Optimal Photovoltaic/Battery Energy Storage/Electric Vehicle Charging Station Design Based on Multi-Agent Particle Swarm Optimization Algorithm

1
School of Economics and Management, North China Electric Power University, Changping, Beijing 102206, China
2
School of Mathematics and Computer Engineering, Ordos Institute of Technology, Ordos 017000, Inner Mongolia, China
*
Author to whom correspondence should be addressed.
Sustainability 2019, 11(7), 1973; https://doi.org/10.3390/su11071973
Submission received: 28 February 2019
/
Revised: 21 March 2019
/
Accepted: 27 March 2019
/
Published: 3 April 2019
Abstract
:In order to effectively improve the utilization rate of solar energy resources and to develop sustainable urban efficiency, an integrated system of electric vehicle charging station (EVCS), small-scale photovoltaic (PV) system, and battery energy storage system (BESS) has been proposed and implemented in many cities around the world. This paper proposes an optimization model for grid-connected photovoltaic/battery energy storage/electric vehicle charging station (PBES) to size PV, BESS, and determine the charging/discharging pattern of BESS. The multi-agent particle swarm optimization (MAPSO) algorithm solves this model is solved, which combines multi-agent system (MAS) and the mechanism of particle swarm optimization (PSO). In this model, a load simulation model is presented to simulate EV charging patterns and to calculate the EV charging demand at each time interval. Finally, a case in Shanghai, China is conducted and three scenarios are analyzed to prove the effectiveness of the proposed model. A comparative analysis is also performed to show the superiority of MAPSO algorithm.
1. Introduction
1.1. Background
Recently, large-scale penetration of electric vehicles (EV) gives rise to the great need for charging facilities. However, electric vehicle charging stations (EVCS) have always been faced with the problem of insufficient land resources or power grid access. For that reason, a solution of a small-scale photovoltaic/battery energy storage/EVCS system (PBES) is proposed to fulfill its self-consumption and autonomy [1]. PBES not only solves the problem of distribution network in limited land resources, but it also realizes the basic balance between local energy production and energy consumption through energy storage and optimal allocation. Besides, it can interact with the utility grid if needed and use battery energy storage system (BESS) to charge EVs, so as to alleviate the impact of charging load on the main grid and improve the energy conversion efficiency. PBES is applicable to large centralized fast charging stations, industrial and commercial parks, commercial residences, and other places. In China, PBES has been rapidly developed in recent years and some pioneering PBES programs were implemented in many cities, such as Shanghai, Nanjing, and Jinzhong, etc.
1.2. Literature Review
In recent years, the rapid increase of EVs has produced higher pressure on the national power grid. Therefore, an initiative to connect EVCS with local renewable energies was proposed to reduce the burden and implemented in some areas [2]. For example, Karmaker et al. integrated the solar photovoltaic (PV) modules and biogas generators with EVCS in Bangladesh based on local resource distribution [3]. However, in most cases, PV energy is more accessible, because PV panels can be easily installed on flat roofs. Ul-Haq et al. proposed a smart EV charging station architecture that is supplied by PV generation and connected to grid, and simulated its feasible behavior [4]. Chandra Mouli et al. investigated the possibility of EVCS with solar PV energy in work places in the Netherlands and analyzed the PV system design [5]. Besides, some studies have considered the energy storage system in the design of PV-assisted EVCS to stabilize grid performance. Esfandyari et al. evaluated the technical performance of a EVCS combined with PV arrays and BESS in a campus microgrid with the aim of maximizing self-consumption and autonomy [1]. García-Triviño et al. focused on the control and operation of a fast charging station for EVs, which consisted of PV system, a Li-ion BESS, fast charging units, and a connection to local grid [6]. From the above literature, it can be seen that PBES is a feasible solution to reduce the stress on the utility grid due to the increase of EVCS. Therefore, it is essential to research the optimal design of PBES in order to reduce cost and increase sustainability.
In many studies, two main issues that are related to PBES were identified and investigated: sizing and energy management. Chaudhari et al. proposed an optimization model to deploy the energy storage system for minimizing the operating cost of EVCS with PV, using real-time electricity price [7]. Bhatti et al. put forward a particle swarm optimization (PSO)-based optimization model to size the PV and BESS in a grid-connected PBES, in which a financial model was used as the objective [8]. Domínguez-Navarro et al. focused on the design of a EV fast-charging station, including the number of chargers, installed power of renewable energies and energy storage, and the contracted power with the grid [9]. In this paper, a genetic algorithm was employed to solve the optimization model and an Erlang B queuing model simulated EV power demand. Baik et al. determined the number of chargers and capacity of PV, ESS in a PBES using an operator to maximize the net present value [10]. Badea et al. investigated the optimal configuration of PV system for an isolated PBES using a genetic algorithm software [11]. Torreglosa et al. developed an energy management system to optimize the energy flow among PV, BESS, and grid in a PBES [12]. Yao et al. used a mixed integer linear programming (MILP) model to coordinate the charging/discharging pattern of EVs in a PBES [13]. Hafez and Bhattacharya determined the optimal design of EVCS with various energy resources [14]. In the above literature, either sizing or energy management was studied. However, this paper will focus on both issues. An optimization model will be proposed to determine the optimal sizes of PV and BESS in a grid-connected PBES and investigate the optimal energy management strategy, such as charging and discharging pattern of BESS and the interaction with the utility grid. In addition, most studies have paid attention to the financial objective, and therefore this paper will minimize the cost of electricity as the optimization objective function.
Besides, it can be seen from the above studies that intelligent optimization algorithms are effective in solving optimal design problems. Among these methods, PSO is widely applied in many engineering problems [8,15,16]. Multi-agent system (MAS) is a network structure that is composed of physically or logically dispersed agents, which accomplish complex control tasks or problems through negotiation and coordination [17]. A number of scholars combined PSO and MAS to overcome the shortcomings of traditional PSO. The multi-agent particle swarm optimization (MAPSO) algorithm can achieve rapid convergence and improve the accuracy of the results with the combination of agents and PSO search mechanism. Power systems widely adopt this method. Kumar et al. presented the MAPSO method applied to economic power dispatch problem, which is a non-linear constrained optimization problem, combining MAS and hybrid PSO [18]. Zhao et al. employed MAPSO to optimize reactive power dispatch and verified this method by an IEEE 30-bus power system and a practical 118-bus power system [19]. This paper will employ MAPSO to solve the optimal design problem for grid-connected PBES.
As shown in the above literature review, most of the studies can be classified into three categories depending on the method: software tools, programming solver, and artificial intelligence. Table 1 presents the summary of some important research shown above. It is easy to implement the simulation in a software tool, but the component specifications are usually fixed. Linear programming models are widely used to deal with optimization problems and artificial intelligence algorithm can solve both the linear and non-linear models. In this research, an improved artificial intelligence algorithm MAPSO will solve the optimization problem.
1.3. Contributions of This Study
This paper proposes an optimization model for a grid-connected PBES to determine the optimal sizing and energy management strategy with the objective of minimizing the cost of electricity and employing MAPSO to solve this model. The main contributions of this paper are presented, as follows:
(1) When considering the difficulty of collecting EV power load data, this paper uses a load simulation model to simulate the EV charging patterns and calculate the EV charging demand at each time interval.
(2) An optimization model determined the optimal design of PBES, including the capacity of on-site PV system and BESS. Besides, the charging/discharging pattern of BESS and the electricity exchange with the utility grid are optimized.
(3) The MAPSO algorithm is applied to solve the proposed model in order to achieve a faster convergence speed and more accurate result.
1.4. Organization of This Paper
The remainder of this paper is organized, as follows. Section 2 introduces the design of PBES. The models of each system component are presented in Section 3, including PV panel, BESS, EV charging demand, and energy balancing. Subsequently, the optimization model is proposed in Section 4. Section 5 gives an overview of MAPSO algorithm. A case study is conducted and discussed in Section 6. Finally, Section 7 concludes this paper.
2. Design of Photovoltaic/Battery Energy Storage/Electric Vehicle Charging Station (PBES)
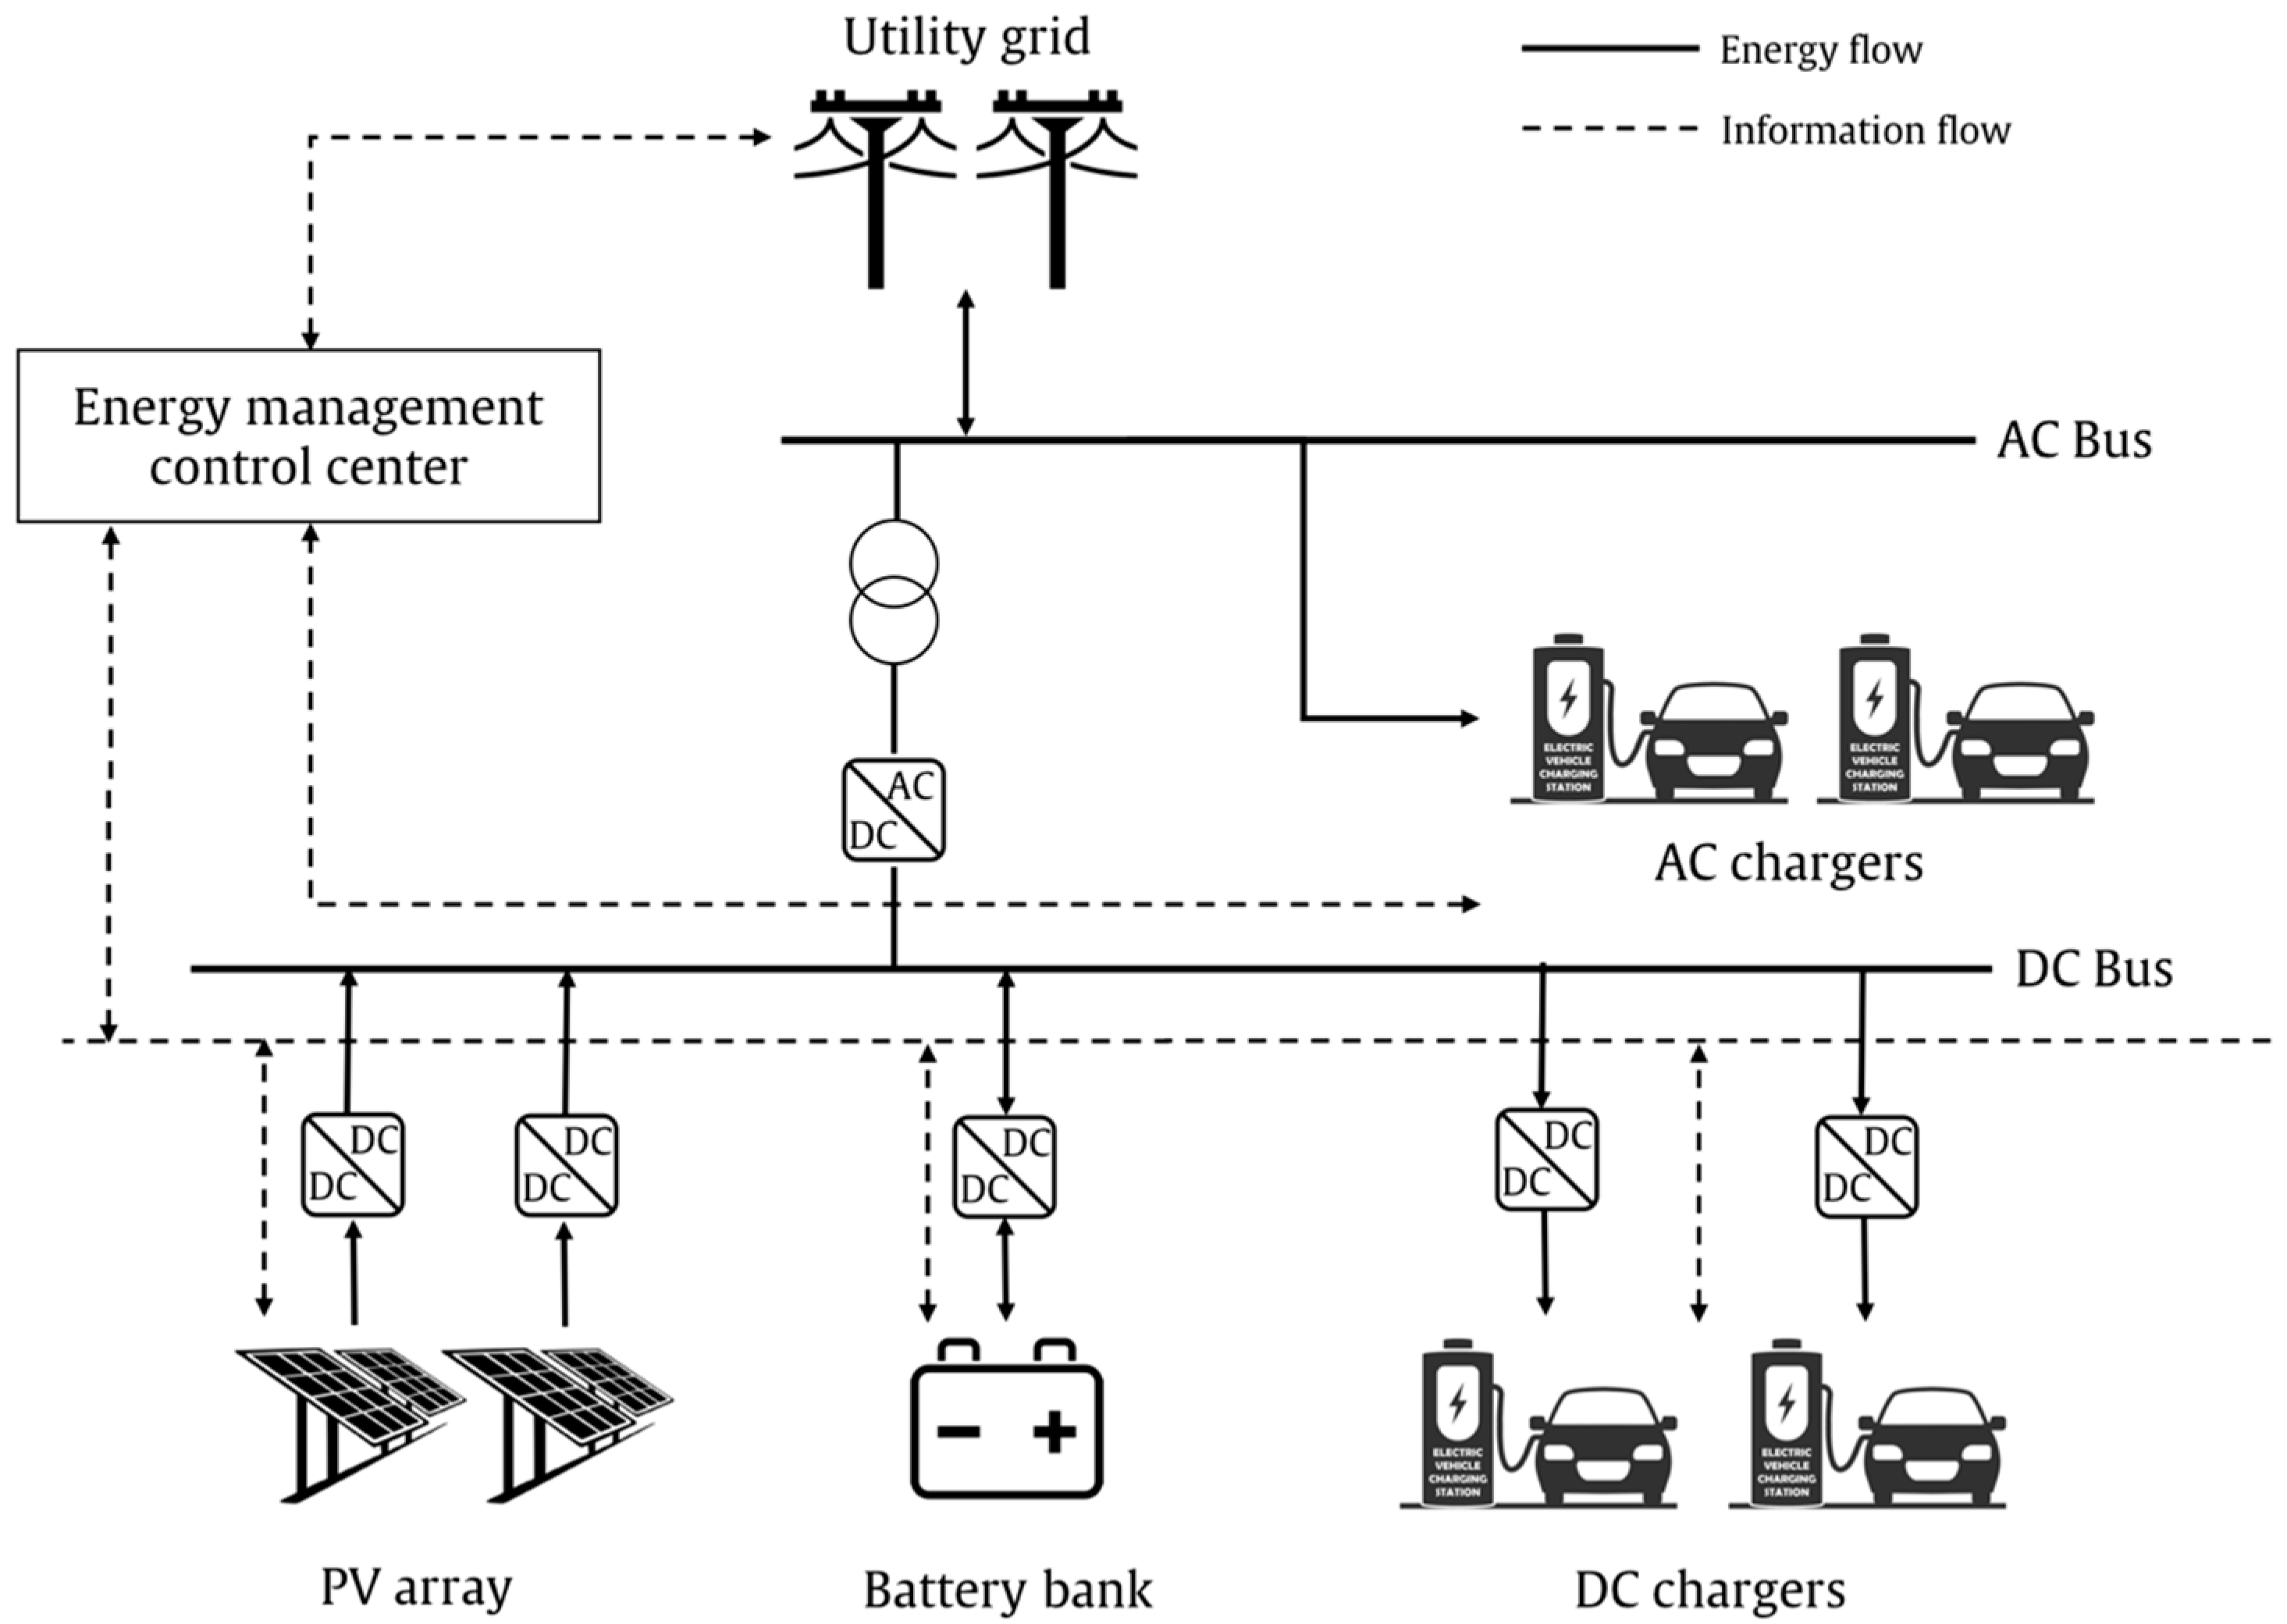
The proposed PBES refers to EV charging stations that are equipped with a small-scale PV system and BESS, which has been developed in many cities around the world as a solution to improve the integration of renewable energy and achieve environmental benefits. Figure 1 illustrates the schematic view of PBES. The major components of PBES include PV power generator, a battery bank, end users (EVs), and energy management system. Utility grid is also considered if PBES is in grid-connected mode. The energy management system controls the whole PBES, which is used to collect, control, and share data from generation, energy storage, and load.
PBES can be either standalone or grid-interactive, depending on the practical situations. In standalone mode, when the power generation is higher than the power load, the electricity surplus is stored in BESS. Otherwise, the BESS releases the energy storage to the power load. When the PBES is connected to the utility grid, it is allowed to sell and purchase electricity with the main grid network. Basically, PBES sends surplus energy to the grid during peak hours to make a profit and it receives electricity from network during valley hours to obtain a lower electricity rate. However, the specific strategy of energy flows at each time interval will be optimized in the following study.
3. Models for System Components
In this section, the mathematical models of the main components in PBES are listed, including PV power generation, a battery bank, and EV charging power load. The energy balancing principle is also proposed.
3.1. PV Panel
The PV system in PBES is designed by determining the number of PV panels, which is related to the PV power output and the load demand. The power output of the PV panel depends on the cell temperature, solar radiant intensity, panel area, and absorption capacity, as provided by Equation (1) [16,20].
where is the solar radiant power perpendicular to the PV panel; is 1000 ; is the rated power of PV panel under standard test conditions (STC); is the PV generator efficiency; is the cell reference temperature under STC, which is 25 °C in this study; is the temperature coefficient, ranging from 0.004 to 0.006 per °C for silicon cells; and, is the cell temperature, which is described as Equation (2) [21].
where is the ambient temperature and Normal operation cell temperature (NOCT) is the normal operation cell temperature.
3.2. Battery Energy Storage System (BESS)
In PBES, a battery bank is utilized as a storage system to balance electricity supply and demand. The proposed optimization model will determine the optimal capacity and the charging-discharging pattern of BESS. The mathematical formulation of energy that is stored in BESS at each time interval is given as Equation (3).
where is self-discharge of BESS; and represent the charging and discharging power at time t, respectively; and are the charging and discharging efficiency of BESS; is the time interval; and, is the number of time intervals. The states of charge and discharge are defined as Equations (4)–(6) and BESS is not allowed to simultaneously work on both states at each moment.
where and refer to the “charge” and “discharge” states of BESS, respectively. 1 means that BESS is being charged/discharged, while 0 means the opposite state.
The energy in BESS at the initial and end hours should be equal in order to prevent energy accumulation, as shown in Equation (7).
There are also some constraints on the charging and discharging rates of BESS, which must not exceed the rated power that is specified by the manufacturer.
where is the rated power of BESS.
A constraint is also imposed on the energy stored in BESS, as shown in Equation (10).
where and denote the maximum and minimum allowable amounts of energy in a battery bank, respectively. can be obtained according to Equation (11).
where DOD is the allowable depth of discharge.
3.3. Electric Vehicle Charging Demand
An important step is to estimate the daily electric power that should be provided by PBES. The charging load simulation model that is proposed in [22] will be applied to simulate the charging process of EVs in PBES and obtain the charging power load of PBES at each moment. In this model, three significant factors are considered: the number of EVs that arrive at PBES and prepare to be charged at each moment, charging duration of each EV, and charging power of each charger.
In order to investigate the charging pattern of EVs, the following assumptions are made for the first two factors. (1) It is assumed that EVs have the same pattern for arriving at PBES as the light-duty vehicles buying gas at gas station [14]. (2) As the sample size increases, the charging duration of EVs can be considered as a situation that is determined by several random variables, so we assume that the charging duration follows Gaussian distribution [22]. (3) The waiting EVs would not choose another charging stations, even if all the chargers were occupied.
The charging power of each charger should be determined by the charging technique of the chargers. At present, the EV charging methods include AC charging, DC charging, and wireless charging, etc. These charging methods are suitable for different charging occasions. AC charging is generally used for charging vehicles with a long period of time. DC charging is mostly used in urban public charging facilities and charging stations in inter-city expressway service areas. When compared with the former two charging methods, the economic benefits and convenience that are brought by wireless charging technology are amazing, and its development prospect cannot be underestimated. However, due to the high cost of wireless charging of EVs, as well as the limitations of technology maturity and infrastructure equipment, wireless charging technology cannot be widely used for the time being.
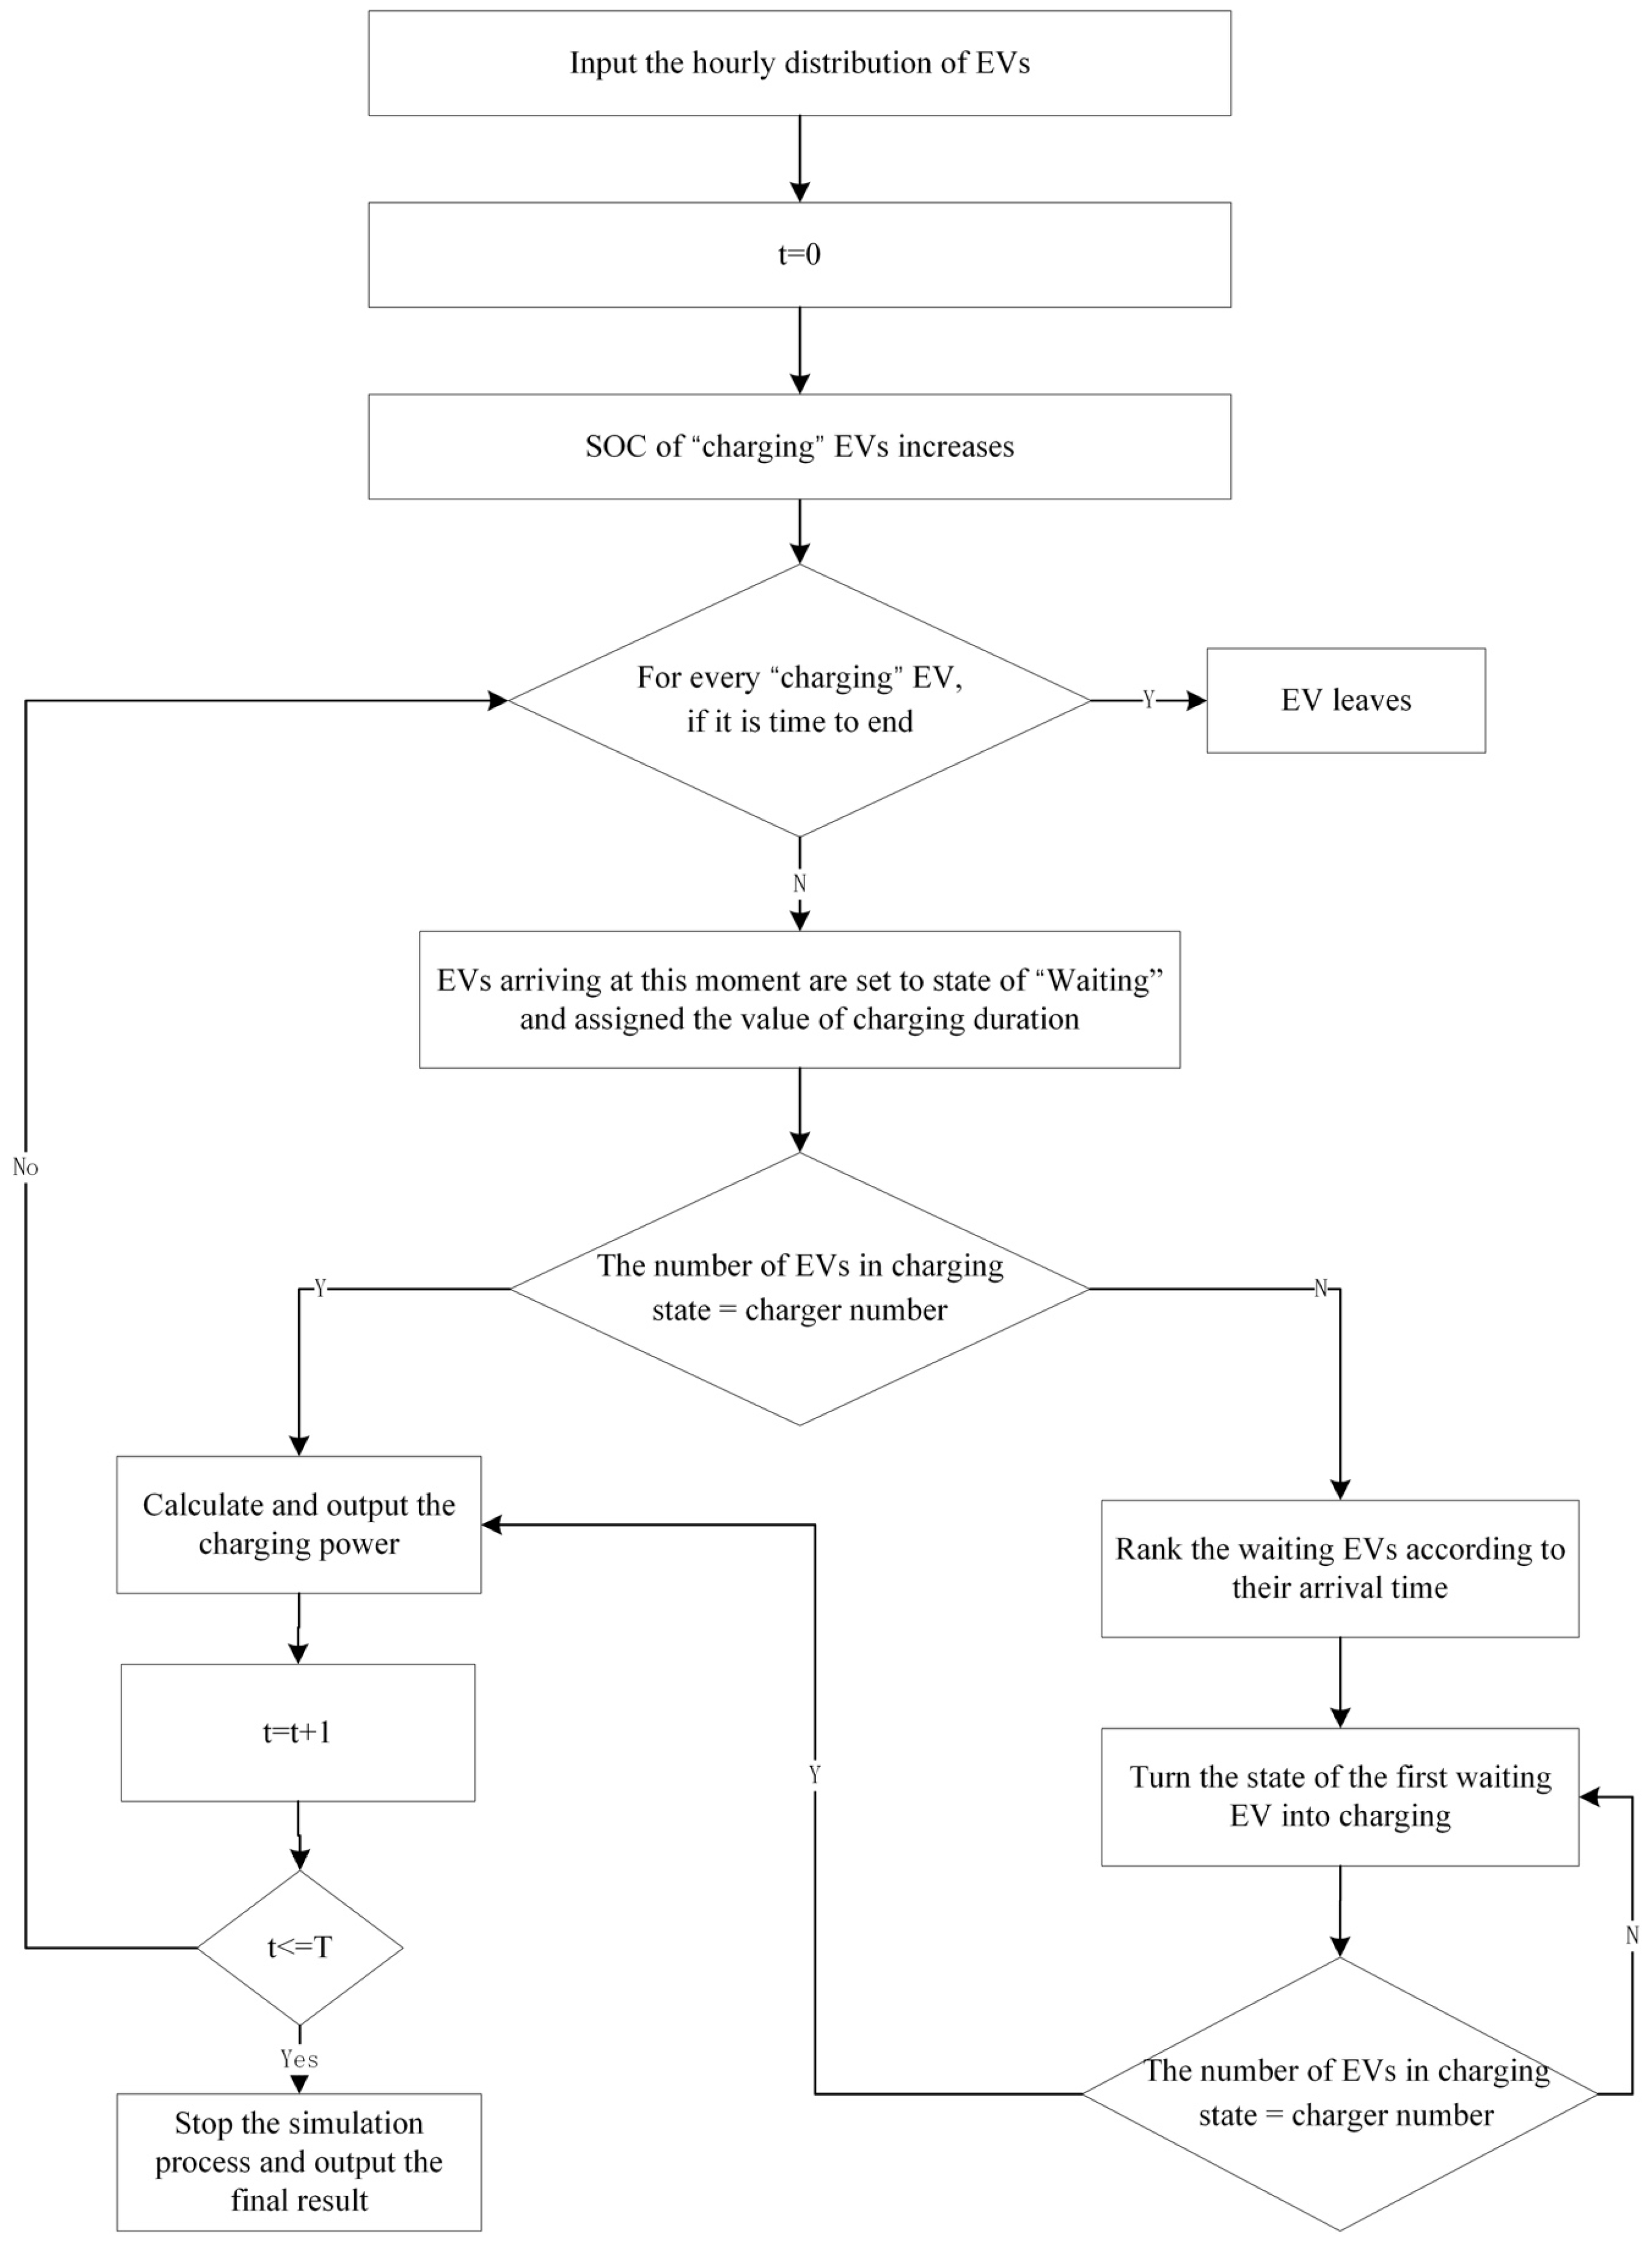
Subsequently, the simulation process is illustrated in Figure 2 and described as follows.
Step 1: Input the hourly distribution of EVs that are arriving for charging at PBES and the charging duration distribution. Initialize the data when t = 0.
Step 2: The EVs in PBES can be divided into two types: waiting state and charging state. For EVs that are charging at this moment, the state of charge (SOC) of their batteries increases according to the charging input power of chargers. If it is time to end charging, then the EVs stop being charged and leave PBES.
Step 3: According to the input data, determine the number of EVs arriving at PBES at this moment. Afterwards, these EVs are all set to waiting states and assigned the value of charging duration.
Step 4: If the number of EVs in charging state is equal to the number of chargers, then go to Step 6. If there are extra chargers for EVs to be charged, then go to Step 5.
Step 5: Rank the waiting EVs according to their arrival time. Turn the state of EVs into the “charging” one by one until the number of charging EVs equals to the number of chargers.
Step 6: Calculate and output the charging power of all EVs at this moment.
Step 7: t = t + 1. Go to Step 2 until the simulation period ends.
Step 8: Stop the simulation process and output the final result.
3.4. Energy Balancing
When connecting to the main grid, PBES should abide by the energy balancing rule, which means that the amount of energy consumption is equal to the total generation, as given by Equation (12). Therefore, in grid-connected mode, the energy shortage is not allowed in PBES.
where is the received power from utility grid, which can be positive or negative. In the above relation, during each time interval, the energy that is consumed by loads plus energy charged into BESS are equal to the energy supplied by the PV system and utility grid plus energy discharged from BESS.
4. System Optimization Problem
The proposed optimization problem is to determine the optimal configuration of PBES, including the number of PV modules, the number of batteries, and the charging/discharging pattern of BESS after meeting technical and economic constraints. The objective, constraints, and optimization algorithm will be presented in this section.
4.1. Objective Function
The optimization objective is to minimize cost of electricity (COE) index, which represents the cost effectiveness of different system configurations of PBES. A critical factor of COE is the net present cost (NPC) of PBES, which includes the cost of each component and the network electricity. The cost of EV charging facilities is not considered, as it is fixed in the proposed model. Equation (13) provides the NPC of PBES.
where and are the total cost and the number of the kth component, respectively; is the annual cost of selling and purchasing electricity with the utility grid, which can be either positive or negative.
Based on the NPC of PBES, the COE index can be obtained by Equation (14) [15,23].
where is the capital recovery factor, being expressed as Equation (15).
where is the interest rate and is the lifetime of PBES.
4.1.1. Cost of System Components
The cost of each component in PBES consists of investment cost , replacement cost , operation and maintenance (O&M) cost , and residual value , as shown in Equation (16).
The residual value can be calculated by depreciating the replacement cost of each component linearly, expressed as Equation (17) [24].
4.1.2. Electricity Cost
Annual electricity cost is generated by energy exchange with the utility grid. When the PBES sends energy to the main grid, the cost is negative, which means that the system is making profits. On the contrary, the electricity cost is positive when the system purchases electricity from the utility grid. Equation (18) gives the annual electricity cost.
where TC is a coefficient to annualize the daily cost of electricity.
4.2. Constraints
Most constraints are explained in Section 3, including the energy balancing and the charging/discharging power, the stored energy, and the initial/end state of charge of BESS. In a specific case, the range of decision variables will be determined according to the power load.
5. Overview of Multi-Agent Particle Swarm Optimization Algorithm (MAPSO)
The proposed MAPSO algorithm is used to solve the proposed optimization model in this paper, which combines PSO and MAS. This section presents the specific steps of the proposed method.
5.1. Particle Swarm Optimization Algorithm
The PSO algorithm is an evolutionary algorithm that was proposed by J. Kennedy and R. C. Eberhart. The main concept of this algorithm is to generate a random solution initially, search for the optimal solution through multiple iterations, evaluate the solutions by fitness, and finally achieve global optimization. When compared with genetic algorithm, PSO is an improved evolutionary algorithm that discards the operators of genetic algorithm, such as “crossover” and “mutation”, which makes the whole optimization process achieve a higher speed of convergence. Suppose that there are M particles. Each of them has N dimensions, which means that the number of variables is N. Let and be N-dimensional vectors, which demonstrate the position and velocity of ith particle. The key of PSO is to find the local optimal solution and the global optimal solution that must be obtained by speed and position updating equations, as shown as Equations (19)–(21).
and are acceleration constants, also called as learning factors. and are random numbers between 0 and 1. and are the best position of particles at the tth iteration and the best global position, respectively. is the inertia weight, which is used to adjust the search range of the solution space. and are the maximum and minimum of inertia weight, respectively. is the current iteration number and is the maximum number of iterations.
5.2. Multi-Agent System (MAS)
As an important branch of distributed artificial intelligence, MAS is a complex and useful system, which is composed of many independent agents. It is an advanced form of conventional distributed control system having abilities to control huge and multifaceted entities. An agent is considered to be a system, being located in an environment, having the capability to autonomously perform actions in the environment in order to encounter the design objective of the system. Each agent has typical characteristics, as follows [25].
Reactivity: Agents respond to any deviations in the environment through the help of intelligent systems without directly affecting the environment.
Autonomy: An agent has the ability to perform tasks independently in the network without external interference from other agents or people. These attributes can protect the internal state of the agents from external influences and isolate them from external disturbances.
Inferential ability: Refers to the ability of an agent to operate in intellectual goal stipulations, that is, the ability to infer observations by simplifying information. This can be done by manipulating the appropriate content of existing information.
Responsiveness: Refers to the ability of an agent to observe the current state of the environment and respond to it in the shortest possible time. This capability is of great significance in the real-time application of the system.
Pro-activeness: An agent must present a positive rebuttal of the immediate conditions without involving the general behavior in order to support the agent to achieve its determined goal in response to a specific variation in the atmosphere.
Social behavior: Even though the agent has the ability to make independent decisions, it is still important to have the ability to interact/communicate with external sources (possibly other agents, humans, or control units in the environment) in order to achieve a specific goal. This helps agents to cooperate, negotiate, or compete with other agents.
5.3. Multi-Agent Particle Swarm Optimization (MAPSO) Algorithm
From the introduction of PSO and MAS, it can be seen that agents are different from particles under three aspects, as follows. Firstly, particles are not considered to be autonomous, but agents search space with more flexibility and autonomy. Secondly, particles have low intelligence and low computing ability, but learning is an ability of agents. Thirdly, the particles of PSO move synchronously to maintain the simplicity of algorithm, while agents of MAS move asynchronously due to its learning, autonomy, and cooperation ability. However, the two methods have certain similarities. For example, they are both population based and they cooperatively do their tasks, so these two methods can be matched on each other. A particle can be considered as an agent and PSO can be regarded as a simple MAS. When combining these two methods, the simplicity of PSO algorithm and the learning and autonomy ability of agents in MAS can both be used [26,27].
In MAPSO, an agent represents not only the candidate solution of a problem, but also a particle in PSO. For the MAPSO algorithm, a lattice-like environment should be initially established, where each agent is fixed at a lattice-point. In order to more accurately obtain the optimal solution, each agent competes and cooperates with its neighboring several agents and uses self-learning to obtain high-quality solution. The mechanism of PSO algorithm can develop a rapid transmission of information between agents, and therefore MAPSO can achieve rapid convergence and improve the accuracy of the results with the combination of agents and PSO search mechanism.
(1) Purpose of each agent. At each iteration of PSO, each particle is approaching to the optimal solution, with the intention of searching for the optimum of fitness value. In MAPSO, each particle is an agent, so the purpose of an agent is to find the optimal solution of fitness value. In this model, for an agent α, its purpose is to minimize COE.
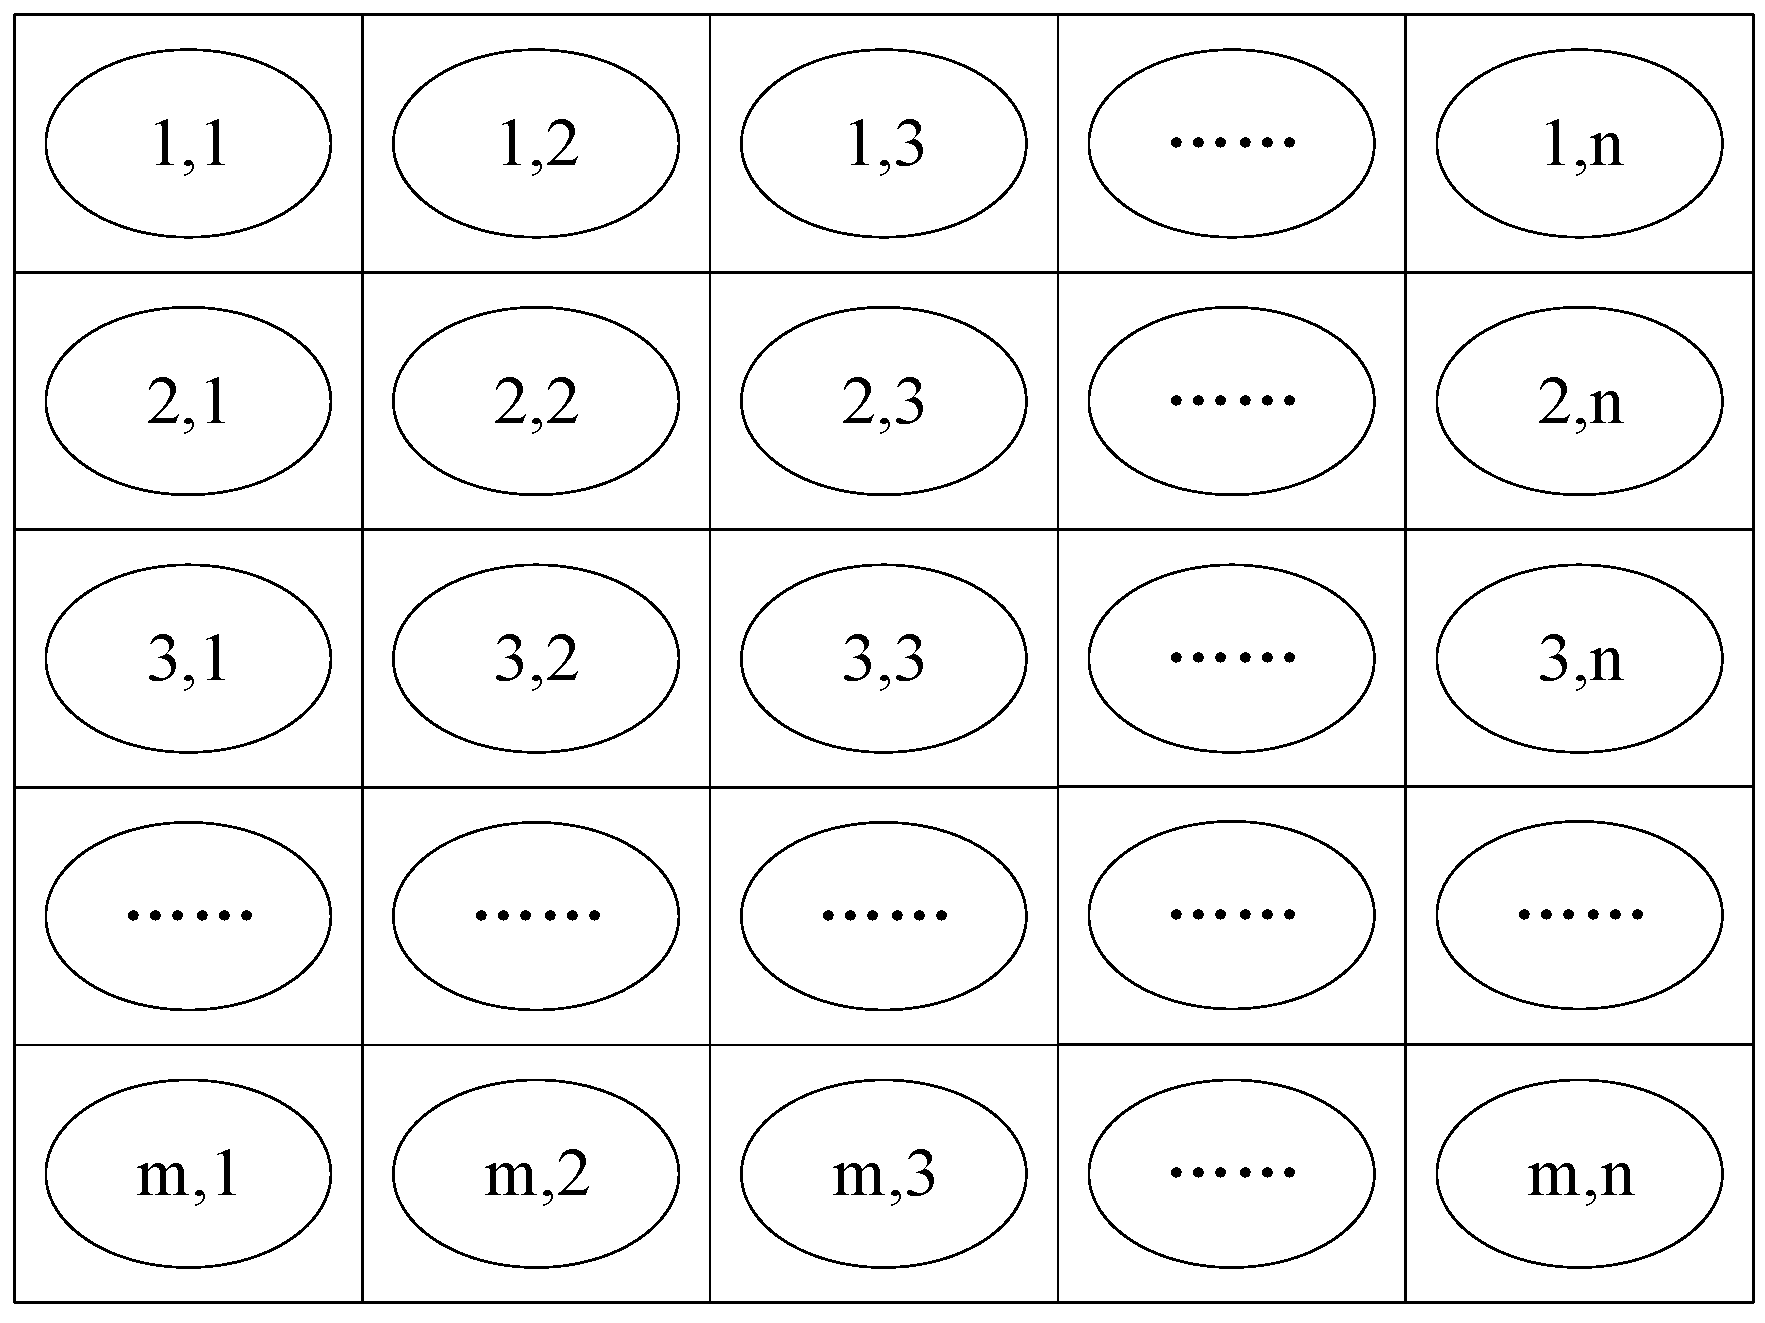
(2) Definition of global environment. All of the agents in MAS need a living environment, as shown in Figure 3. Each lattice point in this figure represents an agent and the number in the circle represents the position of this agent in the environment. There are m × n agents, which mean × particles. Since all of the particles of PSO have the position and velocity attributes, each agent also has these two attributes.
(3) Definition of the local environment. Although a MAS has a global environment, but for one of the agents, it also has a local environment that plays its role. Therefore, how to define the local environment is very critical in the MAPSO method. In this paper, it is supposed that the local environment of an agent is composed of eight other agents adjacent to it. Suppose that an agent α located at (i,j) is presented as , i = 1, 2, …, m; j = 1, 2, …, n. Subsequently, the local environment of is defined, as follows:
where , , , .
In Equation (22), it can be seen that each agent has eight neighbors. They constitute a local environment, in which agent can only sense. For example, for agent , their neighbors are . will compete and cooperate with other eight agents in .
(4) Behavioral strategy for agents. In order to obtain the final solution quickly and accurately, every agent has some behaviors. In MAPSO, each agent shares useful information in the global environment. On the basis of these behaviors, in this paper, we proposed a strategy to obtain the more accurate result.
Suppose that the search space of agent is denoted as where N represents the dimension of this agent. Let be the agent with smallest fitness value in the local environment of . If Equation (23) is satisfied, the position of agent remains unchanged; otherwise, the particle position is adjusted according to Equation (24) to search the solution with a smaller fitness value.
It can be seen that, by adjusting the position of particles, not only the original effective information can be maintained, but also the information of the other eight agents in the local environment can be absorbed to obtain the solution with a smaller fitness value.
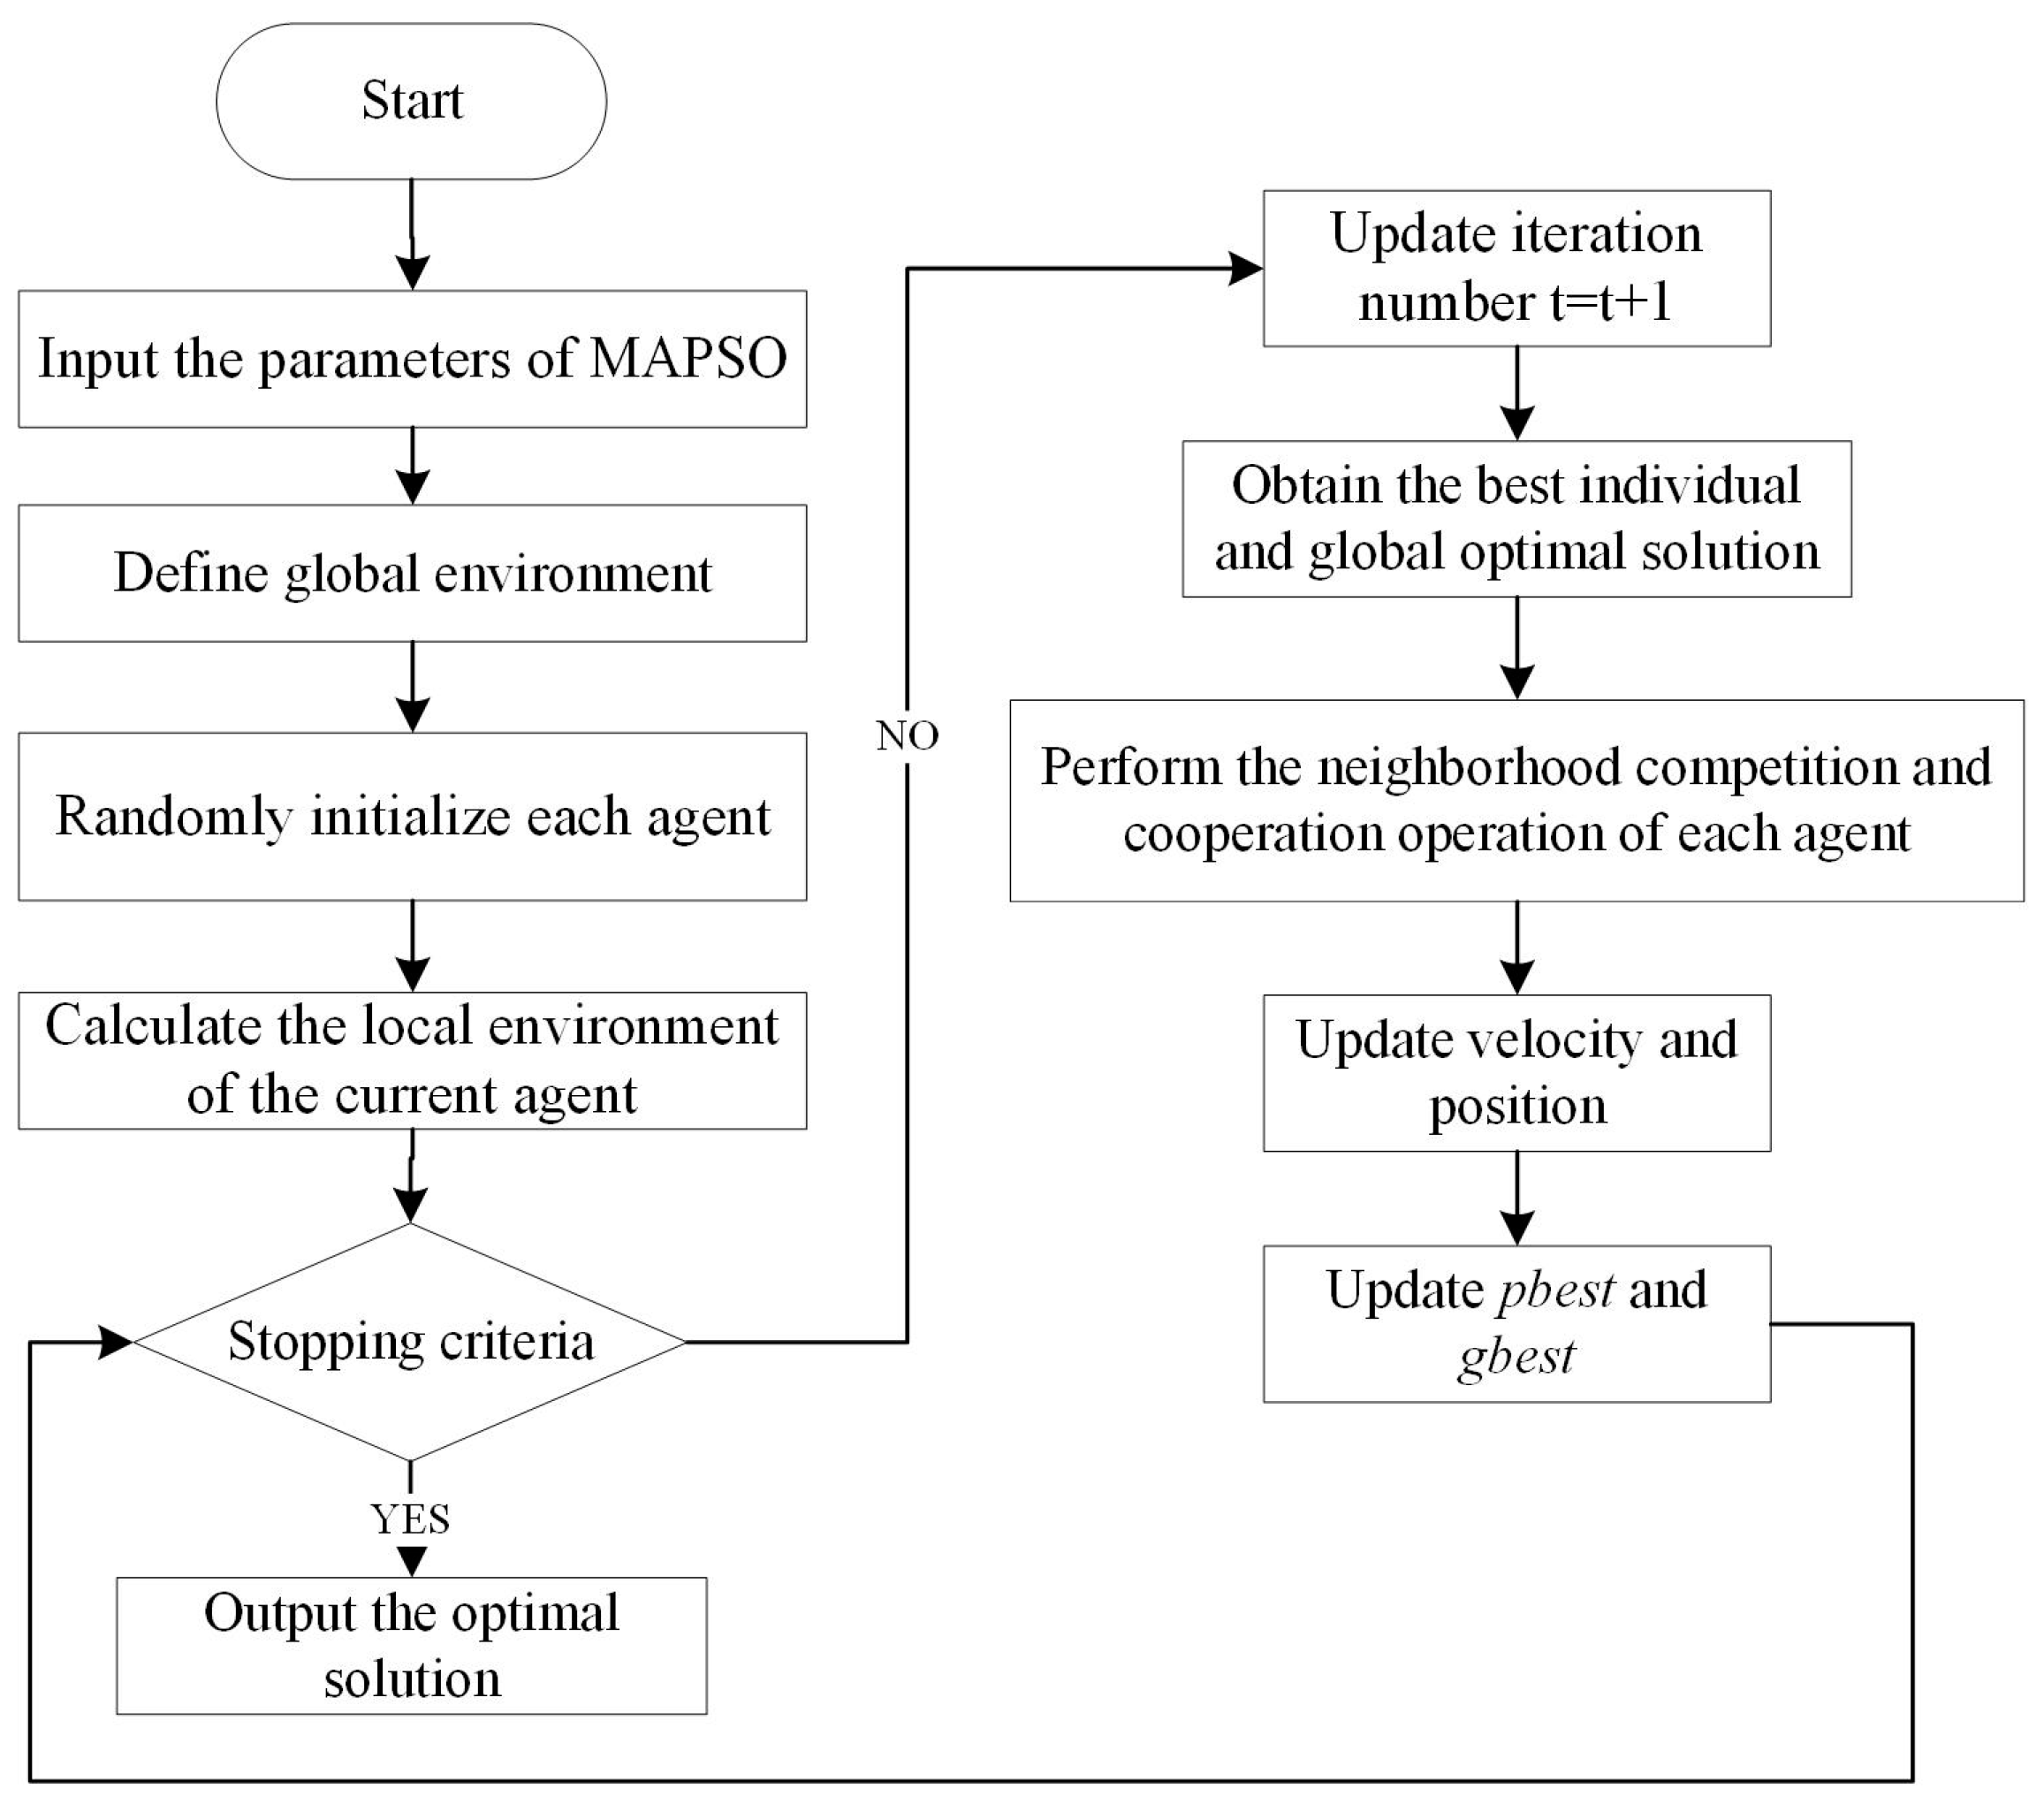
(5) Steps of MAPSO. The specific implementation steps of MAPSO algorithm are as follows, as shown in Figure 4.
Step 1: Input the parameters of MAPSO, including the maximum number of iterations, PSO inertia variables, acceleration coefficient, etc., and define the upper and lower limits of variables.
Step 2: Define a lattice-like environment m × n.
Step 3: Randomly initialize each agent, that is, the initial position and speed of each particle.
Step 4: Calculate the local environment of the current agent according to Equation (22), that is, eight neighbors of the agent.
Step 5: Update iteration number t = t + 1.
Step 6: Obtain the individual extreme value and the global optimal solution. Afterwards, calculate the fitness value of each agent and obtain p-best and g-best.
Step 7: Perform the neighborhood competition and cooperation operation of each agent according to Equations (23) and (24).
Step 8: Update the velocity and position of particles according to Equations (19) and (20).
Step 9: Calculate the fitness of each particle and update the individual extreme value p-best and the global optimal value g-best according to fitness.
Step 10: If the condition of iteration termination is not met, return Step 5; otherwise, proceed with Step 11.
Step 11: Output the optimal agent.
6. Case Study
This section studies a case in China. The EV charging patterns are simulated to obtain the load demand. Subsequently, three scenarios are analyzed to prove the feasibility of the proposed model. A comparative analysis is also performed to verify the effectiveness of MAPSO.
6.1. Problem Description and Data Collection
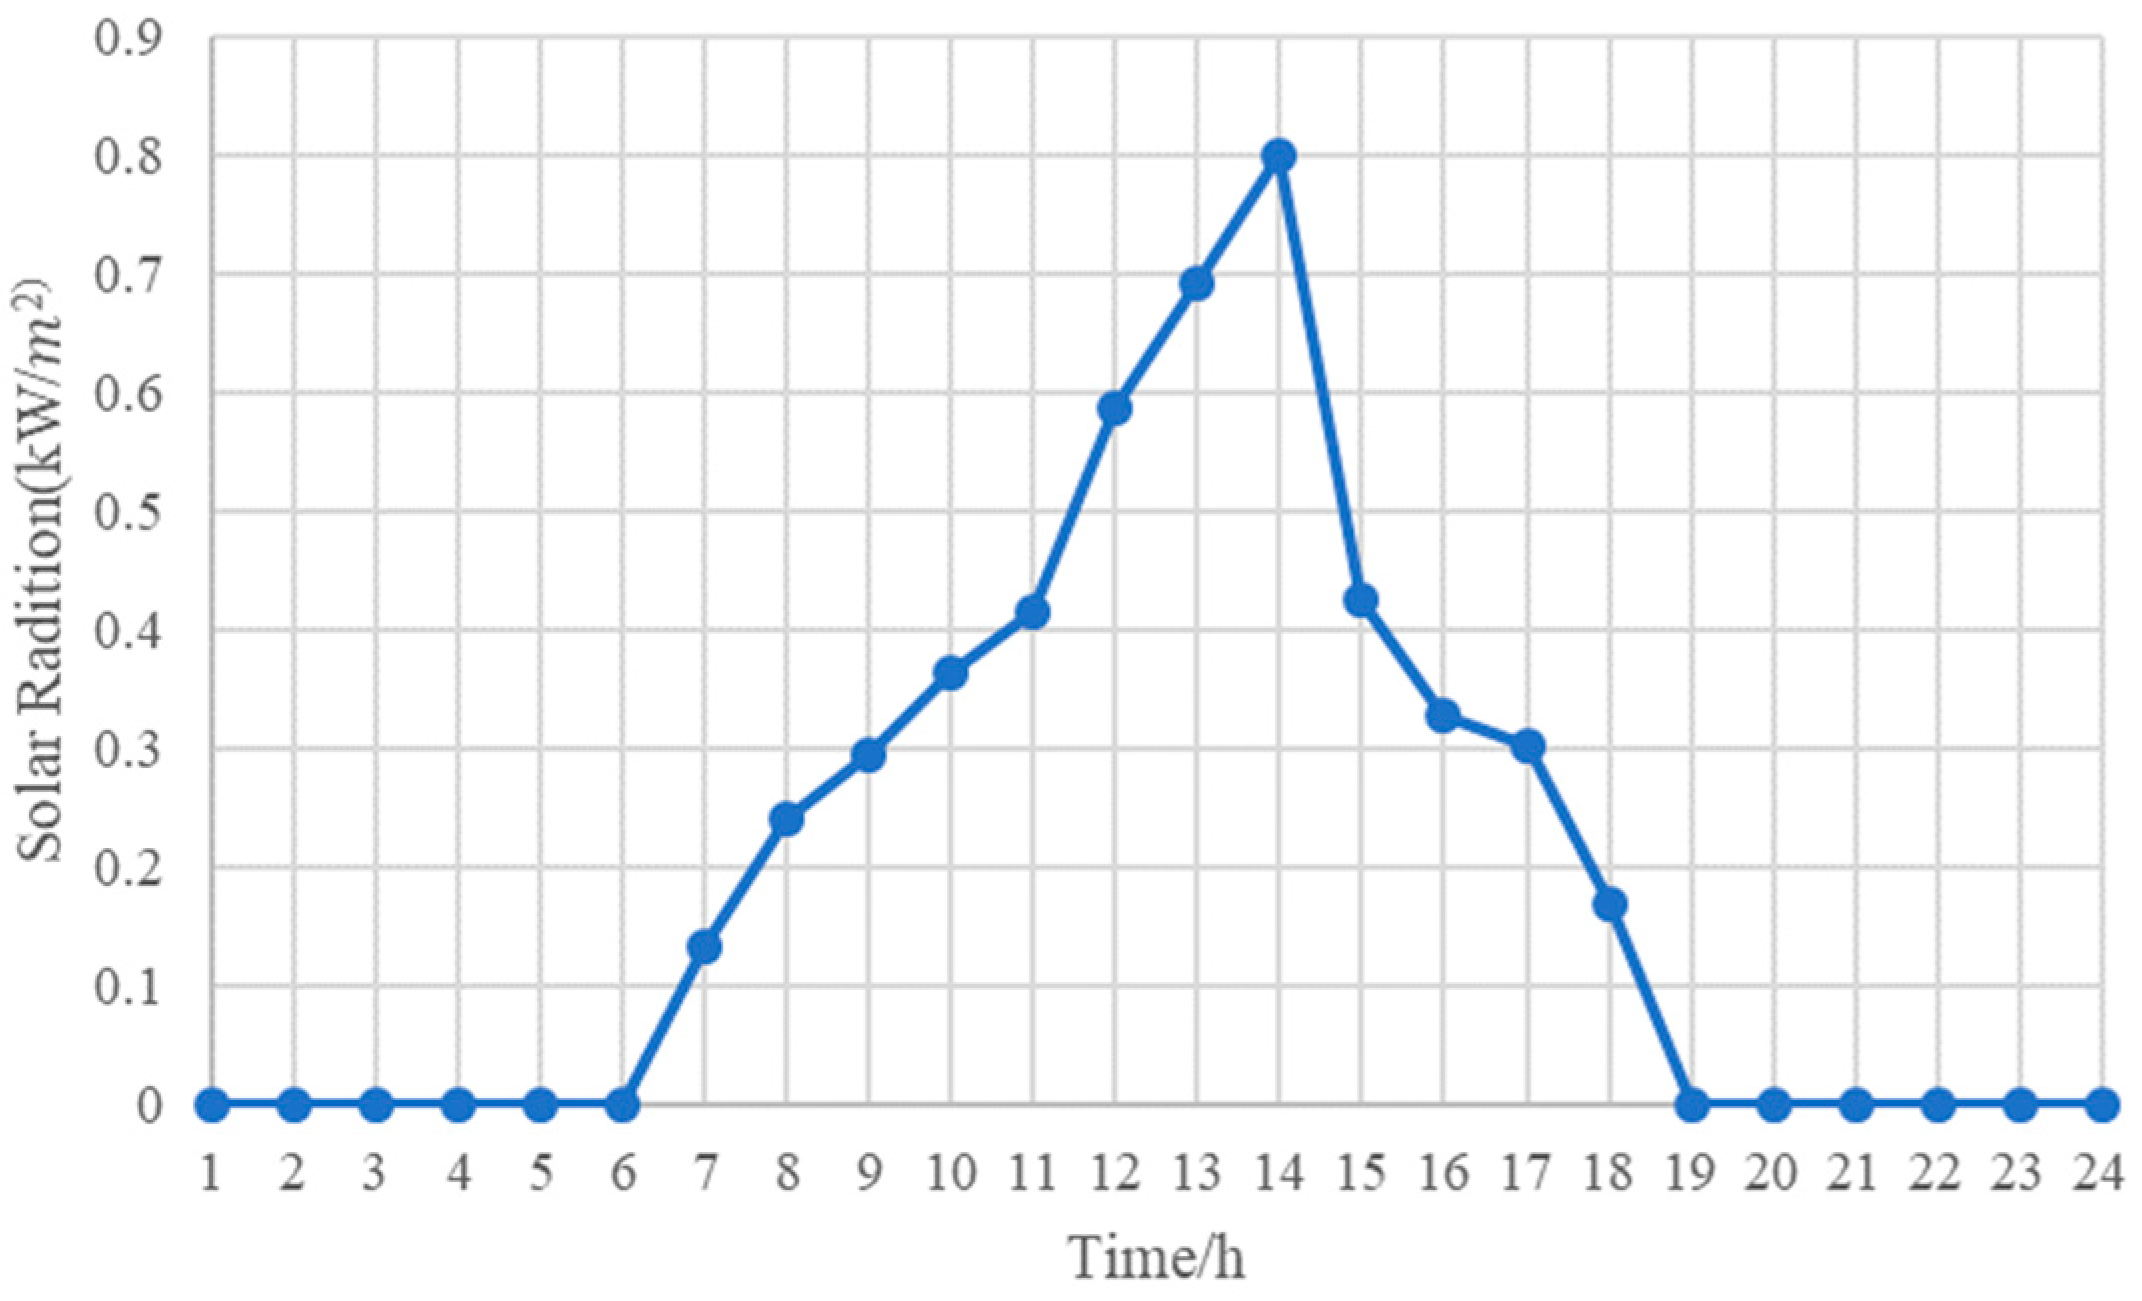
A new energy company plans to build a grid-connected PBES in an industrial park in Shanghai, China. The number of the proposed chargers is 10. In this case, the number of PV modules, batteries, hourly power of BESS, and grid are determined to minimize the system cost. Suppose that the lifetime of system is 25 years. Table 2 shows the parameters of this case. Figure 5 illustrates the solar radiation at each hour.
The population size of MAPSO and PSO is usually determined by the complexity of the problem. When considering the balance between optimization efficiency and results, the population size is set as 25 in this study. The size of the global environment is set as 8 8. The maximum number of iterations of the optimization problem is set as 200. Experiments in Suganthan show that satisfactory solutions can be obtained when and are the constants, usually = 2. Table 3 shows the parameters of MAPSO.
6.2. EV Charging Load Simulation
It is assumed that each EV is equipped with a battery pack. The conventional battery charging is mainly carried out in two ways of constant current charging and constant voltage charging. The first stage is constant current charging, in which the current remains unchanged and the voltage will grow with the gradual increase of the electromotive force of the battery pack. In the second stage of constant voltage charging, voltage remains the same and charging current decreases gradually, until it becomes zero. After simulating the charging power of the EV chargers, a fitting curve is obtained. The charging power remains 3.56 kW in the first stage and the equation of charging power in the second stage is , where t is the duration of the constant voltage charging stage and it is assumed that the total time of the second stage is 60 min.
In practical terms, remaining capacity, vehicle load, distance, road conditions, and other random factors affects the EV charging time [28]. However, with the increase of sample size, the charging time becomes an event that is determined by a number of random factors. According to the law of large numbers and central-limit theorem, the charging time of EVs will approximately obey the normal distribution. Through the simulated statistical data of other existing charging stations, it is concluded that the charging time of EVs in the charging station basically follows the normal distribution of N (123,17.42), that is, the average charging time is 123 min.
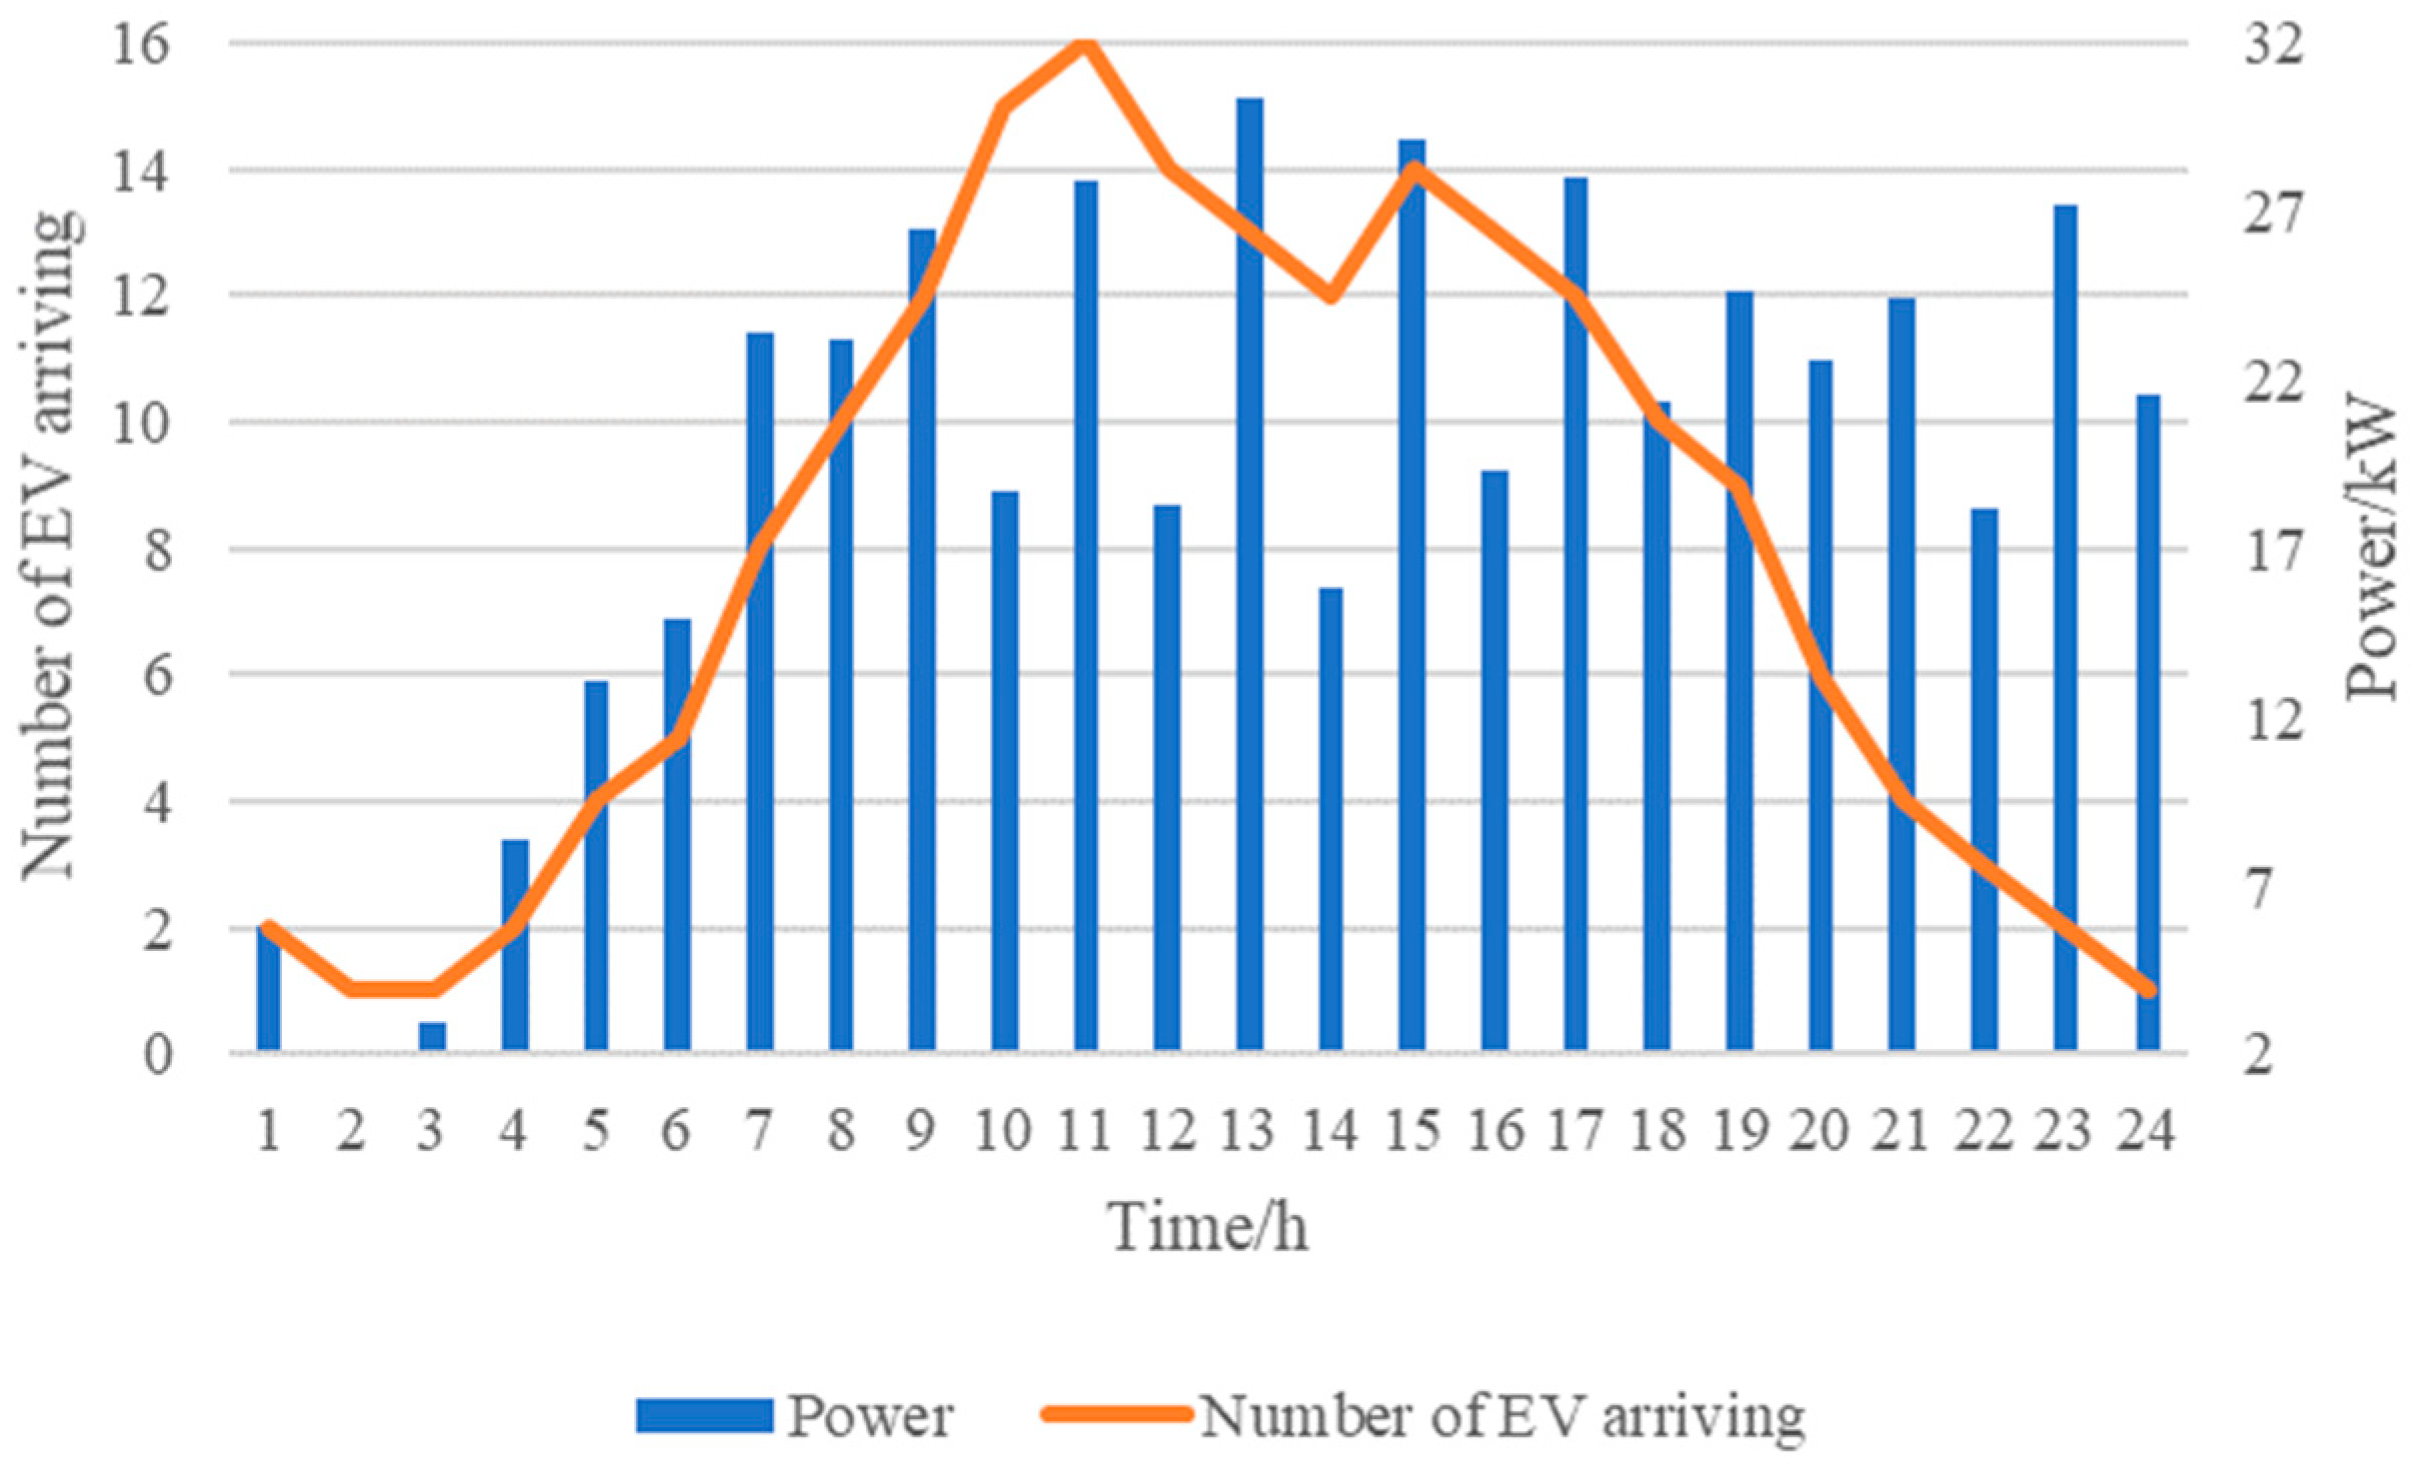
In this model, we assume that EVs have the same pattern for arriving at the EV charging station for charging their vehicles as light-duty vehicles for buying gas at gas station. After collecting the data of vehicles arriving in the gas station, the arrival of EVs at each hour can be obtained, as shown in Figure 4. Suppose that all chargers are initially vacant and the EV charging power at each hour can be obtained, as illustrated in Figure 6.
6.3. Simulation Results and Analysis
The value range of decision variables can be determined according to the load of electric vehicle charging. Based on the result in Section 6.2, in order to meet the power demand of electric vehicles, the maximum power that is purchased from the utility grid is set as 50 kW in this case. At the same time, in order to ensure the profitability of PBES system and the safety and controllability of the utility grid, the maximum selling power to the utility grid is set at 70 kW.
In the proposed model, the objective function is the minimum of COE, and the decision variables are the number of PV cells and BESS and hourly power of grid electricity purchasing/selling. In order to verify the economy of PBES, the other two cases are analyzed in this paper, as follows.
Scenario 1: In this case, PV will not be considered. BESS and the utility grid only provide the load of EVs charging. Therefore, in this scenario, the decision variables are the number of batteries, hourly BESS power, and grid power, with a total of 49 variables.
Scenario 2: Utility grid will not be considered in this scenario. The load is supplied only by PV generation and BESS. This case can be considered as standalone PBES. Therefore, the decision variables are the number of PV cells and the number of batteries.
Scenario 3: This scenario is the proposed grid-connected PBES in this paper. PV, BESS, and utility grid will jointly supply power to EVs. The decision variables are the number of PV cells, the number of batteries, hourly BESS power, and hourly grid power.
6.3.1. Scenario 1
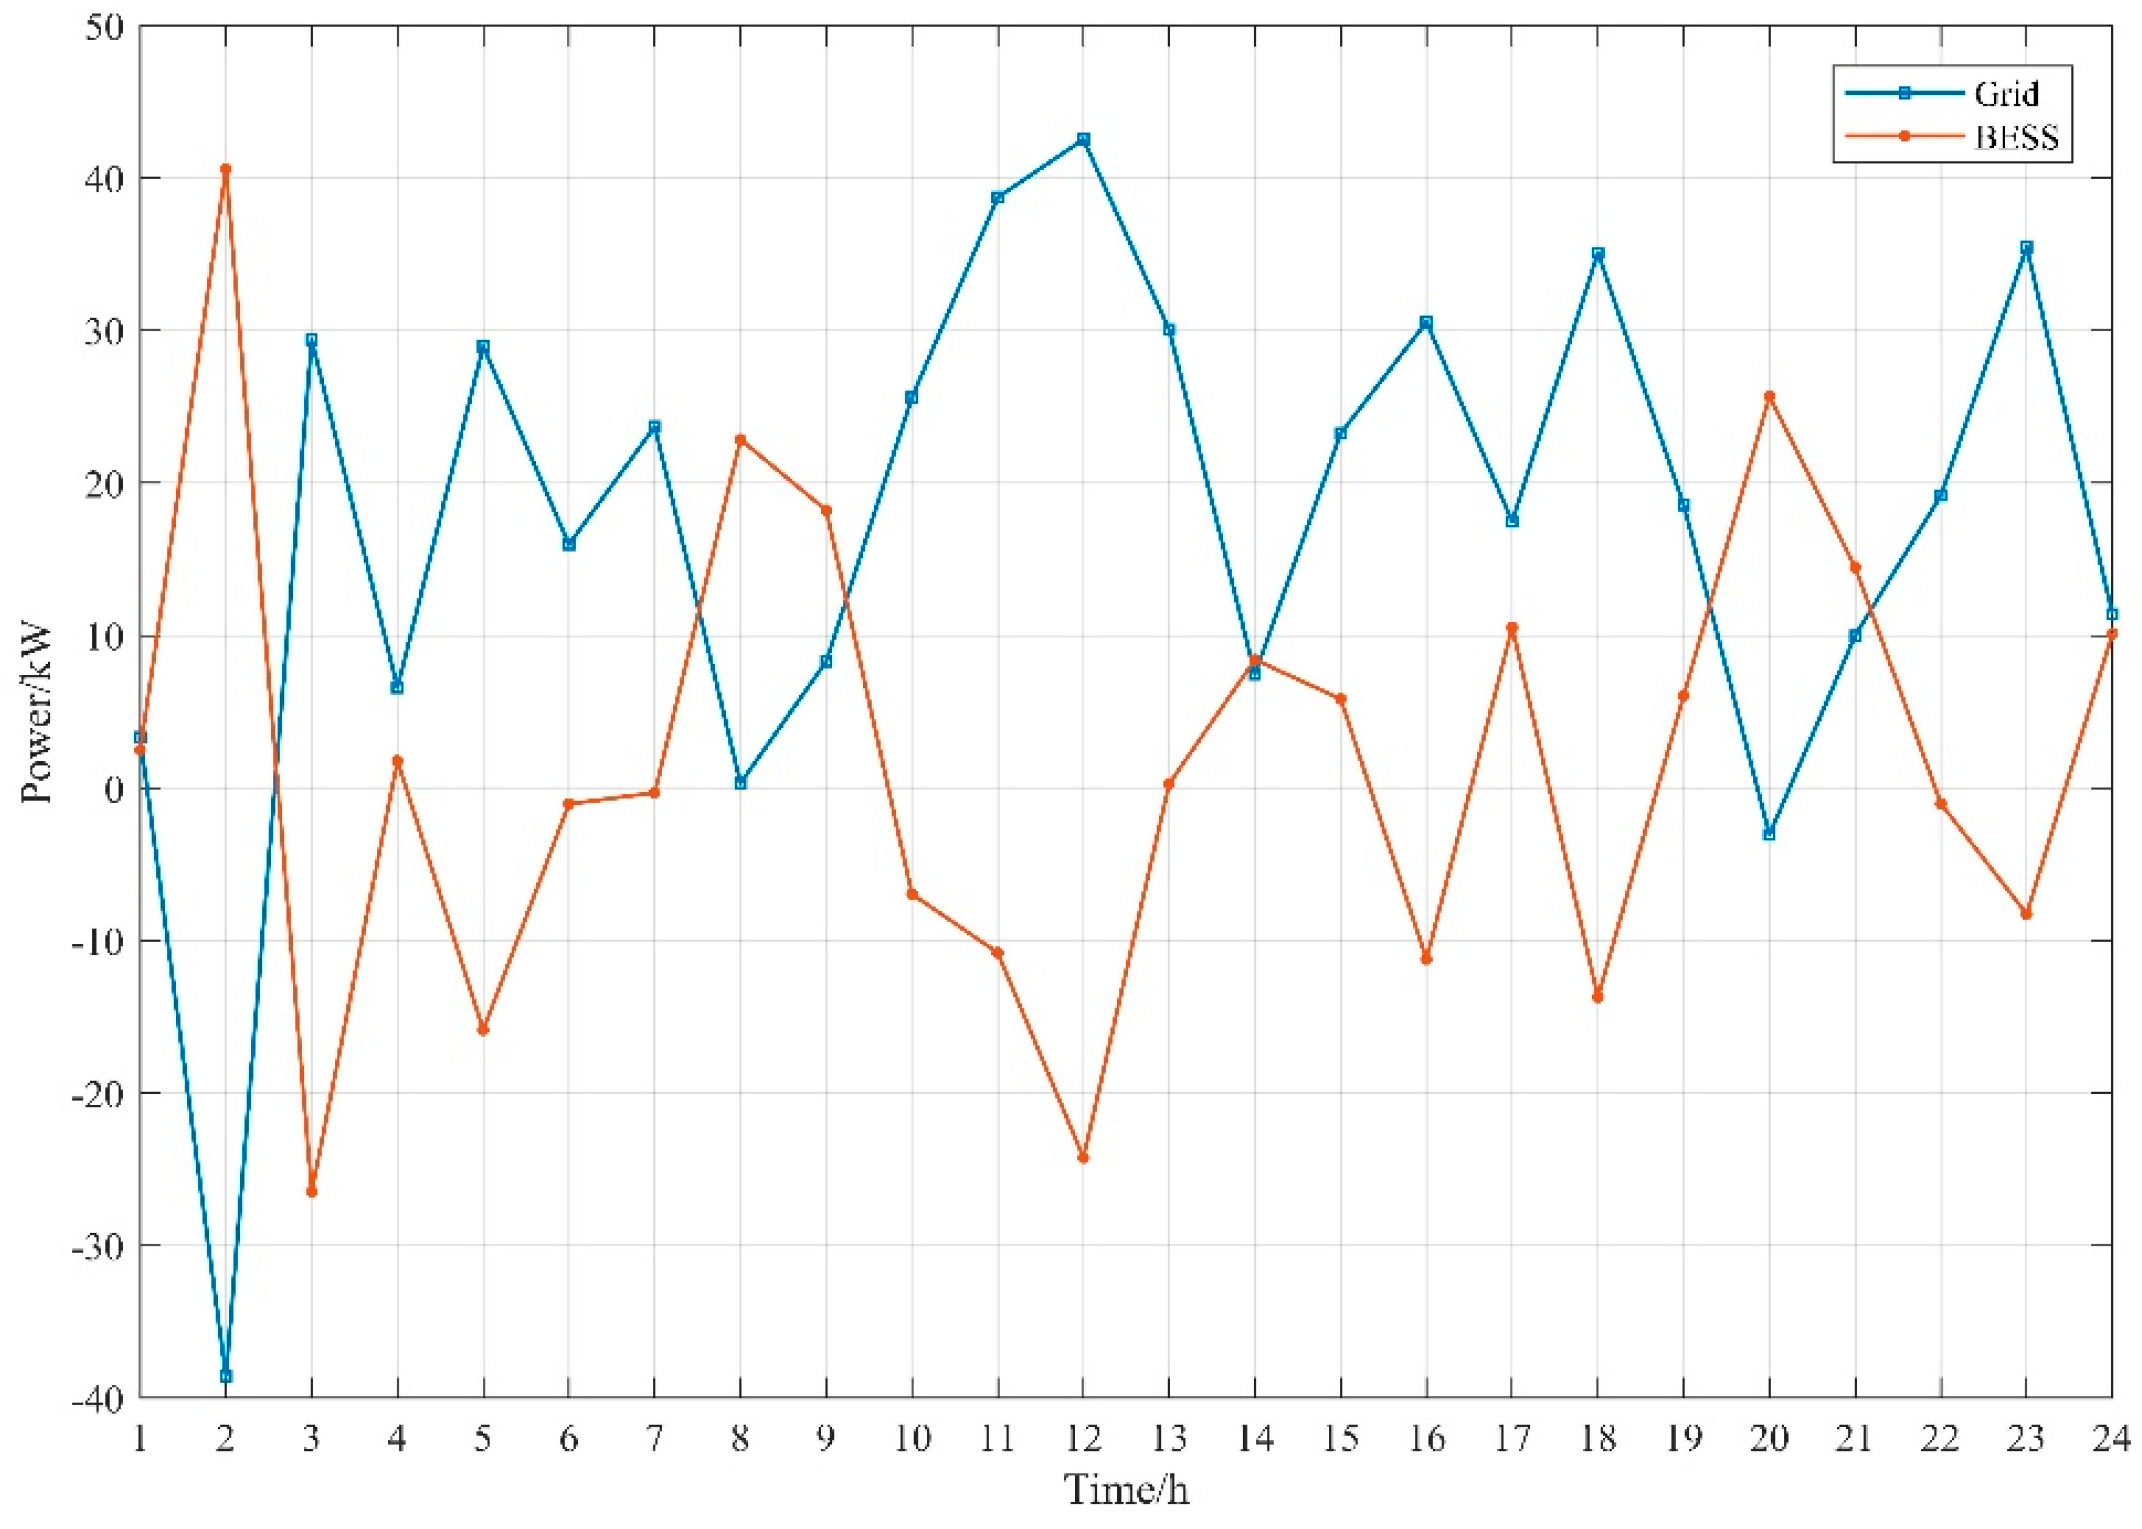
In this scenario, PV cells are not equipped, and the charging power of EVs is only provided by BESS and utility grid. The proposed MAPSO algorithm is used for optimization analysis. It is concluded that, when the number of batteries is 50, the optimal COE is obtained, which is 0.852 yuan/kWh. Table 4 shows the optimization result. The COE represents the cost-effectiveness of the system, and the lower the COE, the lower the cost index for the system. Table 5 and Figure 7 show the optimal BESS and grid power. The positive value of the grid power indicates that PBES buys power from utility grid while the negative value indicates that PBES sells excess electricity to utility grid. The positive value of BESS power represents that BESS is in the state of discharge at the moment, while the negative value indicates that BESS is in the state of charging. By calculating the electricity exchange with the utility grid, it is concluded that the electricity purchased from the grid is 461.84 kWh, electricity sold to the grid is 41.612 kWh, and the total cost of electricity exchange with grid is 221.888 yuan per day.
6.3.2. Scenario 2
In this scenario, the PBES system is in standalone mode, not being connected to the grid. The load demand is supplied by PV and BESS. As long as PV and BESS capacity are determined, the charge and discharge pattern of BESS at each time interval can be obtained according to the supply-demand balance constraint. Table 6 shows the optimization result. Therefore, there are only two decision variables in this scenario, the number of PV cells and batteries. Finally, it is obtained that, when = 65.4 and = 164, scenario 2 has the lowest COE, which is 1.46 yuan/kWh. When compared with scenario 1, the number of batteries increases significantly from 50 to 164 and the COE also grows from 0.852 yuan/kWh to 1.46 yuan/kWh. It can be seen that scenario 1 is more profitable and reasonable as compared with scenario 2.
6.3.3. Scenario 3
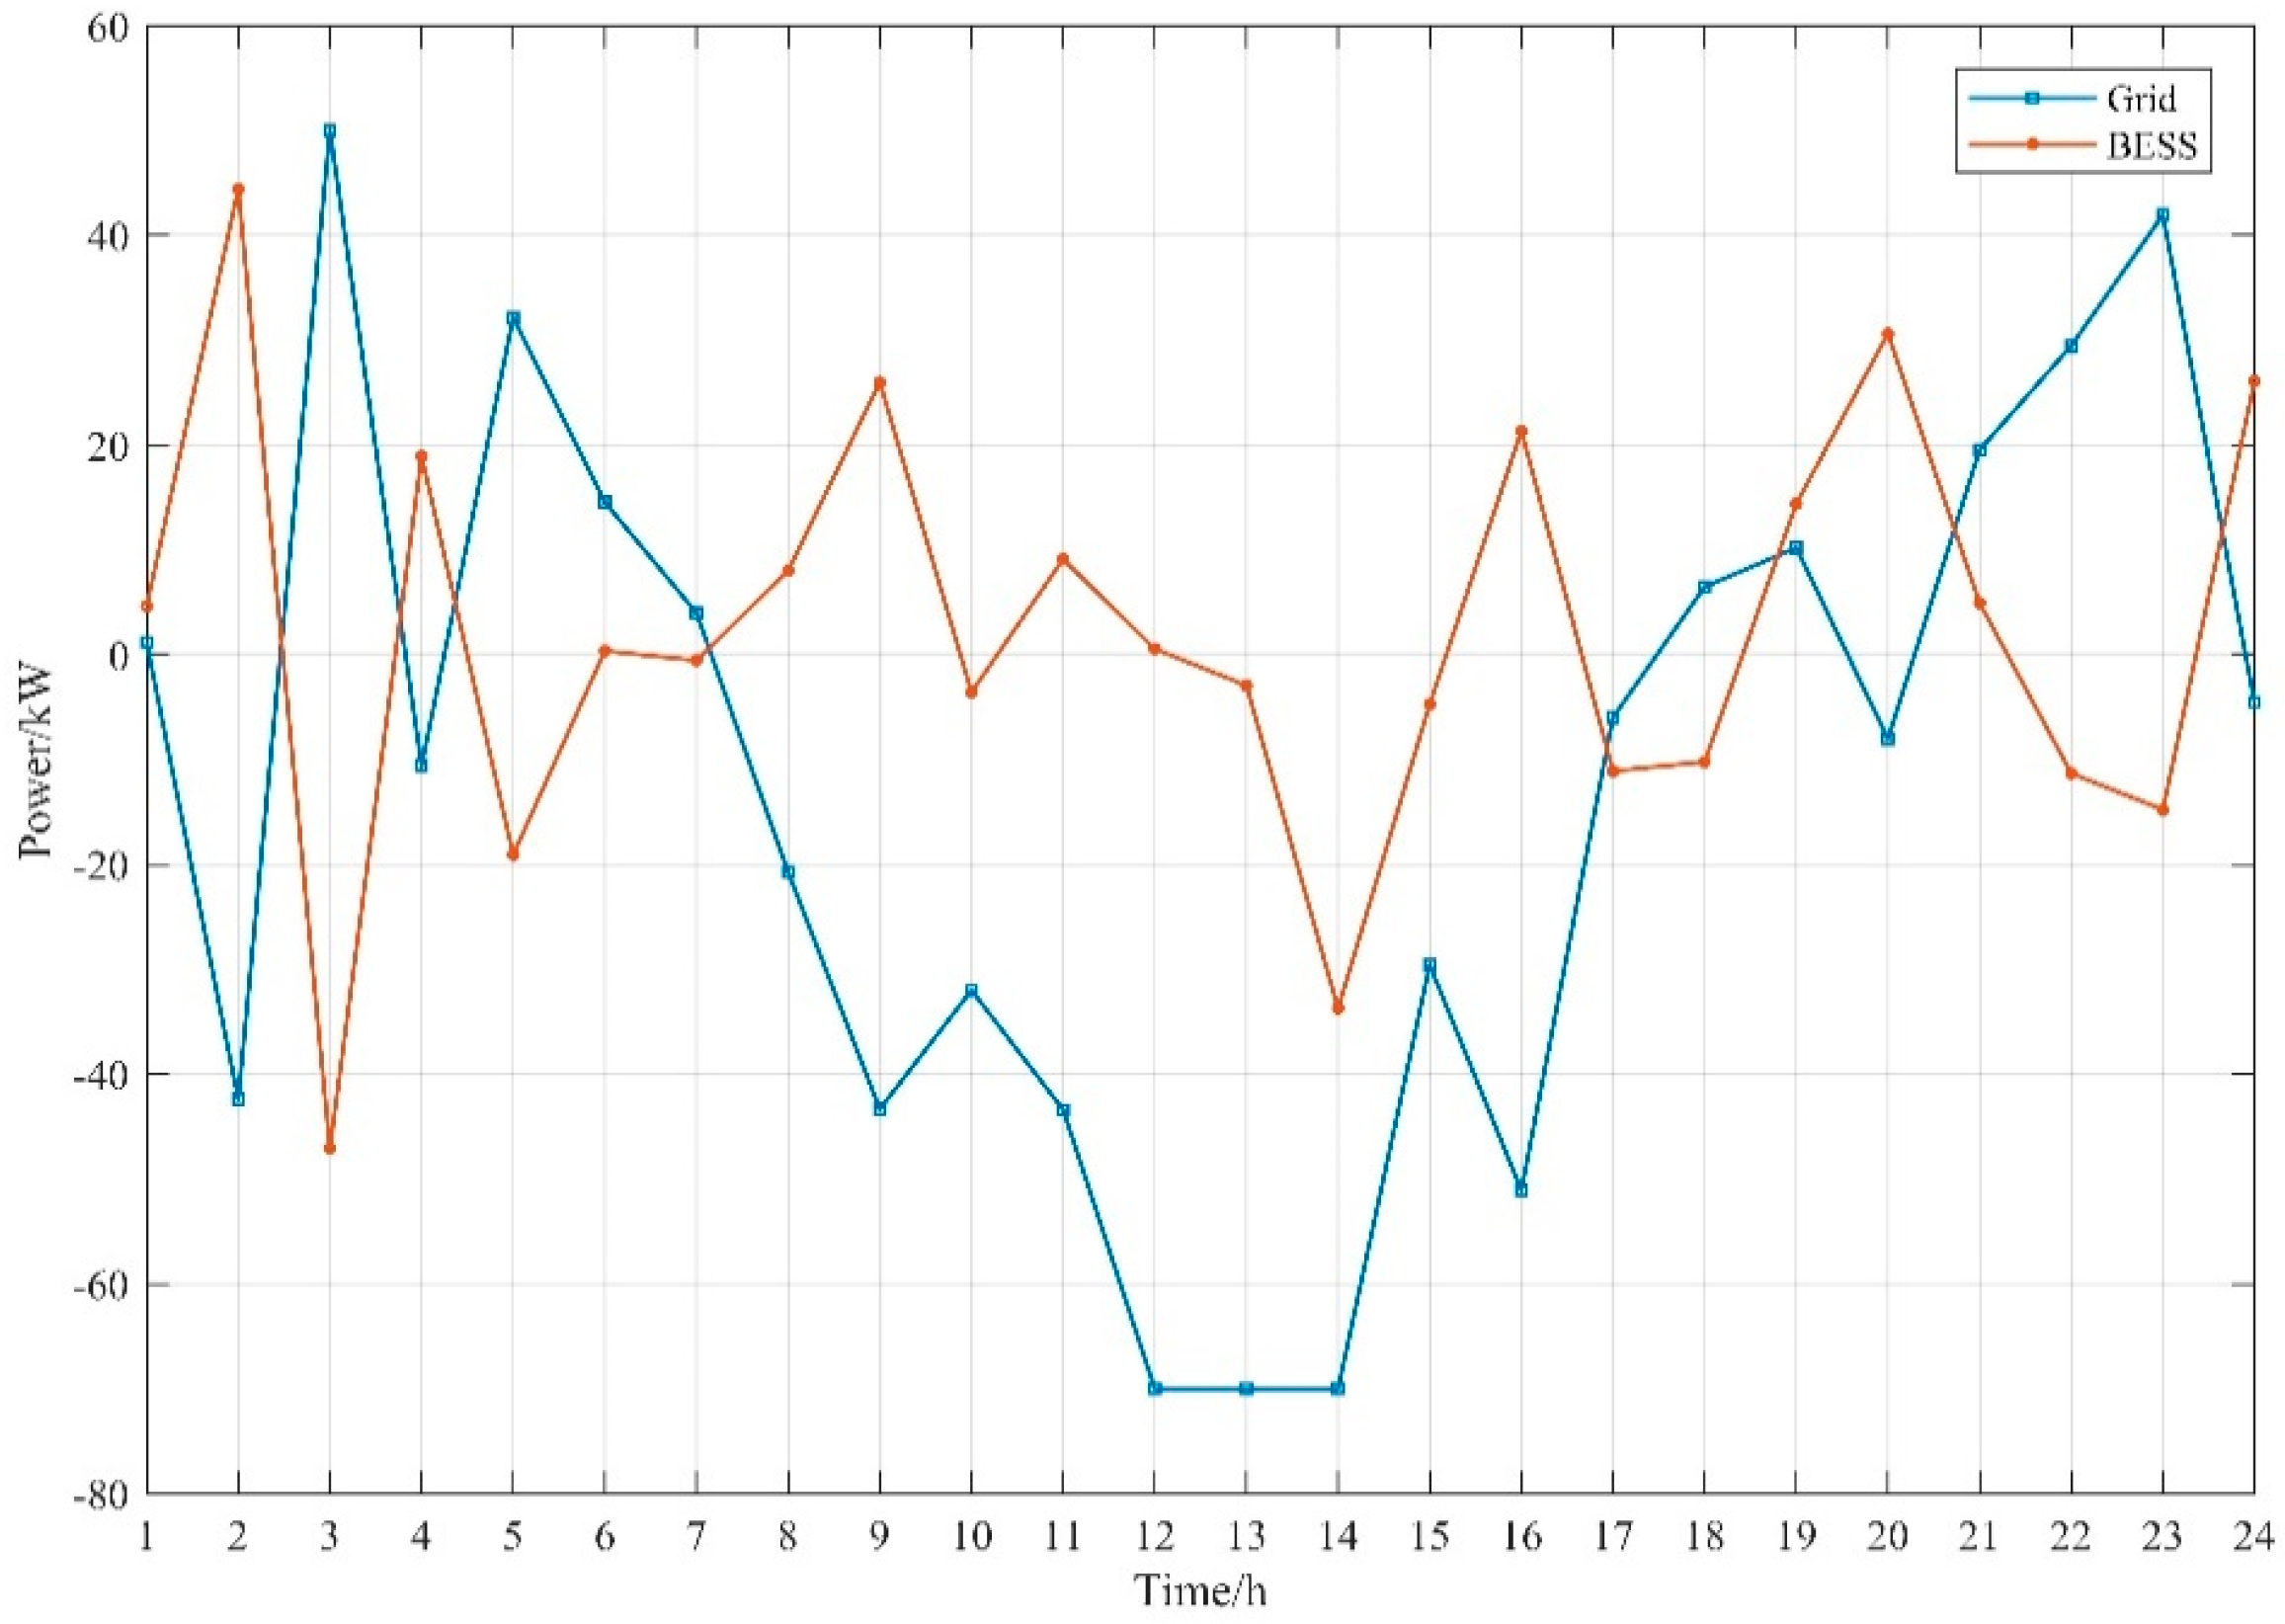
In this scenario, PV, BESS, and utility grid provide electricity to charge EVs in PBES. The decision variables are the number of PV and BESS, the power of BESS and grid, a total of 50. After 200 iterations of MAPSO, the optimal results are obtained, as shown in Table 7. Table 8 and Figure 8 illustrate the hourly power of BESS and utility grid. According to the result, the electricity sold to the grid is 501.65 kWh and the electricity purchased from the grid is 209.52 kWh. The total cost of exchanging electricity with grid is −133.871 yuan, which means that PBES can make a profit of 133.871 yuan per day from the utility grid in this scenario.
In scenario 3, COE = 0.623 yuan/kWh. When compared with scenario 1, although the number of batteries changes little, the COE decreases by 0.22 yuan/kWh, indicating that the proper installation of PV power generation equipment in the system can promote the interaction with the utility grid. PBES can sell excess power generation to the grid and bring benefits, thus reducing the COE. In addition, when compared with the scenario 2, COE in scenario 3 reduces by 131.013%, thus it can be seen, when disconnected from the grid, that the system cost dramatically increases. This is the EV charging power load can only be supplied by PV and BESS. Especially when the light intensity is zero, the PV power is almost zero and the power demand will be satisfied by BESS. Therefore, the number of batteries in scenario 2 is as high as 164. Besides, the lifetime of batteries is short, thus the batteries must be replaced many times during their lifetime to meet the load requirements of the system. Therefore, the COE of the system in scenario 2 is as high as 1.46 yuan/kWh.
It can be concluded from the above analysis that, when compared with the first two scenarios, scenario 3 has the lowest COE, that is, PBES in scenario 3 has a lower cost input. Connecting PBES to the utility grid can not only improve power supply flexibility and relieve power supply pressure, but also have the lowest input cost.
6.4. Comparative Analysis
In Section 6.3, the optimization results of three scenarios are analyzed. In order to prove that the proposed MAPSO algorithm has the characteristics of rapid convergence and improving the accuracy of the results, the effectiveness and rapidity of the MAPSO algorithm will be illustrated from two aspects, as follows.
6.4.1. Result Accuracy Comparison
In order to prove the improvement effect of MAPSO on PSO, this paper runs the optimization process for 20 times using MAPSO and PSO, respectively. Table 9 presents the result.
As can be seen from the above table, for scenario 1, the average value that is calculated by the MAPSO model is 0.874 yuan/kWh, which is 0.02 yuan/kWh lower than 0.894 yuan/kWh of the PSO algorithm. The results of both the optimal and the worst solution that were obtained by MAPSO are better than PSO. Moreover, in scenario 1, the number of batteries that were obtained by MAPSO is 50, while the result of the PSO method is 54. It can be seen that the MAPSO algorithm is more effective.
In Scenario 2, the decision variables are the number of PV and BESS, so, if these two variables are determined, then the charging and discharging mode of BESS can be obtained accordingly. Therefore, the calculation amount of this case is smaller than the others, making the solution of the optimization problem basically consistent. The COE of both algorithms is 1.46 yuan/kWh.
In scenario 3, the best solution of the 20 optimal results of MAPSO algorithm is 0.623 yuan/kWh, which is 0.035 yuan/kWh lower than that of PSO. The average solution and the worst solution are 0.634 yuan/kWh and 0.664 yuan/kWh, respectively, which are also better than the PSO algorithm. In addition, among the 20 simulation results, the optimal result of MAPSO is = 149.521, = 53, while the PSO result is = 150, = 59. According to the above analysis, it can be concluded that the MAPSO algorithm has better results than the PSO algorithm, which proves that this method has stronger search ability than PSO algorithm.
Standard deviation can reflect the dispersion degree of a data set. The smaller the standard deviation is, the less the result values deviate from the mean value. The standard deviation can reflect the stability and robustness of the algorithms. According to Table 7, in scenarios 1 and 3, the standard deviation of the MAPSO algorithm is lower than that of the PSO algorithm, indicating that the proposed MAPSO is stable and strongly robust.
6.4.2. Convergence Speed Comparison
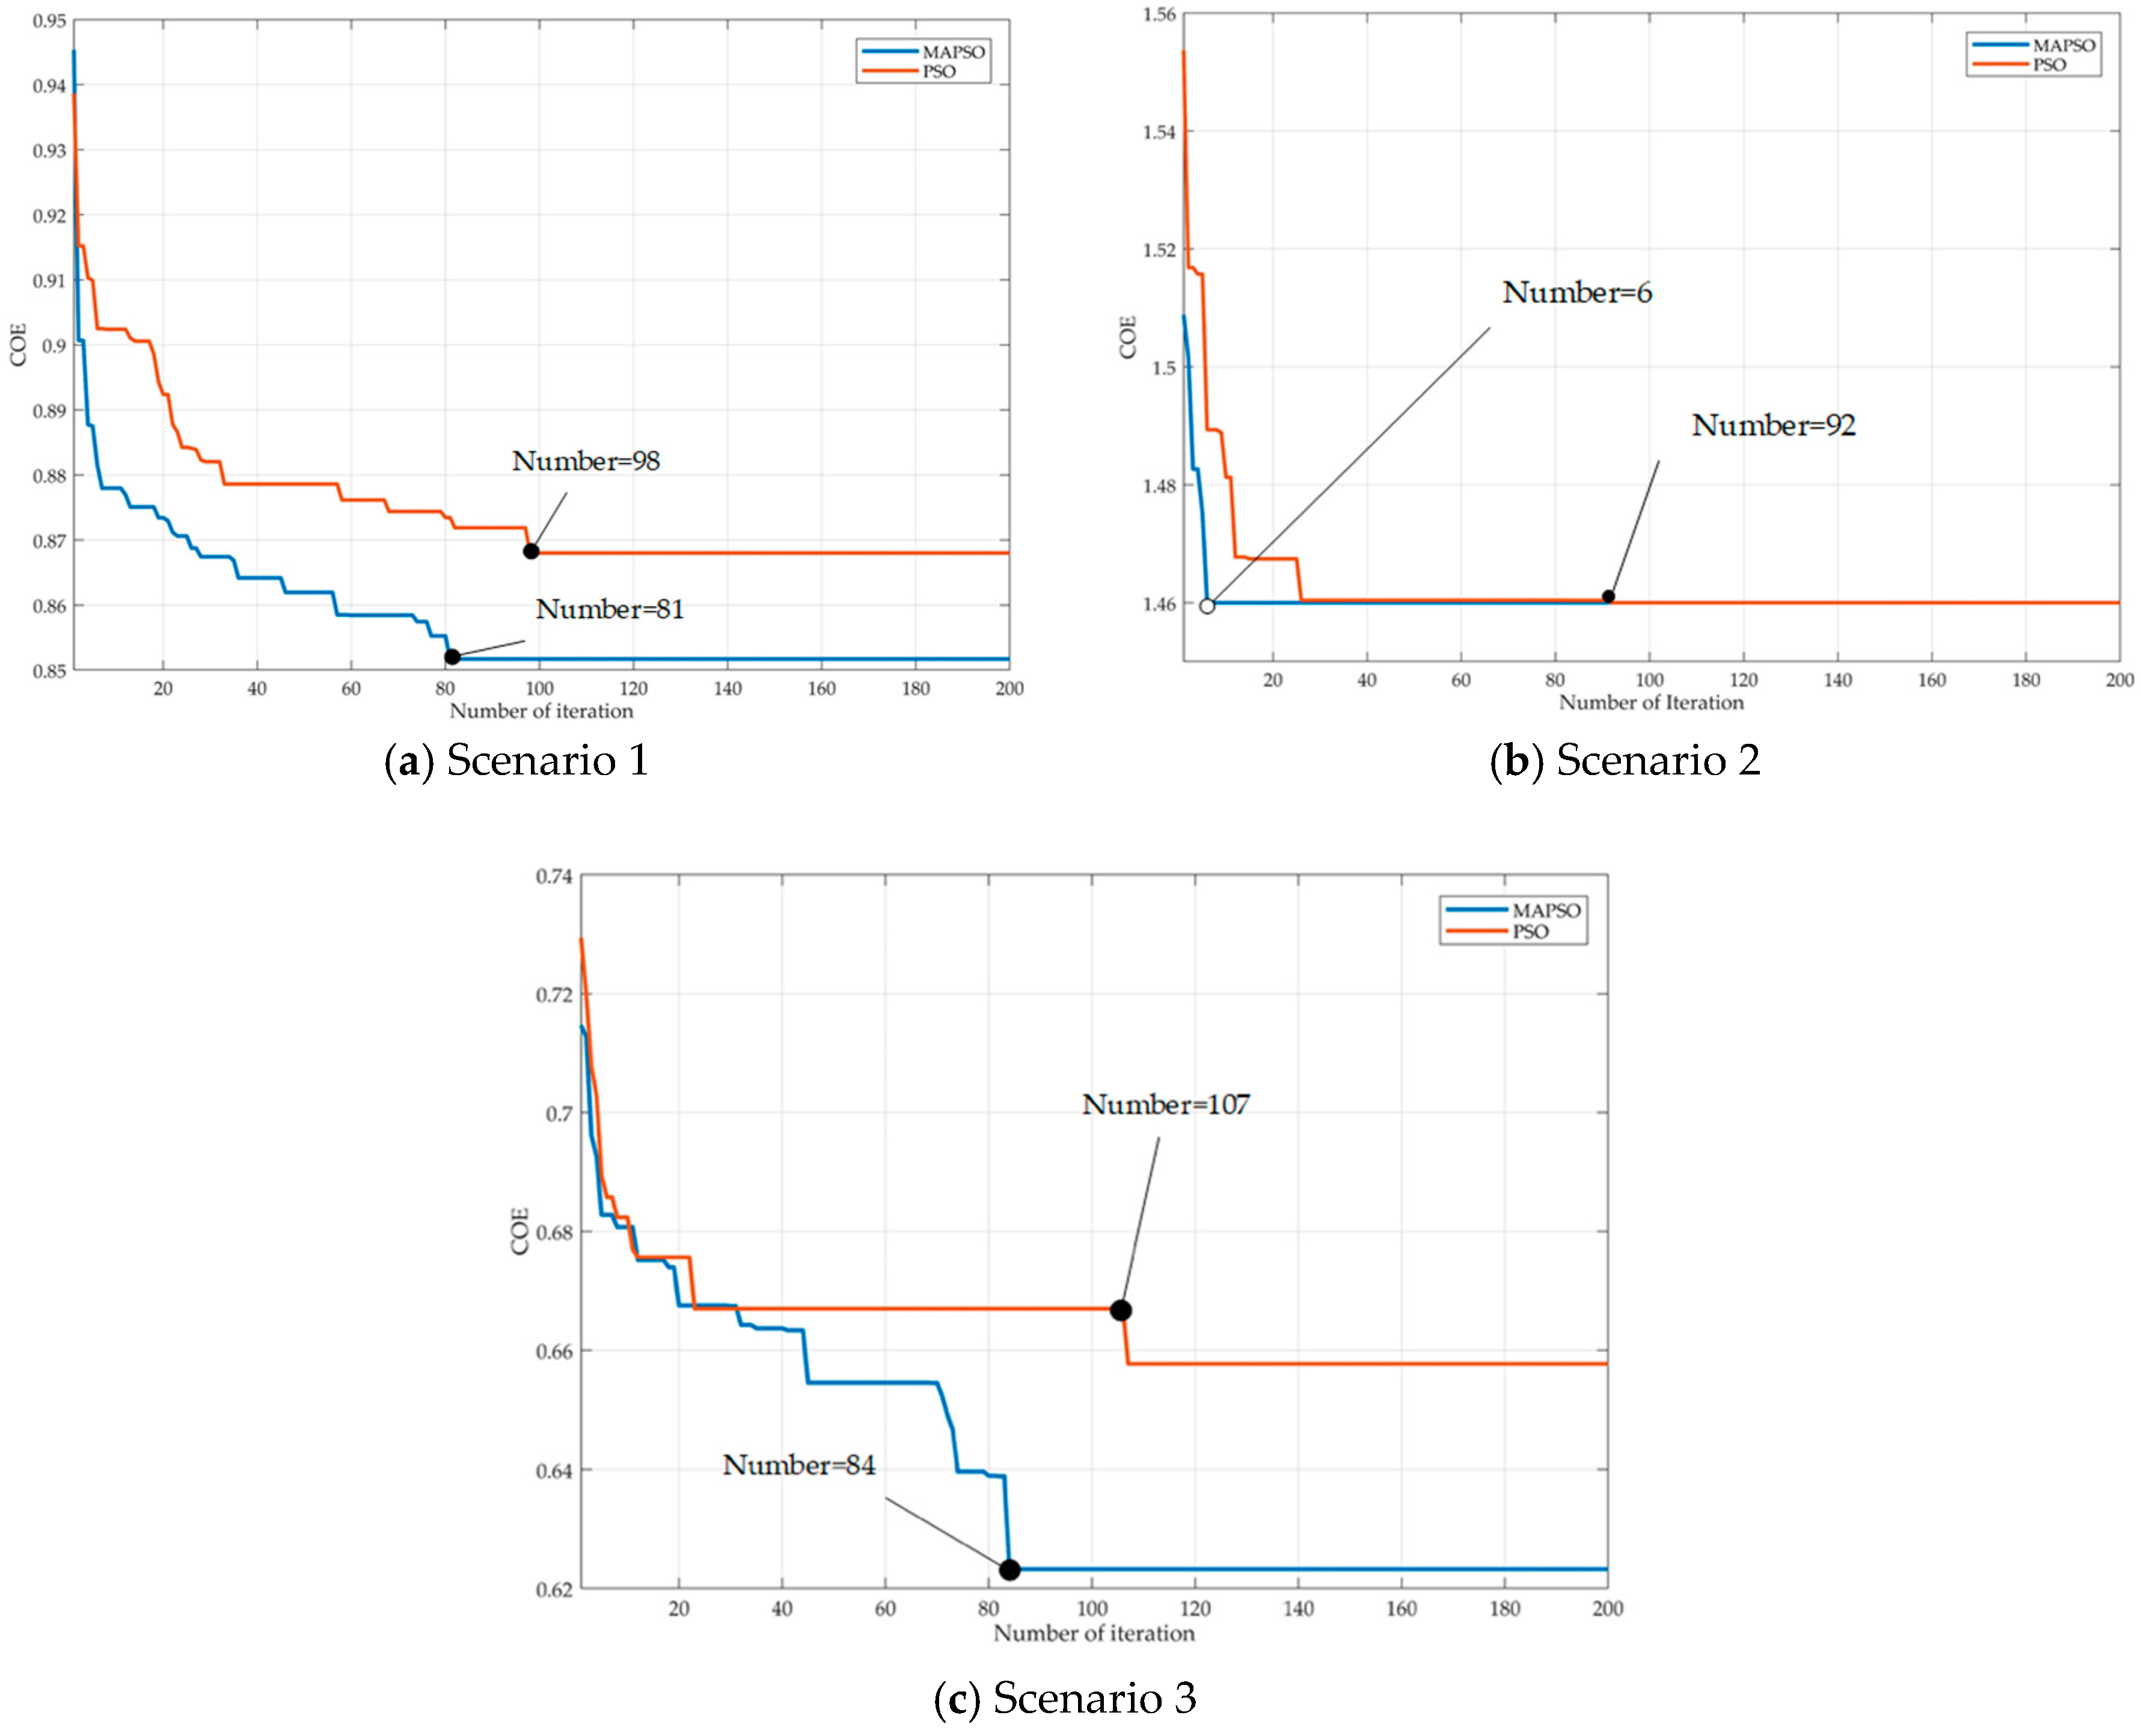
In order to prove that the MAPSO algorithm can rapidly converge, the optimization process of MAPSO and PSO for three scenarios are given, as shown in Figure 9.
In Figure 9a, the MAPSO algorithm finds the optimal solution after 81 iterations, while the PSO algorithm reaches the optimal solution at the 98th iteration. In Figure 9b, the MAPSO algorithm reaches the optimal solution in the 6th iteration, while PSO searches for the optimal solution in the 92nd iteration. In Figure 9c, the MAPSO and PSO algorithms search for the optimal solution at the 84th and 107th iteration, respectively. The mechanism of the PSO algorithm can promote the rapid transmission of information between agents. The comparison results show that the MAPSO algorithm has stronger search ability than PSO and it can achieve rapid convergence.
In this paper, the computing time of the algorithms in the above three scenarios is counted, and the average time of each algorithm executing 20 times in each scenario is taken as the criterion for discussion. For scenario 1, the average computing time of PSO is 7.4613 s and that of MAPSO is 10.7623 s. In scenario 2, the calculation time of PSO is 25.6482 s and that of MAPSO is 27.5471 s. It can be seen that the solving time of MAPSO is slightly longer than that of PSO, but it is acceptable for this problem.
6.5. Policy Implications
This paper studied PBES, which integrated the EV charging, PV generation, and ESS. With the rapid development of EVs, PBES makes use of renewable energy instead of national power grid, which not only improves the efficiency of the PV energy use and alleviates the impact of EV chargers on utility grid. Besides, in this paper, determining the optimal design of PBES can save more resources, reduce the damage to the environment, and realize the sustainable development of energy and environment. According to the results of the case study, it can be found that the PBES system can realize the optimal allocation of resources and it has the highest economic benefits under the condition of limited resources, thus achieving sustainable economic development.
In order to improve sustainable development of energy, the following policy implications are presented, based on the result analysis.
(1) The PBES can be greatly developed instead of traditional EVCS. It can be seen from scenario analysis that PBES is the most cost-effective solution, which not only makes better use of renewable energy, but also sells surplus electricity to national grid to make profits. Therefore, the government should formulate corresponding measures to encourage the construction of PBES and increase the corresponding policy subsidies.
(2) When constructing PBES, it is critical to consider the optimal allocation of resources. Reasonable resource allocation structure can save resources and realize sustainable development. In this paper, a fast and accurate sizing model was proposed, which can provide theoretical support for the PBES system construction in Shanghai and even for the whole country.
(3) According the time-of-use electricity price or real-time electricity price, the grid-connected PBES should investigate the best strategy to exchange electricity with the national power grid. In this paper, the strategy was determined based on the economic objective. However, it can also be optimized by considering some other factors.
7. Conclusions
In order to effectively improve the utilization rate of solar energy resources and solve the problem of difficult access of EV charging stations to the power grid, an integrated system of EVCS, small-scale PV system, and BESS was proposed and implemented in many cities in China. This paper presented an optimization model for grid-connected PBES design and solved the proposed model by the MAPSO method. The main conclusions of this paper are as follows.
(1) In order to overcome the shortcomings of traditional PSO, MAPSO was employed in this paper, combining the MAS and PSO mechanism. In this method, each agent competes and cooperates with its neighboring agents, and it obtains high-quality solutions through self-learning. The mechanism of the PSO algorithm can promote the rapid transmission of information between agents. Therefore, combining the characteristics of agents and the search mechanism of the PSO algorithm, MAPSO can achieve rapid convergence and improve the accuracy of the results.
(2) An optimization design model for grid-connected PBES was proposed to size PV, BESS, and determine the charging/discharging pattern of BESS and electricity exchange with the utility grid. In this model, an EV charging simulation model was presented to calculate the load demand at each hour.
(3) A case study in Shanghai, China was performed and three scenarios were analyzed. The result showed that PBES reached the lowest COE = 0.623 yuan/kWh when the number of PV and batteries were 149.521 and 53, respectively. If without the PV system, PBES will have a higher COE = 0.852 yuan/kWh. If PBES is disconnected to utility grid, then the COE will increase to 1.46 yuan/kWh. Therefore, PBES is the most cost-effective solution.
(4) In order to prove the effectiveness and rapidity of MAPSO algorithm, this paper compared it with PSO and concluded that the result accuracy and the convergence speed of MAPSO were obviously better than PSO. Therefore, it is feasible and effective to apply the MAPSO algorithm to solve the proposed optimization model.
There are still some limitations in this study. When considering the rapid development of information technology, more forms of battery charging techniques will be considered in our future research, such as wifi and uBeam over the air charging. In addition, this paper only considered the COE objective, so more factors can be taken into account in the future.
Author Contributions
Methodology, case study and writing, Q.D.; conceptualization and data collection, J.L.; Software, Q.W.
Funding
This research was funded by National Natural Science Foundation of China (Grant number: 71771085), Scientific Research Project of Universities in Inner Mongolia (Grant number: NJZC17415) and Research Project of Ordos Institute of Technology (Grant number: KYYB2017013).
Acknowledgments
The authors would like to thank the editor of this journal and the reviewers for their detailed and helpful comments.
Conflicts of Interest
The authors declare no conflict of interest.
References
- Esfandyari, A.; Norton, B.; Conlon, M.; McCormack, S.J. Performance of a campus photovoltaic electric vehicle charging station in a temperate climate. Sol. Energy 2019, 177, 762–771. [Google Scholar] [CrossRef]
- Fathabadi, H. Novel grid-connected solar/wind powered electric vehicle charging station with vehicle-to-grid technology. Energy 2017, 132, 1–11. [Google Scholar] [CrossRef]
- Karmaker, A.K.; Ahmed, M.R.; Hossain, M.A.; Sikder, M.M. Feasibility assessment & design of hybrid renewable energy based electric vehicle charging station in Bangladesh. Sustain. Cities Soc. 2018, 39, 189–202. [Google Scholar]
- Ul-Haq, A.; Cecati, C.; Al-Ammar, E.A. Modeling of a Photovoltaic-Powered Electric Vehicle Charging Station with Vehicle-to-Grid Implementation. Energies 2017, 10, 4. [Google Scholar] [CrossRef]
- Chandra Mouli, G.R.; Bauer, P.; Zeman, M. System design for a solar powered electric vehicle charging station for workplaces. Appl. Energy 2016, 168, 434–443. [Google Scholar] [CrossRef] [Green Version]
- García-Triviño, P.; Torreglosa, J.P.; Fernández-Ramírez, L.M.; Jurado, F. Control and operation of power sources in a medium-voltage direct-current microgrid for an electric vehicle fast charging station with a photovoltaic and a battery energy storage system. Energy 2016, 115, 38–48. [Google Scholar] [CrossRef]
- Chaudhari, K.; Ukil, A.; Kumar, K.N.; Manandhar, U.; Kollimalla, S.K. Hybrid Optimization for Economic Deployment of ESS in PV-Integrated EV Charging Stations. IEEE Trans. Ind. Inform. 2018, 14, 106–116. [Google Scholar] [CrossRef]
- Bhatti, A.R.; Salam, Z.; Sultana, B.; Rasheed, N.; Awan, A.B.; Sultana, U.; Younas, M. Optimized sizing of photovoltaic grid-connected electric vehicle charging system using particle swarm optimization. Int. J. Energy Res. 2019, 43, 500–522. [Google Scholar] [CrossRef]
- Domínguez-Navarro, J.A.; Dufo-López, R.; Yusta-Loyo, J.M.; Artal-Sevil, J.S.; Bernal-Agustín, J.L. Design of an electric vehicle fast-charging station with integration of renewable energy and storage systems. Int. J. Electr. Power Energy Syst. 2019, 105, 46–58. [Google Scholar] [CrossRef]
- Baik, S.H.; Jin, Y.G.; Yoon, Y.T. Determining Equipment Capacity of Electric Vehicle Charging Station Operator for Profit Maximization. Energies 2018, 11, 2301. [Google Scholar] [CrossRef]
- Badea, G.; Felseghi, R.-A.; Varlam, M.; Filote, C.; Culcer, M.; Iliescu, M.; Răboacă, M.S. Design and Simulation of Romanian Solar Energy Charging Station for Electric Vehicles. Energies 2019, 12, 74. [Google Scholar] [CrossRef]
- Torreglosa, J.P.; García-Triviño, P.; Fernández-Ramirez, L.M.; Jurado, F. Decentralized energy management strategy based on predictive controllers for a medium voltage direct current photovoltaic electric vehicle charging station. Energy Convers. Manag. 2016, 108, 1–13. [Google Scholar] [CrossRef]
- Yao, L.; Damiran, Z.; Lim, W.H. Optimal Charging and Discharging Scheduling for Electric Vehicles in a Parking Station with Photovoltaic System and Energy Storage System. Energies 2017, 10, 550. [Google Scholar] [CrossRef]
- Hafez, O.; Bhattacharya, K. Optimal design of electric vehicle charging stations considering various energy resources. Renew. Energy 2017, 107, 576–589. [Google Scholar] [CrossRef]
- Azaza, M.; Wallin, F. Multi objective particle swarm optimization of hybrid micro-grid system: A case study in Sweden. Energy 2017, 123, 108–118. [Google Scholar] [CrossRef]
- Kerdphol, T.; Fuji, K.; Mitani, Y.; Watanabe, M.; Qudaih, Y. Optimization of a battery energy storage system using particle swarm optimization for stand-alone microgrids. Int. J. Electr. Power Energy Syst. 2016, 81, 32–39. [Google Scholar] [CrossRef]
- Liu, J.; He, D.; Wei, Q.; Yan, S. Energy Storage Coordination in Energy Internet Based on Multi-Agent Particle Swarm Optimization. Appl. Sci. 2018, 8, 1520. [Google Scholar] [CrossRef]
- Kumar, R.; Sharma, D.; Sadu, A. A hybrid multi-agent based particle swarm optimization algorithm for economic power dispatch. Int. J. Electr. Power Energy Syst. 2011, 33, 115–123. [Google Scholar] [CrossRef]
- Zhao, B.; Guo, C.X.; Cao, Y.J. A Multiagent-Based Particle Swarm Optimization Approach for Optimal Reactive Power Dispatch. IEEE Trans. Power Syst. 2005, 20, 1070–1078. [Google Scholar] [CrossRef]
- Hossein Amrollahi, M.; Bathaee, S.M. Techno-economic optimization of hybrid photovoltaic/wind generation together with energy storage system in a stand-alone micro-grid subjected to demand response. Appl. Energy 2017, 202, 66–77. [Google Scholar] [CrossRef]
- Wen, S.; Lan, H.; Yu, D.C.; Fu, Q.; Hong, Y.-Y.; Yu, L.; Yang, R. Optimal sizing of hybrid energy storage sub-systems in PV/diesel ship power system using frequency analysis. Energy 2017, 140, 198–208. [Google Scholar] [CrossRef]
- Yang, S.; Wu, M.; Jiang, J.; Zhao, W. An Approach for Load Modeling of Electric Vehicle Charging Station. Power Syst. Technol. 2013, 5, 3. [Google Scholar]
- Ramli, M.A.M.; Bouchekara, H.R.E.H.; Alghamdi, A.S. Optimal sizing of PV/wind/diesel hybrid microgrid system using multi-objective self-adaptive differential evolution algorithm. Renew. Energy 2018, 121, 400–411. [Google Scholar] [CrossRef]
- Ma, T.; Yang, H.; Lu, L.; Peng, J. Pumped storage-based standalone photovoltaic power generation system: Modeling and techno-economic optimization. Appl. Energy 2015, 137, 649–659. [Google Scholar] [CrossRef]
- Jun, Z.; Junfeng, L.; Jie, W.; Ngan, H.W. A multi-agent solution to energy management in hybrid renewable energy generation system. Renew. Energy 2011, 36, 1352–1363. [Google Scholar] [CrossRef]
- Kumar, R.; Sharma, D.; Kumar, A. A new hybrid multi-agent-based particle swarm optimisation technique. Int. J. Bio-Inspired Comput. 2009, 1, 259–269. [Google Scholar] [CrossRef]
- Roshanzamir, M.; Balafar, M.A.; Razavi, S.N. Empowering particle swarm optimization algorithm using multi agents’ capability: A holonic approach. Knowl.-Based Syst. 2017, 136, 58–74. [Google Scholar] [CrossRef]
- Kamankesh, H.; Agelidis, V.G.; Kavousi-Fard, A. Optimal scheduling of plug-in electric vehicles and renewable micro-grid in energy and reserve markets considering demand response program. J. Clean. Prod. 2018, 186, 293–303. [Google Scholar]
Figure 1.
The schematic view of PBES.

Figure 2.
The flow chart of EV charging load simulation.

Figure 3.
Structure of the global environment.

Figure 4.
The specific steps of multi-agent particle swarm optimization (MAPSO).

Figure 5.
The solar radiation at each hour.

Figure 6.
Number of EV arriving and EV charging load.

Figure 7.
The hourly power of BESS and grid in scenario 1.

Figure 8.
The hourly power of BESS and grid in scenario 3.

Figure 9.
The convergence of three scenarios.


Table 1.
Summary of important studies related to size optimization and energy management for photovoltaic/battery energy storage/electric vehicle charging station (PBES).
Table 1.
Summary of important studies related to size optimization and energy management for photovoltaic/battery energy storage/electric vehicle charging station (PBES).
| Method Classification | Reference | Objective Function | Solution Method |
|---|---|---|---|
| Software tools | [3] | Cost of energy, emission factor | HOMER software |
| [14] | Net present value | HOMER software | |
| [1] | Self-consumption | TRNSYS software | |
| [11] | Power supply reliability | IHOGA software | |
| Programming solver | [5] | Grid dependency, usage of solar power | MILP |
| [7] | Cost function | Linear programming | |
| [10] | Profit | MILP | |
| [13] | Operation cost and electric vehicles (EV) owner satisfaction | MILP | |
| Artificial intelligence | [8] | Financial model | PSO |
| [9] | Net present value | Genetic algorithm |
Table 2.
Specifications of the PBES components and economic parameters.
| Component | Parameter | Value | Unit |
|---|---|---|---|
| PV | Rated power | 1 | kW |
| Investment cost | 10,000 | Yuan/unit | |
| Maintenance cost | 35 | Yuan/year | |
| Life time | 25 | year | |
| Reduction factor of panels () | 85 | % | |
| Cell temperature under STC | 25 | °C | |
| PV temperature coefficient | 0.0045 | - | |
| Normal operation cell temperature (NOCT) | 55 | °C | |
| Battery Energy Storage System (BESS) | Rated capacity | 1.2 | kWh |
| Investment cost | 1890 | Yuan/unit | |
| Maintenance cost | 35 | Yuan/year | |
| Replacement cost | 1750 | Yuan/unit | |
| Depth of discharge (DOD) | 20 | % | |
| Self-discharge | 0.002 | ||
| Life time | 10 | Year | |
| Economic parameters | Interest rate | 6 | % |
| Residual Value | 10% Investment cost | Yuan/unit |
Table 3.
Parameters of MAPSO.
| Population Size | Maximum Number of Iterations | wmax | wmin | Global Environment | ||
|---|---|---|---|---|---|---|
| 25 | 200 | 2 | 2 | 0.9 | 0.4 | 8 8 |
Table 4.
The optimization result of scenario 1.
| Parameter | Value |
|---|---|
| Number of batteries | 50 |
| Purchase from grid (kW) | 461.84 |
| Sell to grid (kW) | 41.612 |
| COE (yuan/kWh) | 0.852 |
| Electricity cost (yuan) | 221.888 |
Table 5.
The optimal power of BESS and grid.
| Time/h | Grid/kW | BESS/kW | Time/h | Grid/kW | BESS/kW | Time/h | Grid/kW | BESS/kW |
|---|---|---|---|---|---|---|---|---|
| 1:00 | 3.339 | 2.483 | 9:00 | 8.296 | 18.215 | 17:00 | 17.477 | 10.522 |
| 2:00 | −38.560 | 40.579 | 10:00 | 25.603 | −6.946 | 18:00 | 35.097 | −13.710 |
| 3:00 | 29.380 | −26.450 | 11:00 | 38.716 | −10.794 | 19:00 | 18.554 | 6.068 |
| 4:00 | 6.590 | 1.775 | 12:00 | 42.521 | −24.234 | 20:00 | −3.052 | 25.673 |
| 5:00 | 28.941 | −15.858 | 13:00 | 30.047 | 0.288 | 21:00 | 10.001 | 14.474 |
| 6:00 | 15.971 | −1.039 | 14:00 | 7.458 | 8.415 | 22:00 | 19.187 | −1.028 |
| 7:00 | 23.696 | −0.306 | 15:00 | 23.247 | 5.837 | 23:00 | 35.452 | −8.264 |
| 8:00 | 0.319 | 22.851 | 16:00 | 30.547 | −11.223 | 24:00 | 11.402 | 10.123 |
Table 6.
The optimization result of scenario 2.
| Parameter | Value |
|---|---|
| Number of batteries | 164 |
| Number of PV | 65.4 |
| COE (yuan/kWh) | 1.46 |
Table 7.
The optimization result of scenario 3.
| Parameter | Value |
|---|---|
| Number of batteries | 53 |
| Number of PV | 149.521 |
| Purchase from grid (kW) | 209.523 |
| Sell to grid (kW) | 501.639 |
| COE (yuan/kWh) | 0.623 |
| Electricity cost (yuan) | −133.871 |
Table 8.
The optimal power of BESS and grid.
| Time/h | Grid/kW | BESS/kW | Time/h | Grid/kW | BESS/kW | Time/h | Grid/kW | BESS/kW |
|---|---|---|---|---|---|---|---|---|
| 1:00 | 1.182 | 4.640 | 9:00 | −43.339 | 25.990 | 17:00 | −5.966 | −11.091 |
| 2:00 | −42.397 | 44.416 | 10:00 | −32.006 | −3.563 | 18:00 | 6.478 | −10.21 |
| 3:00 | 50 | −47.07 | 11:00 | −43.397 | 9.119 | 19:00 | 10.212 | 14.41 |
| 4:00 | −10.574 | 18.939 | 12:00 | −70 | 0.568 | 20:00 | −8.006 | 30.628 |
| 5:00 | 32.155 | −19.072 | 13:00 | −70 | −2.934 | 21:00 | 19.529 | 4.947 |
| 6:00 | 14.554 | 0.378 | 14:00 | −70 | −33.74 | 22:00 | 29.464 | −11.305 |
| 7:00 | 3.992 | −0.538 | 15:00 | −29.598 | −4.715 | 23:00 | 41.96 | −14.771 |
| 8:00 | −20.74 | 8.025 | 16:00 | −51.071 | 21.353 | 24:00 | −4.55 | 26.077 |
Table 9.
The result comparison between MAPSO and particle swarm optimization (PSO).
| Best Solution (yuan/kWh) | Average Solution (yuan/kWh) | Worst Solution (yuan/kWh) | Standard Deviation | ||
|---|---|---|---|---|---|
| Scenario 1 | PSO | 0.868 | 0.896 | 0.934 | 0.032 |
| MAPSO | 0.852 | 0.874 | 0.901 | 0.024 | |
| Scenario 2 | PSO | 1.460 | 1.460 | 1.460 | 0 |
| MAPSO | 1.460 | 1.460 | 1.460 | 0 | |
| Scenario 3 | PSO | 0.658 | 0.687 | 0.702 | 0.019 |
| MAPSO | 0.623 | 0.634 | 0.664 | 0.013 |
© 2019 by the authors. Licensee MDPI, Basel, Switzerland. This article is an open access article distributed under the terms and conditions of the Creative Commons Attribution (CC BY) license (http://creativecommons.org/licenses/by/4.0/).
Share and Cite
MDPI and ACS Style
Dai, Q.; Liu, J.; Wei, Q. Optimal Photovoltaic/Battery Energy Storage/Electric Vehicle Charging Station Design Based on Multi-Agent Particle Swarm Optimization Algorithm. Sustainability 2019, 11, 1973. https://doi.org/10.3390/su11071973
AMA Style
Dai Q, Liu J, Wei Q. Optimal Photovoltaic/Battery Energy Storage/Electric Vehicle Charging Station Design Based on Multi-Agent Particle Swarm Optimization Algorithm. Sustainability. 2019; 11(7):1973. https://doi.org/10.3390/su11071973
Chicago/Turabian StyleDai, Qiongjie, Jicheng Liu, and Qiushuang Wei. 2019. "Optimal Photovoltaic/Battery Energy Storage/Electric Vehicle Charging Station Design Based on Multi-Agent Particle Swarm Optimization Algorithm" Sustainability 11, no. 7: 1973. https://doi.org/10.3390/su11071973
Note that from the first issue of 2016, this journal uses article numbers instead of page numbers. See further details here.