Network Position Advantage and Technological Innovation of China’s New Energy Vehicle Based on the Perspective of Network Theory


Beijing Institute of Technology, Beijing 100081, China
*
Author to whom correspondence should be addressed.
Sustainability 2019, 11(7), 2098; https://doi.org/10.3390/su11072098
Submission received: 28 February 2019
/
Revised: 26 March 2019
/
Accepted: 28 March 2019
/
Published: 9 April 2019
(This article belongs to the Section Economic and Business Aspects of Sustainability)
Abstract
:This paper attempts to explore the role of innovation networks in the new energy vehicle industry from the perspective of evolution, by integrating of the overall network and the entities’ microscopic features and designing relative variables. Based on market orientation theory social network analysis, the relationship between network location and technological niche and the role of the network relationship strength was examined through empirical data of China’s 2009–2017 patents for new energy vehicles. The results show that: (1) There is an inverted U-shaped relationship between the central position and the technological niche “state” and “potential”; (2) There is an inverted U-shaped relationship between the brokerage position and the entities’ technological niche “state”, and the inverted U-shaped relationship with the technological niche “potential” is not significant; (3) The overall relationship strength of the network modulates the inverted U relationship between the central location and the technological niche. This paper opens up new ideas for the research of the role of innovation networks. The research conclusions have important implications for the management practice of new energy vehicle industries in China through collaborative networks to achieve technological innovation.
1. Introduction
Against the background of the shortage of international energy supply and the increasing demand for environmental protection, the new energy vehicle (NEV) industry, which has the characteristics of energy saving and environmental protection, is not only a key power for cultivating a new economic growth point, but also an important driving force for the transformation and upgrade of the automobile industry. Since 2001, China has introduced a series of policies to promote the development of new energy vehicle industry, and raised it to a national strategy. Guided by policy, the new energy vehicle industry is growing rapidly, and has great prospects.
Nevertheless, with respect to the constraints of a lack of resources, the vulnerability of emerging industries, and a complex environment, technological innovation has become the inevitable choice for the new energy vehicle industry to break through these limitations. Technological innovation for new energy vehicles has two distinct characteristics: novelty and value. Novelty represents new technology and its new achievements, and value is manifested by the realization of market commercial value and the transformation from commercial value to social benefit [1]. These two characteristics reflect the bridge function of the market throughout the whole process of technological innovation [2]. The important role of the market indicates that technological innovation needs to focus on market orientation, and new energy vehicle enterprises need to connect all kinds of entities in the market to broaden their own advantages [3]. It can be said that the close relationship between market orientation and multi-entity collaboration is the main driving factor for technological innovation [4]. Actually, entities have developed innovation networks comprising formal and informal links [5], and taken advantage of the network effect to lead and drive the sustainable development, transformation, and upgrading of the industry. China has formed a variety of innovation networks, such as the National New Energy Vehicle Technological Innovation Collaborating Center, the Intelligent New Energy Vehicle Collaborative Innovation Center, the Beijing-Tianjin-Hebei New Energy Vehicle, and the Intelligent Network Alliance Automotive Collaborative Innovation Alliance. Compared with the innovation networks of traditional industries, the new energy vehicle innovation networks realize the integration of economic network, social network and innovation network. These networks consist of diverse entities whose technical and economic relationships are closer and more complex [6], and the technology transfer within networks is more frequent and the models are flexible [7]. Meanwhile, they can form the basis of resource and knowledge interactions among multiple innovation entities with mutually beneficial effects for technological integration and optimization, thus accelerating the speed and efficiency of innovation for dealing with uncertainty and complexity [8].
However, there are many problems in the development of many innovation networks, especially network failure caused by the lack of effective management. Therefore, regardless of the stage in which innovation networks are, it is important to manage them effectively, and this directly affects the development of the networks. Moreover, innovation networks depend on the entities and the social environment in which the networks exist [9], and will show different characteristics in different industries and industrial environments, and will also have different effects on the innovation outputs [10]. As a result, in order to achieve effective management of new energy vehicle innovation networks, it is necessary to clarify some questions. What are the characteristics of new energy vehicle innovation networks? How do networks affect technological innovation? How does this influence change in different situations?
Based on the above problems, we pay attention to the research on the innovation management of new energy vehicles, and the research mainly includes three parts: innovation policy and policy evaluation [11,12], innovation of the single factor (technological innovation, business model innovation, etc.) [13,14,15], and innovation system [16,17]. In recent years, new energy vehicle innovation systems and collaborative innovation have become hotspots, but whether building an innovation system or creating a collaborative organization, the kinds of innovation entities and how they contact with each other are key points, and all of these are basic characteristics of innovation networks. Hence, it is necessary to analyze the mechanism of innovation from the perspective of networks. Currently, the research on new energy vehicle networks is mainly focused on three aspects: network structure, network governance and network evolution. For example, based on collaborative innovation theory, Liu et al. analyzed some new innovative technologies and constructed a framework based on five stages of Yutong’s collaborative innovation, and they summarized the role of “government–industry–university–research institution” in the process of innovation strategy [18]. Sun et al. took the top 38 organizations with the greatest number of NEV-related patents as study targets and analyzed the cooperative networks based on social network analysis. They thought that the network developed well with a growing density of the network, stable structure and many subgroups [19]. Liu et al. provided a multidimensional evaluation model for selecting the developing direction of new energy vehicles, and they found that China should obey the line of “oil-electric hybrid, pure electric, improved hybrid hydrogen fuel cell (hydrogen power), rechargeable hybrid” [20]. By using a simulation method, Chen et al. held that the clustering structure and betweenness significantly influenced the anti-risk capacity of the new energy vehicle innovation network in northeast China [21]. In a word, the research provides an important foundation for analyzing the characteristics of new energy vehicle innovation networks, and is helpful for understanding the characteristics of the industrial situation. However, the research is still relatively sparse, with research on the influence of innovation network on technological innovation in new energy vehicles, in particular, still being relatively lacking.
The new energy vehicle industry has all the characteristics of an emerging industry, such that research on the relationship between innovation networks and technological innovation in emerging industries will be beneficial to the new energy vehicle industry. Furthermore, the development mechanism of emerging industry networks has been confirmed by many innovation practices and related theoretical studies to be conducive to aggregating innovation resources, promoting the transformation of scientific and technological achievements, and improving innovation efficiency [22,23,24,25]. Although research on the impact of innovation networks on technological innovation in emerging industries has received much attention, it has been found through the relevant literature that existing studies have the following deficiencies.
First, the existing research presents divergent views. For example, network closure theory considers that high-density networks help to form cooperation norms, create a climate of trust, and promote product development [26], while structural hole theory asserts that sparse, high-span networks provide diverse information to promote the formation of innovative ideas [27]. In response to these competing ideas, some scholars have proposed that different network structures play different roles at different stages of technological innovation [28]. Focusing on the time dimension is an important breakthrough point in explaining the value of innovation networks [29].
Second, the influence of borders is not yet clear. Innovation networks are regarded as an important way to surpass organizational boundaries and acquire heterogeneous resources [30]. They can also be a catch-up approach for latecomers to acquire strategic resources and lock-in technological breakthroughs [31]. However, many existing studies have explored the impact of the overall network on technological innovation in terms of its structural characteristics [32,33,34], ignoring the different positions each entity occupies in an intricate technological innovation network. The entities at different network positions have different abilities to absorb and transform network technology spillovers; they also hold different abilities with respect to influence [35]. Existing research generally considers that the dominant entities, who occupy advantageous network positions, can better collect and process new technological knowledge and can better control network resources [36,37]. However, less consideration has been given to the moderating effect of the characteristics of the whole network, which causes the entity to have a close relationship with others within the network and distinguishes this network from others [38]. Integrating the overall network and the micro-characteristics of the entities to further explain the role of the innovation network is a necessary consideration for future research.
Third, the design of variables needs to be improved. Technological innovation is often regarded as an absolute result [39]. However, many studies on innovation and its various forms, such as technological innovation performance, technological innovation capability, product research and development, and exploratory innovation, have demonstrated the effectiveness of innovation networks as a better variable for technological innovation [40,41,42]. Yet, innovation network is a relative concept. From a vertical perspective, an innovation network is an ever-evolving organic system—its basic nature is constantly and dynamically developing [43]. From a horizontal perspective, the micro-characteristics of specific network locations are a manifestation of the status of each innovation entity [44], representing the relative capabilities of various entities to innovate [45]. Therefore, both absolute and result-oriented explained variables are clearly unsuitable for the dynamic development of relative explanatory variables.
In view of the above deficiencies, this paper uses market orientation and social network analysis (SNA) as a theoretical basis to build China’s new energy vehicle innovation network through patent data, comprehensively considering the time dimension and cross-section dimension of the innovative network, and showing the combination of static and dynamic characteristics of the network. Then, empirical methods are used to study the evolution of each entity’s network position on their technological niche and the changeable influence on the overall network. Through this analysis, the role of the new energy vehicle industry innovation networks in technological innovation is revealed. The next two sections introduce the theoretical basis and provide the hypothesis about the relationship between network position and the technological niche. Section 4 focuses on the methods and data, and Section 5 looks at the empirical results for the innovation network position’s influence on the technological niche. The remaining two sections are mainly conclusions, policy implications and contributions and limitations.
2. Theoretical Basis
2.1. Market Orientation Theory
Market orientation theory is the cornerstone of strategic marketing and strategic management, and is also the prerequisite for realizing competitive advantage and providing unique value to customers. In the late 1980s, market orientation began to appear in the literature, and it was interpreted narrowly to adapt to existing consumer preferences or market structures through the adjustment of product [46]. In the 1990s, scholars gradually put forward the definition of market orientation from the perspectives of “culture” [47] and “behavior” [44]. Of these, the behavioral perspective provides the basis for explaining the connections among market entities with respect to market orientation. Jaworski and Kohli deepened the definition of market orientation on the basis of a systematic review of the research. They thought that market orientation was a form of innovative behavior, and it included the generation and internalization of market information coming from customers and competitors, as well as active and passive responses to market information [48]. It can be seen that market orientation is a guidance incentive that is based on the market demand and transformation efficiency. The driving effect of technological innovation is produced by the combination of customers, competitors and other entities [49]. Therefore, combining market orientation and multi-entity collaboration can form the basis of a “multi-entity collaboration–technological innovation” paradigm that is based on market orientation. Moreover, technological innovation is not static in this paradigm, and is a dynamic process that changes with the changes in the collaborative relationship among the main entities.
Under the guidance of market orientation, according to the dynamic characteristics of technological innovation, this paper introduces the concept of the technological niche to represent the technological innovation of new energy vehicles. The technological niche (or innovation niche) represents the protection space in an emerging technology’s innovation and development [50]. Technological niche represents the ability of an entity to adapt a technology to the external environment. It is also a manifestation of the entity’s technological competitiveness. This is a relative and continually evolving concept that can be evaluated in terms of the ecostate and the ecorole of the technological niche. The ecostate of a technological niche is the result of the accumulation of past learning and is a quantitative expression of innovation ability. The ecorole of a technological niche is the influence and power of the innovation entity on the environment and is a manifestation of an entity’s potential to innovate.
2.2. Social Network Analysis and Network Position
Social network analysis is a theoretical method that integrates multiple disciplines to study the relationship between actors. By focusing on the overall structural and functional interactions between actors and the process of change, social network analysis reveals the influence of a network structure on individuals and groups [51]. After decades of development, social network analysis has become the theory that underpins network structures, as well as the hypotheses of weak relationship strength and strong relationship theory, embeddedness theory, structural hole theory, and social capital theory. In addition, compared with other theories, the significance of social network analysis lies in its definition of the “connection”: it can not only explain the process of social mechanisms, but also emphasizes the interaction between nodes from the perspective of the overall network [52]. It is very suitable for research into innovation and the solving of technical difficulties in new energy vehicles.
An entity’s network position is an important variable in network embedding theory, which refers to an individual’s position in the social network. This is the result of the relationship between an individual and other network members, and can be used to describe an individual’s access to resources [53]. Two forms of this variable have been widely studied by the academic community―central position and brokerage position―because they best reflect the impact of network position on innovation performance [36]. Central positions refer to individuals with many relationships to others in the network. The more connected their network nodes, the stronger their centrality. Brokerage positions describe the diversity of the network connections, which serve as a bridge between two disconnected nodes.
Generally speaking, the crossing and integration of market orientation theory and social network analysis have opened up research perspectives on the relationship between innovation network location and technological innovation. Market orientation theory broadens the perspective for the purposes of analyzing technological innovation in the new energy vehicle industry. Social network analysis provides a tool for understanding the location of new energy vehicles within the innovation network, while the introduction of the concept of the technological niche relates to characteristics of technological innovation as emphasized by market orientation theory. Based on these theories, we use two types of network position (central position and brokerage position) as the explanatory variables, and technological niche (the ecostate and ecorole of a technological niche) as the explained variables to analyze the evolution and utility of China’s new energy vehicle innovation network. Additionally, we use tie strength as a representation of the overall network to reveal the moderating effects of the overall network characteristics.
3. Hypothesis Development
3.1. Central Position and Technological Niche
A central position is a hub within the network. The more an entity is connected to the network, the stronger the centrality of its position. An entity that is central has obvious information superiority, but it also has superiority of authority. A great deal of important information needs to pass through the hub [54], so a central position is more conducive to owning and mobilizing resources. As Podolny puts it, network connections are both pipes for information and a prism of the differences between each entity’s actions [55]. A central entity is more likely to acquire external information and resources, identify opportunities for innovation, and learn from knowledge [56]. Hence, information superiority improves an entity’s capability for technological innovation [55]. Moreover, the Matthew effect lends higher authority and prestige to the central entity [57]. These entities typically find it easier to gain the trust and support of other entities [58], and are more likely to dominate the development of uniform rules and standards [59]. Hence, authority advantage becomes a means for achieving technological innovation competitiveness. Therefore, a central position is conducive to making full use of a network’s resources, which can help to promote the capability for technological innovation and competitiveness.
However, being too close to the center can also have a negative effect. Some scholars believe that being closer to the center limits innovation through the ‘homogeneous effect of the established framework’ [60]. The less feasible it is to practice breakthrough innovation, given established and embedded thinking, the more easily an entity’s ability to innovate can be constrained by its own reputation and network standards. In addition to the negative influence of authority advantage, it may be impossible for an entity to receive all information due to limits on the capacity of an organization to absorb knowledge. Furthermore, information redundancy tends to increase the difficulty and cost of resource screening [61], which, in turn, reduces the efficiency of technological innovation. Such circumstances are not conducive to integrating the technology resources within a network, nor to expanding technological niche [62]. In summary, the following assumptions are made:
H1a.
The central network position has an inverse U-shaped relationship with the ecostate of the technological niche.
H1b.
The central network position has an inverse U-shaped relationship with the ecorole of the technological niche.
3.2. Brokerage Position and Technological Niche
Brokerage positions form the bridges of a network, and serve to transmit information and resources between two nodes that are not directly connected. An innovation entity in a brokerage position has significant advantages in terms of ‘integration’ and ‘control’. Because the entities in brokerage positions have more opportunity to access heterogeneous resources, scarce knowledge [63], and dynamic and non-redundant information in a time-efficient way [64], they can effectively reduce invalid connections between nodes. This means they can acquire, absorb, and integrate required external resources more quickly and efficiently. Relying on integration advantages to carry out technological innovation activities is conducive to expanding technological niches. Furthermore, acting as a bridge for a disconnected node provides opportunities to control information and resources [65], increasing that entity’s network rights [66]. Relying on control advantages increases competitiveness in technological innovation. Therefore, a brokerage position is conducive to the integration and control of network resources and improves the entity’s capability for, and competitiveness within, technological innovation.
However, having integration and control advantage without actually being a brokerage may be more favorable. Hannah et al. point out that a brokerage position is negatively related to the degree of trust [67]. Exercising integration advantage and control advantage can easily be seen as opportunistic behavior by other nodes, which hinders the cultivation of trust and resource sharing between the entities. Therefore, other network members may not be conducive to the entity acquiring and absorbing external knowledge for technological innovation.
In summary, the following assumptions are made:
H2a:
An inverted U-shaped relationship exists between the brokerage network position and the ecostate of the technological niche.
H2b:
An inverted U-shaped relationship exists between the brokerage network position and the ecorole of the technological niche.
3.3. The Moderating Effect of Tie Strength
The information superiority and authority superiority associated with the central position, and the integration advantages and control advantages associated with the brokerage position, have both positive and negative effects on technological innovation. This process is affected by the innovation entity, the overall network, the other network members, and so on. Among these factors, the overall network is the systemic environment of the main activities in innovation. Although research has the potential to provide a better understanding of how to use innovation networks effectively and could help to guide an innovation entity when participating in an innovation network, current research in this area is quite limited. Hence, the influence of the overall network characteristics on the role of network position should be studied. The influence of the overall network characteristics on the role of network position should be studied. An important dimension for describing the characteristics of an overall network is the strength of the relationship between the members of the network, namely tie strength. Granovetter defines tie strength as a set of concepts consisting of four dimensions: contact duration and frequency, emotional strength, mutual trust, and reciprocity [68]. He proposes that the relationships between nodes will form with different strengths, and that the strength of these relationships will affect inter-information flow, trust building, and knowledge creation between the nodes. To expand this notion, we assert that an inverse U-shaped relationship between network position and technological niche will amplify the tie strength and, in turn, the positive and negative effects that network position may have.
In the process of an entity’s development from a low to a medium level of centrality, the positive effects of information and authority superiority will become more obvious if the overall network has a higher intensity. First, because frequent interaction between nodes helps central positions gather richer information and more resources [69], which helps in constantly expanding a technological niche. In addition, second, because close contact between nodes helps to form trust and norms across the network [70], authoritative superiority is more prominent. However, once the centrality of a position exceeds a certain critical point, tie strength will aggravate the negative impacts of both information and authority superiority. These negative effects can be attributed to several causes. The resulting increase in information puts higher requirements on the absorptive capacity of the innovation entity [71], which means the costs and difficulties associated with information redundancy will also increase. Furthermore, the risks associated with resource integration and efficient innovation will also increase. In addition, higher authority tends to force the central position to solidify existing norms, while reducing the motivation for innovation. Suppressing innovative thinking ultimately leads to further reductions in the quality of the knowledge and resources acquired.
Similarly, if the tie strength is high, the positive effects of integration and control advantage will become more obvious as an entity develops from a low to a medium brokerage position. The bridge function these entities play consequently strengthens, making it easier to access and learn knowledge and non-redundant information. The result is a better integration of resources [72], and the development of technological niches is therefore accelerated. Brokerage positions become more important to the network because the need for bridging nodes to connect detached entities becomes more urgent. Hence, the network rights of brokerage positions naturally grow. This ability to control network prompts intermediaries to achieve technological innovation faster. However, as with central positions, once the level of the brokerage position exceeds a certain critical point, the tie strength also increases the unfairness of their integration and control advantages to other entities. This often results in a confidence crisis for the brokerage positions and intensifies their difficulties with resource integration and improving innovation capabilities.
In summary, the following assumptions are made:
H3a.
The tie strength moderates the inverted U-shape relationship between the central network position and the ecostate of the technological niche. When the tie strength is great, the upward and downward trends of the inverted U-shaped curve will be steeper.
H3b.
The tie strength moderates the inverted U-shaped relationship between the central network position and the ecorole of the technological niche. When the tie strength is great, the upward and downward trends of the inverted U-shaped curve will be steeper.
H4a.
The tie strength moderates the inverted U-shaped relationship between the brokerage network position and the ecostate of the technological niche. When the tie strength is great, the upward and downward trends of the inverted U-shaped curve will be steeper.
H4b.
The tie strength moderates the inverted U-shaped relationship between the brokerage network position and the ecorole of the technological niche. When the tie strength is great, the upward and downward trends of the inverted U-shaped curve will be steeper.
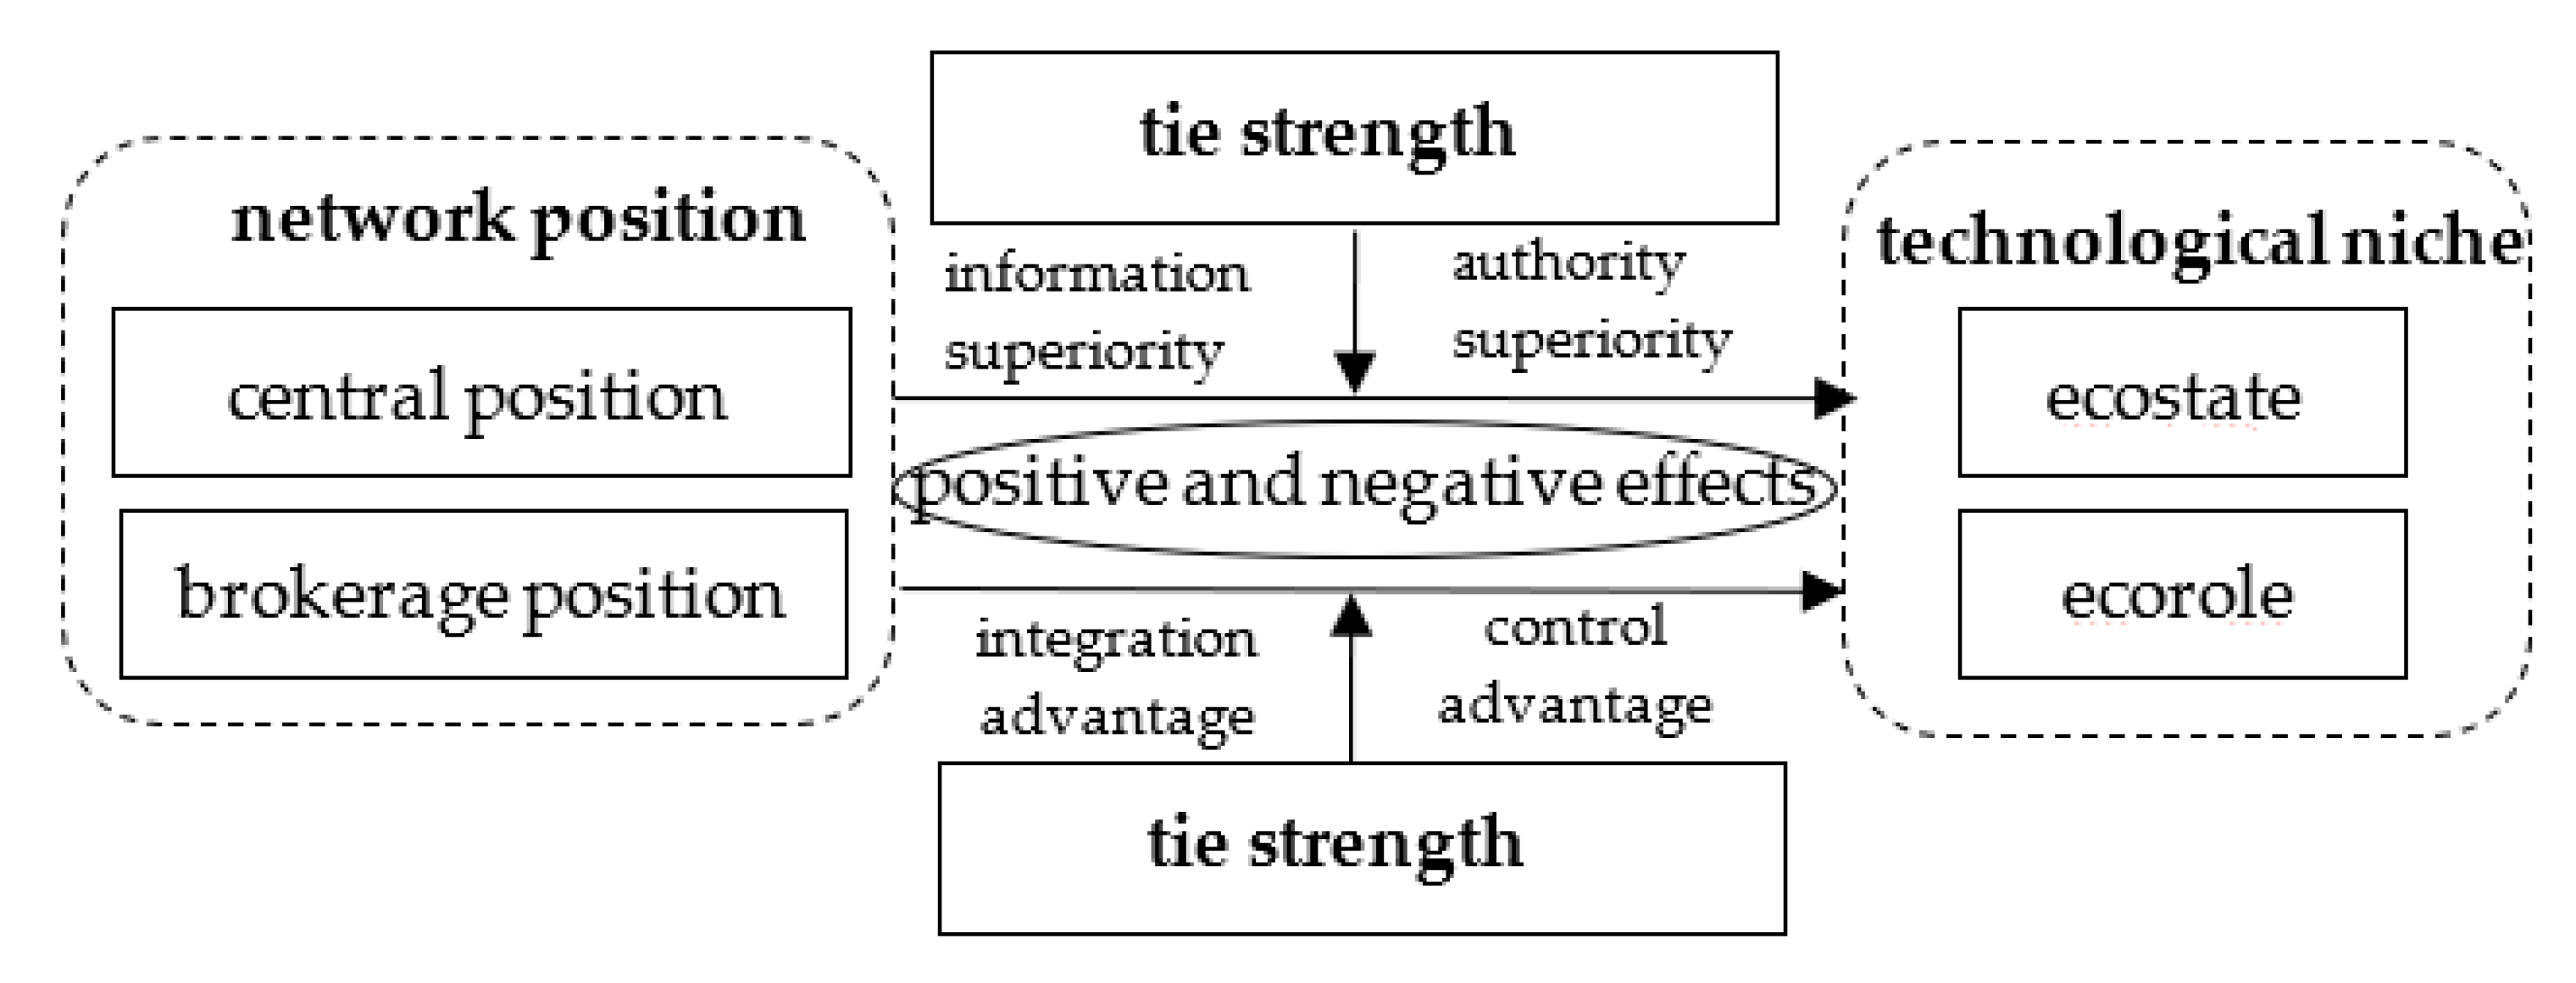
A conceptual model of network positions, relationship strength, and technological niche was constructed based on the above theoretical analysis and proposed hypotheses, as shown in Figure 1.
4. Methods
4.1. Data Collection and Processing
Patents are important indicators for measuring the level of technological innovation in new energy vehicle industries, and because of their availability and objectivity, they have been widely adopted as data by scholars. Hence, patent data has been used in this study to build a new energy vehicle innovation network in China, including the design of research variables.
To ensure reliability and completeness, the data was collected using a full-text database of Chinese patents, which provides the latest patent-related documents, along with scientific and technological achievements and standards. Such information fully explains the background of the patent, the latest developments, and the development trends in related fields. Appearance design and technological inventions are very important to the automobile industry, so we not only collected invention patents, but also appearance patents to construct a more complete innovation network. Therefore, all three types of patent data were selected: invention patents, utility model patents, and design patents. Using a combined keyword search, our search formula was ‘electric car or new energy car or hybrid car or fuel cell car’. The data range was 2009–2017. Because this paper deals with innovation networks at the organizational level, it is necessary to distinguish the nature of the applicant, and we only retain joint application information between organizations and clean joint application information among individuals, as well as between individuals and organizations. After basic data cleaning, which included removing the applicant’s personal data, 3145 documents were collected, involving a total of 841 innovation entities.
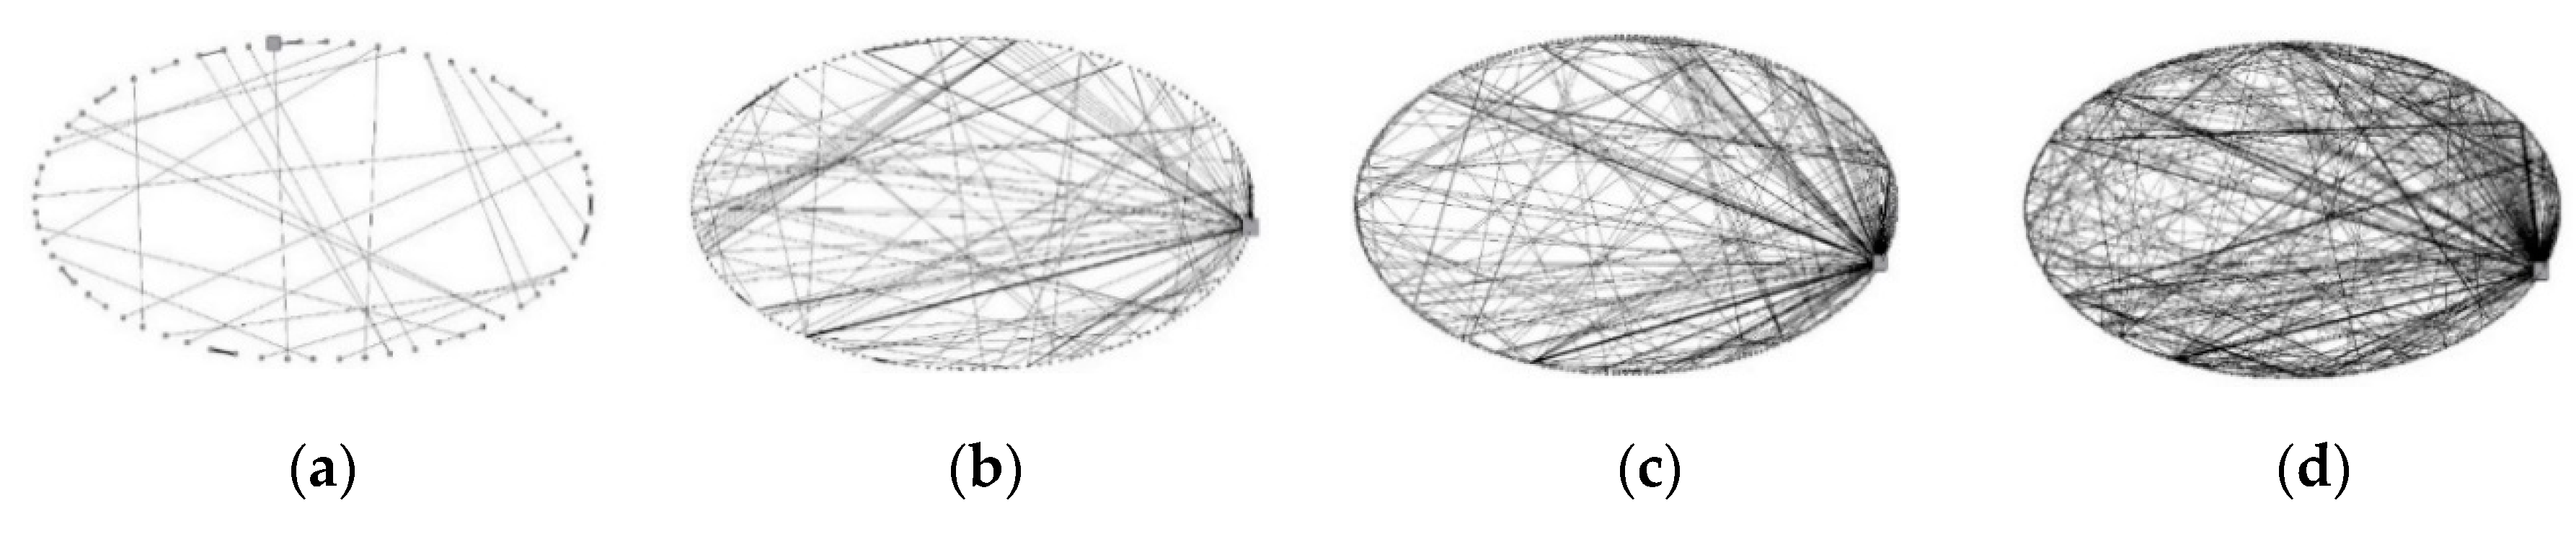
Patents are the result of continued cooperation between innovation entities. In addition, there is often a time lag between when a patent is granted and its innovation results. Therefore, the patents jointly filed in a single year cannot truly represent an innovation network. To solve this problem, Deeds and Hill proposed that innovative inter-subject cooperation lasts for an average of 3.47 years [73]. Drawing on these findings, and based on social network analysis, Ucinet 6.186 software was used to build an innovation network with a window of three years per roll. That is, each annual innovation network comprises joint patents for the current year, the previous year, and the year after. Figure 2 illustrates China’s new energy vehicle innovation network in 2010, 2012, 2014, and 2016. We can see development trends in networks’ characteristics: the scale of the network continues to expand, the number of innovation entities continues to increase, the network connections are continuously intensive, and cooperation between innovation entities increases dramatically.
At the same time, the data show that the network location of the innovation entities also changes constantly. The network is a multi-core organization, and the network structure evolves from a loose and simple type to a compact and complex type. On the one hand, the centrality of the new energy vehicle innovation network decreases each year. This indicates that with the increasing number of innovation entities in the network, the influence of individual entity will be weakened, and thus the degree of heterogeneity of resource allocation in the network is reduced, and the flow and sharing of resources is facilitated. On the other hand, the bridge function played by these entities gradually increases in the new energy vehicle industry, and this may lead to a small world effect, which can realize the transmission and re-creation of the knowledge and enhance the effect of technology diffusion from the new entities to the existing network entities. The innovation network in the new energy vehicle industry can gradually form a lot of groups, such as the group which is dominated by State Grid, the group led by Tsinghua University, and the group which is mainly composed of Zhejiang Geely Holding Group Co., Ltd., and its subsidiary. The emergence of these “small worlds” is beneficial to dispersing the leading role of individual entities, promoting technology diffusion and complementary advantages among different entities. Moreover, the diversity and richness of groups will avoid the emergence of a polarization effect in the process of gathering innovative resources in the new energy vehicle industry. We also find a diversity of cooperation types among the entities, including knowledge chain, industry chain, and space chain, and these types can be used simultaneously.
4.2. Measurement
4.2.1. Dependent Variable: Technological Niche’s Ecostate and Ecorole
A technological niche’s ecostate (TNS) is measured by the number of approved patents in the node that year. To reflect the evolution of the technological niche’s ecorole, we set the year when the node i was first patented as the base period j. The technological niche ecorole (TNR) was measured by the ratio of the number of authorized patents and base-period patents in a given year to the number of patents in the base period. The formula is as follows, where Nik and Nij represent the number of patents for the node in the current year and the base period, respectively.
TNRi = (Nik − Nij)/Nij * 100%
4.2.2. Independent Variable
Central position
Centrality is a measure of the node’s rights within the network. It quantifies the centrality of the nodes in the network. The degree of centrality is the most commonly used and most intuitive indicator, and is relatively simple. Hence, the degree of centrality measurement was chosen for this analysis, that is, the number of other nodes directly connected to a given node. To compare the level of centrality for nodes over different time periods, we rely on the relative degree centrality (CRD), which is the ratio of the centrality of the node i to the maximum possible centrality of the network. The formula follows, where C(i) represents the degree of the node i and n refers to the scale of the network.
CRD(i) = C(i)/(n − 1)
The effective scale is used to measure the level of brokerage position. The effective scale is the size of a single node in the network minus the overall network redundancy. This reflects the effective degree of a node as a bridge in the network. The formula follows, where SH(i) represents the brokerage position index of the node i, j represents the node that node i is connected to, and q represents the nodes other than nodes i and j in the overall network. Let Piq represent the proportion of a node i that has an invested relationship in node q. Let Mjq represent the marginal strength of the relationship between node j and q (which is equal to the value of the relationship between j and q to be divided by the maximum value between j and the relationships between other points). PiqMjq represents the redundancy between node i and node j.
4.2.3. Moderating Variable
Tie strength
Tie strength (TS) describes the closeness of cooperation between two nodes and is measured by the ratio of the number of connections to the number of degrees, that is, the average number of times the node cooperates with other nodes. The number of connections is expressed by the number of patents for joint inventions. The formula follows, where TS(i) is the tie strength between node i and the other nodes, and T(i) represents the number of times the node is connected to other nodes.
TS(i) = T(i)/C(i)
4.2.4. Control Variable
The level of technological innovation is influenced by many factors. In addition to the cooperation network, the innovation input of the entity is crucial. On the basis of strategic niche management, the technology resource category (TRC) is the control variable. Using Lerner’s measurement method, the first four categories of patent classifications were used to characterize the types of technological resources for innovation [74].
5. Results
Since technological niche’s ecorole is measured by patent growth rates, only the entities that have jointly applied for patents can be included in the scope of the observations for at least two years from 2009 to 2017. Therefore, hypothesis testing on the technological niche’s ecostate and ecorole were conducted: the research into the technological niche’s ecostate involved 276 subjects and 921 observations; and the analysis of technological niche’s ecorole involved a total of 137 subjects with 601 observations. Taking the evolution of the innovation network into account, along with the entering and withdrawing nodes, the resulting data formed an unbalanced panel. Eviews 6.0 software was used to perform a regression analysis on the data. Firstly, descriptive statistics and correlation analysis of variables were performed to determine whether there was a correlation between the variables, and this was the foundation of the regression analysis. Secondly, the regression models were chosen. An F-test, BP test, and a Hausman test were performed with appropriate regression models. The F-test compared a fixed-effects model with a mixed-effects model. The BP test compared a random-effects model with a mixed-effects model. In addition, the Hausman test was used to compare a fixed-effects model with a random-effects model. Consequently, technological niche’s ecostate was analyzed using a mixed-effects model, and technological niche’s ecorole was analyzed using a fixed-effects model. Thirdly, we used the least squares method to deal with the models, and tested the main effect and moderating effect progressively. Moreover, to avoid multicollinearity in the model, the squared term of the variable was centered, and the inflation factor (VIF) was used to judge whether harmful multicollinearity existed between the variables.
5.1. Network Position, Tie Strength, and Technological Niche’s Ecostate
Table 1 shows the descriptive statistics and correlation analysis of the variables, which indicates a significant correlation. In the regression analysis of the network positions and the technological niche’s ecostate, the nonlinear main effects of the central position, the brokerage position, and the moderating effects of the tie strength were separately verified. The regression results are shown in Table 2.
As shown in Table 2, Models 1–6 rejected the F-test and passed the Hausman test. Therefore, we used a mixed-effects model for the empirical testing of the technological niche’s ecostate in the regression analysis. The maximum VIF of each model was less than 10, indicating no multicollinearity. After adjustment, R2 showed that the data fit well with the model. Therefore, the model regression results are valid.
Model 1 was used to examine the nonlinear influence of the central position on the technological niche’s ecostate. The quadratic coefficient was negative, passing the significance test to prove an inverse U-shaped relationship between the two, which supports Hypothesis 1a. Models 2 and 3 were used to test the effect of the tie strength on changes in the relationship between the central position and the ecostate of the technological niche. The coefficient passed the significance test, proving its regulatory role, which supports Hypothesis 3a. Model 4 was used to test the impact of the brokerage position on the technological niche’s ecostate. The quadratic coefficient was negative, passing the significance test to prove an inverted U-shaped relationship between the two, which supports Hypothesis 2a. Models 5 and 6 were used to examine the moderating effect of tie strength on the relationships between the brokerage position and the technological niche’s ecostate. These coefficients did not pass the significance test, and therefore do not support the moderating role described in Hypothesis 4a.
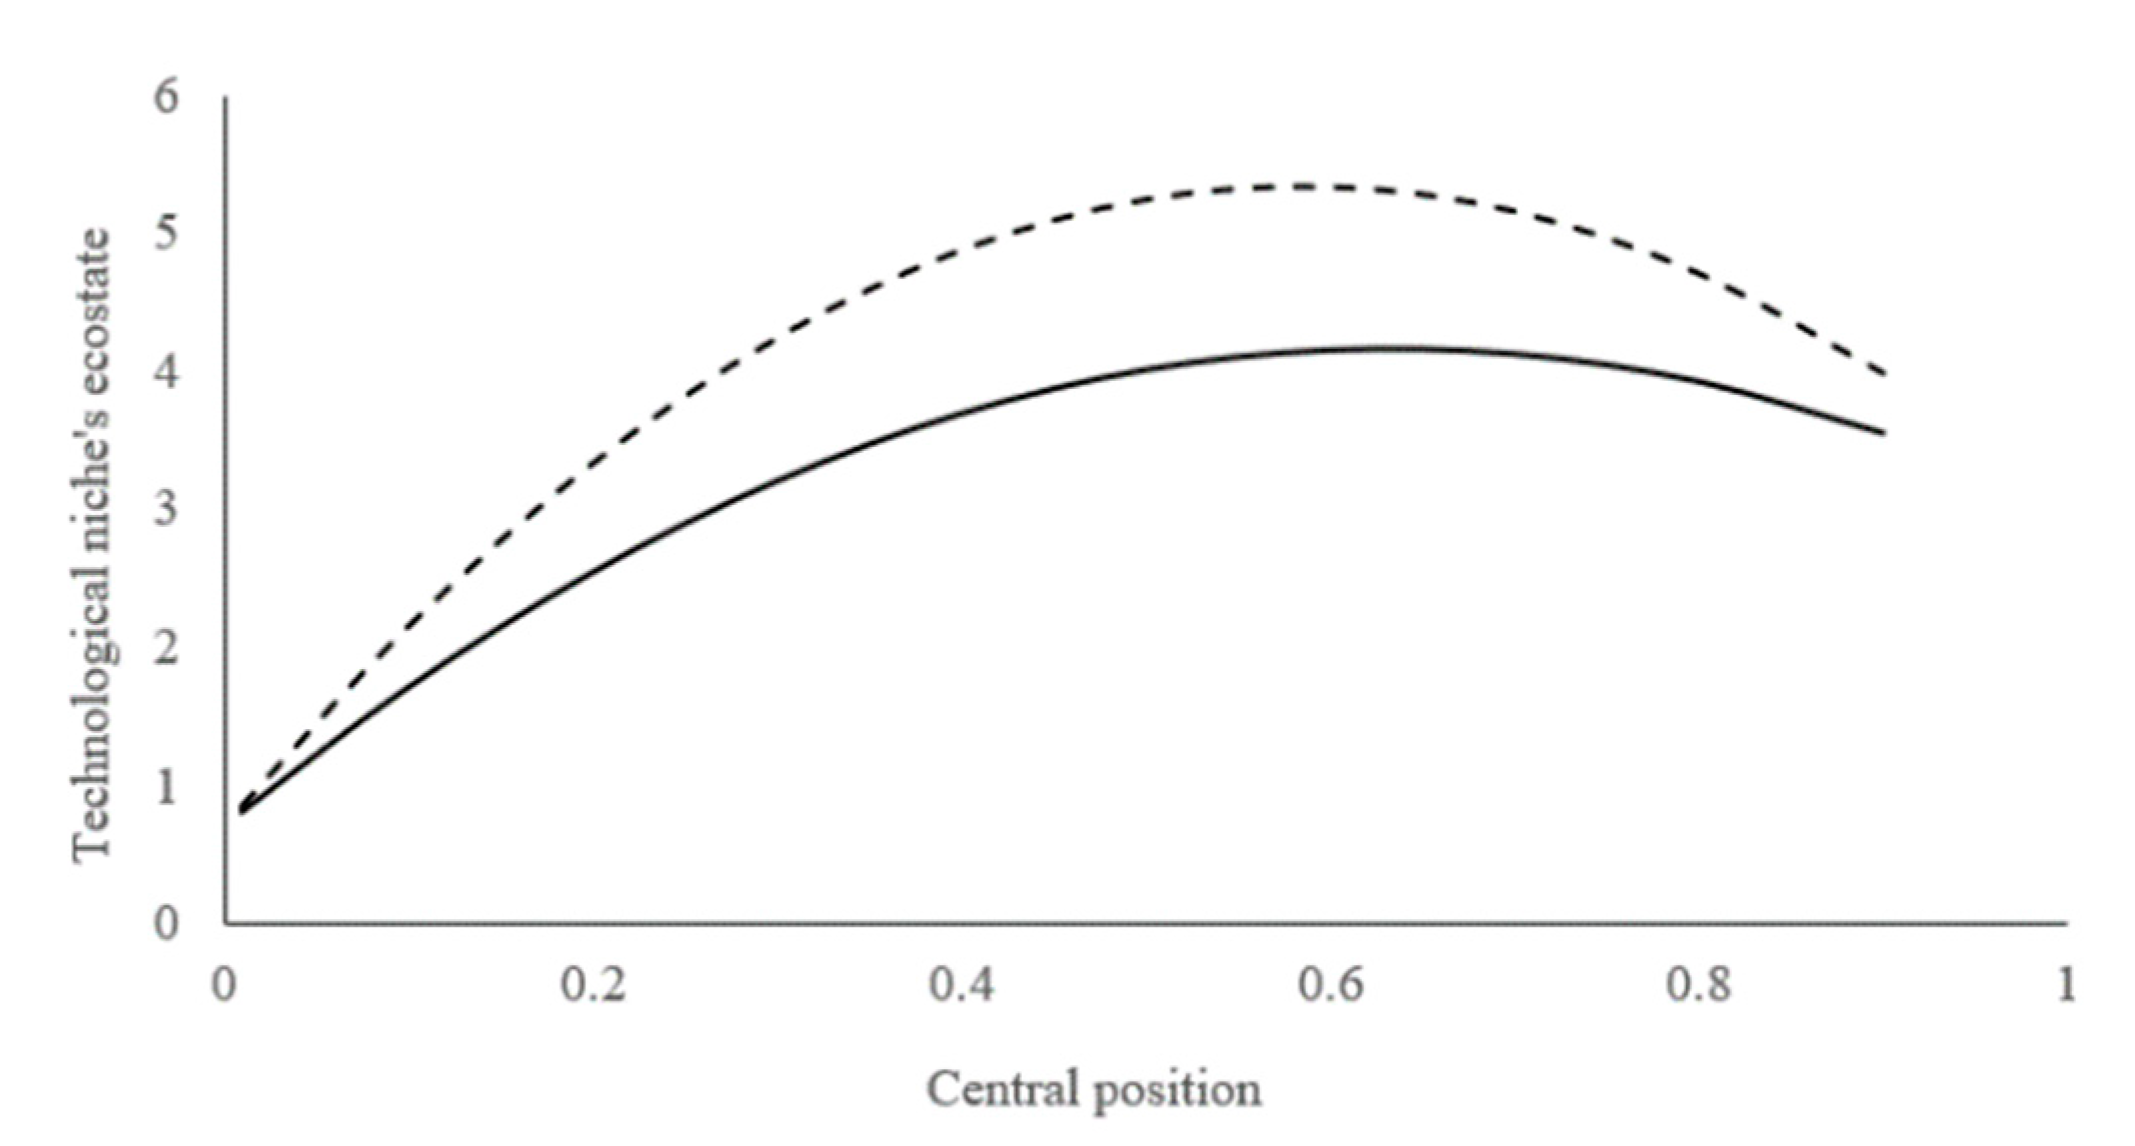
In addition, a further hierarchical regression analysis was conducted based on Zheng and Yang’s method for verifying high and low levels [75]. The results show that the interaction terms are significant (r = −0.031, p < 0.01) and low in the case of high tie strength. In the case of tie strength, the interaction terms are significant (r = −0.118, p < 0.01), which further supports Hypothesis 3a. The influence of the central position on the ecostate of the technological niche at different tie strength levels is shown in Figure 3.
5.2. Network Position, Tie Strength, and Technological Niche’s Ecorole
Table 3 shows the descriptive statistics and correlation analysis of the variables for the analysis of network position and technological niche’s ecorole. Table 4 lists the regression results to verify the non-linear main effects of brokerage locations and the tie strength moderating effects.
As shown in Table 4, Models 1–6 passed the F-test and Hausman’s test, indicating that the fixed-effects model is superior to both the mixed-effects model and the random-effects model. Therefore, we used the fixed-effects model to analyze the technological niche’s ecorole. The maximum VIF of each model was less than 10, indicating no multicollinearity. After adjustment, R2 also proved the degree of fit of the model. Therefore, the model regression results are valid.
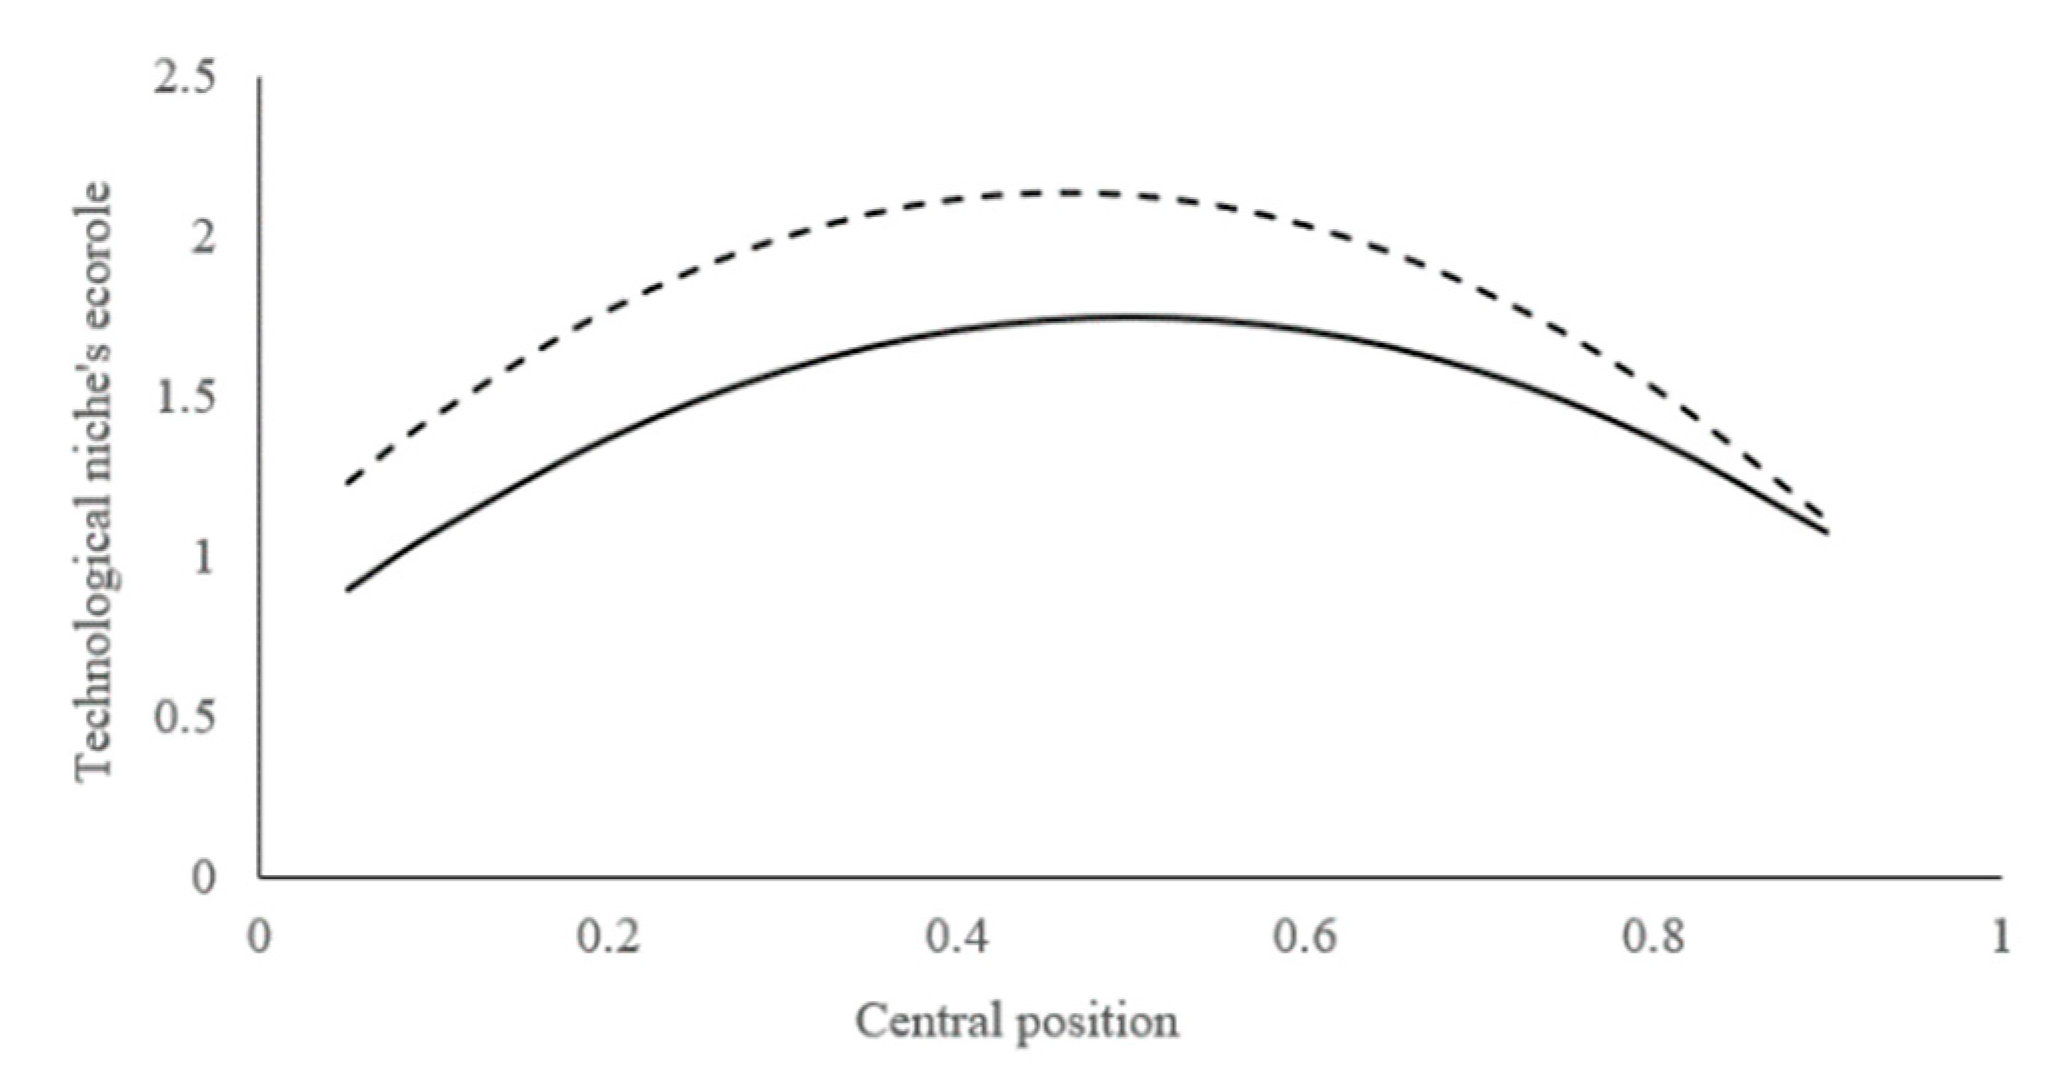
In the empirical analysis of the central position, the quadratic coefficient of Model 1 was negative and passed the significance test when examining the nonlinear influence of the central position on the technological niche’s ecorole. Therefore, Hypothesis 1b is verified (as shown in Figure 4). Models 2 and 3 were used to test the moderating effect of the tie strength. The coefficients passed the significance test, suggesting that Hypothesis 3b is supported. In the empirical analysis of the brokerage position, the coefficients of Models 4, 5, and 6 did not pass the significance test of p < 0.01. Assuming that Hypothesis 2b was only partially supported, the moderating effect of tie strength was not verified; therefore, Hypothesis 4b is not supported.
6. Conclusion, Discussion and Recommendation
6.1. Conclusion and Discussion
This paper attempts to explore the role of innovation networks in new energy vehicle industries from the perspective of market orientation, the integration of the overall network, and an entity’s microscopic features, including the design of relative variables. Our empirical analysis, taking China’s new energy vehicle industry as an example, reveals the relationship between network position, tie strength, and technological niche through tests of several proposed hypotheses; specificaly, that the relationship between network position and technological niche is an inverted U-shape, and that tie strength may play a role in moderating inverted U-shaped relationships.
An inverted U-shaped relationship exists between the central position and the technological niche’s ecostate and ecorole. The positive and negative influences of the information superiority and authority superiority further illustrate the influence of the central position on technological innovation. An inverted U-shaped relationship also exists between the brokerage position and the technological niche’s ecostate. The integration advantage and control advantage have both positive and negative effects on technological innovation. However, the hypothesis that an inverse U-shaped relationship exists between the brokerage position and the technological niche’s ecorole did not pass the significance test. The tie strength of the network alters the inverted U-shaped relationship between the central position and the technological niche. This illustrates the boundary at which the advantage of holding a central position plays a role. However, changes in the brokerage position did not pass verification, which further shows that the relationship between the brokerage position and technological innovation needs further discussion. This study opens up new ideas for study into the role of innovation networks and provides useful references for various entities to participate in an innovation network.
According to the conclusion, we find two important characteristics of the new energy vehicle innovation network. First of all, the innovation entities in the central position and the brokerage position in the new energy vehicle innovation network is not corresponding. The central position is dominated by enterprises, such as the State Grid, and Zhejiang Geely Holding Group Co., Ltd., while high levels of brokerage position are mostly found in universities, such as Tsinghua University and Beijing Institute of Technology. The non-profit nature of these entities largely nullifies the phenomenon of opportunism and is less likely to result in distrust by other entities. Therefore, the negative impacts of holding a brokerage position in the development of technological innovation were not obvious. Meanwhile, loose coupling is an important feature of the new energy vehicle innovation network. The results show that the moderating effect of the tie strength of the network is not consistent between two relationships: the central position and the technological niche, and the intermediate position and the technological niche. This indicates that the new energy vehicle innovation network exhibits loose coupling characteristics. On the one hand, though the function of the network is scattered among the main entities, it does not lose its core function; on the other hand, innovation entities do not lose their characteristics, despite their fusion within the network. Therefore, when participating in the innovative network, each entity should pay attention to adjusting the relationship with other entities in time to give full play to the network effect.
6.2. Recommendations
The entities in the innovation network of the new energy vehicle industry are rich and diverse. However, how can different entities give full play to the advantages within the network, promote the sharing and agglomeration of innovative resources, and highlight the mutually beneficial effects for technological integration and optimization? How should entities choose an appropriate way to embed the networks? Solving these problems is a key point that the new energy vehicle industry needs to break through, in order to address technical difficulties and achieve a breakthrough in development. Based on the above conclusions, the following three suggestions are proposed for management. The first two points focus on innovation entities, and the last point focuses on overall network governance.
Firstly, due to the inverted U-shaped and non-linear relationship between network positions and technological innovation, new energy vehicle enterprises should pay attention to maintaining moderate network connections with other entities in the process of constructing and participating in innovation networks. Low or excessive levels of central and brokerage positions may not be conducive to technological innovation. Therefore, entities at lower network position levels should pay attention to accumulating experience with making and actively maintaining network relationships. In other words, they should strive for advantageous network positions. Meanwhile, entities at higher network location levels should try to avoid excessive embedding, which results in high information processing costs, inertia in thinking, and crises of confidence. Avoiding these negatives will give full play to the advantages of network position for innovation.
Secondly, the results show that tie strength has a moderating effect on the relationships between network position and technological innovation, indicating the importance of the tie strength of the overall network in the process of technological innovation. Managers should undertake appropriate networking according to the actual circumstances of their network relationships. Moreover, approaching any form of external innovation cannot be separated from continual improvement in the capabilities of one’s own network governance.
Thirdly, our analysis also shows that non-profit organizations, such as universities and industry associations, can overcome the adverse effects associated with network location, such as a crisis in confidence. These types of entities can continue to play an active role in overall network governance, and therefore can be useful conduits for promoting innovation, interaction, and innovation network construction. They can also support and guide the development of an innovation network.
7. Contributions and Limitations
By studying the curve relationship between the new energy vehicle innovation network location and the technological niche, the inconsistent conclusions caused by the linear perspective are partially clarified, and the threshold effect is clarified. The main contributions of this paper are reflected in two aspects.
First of all, this paper interprets the relationship between innovation network and technological innovation from the perspective of market orientation. This perspective not only reveals the internal reasons for the formation of innovation networks, but also fits the development characteristics of the new energy vehicle industry.
Moreover, considering the duality and contingency of the innovation network location comprehensively, we pay attention to the combination of dynamic evolution and the spatial structure of the innovation network. This breaks through the limitation of only using cross-section data to study network location in empirical research. This is beneficial for clarifying the characteristics of the new energy vehicle innovation network, and is also useful for improving the explanatory ability with respect to the influence of innovation network on technological innovation.
In addition, we introduce a moderating variable to determine the relationship between the innovation network location and technological innovation in different situations. By focusing on the interactions among different entities from the perspective of the whole network, we can give advice and direction to help focus organizations on how to build and manage their relationship networks. In addition, we can also provide an improvement directions for adjusting and managing the overall network structure.
The main limitations of this study are as follows. Our research on the role of innovation networks in this paper mainly focuses on structural variables. However, the manner in which an entity’s attributes (profitability attributes, equity attributes, etc.) can be incorporated into this analysis is unclear. Hence, we will consider the impact of the changeable position of different entities on technological innovation. In addition, this paper has not yet paid attention to the influence of innovation networks on the cultivation of new energy vehicle market and market innovation. How to promote the technological niche to the market niche, what the effect of market orientation is, and what role the different entities in the innovation network will play in the kind of change, are all questions that require further follow-up and improvement.
Author Contributions
Conceptualization, X.S. and G.-m.H.; Data curation, R.J.; Formal analysis, X.S.; Funding acquisition, G.-m.H.; Methodology, X.S.; Visualization, J.-p.W.; Writing—original draft, X.S.; Writing—review & editing, R.J. and J.-p.W.
Funding
This research was funded by the Major Project of Beijing Social Science Fund of China under Grant No. 18ZDA02 and the Innovation Method Project of Ministry of Science and Technology of the People’s Republic of China under Grant No. 2015IM030100.
Acknowledgments
The authors would like to thank Hui-ze Bu for collecting data and Gang Zheng for his scientific advices.
Conflicts of Interest
The authors declare no conflict of interest.
References
- Erkut, B. Perceiving Innovation: Who ‘Makes’ SAP Labs India and How? South Asian J. Bus. Manag. Cases 2016, 5, 116–125. [Google Scholar] [CrossRef]
- Frank, A.G.; Cortimiglia, M.N.; Ribeiro, J.L.D.; de Oliveira, L.S. The effect of innovation activities on innovation outputs in the Brazilian industry: Market-orientation vs. technology-acquisition strategies. Res. Policy 2016, 45, 577–592. [Google Scholar] [CrossRef]
- Li, C.; Liu, Q.; Zhu, X.; Deng, S. Market orientation and technological innovation: The moderating role of entrepreneurial support policies. Int. Entrep. Manag. J. 2015, 11, 645–671. [Google Scholar]
- Cheng, L.W.; Chung, H.F.L. The moderating role of managerial ties in market orientation and innovation: An Asian perspective. J. Bus. Res. 2013, 66, 2431–2437. [Google Scholar]
- Sun, Y.; Cao, C. The evolving relations between government agencies of innovation policymaking in emerging economies: A policy network approach and its application to the Chinese case. Res. Policy 2018, 47, 592–605. [Google Scholar] [CrossRef]
- Tang, B.J.; Wu, X.F.; Xian, Z. Modeling the CO2 emissions and energy saved from new energy vehicles based on the logistic-curve. Energy Policy 2013, 57, 30–35. [Google Scholar] [CrossRef]
- Hilkevics, S.; Hilkevics, A. The comparative analysis of technology transfer models. Entrep. Sustain. Issues 2017, 4, 540–558. [Google Scholar] [CrossRef] [Green Version]
- Guan, J.; Liu, N. Exploitative and exploratory innovations in knowledge network and collaboration network: A patent analysis in the technological field of nano-energy. Res. Policy 2016, 45, 97–112. [Google Scholar] [CrossRef]
- Rantala, T.; Ukko, J. Performance measurement in university–industry innovation networks: Implementation practices and challenges of industrial organisations. J. Educ. Work 2018, 31, 1–15. [Google Scholar] [CrossRef]
- Žižka, M.; Hovorková Valentová, V.; Pelloneová, N.; Štichhauerová, E. The effect of clusters on the innovation performance of enterprises: Traditional vs new industries. Entrep. Sustain. Issues 2018, 5, 780–794. [Google Scholar] [CrossRef]
- Zhang, J. R&D for environmental innovation and supportive policy: The implications for new energy automobile industry in China. Energy Procedia 2011, 5, 1003–1007. [Google Scholar]
- Gong, H.; Wang, M.Q.; Wang, H. New energy vehicles in China: Policies, demonstration, and progress. Mitig. Adapt. Strateg. Glob. Chang. 2013, 18, 207–228. [Google Scholar] [CrossRef]
- Kimble, C.; Wang, H. China’s new energy vehicles: Value and innovation. J. Bus. Strategy 2013, 34, 13–20. [Google Scholar] [CrossRef]
- Hu, Z.; Yuan, J.H. China’s NEV market development and its capability of enabling premium NEV: Referencing from the NEV market performance of BMW and Mercedes in China. Transp. Res. Part A-Policy Pract. 2018, 118, 545–555. [Google Scholar] [CrossRef]
- Li, Y.W.; Zeng, B.H.; Wu, T. Effects of urban environmental policies on improving firm efficiency: Evidence from Chinese new energy vehicle firms. J. Clean. Prod. 2019, 4, 600–610. [Google Scholar] [CrossRef]
- Liu, Y.; Kokko, A. NEV technology in China. Chin. Manag. Stud. 2012, 6, 78–91. [Google Scholar] [CrossRef]
- Inganas, M.; Harder, M.; Marxt, C. Measuring the science-to-market gap: The case of new energy technologies. Int. J. Innov. Technol. Manag. 2007, 4, 457–478. [Google Scholar] [CrossRef]
- Liu, J.H.; Pu, J.M.; Jiang, Z.H. Promoting strategy of new energy vehicles collaborative innovation: The case study of Yutong. Procedia Eng. 2017, 174, 1009–1015. [Google Scholar]
- Sun, H.; Geng, Y.; Hu, L.; Shi, L.; Xu, T. Measuring China’s new energy vehicle patents: A social network analysis approach. Energy 2018, 153, 685–693. [Google Scholar] [CrossRef]
- Liu, L.F.; Jia, Y.; Wu, Z.Q. Research on developing route of the new energy vehicle technology in China. Adv. Mater. Res. 2012, 512–515, 2607–2614. [Google Scholar] [CrossRef]
- Chen, W.; Zhou, W.; Lang, Y.F. Research on clustering structure, betweenness and anti-risk capacity of innovation network of cluster—A case on industrial cluster of new energy vehicles in the Northeast China. Manag. Rev. 2015, 27, 204–217. [Google Scholar]
- Lopolito, A.; Morone, P.; Sisto, R. Innovation niches and socio-technological transition: A case study of bio-refinery production. Futures 2011, 43, 27–38. [Google Scholar] [CrossRef]
- Lin, B.; Tan, R. Estimation of the environmental values of electric vehicles in Chinese cities. Energy Policy 2017, 104, 221–229. [Google Scholar] [CrossRef]
- Monni, S.; Palumbo, F.; Tvaronavičienė, M. Cluster performance: An attempt to evaluate the Lithuanian case. Entrep. Sustain. Issues 2017, 5, 43–57. [Google Scholar] [CrossRef]
- Razminienė, K.; Tvaronavičienė, M. Detecting the linkages between clusters and circular economy. Terra Econ. 2018, 16, 50–65. [Google Scholar]
- Obstfeld, D. Social networks, the Tertius Iungens orientation, and involvement in innovation. Adm. Sci. Q. 2005, 50, 100–130. [Google Scholar] [CrossRef]
- Burt, R.S. Structural holes and good ideas. Am. J. Sociol. 2004, 110, 349–399. [Google Scholar] [CrossRef]
- Martin, K.; Daniel, J.B. Organizational social network research: Core ideas and key debates. Acad. Manag. Ann. 2010, 74, 317–357. [Google Scholar]
- Soda, G.; Usai, A.; Zaheer, A. Network Memory: The influence of past and current networks on performance. Acad. Manag. J. 2004, 47, 893–906. [Google Scholar]
- Degbey, W.; Pelto, E. Cross-border M&A as a trigger for network change in the Russian bakery industry. J. Bus. Ind. Mark. 2013, 28, 178–189. [Google Scholar]
- Herrigel, G.; Wittke, V.; Voskamp, U. The process of Chinese manufacturing upgrading: Transitioning from unilateral to recursive mutual learning relations. Glob. Strategy J. 2013, 3, 109–125. [Google Scholar] [CrossRef]
- William, S.L.; Amitabh, S. Efficient structures for innovative social networks. Manag. Sci. 2010, 56, 1127–1145. [Google Scholar]
- Rydehell, H.; Isaksson, A.; Löfsten, H. Business networks and localization effects for new Swedish technology-based firms’ innovation performance. J. Technol. Transf. 2018, 10, 1–30. [Google Scholar] [CrossRef]
- Harrisson, D.; Laberge, M. Innovation, identities and resistance: The social construction of an innovation network. J. Manag. Stud. 2002, 39, 497–521. [Google Scholar] [CrossRef]
- Bercovitz, J.; Feldman, M. The mechanisms of collaboration in inventive teams: Composition, social networks, and geography. Res. Policy 2011, 40, 81–93. [Google Scholar] [CrossRef]
- Zaheer, A.; Bell, G.G. Benefiting from network position: Firm capabilities, structural holes, and performance. Strateg. Manag. J. 2005, 26, 809–825. [Google Scholar] [CrossRef]
- Minbaeva, D.B. Knowledge Transfer in multinational corporations. Manag. Int. Rev. 2007, 47, 567–593. [Google Scholar] [CrossRef]
- Yang, Y.; Dang, X.H.; Cheng, L. Research on splitting and alienation of split fault in technological innovation network. In Proceedings of the 1st International Conference on Information Hiding and Image Processing IHIP 2018, Manchester, UK, 22–24 September 2018; Association for Computing Machinery: New York, NY, USA, 2018; pp. 88–93. [Google Scholar]
- Raghu, G.; Philipp, T.; Andrew, H. Van de Ven. Perspectives on innovation processes. Acad. Manag. Ann. 2013, 7, 775–819. [Google Scholar]
- Arranz, N.; Arroyabe, J.C.F.D. Can innovation network projects result in efficient performance? Technol. Forecast. Soc. Chang. 2012, 79, 485–497. [Google Scholar] [CrossRef]
- Gloor, P.A.; Paasivaara, M.; Schoder, D.; Willems, D. Finding collaborative innovation networks through correlating performance with social network structure. Int. J. Prod. Res. 2008, 46, 1357–1371. [Google Scholar] [CrossRef]
- Herstad, S.J.; Aslesen, H.W.; Ebersberger, B. On industrial knowledge bases, commercial opportunities and global innovation network linkages. Res. Policy 2014, 43, 495–504. [Google Scholar] [CrossRef]
- Buchmann, T.; Pyka, A. The evolution of innovation networks: The case of a German automotive network. Econ. Innov. New Technol. 2015, 24, 114–139. [Google Scholar] [CrossRef]
- Kohli, A.K.; Jaworski, B.J. Market orientation: The construct, research propositions, and managerial implications. J. Mark. 1990, 54, 1–18. [Google Scholar] [CrossRef]
- Pullen, A.; Weerd-Nederhof, P.C.D.; Groen, A.J.; Fisscher, O.A.M. SME network characteristics vs. product innovativeness: How to achieve high innovation performance. Creat. Innov. Manag. 2012, 21, 130–146. [Google Scholar] [CrossRef]
- Christensen, C.M.; Bower, J.L. Customer power, strategic investment, and the failure of leading firms. Strateg. Manag. J. 1996, 17, 197–218. [Google Scholar] [CrossRef]
- Narver, J.C.; Slater, S.F. The effect of a market orientation on business profitability. J. Mark. 1990, 54, 20–35. [Google Scholar] [CrossRef]
- Jaworski, B.J.; Kohli, A.K. Market orientation: Review, refinement, and roadmap. J. Mark. -Focused Manag. 1996, 1, 119–135. [Google Scholar] [CrossRef]
- Jaworski, B.; Kohli, A.K.; Sahay, A. Market-driven versus driving markets. J. Acad. Mark. Sci. 2000, 28, 45–54. [Google Scholar] [CrossRef]
- Agnolucci, P.; Mcdowall, W. Technological change in niches: Auxiliary power units and the hydrogen economy. Technol. Forecast. Soc. Chang. 2007, 74, 1394–1410. [Google Scholar] [CrossRef]
- Stephen, P.B.; Pacey, C.F. The network paradigm in organizational research: A review and typology. J. Manag. 2003, 29, 991–1013. [Google Scholar]
- Otte, E.; Rousseau, R. Social network analysis: A powerful strategy, also for the information sciences. J. Inf. Sci. 2002, 28, 441–453. [Google Scholar] [CrossRef]
- Tsai, W. Knowledge transfer in intraorganizational networks: Effects of network position and absorptive capacity on business unit innovation and performance. Acad. Manag. J. 2001, 44, 996–1004. [Google Scholar]
- Everett, M.G.; Borgatti, S.P. The centrality of groups and classes. J. Math. Sociol. 1999, 23, 181–201. [Google Scholar] [CrossRef]
- Podolny, J.M. Networks as the pipes and prisms of the market. Am. J. Sociol. 2001, 107, 33–60. [Google Scholar]
- Dyer, J.H.; Nobeoka, K. Creating and managing a high-performance knowledge-sharing network: The Toyota case. Strateg. Manag. J. 2000, 21, 345–367. [Google Scholar] [CrossRef]
- Echols, A.; Tsai, W. Niche and performance: The moderating role of network embeddedness. Strateg. Manag. J. 2005, 26, 219–238. [Google Scholar] [CrossRef]
- Hargadon, A. Technology brokering and innovation: Linking strategy, practice, and people. Strategy Leadersh. 2005, 33, 1–32. [Google Scholar] [CrossRef]
- Coleman, J. Sociological Analysis of economic institutions: Social capital in the creation of human capital. Am. J. Sociol. 1988, 94, 95–120. [Google Scholar] [CrossRef]
- Cattani, G.; Ferriani, S. A core periphery perspective on individual creative performance: Social networks and cinematic achievements in the Hollywood film industry. Organ. Sci. 2008, 19, 824–844. [Google Scholar] [CrossRef]
- Gilsing, V.; Nooteboom, B. Density and strength of ties in innovation networks: An analysis of multimedia and biotechnology. Eur. Manag. Rev. 2005, 2, 179–197. [Google Scholar] [CrossRef]
- Linus, D.; Lars, F. The core and cosmopolitans: A relational view of innovation in user communities. Organ. Sci. 2012, 23, 988–1007. [Google Scholar]
- Salman, N.; Saives, A.L. Indirect networks: An intangible resource for biotechnology innovation. R D Manag. 2010, 35, 203–215. [Google Scholar] [CrossRef]
- Burt, R.S. Structural Holes: The Social Structure of Competition; Harvard University Press: London, UK, 1992. [Google Scholar]
- Fleming, L.; Mingo, S.; Chen, D. Collaborative brokerage, generative creativity, and creative success. Adm. Sci. Q. 2007, 52, 443–475. [Google Scholar] [CrossRef]
- Bizzi, L. The dark side of structural holes: A multilevel investigation. J. Manag. 2013, 39, 1554–1578. [Google Scholar] [CrossRef]
- Van, H.; Stijn, K.; Reinhilde, V. Researcher networks and productivity. In Proceedings of the Aalborg: Dime-druid Academy Winter Conference 2011, Aalborg, Denmark, 20–22 January 2011; p. 22. [Google Scholar]
- Mark, S.G. The strength of weak ties. Am. J. Sociol. 1973, 78, 1360–1380. [Google Scholar]
- Sandor, L.; Rossum, D.V.; Kraaijenbrink, J.; Groen, A. Strong ties as sources of new knowledge: How small firms innovate through bridging aapabilities. J. Small Bus. Manag. 2012, 50, 239–256. [Google Scholar]
- Susana, C.S.; Frank, B.; Carlos, M.P.S. Empirical test of the trust–performance link in an international alliances context. Int. Bus. Rev. 2012, 21, 293–306. [Google Scholar]
- Escribano, A.; Fosfuri, A.; Tribó, J.A. Managing external knowledge flows: The moderating role of absorptive capacity. Res. Policy 2009, 38, 96–105. [Google Scholar] [CrossRef] [Green Version]
- Schilling, M.A.; Phelps, C.C. Interfirm collaboration networks: The impact of large-scale network structure on firm innovation. Manag. Sci. 2007, 53, 1113–1126. [Google Scholar] [CrossRef]
- Deeds, D.L.; Hill, C.W.L. An examination of opportunistic action within research alliances: Evidence from the biotechnology industry. J. Bus. Ventur. 1999, 14, 141–163. [Google Scholar] [CrossRef]
- Lerner, J. The importance of patent scope: An empirical analysis. Vet. Rec. 1994, 25, 319–333. [Google Scholar] [CrossRef]
- Zheng, Y.; Yang, H. Does familiarity foster innovation? The impact of alliance partner repeatedness on breakthrough innovations. J. Manag. Stud. 2015, 52, 213–230. [Google Scholar] [CrossRef]
Figure 1.
A conceptual model of network position, tie strength, and technological niche.

Figure 2.
China’s new energy vehicle innovation network topology maps for (a) 2010, (b) 2012, (c) 2014, and (d) 2016.
Figure 2.
China’s new energy vehicle innovation network topology maps for (a) 2010, (b) 2012, (c) 2014, and (d) 2016.

Figure 3.
The moderating effect of tie strength. Note: The dashed line indicates the high tie strength; the solid line indicates the low tie strength.
Figure 3.
The moderating effect of tie strength. Note: The dashed line indicates the high tie strength; the solid line indicates the low tie strength.

Figure 4.
The moderating effect of tie strength. Note: The dashed line indicates the high tie strength; the solid line indicates the low tie strength.
Figure 4.
The moderating effect of tie strength. Note: The dashed line indicates the high tie strength; the solid line indicates the low tie strength.


Table 1.
Descriptive statistics and correlation coefficients for the analysis of technological niche’s ecostate.
Table 1.
Descriptive statistics and correlation coefficients for the analysis of technological niche’s ecostate.
| MEAN | Standard Deviation | TNS | TRC | CRD | SH | TS | |
|---|---|---|---|---|---|---|---|
| TNS | 2.641 | 7.597 | 1.000 | ||||
| TRC | 1.842 | 1.834 | 0.792 *** | 1.000 | |||
| CRD | 0.715 | 2.521 | 0.269 *** | 0.208 *** | 1.000 | ||
| SH | 1.489 | 4.850 | 0.400 *** | 0.293 *** | 0.307 *** | 1.000 | |
| TS | 1.105 | 1.842 | 0.322 *** | 0.124 *** | 0.112 *** | 0.074 *** | 1.000 |
Note: n = 276, observations 921, *** p < 0.01.
Table 2.
Hybrid effects model of network position, tie strength, and technological niche’s ecostate.
Table 2.
Hybrid effects model of network position, tie strength, and technological niche’s ecostate.
| Variable | Central Position | Brokerage Position | ||||
|---|---|---|---|---|---|---|
| Main Effect | Moderating Effect | Main Effect | Moderating Effect | |||
| Model 1 | Model 2 | Model 3 | Model 4 | Model 5 | Model 6 | |
| C | 0.496 *** | 0.389 *** | 0.321 *** | 0.260 *** | 0.216 *** | 0.174 *** |
| TRC | 0.146 *** | 0.197 *** | 0.086 *** | 0.168 *** | 0.155 *** | 0.131 *** |
| CRD | 0.078 | 0.081 | 0.077 | −0.074 | ||
| CRD2 | −0.192 *** | −0.115 ** | −0.139 ** | |||
| SH | 0.057 *** | 0.078 | 0.061 | |||
| SH2 | −0.090 *** | −0.102 | −0.192 | |||
| TS | 0.019 ** | 0.021 * | 0.049 | 0.116 | ||
| CRD* TS | 0.042 ** | |||||
| CRD2* TS | −0.036 *** | |||||
| SH * TS | 0.035 | |||||
| SH2 * TS | −0.043 | |||||
| F test | 0.680 | 0.650 | 0.670 | 0.250 | 0.220 | 0.270 |
| Hausmantest | 23.600 *** | 32.160 *** | 19.240 *** | 4.550 ** | 36.900 *** | 12.950 ** |
| Adj-R2 | 0.686 | 0.695 | 0.721 | 0.636 | 0.703 | 0.742 |
| VIFmaximum | 1.170 | 1.040 | 1.210 | 1.690 | 1.380 | 1.920 |
Note: n = 276, observations 921, significance is based on a robust standard deviation, * p < 0.1, ** p < 0.05, *** p < 0.01.
Table 3.
Descriptive statistics and correlation coefficients for the analysis of technological niche’s ecorole.
Table 3.
Descriptive statistics and correlation coefficients for the analysis of technological niche’s ecorole.
| Mean | Standard Deviation | TNR | TRC | CRD | SH | TS | |
|---|---|---|---|---|---|---|---|
| TNR | 1.466 | 3.090 | 1.000 | ||||
| TRC | 2.757 | 2.868 | 0.698 *** | 1.000 | |||
| CRD | 0.597 | 1.874 | 0.258 *** | 0.445 *** | 1.000 | ||
| SH | 2.598 | 7.253 | 0.324 *** | 0.613 *** | 0.733 *** | 1.000 | |
| TS | 2.365 | 2.050 | 0.606 *** | 0.534 *** | 0.102 *** | 0.491 ** | 1.000 |
Note: n = 134, observations 645, ** p < 0.05, *** p < 0.01.
Table 4.
Fixed-effects model for network position, tie strength, and technological niche’s ecorole.
| Variable | Central Position | Brokerage Position | ||||
|---|---|---|---|---|---|---|
| Main Effect | Moderating Effect | Main Effect | Moderating Effect | |||
| Model 1 | Model 2 | Model 3 | Model 4 | Model 5 | Model 6 | |
| C | −2.946 *** | −0.511 *** | −0.626 *** | −0.916 *** | −1.104 *** | −1.496 *** |
| TRC | 0.821 *** | 0.702 *** | 0.659 *** | 0.566 *** | 0.508 *** | 0.528 *** |
| CRD | 0.073 * | 0.092 ** | 0.083 * | −0.074 | ||
| CRD2 | −0.140 *** | −0.175 ** | −0.157 * | |||
| SH | 0.017 * | 0.035 * | 0.041 * | |||
| SH2 | −0.024 * | −0. 082 * | −0.0792 * | |||
| TS | 0.137 * | 0.113 * | 0.049 * | 0.116 ** | ||
| CRD* TS | 0.042 ** | |||||
| CRD2* TS | −0.082 *** | |||||
| SH * TS | 0.072 | |||||
| SH2 * TS | −0.029 | |||||
| F test | 2.390 *** | 2.680 *** | 2.430 *** | 2.560 *** | 2.270 *** | 2.600 *** |
| Hausmantest | 15.610 *** | 19.380 *** | 14.270 *** | 28.480 *** | 32.580 *** | 15.620 *** |
| Adj-R2 | 0.549 | 0.608 | 0.578 | 0.419 | 0.559 | 0.500 |
| VIF maximum | 1.910 | 3.010 | 3.410 | 1.600 | 1.400 | 2.540 |
Note: n = 137, observations 601, significance is based on a robust standard deviation, * p < 0.1, ** p < 0.05, *** p < 0.01.
© 2019 by the authors. Licensee MDPI, Basel, Switzerland. This article is an open access article distributed under the terms and conditions of the Creative Commons Attribution (CC BY) license (http://creativecommons.org/licenses/by/4.0/).
Share and Cite
MDPI and ACS Style
SHI, X.; JING, R.; HOU, G.-m.; WANG, J.-p. Network Position Advantage and Technological Innovation of China’s New Energy Vehicle Based on the Perspective of Network Theory. Sustainability 2019, 11, 2098. https://doi.org/10.3390/su11072098
AMA Style
SHI X, JING R, HOU G-m, WANG J-p. Network Position Advantage and Technological Innovation of China’s New Energy Vehicle Based on the Perspective of Network Theory. Sustainability. 2019; 11(7):2098. https://doi.org/10.3390/su11072098
Chicago/Turabian StyleSHI, Xiu, Rui JING, Guang-ming HOU, and Jun-peng WANG. 2019. "Network Position Advantage and Technological Innovation of China’s New Energy Vehicle Based on the Perspective of Network Theory" Sustainability 11, no. 7: 2098. https://doi.org/10.3390/su11072098
Note that from the first issue of 2016, this journal uses article numbers instead of page numbers. See further details here.