Are Sustainable Banks Efficient and Productive? A Data Envelopment Analysis and the Malmquist Productivity Index Analysis


1
School of Economics and Management, University of Chinese Academy of Science, Beijing 100049, China
2
Stockholm Business School, Stockholm University, SE-10691 Stockholm, Sweden
*
Author to whom correspondence should be addressed.
Sustainability 2019, 11(8), 2398; https://doi.org/10.3390/su11082398
Submission received: 11 March 2019
/
Revised: 9 April 2019
/
Accepted: 10 April 2019
/
Published: 23 April 2019
(This article belongs to the Section Economic and Business Aspects of Sustainability)
Abstract
:Corporate sustainability is the integration of environmental protection, financial benefit, and social responsibility into management and business operations. There is insufficient evidence for its relationship with operating performance and productivity. Furthermore, it becomes doubtful when investors standardize corporate sustainable strategies. This study evaluates the performance and productivity of sustainable banks, exploring practical issues by providing supporting evidence. A two-stage performance evaluation is employed with the integration of data envelopment analysis (DEA) and Malmquist productivity index (MPI) to evaluate sustainable bank performance and productivity for 9 years (2010–2018) in comparison with non-sustainable banks. DEA is used to define dynamic benchmarking, and MPI builds on time-series analysis. The results of our study reveal that sustainable banks are more efficient and productive. The productivity of sustainable banks and non-sustainable banks was influenced by external and internal factors, respectively.
1. Introduction
The concept of sustainable development aims to meet present needs without disturbing the chances of future generations to fulfill their own needs. This concept is also accepted by business organizations, including the World Business Council for Sustainable Development (WBCSD). Traditionally, the basic principle for business was profit-oriented. Rapid advancement in technology and supply-chain networks have gradually extended business channels, which are transformed into a wider community known as stakeholders in modern society. The social behavior of managers relays to stakeholders’ social responsibility, while socially responsible stakeholders encourage managers to try to achieve long-term sustainability by neglecting short-term cost efficiency [1]. Similarly, consumer and investor behavior reflects a firm’s policies.
Previous studies have dealt with sustainability as a social aspect, where it is only related to the environment, without any reference to strategies [2]. The value-creation concept of an organization using corporate sustainability (CS) depends on the integration of their social, environmental, and economic aspects. Long-term perception is supporting greater responsibility [3]. In the literature, corporate sustainability has been defined in many ways. First, it is a framework for the integration of all aspects of sustainability [4,5]. Second, it emphasizes economic, environmental, and social values [6]. Third, the conventional perception expects that firms only be incorporated within such stock indexes if they are more environmentally or socially active than their competitors. Therefore, the inclusion of sustainability stock indexes may be treated as an appropriate indicator for CS performance. In practice, the integration of sustainability in business strategy is still a challenge [7,8].
Environmental and social responsibilities are highly dependent on stakeholder preferences to produce financial gains. The existing literature on firm performance and the relationship with social environmental responsibility is unconvincing [9]. Prior studies are divided into three groups based on the relationship between corporate sustainability and its financial benefit in relation to a firm’s environmental performance. The first group found a positive relationship [10,11,12,13]. The second group found a negative relationship [14,15,16]. This group considered the agency problem; according to the agency problem, a firm’s socio-environmental responsibility is expected to be a cost that may affect its profitability. The third group argued that there might not be a significant relationship [17,18,19,20]. Their findings show that firms do not consider socio-environmental performance, and have to reduce the prices of their products and services to increase their sales. The term CS is a multidimensional concept, and has increased with awareness. The question remains on how to measure performance is still undefined. However, for the performance evaluation of banks, data envelopment analysis (DEA) is considered to be an appropriate tool because it does not require any explicit relationships between multiple inputs and outputs [21,22,23,24,25]. The integrated performance of the bank is based on its sustainable strategies, encompassing economics in both environmental and social dimensions. A comprehensive study of sustainable banking approaches eight categorized types in three dimensions, namely technological, social, and organizational [26].
The literature provides little evidence to decide a firm’s sustainable strategies based on economics, be it with social or environmental dimensions responsible for the firm’s performance. This is what this study aims to address. For this purpose, we examine and then evaluate the operating efficiencies of sustainable banks (SBs) and non-sustainable banks (NSBs), and compare which perform better. We define dynamic benchmark banks, and establish their best class that is demonstrating the best managerial practices. This study helps policy-makers in decision-making and bank regulatory authorities to develop transparent strategies.
This study used DEA and Malmquist Productivity Index (MPI) to evaluate comparative operating efficiencies and productivity changes of SBs and NSBs over time. The sustainable and non-sustainable banks are considered to be decision-making units (DMUs). Operating efficiency breaks down into technical, scale, and mix efficiencies. The technical efficiency reflects the maximum output generated by banks taking a set of inputs. The scale efficiency shows the ability of a bank to increase its productivity by achieving a maximum size. The root causes of inefficiency can be analyzed by efficiencies and provide a projection to be efficient. The top-performing banks can be references for inefficiency. This shows that the DEA is a reliable tool for assessing the impact of bank policy initiatives on productivity, and measuring the changes of productivity over time. MPI evaluates productivity change of a specific DMU between two time periods of “catch-up” and “frontier-shift” terms. The catch-up term relates the degree that a DMU attains for improving its efficiency, while the frontier-shift term reflects the change in the efficient frontier surrounding the DMU between two time periods.
2. Literature Review
To attain sustainable economic development, a country must have an efficient banking system [27]. The banking industry essentially contributes to the economic development of any country by providing significant sources of financial intermediation [26]. Banks also organize financial resources and manage them to increase economic activities. Through efficiency evaluation, the internal structure of banks is explored, identifying the main causes of inefficiency [28]. The performance of banks has been an issue of major interest for various stakeholders, such as regulators, customers, investors, and the general public.
The banking sector started the integration of social and environmental aspects into their business in 1980s through internal environmental management [29]. This initiative helps to save the environmental resource, lower emission, and increase bank reputation [30] as well as benefit the society. In the same period, banks also integrated environmental issues into their services [31,32]. Environmental risks have a significant influence on financial risk; the extreme change in the enthronement can affect the banking business. According to [33] credit risk and investment portfolios have to be properly managed to minimize environmental risk. The financial industry has adopted the concept of socially responsible investments (SRIs) to manage investment risk [34]. The SRI helps banks to reduce financial risk. Nonetheless, the heavy regulations on the financial sector bear institutional pressure [35]. Most of the regulations on the financial sector focus mainly on financial risks to guarantee the stability of the financial industry. By ensuring minimum risk and utilizing mechanisms of controlling risk, the pressure on the financial sector is low, allowing it to provide sustainable services and products [35].
Prior studies proved that the environmental and sustainability are positive correlated with the size and the profitability [36,37] and that corporate sustainability financial sector has been increasing over time [30,38]. Consequently, the position relation between sustainability performance and financial performance in the banking sector helps policymakers to developed sustainable strategies for banks. Sustainable banks must develop ideology to transform industry for adoption of sustainable approaches. The sustainable banks create value that protects prosperity of society through positive investments, which provides huge economic benefit to banks [39]. With changing business environment, customers trends to develop a clear perception about a brand with sustainable features. It’s the corporate image of brand [40], banks are adopting this strategy, with their product and services also educate the consumers about environmental benefits to society [41].
Data envelopment analysis (DEA) has been extensively used for the efficiency evaluation of banks. The efficiency measurement indicates whether a bank produces a given quantity of outputs or maximizes the output quantity by using the given number of inputs or a certain quantity of inputs. A review of empirical studies affirms the application of DEA in all banks around the globe. Most of the efficiency measurement studies widely focus only on developed economies [42]. Researchers have conducted efficiency measurement studies on the top 10 economies, except India [43]. Different studies have different perspectives; some focus on economic blocks and analyze specific issues, including merger and acquisitions processes relevant to understanding banking performance [44,45]. The DEA is used by [46] to evaluate the environmental and sustainable performance of banks in central and eastern European countries, and the results show that the banks in these regions are not socially responsible. This study indicates that banks in different regions of Europe have different behaviors. A small number of studies provide cross-country evidence; most of them examine banks from large EU banking sectors [47,48].
Data envelopment analysis has been extensively used for the efficiency evaluation of banks. The efficiency measurement indicates whether a banks produce a given quantity of outputs or maximizes the output quantity by using the given number of inputs or a certain quantity of inputs. The review of empirical studies shows that the application of DEA in all banking around the globe. Most of the efficiency measurement studies widely focused only on developed economies [42]. Researcher widely conducted efficiency measurement studies on the top ten economies except India [43]. Different studies follow different perspective, some focused on economics blocks and analyzed specific issues, which includes merger and acquisitions processes relevant to understanding banking performance [44,45]. The DEA is used by [46] to evaluate the environmental and sustainable performance of the banks of central and eastern countries in Europe and the results shows the banks in both regions are not socially responsible. This study shows that banks in different region of Europe have different behavior. A small number of studies provides cross country evidence, most of them examine banks from large EU banking sector [47,48].
The overall technical efficiency of US banks is measured by [48] using DEA; the result shows that the overall technical efficiency of banks is approximately 97%. The majority of banks are experienced in decreasing returns to scale due to their large size. Large banks have better performance in profitability, whereas smaller banks tend to perform better in marketability [49]. The efficiency of belt and road country banks is evaluated by [50] using Economist Intelligent Units (EIUs) to identify efficient banks for each rating group. Meanwhile, the Malmquist productivity index is used to measure the productivity change in a period, expressed as a distance ratio for a specific DMU in a specific time at two points in time using reference technology [51,52]. This method is particularly attractive when multiple inputs and outputs are used, and prices are unknown or difficult to estimate. A study by [53] used DEA and Malmquist productivity indices and indicated that the growth of productivity in these banks is attributed to technological change rather than technical efficiency change. Although prior studies focused on the components of sustainability, corporate sustainability is a combination of the environmental, social, and economic components. Notably, the performance evaluation of sustainable banks is disregarded in the literature.
3. DEA Model Development and Testing
Before the application of DEA model, this section introduce the concepts and modeling framework of DEA and Malmquist productivity index.
3.1. DEA Model Frame Work
This section elaborates the frame work used in this study and justifies it with the introduction of conceptual foundation and mathematical explanations of the models.
3.1.1. DEA Concepts
The data envelopment analysis (DEA) was introduced by [54] through which the fractional linear measure of efficiency is transformed into a linear programing model. The ability to measure the efficiency of multiple inputs and outputs of DMUs without assigning prior weight to inputs and outputs attracts the researcher. DEA models are diversely developed by researchers with their empirical application is many sectors including education [55], banking [56,57], manufacturing [9], logistics [58], telecommunication [59], health care [60] and even sports [61,62]. The efficiency is the ratio of inputs and outputs, the limitation of ratio could not be used with multiple inputs and outputs. To overcome the limitation of ratios DEA was introduced to measure efficiency utilizing multiple inputs and outputs. The basic models which become more popular are the CCR model [54] and the BCC model [63]. DEA model considers returns to scale, such as, BCC considers variable returns to scale. The DEA models identify benchmarking entities and degree of improvement for inefficient DMUs to be efficient using input orientation and output orientation. The DEA model, which is utilized to minimize the level of inputs and maintain the current level of outputs is considered as input-oriented model, whereas, the model which aims maximize the level of outputs given the current level of inputs is considered as output-oriented model. One of the advantage of the DEA model is that it advises how the unit evaluated should mend its behavior to reach efficiency [64].
3.1.2. CCR Model
The CCR model is used to maximize multiple outputs given by a set of multiple inputs, where the highest possible score of a DMU is 1, the CCR Model can be mathematically represented as:
- = the vector of output r produced by unit j
- = the vector of input k produced by unit j
- = the weights given to output r by the base unit b
- = the weights given to input k by the base unit b
- a very small positive number
3.1.3. The BCC Model
The BCC model assumes variable returns to scale(VRS) and represent pure technical efficiency (PTE) without including the Scale Efficiency (SE). The BCC model can be formulated as:
The DEA model becomes with an increasing returns to scale when , it becomes decreasing returns to scale when , whereas DMU is Pareto-efficient in one condition, if and only if , where represents pure technical efficiency.
3.1.4. Scale Efficiency
The technical efficiency which is calculated using CCR model and represents as , is combination of pure technical efficiency (PTE) and scale efficiency (SE). That is, TE = PTE × SE, hence SE can be achieved by:
3.2. DEA Application
The DEA models presented in Section 3.1 are used to evaluate the performance and productivity of sustainable banks (SBs) and non-sustainable banks (NSBs) during the period of 9 years (2010–2018).
Data and Variables
In DEA models, the minimum number of DMUs can decrease the discriminatory power of DEA. According to the rule proposed in [63], the number of DMUs must be at least double the combined inputs and outputs. Sustainable banks chose on their comparable data availability and, in turn, were indexed based on the Dow Jones Sustainability Indices (DJSI) in 2018. Based on data obtained directly from the BankFocus web page, only 45 banks from 14 countries are indexed by DJSI in 2018. For stockholders banks performance is important, this study considers the dataset of SBs and NSBs for a period of nine years (2010–2018). By definition, SBs are banks that are indexed by 2018, whereas NSBs are banks from the same countries that have the same specialization. Our dataset consists of 248 banks, including 33 SBs. We use four inputs (i.e., assets, equity, employees, and expenses) and two outputs (i.e., revenue and profit). All the values are in thousand USD; only the employees are in thousand. The DEA model’s results are generated using the MDEAP2 application. The statistical summary of data for sustainable banks and non-sustainable banks is presented in Table 1.
4. Malmquist Model Development
The Malmquist product index (MPI) is introduced by [65,66,67]; it is based on the output distance function that provides the efficiency change of a DMU between two time periods. The non-parametric MPI that measures productivity with a linear programming model based on DEA is proposed by [68]. The MPI has the following advantages: First, it does not need maximization of profit of minimization of expenses. Second, it does not assume the input and output prices and their information [69].
The change into productivity between time period t and t + 1 id defined as follows:
where M is the input-oriented MPI, y represents the output vector that can be produced using the input vector x. The MPI can be calculated as the product of catch-up (technical efficiency change) and frontier shift (technical change) as shown below:
The MPI describes the total factor productivity DMUs and reflects positive or negative direction change to the frontier technology. In an input-oriented calculation, Index > 1 indicates progress in relative efficiency, while Index = 1 and Index < 1 indicate the position quo and regress inefficiency, respectively. The represented TPC can be decomposed into two mutually exclusive components: First is calculating a change in technical efficiency (catching-up effect). Second is calculating a change in technology (frontier shift). Thus, the TFPI is defined as the product of technical efficiency change index (TECI) and technical change index (TCI). The TECI is the ratio between two successive output distance functions and is related to the degree of efforts that the DMU attained for improving its efficiency. It measures the producer’s capacity to move closer to or further away from the frontier technology from t to t + 1. Meanwhile, the TCI reflects a change in the efficient frontiers surrounding the DMUs between the two time periods and measures the shift in the output set or the movement of the production frontier between the periods.
5. Results and Discussion
5.1. DEA Results
DEA CCR model is used to evaluate the efficiency of sustainable banks (SBs) and non-sustainable banks (NSBs). The efficient sustainable banks for the whole period of 2010 to 2018 are: Itau Unibanco Holdings Sa, Brazil, Itausa- Investimentos Itau S.A., Brazil and Banco De Chile, Chile. And the efficient non-sustainable banks for the whole period are: Koc Holding A.S., Turkey, LeasePlan Corporation NV, Netherland, Bank Mendes Gans NV, Netherlands and Allfunds Bank SA, Spain. Table 2 shows the statistical summary of DEA efficiency scores of 33 sustainable Banks and 247 non-sustainable Banks for 9 years period. This table explain the minimum and efficiency for each period with its mean and standard devision ().
The input-oriented and output-oriented CCR, BCC and Scale efficiency of sustainable and non-sustainable banks is used to assess the economies of scale on the performance. The study uses the results of 2018 due to its recentness and compatibility. The statistical summary of input oriented, output oriented CCR, BCC, Scale efficiency and returns to scale category (RTS) (i.e., increasing returns to scale (irs) and decreasing returns to scale (drs)) for SBs and NSBs for year 2018 is presented in Table 3. The table shows the minimum, maximum values of input-oriented CCR, BCC and Scale efficiency with mean and standard deviation for sustainable and non-sustainable banks.
The input-oriented CCR and output-oriented CCR efficient sustainable banks are: Commonwealth Bank Of Australia, Australia, Itau Unibanco Holdings Sa, Brazil, Itausa- Investimentos Itau S.A., Brazil, Royal Bank Of Canada, Banco De Chile Sa, Chile, Grupo Security, Chile, Abn Amro Group N.V., Netherlands and Dbs Group Holdings Ltd., Singapore. The input-oriented CCR and output-oriented CCR efficient non-sustainable banks are: Koc Holding A.S., Turkey, LeasePlan Corporation NV, Netherlands, Banca March SA, Spain, Lansforsakringar Bank AB (Publ), Sweden, Bank Mendes Gans NV, Netherlands, Allfunds Bank SA, Spain, Yapi Kredi Bank Nederland N.V, Netherlands, Norinchukin Trust and Banking Co. Ltd., Japan and BNP Paribas Dealing Services SA, France.
In the input-oriented, output-oriented BCC-O model, which assumes Constant Returns to Scale (CRS) efficient sustainable banks based on Pure Technical Efficiency (PTE) are: Commonwealth Bank Of Australia, Australia, Royal Bank Of Canada, Canada, Banco De Chile Sa, Chile and Grupo Security, Chile. In the BCC-input oriented, output-oriented model, which assumes Decrease Returns to Scale (DRS) efficient sustainable banks based on Pure Technical Efficiency (PTE) are: Westpac Banking Corporation, Australia, Itau Unibanco Holdings Sa, Brazil, Banco Do Brasil S.A., Brazil, Toronto Dominion Bank, Canada, Bank Of Nova Scotia (The) Scotiabank, Canada, Bank Of Montreal, Canada, Bnp Paribas Sa, France, Societe Generale Sa, France, Ing Groep Nv, Netherlands, Abn Amro Group N.V., Netherland, Dbs Group Holdings Ltd., Singapore, Banco Santander Sa, Spain and Banco Bilbao Vizcaya Argentaria Sa, Spain In the BCC-input oriented, output-oriented model, which assumes Increase Returns to Scale (IRS) efficient sustainable banks based on Pure Technical Efficiency (PTE) are: Australia And New Zealand Banking Group Limited, Australia, Canadian Imperial Bank Of Commerce, Canada, Banco Santander Chile, Chile, Bancolombia S.A., Colombia, Banco Davivienda, Colombia, Yes Bank Limited, India, Caixabank, S.A., Spain, Bankinter Sa, Spain, Skandinaviska Enskilda Banken Ab, Sweden, Ctbc Financial Holding Co. Ltd., Taiwan, E. Sun Financial Holding Co. Ltd., Taiwan, Taishin Financial Holding Co., Ltd Taiwan and Turkiye Garanti Bankasi A.S.,Turkey. The sustainable bank BCC input-oriented assuming increase return to scale (CRS) and-output oriented assuming decrease returns to scale are: National Australia Bank Limited, Australia and Sumitomo Mitsui Trust Holdings, Inc Japan. The BCC input-oriented assuming decrease return to scale (CRS) and-output oriented assuming constant to scale sustainable bank is Itausa- Investimentos Itau S.A. Brazil.
In the BCC-input oriented output-oriented model, which assumes Constant Returns to Scale (CRS) efficient non-sustainable banks based on Pure Technical Efficiency (PTE) are: Koc Holding A.S., Turkey, LeasePlan Corporation NV, Netherlands, Lansforsakringar Bank AB (Publ), Sweden, Bank Mendes Gans NV, Netherlands, Allfunds Bank SA, Spain, Yapi Kredi Bank, Nederland, N.V, Netherlands, Norinchukin Trust and Banking Co. Ltd., Japan and BNP Paribas Dealing Services SA, France. In the BCC-input oriented and output-oriented model, which assumes Decrease Returns to Scale (DRS) the efficient sustainable banks based on Pure Technical Efficiency (PTE) are: Mitsubishi UFJ Financial Group Inc, Japan, Sumitomo Mitsui Banking Corporation, Japan, HDFC Bank Ltd., India, Macquarie Group Ltd., Australia, National Bank of Canada, Canada, RCI Banque SA, France and Criteria Caixa, Spain. In the BCC input oriented output model, which assumes Increase Returns to Scale (IRS) are non-sustainable banks are: Caisse de Refinancement de l’Habitat SA, France, TD Bank NV, Netherlands, Vimmerby Sparbank AB, Sweden and Banque Revillon SA, France. The non-sustainable bank BCC input oriented assuming constant return to scale (CRS) and output oriented assuming decrease returns to scale is Bencha March SA, Spain.
The results indicate that the efficiency reached 1.000 when some banks have constant returns to scale, and some have decreasing returns to scale. The input-oriented, output-oriented and scale efficient SBs with constant returns to scale are as follows: Commonwealth Bank of Australia, Australia; Royal Bank of Canada, Canada; Banco De Chile Sa, Chile; and Grupo Security, Chile. Meanwhile, the input-oriented output-oriented scale efficient banks with decreasing returns to scale are as follows: Itau Unibanco Holdings Sa, Brazil; Abn Amro Group N.V., Netherlands; and Dbs Group Holdings Ltd., Singapore. The scale efficient bank Itausa-Investimentos Itau S.A. in Brazil decreased returns to scale as input-oriented and showed constant returns to scale in output-oriented. The input-oriented, output-oriented and scale efficient NSBs with constant returns to scale are as follows: Koc Holding A.S., Turkey; LeasePlan Corporation N.V., Netherlands; Lansforsakringar Bank AB (Publ), Sweden; Bank Mendes Gans NV, Netherlands; Allfunds Bank SA, Spain; Yapi Kredi Bank Nederland N.V., Netherlands, Norinchukin Trust and Banking Co. Ltd., Japan; and BNP Paribas Dealing Services SA, France. The Banca March SA Spain has input-oriented scale efficiency 1 with constant returns to scale and output-oriented efficiency 1 with decreasing returns to scale. The scale efficient SBs have the most productive scale size (MPSS) because these banks have an efficiency score 1 in terms of technical efficiency CCR, pure technical efficiency BCC, and scale efficiency.
5.2. Analysis of the Malmquist Productivity Model
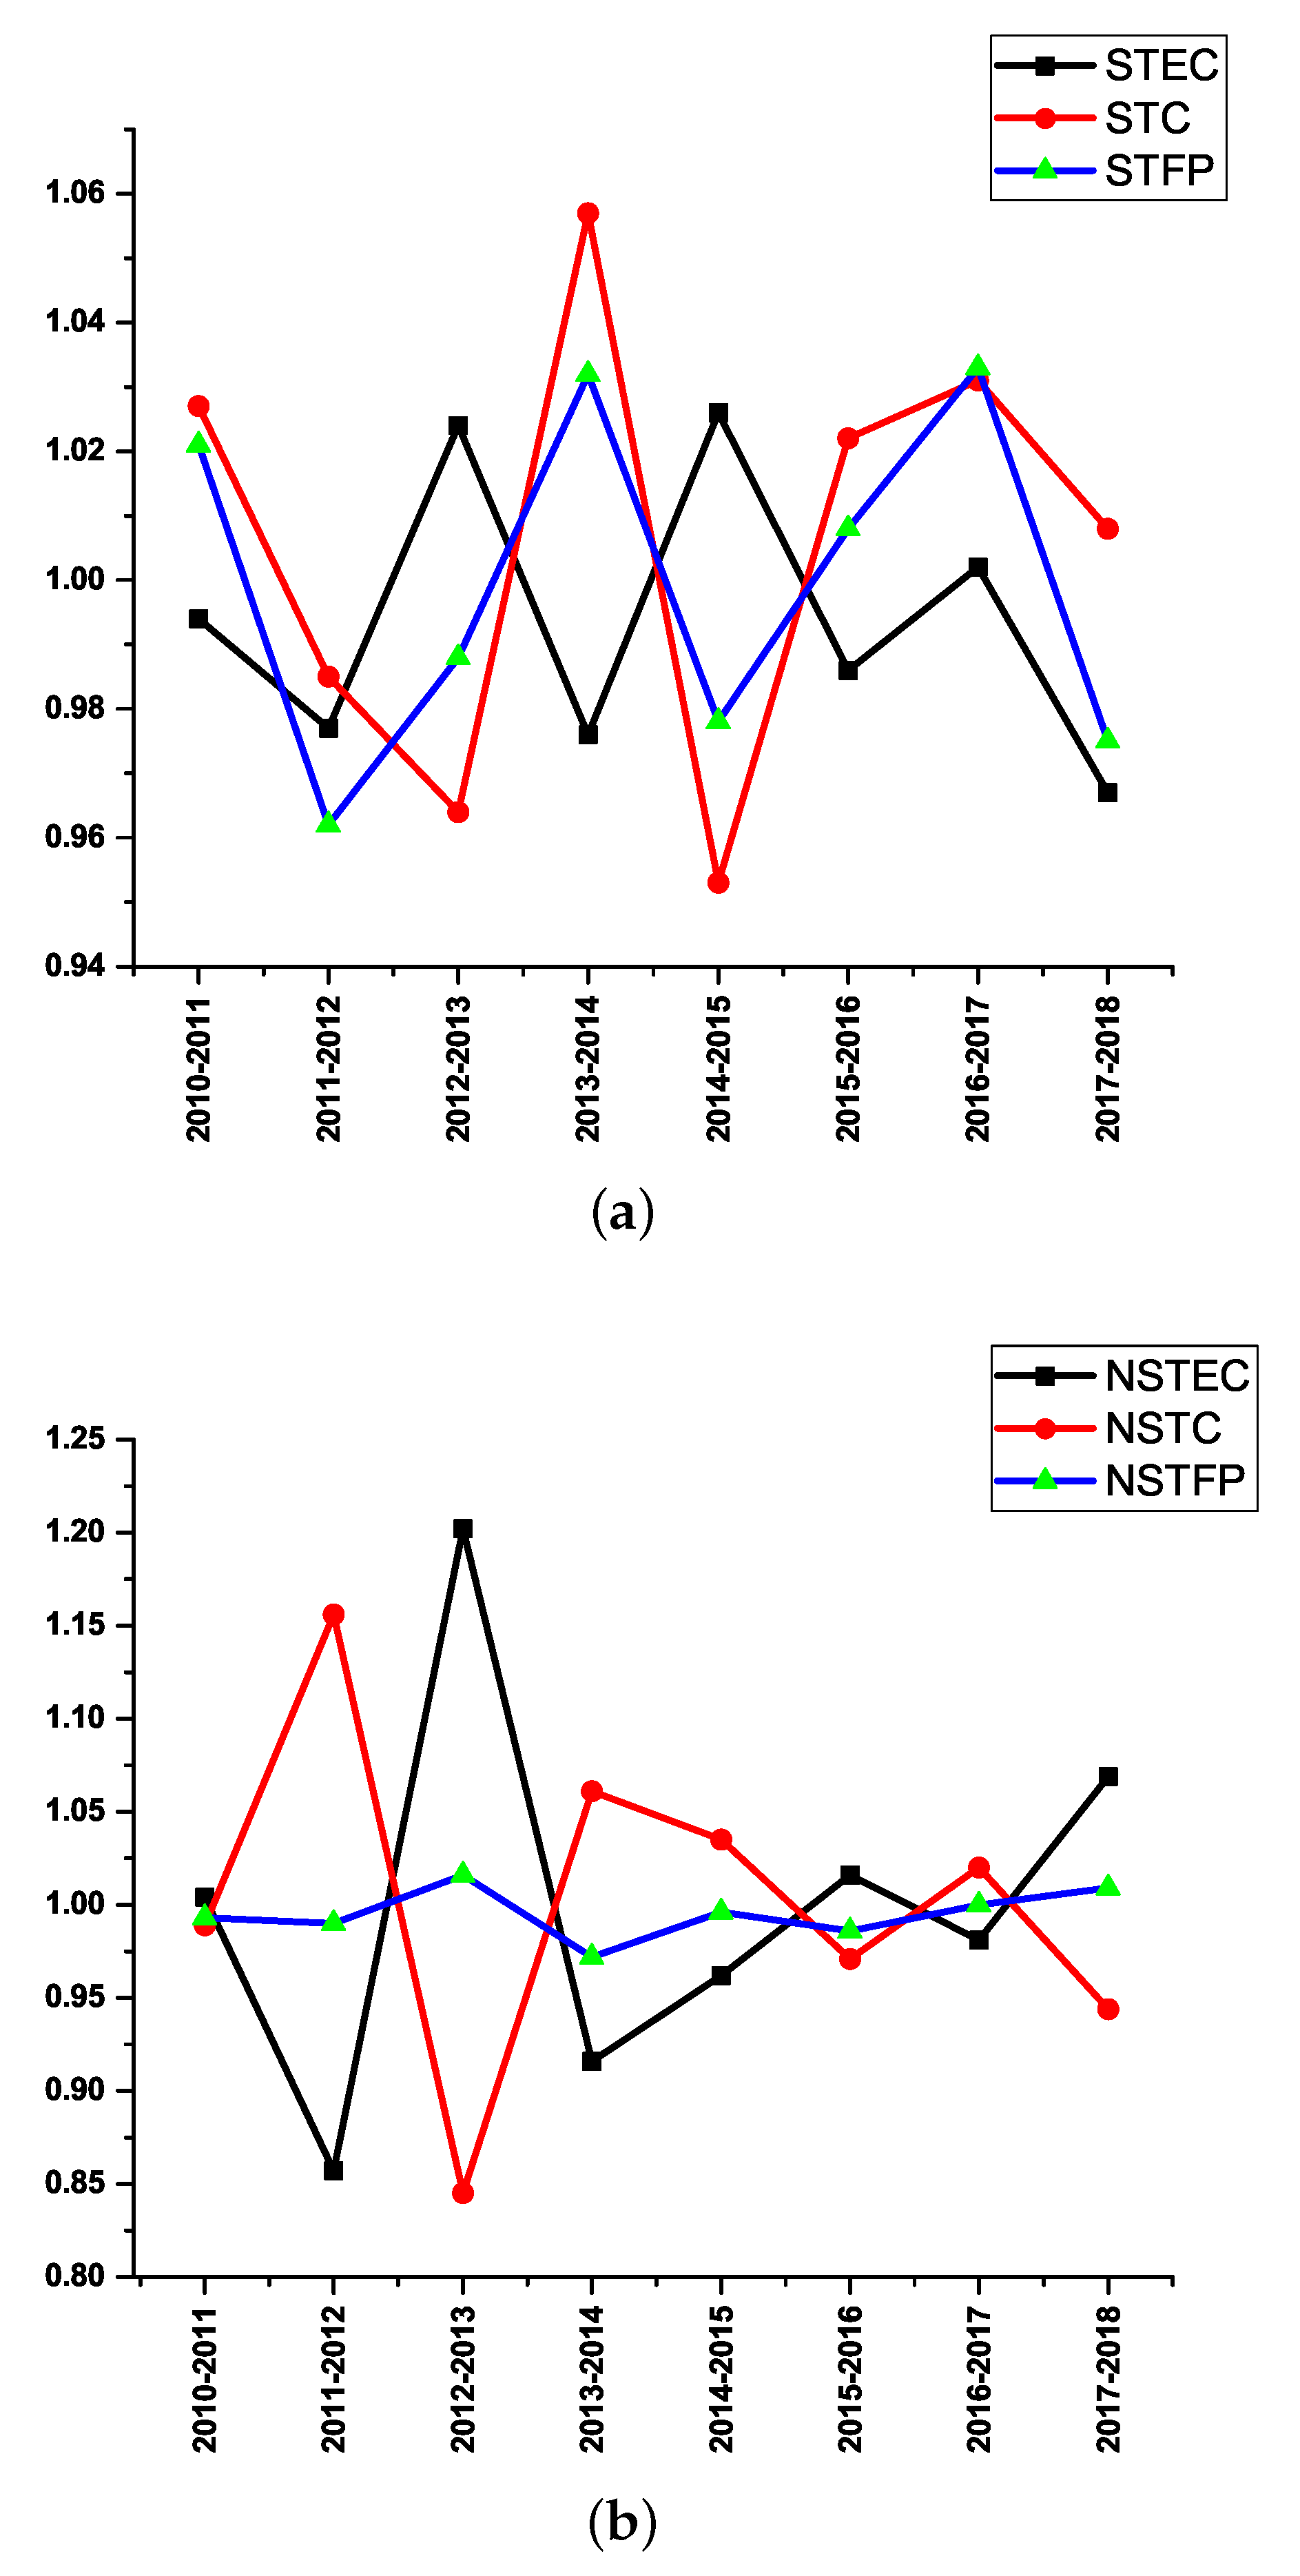
The MPI consists of three main components: technical efficiency change (TEC), technical change (TC), and total factor productivity (TFP). This study calculates each component independently. The statistical summary of commutated productivity changes of SBs and NSBs is presented in Table 4. The productivity trend of SBs and NSBs from 2010 to 2018 is illustrated in Figure 1.
5.2.1. Outline of Banks Productivity
The TC is often triggered by external factors, such as shifts in government policies, advances in technology, and changes in economic environments, whereas, TEC is produced by internal factors, such as a firm’s ability to use its own resources [70]. The productivity trend for SBs and NSBs for the period is presented below.
In Figure 1a, TEC, TC, and TFP are represented as STEC, STC, and STFP, respectively, for SBs. As shown in Figure 1a, TEC has more similar patterns with STF during the 9-year span. The productivity of SBs for nine years is presented in two sub-figures: Figure 1a and Figure 1b. Both figures are generated with different scales based on their data. In Figure 1a, the minimum scale is 0.94, and maximum scale is 1.06. Meanwhile, in Figure 1b, the minimum scale is 0.80, and maximum scale is 1.25.
In Figure 1a, TEC, TC, and TFP are represented as STEC, STC, and STFP, respectively, for SBs. Figure 1a shows that TEC has more similar patterns with STF during the 9-year span, which indicates that the productivity of SBs is influence by TC rather than TEC. The analysis affirms that the bank’s capacity to accept changing external business environments can significantly affect its operating efficiency. Similarly, TEC, TC, and TFP are represented as NSTEC, NSTC, and NSTFP, respectively, for NSBs in Figure 1b. As shown in Figure 1b, NSTC and NSTF have different patterns, while NSTEC have similar patterns with NSTFP, which indicates that the bank’s efficiency is triggered by its own ability to use its resources through improvements in managerial practices.
5.2.2. Total Factor Productivity
The statistical summary of changes in TFP over time is presented in Table 5, which shows the minimum and maximum values of means, medians and standard deviation represented by for SBs and NSBs for the period between 2010 and 2018. The TFP < 1 shows a decrease in productivity; TFP = 1 indicates no change in productivity; while TFP > 1 signifies an increase in productivity. The TFP of SBs decreased by 4.4%, which is calculated by subtracting the TFP of the first year from the last period (i.e., 2017–2018) from period 1 (i.e., 2010–2011). The weighted average TFP during this period is 103%. From 2010–2011 to 2011–2012, the TFP of SBs decreased by 5.5%; between 2011–2012 and 2012–2013, it increased by 3.6%; in 2012-2013 to 2013–2014, it increased by 3.1%; from 2013–2014 to 2014–2015, it decreased by 4.9%; between 2014–2015 and 2015–2016, it decreased by 3.5%; for 2016–2017, it increased by 1.9%; and in the 2016–2017 to 2017–2018, it decreased by 6.1%. During these periods, 8 banks decreased their productivity, while 25 banks increased their productivity.
The TFP for NSBs increased by 3%, and the unweighted average for the whole period is 99.1%. The TFP of NSBs during the period 2010–2011 to 2011–2012 decreased by 0.11%; in 2011–2012 to 2012–2013, it increased by 2.93%; between 2012–2013 and 2013–2014, it decreased by 4.41%, in 2013–2014 to 2014–2015, it increased by 2.36%; from 2014–2015 to 2015–2016, it decreased by 0.91%; for 2016–2017, it increased by 2.07%; and in the 2016–2017 to 2017–2018, it decreased by 1.09%. During these periods, 74 NSBs increased their productivity; 137 decreased their productivity; and 3 had no change in their productivity.
5.2.3. Technical Efficiency Change
The statistical summary of changes in TEC over time is presented in Table 6, which shows the minimum and maximum values of means, median, and standard deviation represented by for SBs and NSBs from 2010 to 2018. The TEC < 1 shows decreased TEC; TEC = 1 denotes no change, while TEC > 1 indicates increase in TEC.
The TEC of SBs decreased by 2.5%, which is calculated by subtracting the TEC of the first year from the last period (i.e., 2017–2018) from period 1 (i.e., 2010–2011). The unweighted average of TEC during this period is 96%. From 2010–2011 to 2011–2012, the TEC of SBs decreased by 1.7%; in 2011–2012 to 2012–2013, it increased by 4.7%; between 2012–2013 and 2013–2014, it decreased by 4.8%; from 2013–2014 to 2014–2015, it increased by 5%; in 2014–2015 to 2015–2016, it decreased by 4%, for 2016–2017, it increased by 1.6%, and in 2016–2017 to 2017–2018, it decreased by 3.5%. During these periods, 19 banks decreased their TEC; 10 banks increased their TEC; and 4 banks did not change their TEC.
The TEC of NSBs increased by 7.6%, and the unweighted average for the whole period is 100%. Overall, the TEC of NSBs from 2010–2011 to 2011–2012 decreased by 14.3%, while in 2011–2012 to 2012–2013, it increased by 35.5%, which is the highest increase. In 2012–2013 to 2013–2014, it decreased by 29.5%; between 2013–2014 to 2014–2015, it increased by 4.5%; from 2014–2015 to 2015–2016, it increased by 5.4%; for 2016–2017, it decreased by 3.1%, and in the 2016–2017 to 2017–2018, it increased by 9%. During these periods, the TEC increased for 105 NSBs; it decreased for 100 NSBs, while there is no change in TEC for 9 NSBs.
5.2.4. Technical Change
The statistical summary of changes in TC over time is presented in Table 7, which shows the minimum and maximum values with means, median, and standard deviation represented by for SBs and NSBs for the period of 2010 to 2018. Here, TC < 1 indicates decreased TC; TC = 1 denotes no change; and TC > 1 shows increase in TC.
The TC of SBs decreased by 1.9%, which is calculated by subtracting the TC of the first year from the last period (i.e., 2017–2018) from period 1 (i.e., 2010–2011). The unweighted average TC during this period is 107.4%. During the period of 2010–2011 to 2011–2012, the TC of SBs decreased by 4.1%; in 2011–2012 to 2012–2013, it decreased by 1.6%; between 2012–2013 and 2013–2014, it increased by 8.6%; in 2013–2014 to 2014–2015, it decreased by 10%; it increased by 6.8% in 2014–2015 to 2015–2016; for 2016–2017, it increased by 0.8%; and in 2016–2017 to 2017–2018, it decreased by 2.4%. During these periods, 2 banks decreased their TC, while 31 increased their TC. The TC for NSBs decreased by 3.39%, and the unweighted average for the whole period is 99.2%. Overall, the TC of NSBs from 2010–2011 to 2011–2012 increased by 17.1%, whereas in 2011–2012 to 2012–2013, it decreased by 30.7%. In 2012–2013 to 2013–2014, it increased by 21.2%; between 2013–2014 and 2014–2015, it decreased by 2.8%; from 2014–2015 to 2015–2016, it decreased by 6.3%; for 2016–2017, it increased by 5.7%; and in 2016–2017 to 2017–2018, it decreased by 7.7%. During these periods, TC increased for 73 NSBs; it decreased for 139 NSBs, while there is no change in TC for 2 NSBs.
5.3. Comparative Analysis
To analyze the results of this study, we employed two comparisons. The first comparison concerns the difference in means and the difference in medians. This comparison is used to differentiate the performance of sustainable banks (SBs) and non-sustainable banks (NSBs). The second comparison is based on regions and specialization to identify the potential effect of specialization and regions on the banks’ performance.
The result of the difference in means and medians is presented in Table 8. The mean score of SBs’ technical efficiency of 0.908 is compared with the mean of 0.659 for NSBs. The result indicates that SBs perform better than NSBs, with a mean difference of 0.249. This implies that the strategy of SBs evidently helps generate profit despite limited input resources; this result is statistically significant. Similar results are found in the difference test for the medians where the mean score of SBs’ pure technical efficiency of 0.949 is compared with the mean of 0.748 for NSBs. The result shows that in terms of pure technical efficiency, SBs perform better than NSBs, with mean difference of 0.201. This result is also statistically significant. Comparable results are also found in the difference test for the medians. The scale efficiency mean of SBs is 0.958, whereas the mean for NSBs is 0.896; the difference is 0.061, which is statistically significant. This result indicates the SBs increase efficiency by increasing their size as compared to NSBs. The difference in median also provides a similar result. The mean productivity of SBs 1.030 is compared with the mean of 0.991 for NSBs. The result indicates that SBs perform better than other firms, with a mean difference of 0.039. This implies that the productivity of SBs is higher than NSBs. This is, however, not statistically significant. The selected SBs and NSBs in this study operate in different regions and have different specializations. We, therefore, conducted two independent statistical tests for them. The first test is a one-way ANOVA to determine any significant difference in the performance of SBs and NSBs in different regions. The second test is a one-way ANOVA to identify any significant difference in the performance of SBs and NSBs in different specializations. The banks belong to four regions―Asia, Europe, North America, and South America. Meanwhile, specializations include commercial banks, banks and holding companies, and investments and trust corporations. The indexes used are technical efficiency, pure technical efficiency, scale efficiency, TFP, TEC, and TC. The p-value of less than 0.05 shows the significant difference among indexes.
The results of comparative analysis of the malmquist indexes is presented in Table 9. The results for SBs indicate that there is a significant difference in technical efficiency concerning the regions, whereas, no significant difference is noted regarding pure technical efficiency, scale efficiency, TFP change, TEC, which means that banks belonging to different regions have different technical efficiency. Meanwhile, the results for NSBs show that there is a significant difference in technical efficiency and pure technical efficiency concerning the regions, whereas no significant difference is observed in scale efficiency, TFP change, and TEC, which means that banks belonging to different regions have different technical efficiency and pure technical efficiency. Notably, all other factors are the same for all regions. The results for SBs with different specializations show a significant difference in TFP and TC. Each specialized group generates profit differently by utilizing inputs; the technical change is also different for each specialized group. Each specialization group employs internal strategies regarding the use of resources, develops new strategies, and takes decisions according to key decision-makers. The results for NSBs with different specializations indicate a significant difference in all indexes (i.e., technical efficiency, pure technical efficiency, scale efficiency, TFP, TEC, and TC. Each specialization group of NSBs has a different technical efficiency, pure technical efficiency, scale efficiency, TFP, TEC, and TC. This implies that NSBs with different specializations have different efficiency and productivity. The pure technical efficiency of the NSB specialization group shows a different way of utilizing its resources under exogenous environments. Moreover, the scale efficiency of NSBs with different specializations demonstrates that efficiency is increased by increasing size. Meanwhile, the MPI indexes signify that the change in productivity is because of internal and external factors in each specialization group.
6. Managerial Implications and Conclusions
6.1. Managerial Implications
First, this study affirms that the efficiency and productivity of sustainable banks (SBs) is better than non-sustainable banks (NSBs); these being statistically significant. This result is consistent with the first group mentioned in Section 2, which states that firm’s socio-environmental responsibility is positively correlated with its performance. Nonetheless, we do not disregard finding regarding the second group, which is considered the agency problem. The agency problem asserts that the firm’s environmental and social activities will incur costs, which can lead to a competitive disadvantage. As such, although sustainable development has become a slogan for business practices worldwide, the agency problem still exists. Second, the efficiency and productivity performance that varies according to regions and specializations can be explained by the bank’s awareness of sustainable development. Notably, there is an increased awareness of SBs. The equator principles define benchmarks that only allow financing of projects that have passed the socio-environmental screening process.
6.2. Conclusions
This study evaluates the efficiency and productivity of sustainable banks (SBs) using the DEA and the Malmquist technique and compares them with non-sustainable (NSBs). We used the data of SBs, which are indexed in 2018, and NSBs from the same countries that have the same specialization. Our study reveals that SBs are more efficient and have higher productivity compared to NSBs. Moreover, the results show that the productivity of SBs is influenced by the external factors, such as shifts in government policies, advances in technology, and changes in economic environments. In contrast, the productivity of NSBs is influenced by the internal factors, such as the bank’s ability to utilize its own resources to increase profitability. Furthermore, the results demonstrate that SBs in different regions differ in efficiency, and different specialized banks differ in productivity. Similarly, NSBs in different regions vary in efficiency. Non-sustainable banks with different specializations also differ in efficiency and productivity.
Although the impact of sustainable corporate strategies on financial performance is complicated, our analysis affirms that efficiency and productivity matter in the firm’s performance. For this reason, it is necessary to develop a new framework by using parametric and non-parametric approaches to study bank efficiency and productivity. Apart from these models, the stochastic frontier approaches and the analytical hierarchical process can also be used to study and compare the performance of SBs and NSBs. The framework developed can then be applied in various fields, such as insurance, production, and hospitals.
Author Contributions
Conceptualization, A.A.S. and D.W.; Data Curation, A.A.S.; Formal Analysis, A.A.S.; Funding Acquisition, D.W., A.A.S.; Investigation, A.A.S.; Methodology, D.W. and A.A.S.; Project Administration, D.W.; Resources, A.A.S.; Software, A.A.S.; Supervision D.W., V.K.; Validation, A.A.S.; Visualization, A.A.S.; Writing original Draft, A.A.S.; Writing Review and Edit, A.A.S.
Funding
This work was supported in part by the Ministry of Science and Technology of China under Grant 2016YFC0503606, in part by the National Natural Science Foundation of China under Grant 71825007, in part by the Chinese Academy of Sciences Frontier Scientific Research Key Project under Grant QYZDB-SSW-SYS021, in part by the CAS Strategic Research and Decision Support System Development under Grant GHJ-ZLZX-2019-33-3, in part by the Marianne and Marcus Wallenberg Foundation under Grant MMW 2015.0007, and supported by the International Partnership Program of Chinese Academy of Sciences, Grant No. 211211KYSB20180042.
Acknowledgments
The author would also like to acknowledge the financial contribution for his research work supported by the Chinese Academy of Science the (CAS) The Word Academy of Sciences (TWAS) CAS-TWAS President’s fellowship.
Conflicts of Interest
The authors declare no conflict of interest.
References
- Pérez, R. Research About “global responsibility” in management. Corp. Gov. Int. J. Bus. Soc. 2003, 3, 78–89. [Google Scholar] [CrossRef]
- Funk, K. Sustainability and performance. MIT Sloan Manag. Rev. 2003, 44, 65. [Google Scholar]
- Ashrafi, M.; Adams, M.; Walker, T.; Magnan, G. How corporate social responsibility can be integrated into corporate sustainability: A theoretical review of their relationships. Int. J. Sustain. Dev. World Ecol. 2018, 25, 672–682. [Google Scholar] [CrossRef]
- Lozano, R. A holistic perspective on corporate sustainability drivers. Corp. Soc. Responsib. Environ. Manag. 2015, 22, 32–44. [Google Scholar] [CrossRef]
- Miska, C.; Szocs, I.; Schiffinger, M. Culture’s effects on corporate sustainability practices: A multi-domain and multi-level view. J. World Bus. 2018, 53, 263–279. [Google Scholar] [CrossRef]
- Vildåsen, S.S.; Keitsch, M.; Fet, A.M. Clarifying the epistemology of corporate sustainability. Ecol. Econ. 2017, 138, 40–46. [Google Scholar] [CrossRef]
- Gond, J.P.; Grubnic, S.; Herzig, C.; Moon, J. Configuring management control systems: Theorizing the integration of strategy and sustainability. Manag. Account. Res. 2012, 23, 205–223. [Google Scholar] [CrossRef] [Green Version]
- Morioka, S.N.; Carvalho, M.M. Measuring sustainability in practice: Exploring the inclusion of sustainability into corporate performance systems in Brazilian case studies. J. Clean. Prod. 2016, 136, 123–133. [Google Scholar] [CrossRef]
- Wahab, M.; Wu, D.; Lee, C.G. A generic approach to measuring the machine flexibility of manufacturing systems. Eur. J. Oper. Res. 2008, 186, 137–149. [Google Scholar] [CrossRef]
- Dowell, G.; Hart, S.; Yeung, B. Do corporate global environmental standards create or destroy market value? Manag. Sci. 2000, 46, 1059–1074. [Google Scholar] [CrossRef]
- King, A.; Lenox, M. Exploring the locus of profitable pollution reduction. Manag. Sci. 2002, 48, 289–299. [Google Scholar] [CrossRef]
- Schnietz, K.E.; Epstein, M.J. Exploring the financial value of a reputation for corporate social responsibility during a crisis. Corp. Reput. Rev. 2005, 7, 327–345. [Google Scholar] [CrossRef]
- Lo, S.F.; Sheu, H.J. Is corporate sustainability a value-increasing strategy for business? Corp. Gov. Int. Rev. 2007, 15, 345–358. [Google Scholar] [CrossRef]
- Wagner, M.; Van Phu, N.; Azomahou, T.; Wehrmeyer, W. The relationship between the environmental and economic performance of firms: An empirical analysis of the European paper industry. Corp. Soc. Responsib. Environ. Manag. 2002, 9, 133–146. [Google Scholar] [CrossRef]
- Chen, K.H.; Metcalf, R.W. The relationship between pollution control record and financial indicators revisited. Account. Rev. 1980, 55, 168. [Google Scholar]
- Jaggi, B.; Freedman, M. An examination of the impact of pollution performance on economic and market performance: Pulp and paper firms. J. Bus. Financ. Account. 1992, 19, 697–713. [Google Scholar] [CrossRef]
- Mahapatra, S. Investor reaction to a corporate social accounting. J. Bus. Financ. Account. 1984, 11, 29–40. [Google Scholar] [CrossRef]
- McWilliams, A.; Siegel, D. Corporate social responsibility and financial performance: Correlation or misspecification? Strateg. Manag. J. 2000, 21, 603–609. [Google Scholar] [CrossRef]
- Mill, G.A. The financial performance of a socially responsible investment over time and a possible link with corporate social responsibility. J. Bus. Ethics 2006, 63, 131. [Google Scholar] [CrossRef]
- Murray, A.; Sinclair, D.; Power, D.; Gray, R. Do financial markets care about social and environmental disclosure? Further evidence and exploration from the UK. Account. Audit. Account. J. 2006, 19, 228–255. [Google Scholar] [CrossRef]
- Ghahraman, A.; Prior, D. A learning ladder toward efficiency: Proposing network-based stepwise benchmark selection. Omega 2016, 63, 83–93. [Google Scholar] [CrossRef]
- Huang, T.H.; Lin, C.I.; Chen, K.C. Evaluating efficiencies of Chinese commercial banks in the context of stochastic multistage technologies. Pac. Basin Financ. J. 2017, 41, 93–110. [Google Scholar] [CrossRef]
- Jacobs, B.W.; Kraude, R.; Narayanan, S. Operational productivity, corporate social performance, financial performance, and risk in manufacturing firms. Prod. Oper. Manag. 2016, 25, 2065–2085. [Google Scholar] [CrossRef]
- Juo, J.C.; Fu, T.T.; Yu, M.M.; Lin, Y.H. Non-radial profit performance: An application to Taiwanese banks. Omega 2016, 65, 111–121. [Google Scholar] [CrossRef]
- Novickytė, L.; Droždz, J. Measuring the Efficiency in the Lithuanian Banking Sector: The DEA Application. Int. J. Financ. Stud. 2018, 6, 37. [Google Scholar] [CrossRef]
- Yip, A.W.; Bocken, N.M. Sustainable business model archetypes for the banking industry. J. Clean. Prod. 2018, 174, 150–169. [Google Scholar] [CrossRef]
- Levine, R. Financial Development and Economic Growth: Views and Agenda; The World Bank: Washington, DC, USA, 1999. [Google Scholar]
- Zhou, X.; Xu, Z.; Chai, J.; Yao, L.; Wang, S.; Lev, B. Efficiency evaluation for banking systems under uncertainty: A multi-period three-stage DEA model. Omega 2019, 85, 68–82. [Google Scholar] [CrossRef]
- Jeucken, M.; Bouma, J.J. The changing environment of banks. In Sustainable Banking; Routledge: Abingdon, UK, 2017; pp. 24–38. [Google Scholar]
- Babiak, K.; Trendafilova, S. CSR and environmental responsibility: Motives and pressures to adopt green management practices. Corp. Soc. Responsib. Environ. Manag. 2011, 18, 11–24. [Google Scholar] [CrossRef]
- Schmidheiny, S.; Zorraquin, F.J. Financing Change: The Financial Community, Eco-Efficiency, and Sustainable Development; MIT Press: Cambridge, MA, USA, 1998. [Google Scholar]
- Zeidan, R.; Boechat, C.; Fleury, A. Developing a sustainability credit score system. J. Bus. Ethics 2015, 127, 283–296. [Google Scholar] [CrossRef]
- Weber, O.; Hoque, A.; Ayub Islam, M. Incorporating environmental criteria into credit risk management in Bangladeshi banks. J. Sustain. Financ. Invest. 2015, 5, 1–15. [Google Scholar] [CrossRef]
- Cerin, P.; Scholtens, B. Linking responsible investments to societal influence: Motives, assessments and risks. Sustain. Dev. 2011, 19, 71–76. [Google Scholar] [CrossRef]
- Darnall, N.; Carmin, J. Greener and cleaner? The signaling accuracy of US voluntary environmental programs. Policy Sci. 2005, 38, 71–90. [Google Scholar] [CrossRef]
- Alberici, A.; Querci, F. The quality of disclosures on environmental policy: The profile of financial intermediaries. Corp. Soc. Responsib. Environ. Manag. 2016, 23, 283–296. [Google Scholar] [CrossRef]
- Chih, H.L.; Chih, H.H.; Chen, T.Y. On the determinants of corporate social responsibility: International evidence on the financial industry. J. Bus. Ethics 2010, 93, 115–135. [Google Scholar] [CrossRef]
- Scholtens, B. Corporate social responsibility in the international banking industry. J. Bus. Ethics 2009, 86, 159–175. [Google Scholar] [CrossRef]
- Eccles, R.G.; Ioannou, I.; Serafeim, G. The Impact of a Corporate Culture of Sustainability on Corporate Behavior and Performance; Number W17950; National Bureau of Economic Research: Cambridge, MA, USA, 2012. [Google Scholar]
- Høgevold, N.M.; Svensson, G. A business sustainability model: A European case study. J. Bus. Ind. Mark. 2012, 27, 142–151. [Google Scholar] [CrossRef]
- Falcone, P.M.; Morone, P.; Sica, E. Greening of the financial system and fuelling a sustainability transition: A discursive approach to assess landscape pressures on the Italian financial system. Technol. Forecast. Soc. Chang. 2018, 127, 23–37. [Google Scholar] [CrossRef]
- Matousek, R.; Rughoo, A.; Sarantis, N.; Assaf, A.G. Bank performance and convergence during the financial crisis: Evidence from the ‘old’European Union and Eurozone. J. Bank. Financ. 2015, 52, 208–216. [Google Scholar] [CrossRef]
- Paradi, J.C.; Yang, Z.; Zhu, H. Assessing bank and bank branch performance. In Handbook on Data Envelopment Analysis; Springer: Berlin, Germany, 2011; pp. 315–361. [Google Scholar]
- Ebrahim, M.S.; Girma, S.; Shah, M.E.; Williams, J. Rationalizing the value premium in emerging markets. J. Int. Financ. Mark. Inst. Money 2014, 29, 51–70. [Google Scholar] [CrossRef] [Green Version]
- Sturm, J.E.; Williams, B. What determines differences in foreign bank efficiency? Australian evidence. J. Int. Financ. Mark. Inst. Money 2010, 20, 284–309. [Google Scholar] [CrossRef] [Green Version]
- Fijałkowska, J.; Zyznarska-Dworczak, B.; Garsztka, P. Corporate social-environmental performance versus financial performance of banks in Central and Eastern European countries. Sustainability 2018, 10, 772. [Google Scholar] [CrossRef]
- Casu, B.; Molyneux, P. A comparative study of efficiency in European banking. Appl. Econ. 2003, 35, 1865–1876. [Google Scholar] [CrossRef] [Green Version]
- Miller, S.M.; Noulas, A.G. The technical efficiency of large bank production. J. Bank. Financ. 1996, 20, 495–509. [Google Scholar] [CrossRef]
- Seiford, L.M.; Zhu, J. Profitability and marketability of the top 55 US commercial banks. Manag. Sci. 1999, 45, 1270–1288. [Google Scholar] [CrossRef]
- Shah, A.A.; Wu, D.; Korotkov, V.; Jabeen, G. Do Commercial Banks Benefited from the Belt and Road Initiative? A Three-Stage DEA-Tobit-NN Analysis. IEEE Access 2019, 7, 37936–37949. [Google Scholar] [CrossRef]
- Kingyens, A.T.; Paradi, J.C.; Tam, F. Bankruptcy prediction of companies in the retail-apparel industry using data envelopment analysis. In Advances in Efficiency and Productivity; Springer: Berlin, Germany, 2016; pp. 299–329. [Google Scholar]
- Yang, X.; Dimitrov, S. Data envelopment analysis may obfuscate corporate financial data: Using support vector machine and data envelopment analysis to predict corporate failure for nonmanufacturing firms. INFOR Inf. Syst. Oper. Res. 2017, 55, 295–311. [Google Scholar] [CrossRef]
- Krishnasamy, G.; Hanuum Ridzwa, A.; Perumal, V. Malaysian post merger banks’ productivity: Application of Malmquist productivity index. Manag. Financ. 2004, 30, 63–74. [Google Scholar] [CrossRef]
- Charnes, A.; Cooper, W.W.; Rhodes, E. Measuring the efficiency of decision making units. Eur. J. Oper. Res. 1978, 2, 429–444. [Google Scholar] [CrossRef]
- Bessent, A.; Bessent, W.; Kennington, J.; Reagan, B. An application of mathematical programming to assess productivity in the Houston independent school district. Manag. Sci. 1982, 28, 1355–1367. [Google Scholar] [CrossRef]
- Thanassoulis, E. Data envelopment analysis and its use in banking. Interfaces 1999, 29, 1–13. [Google Scholar] [CrossRef]
- Ebrahimnejad, A.; Tavana, M.; Lotfi, F.H.; Shahverdi, R.; Yousefpour, M. A three-stage data envelopment analysis model with application to banking industry. Measurement 2014, 49, 308–319. [Google Scholar] [CrossRef]
- Xu, J.; Li, B.; Wu, D. Rough data envelopment analysis and its application to supply chain performance evaluation. Int. J. Prod. Econ. 2009, 122, 628–638. [Google Scholar] [CrossRef]
- Cooper, W.W.; Park, K.S.; Yu, G. An illustrative application of IDEA (imprecise data envelopment analysis) to a Korean mobile telecommunication company. Oper. Res. 2001, 49, 807–820. [Google Scholar] [CrossRef]
- Jacobs, R. Alternative methods to examine hospital efficiency: Data envelopment analysis and stochastic frontier analysis. Health Care Manag. Sci. 2001, 4, 103–115. [Google Scholar] [CrossRef] [PubMed]
- Cooper, W.W.; Ruiz, J.L.; Sirvent, I. Selecting non-zero weights to evaluate effectiveness of basketball players with DEA. Eur. J. Oper. Res. 2009, 195, 563–574. [Google Scholar] [CrossRef]
- Sexton, T.R.; Lewis, H.F. Two-stage DEA: An application to major league baseball. J. Product. Anal. 2003, 19, 227–249. [Google Scholar] [CrossRef]
- Banker, R.D.; Charnes, A.; Cooper, W.W. Some models for estimating technical and scale inefficiencies in data envelopment analysis. Manag. Sci. 1984, 30, 1078–1092. [Google Scholar] [CrossRef]
- Vincová, K. Using DEA models to measure efficiency. Biatec 2005, 13, 24–28. [Google Scholar]
- Shepherd, R.W. Theory of Cost and Production Functions; Princeton University Press: Princeton, NJ, USA, 2015. [Google Scholar]
- Caves, D.W.; Christensen, L.R.; Diewert, W.E. The economic theory of index numbers and the measurement of input, output, and productivity. Econom. J. Econom. Soc. 1982, 50, 1393–1414. [Google Scholar] [CrossRef]
- Nishimizu, M.; Page, J.M. Total factor productivity growth, technological progress and technical efficiency change: Dimensions of productivity change in Yugoslavia, 1965–1978. Econ. J. 1982, 92, 920–936. [Google Scholar] [CrossRef]
- Färe, R.; Grosskopf, S.; Norris, M.; Zhang, Z. Productivity growth, technical progress, and efficiency change in industrialized countries. Am. Econ. Rev. 1994, 84, 66–83. [Google Scholar]
- Kirikal, L.; Tallinna, T. Productivity, the Malmquist Index and the Empirical Study of Banks in Estonia; Tallinn Technical University Press: Tallinn, Estonia, 2005. [Google Scholar]
- Ahn, Y.H.; Min, H. Evaluating the multi-period operating efficiency of international airports using data envelopment analysis and the Malmquist productivity index. J. Air Transp. Manag. 2014, 39, 12–22. [Google Scholar] [CrossRef]
Figure 1.
Productivity trend of the sustainable and non-sustainable banks during the period of 2010 to 2018. (a) Productivity trend of sustainable banks during the period; (b) Productivity trend of non-sustainable banks during the period.
Figure 1.
Productivity trend of the sustainable and non-sustainable banks during the period of 2010 to 2018. (a) Productivity trend of sustainable banks during the period; (b) Productivity trend of non-sustainable banks during the period.


Table 1.
Statistics summary of sustainable and non-sustainable banks.
| Sustainable Banks | Min | Max | Mean | Median | |
|---|---|---|---|---|---|
| Assets (Thousand $) | 9,539,774.000 | 2,542,879,465.000 | 521,800,551.270 | 418,457,808.000 | 537,122,883.310 |
| Equity (Thousand $) | 728,540.000 | 128,575,708.000 | 31,367,567.020 | 27,048,911.000 | 28,978,097.320 |
| Employees (Thousand $) | 3396.000 | 386,1241.320 | 79,390.510 | 34,263.000 | 312,242.250 |
| Expenses (Thousand $) | 174,816.000 | 62,126,603.000 | 8,843,103.780 | 6,540,181.000 | 9,516,082.250 |
| Revenues (Thousand $) | 313,560.000 | 69,699,799.000 | 12,146,690.620 | 9,516,931.000 | 11,603,804.810 |
| Profit (Thousand $) | 81,150.000 | 9,842,652.000 | 3,303,586.840 | 2,744,019.000 | 2,688,452.620 |
| Non-Sustainable | |||||
| Assets (Thousand $) | 114,206.444 | 2,613,578,091.222 | 786,206,207.719 | 21,885,512.157 | 295,335,539.152 |
| Equity (Thousand $) | 25,181.519 | 147,544,292.667 | 4,884,806.398 | 1,047,242.667 | 15,875,595.651 |
| Employees (Thousand $) | 9.111 | 102,978.297 | 6262.299 | 1526.297 | 14,710.298 |
| Expenses (Thousand $) | 3428.099 | 31,729,723.222 | 1,118,108.022 | 283,958.627 | 3,497,417.642 |
| Revenue (Thousand $) | 4327.074 | 35,400,957.889 | 1,483,841.508 | 343,842.444 | 4,436,100.986 |
| Profit (Thousand $) | 799.778 | 9,618,663.778 | 365,733.486 | 69,834.568 | 1,106,557.054 |
Table 2.
Statistics summary data envelopment analysis (DEA) efficiency scores of sustainable and non-sustainable banks.
Table 2.
Statistics summary data envelopment analysis (DEA) efficiency scores of sustainable and non-sustainable banks.
| Sustainable Banks | Min | Max | Mean | Median | |
|---|---|---|---|---|---|
| Year 2010 | 0.634 | 1.000 | 0.863 | 0.880 | 0.115 |
| Year 2011 | 0.621 | 1.000 | 0.893 | 0.909 | 0.109 |
| Year 2012 | 0.569 | 1.000 | 0.893 | 0.927 | 0.119 |
| Year 2013 | 0.707 | 1.000 | 0.903 | 0.922 | 0.103 |
| Year 2014 | 0.624 | 1.000 | 0.882 | 0.911 | 0.112 |
| Year 2015 | 0.731 | 1.000 | 0.900 | 0.918 | 0.082 |
| Year 2016 | 0.554 | 1.000 | 0.882 | 0.910 | 0.113 |
| Year 2017 | 0.735 | 1.000 | 0.900 | 0.899 | 0.085 |
| Year 2018 | 0.741 | 1.000 | 0.905 | 0.920 | 0.084 |
| Non-Sustainable Banks | |||||
| Year 2010 | 0.472 | 1.000 | 0.680 | 0.653 | 0.135 |
| Year 2011 | 0.421 | 1.000 | 0.685 | 0.653 | 0.146 |
| Year 2012 | 0.378 | 1.000 | 0.591 | 0.556 | 0.149 |
| Year 2013 | 0.419 | 1.000 | 0.704 | 0.678 | 0.143 |
| Year 2014 | 0.431 | 1.000 | 0.648 | 0.610 | 0.150 |
| Year 2015 | 0.441 | 1.000 | 0.622 | 0.573 | 0.137 |
| Year 2016 | 0.452 | 1.000 | 0.631 | 0.597 | 0.134 |
| Year 2017 | 0.327 | 1.000 | 0.619 | 0.577 | 0.131 |
| Year 2018 | 0.497 | 1.000 | 0.748 | 0.720 | 0.152 |
Table 3.
Statistics summary of Input and output based CCR BCC and Scale for sustainable and non-sustainable banks.
Table 3.
Statistics summary of Input and output based CCR BCC and Scale for sustainable and non-sustainable banks.
| Sustainable Banks | Model | Min | Max | Mean | Median | |
|---|---|---|---|---|---|---|
| Input-Oriented | CCR | 0.741 | 1.000 | 0.908 | 0.923 | 0.084 |
| BCC | 0.752 | 1.000 | 0.949 | 0.989 | 0.069 | |
| Scale | 0.741 | 1.000 | 0.958 | 0.989 | 0.068 | |
| Output-Oriented | CCR | 0.741 | 1.000 | 0.908 | 0.923 | 0.084 |
| BCC | 0.750 | 1.000 | 0.950 | 0.991 | 0.065 | |
| Scale | 0.741 | 1.000 | 0.956 | 0.991 | 0.068 | |
| Non-Sustainable Banks | ||||||
| Input-Oriented | CCR | 0.490 | 1.000 | 0.659 | 0.629 | 0.128 |
| BCC | 0.497 | 1.000 | 0.748 | 0.720 | 0.152 | |
| Scale | 0.588 | 1.000 | 0.890 | 0.907 | 0.098 | |
| Output-Oriented | CCR | 0.490 | 1.000 | 0.659 | 0.629 | 0.128 |
| BCC | 0.510 | 1.000 | 0.759 | 0.739 | 0.144 | |
| Scale | 0.588 | 1.000 | 0.875 | 0.877 | 0.095 |
Table 4.
Statistics summary of cumulated productivity changes of sustainable and non-sustainable banks.
Table 4.
Statistics summary of cumulated productivity changes of sustainable and non-sustainable banks.
| Sustainable Banks | Min | Max | Mean | Median | |
|---|---|---|---|---|---|
| TEC | 0.787 | 1.098 | 0.960 | 1.000 | 0.072 |
| TC | 0.859 | 1.355 | 1.074 | 1.076 | 0.085 |
| TFP | 0.830 | 1.355 | 1.030 | 1.023 | 0.103 |
| Non-Sustainable Banks | |||||
| TEC | 0.838 | 1.132 | 1.000 | 1.000 | 0.040 |
| TC | 0.956 | 1.034 | 0.992 | 0.991 | 0.016 |
| TFP | 0.867 | 1.111 | 0.991 | 0.989 | 0.035 |
Table 5.
Statistics summary of total factor productivity (TFP) of sustainable and non-sustainable banks.
Table 5.
Statistics summary of total factor productivity (TFP) of sustainable and non-sustainable banks.
| Sustainable Banks | Min | Max | Mean | Median | |
|---|---|---|---|---|---|
| 2010–2011 | 0.968 | 1.186 | 1.022 | 1.008 | 0.051 |
| 2011–2012 | 0.604 | 1.220 | 0.967 | 0.969 | 0.101 |
| 2012–2013 | 0.489 | 1.650 | 1.003 | 1.018 | 0.173 |
| 2013–2014 | 0.855 | 1.195 | 1.035 | 1.036 | 0.078 |
| 2014–2015 | 0.542 | 1.266 | 0.985 | 0.995 | 0.112 |
| 2015–2016 | 0.714 | 1.645 | 1.020 | 1.002 | 0.172 |
| 2016–2017 | 0.741 | 1.366 | 1.039 | 1.031 | 0.118 |
| 2017–2018 | 0.747 | 1.152 | 0.978 | 0.974 | 0.086 |
| Non-Sustainable Banks | |||||
| 2010–2011 | 0.631 | 1.238 | 0.995 | 0.998 | 0.065 |
| 2011–2012 | 0.827 | 1.807 | 0.994 | 0.982 | 0.099 |
| 2012–2013 | 0.510 | 2.321 | 1.023 | 1.013 | 0.132 |
| 2013–2014 | 0.395 | 1.725 | 0.979 | 0.973 | 0.116 |
| 2014–2015 | 0.576 | 2.602 | 1.003 | 0.999 | 0.141 |
| 2015–2016 | 0.412 | 1.755 | 0.994 | 0.987 | 0.124 |
| 2016–2017 | 0.562 | 3.873 | 1.014 | 0.994 | 0.237 |
| 2017–2018 | 0.284 | 4.788 | 1.025 | 1.012 | 0.275 |
Table 6.
Statistics summary of technical efficiency change (TEC) over the period of sustainable and non-sustainable banks.
Table 6.
Statistics summary of technical efficiency change (TEC) over the period of sustainable and non-sustainable banks.
| Sustainable Banks | Min | Max | Mean | Median | |
|---|---|---|---|---|---|
| 2010–2011 | 0.898 | 1.054 | 0.995 | 1.000 | 0.030 |
| 2011–2012 | 0.633 | 1.257 | 0.981 | 0.985 | 0.093 |
| 2012–2013 | 0.848 | 1.684 | 1.032 | 1.000 | 0.144 |
| 2013–2014 | 0.784 | 1.109 | 0.979 | 1.000 | 0.067 |
| 2014–2015 | 0.849 | 1.342 | 1.029 | 1.006 | 0.087 |
| 2015–2016 | 0.679 | 1.415 | 0.993 | 1.000 | 0.122 |
| 2016–2017 | 0.771 | 1.346 | 1.005 | 1.000 | 0.092 |
| 2017–2018 | 0.777 | 1.158 | 0.970 | 0.983 | 0.076 |
| Non-Sustainable Banks | |||||
| 2010–2011 | 0.634 | 1.238 | 1.006 | 1.004 | 0.066 |
| 2011–2012 | 0.649 | 1.653 | 0.863 | 0.857 | 0.110 |
| 2012–2013 | 0.616 | 2.092 | 1.218 | 1.224 | 0.186 |
| 2013–2014 | 0.466 | 1.794 | 0.923 | 0.910 | 0.120 |
| 2014–2015 | 0.585 | 1.592 | 0.968 | 0.962 | 0.109 |
| 2015–2016 | 0.663 | 1.668 | 1.022 | 1.021 | 0.114 |
| 2016–2017 | 0.340 | 1.862 | 0.991 | 1.012 | 0.136 |
| 2017–2018 | 0.643 | 2.435 | 1.082 | 1.027 | 0.190 |
Table 7.
Statistics summary of technical change (TC) over time of sustainable and non-sustainable banks.
Table 7.
Statistics summary of technical change (TC) over time of sustainable and non-sustainable banks.
| Sustainable Banks | Min | Max | Mean | Median | |
|---|---|---|---|---|---|
| 2010–2011 | 0.978 | 1.186 | 1.028 | 1.010 | 0.053 |
| 2011–2012 | 0.790 | 1.220 | 0.987 | 0.996 | 0.067 |
| 2012–2013 | 0.489 | 1.052 | 0.971 | 0.995 | 0.102 |
| 2013–2014 | 0.922 | 1.138 | 1.057 | 1.064 | 0.040 |
| 2014–2015 | 0.542 | 1.026 | 0.957 | 0.972 | 0.079 |
| 2015–2016 | 0.714 | 1.189 | 1.026 | 1.009 | 0.087 |
| 2016–2017 | 0.909 | 1.366 | 1.033 | 1.019 | 0.072 |
| 2017–2018 | 0.848 | 1.143 | 1.009 | 1.017 | 0.045 |
| Non-Sustainable Banks | |||||
| 2010–2011 | 0.890 | 1.036 | 0.989 | 0.999 | 0.026 |
| 2011–2012 | 0.928 | 1.520 | 1.160 | 1.149 | 0.100 |
| 2012–2013 | 0.606 | 1.350 | 0.853 | 0.830 | 0.118 |
| 2013–2014 | 0.668 | 1.267 | 1.065 | 1.077 | 0.085 |
| 2014–2015 | 0.870 | 1.634 | 1.037 | 1.048 | 0.070 |
| 2015–2016 | 0.622 | 1.755 | 0.974 | 0.963 | 0.085 |
| 2016–2017 | 0.891 | 2.220 | 1.032 | 0.970 | 0.193 |
| 2017–2018 | 0.442 | 2.363 | 0.955 | 0.985 | 0.151 |
Table 8.
Difference in means and difference in medians.
| Difference in Means | Sustainable | Non-Sustainable | Difference | T-Statistis | p-Value | |
|---|---|---|---|---|---|---|
| Banks | Banks | |||||
| Technical Efficiency | Mean | 0.908 | 0.659 | 0.249 | 11.149 | 0.000 |
| Standard Deviation | 0.840 | 0.128 | ||||
| Pure Technical Efficiency | Mean | 0.949 | 0.748 | 0.201 | 7.772 | 0.000 |
| Standard Deviation | 0.069 | 0.152 | ||||
| Scale Efficiency | Mean | 0.958 | 0.896 | 0.062 | 13.977 | 0.000 |
| Standard Deviation | 0.068 | 0.098 | ||||
| Productivity | Mean | 1.030 | 0.991 | 0.039 | 0.334 | 0.739 |
| Standard Deviation | 0.112 | 0.149 | ||||
| Difference in Medians | ||||||
| Technical Efficiency | Median | 0.918 | 0.739 | |||
| Pure Technical Efficiency | Median | 0.938 | 0.739 | |||
| Scale Efficiency | Median | 0.983 | 0.969 | |||
| Productivity | Median | 1.003 | 0.996 |
Table 9.
The results of comparative analysis of the malmquist indexes.
| Category | Index | p-Value | ||
|---|---|---|---|---|
| Region | ||||
| Technical Efficiency | 0.02 | Asia | 7 | |
| Pure Technical Efficiency | 0.07 | Europe | 13 | |
| Scale Efficiency | 0.59 | North America | 5 | |
| Total Factor Productivity | 0.53 | South America | 8 | |
| Technical Efficiency Change | 0.41 | |||
| Technical Change | 0.42 | |||
| Specialization | ||||
| Technical Efficiency | 0.471 | Commercial Banks | 24 | |
| Pure Technical Efficiency | 0.647 | Banks and Holding Companies | 8 | |
| Scale Efficiency | 0.477 | Investment & Trust corporation | 1 | |
| Total Factor Productivity | 0.000 | |||
| Technical Efficiency Change | 0.783 | |||
| Technical Change | 0.000 | |||
| Region | ||||
| Technical Efficiency | 0.000 | Asia | 119 | |
| Pure Technical Efficiency | 0.000 | Europe | 90 | |
| Scale Efficiency | 0.900 | North America | 5 | |
| Total Factor Productivity | 0.610 | South America | 1 | |
| Technical Efficiency Change | 0.839 | |||
| Technical Change | 0.019 | |||
| Specialization | ||||
| Technical Efficiency | 0.003 | Commercial Banks | 191 | |
| Pure Technical Efficiency | 0.000 | Banks and Holding Companies | 17 | |
| Scale Efficiency | 0.039 | Investment & Trust corporation | 7 | |
| Total Factor Productivity | 0.000 | |||
| Technical Efficiency Change | 0.000 | |||
| Technical Change | 0.000 |
© 2019 by the authors. Licensee MDPI, Basel, Switzerland. This article is an open access article distributed under the terms and conditions of the Creative Commons Attribution (CC BY) license (http://creativecommons.org/licenses/by/4.0/).
Share and Cite
MDPI and ACS Style
Shah, A.A.; Wu, D.; Korotkov, V. Are Sustainable Banks Efficient and Productive? A Data Envelopment Analysis and the Malmquist Productivity Index Analysis. Sustainability 2019, 11, 2398. https://doi.org/10.3390/su11082398
AMA Style
Shah AA, Wu D, Korotkov V. Are Sustainable Banks Efficient and Productive? A Data Envelopment Analysis and the Malmquist Productivity Index Analysis. Sustainability. 2019; 11(8):2398. https://doi.org/10.3390/su11082398
Chicago/Turabian StyleShah, Akber Aman, Desheng Wu, and Vladmir Korotkov. 2019. "Are Sustainable Banks Efficient and Productive? A Data Envelopment Analysis and the Malmquist Productivity Index Analysis" Sustainability 11, no. 8: 2398. https://doi.org/10.3390/su11082398
Note that from the first issue of 2016, this journal uses article numbers instead of page numbers. See further details here.