The Use of Artificial Intelligence as a Tool Supporting Sustainable Development Local Policy
by
 , , , and
Maria Mrówczyńska
1 ,
,
Małgorzata Sztubecka
2,
Marta Skiba
1,*,
Anna Bazan-Krzywoszańska
1 and
Przemysław Bejga
3 1
Institute of Civil Engineering, Faculty of Civil Engineering, Architecture and Environmental Engineering, University of Zielona Góra, u1 Prof. Z. Szafrana 1, 65-516 Zielona Góra, Poland
2
Faculty of Civil and Environmental Engineering and Architecture, UTP University of Science and Technology in Bydgoszcz, Al. Prof. S. Kaliskiego 7, 85-796 Bydgoszcz, Poland
3
Department of Pharmakology and Toxicology, Faculty of Medicine and Health Sciences, University of Zielona Góra, ul. Zyty 28, 65-046 Zielona Góra, Poland
*
Author to whom correspondence should be addressed.
Sustainability 2019, 11(15), 4199; https://doi.org/10.3390/su11154199
Submission received: 31 May 2019
/
Revised: 31 July 2019
/
Accepted: 1 August 2019
/
Published: 3 August 2019
(This article belongs to the Special Issue Socio-Environmental Vulnerability Assessment for Sustainable Management)
Abstract
:This paper addresses the problem of noise in spa protection areas. Its aim is to determine the delimitation of the areas that exceed a permissible noise level around the sanatorium on the example of a health resort in Inowrocław. The determination of the exceedance of permissible noise levels allows us to develop directly effective local policy tools to be included in planning documents. In order to reduce noise infiltration, it is important to define environmental priorities. Taking into account their impact on the health of users in the protection area, environmental priorities enable us to introduce additional elements to street architecture. In order to properly manage space, in accordance with the idea of sustainable development, zones of environmental sensitivity—and their socio-environmental vulnerability—have been designated for assessing damage (exceeding permissible noise in health facilities) and defining methods of building resilience (proper management). This has provided the basis for a natural balance optimized for the people living in these areas. To achieve the goal above, non-linear support vector machine (SVM) networks were used. This technique allows us to classify the linearly inseparable data and to determine the optimal separation margin. The boundaries of the areas which exceeded permissible noise levels (separation margin) were estimated on the basis of noise pollution maps, created by means of the SVM technique. Thus, the study results in establishing buffer zones where it is possible to use varied land utilization in terms of form and function, as described in the planning documents. Such an activity would limit the spread of noise.
1. Introduction
The effect of environmental factors on human health is inevitable. Among health-affecting factors, quite important are the physical factors of diverse nature: water, soil or air pollution [1]. Increasingly, noise is being mentioned as air pollution caused by energy. Energy propagating in the air takes the form of acoustic waves that are divided by frequency into ultrasound, audible sounds, and infrasound [2]. Noise is an undesirable, unpleasant, cumbersome, oppressive or harmful sound of excessive intensity affecting the organ of hearing, the other senses and other parts of the body or the whole body [3,4,5,6,7]. Proper development of the acoustic environment is based on the formation of acoustic conditions so that they are optimal from the point of view of health and human activities. Each person is characterized by an individual reception of sounds. It is the sensitivity on noise. To get to know this sensitivity it is important to properly manage and recognize social, environmental and health vulnerabilities. “Noise sensitivity” is defined as an individual and increased probability of perceiving sounds as unpleasant [8,9,10,11]. Moreover, getting used to excessive noise levels causes indifference, which is caused by exposure to a hazardous situation [12,13,14,15,16].
Noise can be characterized by its source (e.g., anthropogenic or natural causes) or by specific physical values, such as power, intensity, frequency or duration. It should be noted that its relevant parameters refer not only to strictly objective values considered to be unpleasant or harmful but also, to the same extent, to the places where common sounds will cause unwanted or disturbing effects [17,18,19]. Organized urban spaces are treated like resources directly used by local residents. The conditions of these spaces decide also on the possibilities for creating a proper base for planners who, to a greater or lesser degree, introduce quantitative and qualitative changes in the area [20,21].
It is important then, to analyze the acoustic situation. The determination of physical parameters such as density, open spaces, their shape, the greenery and the location of the buildings has a significant effect on the noise spread in the environment [18,22]. Maps are a good tool for showing the noise distribution in the area. It is accepted in the literature that an acoustic space map can contain three different topics: a sound sources map, a map of psychoacoustic perception and a noticeable quality of sound environment [23,24,25,26,27,28,29,30]. A map of sound sources provides information on the different types of noise, including positive ones. Liu developed a map of perception of sound sources based on their spatial-temporal variation [27,28]. He qualified the sources as anthropological, biological and geographical, and showed that they are characteristic of urban landscapes and depend on their composition.
Yerli and Demir, by examining seasonal variation of noise, identified the possibility of noise reduction by greenery up to 20 dB [31]. The researchers showed the dependence of the noise level on the time of year and the time of day (daytime noise for the spring–summer is higher by 4 dB). Independently, the researchers demonstrated a relationship between the size of the paved surface (passageways) in green areas and the noise level. The impact of the characteristics of the acoustic properties of surface material used for paths on the feeling of annoyance caused by noise (perception of background factor) was also described by Vlahov [32].
Urban noise pollution is gradually increasing, mainly because of rapid industrialization and urbanization. A number of studies and reports refer to the fact that noise affects physiological and mental health [33,34] and sound space is considered to be a key factor in creating a healthy city [35,36,37]. According to the World Health Organization, health is defined as a state of complete physical, mental, and social well-being and not merely the absence of disease or infirmity. Particular attention should be paid to the importance of recreational and health areas due to their tasks [38]. In these areas, the noise level should be as low as possible, close to natural background levels. In Polish law spas have the lowest values of equivalent sound level. The highest permissible value is 50 dB during the day, whereas other areas have 68 dB. The Directive 2002/49/EC of the European Parliament and of the Council of 25 June 2002 relating to the assessment and management of environmental noise, indicates that it is necessary to adopt common methods to assess “environmental noise” and the definition of “limit values”, in terms of harmonized indicators for the determination of noise levels. The harmful effects of noise on the human body is a complex issue and it is related to a number of its space activities. In the assessment of nuisance sounds, an indicator LAeq was used, which refers to the measured noise value at the specific time of the measurement. The obtained results show the current acoustic climate characteristic for a certain area [22,29]. The research presents on noise and its effects on human health. The results are a good output model for the extrapolation of health effects and attempts to define them in different periods of activity. The aim is the sustainable creation of such vulnerable spaces, especially in terms of noise protection. Thus, the research question is how to monitor noise in spa areas and how to counteract its spread.
Environmental noise depends on land development and usage. This paper presents, for the first time, zones, within one park, where various development and land use should be conducted. Usually, the area of the spa park is treated homogeneously. We propose to distinguish zoning and utilization zones and introduce various limitations in zones. This is necessary due to the fact that noise sources are internal and result from the intensity of use. Many studies deal with environmental noise research, most often regarded as a linear source. We use support vector machine (SVM) networks, which gives the possibility to determine zones depending on many sources of noise and the need to protect the acoustic climate of the protected space [39]. The residents and spa patients and also the inhabitants of Inowrocław, who use the attractions of the health spa, are the sources of noise in the spa area. The source of noise is, therefore, internal, anthropological, and the prevention of its spread will be supported by creating separated areas with controlled absorbency.
Mathematical multi-criteria optimization methods are usually used to plan the reduction of the impact of noise coming from various sources such as road and rail transport, construction and operations, or resulting from human life. In addition, they are based on many purposes [40,41,42,43]. In this way, an attempt is made to reduce the impact of noise along with optimizing the costs of decisions and possible implementation. The use of the support vector machine, a technique to determine the areas based on the noise measurements in spatial planning, is also new. The SVM algorithm is widely used in solving data classification problems [44,45], object recognition [46], in technical, engineering and environmental applications [47] and in medical diagnostics [48,49]. An interesting application is the use of the SVM algorithm to model ship maneuvering movements to mitigate the impact of noise problems [50]. The SVM is characterized by strong theoretical foundations based on statistics. Its modern form was developed by Vapnik and discussed in detail in [51]. The SVM technique has been gaining more and more popularity in recent years and it is still prevailing in line with the currently used trends in scientific research on the use of artificial intelligence methods.
Its application primarily solves problems of linear and non-linearly separable data classification [52,53,54], detects and identifies failures and errors in various systems [55,56], and assesses risk in various branches of the economy [57,58]. In this paper, the range of special zone development in the spa areas was determined by means of the SVM technique. Simultaneously, ways of developing the area in order to reduce noise spread were proposed.
2. Materials and Methods
2.1. Research Object
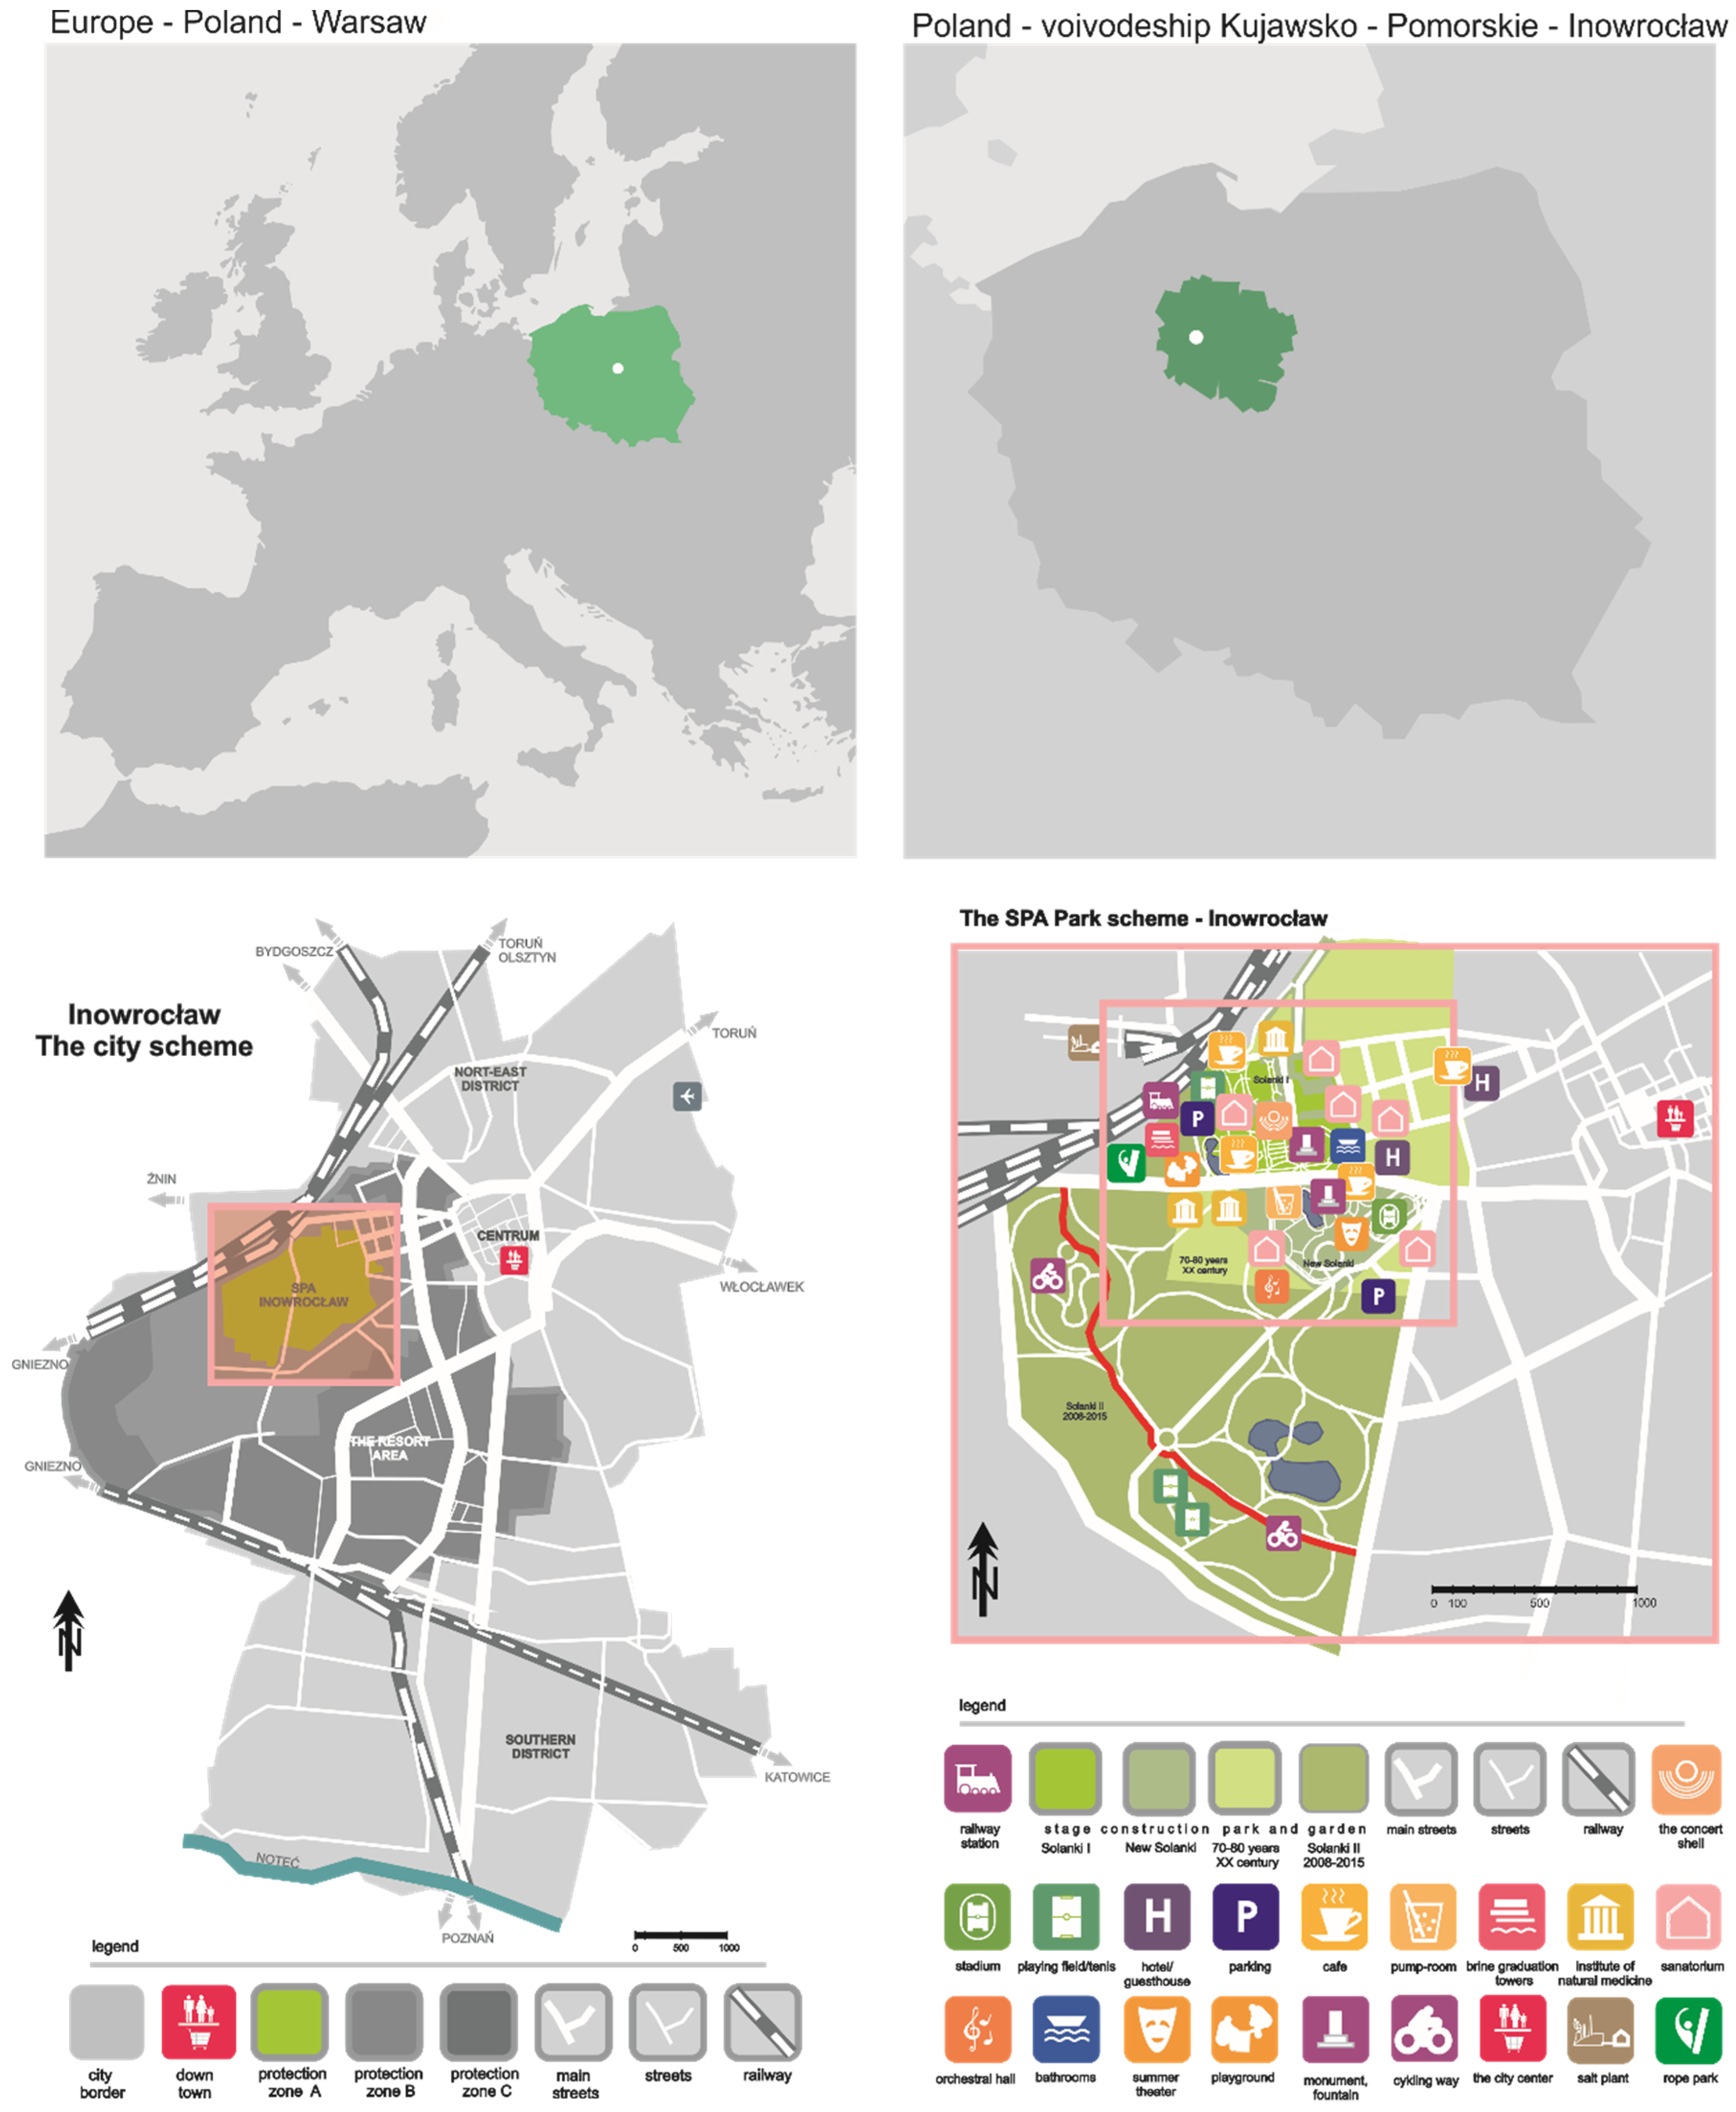
Inowrocław is a city in the northern-west part of Poland, located in Kuyavia-Pomerania province. It is one of 46 health resorts in Poland and it currently functions as:
- a large settlement,
- an industrial-economic and service center of a regional importance,
- an important railway junction and a significant road transport hub,
- a vocational education center,
- a health resort with a separate spa (Figure 1)
The spa function completes urban functions and generates income.
The lowland spa in Inowrocław was founded in 1875. Initially, the Health Spa and Resort (Solanki I) covered the area of 5 ha. At present, its area is approximately 85 ha. The arrangement of the Health Spa takes patients’ comfort into account most of all. There, one can find numerous walking alleys, pedestrian zones and leisure areas with gazebos, brine graduation towers, mineral water drinking sites, spa houses, natural medicine institutes and other objects of public interest.
The intention of health resorts is to provide an atmosphere supporting medical treatment. Therefore, the spatial layout of health resorts should have elements unique to these types of areas. The basis is a natural therapy complex, around which the parkland is located, often of a great value due to its composition, aesthetic and cultural features. Moreover, organizing social life and entertainment plays an important role in health resorts. Most of the noise in such a type of areas is associated with human activities [59].
2.2. The Measurement of an Equivalent Sound Level
Sound level measurements were carried out in accordance with Polish legislation (PN—81/N—01306, PN-ISO 1996-1:1999) and were described also in the principles in the statement of the State Inspectorate for Environmental Protection entitled “Methods of measurement of external noise in the environment” with amendments that are adapted to the purposes of this study. Acoustic data were collected with a sampling technique approved by the standard PN-ISO 1996-2:1999 [60]. In this technique, the total duration of the measure was part of the period of reference time, which was chosen to take the variability of noise emissions into account. The measurement points were located so as to best represent the space around health resorts. It was also considered to carry out the noise measurements in conditions not exceeding the following limit values:
- temperature range from −10 °C to 40 °C,
- humidity from 25% to 98%,
- average wind speeds up to 5 m/s,
- atmospheric pressure from 940 hPa to 1060 hPa.
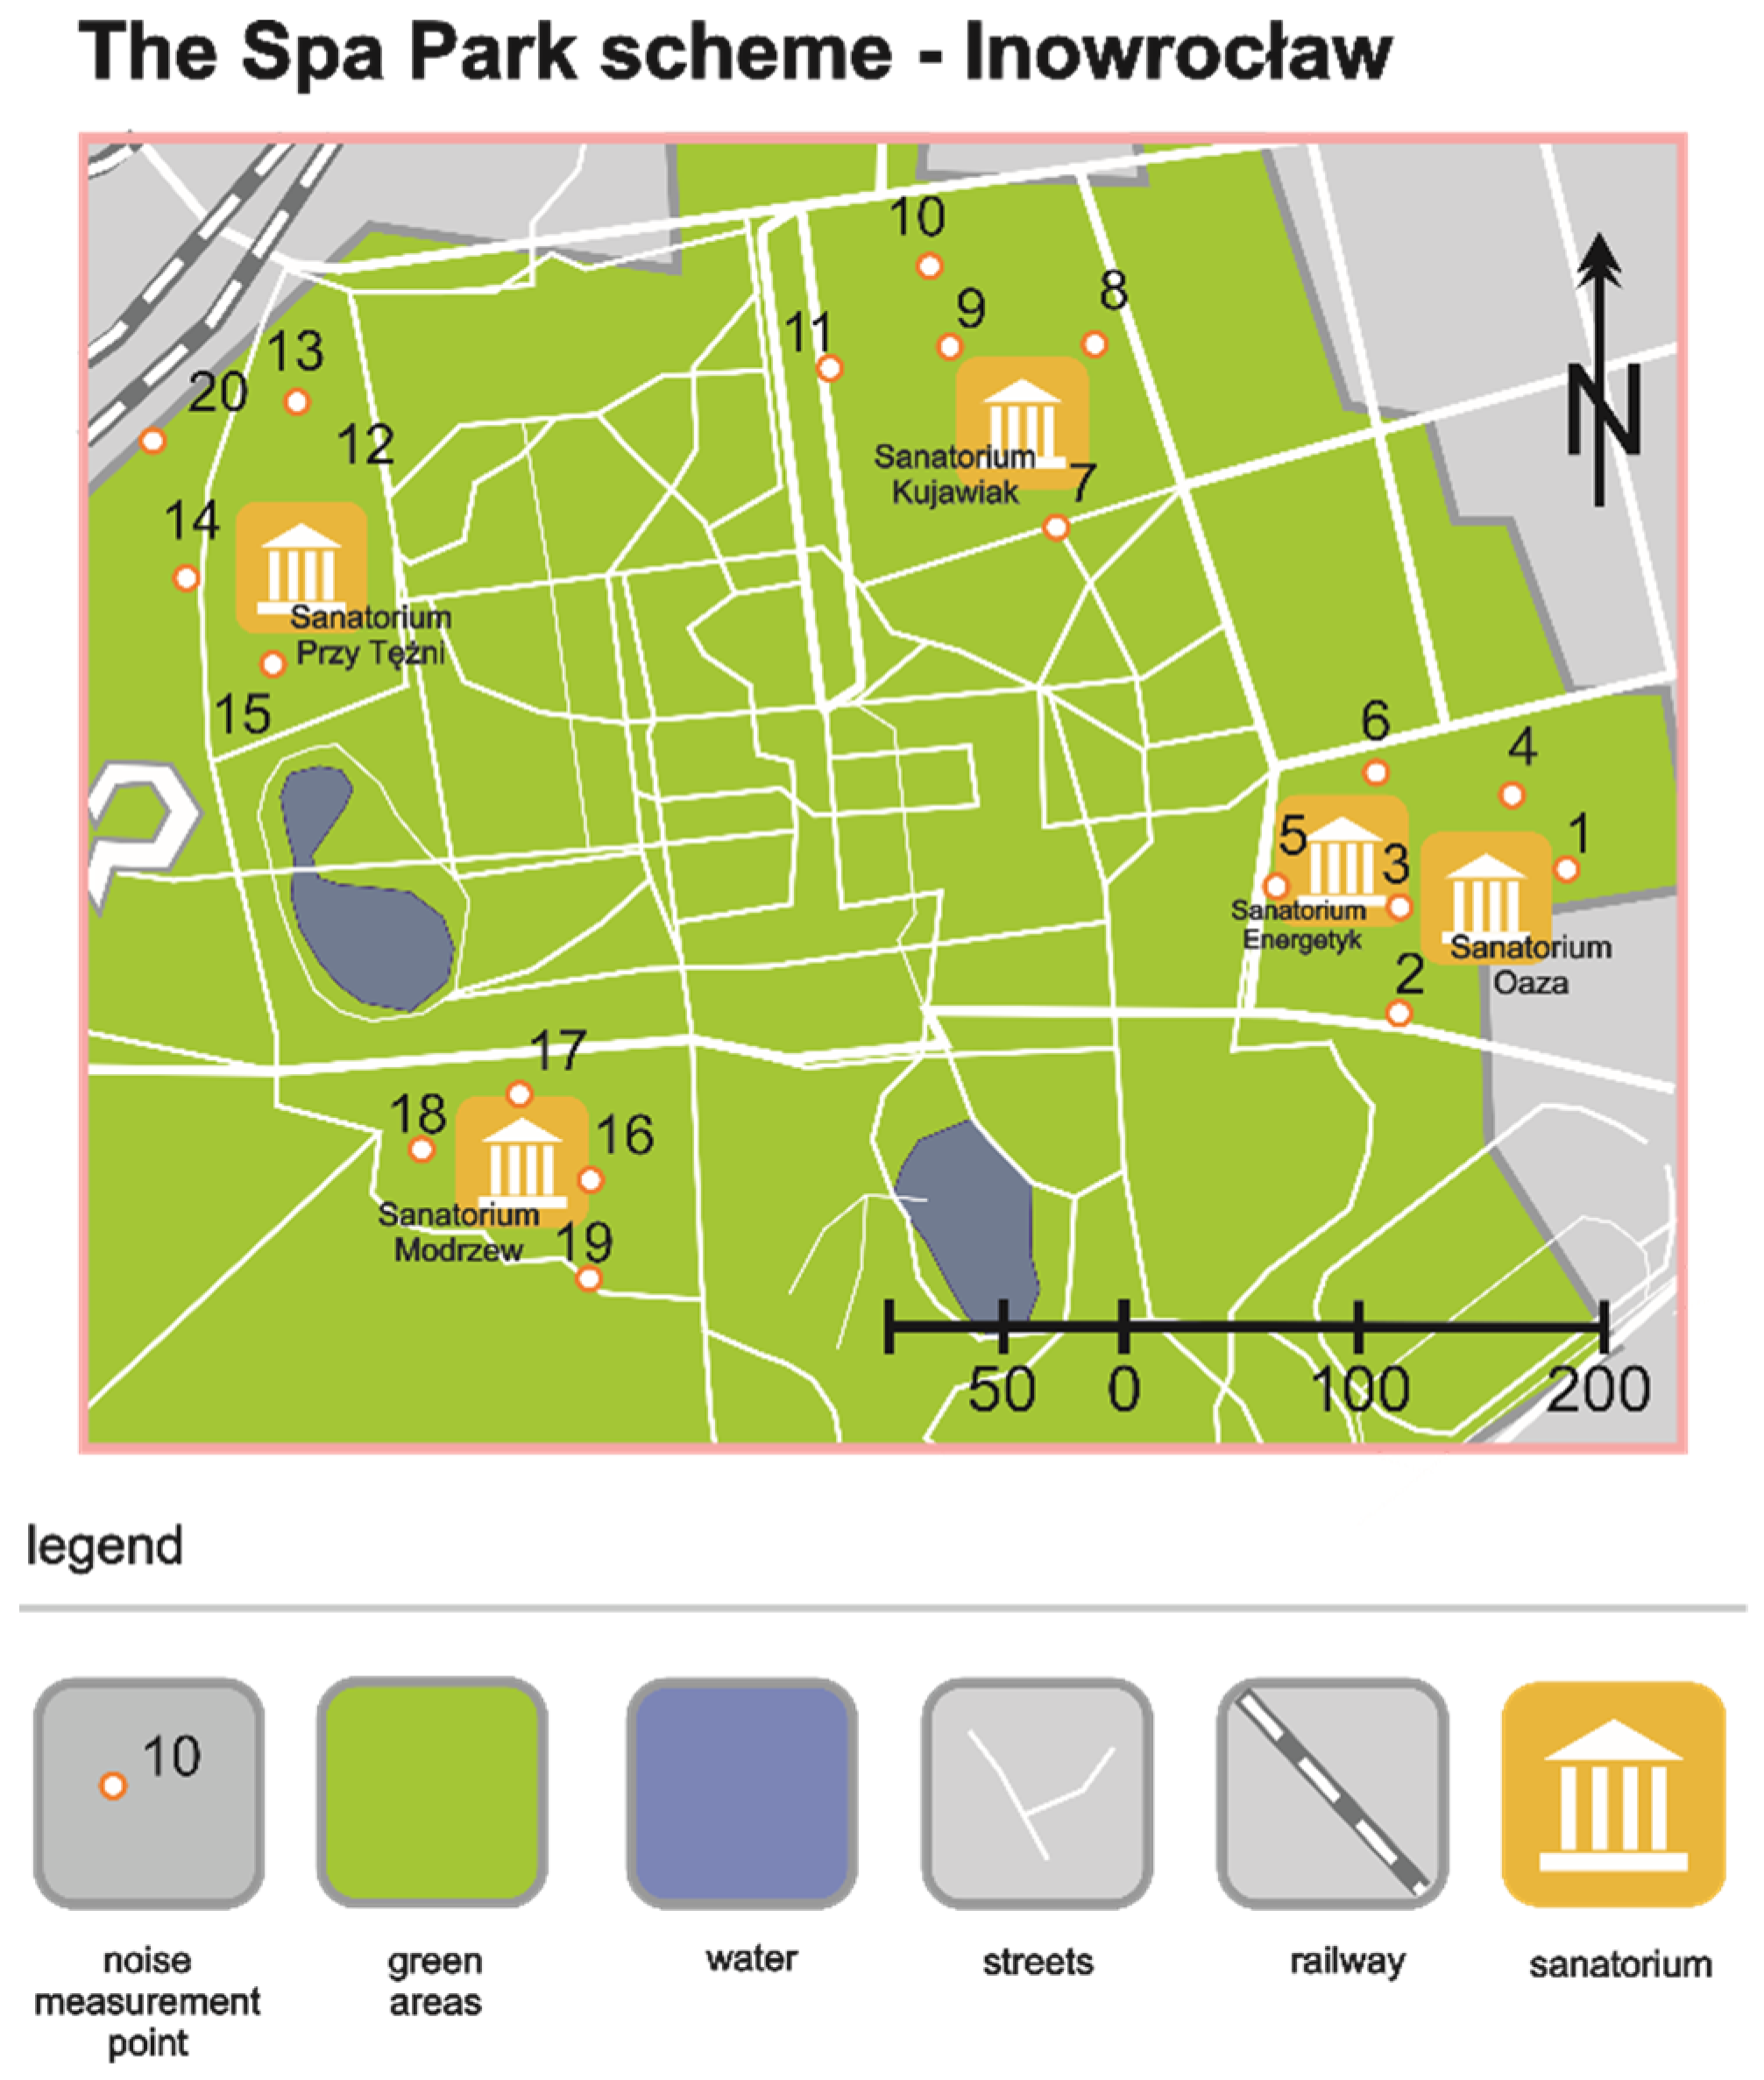
The designated indicator was the equivalent sound level LAeq. The measurements taken into account were the eight least favorable hours for daytime and one least favorable hour at night. The sound level was measured around the spa objects located in A zone of the health resort protection area. The buildings of five sanatoriums are located around the park in its old part. The location of the measurement points is shown in Figure 2, and the value of the measured equivalent sound level is presented in Table 1 and Figure 3.
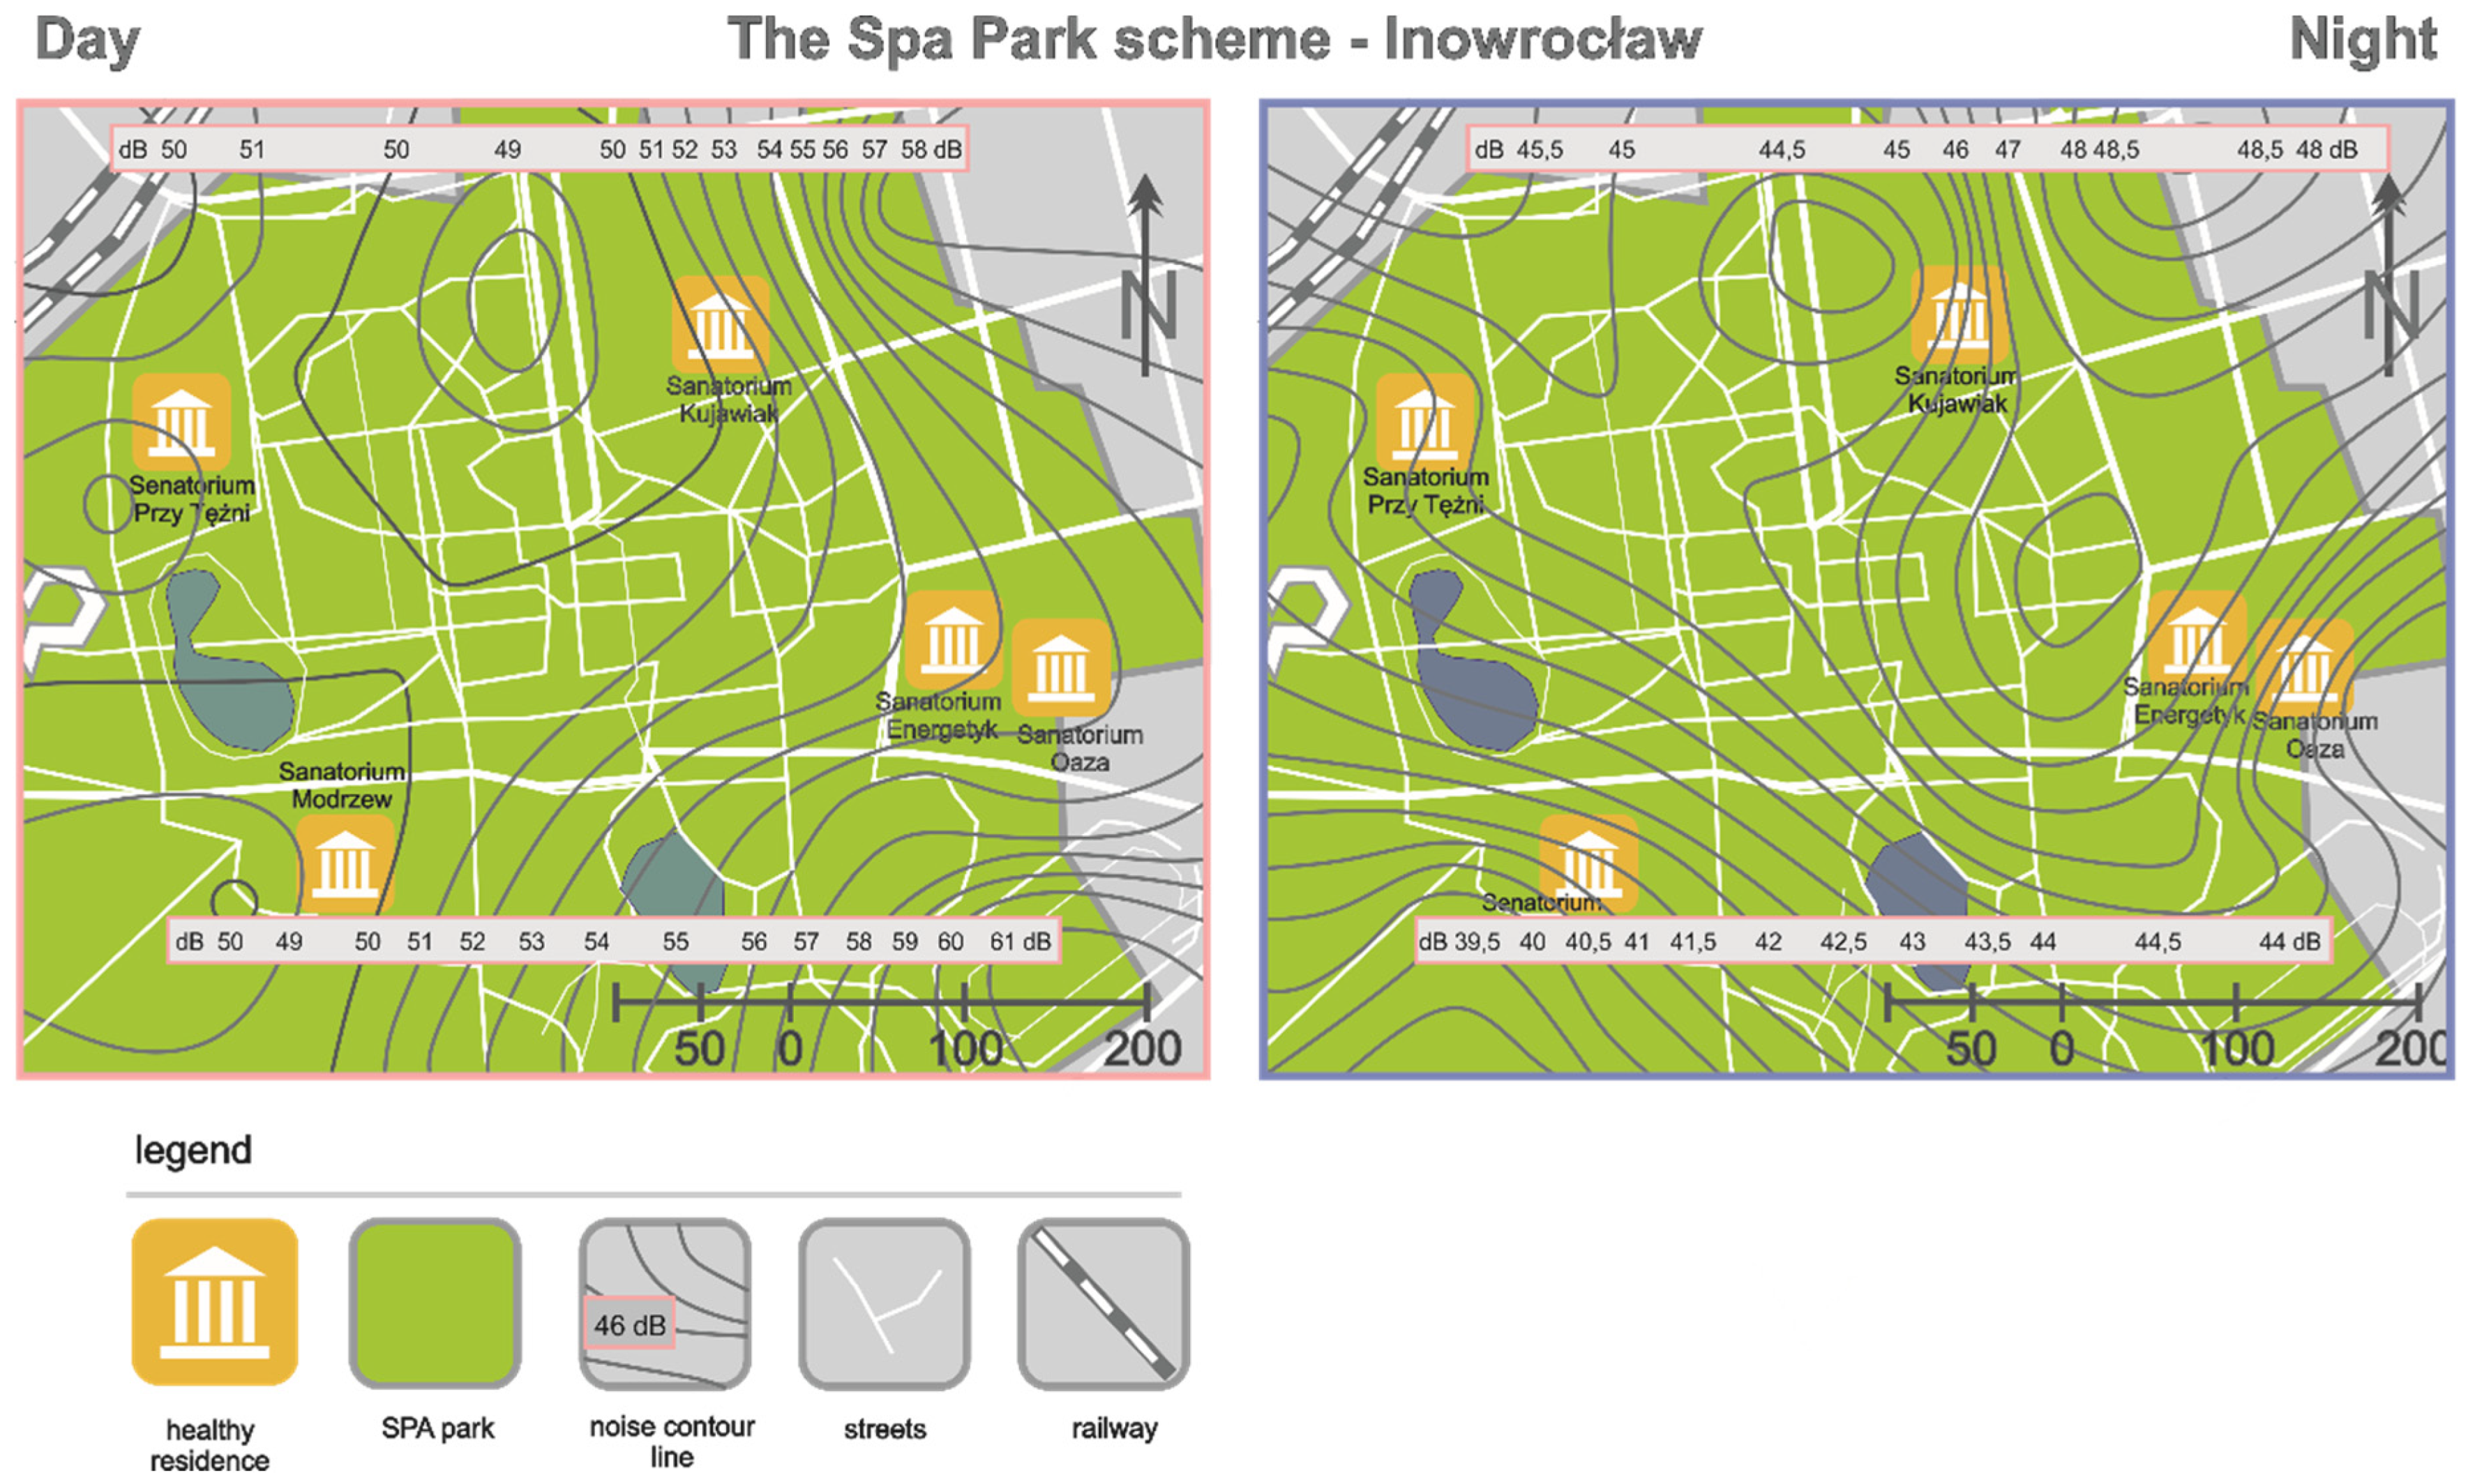
The noise from all observable sources was measured at the designated points. The obtained results show the currently prevailing acoustic conditions of the area (Figure 3—noise contour line).
2.3. The SVM Neural Networks Used to Border the Land Use in Zones
Solutions that use artificial intelligence are more common [61]. The SVM classifiers, called the support vectors network technique, were developed by Vapnik [51]. It is a new approach to building and training a unidirectional network. They usually have a double-layer structure and may use different types of activation functions [62]. SVM networks lack the defects typical of multi-layer perceptron (MLP) networks, that is, the possibility of stopping the process of minimizing in one of many local minima, and network architecture arbitrarily taken at the outset, which its future capacity to generalize depends on.
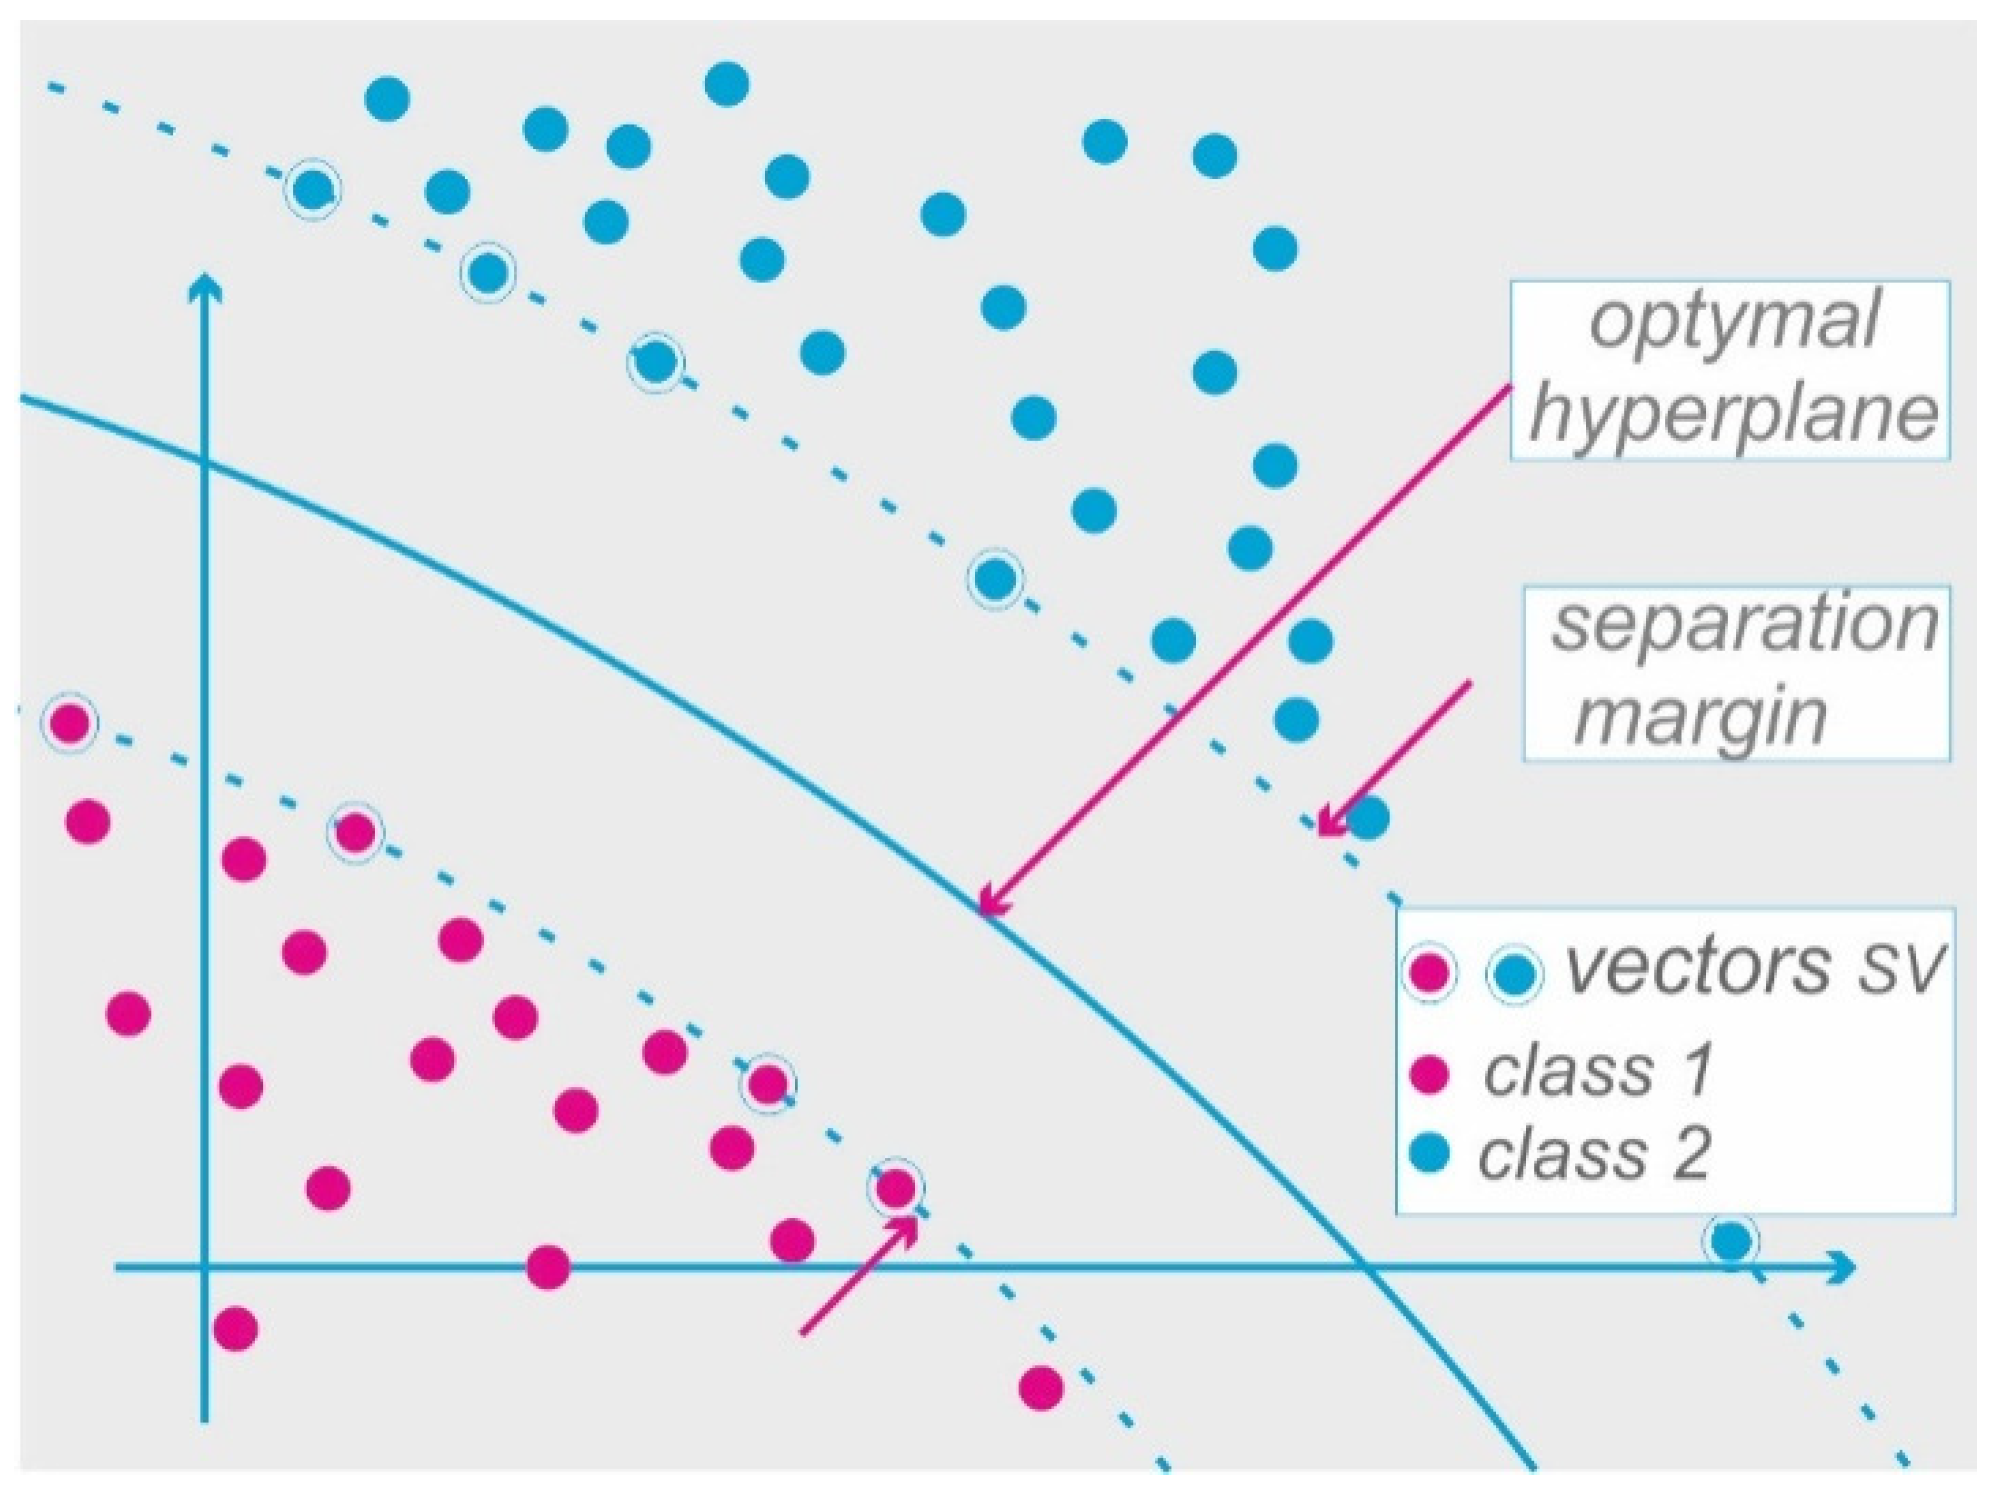
Generally, in the case of linearly separable data, the SVM networks allow us to find a separation hyperplane that separates two classes [61]. In the case of linearly inseparable data, the SVM method can be used to find a hyperplane which classifies objects properly and, at the same time, has the highest possible distance from typical clusters for each class (Figure 4). In the case of linearly inseparable data, using the dimension raise, the SVM method allows us to find a curvilinear separation line with the maximum possible margin. The paper presents the problem of using a non-linear SVM network to classify data which are linearly inseparable, for example, the measurement of sound intensity in the area of Inowrocław health resort.
The essence of the SVM method is the construction of an optimal hyperplane, which separates data belonging to different classes, with a maximum margin of trust (separation margin). The margin of trust shall be understood as the distance of the hyperplane from the nearest points on which support vectors will be formed (Figure 4). The points, where the support vectors are formed, are located close to the hyperplane and define its position. However, at the same time, they are the most difficult to classify. More information about the classification of linearly separable data and methods of building an optimal hyperplane can be found, inter alia, in the following works: [62,63,64,65].
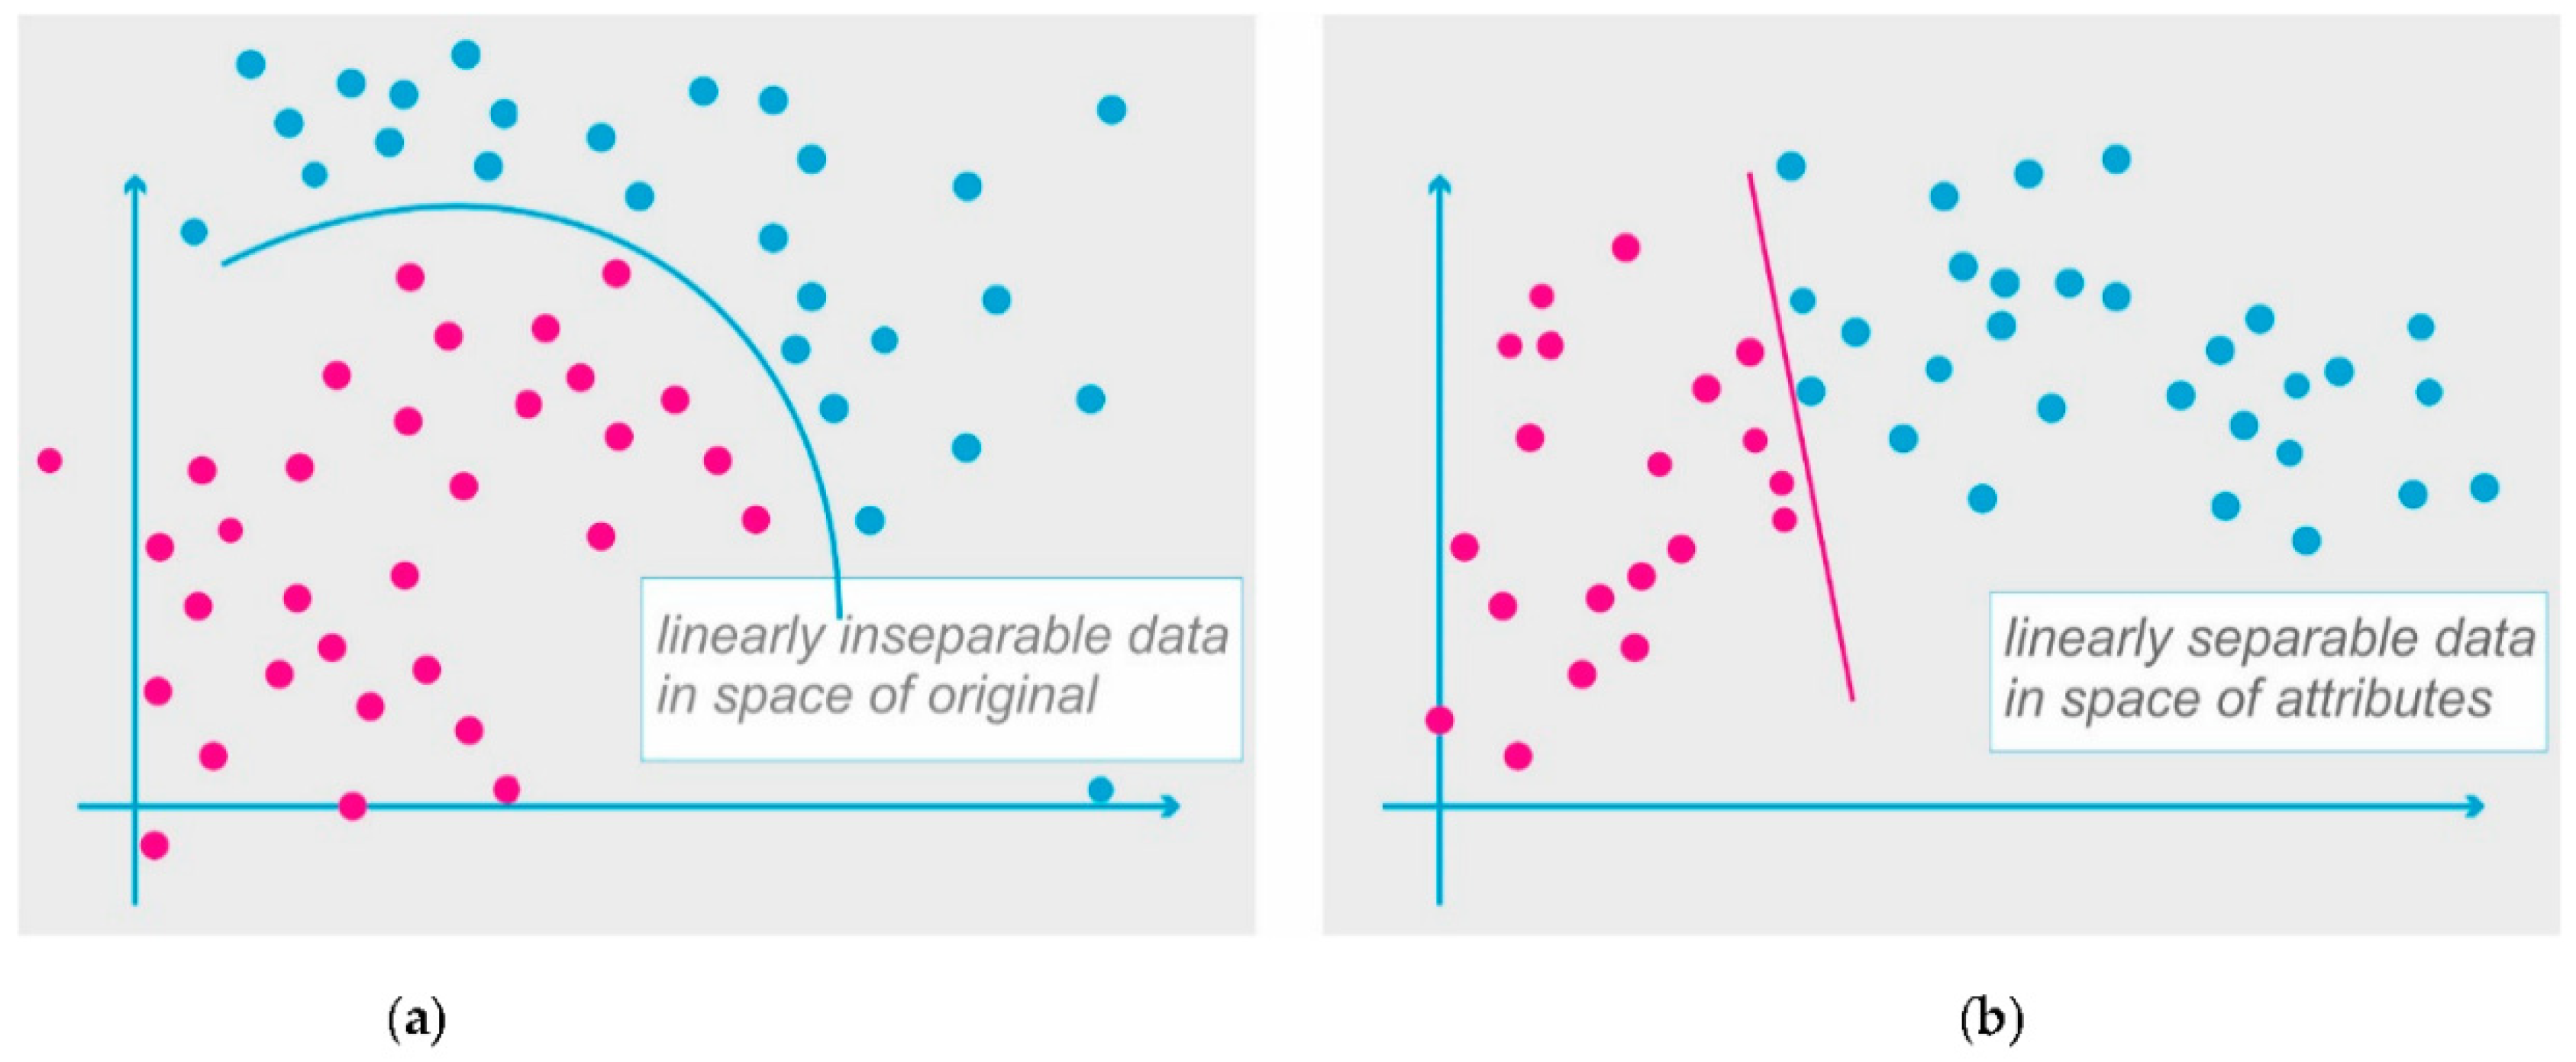
A commonly used solution to classify linearly inseparable data is a projection of the original data to the function space (space of attributes), in which the data are linearly separable with a probability close to 1. Usually, the dimension of the space of attributes-K is a lot larger than the dimension of the space of the original-N, and a carried-out transformation of one space into another is a non-linear transformation [66]. The graphic presentation of the non-linear transformation of the linearly inseparable data is shown in Figure 5a,b. The linearly inseparable data in the two-dimensional space of the original-N (Figure 5a) were transformed to the space of attributes-K (Figure 5b), which is defined with the Gaussian functions (1)
where: —the width of the Gaussian function, —the Gaussian function centers, x—the input vector.
After a non-linear transformation, the data become linearly separable and they can be separated by one separation plane. The location of the class separating hyperplane is determined in the space of attributes (Figure 5b), and in the space of the original, only its picture can be observed (Figure 5a).
Assuming that a set of training pairs is being classified , , in which the required value is equal to 1 or −1 and the input vector is projected in the space of attributes-K, the dimension is represented by a set of attributes , . After the transformation, Equation (2) for hyperspace separating data in the space of attributes shall be recorded as
where: —the weight from a neuron in the hidden layer to the output neuron (Figure 5), b—polarization that specifies the hyperplane location in relation to the origin of a coordination system.
The signal of the output neuron for the network, with the architecture shown in Figure 5, is defined by Equation (3)
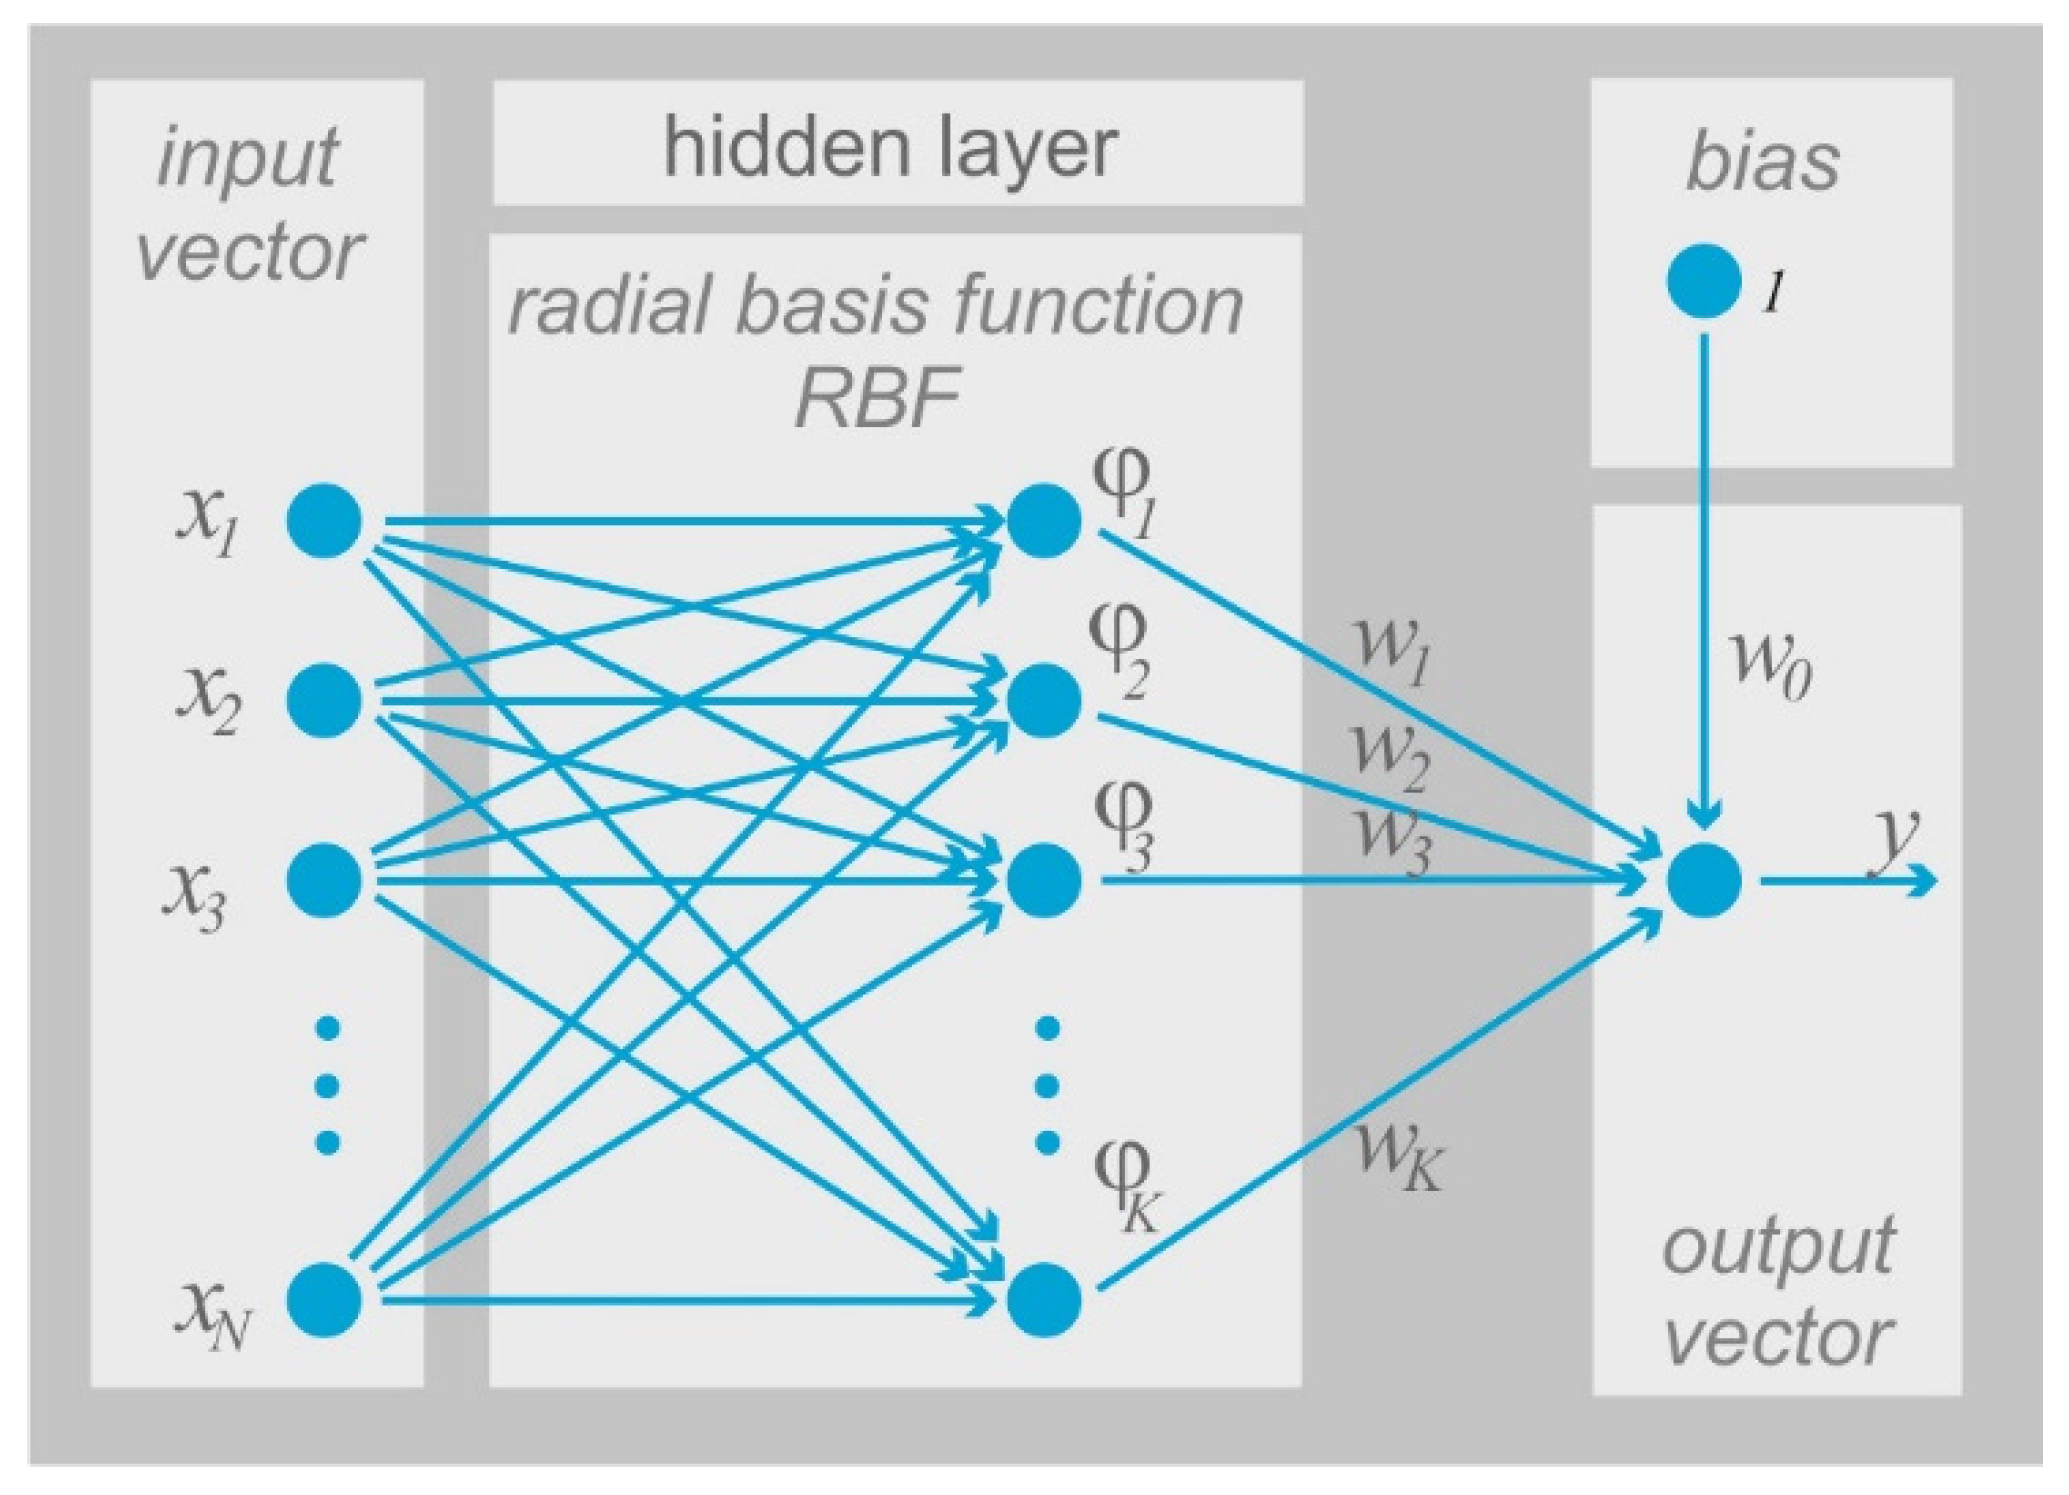
Analyzing the basic structure of the SVM neural network (Figure 6) one will notice that the structure is comparable to that of the radial basis function networks (RBF) and the difference is that the basic functions may take a linear, polynomial, radial or sigmoidal form.
The aim of training the non-linear SVM network is similar to the determination of values of the vector of weights w so as to determine the optimal hyperplane for the linearly inseparable data, which shall minimize the probability of classification error while maintaining the condition of maximizing the separation margin. While classifying the linearly inseparable data, it is necessary to define a non-negative complementary variable , which is needed to reduce the current width of the separation margin. A problem defined this way is referred to as a primary problem [54,55] that shall be noted as (4)
with restrictions (5)
where: C—a parameter is taken arbitrarily by the user.
In the early stages of the non-linear SVM network training, a number of support vectors are usually equal to the number of training data. During the training process, depending on the value of the C parameter (limit value), network complexity is reduced and support vectors are formed for only some of the points. The support vectors are formed on those points for which a condition is fulfilled (6)
It is worth noting that the higher the value of the parameter C, the narrower the separation margin and the smaller the number of support vectors. For small values of the parameter, the C network is approximated in its activity to the linear network, which extends the separation margin.
The output signal (7) of the non-linear SVM network is eventually defined as [39]
where: —the number of the support vectors , which is equal to the number of non-zero Lagrange multipliers, —the kernel function.
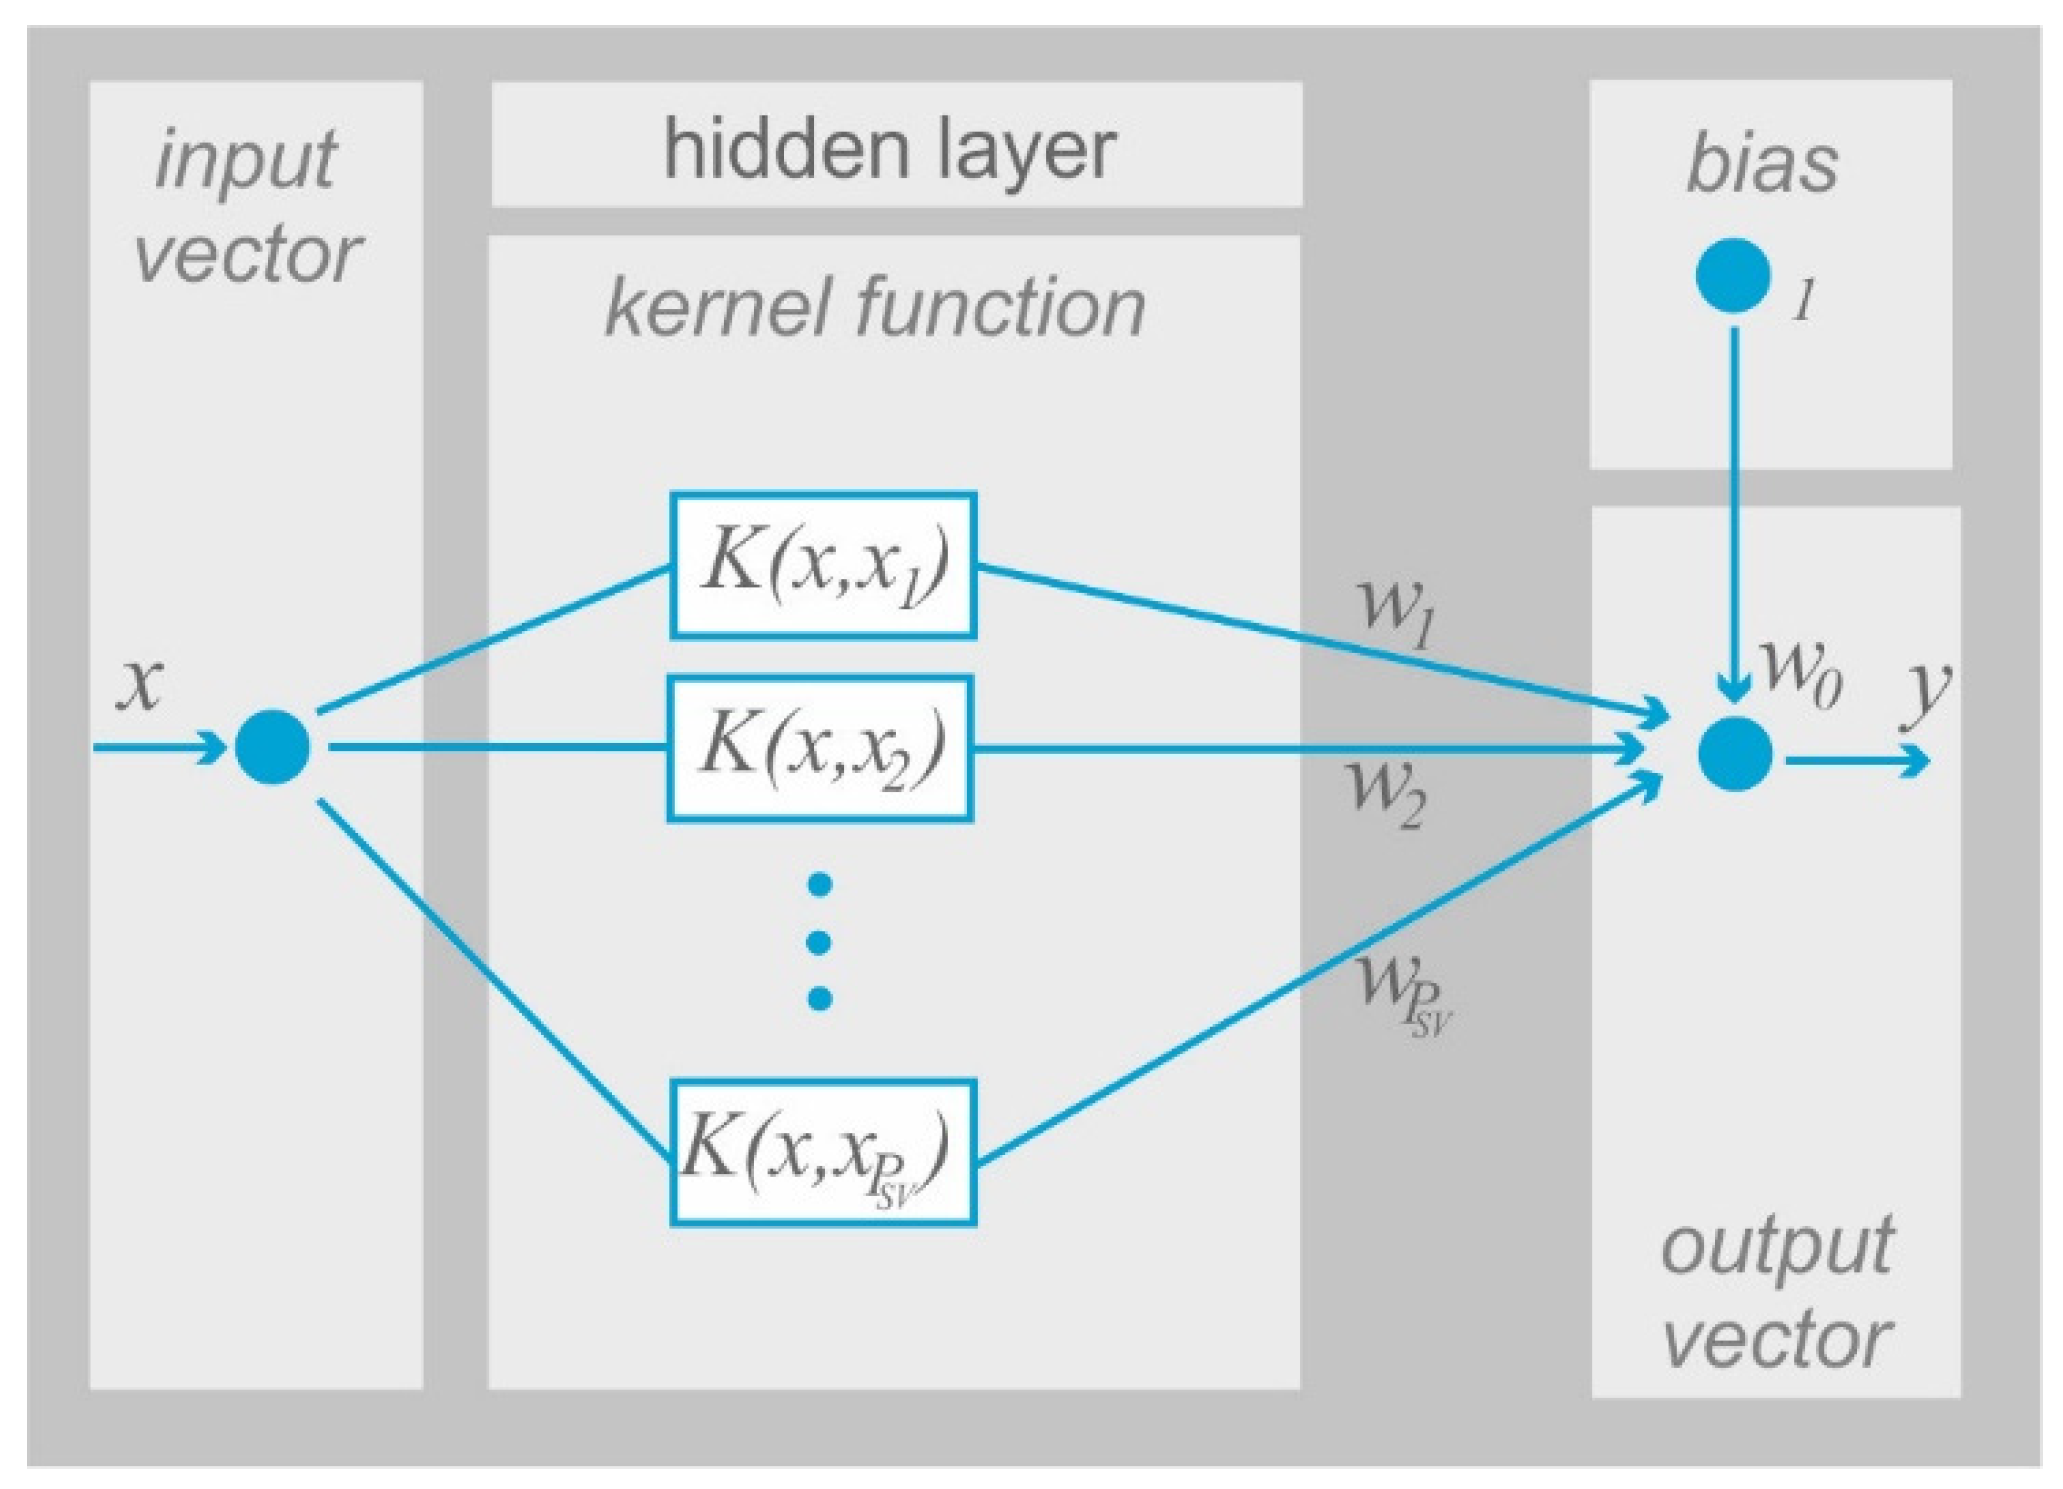
The output signal of the non-linear SVM network depends on the kernel function , not on the base function , as in the case of radial networks. Because of that, it becomes obvious that it is necessary to build a network with the resulting structure shown in Figure 7, whereas the most commonly used kernel functions are presented in Table 2.
If a linear kernel is applied, the built network is fully linear without a hidden layer. The application of a sigmoid function leads to the architecture corresponding to perceptron neural network with one hidden layer. Using the Gaussian function results in a radial basic function network, in which the number of basic functions and their centers is equated with the support vectors. Similarly, in sigmoidal networks, the number of neurons in the hidden layer is determined by the number of the support vectors.
For the tested health spa and resort, the use of SVM led to the designation of isolines of the sound level distribution in the area (Figure 7). This allowed us to distinguish the areas of “acoustic safety” (Figure 7). The task of automatic classification was based on noise intensity measurements. The results, along with the geolocation of the measurement points, were the data that were entered into the input layer. The process of classification and determination of individual zones has been carried out taking into account: the selection of a kernel function type, the selection of network parameters (architecture, C parameter) and the use of weights selection in relation to the chosen network parameters. The values of the signal in the output layer allowed us to qualify the data to appropriate classes.
Besides the distinction, the areas are characterized by an increased sound level which is adverse for users.
3. Results and Discussion
The Health Spa and Resort in Inowrocław displays many features associated with healthcare, entertainment, recreation, and relaxation. Its sound space is formed by all the events taking place there. Special attention should be given to keeping the noise level as low as possible, close to the natural background level [18,67].
In Polish legislation, the acceptable noise level in the daytime and nighttime (other sources of noise—environmental noise) for spa parks (A protection zone), is 45 dB and 40 dB. The measurement of an equivalent sound level in the area of the park for the daytime shows exceeded limit values by 7 dB, while at night the limits are exceeded on average by 4 dB. Noticeable changes in the sound level for a human is a level of 3 dB. So, the above values indicate a significant increase in sound intensity.
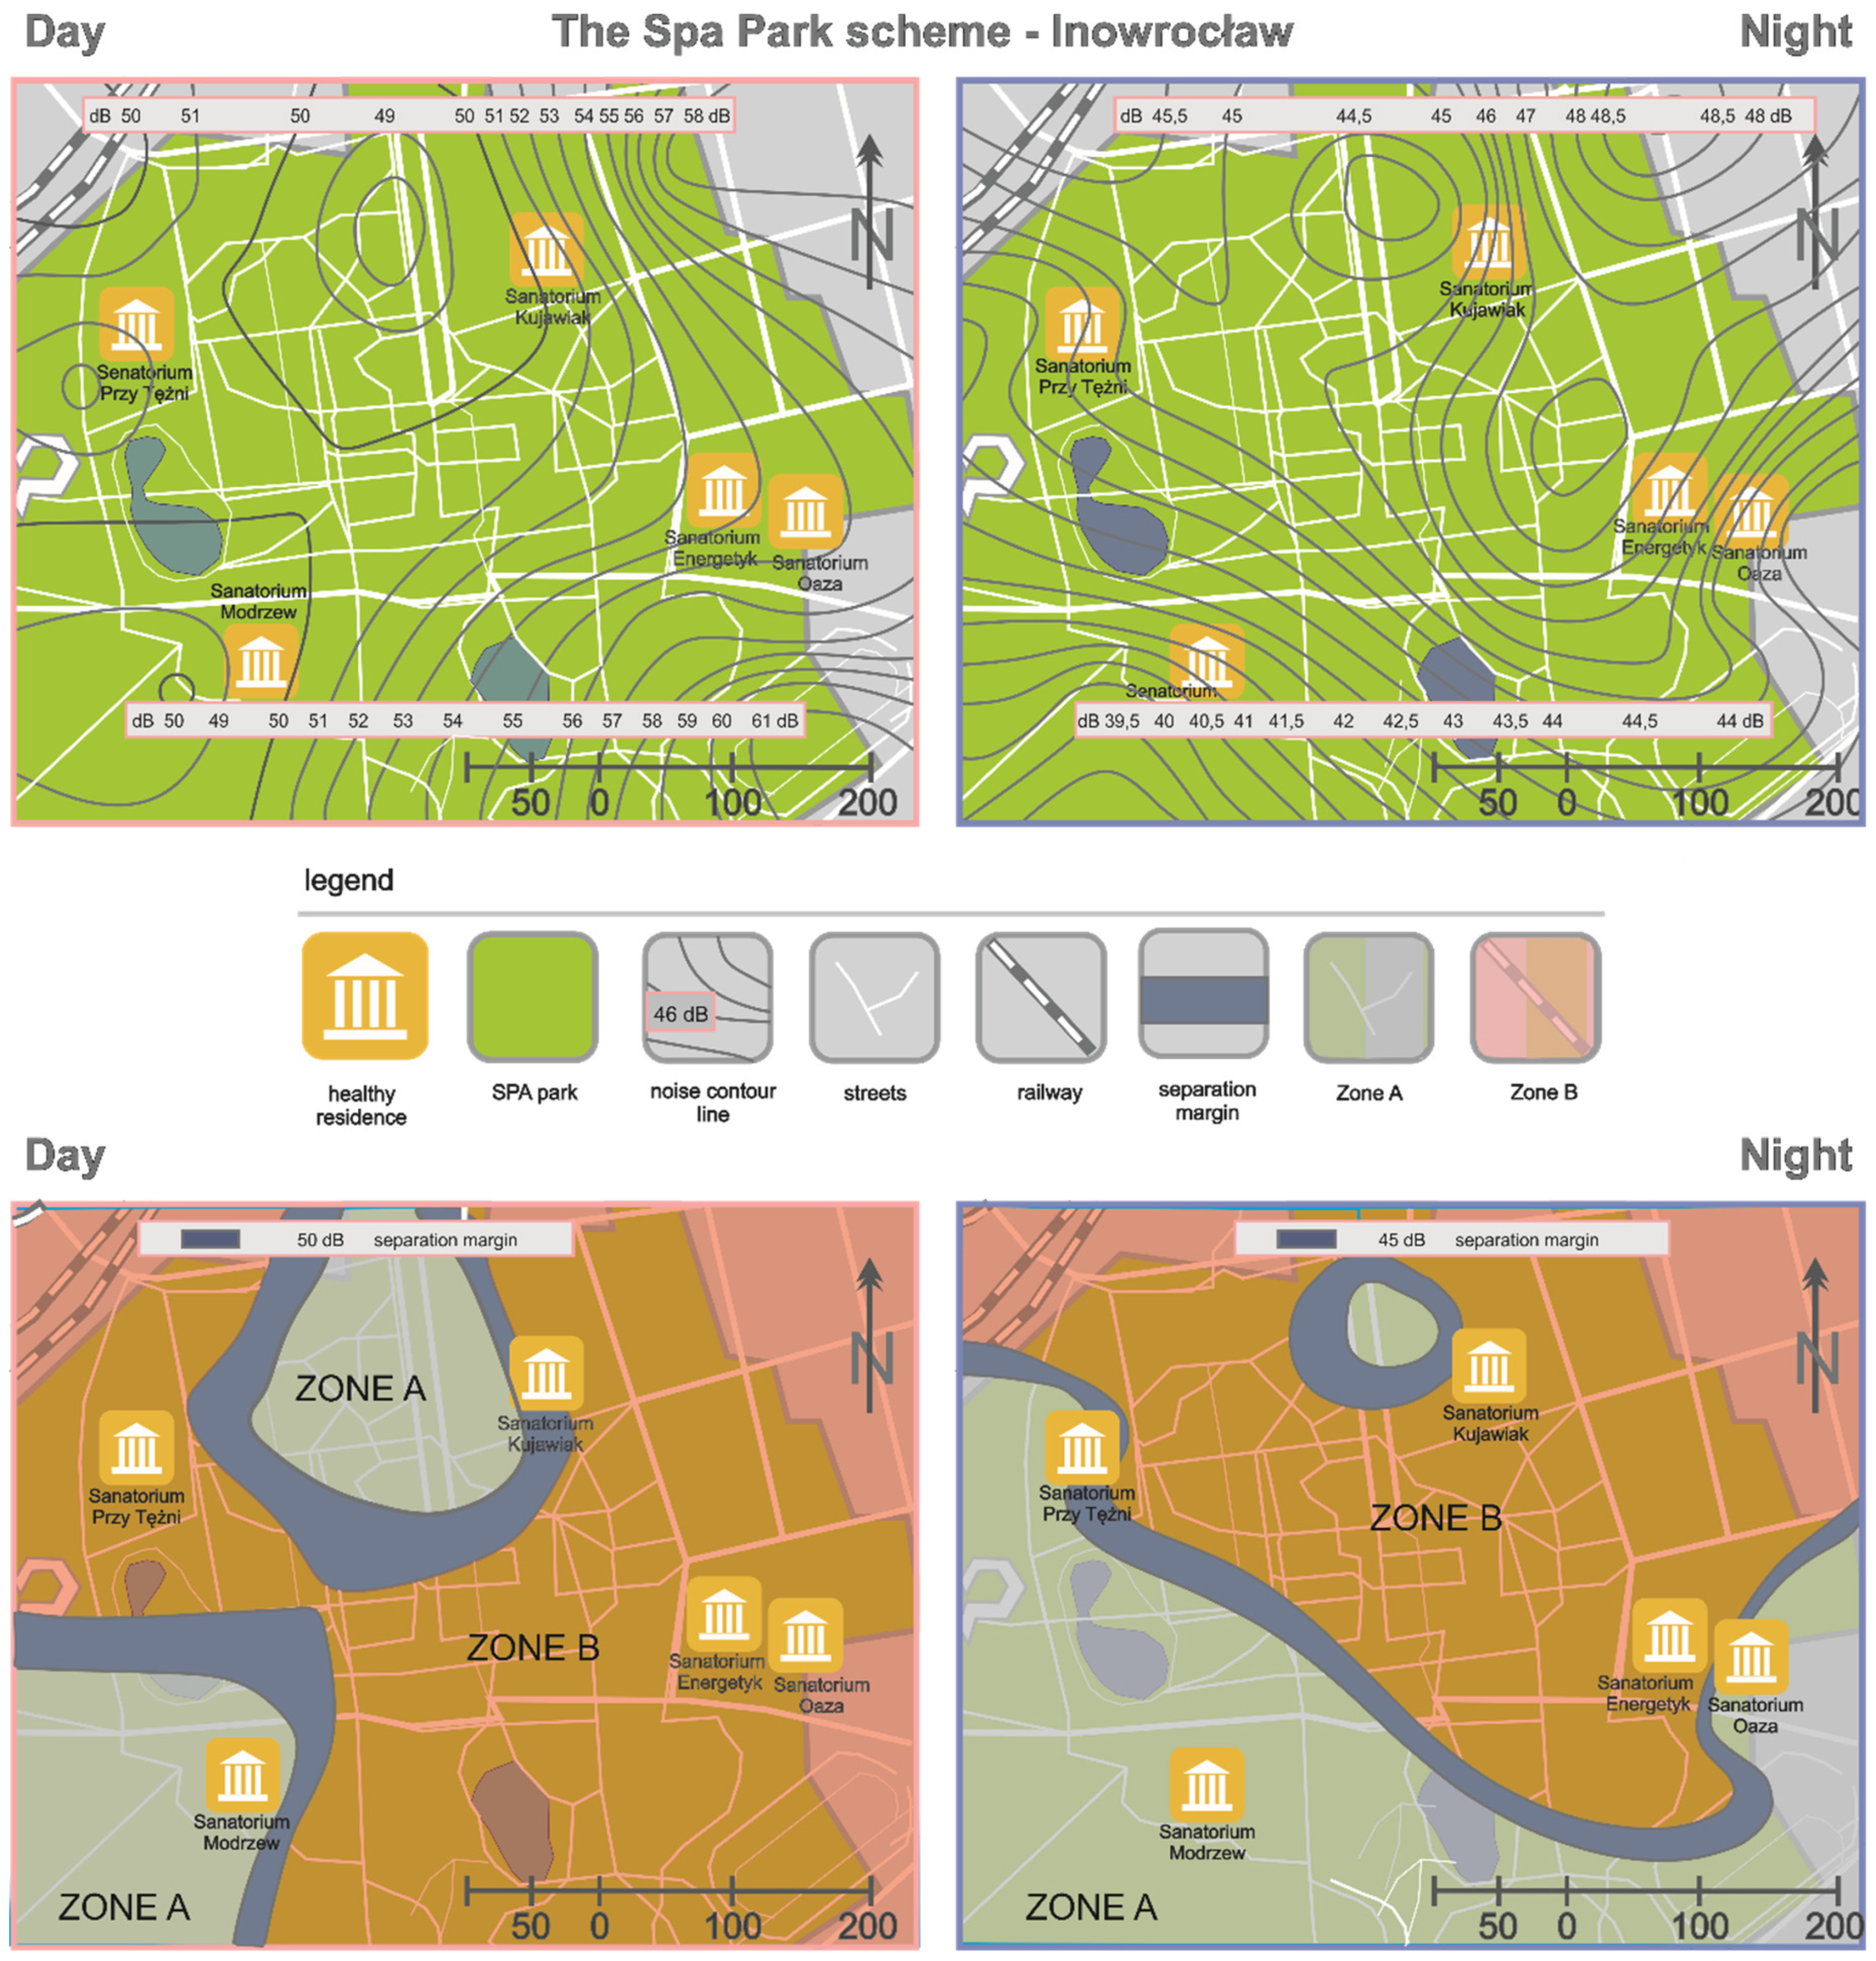
The information, included in the map of the acoustic climate, is primarily used to identify an existing acoustic situation in the studied area. They designate the areas where the exceedance of noise limit values occurred. The maps enable us to estimate the population size exposed to the excessive noise and to estimate possible changes to the acoustic climate in relation to the environment protection against the noise. For the greenery in the areas, such maps have not been prepared because there is a belief that those areas represent silence zones. In large parks, where the accumulation of different functions can be observed, proper zoning is essential as it improves acoustic comfort. The map showing the distribution of sounds is a helpful tool to create a protection area properly. The boundaries of the areas with the exceeded permissible noise levels (separation margin) were estimated on the basis of the noise pollution maps, created by means of the SVM technique. That is 45 dB during the night and 60 dB in the daytime and it should be applied including varied land utilization in terms of form and function, described in the planning documents. In these zones, additional elements of land utilization may be introduced to limit the noise infiltration (Figure 8).
In the area around the health resort, relationships between sound, environment, and people using it, and those expressed as an acoustic comfort, were presented by Tse. In addition to the visual evaluation of landscape, the evaluation of acoustic comfort played an important role in accepting the urban park [68].
The researchers recommend including the analyses of the process of urban sprawl and its impact on the health of population, as potential determinants of health. The development of spatial policy and legal regulations should come from proper planning and integral multi-sectoral approach towards these issues, so as to protect and improve the health of population in a more and more urbanized living environment [69,70,71,72].
The existence of the problem of noise nuisance for the health spa area visitors cannot be concluded only from the measurements. Guests staying in the area may, in fact, pay attention to noise which is not taken into account in the standards. A complete assessment of these feelings can only be obtained on the basis of surveys carried out among people residing in the area. They can be the basis for determining a subjective nuisance of the received noise [73,74]. The direction of the future research should be the search for an effective policy of monitoring noise as an air pollution. In addition, it must be considered to what extent air pollution and other sources of pollution can cause short- and long-term health effects with a certain exposure to noise, and what relationships exist between health outcomes and sensitivity in the noise delivery.
The presented classification model was developed with regard to a number of spatially distributed sampling points. This method can easily be extended to the continuous systems of monitoring perception and acoustic properties of a certain location.
4. Conclusions
Maintaining the right proportions in sustainable park management requires a balance between the noise generated and the impact on the environment. Is the analyzed area vulnerable to changes, especially with regard to noise protection? Yes, but as a special area—a spa park—changes must be rational and should take into account both social and environmental aspects as well as natural aspects.
Shaping the noise climate of the greenery is influenced by many factors, such as:
- the size of the area,
- the accumulation of sound sources,
- the terrain shape,
- natural or artificial obstacles,
- the selection of sampling points,
- the number of visitors (capacity and functional program).
The tested object, the health spa and resort, is a multi-functional area comprising of objects related to healthcare, entertainment, recreation and relaxation. Increasingly, programs for the development of such areas offer diversity, adapting to the new needs of users. Health resorts change their profiles from healthcare centers to multi-functional spa, wellness and recreational places with catering and entertainment.
The space of the tested health spa area is characterized by noise infiltration between the zones. Therefore, there is the need of separating silence zones from the noisy ones by creating neutral zones. This note, which is primarily a recommendation for designing spatial systems in new areas, in the case of “Solanki” may be replaced by the introduction of acoustic partitions. However, often for aesthetic reasons, constructing engineering partitions requires masking elements such as evergreen plants. In addition, linear partitions, considering the gravity flow of air masses, can disturb natural ventilation. The composition of dense greenery and buildings is important for the noise interference issue. Noise is often generated by sports zones and playgrounds as well as by materials used for path cladding. The adjustment of a park’s functional program to its absorbency may be the solution to the problem of reducing noise (anthropocentric), especially in historical parks.
Polish spatial policy, in accordance with the provisions of the Act of 27 March 2003 on spatial planning and development (Off. J. of 2016 item 778 as amended), hereinafter referred to as the SPD Act, based primarily on the findings of the planning documents, which include a municipal study of the conditions and directions of the spatial development and a local zoning plan, in accordance with article 10 paragraph 2 subparagraph 3, takes into account protected areas and policies of a protection of the environment and its resources, nature conservation, landscape conversation, including cultural landscapes and health resorts.
Poland is a country with a distinctive diversity of space functioning in Europe, but at the same time, with very severe processes of spatial order and degradation of landscape physiognomy. There are also growing problems with the management of cities and municipalities land utilization.
The paper presents an innovative approach to the classification of zones located in health spa areas, depending on the noise and done by means of the SVM technique. The proposed approach has allowed us not only to classify the areas with exceeded noise standards but also to determine the course and width of the separation margin. This margin has been identified as an area where the spread of noise to neighboring areas will be reduced by the adopted solution. Proposals of a development zone and a buffer zone for exceeded noise levels are shown in Table 3 and Table 4.
Greenery has a beneficial effect on the urban environment (limits the spread of dust, gases, and noise). It also provides the space necessary for recreation. The location and size of a health resort area are very important factors in determining the quality of relaxation. In larger areas, different functions are accumulated. For this reason, sports or recreational zones may appear there next to zones for silence and walking.
A special type of greenery is a health spa area. They are part of health resorts and, therefore, subject to regulations in the Act of 28 July 2005 on health resort treatment, health resorts and Spa protection areas and health resort municipalities (Off. J. of 2016. item. 879 as amended) and also to the Polish standard of “Health resorts”. The term “health resort” is a combination of medical and recreational functions in the area. The basis of activity in these areas is a balance between various elements of the natural and cultural environment. Health spa areas are health protection zones—separated from the area of a health resort, in order to protect medicinal features and medicinal natural raw materials, which are the benefits of the environment and equipment. They are characterized by a rational shaping of the landscape and their spatial arrangement should take into account proper zones. However, for such a diverse area, it is extremely difficult to separate various subareas of silence and recreation and to prevent the noise infiltration between them.
Spa objects, as sensitive areas, are not monitored in terms of the existing noise level. Sanatoriums, located mostly on the outskirts of health spa and resort areas, should offer peace and relaxation in their space. The measurements of the equivalent sound level around these buildings show, above all, that the patients are the source of the noise. Changes should include determining the limits of the health spa areas’ absorbency in sensitive spaces and other ways of development such as acoustic barriers (in the zone as the separation margin) to prevent the spread of noise.
Author Contributions
All authors had an equal contribution to the creation of this article.
Funding
This research received no external funding.
Conflicts of Interest
The authors declare no conflict of interest.
References
- Marvin Herndon, J.; Whiteside, M. Further Evidence of Coal Fly Ash Utilization in Tropospheric Geoengineering: Implications on Human and Environmental Health. J. Geogr. Environ. Earth Sci. Int. 2017, 9, 1–8. [Google Scholar] [CrossRef] [PubMed] [Green Version]
- Pawlas, K.; Pawlas, N.; Boroń, M.; Szłapa, P.; Zachara, J. Infrasound and low frequency noise assessment at workplaces and environment—Review of criteria. Environ. Med. 2013, 16, 82–89. (In Polish) [Google Scholar]
- Engel, Z. Environmental Protection against Vibration and Noise; Wyd. Nauk. PWN: Warszawa, Poland, 2001. (In Polish) [Google Scholar]
- Augustyńska, D.; Engel, Z.; Kaczmarska-Kozłowska, A.; Koton, J.; Mikulski, W. Noise. Infrasound and Ultrasound. Centralny Instytut Ochrony Pracy 2009. Available online: Ergonomia.ioz.pwr.wroc.pl/download/ciop-halas-text.pdf (accessed on 23 January 2017). (In Polish).
- Takayashi, Y.; Kanada, K.; Yonekawa, Y.; Harada, N.A. Study on the Relationship betweeen Subjective Unpleasantness and Body Surface Vibration Induced by Highlevel Low-frequency Pure Tones. Ind. Health 2005, 43, 580–587. [Google Scholar] [CrossRef] [PubMed]
- Prasher, D. Is there evidence that environmental noise is immunotoxic? Noise Health 2009, 11, 151–155. [Google Scholar] [CrossRef] [PubMed]
- Sørensen, M.; Andersen, Z.J.; Nordsborg, R.B.; Jensen, S.S.; Lillelund, K.G.; Beelen, R. Road Traffic Noise and Incident Myocardial Infarction: A Prospective Cohort Study. PLoS ONE 2012, 7, e39283. [Google Scholar] [CrossRef] [PubMed]
- Van Kamp, I.; Davies, H. Noise and health in vulnerable groups: A review. Noise Health 2013, 15, 153–159. [Google Scholar] [CrossRef] [PubMed]
- Shepherd, D.; Welch, D.; Dirks, K.N.; Mathews, R. Exploring the relationship between noise sensitivity, annoyance and health-related quality of life in a sample of adults exposed to environmental noise. Int. J. Res. Public Health 2010, 7, 3579–3594. [Google Scholar] [CrossRef]
- Seltenrich, N. Wind Turbines: A Different Breed of Noise? Environ. Health Perspect 2014, 122, A20–A25. [Google Scholar] [CrossRef] [Green Version]
- Crichton, F.; Dodd, G.; Schmid, G.; Petrie, K.J. Framing sound: Using expectations to reduce environmental noise annoyance. Environ. Res. 2015, 142, 609–614. [Google Scholar] [CrossRef]
- Holzman, D. Vehicle Motion Alarms: Necessity, Noise Pollution or Both? Environ. Health Perspect 2011, 119, A30–A33. [Google Scholar] [CrossRef]
- Stansfeld, S.A.; Matheson, M.P. Noise pollution: Non-auditory effects on health. Br. Med. Bull. 2003, 68, 243–257. [Google Scholar] [CrossRef] [PubMed]
- Halonen, J.I.; Vahtera, J.; Stansfeld, S.; Yli-Tuomi, T.; Salo, P.; Pentti, J.; Kivimäki, M.; Lanki, T. Associations between nighttime traffic noise and sleep: The Finnish public sector study. Environ. Health Perspect 2012, 120, 1391–1396, Erratum in Environ. Health Perspect 2013, 121, A147. [Google Scholar] [CrossRef] [PubMed]
- Roswall, N.; Bidstrup, P.E.; Raaschou-Nielsen, O.; Jensen, S.S.; Olsen, A.; Sørensen, M. Residential road traffic noise exposure and survival after breast cancer—A cohort study. Environ. Res. 2016, 151, 814–820. [Google Scholar] [CrossRef] [PubMed]
- Badran, M.; Yassin, B.A.; Fox, N.; Laher, I.; Ayas, N. Epidemiology of sleep disturbances and cardiovascular consequences. Can. J. Cardiol. 2015, 31, 873–879. [Google Scholar] [CrossRef] [PubMed]
- Bush-Vishniac, I.J.; West, J.E.; Barnhill, C.; Hunter, T.; Orellana, D.; Chivukula, R. Noise levels in Johns Hopkins Hospital. J. Acoust. Soc. Am. 2005, 118, 3629–3645. [Google Scholar] [CrossRef] [PubMed] [Green Version]
- Begrlund, B.; Lindvall, T.; Schwela, D.H. Table 4.1: Guideline Values for Community Noise in Specific Environments. In Guidelines for Community Noise; World Health Organization: Geneva, Belgium, 1999. [Google Scholar]
- Polish Committee for Standardization. PN-B-02151-2:2018-01 Building Acoustics—Protection against Noise in Buildings—Part 2: Requirements regarding the Permissible Sound Level in Rooms. 08.12.2018. ICS 91.120.20; Polish Committee for Standardization: Warsaw, Poland, 2018; p. 12. (In Polish) [Google Scholar]
- Bazan-Krzywoszańska, A.; Mrówczyńska, M.; Skiba, M. Perceptions of Residents City Zielona Góra—Mental maps. J. Civ. Eng. Environ. Archit. 2015, 32, 19–32. Available online: http://doi.prz.edu.pl/pl/pdf/biis/435 (accessed on 23 January 17). (In Polish).
- Osman, T.; Divigalpitiyac, P.; Arima, T. Driving factors of urban sprawl in Giza. Governorate of Greater Cairo Metropolitan Region using AHP method. Land Use Policy 2016, 58, 21–31. [Google Scholar] [CrossRef]
- Italo, C.M.G.; Stelamaris, R.B.; Paulo, H.T.Z. Influence of urban shapes on environmental noise: A case study in Aracaju—Brazil. Sci. Total Environ. 2011, 412–413, 66–76. [Google Scholar] [CrossRef]
- Aletta, F.; Kang, J. Soundscape approach integrating noise mapping techniques: A case study in Brighton, UK. Noise Mapp. 2015, 2. [Google Scholar] [CrossRef]
- Genuit, K.; Fiebig, A. Psychoacoustics and its benefit for the soundscape approach. Acta Acoust. United Acoust. 2006, 92, 952–958. [Google Scholar]
- Genuit, K.; Schulte-Fortkamp, B.; Fiebig, A. Psychoacoustic mapping within the soundscape approach. Internoise 2008, 2008, 594–606. [Google Scholar]
- Hao, Y.; Kang, J.; Krijnders, J. Integrated effects of urban morphology on birdsong loudness and visibility of green areas. Landsc. Urban Plan. 2015, 137, 149–162. [Google Scholar] [CrossRef] [Green Version]
- Liu, J.; Kang, J.; Behm, H. Birdsong as an element of the urban sound environment: A case study concerning the area of Warnemünde in Germany. Acta Acoust. United Acoust. 2014, 100, 458–466. [Google Scholar] [CrossRef]
- Liu, J.; Kang, J.; Luo, T.; Behm, H. Landscape effects on soundscape experience in city parks. Sci. Total Environ. 2013, 454, 474–481. [Google Scholar] [CrossRef] [PubMed]
- Liu, J.; Kang, J.; Luo, T.; Behm, H.; Coppack, T. Spatio temporal variability of soundscapes in a multiple functional urban area. Landsc. Urban Plan. 2013, 115, 1–9. [Google Scholar] [CrossRef]
- Boerenfijn, P.; Kazak, J.; Schellen, L.; van Hooff, J. A multi-case study of innovations in energy performance of social housing for older adults in the Netherlands. Energy Build. 2018, 158, 1762–1769. [Google Scholar] [CrossRef]
- Yerli, O.; Demir, Z. Relation between urban land uses and noise. A case study in Dulze, Turkey. Oxid. Commun. 2016, 39, 732–745. [Google Scholar]
- Vlahov, D.; Freudenberg, N.; Proietti, F. Urban as a determinant of health. J. Urban Health 2007, 84, 16–26. [Google Scholar] [CrossRef]
- Marquis-Favre, C.; Premat, E.; Aubree, D. Noise and its effect—A review on qualitative aspect of sound. Part II: Noise and annoyance. Acta Acoust. United Acoust. 2005, 91, 626–642. [Google Scholar]
- Honga, J.; Jeon, J. Exploring spatial relationships among soundscape variables in urbanareas: A spatial statistical modelling approach. Landsc. Urban Plan. 2017, 157, 352–364. [Google Scholar] [CrossRef]
- Corburn, J. Toward the Healthy City: People, Places, and the Politics of Urban Planning; MIT Press: Cambridge, MA, USA; London, UK, 2009; Available online: https://mitpress.mit.edu/sites/default/files/titles/content/9780262513074_sch_0001.pdf (accessed on 23 February 2017).
- Seidman, M.; Standring, R. Noise and quality of life. Int. J. Environ. Res. Public Health 2010, 7, 3730–3738. [Google Scholar] [CrossRef] [PubMed]
- Rosenberg, B.C. Shhh! Noisy cities, anti-noise groups and neoliberal citizenship. J. Sociol. 2013, 52, 190–203. [Google Scholar] [CrossRef]
- Passchier-Vermer, W.; Passchier, W.F. Noise exposure and public health. Environ. Health Perspect. 2000, 108, 123–131. [Google Scholar]
- AbhijitDebnath Prasoon KumarSingh Environmental traffic noise modelling of Dhanbad township area—A mathematical based approach. Appl. Acoust. 2018, 129, 161–172. [CrossRef]
- Berger, R.G.; Ashtiani, P.; Ollson, C.A.; Whitfield Aslund, M.; McCallum, L.C.; Leventhall, G.; Knopper, L.D. Health-based audible noise guidelines account for infrasound and low frequency noise produced by wind turbines. Front. Public Health 2015, 3, 1–14. [Google Scholar] [CrossRef] [PubMed]
- Ho-Huu, V.; Ganić, E.; Hartjes, S.; Babić, O.; Curran, R. Air traffic assignment based on daily population mobility to reduce aircraft noise effects and fuel consumption. Transp. Res. Part D Transp. Environ. 2019, 72, 127–147. [Google Scholar] [CrossRef]
- Ning, X.; Qi, J.; Wu, C.; Wang, W. Reducing noise pollution by planning construction site layout via a multi-objective optimization model. J. Clean. Prod. 2019, 222, 218–230. [Google Scholar] [CrossRef]
- Williams, R.; Veirs Val Veirs, S.; Ashe, E.; Mastick, N. Approaches to reduce noise from ships operating in important killer whale habitats. Mar. Pollut. Bull. 2019, 139, 459–469. [Google Scholar] [CrossRef]
- Richhariya, B.; Tanveer, M. EEG signal classification using universum support vector machine. Expert Syst. Appl. 2018, 106, 169–182. [Google Scholar] [CrossRef]
- Benítez-Peña, S.; Blanquero, R.; Carrizosa, E.; Ramírez-Cobo, P. Cost-sensitive Feature Selection for Support Vector Machines. Comput. Oper. Res. 2019, 106, 169–178. [Google Scholar] [CrossRef]
- Phangtriastu, M.R.; Harefa, J.; Tanoto, D.F. Comparison Between Neural Network and Support Vector Machine in Optical Character Recognition. Procedia Comput. Sci. 2017, 116, 351–357. [Google Scholar] [CrossRef]
- Leong, W.C.; Kelani, R.O.; Ahmad, Z. Prediction of air pollution index (API) using support vector machine (SVM). J. Environ. Chem. Eng. 2019, 103208. [Google Scholar] [CrossRef]
- Alirezaei, M.; Akhavan Niaki, S.T.; Akhavan Niaki, S.A. A bi-objective hybrid optimization algorithm to reduce noise and data dimension in diabetes diagnosis using support vector machines. Expert Syst. Appl. 2019, 127, 47–57. [Google Scholar] [CrossRef]
- Battineni, G.; Chintalapudi, N.; Amenta, F. Machine learning in medicine: Performance calculation of dementia prediction by support vector machines (SVM). Inform. Med. Unlocked 2019, 100200. [Google Scholar] [CrossRef]
- Wang, Z.; Zou, Z.; Soares, C.G. Identification of ship manoeuvring motion based on nu-support vector machine. Ocean Eng. 2019, 183, 270–281. [Google Scholar] [CrossRef]
- Vapnik, V. Statistical Learning Theory; Wiley: New York, NY, USA, 1998. [Google Scholar]
- Redgwell, R.D.; Szewczak, J.M.; Jones, G.; Parsons, S. Classification of Echolocation Calls from 14 Species of Bat by Support Vector Machines and Ensembles of Neural Networks. Algorithms 2009, 2, 907–924. [Google Scholar] [CrossRef]
- Parrado-Hernández, E.; Robles, G.; Ardila-Rey, J.A.; Martínez-Tarifa, J.M. Robust Condition Assessment of Electrical Equipment with One Class Support Vector Machines Based on the Measurement of Partial Discharges. Energies 2018, 11, 486. [Google Scholar] [CrossRef]
- Yu, H.; Gao, L.; Li, J.; Li, S.S.; Zhang, B.; Benediktsson, J.A. Spectral-Spatial Hyperspectral Image Classification Using Subspace-Based Support Vector Machines and Adaptive Markov Random Fields. Remote Sens. 2016, 8, 355. [Google Scholar] [CrossRef]
- Vuolo, F.; Atzberger, C. Exploiting the Classification Performance of Support Vector Machines with Multi-Temporal Moderate-Resolution Imaging Spectroradiometer (MODIS) Data in Areas of Agreement and Disagreement of Existing Land Cover Products. Remote Sens. 2012, 4, 3143–3167. [Google Scholar] [CrossRef] [Green Version]
- Elangovan, K.; Krishnasamy Tamilselvam, Y.; Mohan, R.E.; Iwase, M.; Takuma, N.; Wood, K.L. Fault Diagnosis of a Reconfigurable Crawling–Rolling Robot Based on Support Vector Machines. Appl. Sci. 2017, 7, 1025. [Google Scholar] [CrossRef]
- Shin, K.; Lee, K.J.; Kim, H. Support vector machines approach to pattern detection in bankruptcy prediction and its contingency. In Proceedings of the 11th International Conference on Neural Information Processing, ICONIP 2004, Calcutta, India, 22–25 November 2004. [Google Scholar]
- Platt, J.C. Probabilistic outputs for support vector machines and comparisons to regularized likelihood method. Adv. Large Margin Classif. 1999, 10, 61–74. [Google Scholar]
- Sztubecka, M.; Skiba, M. Noise level arrangement in determined zones of homogenous development of green areas on the example of the spa park in Inowrocław. Open Eng. 2016, 6, 524–531. [Google Scholar] [CrossRef]
- Polish Committee for Standardization. PN-ISO 1996-2:1999. Acoustics—Description and measurement of environmental noise.12.03.1999. ICS: 17.140.01; Polish Committee for Standardization: Warsaw, Poland, 1999; p. 9. (In Polish) [Google Scholar]
- Abbod, M.F.; Linkens, D.A.; Mahfouf, M.; Dounias, G. Survey on the use of smart and adaptive engineering systems in medicine. Artif. Intell. Med. 2002, 26, 179–209. [Google Scholar] [CrossRef]
- Mrówczyńska, M. Study on the Selection of Numerical Intelligence Methods for Solving Surveying Problems; Oficyna Wydawnicza Uniwersytetu Zielonogórskiego: Zielona Góra, Poland, 2015. (In Polish) [Google Scholar]
- Osowski, S. Neural Networks for Processing Information; Oficyna Wydawnicza Politechniki Warszawskiej: Warszawa, Poland, 2006. (In Polish) [Google Scholar]
- Bishop, C.M. Pattern Recognition and Machine Learning. In Information Science and Statistics; Springer Science + Business Media: New York, NY, USA, 2006. [Google Scholar]
- Jankowski, N. Ontogemic Neural Networks. About Networks Changing Their Structure; Akademicka Oficyna Wydawnicza EXIT: Warszawa, Poland, 2003. (In Polish) [Google Scholar]
- Skrzypczak, I.; Kokoszka, W.; Kogut, J.; Oleniacz, G. Methods of Measuring and Mapping of Landslide Areas. In Proceedings of the Conference: 3rd World Multidisciplinary Earth Sciences Symposium (WMESS), Prague, Czech Republic, 11–15 September 2017. [Google Scholar]
- Cover, T. Geometrical and statistical properties of system of linear inequalities with applications in pattern recognition. IEEE Trans. Electron. Comput. 1965, 14, 326–334. [Google Scholar] [CrossRef]
- Beycioglu, A.; Gultekin, A.; Aruntas, H.Y.; Gencel, O.; Dobiszewska, M.; Brostow, W. Mechanical properties of blended cements at elevated temperatures predicted using a fuzzy logic model. Comput. Concr. 2017, 20, 247–255. [Google Scholar]
- Tse, M.S.; Chau, C.K.; Choy, Y.S.; Tsui, W.K.; Chan, C.N.; Tang, S.K. Perception of urban park soundscape, Published by the Acoustical Society of America. J. Acoust. Soc. Am. 2012, 131. [Google Scholar] [CrossRef]
- King, G.; Roland-Mieszkowski, M.; Jason, T.; Rainham, D.G. Noise Levels Associated with Urban Land Use. J. Urban Health 2012, 89, 1017–1030. [Google Scholar] [CrossRef] [Green Version]
- Hassana, A.M.; Lee, H. Toward the sustainable development of urban areas: An overview of global trends in trials and policies. Land Use Policy 2015, 48, 199–212. [Google Scholar] [CrossRef]
- Foraster, M.; Eze, I.; Vienneau, D.; Brink, M.; Cajochen, C.; Caviezel, S.; Héritier, H.; Schaffner, E.; Schindler, C.; Wanner, M.; et al. Long-term transportation noise annoyance is associated with subsequent lower levels of physical activity. Environ. Int. 2016, 91, 341–349. [Google Scholar] [CrossRef] [Green Version]
- Świąder, M.; Szewrański, S.; Kazak, J.; van Hoof, J.; Lin, D.; Wackernagel, M.; Alves, A. Application of Ecological Footprint Accounting as a Part of an Integrated Assessment of Environmental Carrying Capacity: A Case Study of the Footprint of Food of a Large City. Resources 2018, 7, 52. [Google Scholar] [CrossRef]
- Juszczyk, M.; Leśniak, A.; Zima, K. ANN Based Approach for Estimation of Construction Costs of Sports Fields. Complexity 2018, 2018, 7952434. [Google Scholar] [CrossRef]
Figure 1.
The map of Inowrocław, along with the health spa and resort. Source: Authors.

Figure 2.
The maps of the health resort area with measuring points. Source: Authors.

Figure 3.
The maps of the health resort area with noise contour line. Source: Authors.

Figure 4.
The optimal hyperplane with the maximum separation margin. Source: Authors.

Figure 5.
(a) Linearly inseparable data in space of original. Source: Authors; (b) Linearly separable data in space of attributes. Source: Authors.
Figure 5.
(a) Linearly inseparable data in space of original. Source: Authors; (b) Linearly separable data in space of attributes. Source: Authors.

Figure 6.
The basic architecture of the non-linear support vector machine (SVM) network. Source: Authors.
Figure 6.
The basic architecture of the non-linear support vector machine (SVM) network. Source: Authors.

Figure 7.
The architecture resulting from the non-linear SVM network. Source: Authors.

Figure 8.
Acoustic zones established with the SVM neural networks. Source: Authors.


Table 1.
Measured values of the equivalent sound level [dB].
| Point No. | The Name of the Sanatorium | LAeq for 8 h During the Day [dB] | LAeq for 1 h During the Night [dB] | Point No. | The Name of the Sanatorium | LAeq for 8 h During the Day [dB] | LAeq for 1 h During the Night [dB] |
|---|---|---|---|---|---|---|---|
| 1 | Oaza | 56.9 | 40.5 | 10 | Kujawiak | 48.5 | 45.1 |
| 2 | Oaza | 64.4 | 46.2 | 11 | Kujawiak | 45.7 | 42.4 |
| 3 | Oaza | 51.0 | 40.0 | 12 | Przy Tężni | 48.8 | 45.2 |
| 4 | Oaza | 55.9 | 40.1 | 13 | Przy Tężni | 54.2 | 46.8 |
| 2 | Energetyk | 64.4 | 46.2 | 14 | Przy Tężni | 47.9 | 41.6 |
| 3 | Energetyk | 51.0 | 40.0 | 15 | Przy Tężni | 54.3 | 45.3 |
| 5 | Energetyk | 58.8 | 47.6 | 20 | Przy Tężni | 54.6 | 45.8 |
| 6 | Energetyk | 52.0 | 48.1 | 16 | Modrzew | 52.8 | 41.5 |
| 7 | Kujawiak | 47.8 | 45.4 | 17 | Modrzew | 45.1 | 38.9 |
| 8 | Kujawiak | 62.9 | 50.8 | 18 | Modrzew | 47.9 | 40.7 |
| 9 | Kujawiak | 49.5 | 45.0 | 19 | Modrzew | 48.3 | 37.6 |
Table 2.
Examples of kernel functions.
| Type Kernel | Equation K(x, xi) | Comment |
|---|---|---|
| linear | ||
| polynomial | b—degree polynomial | |
| radial (Gaussian) | σ—for all kernels | |
| sigmoidal | restrictions on the |
Table 3.
Proposals supporting spatial decision-making reinforcing the basic healthcare functions of health spa areas.
Table 3.
Proposals supporting spatial decision-making reinforcing the basic healthcare functions of health spa areas.
| Current Status | Zone A | Separation Margin | Zone B |
|---|---|---|---|
| Park development | Park development (paths, high greenery, low greenery) | Change of park management (acoustic barriers) | Change of park management (change of track surface, change of track width depending on the boundary absorption of zones) |
| Sanatorium buildings | limiting the amount of acceptable space in sanatorium buildings | Slopes—earth acoustic barriers | change of building elements (windows, doors) to muted—less noisy |
Table 4.
Proposals of preventive actions concerning records in the documents on spatial policy and changes in the management technique.
Table 4.
Proposals of preventive actions concerning records in the documents on spatial policy and changes in the management technique.
| Current Status | Reform Guidelines |
|---|---|
| residents are indifferent to the public domain management technique | strengthening the role of civic organizations to establish partnership in development policy |
| lack of entries in the planning documents for parks, health areas and healthcare facilities, which are based on the acoustic analysis and study of the experience of space users |
|
| uncontrolled spatial policy system | obligatory monitoring to control the appropriateness of activities (the reduction of sound-active materials and the introduction of functional program) |
| inefficient ways to write the land destination and utilization in the planning documents of the areas | changes to the law in order to introduce modern and effective methods of managing the land destination and utilization in accordance with the principles of sustainable development |
© 2019 by the authors. Licensee MDPI, Basel, Switzerland. This article is an open access article distributed under the terms and conditions of the Creative Commons Attribution (CC BY) license (http://creativecommons.org/licenses/by/4.0/).
Share and Cite
MDPI and ACS Style
Mrówczyńska, M.; Sztubecka, M.; Skiba, M.; Bazan-Krzywoszańska, A.; Bejga, P. The Use of Artificial Intelligence as a Tool Supporting Sustainable Development Local Policy. Sustainability 2019, 11, 4199. https://doi.org/10.3390/su11154199
AMA Style
Mrówczyńska M, Sztubecka M, Skiba M, Bazan-Krzywoszańska A, Bejga P. The Use of Artificial Intelligence as a Tool Supporting Sustainable Development Local Policy. Sustainability. 2019; 11(15):4199. https://doi.org/10.3390/su11154199
Chicago/Turabian StyleMrówczyńska, Maria, Małgorzata Sztubecka, Marta Skiba, Anna Bazan-Krzywoszańska, and Przemysław Bejga. 2019. "The Use of Artificial Intelligence as a Tool Supporting Sustainable Development Local Policy" Sustainability 11, no. 15: 4199. https://doi.org/10.3390/su11154199
Note that from the first issue of 2016, this journal uses article numbers instead of page numbers. See further details here.