City Branding Evaluation as a Tool for Sustainable Urban Growth: A Framework and Lessons from the Yangtze River Delta Region

1
College of Architecture and Urban Planning, Tongji University, Shanghai 200092, China
2
Martin Centre for Architectural and Urban Studies, University of Cambridge, Cambridge CB2 1PX, UK
3
School of Economics and Management, Tongji University, Shanghai 200092, China
4
Institute for Manufacturing, University of Cambridge, Cambridge CB3 0FS, UK
5
School of Design, Shanghai Jiao Tong University, Shanghai 200240, China
*
Author to whom correspondence should be addressed.
Sustainability 2019, 11(16), 4281; https://doi.org/10.3390/su11164281
Submission received: 1 July 2019
/
Revised: 28 July 2019
/
Accepted: 6 August 2019
/
Published: 8 August 2019
(This article belongs to the Special Issue City Branding and Sustainable Development)
Abstract
:With the rising tide of globalization, urban branding campaigns have become the focal points of decision makers and planners aiming to establish city reputations and to achieve long-term urban prosperity. This paper, therefore, aims to develop a sustainability-oriented city branding framework that incorporates (1) comprehensive perceptions from various stakeholders through questionnaires and (2) empirical applications that evaluate the city-level potentials for a global mega-region in support of its sustainable growth. Seven major aspects, i.e., economic development, environment, potential, pulse, people, infrastructure, and governance, have been identified and assessed in the context of 26 prefecture cities in the Yangtze River Delta region. Moreover, a cluster analysis differentiated these cities into four groups with distinct characteristics and development paths. Through the framework and evaluation outputs, local planners, researchers, and decision-makers would be better placed to design and implement sustainable policy packages and incentives, with a quantitative insight into current strengths and weaknesses.
1. Introduction
With the hyper-fast growth of globalization, the possession of core competence and the demands of sustainable growth have become the focal points of decision makers and urban planners. The branding of a city offers a representative image of that city to the world, allowing the city to enjoy competitive advantages both regionally and internationally [1,2,3]. Reflecting a city externally, its branding is of critical importance due to its impact on people’s decisions to visit, to relocate, or to invest. Additionally, urban brand value can significantly affect the well-being and satisfaction of local citizens [4]. Therefore, almost every city in the world strives to be sufficiently competent in attracting and accommodating their target audiences through effective branding.
Famous and successful cities are usually associated with tourist destinations, entertainment events, cultural festivals, and promotions of investment [5]. The accurate positioning and the establishment of a city brand is the fundamental power behind its long-term performance [6]. A recent bibliographical analysis of the published research on city branding [7] indicated the keywords with the highest co-occurrence: brand, city, loyalty, markets, consumption, quality, behavior, product, differentiation, personality, and tourism.
To achieve significance in a globalized world, a framework to identify the potential of city branding plays a major role in shaping the branding strategy [8]. However, the range of urban branding spans too widely to be easily understood and thus often causes confusion and doubts among city governors when designing urban development policies [9].
This paper, therefore, aims to develop a sustainability-oriented city branding framework that incorporates (1) comprehensive perceptions from various stakeholders through questionnaires and (2) empirical applications that evaluate the city-level potentials for a global mega-region in support of its sustainable growth. Theoretically, this research adds to the literature regarding the evaluation framework construction of a sustainability-oriented city branding, with adaptations to rapidly-urbanizing city-regions. Practically, a deep, quantifiable understanding of brand-related indexes offers important insights for the strategic planning of a city to stimulate its sustainable socio-economic development. Local planners, researchers, and decision-makers will be better placed to design and implement sustainable policy packages and incentives, with a quantitative insight into current strengths and weaknesses.
2. Literature Review
A brand is widely acknowledged as “a name, term, sign, symbol, or design, or a combination of them, [that] is intended to identify the goods and services of one seller or a group of sellers and to differentiate them from those of competitors” [10]. This concept has been extended beyond commodities into different areas such as corporations [11], societies [12], and places [13]. City branding is an emerging topic advocated by Keller, Apéria [1], and Anttiroiko [14], indicating that a geographical area can also shape a brand influence.
Similar to traditional branding strategies, an effective city brand should represent all the related stakeholders and should remain active over time. However, it goes beyond typical branding as it calls for collective actions and is represented by various stakeholders, such as but not limited to local residents, visitors, and investors [15,16,17]. The complexity of cities determines the nature of city branding as multidimensional with respect to various major stakeholders.
Support and commitment from local people greatly affects the effectiveness and efficiency of a city brand. This is examined and quantified by Zenker and Petersen [18]’s survey of over 600 German residents about their attitudes to urban life. With a combination of 18 different scales, they derived urbanism and diversity, nature and recreation, job opportunities, and cost efficiency as the elements of their Citizen Satisfaction Index. Biel [19] added quality of life as another key issue that affects people’s relocation and investment decisions, especially for company supervisors, administrators, and their relatives. Other similar factors like infrastructure, transportation, education, and training opportunities supplement each other in the process of evaluation [20,21,22]. Thus, reaching an ideal level of residential satisfaction has become many local governors’ ultimate goal in their establishment of a sustainable urban brand.
Another main strand of research lies in tourism and business, leading to a large amount of literature since the 1990s with advances in global transportation [23,24,25,26]. Based on a questionnaire from a business tourism perspective, Hankinson [27] derived economic activity, physical environment, business tourism facilities, accessibility, social facilities, strength of reputation, people’s characteristics, size, and others as eight key clusters of brand image attributes. Moreover, the attraction elements of a city to tourists can be generalized into the following three kinds: the built environment, hallmark events, and famous personalities [28,29,30]. Additionally, investors can also influence the long-term profit and sustainability of a city from an economic point of view, and this leads to branding preferences towards conveying economic competence [31].
Other comprehensive models of city branding such as the Anholt-Global Marketing Institute (GMI), the City Brands Index developed from interviews in 50 cities [9], and the City Branding Index proposed by Merrilees and Miller [32] are summarized in Table 1.
It is noteworthy that a shift to the network paradigm emphasizing the interactions between local development, regional coalition, and globalization processes has become increasingly important in understanding city branding and sustainable growth. A complementary or synergic relationship through multipolar territorial organization gives rise to strategic, integrated, and sustainable development via a trans-territorial network of relationships [33,34,35]. Despite the significance of the adopted branding tool of a particular city, the effective functioning of the network and joint implementation of cooperation activities among cities can further reinforce the cities’ image [36], promote social inclusion [37], and sustain regional growth [38,39]. As novel network-based analysis of city branding is still in its explorative stage [40], this research is more situated in the literature of conventional city branding frameworks but takes into account the significant roles of city networks.
3. Evaluation Framework of Sustainability-Oriented City Branding and Its Application
3.1. Framework Development
Due to the complexity of understanding the brand value of a city and measuring the potential differences between cities, a multi-level, quantifiable evaluation framework has been long called for. A focus session on urban branding was organized by the research group during the 2015 Yangtze River Delta Mayors’ Conference (http://sh.eastday.com/m/20150327/u1ai8641527.html) to agree upon a sustainability-oriented city branding framework that could be applied both domestically and abroad. Forty-five public officials and academics attended the focus session.
The research group pre-defined and disseminated the following six principles of the framework development prior to the focus session: (1) comprehensiveness: the dimensions of indexes should cover all the key aspects of city brands; (2) operability: indexes should be easily quantitatively measured through existing data sources; (3) independence: overlapped indexes should be avoided to ensure the accuracy of the final outputs; (4) comparability: every index should be comparable in different time periods and dimensions and among different cities; (5) policy orientation: the result of the index calculation should catch the tendency of policy-related aspects in the cities to provide efficient suggestions to the decision makers and urban planners; and (6) context specificity: the development of the framework should be based on the characteristics of the cities with respect to the local culture and context.
The major components of the evaluation were widely discussed and agreed upon during the focus session. After the presentations of the reviews of the prevalent branding frameworks and keeping in mind the specific aim of enhancing the role of sustainability, this research tapped into Anholt [9]’s Hexagon model to develop a new framework. Firstly, presence and place in the hexagon framework proved difficult to quantify and were therefore excluded according to the defined principles. Secondly, the environment, infrastructure, and economic development were borrowed from other dominant models of Hankinson [27], Merrilees and Miller [32], Zenker and Petersen [18], Wu and Yang [41], Pan and Deal [42], Pan and Deal [43], and Pan and Zhang [44] to improve the representativeness of the sustainable-oriented development. Thirdly, a novel section on governance was proposed to reflect the importance of urban governance in comprehensively supporting all the above-mentioned aspects. Seven main components were consequently summarized, i.e., economic development, environment, potential, pulse, people, infrastructure, and governance, while the indexes under each category were drafted by the research team after the focus session.
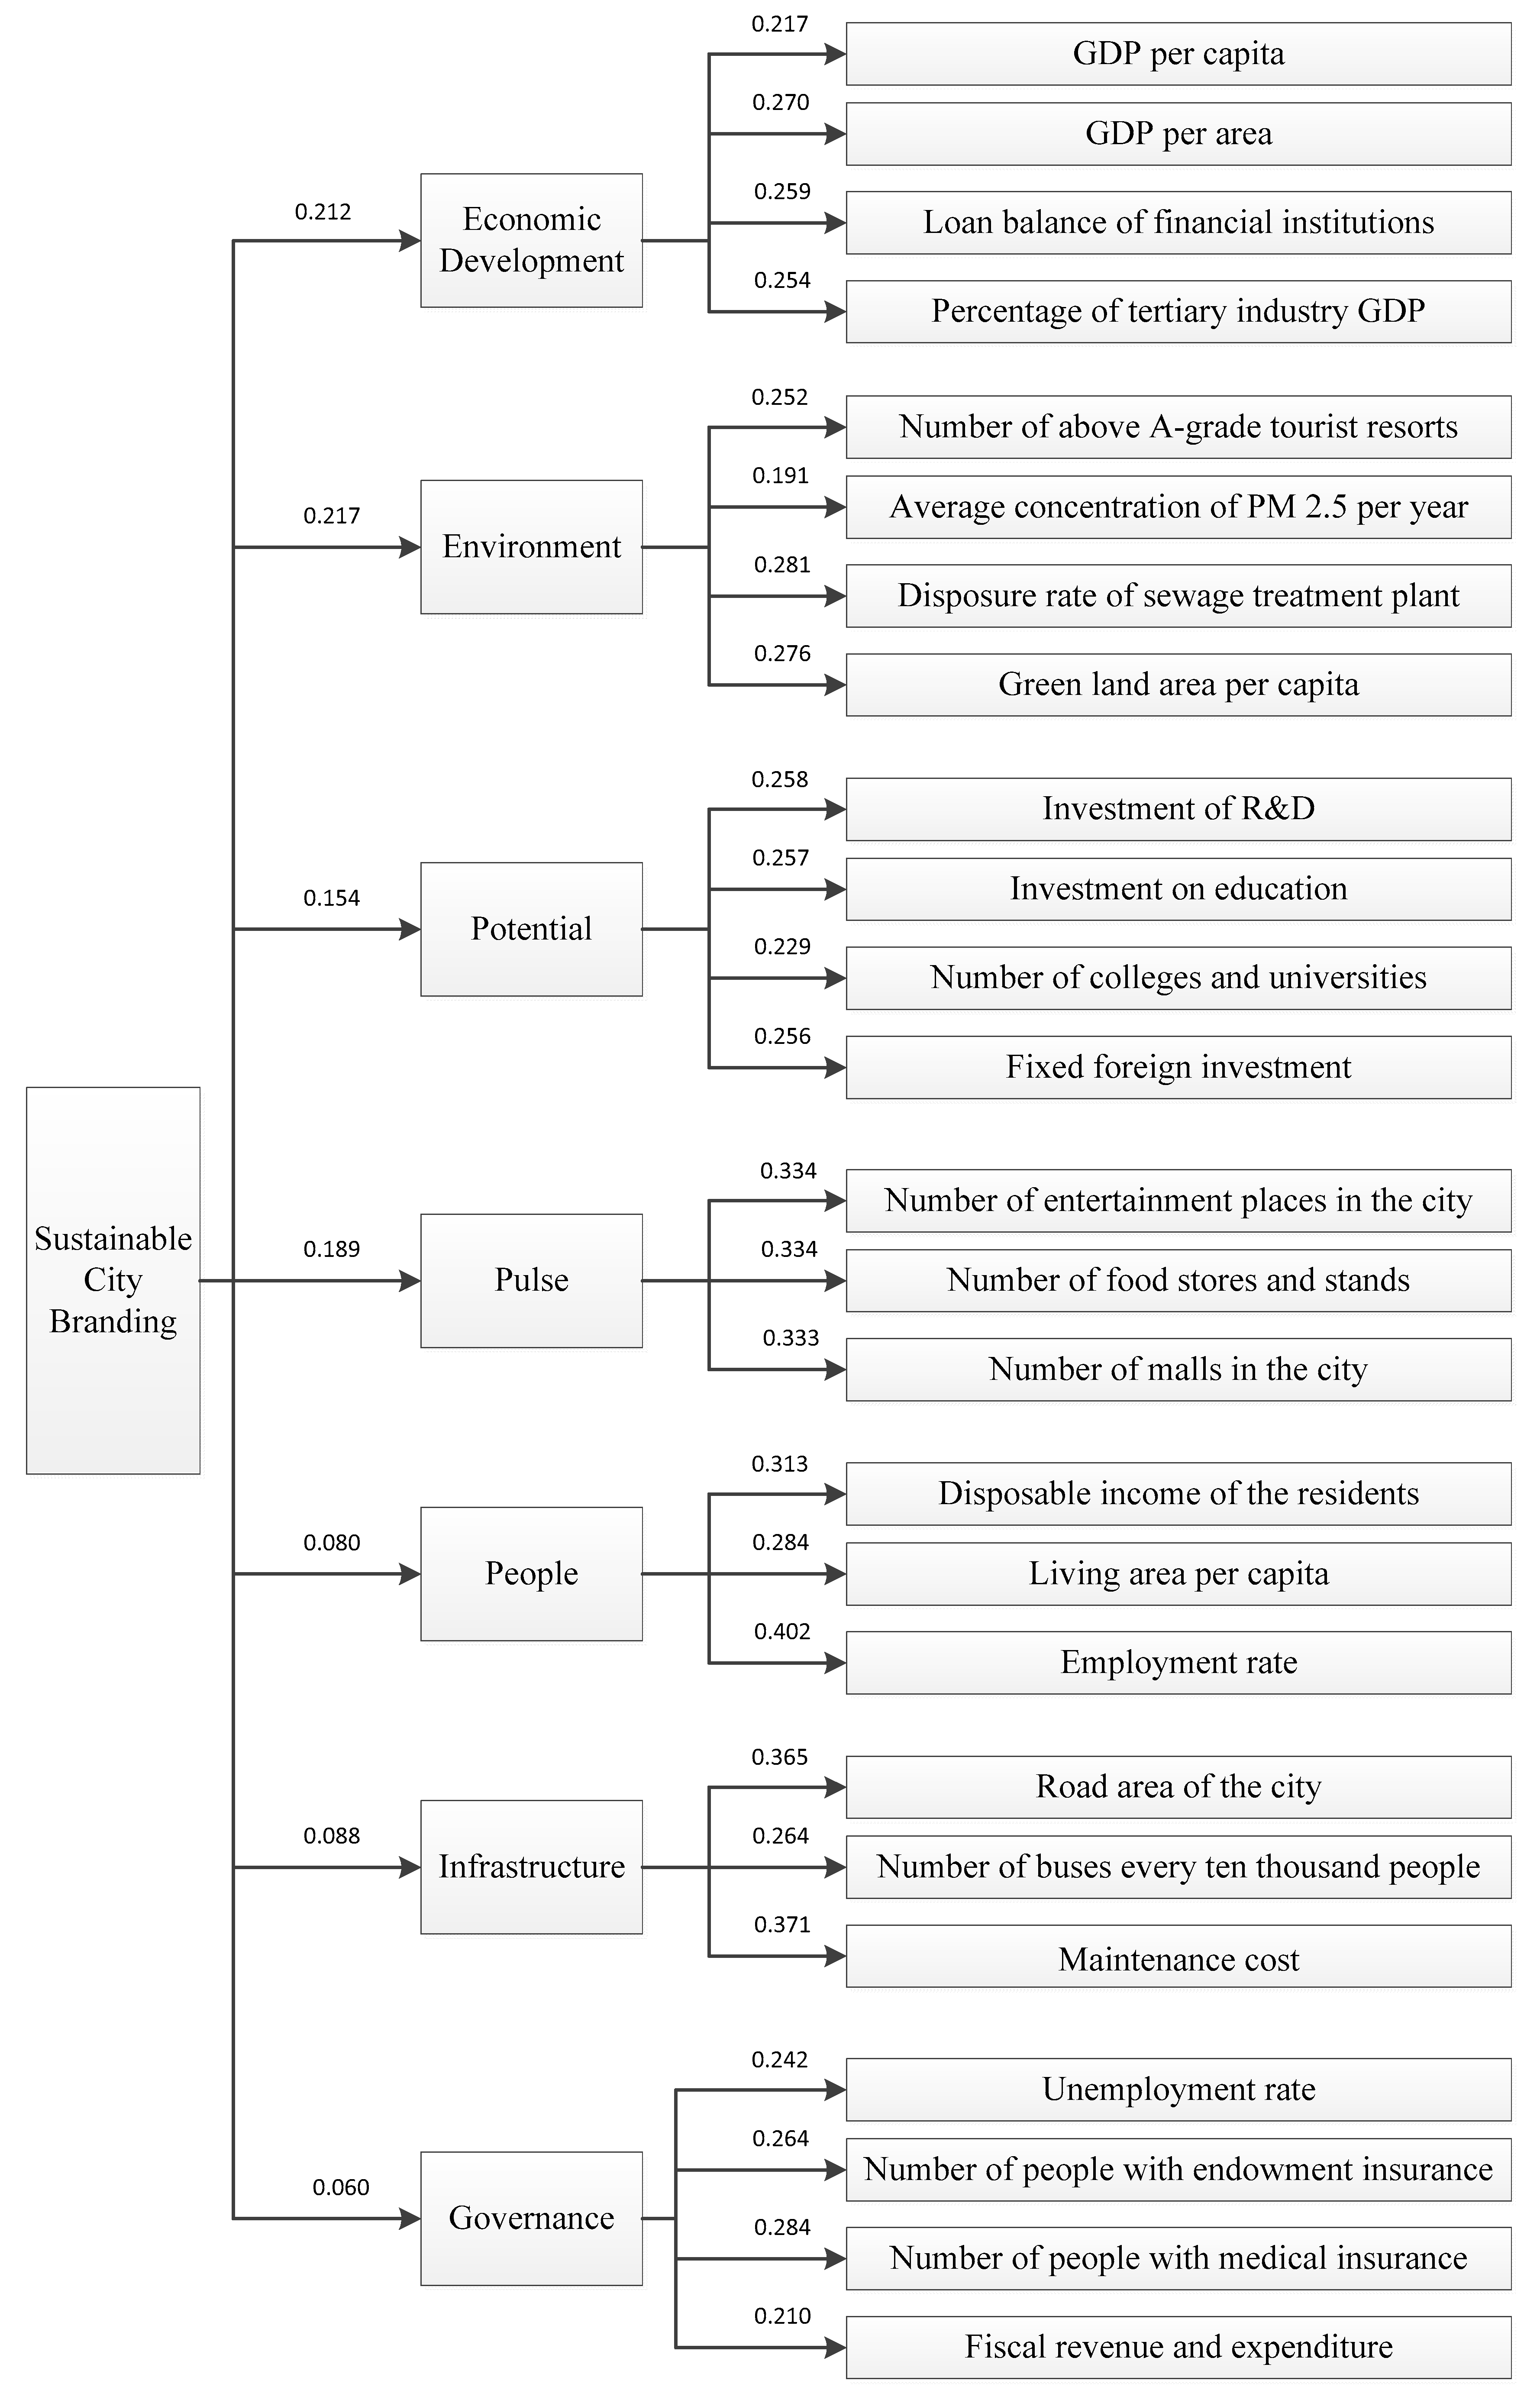
Follow-up questionnaires were delivered and collected from the focus session attendees to understand the relative importance of each category and index. Based on 39 valid responses, the analytic hierarchy process (AHP) and factor analysis were adopted to quantify the weights (Figure 1).
3.2. Study Area, Data and Measurement
The Yangtze River Delta region is located in eastern China, consisting of Shanghai, Jiangsu Province, Zhejiang Province, and Anhui Province. It enjoys a strategic position, as it is the location where the One Belt One Road and the Yangtze River Economic Belt meet. With the national strategy of modernization and comprehensive opening-up, this region has become the most important city cluster in China. It covers an area of merely 211.7 thousand square kilometers (2.2% of the country’s whole), but has a population of 150 million people (11.0% of the country’s whole) with a total GDP of 12.67 trillion yuan (18.5% of the country’s whole).
The city cluster in the region is recognized as the most vigorous, open, and innovative area in China. It is also the area that receives the highest number of migrants. With Shanghai playing the dominant role, there are another 25 prefecture-level cities interconnected in the surrounding area. Nine of them are in Jiangsu Province (i.e., Nanjing, Wuxi, Changzhou, Suzhou, Nantong, Yancheng, Yangzhou, Zhenjiang, and Taizhou); eight in Zhejiang Province (i.e., Hangzhou, Ningbo, Jiaxing, Huzhou, Shaoxing, Jinhua, Zhoushan, Taizhou); and eight in Anhui Province (i.e., Hefei, Wuhu, Ma’anshan, Tongling, Anqing, Chuzhou, Chizhou, and Xuancheng).
The data used in this research was collected from the China City Statistical Yearbook (2015 data) following the definition of indexes in Figure 1. Considering the units of indexes are different from each other and cannot be compared directly, this research adopted the following standardized equation to generate non-dimensional results:
where is the standardized index value, is the original index value for a sample, is the average value across all the samples, and represents standard deviation. Due to the possibility of the occurrence of negative numbers, which might cause inconvenience in understanding, the in each category was scaled to 5 (i.e., the largest value was scaled to 5, while the other values were scaled up accordingly) as and transformed as follows:
Therefore, the output value varies between 0 and 100, with a higher TX indicating a greater performance in the corresponding category.
4. Results and Discussion
4.1. City-Level Analysis
Results from the city-level evaluation are summarized by category in Table 2. Large disparities were identified in the economic development between provinces. Specifically, all the cities in Anhui Province have relatively poor accessibilities in transport (both freight and passenger) connection within the Yangtze River Delta region, leading to their relatively poor economic performances at the regional level. The poor performances can also be explained by the unattractive business policies and the slow transition from the secondary to tertiary industries therein [45]. In addition, the local growth poles play a critical role in leading the provincial economic performance. Suzhou, as the capital of the Jiangsu Province, enjoys the closest proximity to Shanghai and accommodates resource spillover, and, in turn, serves as the driving force to support the economic development of other cities in the provinces. This is reflected in the overall better economic performance in Jiangsu Province than in Zhejiang Province.
Contrary to performances in economic development, cities in Anhui Province rank highly in terms of environmental evaluation due to their natural endowments. Yet, this environmental potential is far from being fully exploited. With the trend of the Beautiful Town and Countryside Movement in China, cities in Anhui should treasure their environmental advantages and develop eco-tourism as part of their branding strategies. Other cities in the region are facing the inevitable environmental problems associated with their rapid urbanization and industrialization processes [46,47]. This calls for policy makers’ attention in transforming the development tracks into the sustainable exploitation of future growth.
The aspects of urban potential and urban pulse prove to be extremely polarized in the Yangtze River Delta region. Shanghai gathers abundant research and recreational resources and largely outweighs the other cities. It plays a leading role in the transformation from the first and second industries to a new service economy, and has experienced the opening of a great number of restaurants and entertainment places. In addition to the booming trend of well-known companies moving in, many local boutiques have appeared [48]. The mixture of traditional assets with international brands shapes the uniqueness of the city. This provides evidence for lagging cities to rethink their stagnant industries, which have great retrofitting potential for future development schemes.
In the people section, it can be easily identified that what makes an aggregable city has nothing to do with its geographic or economic size. Many so-called enormous cities like Shanghai and Nanjing rank quite low compared with their performances in other categories. This offers great opportunities to the traditional second- or third-tier cities, such as Zhoushan, Taizhou, and Shaoxing. These pilot sites could be set as examples to facilitate sustainable city branding in the eyes’ of local residents.
Infrastructure, as the backbone of city operation, plays a fundamental role in improving living conditions, strengthening comprehensive capability, and increasing operational efficiency. According to the results, Nanjing enjoys the greatest infrastructure development, followed by Shanghai. Furthermore, cities in Zhejiang and Jiangsu Province generally achieve higher values in their evaluation outcomes than those in Anhui Province. The lack of infrastructure investment tends to be highly related to performance in other aspects. Therefore, timely incentives should be made to enhance the infrastructure indexes in support of future growth visions.
The competence of urban governance greatly influences the success or failure of policy implementations and residents’ support, which is essential to building up the comprehensive competence of a city. Both Nanjing and Hefei, provincial capital cities, have relatively low evaluation results in terms of governance. This hinders their fast track to development. Only when governments attach importance to city administration and build up a policy system that benefits the people will they succeed in the sustainable development of a city and lift the index values in the ranking list. Additionally, cities in Jiangsu Province such as Suzhou, Wuxi, Nanjing, and Ningbo in Zhejiang Province have better governance performances that confirm the findings of Zhang and Wu [49].
In terms of the overall performance evaluation and ranking, Shanghai is at the heart of the region, and is closely followed by Suzhou (76.7), Hangzhou (75.6), Nanjing (74.8), and Wuxi (71.0). Despite the leading role of these top cities, the performances of the other 21 cities are quite close to their level.
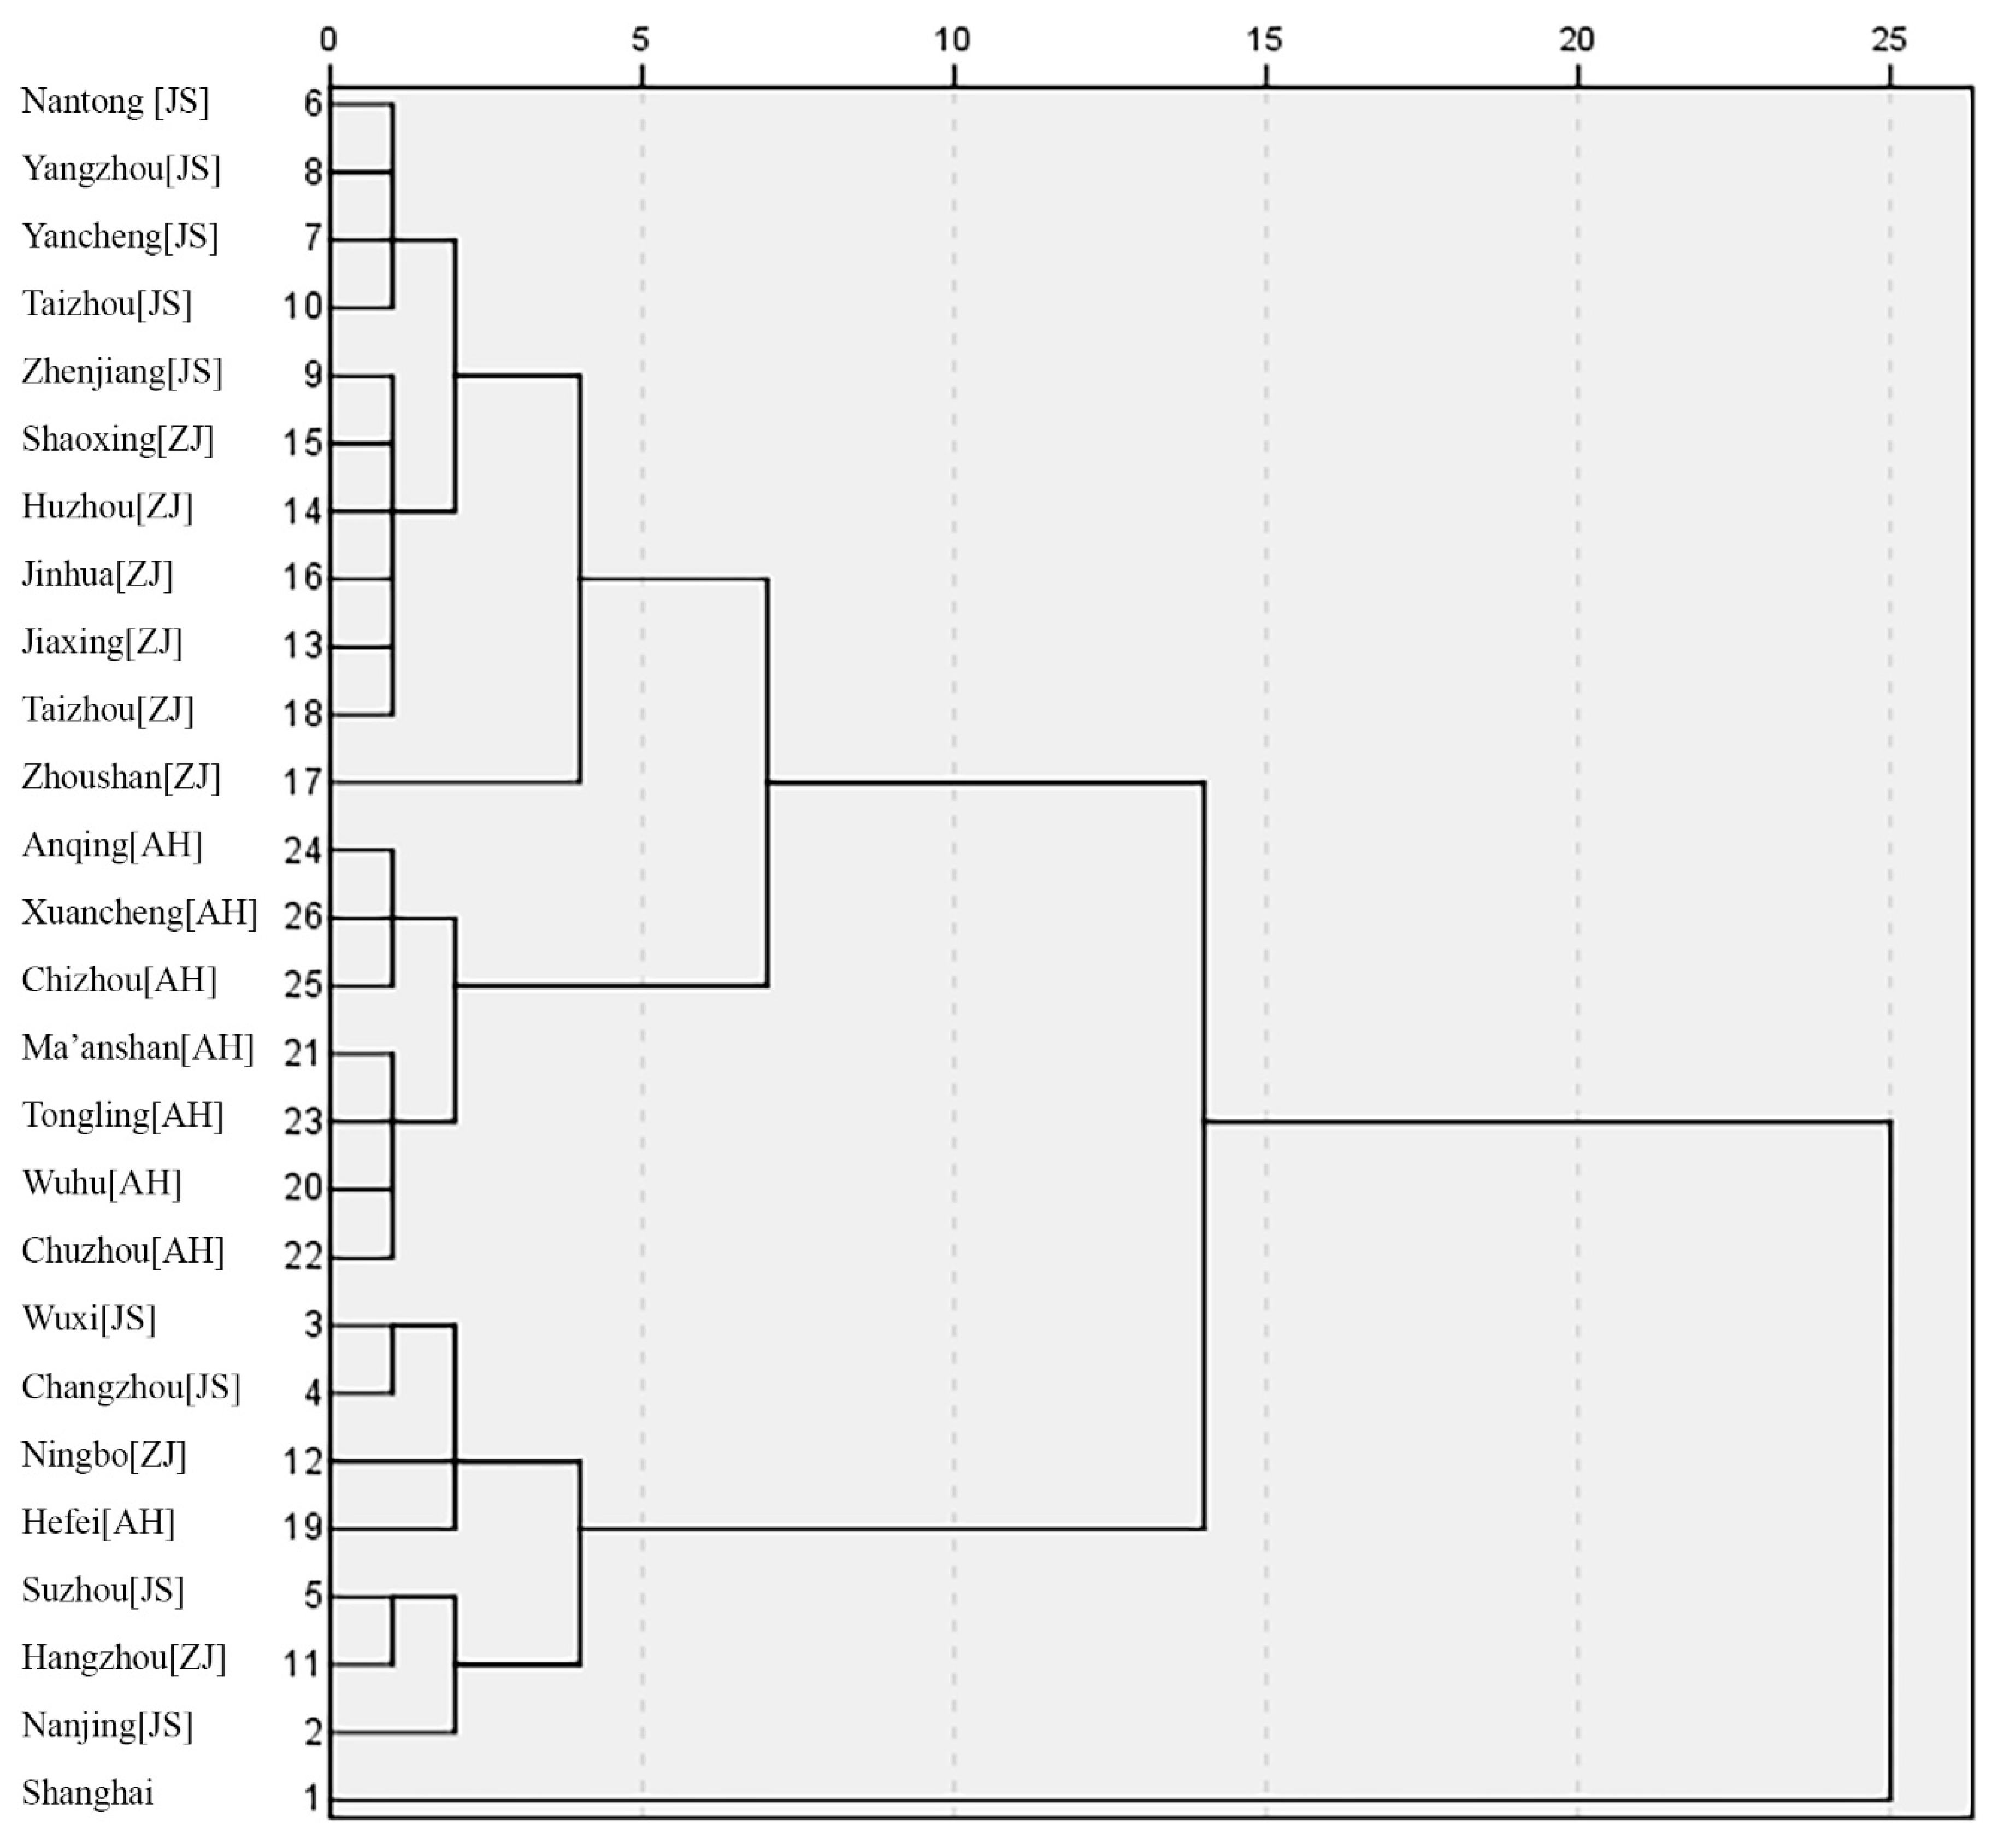
4.2. Cluster Analysis
The cluster analysis in Figure 2 better explains the similarities and differences between the 26 cities. In the first tier, Shanghai defines itself as a sustainable city with great urban branding performances in a comprehensive manner. It ranks first in the categories of economic development, potential, pulse, and governance. Greater efforts could be made from a local people’s perspective, including offering more living areas and increasing the employment rate and disposable income of residents.
The second-tier cities include Nanjing, Hangzhou, Suzhou, Hefei, Ningbo, Changzhou, and Wuxi. Among them, Suzhou, Hangzhou, and Nanjing rank highly in the areas of economic development, potential, pulse, and infrastructure. In particular, Suzhou, being in first place in the category of people, could be a model for other same-tier cities to learn from its agreeable living conditions.
The cities of Zhoushan, Nantong, Yangzhou, Yancheng, Taizhou [JS], Zhenjiang, Shaoxing, Huzhou, Jinhua, Jiaxing, and Taizhou [ZJ] are located mostly in the central area of the Yangtze River Delta region. They have great potential for future growth but are currently restrained by the mega-Shanghai area. They have balanced performances in the evaluation. In the process of building city brands, these cities should thoroughly analyze their own advantages and build up their city brands gradually, starting with specific key points.
The fourth tier involves Chuzhou, Wuhu, Tongling, Ma’anshan, Chizhou, Xuancheng, and Anqing. These seven cities all belong to Anhui Province and have no outstanding advantages in their sustainable urban branding values. Due to the long distance from central Shanghai, these cities should draw upon the radiating power of Nanjing and Hefei and accelerate the development of the local economy.
5. Conclusions
This study has defined a comprehensive sustainability-oriented city branding framework to evaluate current brand values in seven major areas, i.e., economic development, environment, potential, pulse, people, infrastructure, and governance. Stakeholders’ perspectives have been largely considered in deciding the key factors and their corresponding weights. The proposed framework could support urban planners, researchers, and decision-makers to develop policy packages based on a quantitative comparison of cities.
The framework has been applied to 26 prefecture cities in the Yangtze River Delta region. Four clusters of cities with different characteristics have been identified according to their socio-economic status and spatial constraints. The city of Shanghai achieves the highest value in the evaluation, followed by most of the cities in Jiangsu Province. Cities in Zhejiang and Anhui Province do not enjoy the same political and spatial advantages, leading to the relatively weak performance of their brand values. Despite these weaknesses, these cities have greater potential in terms of environment and people. These strengths should be nurtured and defined as potential growth points in their sustainable branding strategies to stimulate overall performance improvement.
A successful and sustainable city branding strategy depends greatly on the identification of distinctive characteristics possessed by the city. Faced with a dearth of uniqueness, third- and fourth-tier cities urgently need to understand their strengths and weaknesses through the comparable evaluation outcomes. This further calls for a regional governance of complementary and synergic growths between cities, where the untapped potentials of individual cities can be explored through a paradigm shift to inter-territorial networks. In addition, continuous, dynamic evaluation of sustainability-oriented brand values should be introduced into the local planning agenda. Long-term monitoring can better place decision-makers to fine-tune and implement sustainable development policies that are beneficial at both the local and regional levels.
Due to the complexity of understanding city performance, the proposed sustainable city branding framework has its limitations. On the one hand, owing to the data availability from officially-released reports or websites, subjective indexes such as quality of life and residents’ satisfaction levels could not be included in this study. Furthermore, the existing framework lacks sufficient insight from international experts, as the factor weights were determined mostly by local people. Despite the limited data sources and information at the pilot stage, this research provides an exemplary case on how a sustainability-oriented city branding framework is constructed and how the evaluation results of city-level performance can be interpreted to inform policy-makers. Future research projects should introduce a more context-specific and dynamic sustainable urban branding framework based on the increasing availability of urban datasets (see, for example, [50,51,52]), and continuous updates on the factor weights.
Author Contributions
Conceptualization, T.Y.; Formal analysis, M.Y.; Funding acquisition, H.P.; Methodology, Y.S.; Supervision, M.Y.; Writing-Original Draft Preparation, P.P. and T.Y.; Writing–Review & Editing, P.P. and H.P.
Funding
This research received no external funding.
Acknowledgments
The authors also appreciate the support from the research associate Yinlong Jiang for his assistance in data processing and analytics.
Conflicts of Interest
The authors declare no conflict of interest.
References
- Keller, K.L.; Apéria, T.; Georgson, M. Strategic Brand Management: A European Perspective; Pearson Education: London, UK, 2008. [Google Scholar]
- Kavaratzis, M. From city marketing to city branding: Towards a theoretical framework for developing city brands. Place Branding Public Dipl. 2004, 1, 58–73. [Google Scholar] [CrossRef]
- Anttiroiko, A.V. City Branding as a Response to Global Intercity Competition. Growth Chang. 2015, 46, 233–252. [Google Scholar] [CrossRef]
- Riza, M.; Doratli, N.; Fasli, M. City branding and identity. Procedia Soc. Behav. Sci. 2012, 35, 293–300. [Google Scholar] [CrossRef]
- Rehan, R.M. Urban branding as an effective sustainability tool in urban development. HBRC J. 2014, 10, 222–230. [Google Scholar] [CrossRef] [Green Version]
- Dinnie, K. City Branding: Theory and Cases; Palgrave Macmillan: Basingstoke, UK, 2011. [Google Scholar]
- Lucarelli, A.; Berg, P. City branding: A state-of-the-art review of the research domain. J. Place Manag. Dev. 2011, 4, 9–27. [Google Scholar] [CrossRef]
- Bagaeen, S. Brand Dubai: The instant city; or the instantly recognizable city. Int. Plan. Stud. 2007, 12, 173–197. [Google Scholar] [CrossRef]
- Anholt, S. The Anholt-GMI city brands index: How the world sees the world’s cities. Place Branding Public Dipl. 2006, 2, 18–31. [Google Scholar] [CrossRef]
- Kotler, P. Marketing Management: A South Asian Perspective; Pearson Education India: New Delhi, India, 2009. [Google Scholar]
- Balmer, J.M.; Harris, F.; de Chernatony, L. Corporate branding and corporate brand performance. Eur. J. Mark. 2001, 35, 441–456. [Google Scholar]
- Farquhar, J.D. Branding in UK banks and building societies: a relationship approach. J. Strateg. Mark. 2011, 19, 43–56. [Google Scholar] [CrossRef]
- Hankinson, G. Relational network brands: Towards a conceptual model of place brands. J. Vacat. Mark. 2004, 10, 109–121. [Google Scholar] [CrossRef]
- Anttiroiko, A.V. The Political Economy of City Branding; Routledge: Abington, UK, 2014. [Google Scholar]
- Bickford-Smith, V. Creating a city of the tourist imagination: The case of Cape Town, ‘The fairest Cape of them all’. Urban Stud. 2009, 46, 1763–1785. [Google Scholar] [CrossRef]
- Greenberg, M. Branding cities a social history of the urban lifestyle magazine. Urban Aff. Rev. 2000, 36, 228–263. [Google Scholar] [CrossRef]
- Hankinson, G. The management of destination brands: Five guiding principles based on recent developments in corporate branding theory. J. Brand Manag. 2007, 14, 240–254. [Google Scholar] [CrossRef]
- Zenker, S.; Petersen, S.; Aholt, A. The Citizen Satisfaction Index (CSI): Evidence for a four basic factor model in a German sample. Cities 2013, 31, 156–164. [Google Scholar] [CrossRef]
- Biel, A.L. Converting image into equity. Brand Equity Advert. Advert. Role Build. Strong Brands 1993, 26, 67–82. [Google Scholar]
- Kotler, P.; Gertner, D. Country as brand, product, and beyond: A place marketing and brand management perspective. J. Brand Manag. 2002, 9, 249–261. [Google Scholar] [CrossRef]
- Guhathakurta, S.; Stimson, R.J. What is driving the growth of New “Sunbelt” Metropolises? Quality of life and urban regimes in Greater Phoenix and Brisbane-South East Queensland Region. Int. Plan. Stud. 2007, 12, 129–152. [Google Scholar] [CrossRef]
- Insch, A.; Florek, M. A great place to live, work and play: Conceptualising place satisfaction in the case of a city’s residents. J. Place Manag. Dev. 2008, 1, 138–149. [Google Scholar] [CrossRef]
- Papadopoulos, N.; Heslop, L. Country equity and country branding: Problems and prospects. J. Brand Manag. 2002, 9, 294–314. [Google Scholar] [CrossRef]
- Blain, C.; Levy, S.E.; Ritchie, J.B. Destination branding: Insights and practices from destination management organizations. J. Travel Res. 2005, 43, 328–338. [Google Scholar] [CrossRef]
- Pike, S. Tourism destination branding complexity. J. Prod. Brand Manag. 2005, 14, 258–259. [Google Scholar] [CrossRef] [Green Version]
- Lim, L.; Yang, T.; Vialard, A.; Feng, C.; Peponis, J. Urban morphology and syntactic structure: A discussion of the relationship of block size to street integration in some settlements in the Provence. J. Space Syntax 2015, 6, 142–169. [Google Scholar]
- Hankinson, G. Destination brand images: a business tourism perspective. J. Serv. Mark. 2005, 19, 24–32. [Google Scholar] [CrossRef]
- Lynch, K. The Image of the City; MIT Press: Cambridge, MA, USA, 1960; Volume 11. [Google Scholar]
- Ashworth, G.; Kavaratzis, M. Beyond the logo: Brand management for cities. J. Brand Manag. 2009, 16, 520–531. [Google Scholar] [CrossRef]
- Knapp, D.; Becker, B. The Brand Science Guide for Destination RFPs; Brand Strategy, Inc.: Anacortes, WA, USA, 2004. [Google Scholar]
- Florida, R.; Gates, G. Technology and tolerance: The importance of diversity to high-technology growth. In The City as an Entertainment Machine; Research in Urban Policy; Emerald Group Publishing Limited: Bingley, UK, 2003; Volume 9, pp. 199–219. [Google Scholar]
- Merrilees, B.; Miller, D.; Herington, C. City branding: A facilitating framework for stressed satellite cities. J. Bus. Res. 2013, 66, 37–44. [Google Scholar] [CrossRef]
- Jan D’Auria, A. City networks and sustainability—The role of knowledge and of cultural heritage in globalization. Int. J. Sustain. High. Educ. 2001, 2, 38–47. [Google Scholar] [CrossRef]
- Yang, T.; Pan, H.; Hewings, G.; Jin, Y. Understanding urban sub-centers with heterogeneity in agglomeration economies—Where do emerging commercial establishments locate? Cities 2019, 86, 25–36. [Google Scholar] [CrossRef]
- Hu, L.; Yang, J.; Yang, T.; Tu, Y.; Zhu, J. Urban Spatial Structure and Travel in China. J. Plan. Lit. 2019. [Google Scholar] [CrossRef]
- Rosi, M. Branding or sharing?: The dialectics of labeling and cooperation in the UNESCO Creative Cities Network. City Cult. Soc. 2014, 5, 107–110. [Google Scholar] [CrossRef]
- Paganoni, M.C. City Branding and Social Inclusion in the Glocal City. Mobilities 2012, 7, 13–31. [Google Scholar] [CrossRef]
- Keiner, M.; Kim, A. Transnational City Networks for Sustainability. Eur. Plan. Stud. 2007, 15, 1369–1395. [Google Scholar] [CrossRef]
- Wittmayer, J.M.; Mizuguchi, S.; Rach, S.; Fujino, J. City Networks for Sustainability Transitions in Europe and Japan. In Governance of Urban Sustainability Transitions; Loorbach, D., Wittmayer, J.M., Shiroyama, H., Fujino, J., Mizuguchi, S., Eds.; Springer: Tokyo, Japan, 2016; pp. 33–45. [Google Scholar]
- Sevin, H.E. Understanding cities through city brands: City branding as a social and semantic network. Cities 2014, 38, 47–56. [Google Scholar] [CrossRef]
- Wu, C.; Yang, T.; Pei, P.; Chen, H. Community Perception of Management Goals in Matoushan National Nature Reserve. Plan. Malays. J. 2016, 14. [Google Scholar] [CrossRef]
- Pan, H.; Deal, B.; Chen, Y.; Hewings, G. A Reassessment of urban structure and land-use patterns: distance to CBD or network-based?—Evidence from Chicago. Reg. Sci. Urban Econ. 2018, 70, 215–228. [Google Scholar] [CrossRef]
- Pan, H.; Deal, B.; Destouni, G.; Zhang, Y.; Kalantari, Z. Sociohydrology modeling for complex urban environments in support of integrated land and water resource management practices. Land Degrad. Dev. 2018, 29, 3639–3652. [Google Scholar] [CrossRef] [Green Version]
- Pan, H.; Zhang, L.; Cong, C.; Deal, B.; Wang, Y. A dynamic and spatially explicit modeling approach to identify the ecosystem service implications of complex urban systems interactions. Ecol. Indic. 2019, 102, 426–436. [Google Scholar] [CrossRef]
- Fitzgerald, J. Rethinking China’s Provinces; Routledge: Abington, UK, 2003. [Google Scholar]
- Yang, T.; Zhang, X. Benchmarking the building energy consumption and solar energy trade-offs of residential neighborhoods on Chongming Eco-Island, China. Appl. Energy 2016, 180, 792–799. [Google Scholar] [CrossRef]
- Yang, T.; Chen, H.; Zhang, Y.; Zhang, S.; Feng, F. Towards Low-Carbon Urban Forms: A Comparative Study on Energy Efficiencies of Residential Neighborhoods in Chongming Eco-Island. In Cue 2015—Applied Energy Symposium and Summit 2015: Low Carbon Cities and Urban Energy Systems; Yan, J., Chen, B., Yang, J., Eds.; Elsevier Science Bv: Amsterdam, The Netherlands, 2016; pp. 321–324. [Google Scholar]
- Yung, E.H.K.; Chan, E.H.W.; Xu, Y. Sustainable development and the rehabilitation of a historic urban district–Social sustainability in the case of Tianzifang in Shanghai. Sustain. Dev. 2014, 22, 95–112. [Google Scholar] [CrossRef]
- Zhang, J.; Wu, F. China’s changing economic governance: Administrative annexation and the reorganization of local governments in the Yangtze River Delta. Reg. Stud. 2006, 40, 3–21. [Google Scholar] [CrossRef]
- Yang, T.; Jin, Y.; Yan, L.; Pei, P. Aspirations and realities of polycentric development: Insights from multi-source data into the emerging urban form of Shanghai. Environ. Plan. B Urban Anal. City Sci. 2019. [Google Scholar] [CrossRef]
- Pan, H.; Page, J.; Zhang, L.; Chen, S.; Cong, C.; Destouni, G.; Kalantari, Z.; Deal, B. Using comparative socio-ecological modeling to support Climate Action Planning (CAP). J. Clean. Prod. 2019, 232, 30–42. [Google Scholar] [CrossRef]
- Pan, H.; Deal, B. Reporting on the Performance and Usability of Planning Support Systems—Towards a Common Understanding. Appl. Spat. Anal. Policy 2019, 1–23. [Google Scholar] [CrossRef]
Figure 1.
Sustainability-oriented city branding framework.

Figure 2.
Cluster analysis of the 26 cities.


Table 1.
Major models of city branding.
| Framework | Category | Index |
|---|---|---|
| Citizen Satisfaction Index [18] | Urbanity and density | Cultural activities, shopping opportunities, services, openness, etc. |
| Nature and recreation | Green area, environmental quality, parks, outdoor-activities, tranquility, etc. | |
| Job opportunities | Level of wages, job and promotion opportunities, economic growth, professional networks, etc. | |
| Cost-efficiency | Housing market, price level, availability of apartments and houses, etc. | |
| Overall satisfaction | Level of satisfaction, etc. | |
| Brand Images (Business Tourism) [27] | Physical environment | Attractive environment, interesting architecture, etc. |
| Economic activity | Tourism/industrial, leisure/business, etc. | |
| Business tourism facilities | Conference facilities, venues, standards, etc. | |
| Accessibility | Transport links, etc. | |
| Social facilities | Suitable for incentive events, etc. | |
| Strength of reputation | Marketing, identity, etc. | |
| People’s characteristics | Vibrant/retirement place, young, etc. | |
| Size | Cities/suburbs, smaller/bigger cities, etc. | |
| Other | Dimensions relating to cost, international associations, etc. | |
| The Anholt-GMI City Brands Index [9] | Presence | Familiarity, cultural contribution to the world, etc. |
| Place | Suitable for tourism, city image, etc. | |
| Potential | Economic and educational opportunities, etc. | |
| Pulse | Excitement, how easy is it to find interesting things, etc. | |
| People | Inhabitants, friendliness, etc. | |
| Prerequisites | Basic qualities of the city, public amenities, etc. | |
| City Branding [32] | Nature | Green belts, outdoor areas, etc. |
| Business/job opportunities | Innovation, local business, etc. | |
| Shopping | Cafes, homewares stores, etc. | |
| Transport | Developed road networks, etc. | |
| Cultural activities | Live shows, entertainment activities, etc. | |
| Government services | Public health-care access, education faculties, etc. | |
| Social bonding | Family life, cultural diversity, etc. | |
| Brand | Reputation, lifestyle, etc. |
Table 2.
City-level evaluation based on the sustainability-oriented city branding framework in the Yangtze River Delta region.
Table 2.
City-level evaluation based on the sustainability-oriented city branding framework in the Yangtze River Delta region.
| City | Economic | Environment | Potential | Pulse | People | Infrastructure | Governance | Overall |
|---|---|---|---|---|---|---|---|---|
| Shanghai | 100 (1) | 100 (1) | 100 (1) | 100 (1) | 74 (18) | 92 (2) | 100 (1) | 100 (1) |
| Suzhou[JS] | 77 (2) | 79 (17) | 64 (2) | 74 (2) | 100 (1) | 88 (3) | 71 (3) | 77 (2) |
| Hangzhou[ZJ] | 74 (5) | 87 (5) | 64 (3) | 71 (3) | 92 (5) | 81 (5) | 75 (2) | 76 (3) |
| Nanjing[JS] | 77 (3) | 87 (4) | 61 (4) | 64 (4) | 86 (14) | 100 (1) | 64 (9) | 75 (4) |
| Wuxi[JS] | 75 (4) | 88 (2) | 55 (7) | 61 (6) | 90 (10) | 73 (7) | 68 (5) | 71 (5) |
| Hefei[AH] | 60 (16) | 88 (3) | 59 (5) | 60 (7) | 64 (23) | 87 (4) | 62 (11) | 68 (6) |
| Ningbo[ZJ] | 68 (7) | 71 (23) | 57 (6) | 62 (5) | 90 (8) | 76 (6) | 64 (10) | 67 (7) |
| Changzhou[JS] | 68 (6) | 81 (11) | 52 (9) | 58 (9) | 84 (15) | 68 (9) | 70 (4) | 67 (8) |
| Shaoxing[ZJ] | 62 (10) | 86 (6) | 51 (14) | 53 (15) | 92 (4) | 64 (13) | 68 (6) | 65 (9) |
| Nantong[JS] | 62 (11) | 81 (10) | 54 (8) | 55 (12) | 91 (6) | 67 (10) | 60 (15) | 64 (10) |
| Jinhua[ZJ] | 61 (14) | 77 (18) | 50 (15) | 59 (8) | 89 (11) | 58 (23) | 65 (7) | 63 (11) |
| Zhenjiang[JS] | 66 (8) | 80 (15) | 50 (16) | 51 (18) | 86 (13) | 65 (11) | 60 (17) | 63 (12) |
| Jiaxing[ZJ] | 62 (12) | 72 (22) | 52 (11) | 55 (13) | 89 (12) | 63 (14) | 65 (8) | 62 (13) |
| Yangzhou[JS] | 61 (13) | 76 (19) | 51 (13) | 54 (14) | 83 (16) | 60 (19) | 58 (20) | 62 (14) |
| Taizhou[ZJ] | 59 (17) | 75 (20) | 48 (23) | 55 (10) | 95 (3) | 62 (15) | 59 (19) | 61 (15) |
| Huzhou[ZJ] | 58 (18) | 81 (12) | 49 (19) | 50 (19) | 90 (9) | 60 (17) | 61 (14) | 61 (16) |
| Wuhu[AH] | 54 (21) | 79 (16) | 52 (10) | 49 (20) | 72 (19) | 70 (8) | 61 (12) | 60 (17) |
| Taizhou[JS] | 60 (15) | 68 (25) | 49 (18) | 51 (17) | 90 (7) | 58 (24) | 61 (13) | 60 (18) |
| Zhoushan[ZJ] | 64 (9) | 67 (26) | 48 (24) | 47 (24) | 97 (2) | 64 (12) | 57 (24) | 59 (19) |
| Xuancheng[AH] | 51 (24) | 85 (7) | 48 (22) | 55 (11) | 66 (21) | 56 (25) | 56 (25) | 59 (20) |
| Yancheng[JS] | 56 (19) | 70 (24) | 51 (12) | 53 (16) | 80 (17) | 59 (21) | 57 (23) | 59 (21) |
| Tongling[AH] | 54 (20) | 82 (8) | 48 (25) | 46 (26) | 67 (20) | 62 (16) | 59 (18) | 58 (22) |
| Ma’anshan[AH] | 53 (22) | 81 (13) | 49 (17) | 47 (23) | 62 (24) | 60 (20) | 58 (21) | 58 (23) |
| Chuzhou[AH] | 48 (26) | 82 (9) | 49 (21) | 48 (22) | 65 (22) | 60 (18) | 60 (16) | 57 (24) |
| Anqing[AH] | 50 (25) | 81 (14) | 49 (20) | 49 (21) | 60 (25) | 59 (22) | 58 (22) | 57 (25) |
| Chizhou[AH] | 52 (23) | 72 (21) | 48 (26) | 46 (25) | 58 (26) | 55 (26) | 55 (26) | 55 (26) |
Note: the abbreviations in the square brackets indicate the province a city belongs to, where JS stands for Jiangsu, ZJ represents Zhejiang, and AH denotes Anhui.
© 2019 by the authors. Licensee MDPI, Basel, Switzerland. This article is an open access article distributed under the terms and conditions of the Creative Commons Attribution (CC BY) license (http://creativecommons.org/licenses/by/4.0/).
Share and Cite
MDPI and ACS Style
Yang, T.; Ye, M.; Pei, P.; Shi, Y.; Pan, H. City Branding Evaluation as a Tool for Sustainable Urban Growth: A Framework and Lessons from the Yangtze River Delta Region. Sustainability 2019, 11, 4281. https://doi.org/10.3390/su11164281
AMA Style
Yang T, Ye M, Pei P, Shi Y, Pan H. City Branding Evaluation as a Tool for Sustainable Urban Growth: A Framework and Lessons from the Yangtze River Delta Region. Sustainability. 2019; 11(16):4281. https://doi.org/10.3390/su11164281
Chicago/Turabian StyleYang, Tianren, Minghai Ye, Pei Pei, Yongjiang Shi, and Haozhi Pan. 2019. "City Branding Evaluation as a Tool for Sustainable Urban Growth: A Framework and Lessons from the Yangtze River Delta Region" Sustainability 11, no. 16: 4281. https://doi.org/10.3390/su11164281
Note that from the first issue of 2016, this journal uses article numbers instead of page numbers. See further details here.