Using Kolb’s Learning Cycle to Improve Student Sustainability Knowledge


1
Department of Civil & Environmental Engineering, The Citadel, The Military College of South Carolina, Charleston, SC 29409, USA
2
VMware, Atlanta, GA 30338, USA
3
The University of New Orleans, New Orleans, LA 70718, USA
4
The Georgia Institute of Technology, Atlanta, GA 30332, USA
*
Author to whom correspondence should be addressed.
Sustainability 2019, 11(17), 4602; https://doi.org/10.3390/su11174602
Submission received: 22 July 2019
/
Revised: 18 August 2019
/
Accepted: 20 August 2019
/
Published: 24 August 2019
(This article belongs to the Section Sustainable Education and Approaches)
Abstract
:Engineers are increasingly called upon to develop and implement innovative solutions that serve a growing population, while simultaneously exploiting fewer resources and minimizing environmental impacts. As such, improvements in undergraduate curricula are needed to train students to operate under a sustainable development paradigm. A learning-cycle-based sustainability module was adapted and implemented in a cornerstone design course within a civil engineering program at a large, research-intensive institution in the United States. One cornerstone cohort participated in a peer-lecture version of the module, while the second cohort participated in a peer-discussion version. Concept maps, scored using three different methods, were used to measure changes in students’ sustainability knowledge. A self-report survey was used to measure changes in students’ perceptions of their sustainability knowledge and skills. Students in both the peer-lecture and peer-discussion cohorts demonstrated improved sustainability knowledge networks and confidences after participation in the module. However, peer-lecture students showed greater improvements in knowledge connectedness (a feature of expert-like knowledge) than peer-discussion students. Regardless of cohort, cornerstone students demonstrated greater gains in knowledge and confidence than did a cohort of capstone students who participated in an earlier implementation of the module. Future implementations may be most impactful if the peer-discussion format is integrated into early design courses.
1. Introduction
Engineers are especially poised to contribute to a sustainable future, as they are the designers of society’s infrastructure, industrial processes, and many consumer products. However, undergraduate curricula often train students to become proficient in disciplinary design protocols, while management of sustainability issues requires students to exercise systems and inter/trans-disciplinary thinking to balance the interrelated technical, economic, environmental, and social dimensions of a problem [1,2,3,4]. Thus, significant changes in engineering education are needed to equip students to tackle complex problems.
1.1. Engineering Education for Sustainable Development
A variety of educators have used a modular approach to infuse sustainability into traditional and sustainability-focused engineering courses [5]. For example, Bedoya-Valenci et al. [6] added a sustainability module, including presentations and discussions related to the triple bottom line, into a general first-year engineering course and noted improvements in student awareness of sustainability. To tackle the social dimension in a Sustainability in Civil and Environmental Systems course, Flynn et al. [7] implemented a case-based module and found improved confidence in knowledge of how stakeholders influence engineering decisions, as well as improved student motivation. In addition, a series of sustainability modules developed for integration into existing industrial engineering courses were shown to improve student interest in sustainable design [8]. To prepare industrial engineering students to integrate sustainability into their capstone projects, Yuan et al. [9] used a module to encourage students to use the considerations of system, time, energy, modeling, people, and scale [10] when engaging in sustainable design. Consequently, sustainability modules are used by at many academic levels across a variety of disciplines [5].
The pedagogical approach used to disseminate a module or course can also impact the quality of curricular reforms. While lecture-based instruction dominates in engineering education [11], research has shown that more engaging and student-centered pedagogies more effectively promote student learning [12]. Indeed, empirical research concurs that innovative pedagogies are effective for facilitating effective teaching and learning related to sustainability. For instance, expert perceptions of pedagogies for sustainability education were explored by Segalàs et al. [13] through interviews. Almost all experts (88%) supported project-based learning as the most advantageous “active” strategy for introducing sustainability to students. Even so, many instructors (71%) also supported traditional lecturing as being important for providing students with fundamental information before engaging in active learning. Other popular active pedagogies included use of case studies (41%) and discussions and debates (29%). Expert beliefs about sustainable education were confirmed in another work by Segalàs and collaborators [14], which showed that student learning about sustainability was improved when experiential and active learning pedagogies were used in the classroom. Thus, student learning about sustainability can be encouraged by providing opportunities for collaborative, student-driven experiences.
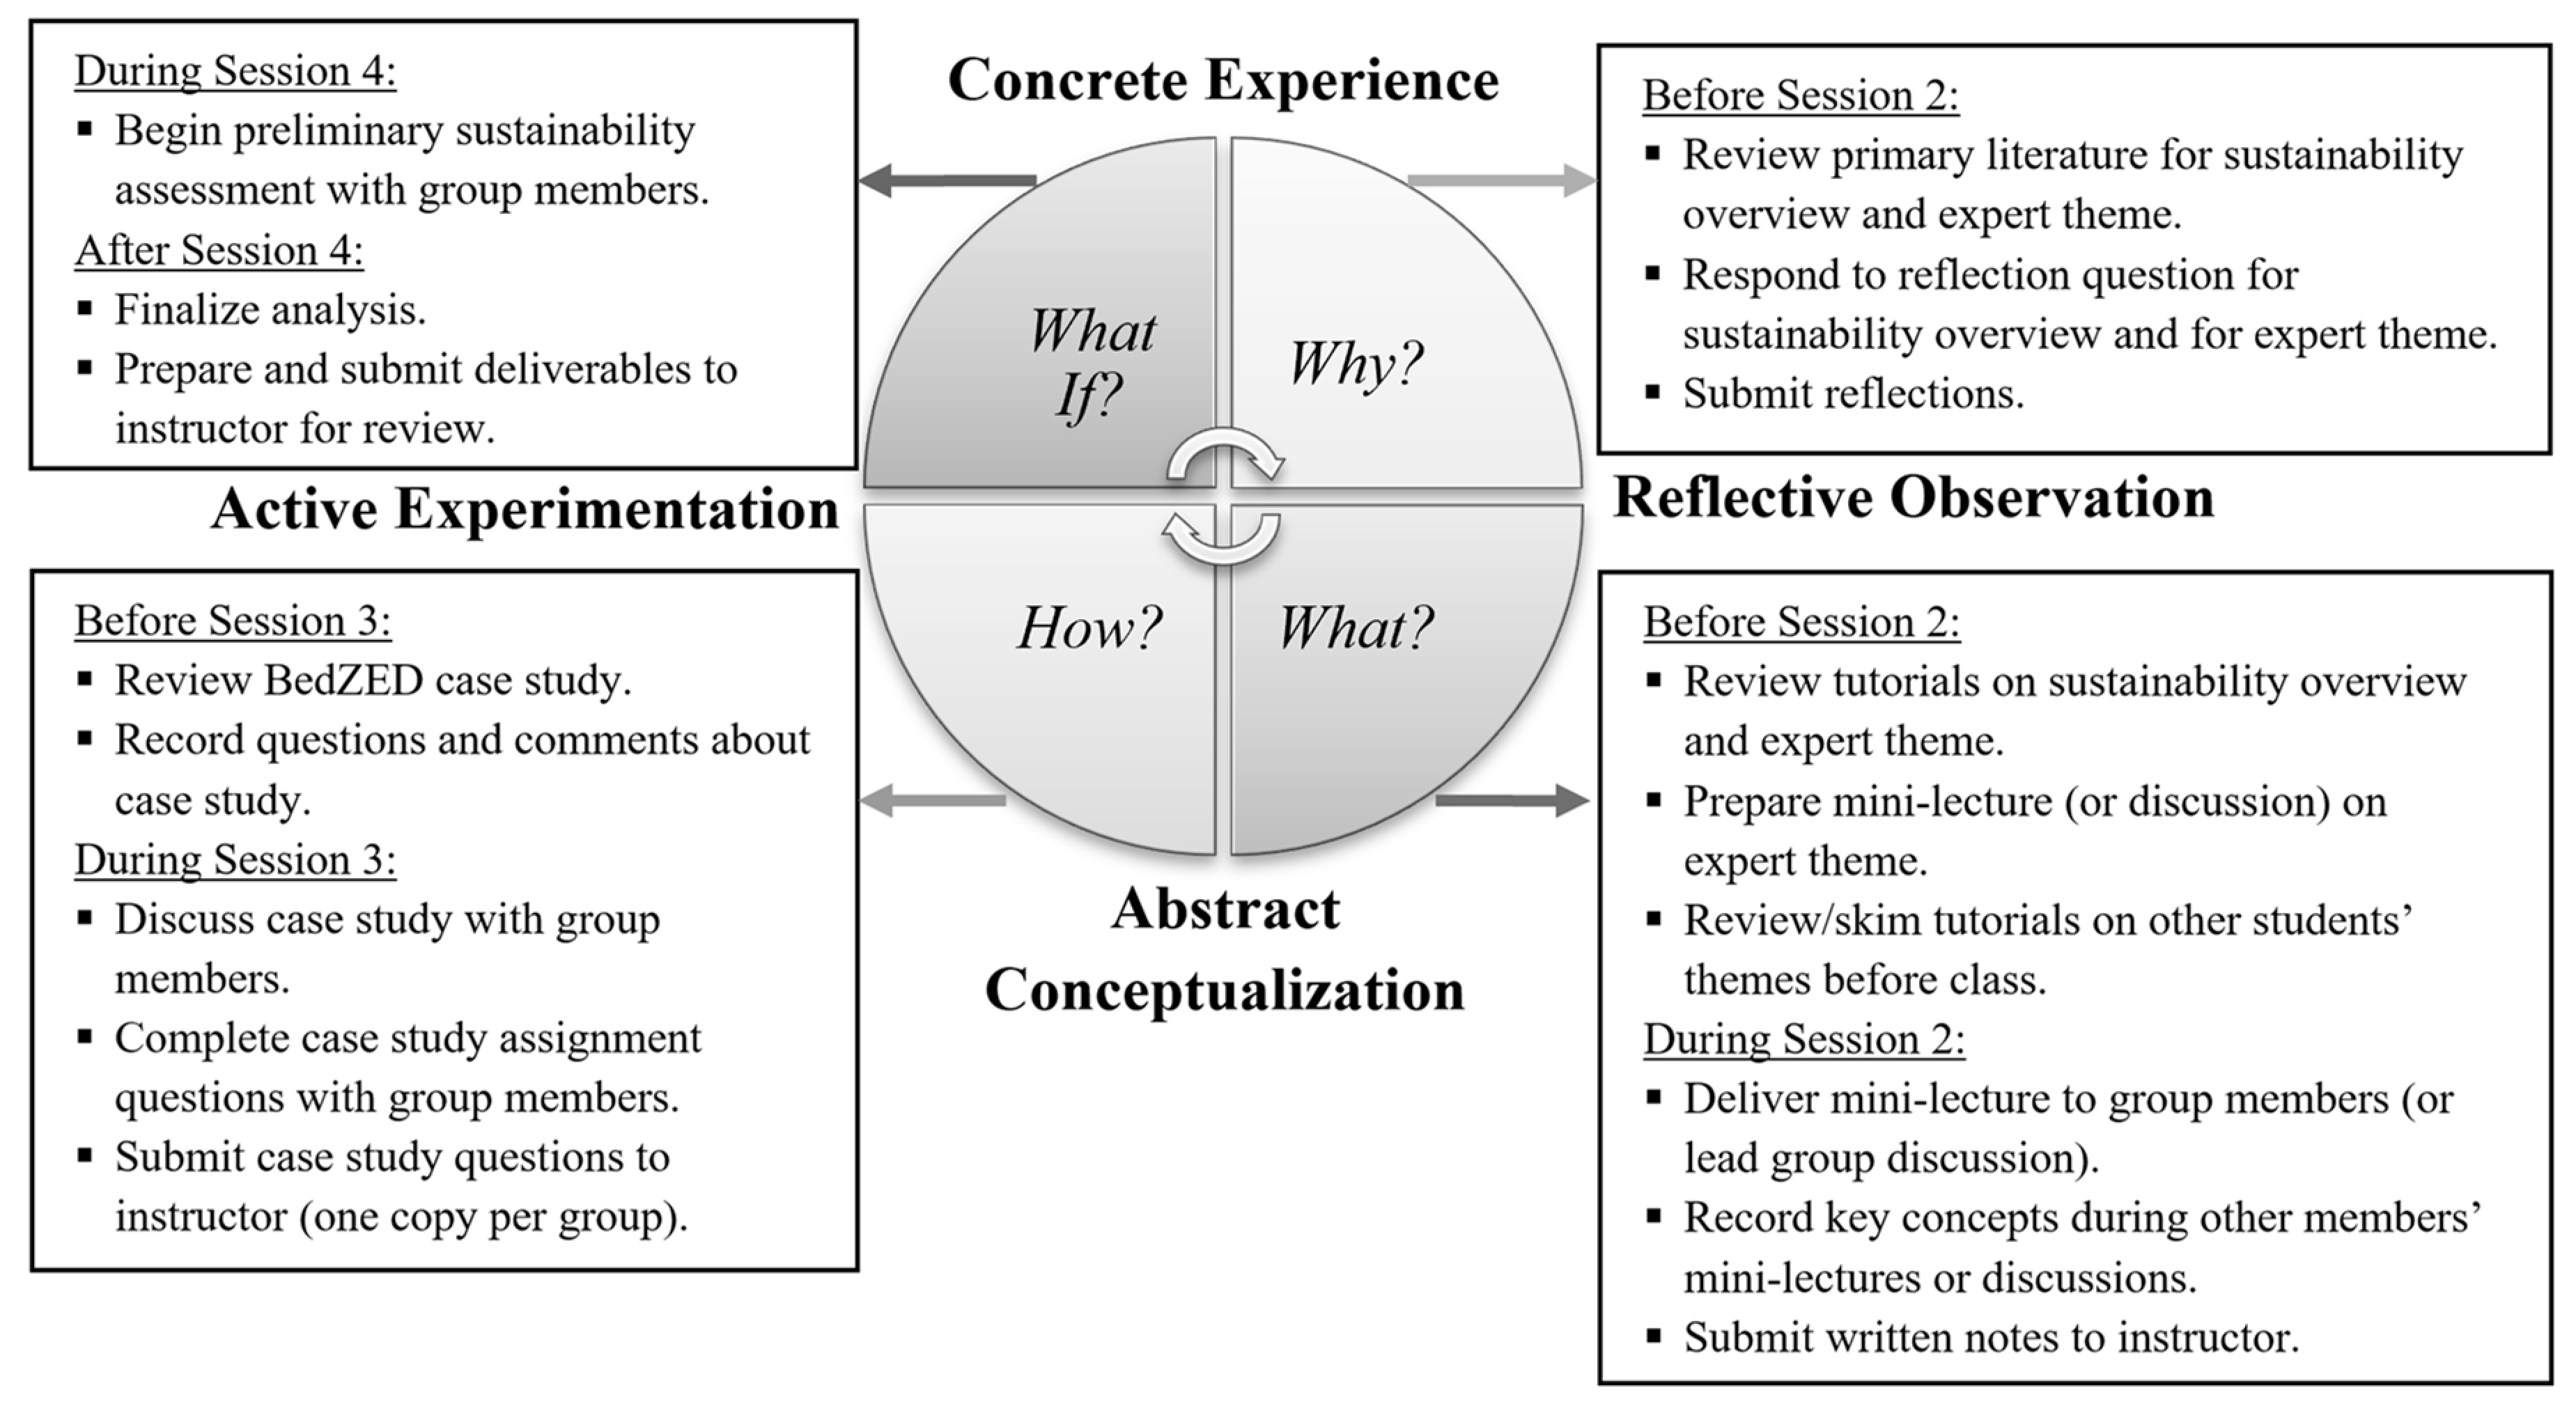
One learning theory that can be used to design student-centered learning experiences that promote sustainability learning is experiential learning theory [7,15,16]. Originally proposed by Kolb and based on constructivist theory, experiential learning theory is a model for adult development which asserts that experiences play a key role in the learning process. Experiential learning theory postulates that learning is “the process whereby knowledge is created through the transformation of experience” [17]. Furthermore, Kolb postulates that complete learning occurs when students engage in all phases of a learning cycle (Figure 1). Learning begins when a student engages in a given experience (CE) and continues as he or she reflects on that experience (RO). Student reflection leads to development of logical conclusions, to which theoretical or expert ideas can be added (AC). Finally, students apply and test new concepts and skills (AE) to develop templates for new experiences (CE) [17,18]. Often referred to as “teaching around the cycle”, Kolb’s experiential learning theory suggests that an instructor can promote complete learning by designing course materials to encourage students to complete all learning cycle phases [19,20]. When “teaching around the cycle”, students are encouraged to learn as they are taught using their preferred styles; however, teaching students using less-preferred styles may help them to develop new ways of thinking about problems or ideas [18,19,21].
1.2. Learning-Cycle-Based Sustainability Module
A sustainability module was designed to guide undergraduate civil engineering students in learning about and applying sustainability concepts. The sustainability module was intended for integration into an undergraduate course with a real-world design project. The learning objectives of the module were to: (1) Describe sustainability by using breadth and depth of knowledge related to the economic, environmental, social, and temporal aspects of sustainability; (2) Summarize the interconnected nature of the economic, environmental, social, and temporal aspects of sustainability; (3) Analyze the impacts of a project on the economic, environmental, and social systems; and (4) Apply principles of sustainable engineering during design. Although details of the module are provided in previous publications [15,16], key highlights are summarized below to provide context for the presented results.
1.2.1. Module Components
The module was designed to guide students through five activities that are structured to follow Kolb’s learning cycle (Figure 1). In Session 1, students create sustainability concept maps and complete a self-reported knowledge survey to benchmark their sustainability knowledge. During Session 2, students learn about sustainable development broadly before focusing on specific themes, such as environmental, economic, and social sustainability, as well as sustainable design (Table 1). Outside of class, each student becomes an “expert” on sustainable development and one of the five sustainability themes by reading key literature, responding to a reflection prompt, reviewing a comprehensive written tutorial, and preparing a mini-lecture (or discussion) for group members. In class, each student-expert teaches other group members about his or her theme. During Session 3, student groups review sustainability case studies and answer a series of questions designed to guide them in identifying application of sustainability concepts (discussed in Session 2) in real-world projects. During Session 4, students apply their sustainability knowledge by completing a preliminary sustainability analysis of their own semester design project and summarizing results in a short report. Finally, in Session 5, students showcase their sustainability knowledge by again creating sustainability concept maps and completing a self-reported knowledge survey.
1.2.2. Insights from Previous Implementations
The sustainability module was previously implemented in a capstone design course at the Georgia Institute of Technology (Georgia Tech) [16]. The major insight from this implementation was that the module should be completely and meaningfully integrated into the course. It was found that students did not value participation in module activities and cited that they would have preferred to have focused only on their capstone design projects. Essentially, students viewed the module as an unimportant “add-on” to the capstone course. Suggestions for remediating this problem included having the actual instructor be involved in module dissemination, as well as requiring students to apply sustainability concepts and principles in their semester project.
Additional suggestions were provided by the capstone students to improve the module activities. One common suggestion for Session 2 was to allow students to explore sustainability themes through group discussions, rather than requiring groups to follow a prescribed outline. Another frequent comment was that the module would be more impactful in a cornerstone, rather than capstone, design course [16]. The current study was designed to explore the impacts of making Session 2 more open-ended and implementing the module earlier in the curriculum.
1.3. Project Scope
In the context of the growing need for curricular materials to aid educators in infusing sustainability into new and existing courses, the goal of this project was to examine the effectiveness of a learning-cycle-based sustainability module for improving student sustainability knowledge. The module, previously piloted in a capstone design course [16], was implemented in a cornerstone design course at Georgia Tech. Learning outcomes were assessed using concept map and student self-report surveys. Using this data, several research questions were addressed:
- What is the impact of module participation on the structure and content of student sustainability knowledge?
- What is the impact of module participation on student confidence in their sustainability knowledge?
- How do impacts on sustainability knowledge and confidence compare between cornerstone and capstone students participating in the module?
Based on the results, implications for future module implementations and sustainability knowledge assessments will be provided for other engineering education researchers.
2. Materials and Methods
2.1. Study Site
The impacts of participation in the learning-cycle-based sustainability module on students’ conceptual understanding of sustainability were investigated in a civil and environmental engineering (CEE) cornerstone design course (“Civil Engineering Systems”) at Georgia Tech. The course included three sections: (1) Systems and Sustainability Perspectives; (2) Systems Performance Analysis; and (3) Economic Decision-Making Tools and Project Evaluation. The learning-cycle-based sustainability module described above was integrated into the first part of the course. Throughout the semester, students completed a sustainability analysis of an existing infrastructure system, which required them to apply concepts from the module and other course sections. Civil Engineering Systems can be considered to be a cornerstone design course because it provides students with the introductory knowledge and skills to engage in sustainable design [23,24].
2.2. Experimental Design
A quasi-experimental, one-group pretest-posttest design [25] was used to investigate the impacts of module completion on student learning in CEE cornerstone design courses. The module was disseminated as discussed above, including the changes suggested by previously-tested capstone seniors. Specifically, seniors requested less-structured sessions with more flexibility for group discussions when learning about sustainability concepts in Session 2. To determine if group discussions would indeed enhance learning, one section of cornerstone design completed the sustainability module with a peer-lecture session, while another section engaged in the module with a peer-discussion session. For both cohorts, the sustainability module was conducted during the first four weeks of the semester. Knowledge assessments were administered at the beginning and end of the module for both cohorts. Completion of assessments, as well as other module deliverables, accounted for 5% of the overall course grade. In addition, the preliminary sustainability assessment report (from Session 4) comprised 10% of the final project grade in the class.
Most students in the two cornerstone courses participated in the study. Within the peer lecture (n = 57) and peer discussion (n = 62) cohorts, 91.2% and 91.9% completed both the pre- and post- knowledge surveys, respectively. Of students completing both surveys, 62.4% were male students, while 37.6% were female students. Also, 78% were from the United States, while 22% identified as international students. Finally, 2.8%, 33.0%, 48.6%, and 15.6% identified as freshmen, sophomores, juniors, and seniors, respectively. For concept mapping assessments, 94.7% and 93.5% of students in the peer lecture and peer discussion cohorts, respectively, completed both pre- and post-assignments.
2.3. Assessment of Conceptual Learning
A section of a previously-developed sustainability knowledge survey was administered as an indirect measure of student knowledge. Specifically, students were prompted to reflect on their knowledge of sustainable development, including environmental, social, and economic aspects using seven-point scales. The survey was administered in paper-form and students were given 30 minutes to answer questions. Additional details on survey, including development, administration, and final questions are available [26].
Concept map assessments were used as a direct measure of student knowledge, as detailed in previous publications [27,28]. Briefly, concept maps are graphical tools for organizing knowledge. Construction of a concept map is completed by enclosing concepts related to a central topic in boxes and using connecting lines, as well as linking phrases, to depict relationships between concepts [29]. Interconnectedness of concepts within the structure is an important network characteristic, since it increases one’s ability to access concepts [30] and is a key feature that differentiates expert and novice knowledge frameworks [31].
Students were trained on how to construct concept maps and provided up to three hours to complete their sustainability concept maps, although most students only took approximately 30 min. Students used CmapTools [32], a free concept mapping software, to construct and organize their concept maps. After submission, two judges individually examined concept maps using the traditional, holistic, and categorical scoring methods. Judges discussed discrepancies in their scores in order to arrive at a set of consensus scores.
The traditional scoring method [33,34] involved quantifying the number of components in each concept map. The number of concepts (NC) included in the maps were counted to serve as an indicator of knowledge breadth. Next, hierarchies, which are defined by propositions that include the concept map topic, were analyzed. Concepts in each hierarchy were counted and the maximum number of concepts in hierarchy (i.e., the highest hierarchy; HH) was used as an indicator of knowledge depth. Finally, the number of cross-links (NCL), which are links between concepts from different hierarchies, were used as a measure of knowledge connectedness. The total traditional score was calculated by awarding 1 point for each concept, 5 points for each level of hierarchy, and 10 points for each cross-link, as reported earlier [33,34] and adapted from Novak and Gowin [33].
Instead of analyzing individual components, the concept map as a whole was evaluated. An adapted form of the Besterfield-Sacre et al. [34] scoring rubric was used to guide judges in using a three-point scale to rate the comprehensiveness, organization, and correctness of sustainability concept maps [27]. In analyzing comprehensiveness, judges considered the variety of topics (knowledge breadth) and also how extensively topics were covered (knowledge depth). Scoring the organizational dimension required evaluation of the concept map structure, including the links within and between hierarchies (knowledge connectedness). Unlike the traditional method, the holistic method included a correctness sub-score, which characterized the overall appropriateness of propositions and concept placements. Finally, the total holistic concept map score was computed by simply adding the three sub-scores.
An alternative to the traditional and holistic methods, the categorical scoring method was also used to score concept maps, as previously reported [27]. To apply the categorical scoring method, judges first categorized each concept according to appropriate categories. The categories used by Segalàs et al. [35] (based on the earlier categories proposed by Lourdel et al. [36]) were used for this study: environment, natural resources, social impacts, values, temporal aspects, spatial aspects, technology, economy, education, and stakeholders. To further facilitate analysis, the sustainability categories were grouped according to mega-categories. The environmental mega-category was composed of the environment and resource categories. The social mega-category was composed of the social impacts, values, temporal, spatial unbalances, education, and actors/stakeholders categories. The economic mega-category was composed of the economic and technology categories. Next, judges counted the number of inter-links (NIL), or connections between concepts from different categories. Using category assignments and number of inter-links, the complexity index (COj) was calculated for each concept map to capture coverage and connection between categories, as reported previously [27,35].
2.4. Statistical Analyses
Statistical analyses were completed to analyze concept map data. Inter-rater reliability of judges’ individual scores was quantified using Krippendorff’s alpha, which can be applied to all levels of measurements and any number of judges [37]. All Krippendorff’s alpha values were above 0.67, which is classified as “acceptable for exploratory research” [37,38]. Using concept map consensus scores, 2 (peer-lecture cohort, peer-discussion cohort) × 2 (pre-, post-scores) repeated measures ANOVA were employed to determine any trends in data between pre- and post- knowledge assessments, as well as between cohorts. Also, 2 (cornerstone cohorts, capstone cohort) × 2 (pre-, post-scores) repeated measures ANOVA were used to compare learning gains between cornerstone and capstone students.
Pre- and post- responses to survey items asking students to rate their confidences in their abilities to discuss sustainable development and related dimensions were compared between peer-lecture and peer-discussion cornerstone cohorts, as well as between cornerstone and capstone cohorts, using McNemar and Pearson Chi-Square tests. Specifically, the proportion of students indicating that they were very confident in their abilities to discuss different aspects of sustainable development (π6-7, defined as providing a response of 6–7 on a seven-point scale) were compared between pre- and post-assessments. A significance level of 0.05 was used for all hypothesis testing in order to balance the probabilities of Type I and II errors [39]. IBM SPSS Statistics 22 was used for all statistical analyses.
3. Results
3.1. Comparing Peer-Lecture and Peer-Discussion Cohorts
Effectiveness of both the peer-lecture and peer-discussion versions of the sustainability module was investigated. Concept map scores and survey items were used to capture impacts on sustainability knowledge and confidence.
3.1.1. Traditional and Holistic Concept Map Scoring Methods
Both traditional and holistic scoring methods revealed few differences between concept maps generated by peer-lecture and peer-discussion cornerstone cohorts (Table 2 and Table 3). In fact, improvements in the breadth and depth of students’ knowledge were similar, since no statistically significant interactions were found between the number of concepts, highest hierarchy, or comprehensiveness sub-scores by cohort. However, the connectedness of students’ knowledge, as indicated by the number of cross-links, increased more (p ≤ 0.05) for peer-lecture students (Δpost-pre = +2.5), as compared to their peer-discussion counterparts (Δpost-pre = +0.6). Conversely, changes in organization sub-scores, which also capture the structural complexity of student concept maps, were similar for both cohorts. Overall, increases in general concept map qualities, as quantified by the total traditional and total holistic scores, were not substantially different for the two groups of students. Even so, means for all traditional and holistic sub-scores increased between pre- and post-assessments, indicating that participation in either version of the module resulted in positive conceptual learning gains.
3.1.2. Categorical Concept Map Scoring Method
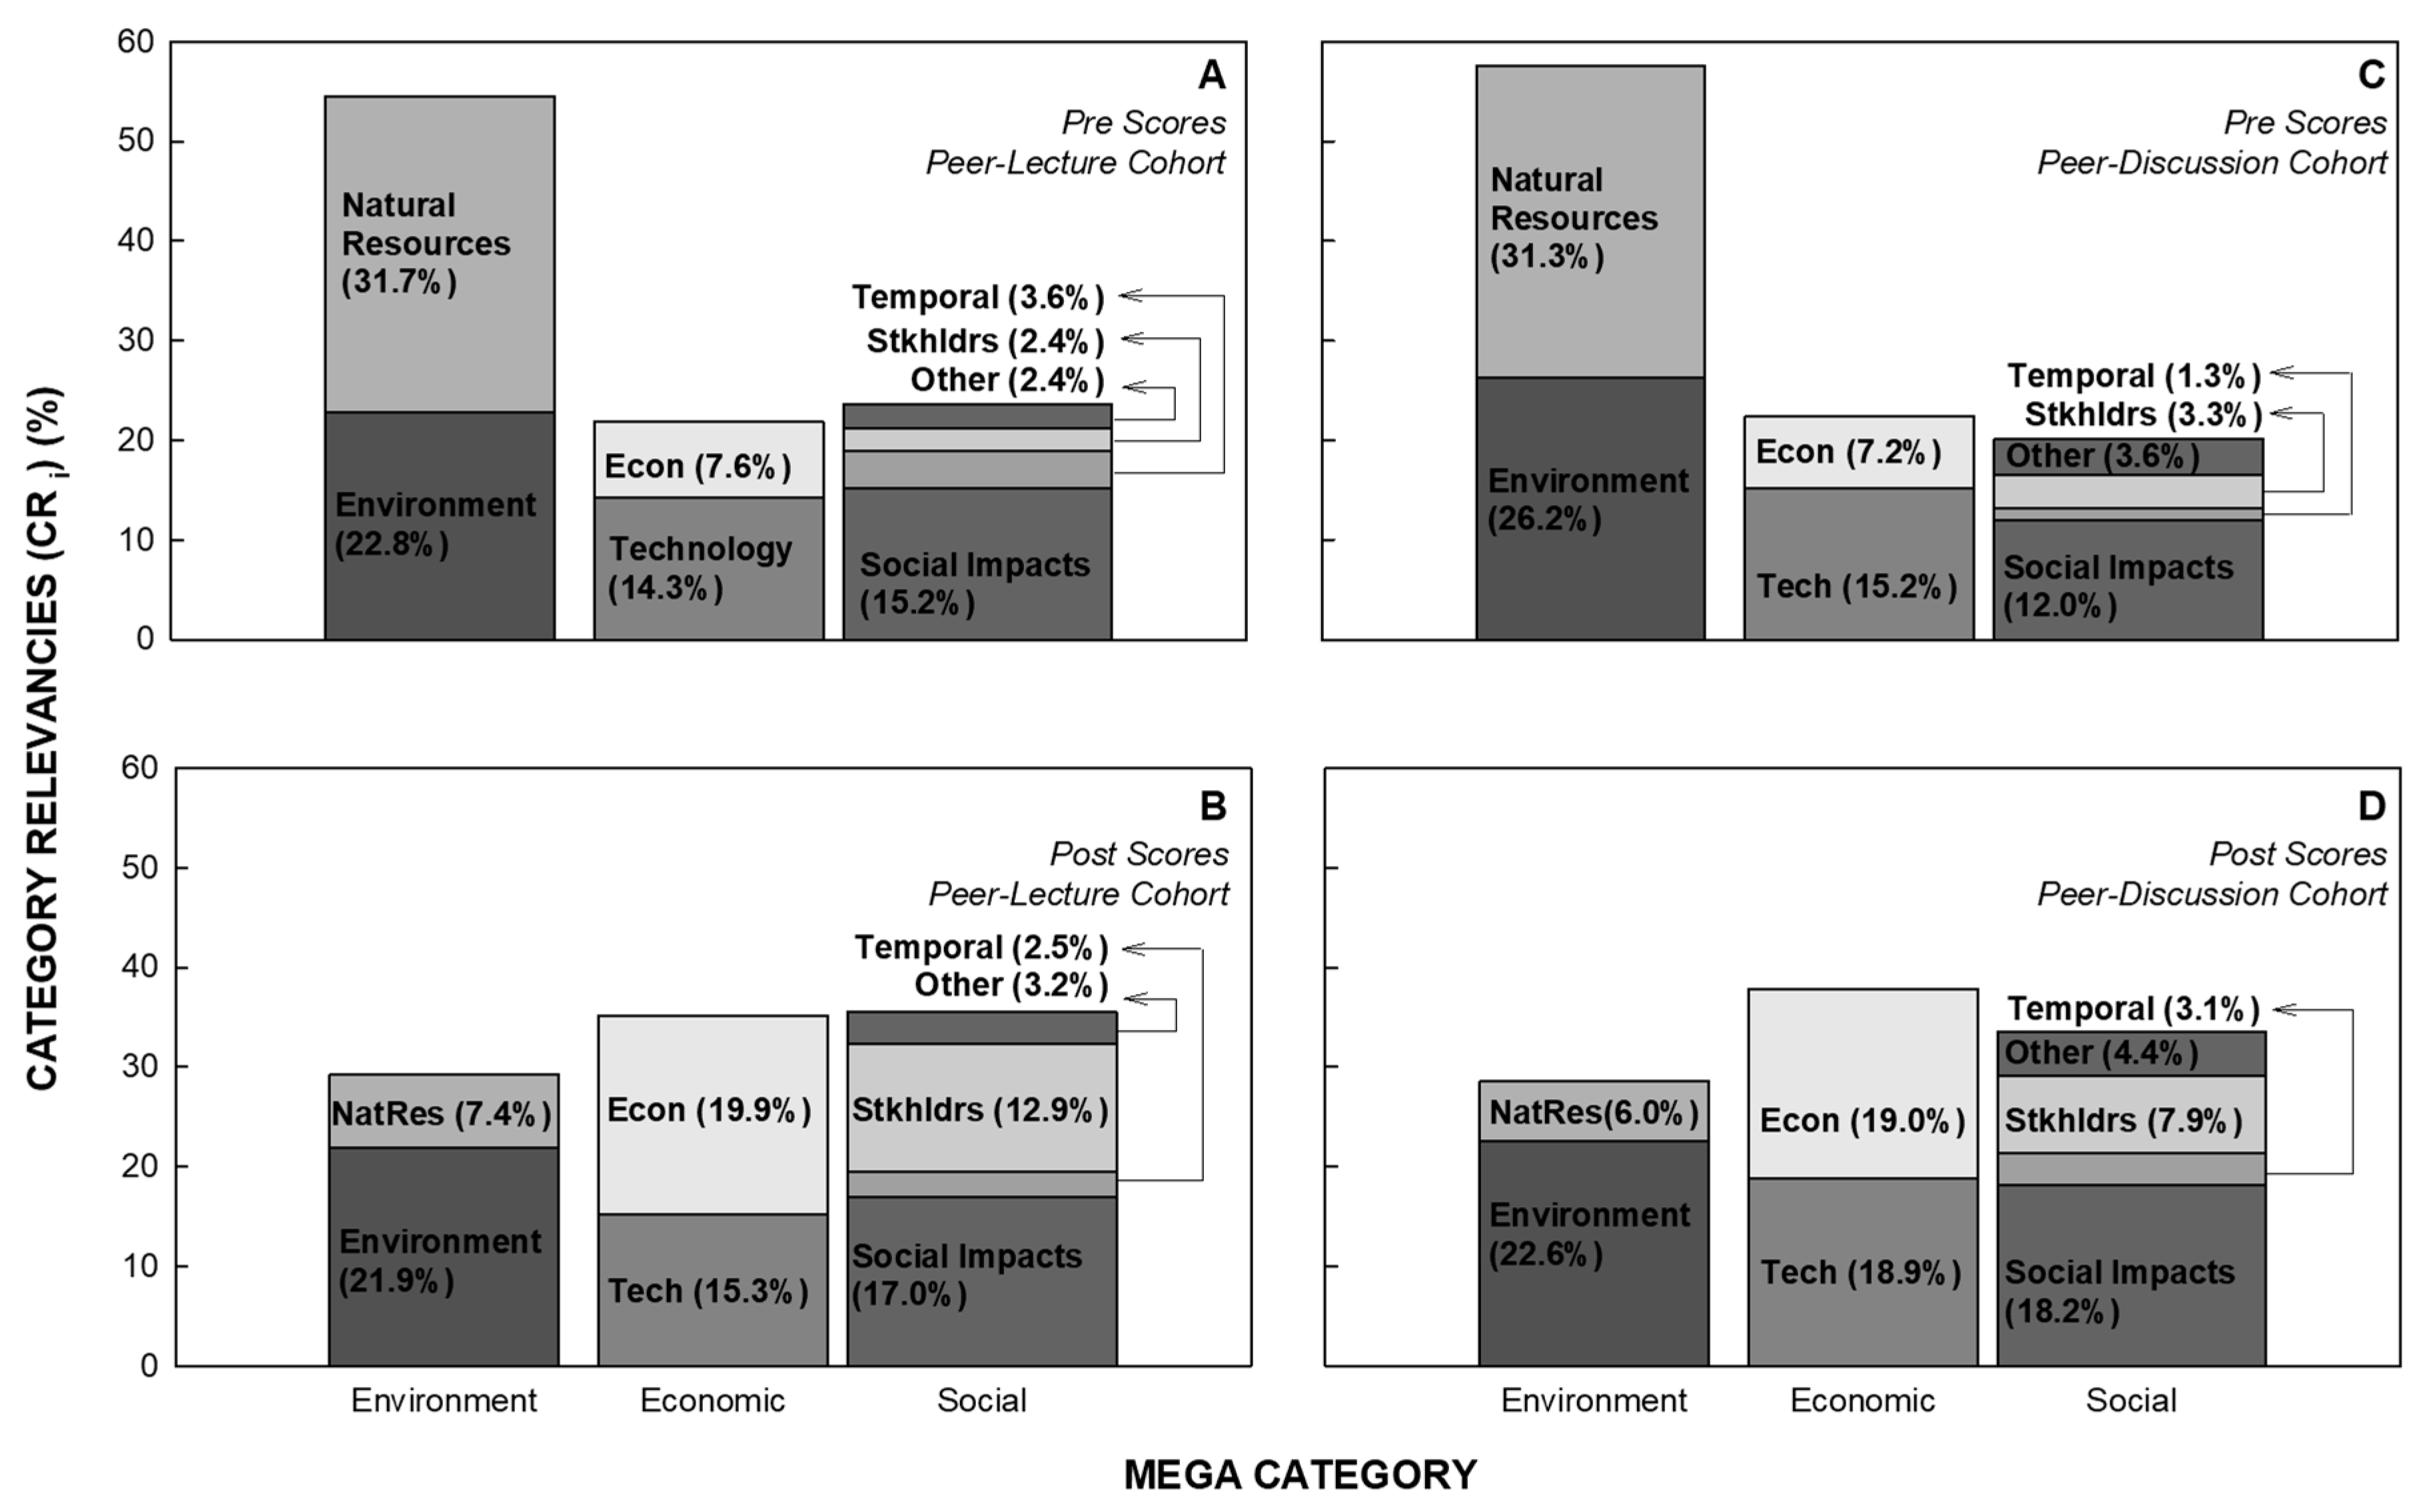
According to the categorical scoring method, changes in the content of student knowledge were similar for both the peer-lecture and peer-discussion cohorts. In fact, all students incorporated more social concepts in their post-concept maps (38.0%) than in the pre-concept maps (30.4%) (F(1, 109) = 16.58, p ≤ 0.001). Similarly, economic category distributions were higher for post- (33.5%) as compared to pre-assessments (24.4%) (F(1, 109) = 25.56, p ≤ 0.001]=). Conversely, all post-concept maps contained less environmental concepts (28.6%) than did pre-concept maps (50.4%) (F(1, 109) = 102.68, p ≤ 0.001). As demonstrated in Figure 2, participating in either version of the module aided students in developing a more holistic understanding of sustainability, with knowledge shifting from being primarily environmentally-focused to having nearly equal emphasis on all three dimensions.
In addition to developing a more balanced repertoire of sustainability knowledge, participation in both versions of the module aided students in developing connections between concepts from different sustainability categories. Specifically, the student-level complexity index (COj) increased between pre- (M = 14.8) and post-assessments (M = 58.4), regardless of cohort (F(1109) = 118.62, p ≤ 0.001), although the increase in COj was not different for the peer-lecture and peer-discussion cohort (F(1109) = 0.01; p = 0.907). Thus, students in both the peer-lecture and peer-discussion cohorts were able to develop more complex knowledge networks by engaging in the module activities.
3.1.3. Knowledge Self-Report Surveys
In addition to examining student generated concept maps, survey items were used to gauge changes in students’ perceptions of their sustainability knowledge. Students in both cohorts indicated increased confidences in their abilities to discuss sustainable development, as well as several dimensional aspects, after participating in the sessions (Table 4). Similarly, students also perceived themselves to have increased their abilities to “develop sustainable solutions to engineering problems” (Table 4). Thus, regardless of whether students learned about foundational sustainability concepts through peer-lectures or peer-discussions, module participation increased confidences in their conceptual and applied sustainability knowledge.
When comparing the number of students positively impacted by module participation, few differences existed based on cohort. In fact, the percentage of students whose perceived conceptual understanding of sustainability was positively impacted by participation in the module was similar for both peer-lecture and peer-discussion cohorts (Table 4). Related to sustainable design capabilities, students’ confidences to “develop sustainable solutions to engineering problems” were not significantly improved by participating in module activities (Table 4). Even so, positive outcomes of the two module versions were mostly similar.
3.2. Comparing Cornerstone and Capstone Module Implementations
Learning gains for students participating in the cornerstone implementations of the sustainability module (peer-lecture and peer-discussion cohorts) were compared to those for senior CEE capstone students previously studied [16]. Specifically, concept map scores, survey responses, and module evaluations were compared between both groups.
3.2.1. Traditional and Holistic Concept Map Scoring Methods
Both traditional and holistic scoring methods reveal several differences between concept maps generated by cornerstone students and seniors participating in the sustainability module (Table 5 and Table 6). First, improvements in knowledge breadth and depth, indicated by the number of concepts, highest hierarchy, and comprehensiveness sub-score, increased more for cornerstone students as compared to seniors (p ≤ 0.001). However, improvements in the connectedness of students’ knowledge were similar for both groups (Δpost-pre = +1.5). Due primarily to improvements in knowledge breadth and depth, both total traditional and holistic concept map scores improved more for cornerstone students than for seniors (p ≤ 0.05). Even so, means for all traditional and holistic sub-scores increased between pre- and post-assessments, indicating that participation in the module resulted in positive learning gains.
3.2.2. Categorical Concept Map Scoring Method
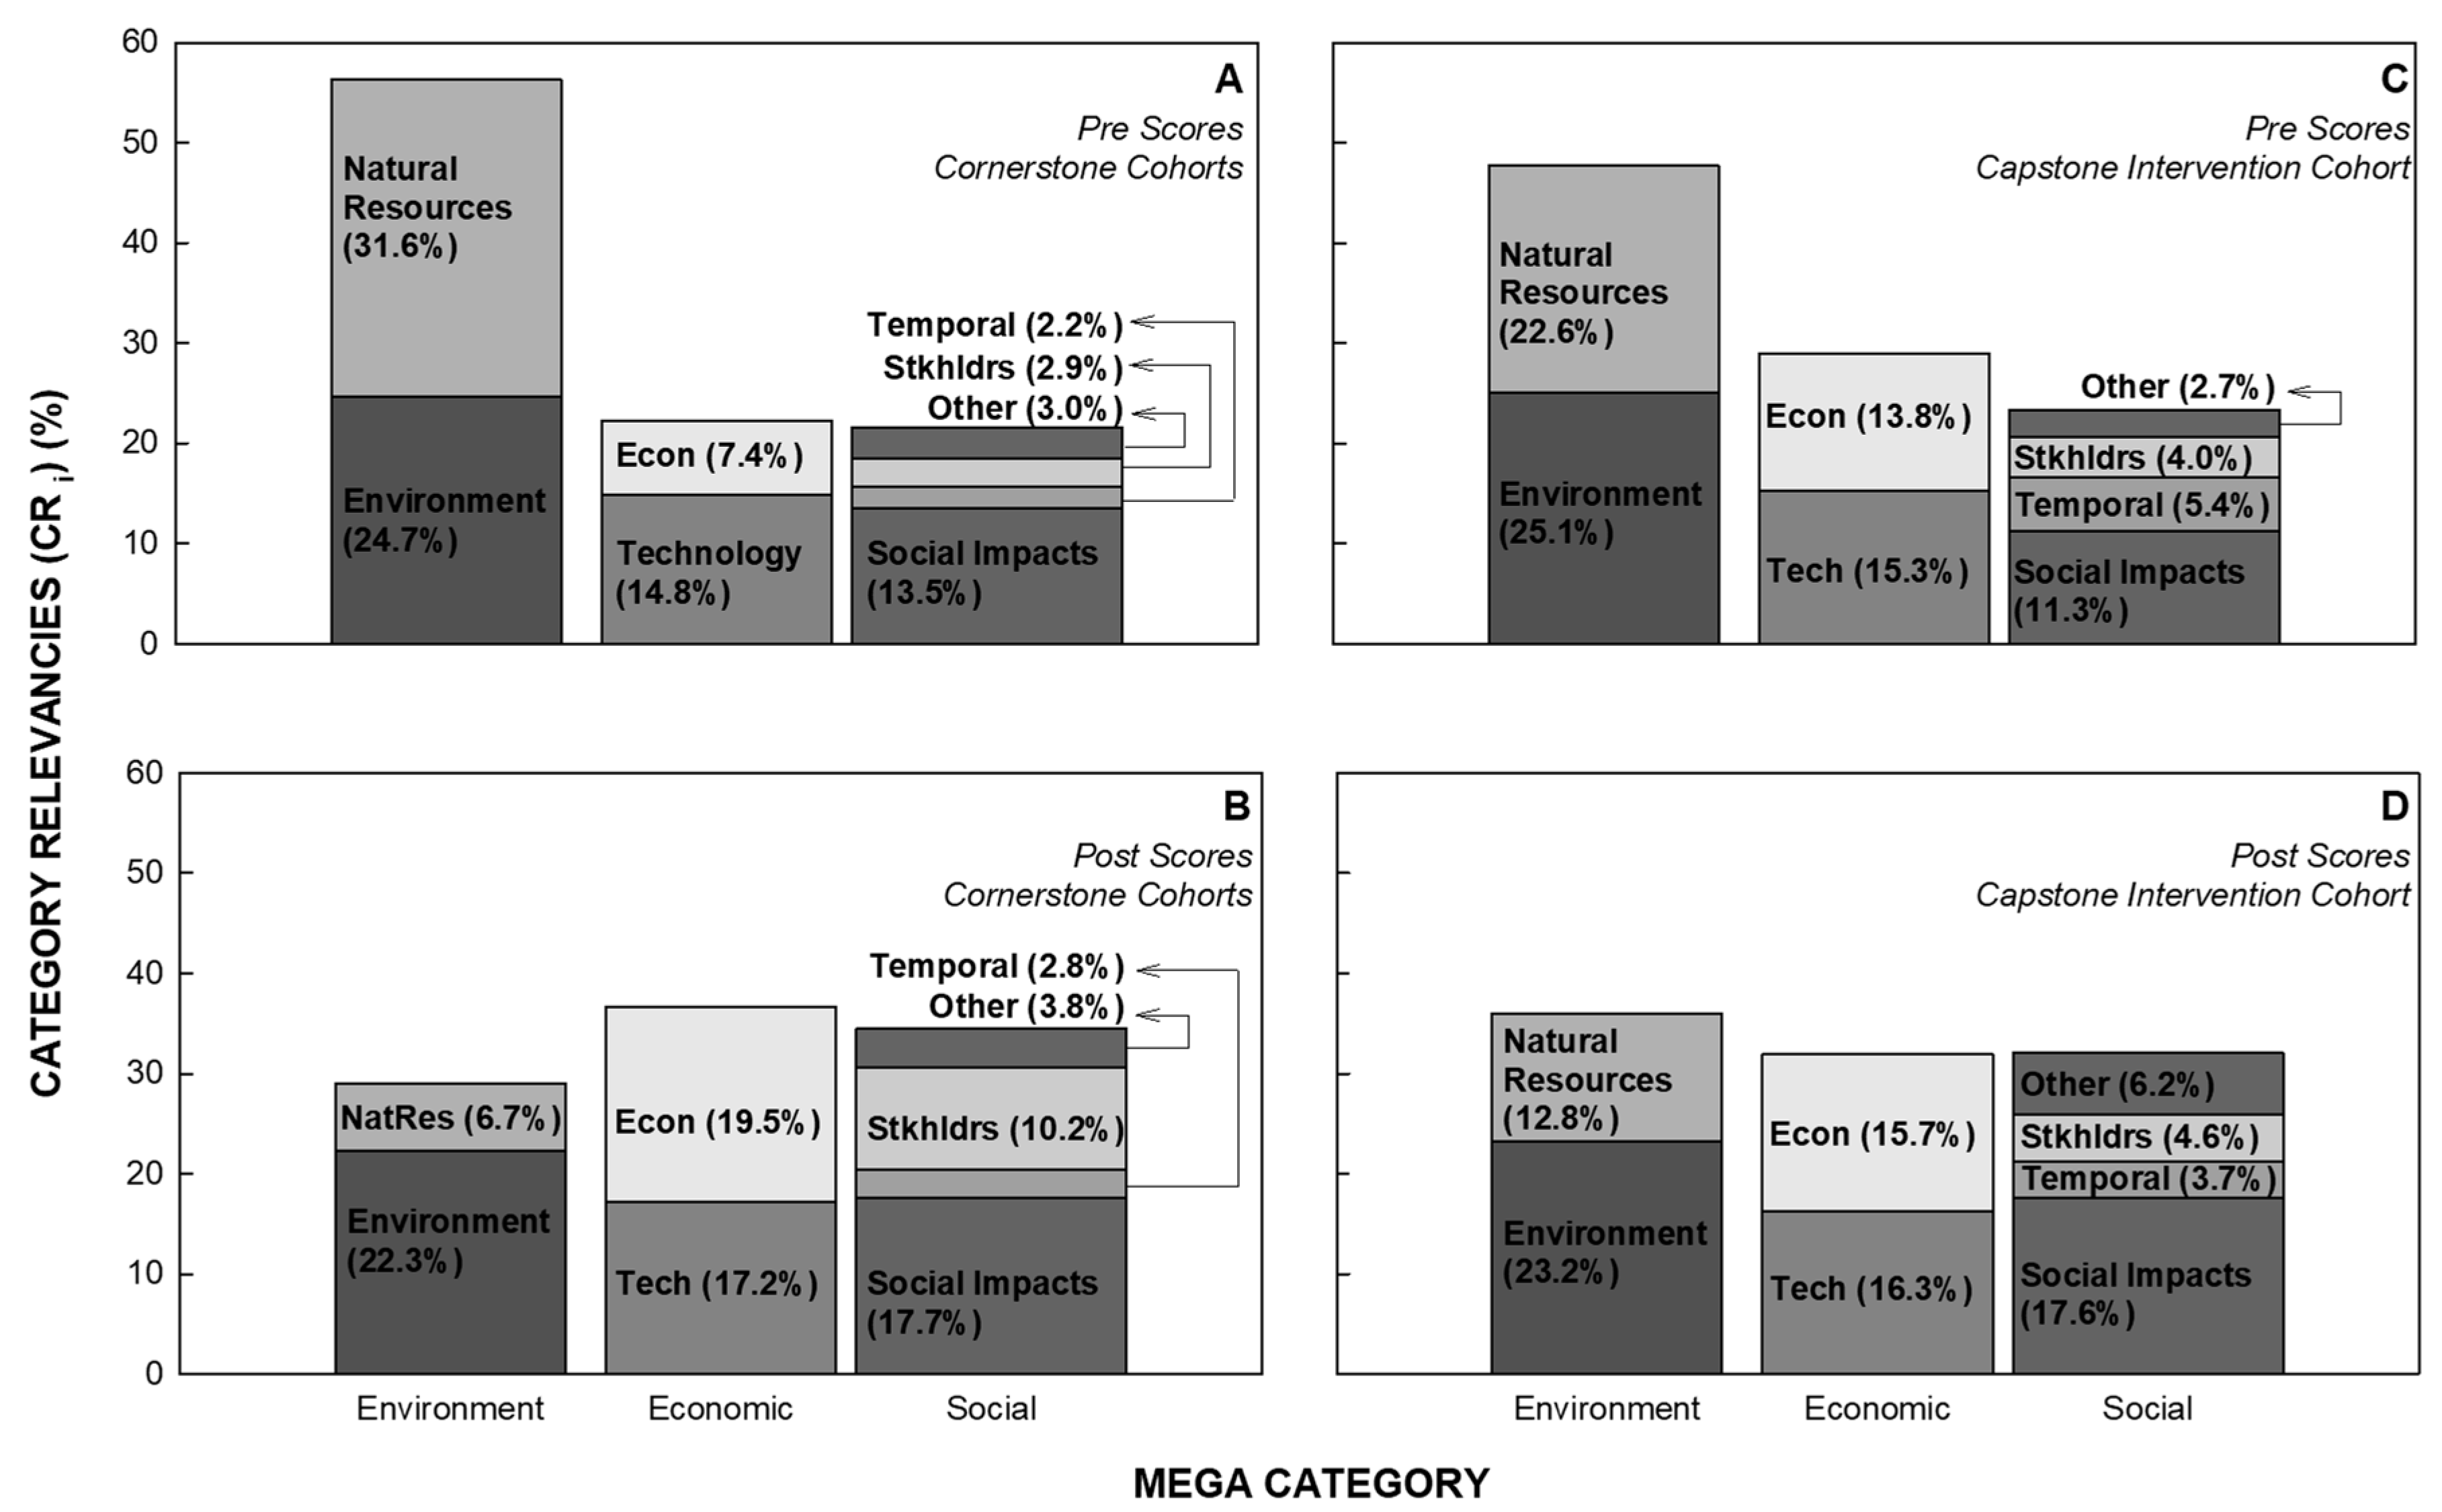
According to the categorical scoring method, changes in the content of student knowledge varied somewhat between cornerstone and senior cohorts. While overall students included more economic concepts in their post- (M = 32.1%) versus their pre- (M = 26.3%) concept maps (p ≤ 0.001), this increase was most substantial for cornerstone students (p = 0.028). Similarly, the environmental category distribution decreased in general between post- (M = 43.9%) and pre- (M = 29.8%) assessments (p ≤ 0.001), although this decrease was highest for the cornerstone cohort (p ≤ 0.001). Finally, students incorporated more social concepts into concept maps after (M = 42.3%), as compared to before (M = 32.4%), participation in the module (p = 0.002). However, this increase was not statistically different between student groups. As depicted in Figure 3, participating in the module aided students in developing a more holistic understanding of sustainability by reducing over-emphasis on environmentally-related concepts.
In addition to developing a more balanced inventory of sustainability knowledge, participation in the module aided both cohorts in developing connections between concepts from different sustainability categories. Specifically, the student-level complexity index (COj) increased between pre- (M = 13.5) and post-assessments (M = 43.2), regardless of cohort (p ≤ 0.001). Even still, the increase in COj between pre- and post-concept map assessments was higher for cornerstone students (Δpost-pre = 43.5) as compared to seniors (Δpost-pre = 15.9) (p ≤ 0.001). Overall, the module helped cornerstone students improve the complexity of their sustainability knowledge networks more than seniors.
3.2.3. Knowledge Self-Report Surveys
Participation in the sustainability module improved cornerstone students’ confidences in their conceptual sustainability knowledge more than capstone students’ (Table 7). Both cohorts indicated improvements in their perceived abilities to “discuss the concept of sustainable development (p ≤ 0.05)”, although increases in confidence ratings were significantly higher for cornerstone students as compared to seniors (p ≤ 0.05). However, members of the cornerstone cohorts also reported improved abilities to discuss sustainability dimensions and their interconnections, while capstone students indicated no such increases. Both groups reported improvements in their abilities to “develop sustainable solutions to engineering problems”, although increases were highest for the cornerstone cohorts (Table 7). Overall, while the module positively impacted sustainable design abilities, greatest improvements were observed for the cornerstone students.
3.2.4. Student Evaluation of Sustainability Module
When examining closed-ended student feedback on the sustainability module, it was evident that cornerstone students (n = 116) found the activities to be more beneficial and enjoyable than did seniors (n = 88). Even though concept maps revealed that both groups of students learned quite a bit about sustainability, only 29.5% of seniors “strongly agreed” that the module helped them learn about relevant concepts, as compared to 92.9% of cornerstone students (χ2(1, n = 204) = 86.68, p ≤ 0.001). Similarly, most cornerstone students (84.5%) “strongly” felt that the module helped them learn about sustainable design, as compared to less than one-fourth (19.3%) of seniors (χ2(1, n = 204) = 83.40, p ≤ 0.001). As a result, cornerstone students in general (78.4%) “strongly” asserted that they enjoyed participating in module activities, while very few seniors (15.9%) felt the same (χ2(1, n = 204) = 78.35, p ≤ 0.001).
4. Discussion
4.1. Comparing Learning Impacts for Peer-Lecture and Peer-Discussion Cohorts
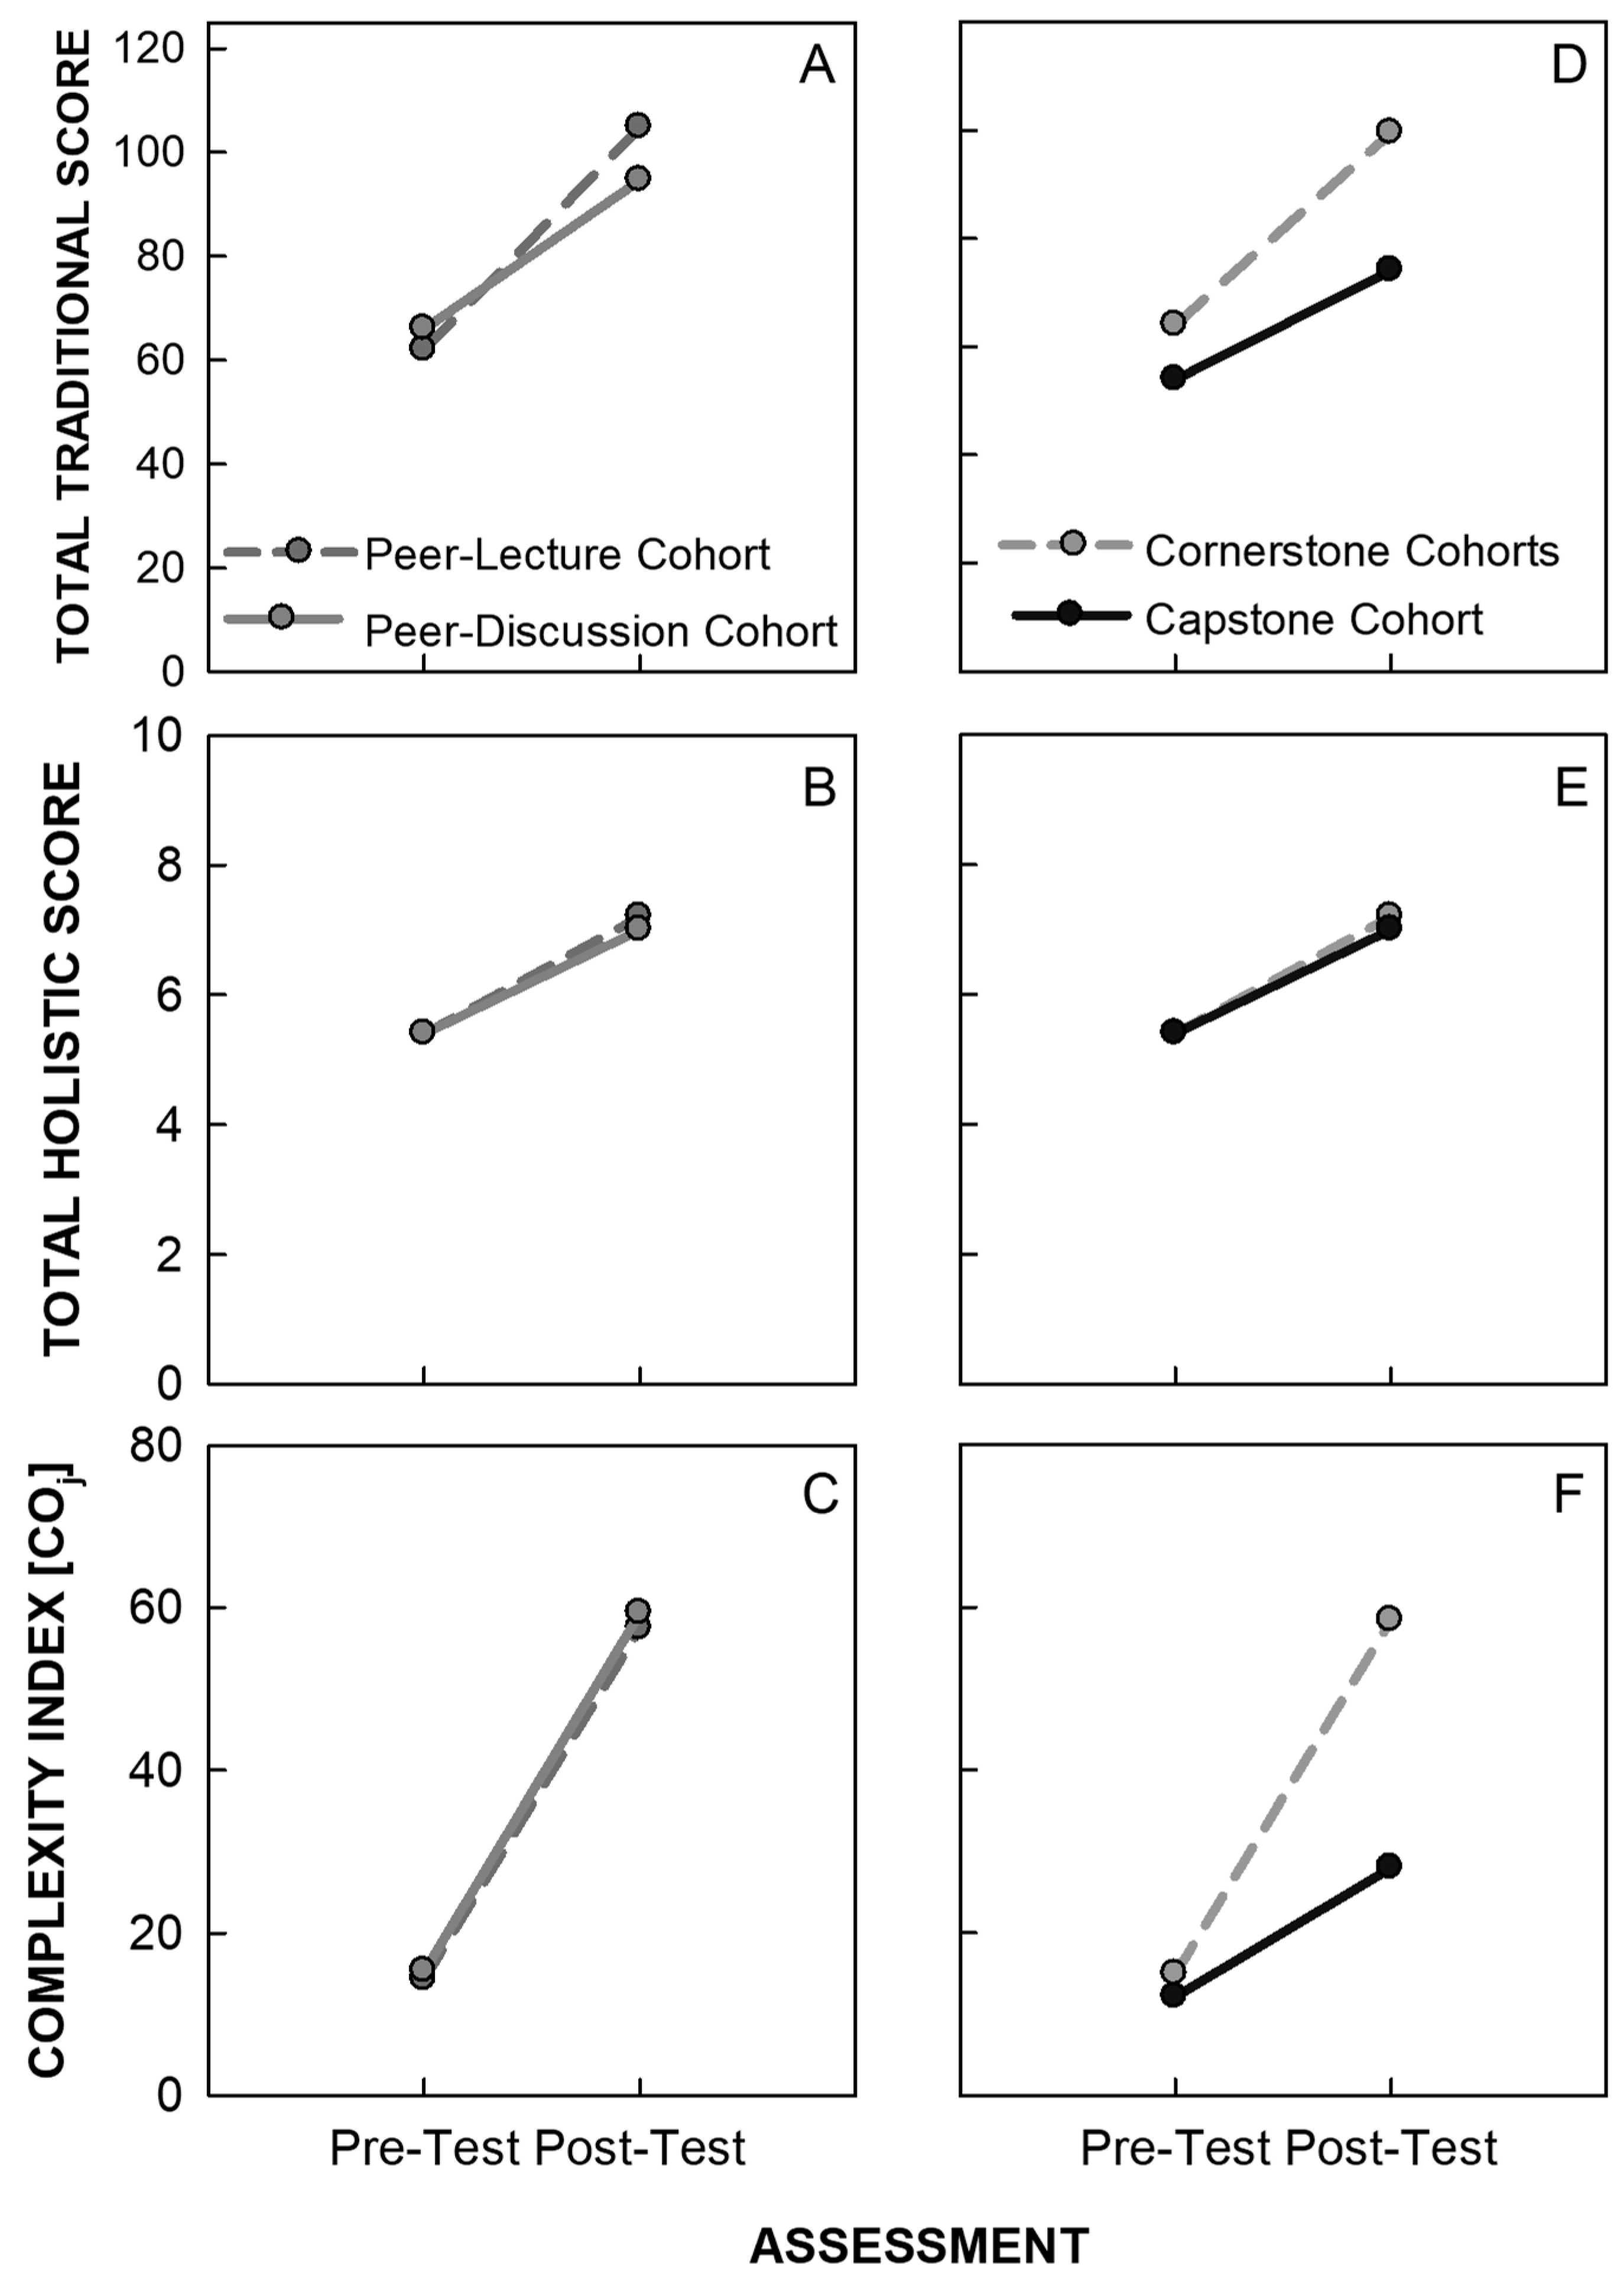
Both peer-lecture and peer-discussion cohorts showed improvements in overall conceptual understanding of sustainability, according to concept maps (Figure 4, Figure 5 and Figure 6) and student surveys (Table 4). In fact, increases in students’ total traditional (Δpost-pre = +35.5) and total holistic (Δpost-pre = +1.7) concept map scores were similar for both cohorts, as well as improvements in their confidences to “discuss the concept of sustainable development”. Although the module was only composed of five sessions, the gain in holistic scores was comparable to the increase reported for students engaging in a two-semester, inter-disciplinary green engineering course (Δpost-pre = +1.3) [40]. In addition, increases in the overall complexity of student concept maps, as quantified by the complexity index (COcohort), was also similar for both cohorts (Δpost-pre = +39.9). This increase was slightly higher than the highest gain (Δpost-pre = +22.2) reported for students completing a variety of sustainability-focused courses incorporating different types of active learning pedagogies [14]. Even further, the final score for cornerstone students (COcohort = 58.4) was higher than reported for a small group of sustainability experts (COcohort = 24.8) [41]. As a result, both versions of the sustainability module, despite their brevity, served to improve students’ conceptual understanding of sustainability just as much as reports of full-length courses.
Examining specific aspects of student knowledge, including depth, breadth, connectedness, and balance, showed many similarities between cohorts. Not only were similar increases in the breadth and depth of student knowledge observed according to concept map scores (number of concepts, highest hierarchy, and comprehensiveness sub-scores) (Table 2 and Table 3), but both cohorts also indicated corresponding increases in their confidences to discuss sustainability and related dimensional aspects (Table 4).
Despite these similarities, the traditional concept map scoring method showed that students in the peer-lecture cohort demonstrated a greater increase in the number of cross-links included in their concept maps than their peer-discussion counterparts. This is a notable difference, since cross-links are indicators of connectedness and expert-like semantic networks [30]. However, the organization sub-score for the holistic method showed no such differences in improvements of concept map structure by cohorts. Even still, students felt equally as confident in their abilities to “describe the connections between poverty, population, consumption, and environmental degradation”.
Related to the balance of knowledge gained, all students showed shifts from recognizing primarily environmental concepts to embracing a more holistic perspective of sustainability that included economic and social dimensions. Overall, participation in both versions of the module served to improve the breadth, depth, and balance of student knowledge, although the peer-lecture cohort may have developed more connected knowledge networks that students from the peer-discussion cohort.
Although students had some suggestions for improving the module, their feedback was quite positive. Importantly, students indicated that each of the module sessions aligned with one or more of the four module learning objectives. Interestingly, students in the peer-lecture cohort felt that Session 2 helped them to “reinforce the complex and interrelated nature of sustainability” more than students participating in the peer-discussion group. Appropriately, peer-lecture students also demonstrated a greater increase in the number of cross-links in their concept maps than those participating in the peer-discussion version of Session 2. After reflecting on the module as a whole, approximately 80% of students “strongly” agreed that they enjoyed participating in the module. Among the most common requests from students was to incorporate additional case studies into the module. Those embarking on future implementations of the module could consider expanding Session 3, “Examining Sustainable Design by Evaluating a Real-World Project”, to include multiple case studies.
4.2. Comparing Learning Impacts for Cornerstone and Capstone Cohorts
Participating in the module positively impacted both cornerstone students’ and seniors’ conceptual understanding of sustainability (Figure 4). In fact, overall quality of concept maps (total traditional, total holistic, and complexity indexes), including breadth and depth of knowledge (number of concepts, highest hierarchy, and comprehensiveness sub-scores) increased for all students over the course of the module. However, improvements were most substantial for cornerstone students. In addition, both groups demonstrated similar increases in knowledge connectedness (number of cross-links and organization sub-scores) after module participation. It is possible that improvements in seniors’ scores were not as impressive because they had already developed a conceptual understanding of sustainability through their previous completion of the cornerstone course. While this is possible, initial concept map scores were similar for both cornerstone students and seniors, which support that seniors had the same capacity for improvement as the cornerstone cohort.
While actual conceptual knowledge gains demonstrated in concept maps improved for both groups of students, cornerstone students demonstrated the highest gains in confidence scores. Although all students indicated improvements in their overall abilities to discuss sustainable development, this increase was highest for cornerstone students. Even still, while both groups demonstrated improvements in depth, breadth, connectedness, and balance of knowledge depicted in concept maps, only cornerstone students reported corresponding increases in confidences in their abilities to discuss the dimensional and connected aspects of sustainability. Overall, cornerstone students recognized the learning benefits of the module while seniors largely did not.
Overwhelmingly, student feedback was most supportive in the cornerstone cohort. In fact, the module was tested in the cornerstone course only after suggestions from capstone students that it would be more useful earlier in the curriculum [16]. Seniors suggested that participating in module activities conflicted with their desire to solely work on the semester projects. Rather, cornerstone students viewed the module as aiding them in completing their semester project. One student even commented that the module “...helped a lot in preparing [them] for the final project...” Even still, not only did more cornerstone design students indicate that the module helped them improve their knowledge about sustainability concepts and designs, but more also enjoyed engaging in the module than seniors. While gains in both conceptual and applied sustainability knowledge were documented for both cohorts, the module itself was best received and enjoyed by cornerstone students.
4.3. Insights for Future Application of Sustainability Module
The sustainability module as it exists is most suitable for future implementation in the cornerstone design course (Civil Engineering Systems). The current study investigated two different methods for guiding students in learning foundational sustainability concepts: peer-lectures and peer-discussions. Both formats proved to elevate students’ conceptual understanding of sustainability, as well as their confidences in their sustainability knowledge. One notable difference between the two implementations was that students participating in the peer-lecture cohort developed the most connected sustainability knowledge networks. Connectedness of knowledge is important because it is indicative of expert knowledge and allows for retention and access of information, while developing systems thinking skills is one of the key learning outcomes of the cornerstone course itself. Given that general knowledge of sustainability is fundamental for engagement in systems thinking and ultimate success in the cornerstone course, there may be some benefit to opting for the peer-lecture version of the module. While the sustainability module certainly promoted most substantial improvements in learning for cornerstone design students, it could alternatively be integrated in capstone design.
While the sustainability module was developed for capstone and/or cornerstone design courses in CEE at Georgia Tech, it could be utilized by instructors elsewhere. Certainly, instructors of similar courses at other institutions could apply the module in its current form. In addition, the module could also be incorporated into other CEE courses with semester projects that could serve as students’ context for learning about sustainability. Not only does Session 4,“Conducting Sustainability Analyses”, necessitate that students apply sustainability concepts to their semester projects, but lack of proper integration of the module with existing course material may lead to student resistance, as was potentially the case for the capstone cohort. Also, with some minor changes, the module could be made suitable for implementation in other engineering courses. Specifically, the Beddington Zero Energy Development Project case study that students analyze in Session 3 would need to be replaced with a discipline-specific example.
5. Conclusions
An investigation was conducted to characterize the impacts of integrating two different versions of a learning-cycle-based sustainability module into CEE cornerstone design courses on student sustainability knowledge. All students participated in the module, except that one class of students learned about sustainability concepts through peer lectures (peer-lecture cohort) and the second class of students learned about concepts through peer discussions (peer-discussion cohort). Changes in students’ conceptual understanding and sustainable design abilities were inferred by analyzing student-generated concept maps and/or student perceptions surveys. The following conclusions were made based on the results.
- Students in both the peer-lecture and peer-discussion cohorts demonstrated improvements in conceptual understanding of sustainability, although students in the peer-lecture cohort likely developed the most connected knowledge networks, which indicate progression towards expert-like sustainability knowledge;
- Students in both the peer-lecture and peer-discussion cohorts indicated improved confidences in sustainability knowledge;
- Cornerstone cohorts not only learned more about sustainability concepts than did seniors participating in module activities, but they also indicated the most substantial increases in knowledge confidences;
- The peer-lecture version of the sustainability module is suggested for future implementations in cornerstone design courses to help students develop connected and complex knowledge structures related to sustainability.
The learning-cycle-based sustainability module was shown to be useful for guiding students at various stages of their academic development in learning about sustainable development. While no single intervention is likely to transform an entire curriculum, the module does provide a relatively short, yet effective, means for initiating sustainability learning in a single course. Students completing this module could then be expected to possess the foundational knowledge needed to learn about sustainability applications in traditional engineering courses throughout the curriculum (horizontal integration). Overall, the module should be part of a larger and systematic plan to integrate sustainability throughout an undergraduate engineering curriculum.
Limitations of the presented study, related to the experimental design, assessment methods, and module content, are acknowledged. The design, a quasi-experimental, pretest-posttest design, usually has lower internal validity than a true experimental design. True experimental designs are often not feasible in educational research, due to the inability or ethical questions associated with randomly assigning students to control and treatment groups [42]. However, quasi-experimental designs, which are identical to experimental designs, except in the random assignment to groups, can still be used to establish causality if threats to internal validity are addressed [43]. One common compromise to internal validity is “history” or the fact that some event other than the intervention could have caused differences in pre- and post-test scores. In the current study, assessments were given only five weeks apart, which makes the possibility of all students experiencing events that greatly improved their sustainability knowledge less likely.
Related to assessment methods, some conclusions about module impacts are founded on students’ perceptions rather than direct measures. Indeed, previous work has shown that students often over-report their knowledge and skills [44]. Improvements in students’ conceptual sustainability knowledge were measured using student self-reports (indirect measure) and confirmed with concept map scores (direct measure). However, impacts of the module on student design abilities were only captured through indirect student self-reports. Future module implementations could use a direct measure, such as rubric, to provide additional insights into the impact of module participation on sustainable design skills.
Finally, the module itself may not be completely inclusive of the entire sustainability domain. The written tutorials, which students reviewed prior to their peer-lectures or peer-discussions, focused on the areas of environmental sustainability, economic sustainability, social sustainability, and sustainable design. While the domain of sustainability is complex, somewhat subjective, and constantly evolving, most authors and global institutions agree on the importance of economic, environmental, and social issues. However, some support the importance of additional dimensions, including institutional [45], individual [46], and aesthetic [47]. Nevertheless, the module provides students with a basic foundation needed to learn about and apply principles from additional sustainability dimensions in the future.
Author Contributions
Conceptualization, M.K.W., J.P., C.N., and M.O.R.; Methodology, M.K.W., C.N., and M.O.R.; Validation, M.K.W., J.P, C.N., and M.O.R.; Formal analysis, M.K.W., J.P., and C.N.; Investigation, M.K.W.; Resources, M.O.R.; Data curation, M.K.W.; Writing—original draft preparation, M.K.W.; writing—review and editing, M.K.W., J.P., C.N., and M.O.R.; Visualization, M.K.W.; Supervision, C.N. and M.O.R.; Project administration, M.O.R; Funding acquisition, M.K.W.
Funding
This research was funded by the National Science Foundation, Graduate Research Fellowship DGE/0946809. Any opinions, findings, and conclusions or recommendations expressed in this material are those of the authors and do not necessarily reflect the views of the National Science Foundation.
Conflicts of Interest
The authors declare no conflict of interest. The funders had no role in the design of the study; in the collection, analyses, or interpretation of data; in the writing of the manuscript, or in the decision to publish the results.
References
- Lozano, R. Diffusion of sustainable development in universities’ curricula: An empirical example from Cardiff University. J. Clean. Prod. 2010, 18, 637–644. [Google Scholar] [CrossRef]
- Cortese, A.D. The critical role of higher education in creating a sustainable future. Plan. High. Educ. 2003, 31, 15–22. [Google Scholar]
- Tejedor, G.; Segalàs, J.; Rosas-Casals, M. Transdisciplinarity in higher education for sustainability: How discourses are approached in engineering education. J. Clean. Prod. 2018, 175, 29–37. [Google Scholar] [CrossRef] [Green Version]
- Davidson, C.I.; Matthews, H.S.; Hendrickson, C.; Bridges, M.W.; Allenby, B.R.; Crittenden, J.C.; Chen, Y.; Williams, E.; Allen, D.T.; Murphy, C.F.; et al. Viewpoint: Adding sustainability to the engineer’s toolbox: A challenge for engineering educators. Environ. Sci. Technol. 2007, 41, 4847–4849. [Google Scholar] [CrossRef] [PubMed]
- Thürer, M.; Tomašević, I.; Stevenson, M.; Qu, T.; Huisingh, D. A systematic review of the literature on integrating sustainability into engineering curricula. J. Clean. Prod. 2018, 181, 608–617. [Google Scholar] [Green Version]
- Bedoya-Valencia, L.; Yuan, D.; Fraser, J.M. Incorporating a sustainability module into an introduction to engineering course. In Proceedings of the ASEE National Conference and Exposition, Atlanta, GA, USA, 23–26 June 2013. [Google Scholar]
- Flynn, C.D.; Squier, M.; Davidson, C.I. Development of a case-based teaching module to improve student understanding of stakeholder engagement processes within engineering systems design. In Proceedings of the 7th International Conference on Engineering Education for Sustainable Development (EESD15), Vancouver, BC, Canada, 9–12 June 2015. [Google Scholar]
- Nazzal, D.; Joseph, Z.; Alexander, H.; Debra, R.; Waldemar, K.; Kaveh, M. Introduction of Sustainability Concepts into Industrial Engineering Education: A Modular Approach. Adv. Eng. Educ. 2015, 4, n4. [Google Scholar]
- Yuan, D.; Fraser, J.M.; Paudel, A.M. Incorporating sustainable engineering design principles into senior design proposals. In Proceedings of the American Society for Engineeing Education Annual Conference and Exposition, Seattle, WA, USA, 13 June 2015. [Google Scholar]
- Pawley, A.L.; Hoffmann, S.R.; Cardella, M.E.; Ohland, M.W.; Rao, R.L.; Jahiel, A.R.; Seager, T.; Vanasupa, L. Assessing Sustainability Knowledge: A Framework of Concepts. In Proceedings of the American Society for Engineering Education Annual Conference and Exposition, Indianapolis, IN, USA, 15–18 June 2014. [Google Scholar]
- Mills, J.E.; Treagust, D.F. Engineering education—Is problem-based or project-based learning the answer. Australas. J. Eng. Educ. 2003, 3, 2–16. [Google Scholar]
- Prince, M. Does active learning work? A review of the research. J. Eng. Educ. 2004, 93, 223–231. [Google Scholar] [CrossRef]
- Segalàs, J.; Mulder, K.F.; Ferrer-Balas, D. What do EESD “experts” think sustainability is? Which pedagogy is suitable to learn it? Results from interviews and Cmaps analysis gathered at EESD 2008. Int. J. Sustain. High. Educ. 2012, 13, 293–304. [Google Scholar] [CrossRef]
- Segalas, J.; Ferrer-Balas, D.; Mulder, K.F. What do engineering students learn in sustainability courses? The effect of the pedagogical approach. J. Clean. Prod. 2010, 18, 275–284. [Google Scholar] [CrossRef]
- Watson, M.K.; Noyes, C.; Rodgers, M. Development of a Structured-Inquiry Module for Teaching Sustainability ‘Around the Cycle’. Framework 2012, 4, 7. [Google Scholar]
- Watson, M.K.; Pelkey, J.; Pelkey, J.; Rodgers, M. Assessing impacts of a learning-cycle-based module on students’ conceptual sustainability knowledge using concept maps and surveys. J. Clean. Prod. 2016, 133, 544–556. [Google Scholar] [CrossRef]
- Kolb, D.A. Experiential Learning: Experience as the Source of Learning and Development; FT Press: Upper Saddle River, NJ, USA, 2014. [Google Scholar]
- Kolb, D.A.; Boyatzis, R.E.; Mainemelis, C. Experiential learning theory: Previous research and new directions. Perspect. Think. Learn. Cogn. Styles 2001, 1, 227–247. [Google Scholar]
- Prince, M.J.; Felder, R.M. Inductive teaching and learning methods: Definitions, comparisons, and research bases. J. Eng. Educ. 2006, 95, 123–138. [Google Scholar] [CrossRef]
- Harb, J.N.; Durrant, S.O.; Terry, R.E. Use of the Kolb learning cycle and the 4MAT system in engineering education. J. Eng. Educ. 1993, 82, 70–77. [Google Scholar] [CrossRef]
- Svinicki, M.D.; Dixon, N.M. The Kolb model modified for classroom activities. Coll. Teach. 1987, 35, 141–146. [Google Scholar] [CrossRef]
- Barrella, E.; Watson, M.K. Comparing the outcomes of horizontal and vertical integration of sustainability content into engineering curricula using concept maps. In New Developments in Engineering Education for Sustainable Development; Springer: Cham, The Netherlands, 2015. [Google Scholar]
- Meyer, M.D.; Jacobs, L.J. A civil engineering curriculum for the future: The Georgia Tech case. J. Prof. Issues Eng. Educ. Pract. 2000, 126, 74–78. [Google Scholar] [CrossRef]
- Amekudzi, A.; Meyer, M. The civil engineering systems course at Georgia Institute of Technology. In Proceedings of the 2004 Engineering Systems Symposium, Boston, MA, USA, 29–31 March 2004. [Google Scholar]
- Shadish, W.R.; Cook, T.D.; Campbell, D.T. Experimental and Quasi-Experimental Designs for Generalized Causal Inference; Houghton, Mifflin and Company: Boston, MA, USA, 2002. [Google Scholar]
- Watson, M.K.; Noyes, C.; Rodgers, M.O. Student perceptions of sustainability education in civil and environmental engineering at the Georgia Institute of Technology. J. Prof. Issues Eng. Educ. Pract. 2013. [Google Scholar] [CrossRef]
- Watson, M.K.; Pelkey, J.; Noyes, C.R.; Rodgers, O.M. Assessing Conceptual Knowledge Using Three Concept Map Scoring Methods. J. Eng. Educ. 2016, 105, 118–146. [Google Scholar] [CrossRef]
- Watson, M.; Pelkey, J.G.; Noyes, C.R.; Rodgers, M.O. Use of Concept Maps to Assess Student Sustainability Knowledge. In Proceedings of the American Society for Engineering Education Annual Conference and Exposition, Indianapolis, IN, USA, 15–18 June 2014. [Google Scholar]
- Novak, J.D.; Cañas, A.J. The Theory Underlying Concept Maps and How to Construct Them; Institute for Human and Machine Cognition: Pensacola, FL, USA, 2006. [Google Scholar]
- Turns, J.; Atman, C.J.; Adams, R. Concept maps for engineering education: A cognitively motivated tool supporting varied assessment functions. IEEE Trans. Educ. 2000, 43, 164–173. [Google Scholar] [CrossRef]
- Ruiz-Primo, M.A. On the use of concept maps as an assessment tool in science: What we have learned so far. REDIE Rev. Electrónica De Investig. Educ. 2000, 2, 3. [Google Scholar]
- Cañas, A.J.; Hill, G.; Carff, R.; Suri, N.; Lott, J.; Eskridge, T.C.; Gomez, G.; Arroyo, M.; Carvajal, R. CmapTools: A knowledge modeling and sharing environment. In Proceedings of the 1st International Conference on Concept Mapping, Pamplona, Spain, 14–17 September 2004. [Google Scholar]
- Novak, J.D.; Gowin, D.B. Learning How to Learn; Cambridge University Press: New York, NY, USA, 1984. [Google Scholar]
- Besterfield-Sacre, M.; Gerchak, J.; Lyons, M.R.; Shuman, L.J.; Wolfe, H. Scoring concept maps: An integrated rubric for assessing engineering education. J. Eng. Educ. 2004, 93, 105–115. [Google Scholar] [CrossRef]
- Segalàs, J.; Ferrer-Balas, D.; Mulder, K.F. Conceptual maps: Measuring learning processes of engineering students concerning sustainable development. Eur. J. Eng. Educ. 2008, 33, 297–306. [Google Scholar] [CrossRef]
- Lourdel, N.; Natacha, G.; Valerie, L.; Bruno, D.; Christian, B. Sustainable development cognitive map: A new method of evaluating student understanding. Int. J. Sustain. High. Educ. 2007, 8, 170–182. [Google Scholar] [CrossRef]
- Hayes, A.F.; Krippendorff, K. Answering the call for a standard reliability measure for coding data. Commun. Methods Meas. 2007, 1, 77–89. [Google Scholar] [CrossRef]
- Krippendorff, K. Content Analysis: An Introduction to Its Methodology, 2nd ed.; Sage Publications Inc.: Thousand Oaks, CA, USA, 2004. [Google Scholar]
- Rajamanickam, M. Statistical Methods in Psychological and Educational Research; Concept Publishing Company: Delhi, India, 2001. [Google Scholar]
- Borrego, M.; Newswander, C.; McNair, L.D.; McGinnis, S.P.; Paretti, M.C. Using concept maps to assess interdisciplinary integration of green engineering knowledge. Adv. Eng. Educ. 2009, 2, 1–26. [Google Scholar]
- Coral, J.S. Engineering Education for a Sustainable Future. Ph.D. Thesis, Universitat Politecnica de Catalunya, Barcelona, Spain, 2009. [Google Scholar]
- Hartas, D. Educational Research and Inquiry; Continuum International Publishing Group: New York, NY, USA, 2010. [Google Scholar]
- Takona, J.P. Educational Research: Principles and Practice; iUniverse Inc.: Lincoln, NE, USA, 2002. [Google Scholar]
- Yadav, A.; Subedi, D.; Lundeberg, M.A.; Bunting, C.F. Problem-Based Learning: Influence on Students’ Learning in an Electrica Engineering Course. J. Eng. Educ. 2011, 100, 253–280. [Google Scholar] [CrossRef]
- Pfahl, S. Institutional Sustainability. Int. J. Sustain. Dev. 2005, 8, 1838–1846. [Google Scholar] [CrossRef]
- Barrella, E.; Spratto, E.P.; Pappas, E.; Nagel, R. Developing and Validating an Individual Sustainability Instrument with Engineering Students to Motivate Intentional Change. Sustainability 2018, 10, 2885. [Google Scholar] [CrossRef]
- Hadzigeorgiou, Y.; Skoumios, M. The Development of Environmental Awareness through School Science: Problems and Possibilities. Int. J. Environ. Sci. Educ. 2013, 8, 405–426. [Google Scholar]

Figure 2.
Comparison of (A) preliminary and (B) post category relevancies for students enrolled in the peer-lecture cohort, as well as (C) preliminary and (D) post category relevancies for students enrolled in the peer-discussion cohort (“Other” represents values, spatial imbalances, and education categories).

Figure 3.
Comparison of (A) preliminary and (B) post category relevancies for students in cornerstone design cohorts, as well as (C) preliminary and (D) post category relevancies for students in the capstone design cohort (“Other” represents values, spatial imbalances, and education categories).
Figure 3.
Comparison of (A) preliminary and (B) post category relevancies for students in cornerstone design cohorts, as well as (C) preliminary and (D) post category relevancies for students in the capstone design cohort (“Other” represents values, spatial imbalances, and education categories).

Figure 4.
Comparison of (A) traditional, (B) holistic, and (C) categorical concept map scores between peer-lecture and peer-discussion cornerstone cohorts, as well as (D) traditional, (E) holistic, and (F) categorical concept map scores between cornerstone and capstone cohorts.
Figure 4.
Comparison of (A) traditional, (B) holistic, and (C) categorical concept map scores between peer-lecture and peer-discussion cornerstone cohorts, as well as (D) traditional, (E) holistic, and (F) categorical concept map scores between cornerstone and capstone cohorts.

Figure 5.
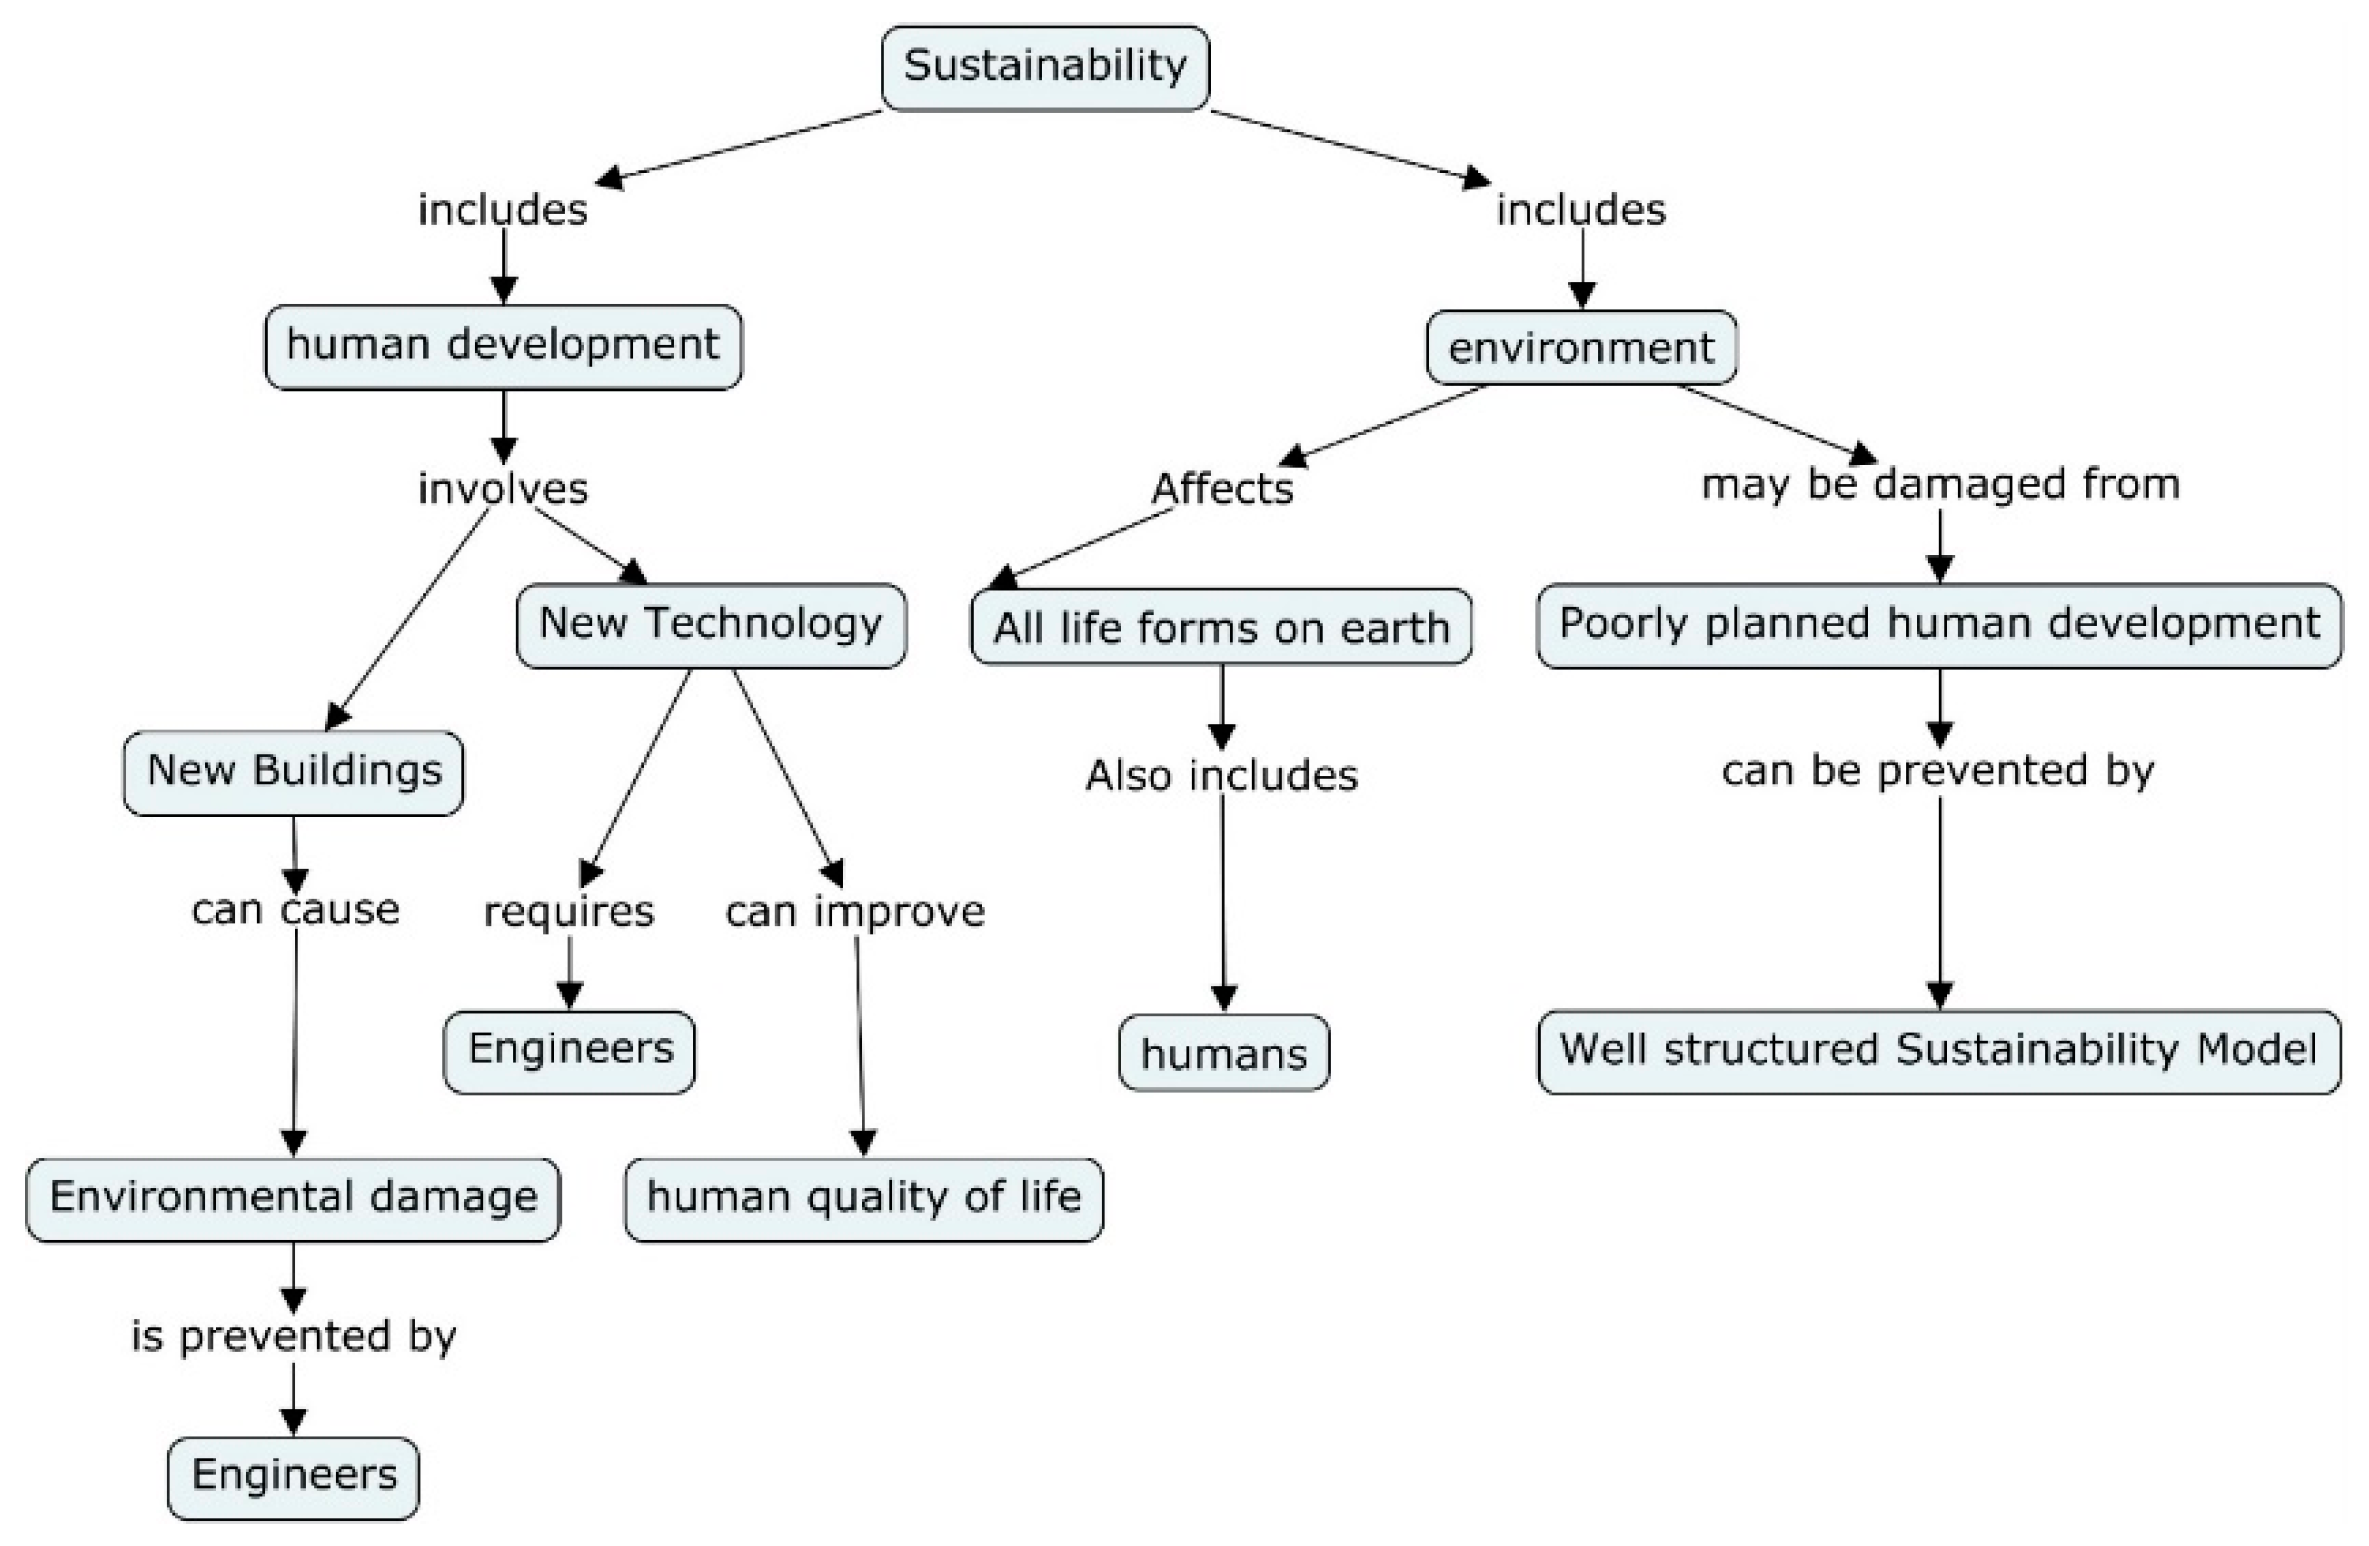
Sample pre-module concept map (Traditional Method: NC = 12, HH = 4, NCL = 0, Total = 32; Holistic Method: Comp = 1, Org = 1, Corr = 3, Total = 5; Categorical Method: NIL = 10, COj = 12.0).
Figure 5.
Sample pre-module concept map (Traditional Method: NC = 12, HH = 4, NCL = 0, Total = 32; Holistic Method: Comp = 1, Org = 1, Corr = 3, Total = 5; Categorical Method: NIL = 10, COj = 12.0).

Figure 6.
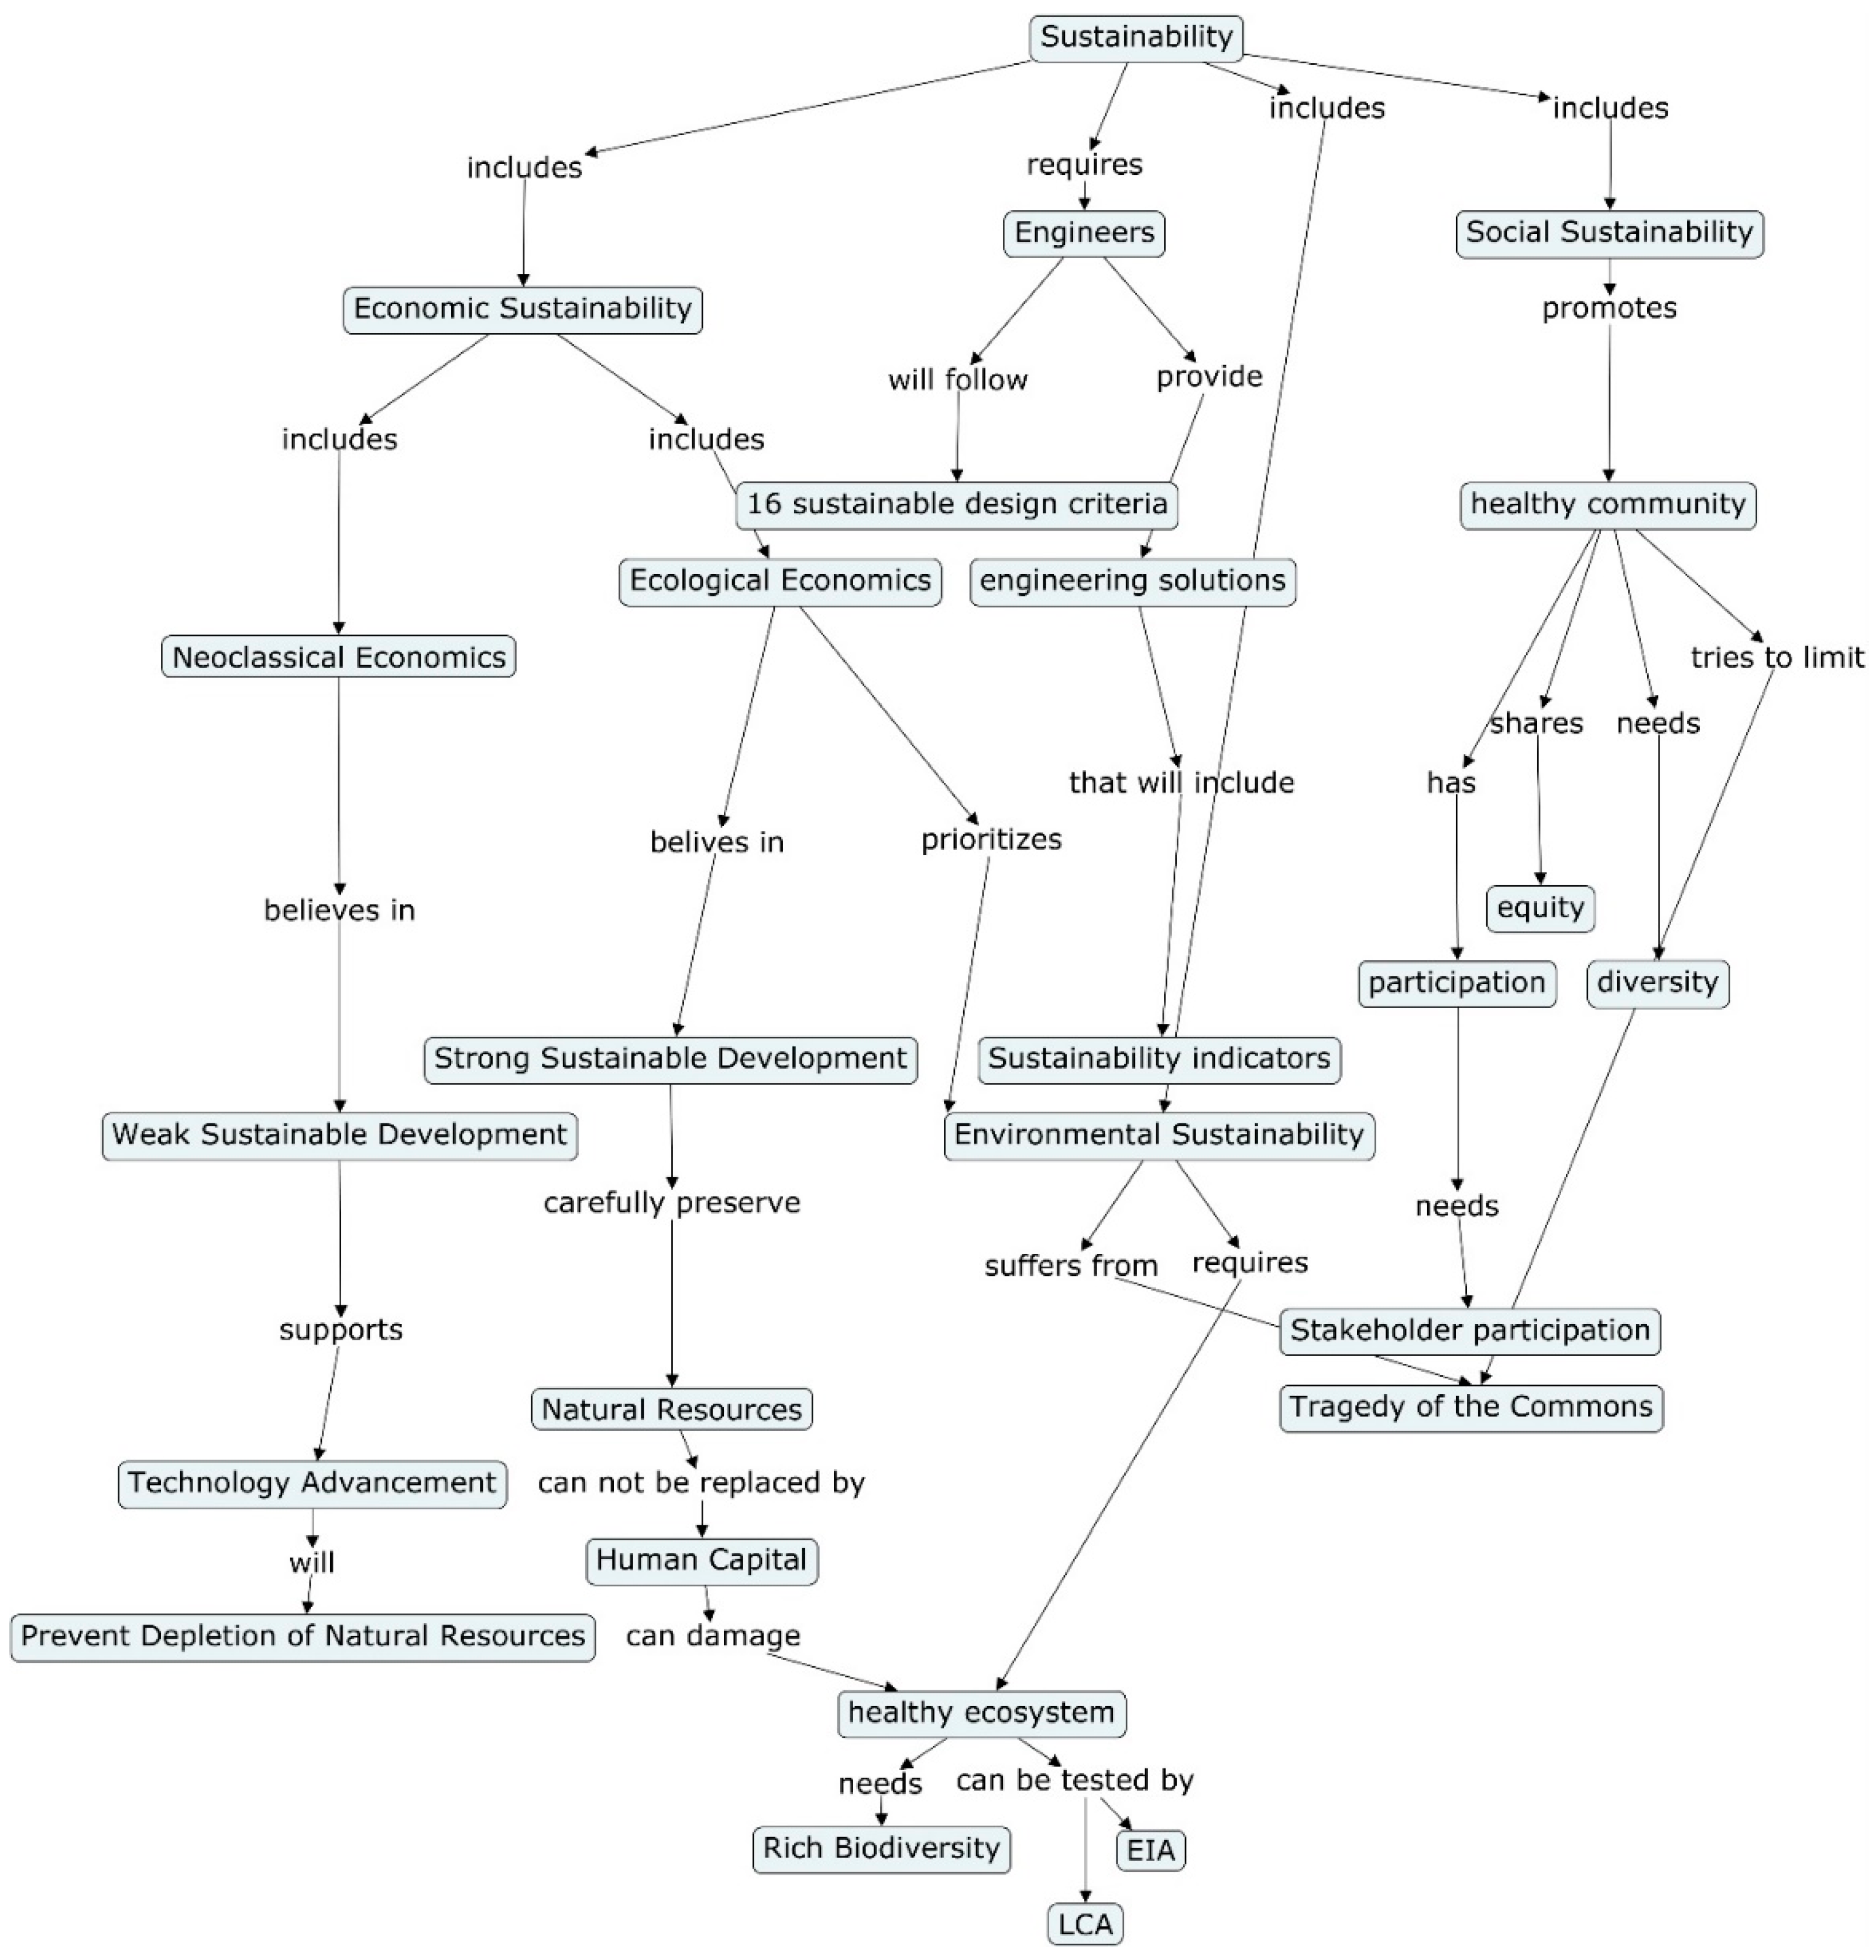
Sample post-module concept map (Traditional Method: NC = 25, HH = 4, NCL = 4, Total = 96; Holistic Method: Comp = 3, Org = 1, Corr = 3, Total = 7; Categorical Method: NIL = 14, COj = 35.0).
Figure 6.
Sample post-module concept map (Traditional Method: NC = 25, HH = 4, NCL = 4, Total = 96; Holistic Method: Comp = 3, Org = 1, Corr = 3, Total = 7; Categorical Method: NIL = 14, COj = 35.0).


Table 1.
Topics covered in tutorials on sustainable development and sustainability themes.
| Sustainable Development | Social Sustainability |
| Tragedy of the Commons Definition of sustainable development Triple-Bottom-Line Model Nested Dependencies Model | Socially sustainable communities Methods to promote social sustainability Stakeholder engagement Stakeholder mapping |
| Environmental Sustainability | Sustainable Engineering |
| Fundamentals of ecosystems Ecosystem goods and services Environmental impact assessments Lifecycle analysis | Sustainable design methodologies Nine Principles of Sustainability Engineering Strategic design tools (e.g., Design Abacus) |
| Economic Sustainability | |
| Economic growth and development Neoclassical and ecological economics Five Capitals Model for economic sustainability | |
Table 2.
Comparison between pre- and post-concept map scores determined using the traditional scoring approach for peer-lecture and peer-discussion cohorts (Mean (Standard Deviation)).
Table 2.
Comparison between pre- and post-concept map scores determined using the traditional scoring approach for peer-lecture and peer-discussion cohorts (Mean (Standard Deviation)).
| Peer-Lecture Cohort (n = 53) | Peer-Discussion Cohort (n = 58) | Repeated Measures ANOVA F(1, 109) | |||||
|---|---|---|---|---|---|---|---|
| Pre | Post | Pre | Post | Test | Cohort | Test × Cohort | |
| NC | 14.6 (5.5) | 29.4 (10.4) | 15.2 (5.0) | 29.8 (12.0) | 213.84 *** | 0.13 | 0.01 |
| HH | 4.2 (1.4) | 5.4 (1.7) | 4.0 (1.2) | 5.5 (2.2) | 55.68 *** | 0.012 | 1.11 |
| NCL | 2.9 (3.8) | 5.4 (3.5) | 3.5 (2.7) | 4.1 (3.5) | 16.45 *** | 0.49 | 5.72 * |
| Total | 61.9 (36.3) | 104.8 (35.6) | 66.0 (26.7) | 94.6 (39.3) | 80.27 *** | 0.34 | 3.26 |
* p ≤ 0.05; *** p ≤ 0.001.
Table 3.
Comparison between pre- and post-concept map scores determined using the holistic scoring approach for peer-lecture and peer-discussion cohorts (Mean (Standard Deviation)).
Table 3.
Comparison between pre- and post-concept map scores determined using the holistic scoring approach for peer-lecture and peer-discussion cohorts (Mean (Standard Deviation)).
| Peer-Lecture Cohort (n = 53) | Peer-Discussion Cohort (n = 58) | Repeated Measures ANOVA F(1, 109) | |||||
|---|---|---|---|---|---|---|---|
| Pre | Post | Pre | Post | Test | Cohort | Test × Cohort | |
| Comp 1 | 1.2 (0.4) | 2.4 (0.6) | 1.1 (0.3) | 2.2 (0.5) | 293.08 *** | 3.20 | 0.120 |
| Org 1 | 1.2 (0.5) | 1.8 (0.6) | 1.3 (0.5) | 1.8 (0.8) | 53.44 *** | 0.00 | 1.11 |
| Corr | 2.9 (0.3) | 3.0 (0.0) | 3.0 (0.2) | 3.0 (0.0) | 6.48 * | 0.901 | 0.901 |
| Total | 5.4 (0.8) | 7.2 (0.9) | 5.4 (0.6) | 7.0 (0.9) | 296.48 *** | 0.520 | 1.52 |
* p ≤ 0.05; *** p ≤ 0.001.
Table 4.
Comparison between student-provided rankings to complete several tasks related to sustainable development (SD) before and after completion of the peer-lecture and peer-discussion versions of the sustainability module. Survey prompt: The statements below are related to sustainable development. Indicate how confident you are in your ability to complete the listed tasks.
| Peer-Lecture Cohort (PLC) 1 (n = 52, df = 1) (π6-7) (%) | Peer-Discussion Cohort (PDC) 1 (n = 57, df = 1) (π6-7) (%) | Positively Impacted Students 2,3 (%) (n = 109, df = 1) | |||||||
|---|---|---|---|---|---|---|---|---|---|
| Pre | Post | χ2 | Pre | Post | χ2 | PLC | PDC | χ2 | |
| Develop sustainable solutions to engineering problems. | 13.5 | 48.1 | 15.56 *** | 7.0 | 50.9 | 26.01 *** | 38.5 | 43.9 | 0.327 |
| Discuss the concept of SD. | 17.3 | 75.0 | 31.01 *** | 12.3 | 66.8 | 26.82 *** | 57.7 | 59.6 | 0.043 * |
| Discuss connections between population, environmental degradation, etc. | 11.5 | 51.9 | 17.12 *** | 15.8 | 63.2 | 28.01 *** | 46.2 | 47.4 | 0.016 * |
| Discuss economic factors that affect SD. | 13.5 | 61.5 | 24.08 *** | 5.3 | 71.9 | 37.06 *** | 50.0 | 68.4 | 0.383 |
| Discuss environmental factors that affect SD. | 15.4 | 69.2 | 25.38 *** | 14.0 | 68.4 | 28.35 *** | 57.7 | 57.9 | 0.000 *** |
| Discuss social factors that affect SD. | 9.6 | 61.5 | 28.01 *** | 14.0 | 66.7 | 29.07 *** | 51.9 | 54.4 | 0.066 |
| Evaluate a design based on sustainability criteria. | 9.6 | 59.6 | 21.95 *** | 8.8 | 61.4 | 27.36 *** | 55.8 | 56.1 | 0.002 ** |
Notes: * p ≤ 0.05; ** p ≤ 0.01; *** p ≤ 0.001; 1 McNemar χ2 used to compare pre- and post-scores within subjects. Test statistic calculated with Yates correction factor because some cells contained a frequency of less than 5. 2 Percentage of students that indicated a preliminary score of less than six and a post score of six or greater (on a seven-point scale). 3 Pearoson χ2.
Table 5.
Comparison between pre- and post-concept map scores determined using the traditional scoring approach for cornerstone and capstone cohorts participating in the sustainability module [Mean (Standard Deviation)].
Table 5.
Comparison between pre- and post-concept map scores determined using the traditional scoring approach for cornerstone and capstone cohorts participating in the sustainability module [Mean (Standard Deviation)].
| Cornerstone Cohorts (n = 111) | Capstone Cohort (n = 72) | Repeated Measures ANOVA F(1,181) | |||||
|---|---|---|---|---|---|---|---|
| Pre | Post | Pre | Post | Test | Cohort | Test × Cohort | |
| NC | 14.9 (5.2) | 29.6 (11.2) | 14.2 (6.2) | 19.3 (10.3) | 171.63 *** | 26.65 *** | 40.59 *** |
| HH | 4.1 (1.3) | 5.5 (2.0) | 3.3 (1.2) | 3.6 (1.3) | 41.39 *** | 49.31 *** | 19.2 *** |
| NCL | 3.2 (3.2) | 4.7 (3.5) | 2.6 (3.2) | 4.1 (6.6) | 20.67 *** | 1.38 | 0.00 |
| Total | 64.0 (31.6) | 99.5 (37.3) | 53.9 (32.3) | 74.1 (63.1) | 69.08 *** | 11.31 *** | 5.13 * |
* p ≤ 0.05; *** p ≤ 0.001
Table 6.
Comparison between pre- and post-concept map scores determined using the holistic scoring approach for cornerstone and capstone cohorts participating in the sustainability module [Mean (Standard Deviation)].
Table 6.
Comparison between pre- and post-concept map scores determined using the holistic scoring approach for cornerstone and capstone cohorts participating in the sustainability module [Mean (Standard Deviation)].
| Cornerstone Cohorts (n = 111) | Capstone Cohort (n = 72) | Repeated Measures ANOVA F(1, 181) | |||||
|---|---|---|---|---|---|---|---|
| Pre | Post | Pre | Post | Test | Cohort | Test × Cohort | |
| Comp | 1.2 (0.4) | 2.3 (0.5) | 1.3 (0.5) | 1.8 (0.7) | 246.44 *** | 12.91 *** | 33.94 *** |
| Org | 1.3 (0.5) | 1.8 (0.7) | 1.3 (0.5) | 1.8 (0.8) | 72.80 *** | 0.13 | 0.11 |
| Corr | 2.9 (0.2) | 3.0 (0.0) | 2.9 (0.3) | 3.0 (0.0) | 16.86 *** | 2.01 | 2.01 |
| Total | 5.4 (0.7) | 7.1 (0.9) | 5.4 (0.8) | 6.5 (1.0) | 307.28 *** | 7.12 ** | 12.93 *** |
** p ≤ 0.01; *** p ≤ 0.001.
Table 7.
Comparison between student-provided rankings to complete several tasks related to sustainable development (SD) before and after participation in the capstone and cornerstone implementations of the sustainability module. Survey Prompt: The statements below are related to sustainable development. Indicate how confident you are in your ability to complete the listed tasks.
| Cornerstone Cohorts (CNR) 1 (n = 109, df = 1) (π6-7 ) (%) | Capstone Cohort (CAP) 1 (n = 84, df = 1) (π6-7) (%) | Positively Impacted Students 2,3 (%) (n = 193, df = 1) | |||||||
|---|---|---|---|---|---|---|---|---|---|
| Pre | Post | χ2 | Pre | Post | χ2 | CNR | CAP | χ2 | |
| Develop sustainable solutions to engineering problems. | 10.1 | 49.5 | 38.43 *** | 27.4 | 43.0 | 4.88 * | 41.3 | 26.2 | 4.77 * |
| Discuss the concept of SD. | 14.7 | 70.6 | 55.54 *** | 45.2 | 61.6 | 5.53 * | 58.7 | 31.0 | 14.70 *** |
| Discuss connections between population, environmental degradation, etc. | 13.8 | 57.8 | 42.67 *** | 35.7 | 44.2 | 1.24 | 46.8 | 23.8 | 10.77 *** |
| Discuss economic factors that affect SD. | 9.2 | 67.0 | 59.24 *** | 34.5 | 38.4 | 0.40 | 59.6 | 20.2 | 18.53 *** |
| Discuss environmental factors that affect SD. | 14.7 | 68.8 | 51.96 *** | 36.9 | 44.2 | 0.86 | 57.8 | 23.8 | 22.36 *** |
| Discuss social factors that affect SD. | 11.9 | 64.2 | 55.07 *** | 39.3 | 52.3 | 3.06 | 53.2 | 27.4 | 13.00 *** |
| Evaluate a design based on sustainability criteria. | 9.2 | 60.6 | 47.52 *** | 31.0 | 40.7 | 1.61 | 56.0 | 25.0 | 18.61 *** |
Notes: * p ≤ 0.05; *** p ≤ 0.001; 1 McNemar χ2 used to compare pre- and post-scores within subjects. Test statistic calculated with Yates correction factor because some cells contained a frequency of less than 5. 2 Percentage of students that indicated a preliminary score of less than six and a post score of six or greater (on a seven-point scale). 3 Pearoson χ2.
© 2019 by the authors. Licensee MDPI, Basel, Switzerland. This article is an open access article distributed under the terms and conditions of the Creative Commons Attribution (CC BY) license (http://creativecommons.org/licenses/by/4.0/).
Share and Cite
MDPI and ACS Style
Watson, M.K.; Pelkey, J.; Noyes, C.; Rodgers, M.O. Using Kolb’s Learning Cycle to Improve Student Sustainability Knowledge. Sustainability 2019, 11, 4602. https://doi.org/10.3390/su11174602
AMA Style
Watson MK, Pelkey J, Noyes C, Rodgers MO. Using Kolb’s Learning Cycle to Improve Student Sustainability Knowledge. Sustainability. 2019; 11(17):4602. https://doi.org/10.3390/su11174602
Chicago/Turabian StyleWatson, Mary Katherine, Joshua Pelkey, Caroline Noyes, and Michael O. Rodgers. 2019. "Using Kolb’s Learning Cycle to Improve Student Sustainability Knowledge" Sustainability 11, no. 17: 4602. https://doi.org/10.3390/su11174602
Note that from the first issue of 2016, this journal uses article numbers instead of page numbers. See further details here.