Exploring Foreign Direct Investment–Economic Growth Nexus—Empirical Evidence from Central and Eastern European Countries


1
Department of Finance, The Bucharest University of Economic Studies, Bucharest 010374, Romania
2
Department of Economic and Administrative Sciences, Faculty of Administration and Business, University of Bucharest, Bucharest 050107, Romania
*
Author to whom correspondence should be addressed.
Sustainability 2019, 11(19), 5421; https://doi.org/10.3390/su11195421
Submission received: 23 June 2019
/
Revised: 25 September 2019
/
Accepted: 26 September 2019
/
Published: 30 September 2019
(This article belongs to the Collection Sustainable Economic Development: Challenges, Policies, and Reforms)
Abstract
:This study aims to examine the link between foreign direct investment (FDI) inflows and economic growth, also considering several institutional quality variables, as well as sustainable development goals (SDGs) set in the 2030 Agenda for Sustainable Development. By estimating panel data regression models for a sample of 11 Central and Eastern European countries, from 2003 to 2016, the empirical outcomes provide support for a non-linear relationship between FDI and gross domestic product per capita. Regarding institutional quality, it is found that control of corruption, government effectiveness, regulatory quality, rule of law, and voice and accountability positively influence growth, while political stability and absence of violence/terrorism is not statistically significant. Moreover, SDGs such as poverty, income distribution, education, innovation, transport infrastructure, and information technology are noteworthy drivers of growth. The outcomes of panel fully modified and dynamic ordinary least squares partly confirm the findings. The panel vector error-correction model Granger causalities provide support for a short-run one-way causal association running from FDI to growth and a long-run two-way causal connection among FDI and growth. Furthermore, in the long run, unidirectional causal relationships running from each institutional quality indicator to economic growth and FDI are set out.
1. Introduction
In an increasingly globalized worldwide economy, investment is viewed as a catalyst for economic growth. For instance, foreign direct investment (FDI) influx supports development via productivity intensification through new investment, improved technologies, and decision-making abilities to the host nations [1,2,3,4,5,6]. Therefore, FDI lifts the host nation’s economy by rising investible capital and by technological spillovers [7,8]. FDI is regarded as a collection of physical and immaterial capital that is shifted across borders and spill over to the local economy producing growth [9]. Similarly, FDI is a crucial factor in global economic integration and generates direct, stable, and long-lasting relationships between economies [10]. Moreover, Farla, et al. [11] marked off the “crowding in” which pretend that FDI will bring more investment from private inland sources and the “crowding out” which is the reverse.
In neoclassical models, long-term growth may ensue as the outcome of exogenously driven technical evolution and/or labor force growth [6]. Accordingly, new domestic businesses or the extension of the existing ones involve employment of individuals, therefore laying the grounds for the decline of the unemployment rate. Vojtovic, et al. [12] argued that FDI is generally the key provider of capital to founder of jobs for local workers, thus being connected to growth. Likewise, the link between FDI net influxes and poverty lessening is strongly significant [13]. Nevertheless, institutions exert a significant role in technological development [14]. Hence, host-country corruption impacts multinational firms’ foreign investment decisions by producing economic settings that are either fortunate for or hostile to coherent economic activity [15]. Corrupt governments may hinder human progress that rise from FDI, while large levels of bribery will harmfully influence the positive outcome that FDI may have on human development [16]. Chen, et al. [17] proved that foreign companies from countries with higher institutional quality exhibit more efficient investment activities than firms from countries with poor institutions. Gossel [18],Barassi and Zhou [19],Egger and Winner [20] argued that corruption may act as a “grabbing hand” since paying bribes generates a variety of financial misrepresentations, but also as a “helping hand” due its facility to accelerate the bureaucratic courses. Khamfula [21] found that when the level of corruption rises, then FDI is prejudiced, but when the level of corruption is related with local investment, the effect on FDI is beneficial. Hence, Gilmore, et al. [22] emphasized a set of factors which drive the selection of host market: “FDI as a preference to other forms of foreign market entry, size, and growth of the host market, government emphasis on FDI and financial incentives, economic policy, cultural closeness, costs of transport, materials and labor, resources, technology, political stability, infrastructure”.
With the enlarged incorporation of capital markets after the 1990s, FDI streams turn out to be more prevalent amid the developing nations [23]. FDI supported Central and Eastern European countries (hereinafter “CEECs”) to change their product structure to get comparable to the more developed European Union (hereinafter “EU”) nations. Therefore, momentum to economic growth is expected, alongside mitigation of the development gap among the more advanced CEECs and the EU [24]. For instance, Damijan and Rojec [25] established that FDI is a central driver of manufacturing field reform and productivity growth in Central European Countries. Different to other capital streams, FDI is less unstable and does not show a pro-cyclical conduct [26]. Likewise, FDI has an crucial role in the enhancement and structural recovery of the CEECs [27]. However, emerging states with matching economic and state governance structures fail to entice a comparable level of inward FDI due to unproductive business setting [28]. These states should counterbalance the compromise from the advantages that ensue from FDI, such as technology transfer and employment, with the costs allied with increased short-term flows [29]. Fawaz, et al. [30] highlighted extensive variances across high-income and low-income developing nations with reference to institutions, openness in capital markets, aversion to redistribution policies, or culture. Thus, Lipsey [31] argued that nations which show reliable and predictable legal systems and efficient public administration may get more investment than states with deprived governance. In the same vein, Tun, et al. [32] strengthened that better institutions entice more FDI inflows since it creates for multinational corporations a propitious business and investment environment. Nonetheless, according to Henderson [33], favoritism entails boundaries in capital markets, export/import markets, and licensing of production rights, all supporting companies that locate in the national capital. Also, Kottaridi, et al. [34] claimed that foreign investors are not confident in Central and Eastern Europe (CEE) countries’ governments concerning proper use of funds in education. Hence, transition economies show lack of transparency, weak standards of business conduct, poor protection of creditor and minority shareholder rights [35]. The Central and Eastern European countries register fragile economic and social institutions, but show a high potential of economic growth attributable to unsaturated markets, as well as a great extent of FDI appeal because of the geopolitical status of the region [5]. Nevertheless, CEECs show a poor knowledge regarding harnessing the capital richness at their disposal, thus requiring an extended time for getting rid of bureaucratic impediments [36].
Previous papers explored the effect of FDI and institutional quality on economic growth for datasets covering Association of Southeast Asian Nations (hereinafter “ASEAN”) states [37], developing countries, located in the lower- and middle-income groups [38], developing markets and developed economies [39], non-OECD nations [40], Pacific Island countries [41], African nations [42], North African states [43], Southern African countries [44], sub-Saharan African nations [45] or various groups of nations [46]. Therefore, the empirical evidence on foreign direct investment, institutional quality, economic growth link is limited for the CEECs. Throughout the communist regime, the transition economies were isolated, falling behind the Western part with reference to key technologies, skills, and capabilities [47]. The analysis of FDI within this region is important since it has acted as an imperative instrument for catching up. As such, the primary aim of current research is to empirically explore the influence of FDI on economic growth, also considering the institutional quality, for the case of CEECs. As well, measures regarding the 2030 Agenda for Sustainable Development [48] are covered, namely poverty (Goal 1: End poverty in all its forms everywhere), income distribution (Goal 10: Reduce inequality within and among countries), education (Goal 4: Quality education), innovation, transport infrastructure and, information technology (Goal 9: Build resilient infrastructure, promote sustainable industrialization and foster innovation), along with country-level controls. Subsequently, the causal associations between economic growth, FDI, and institutional quality will be explored. Our study differs from prior surveys on CEECs [5,12,49] in two ways: first, we consider the institutional context and, secondly, we provide evidence on the existing causal relationships. The novelty of current research is the broader inclusion of all Worldwide Governance Indicators, especially for the CEECs, as proxies for institutional quality, namely control of corruption, government effectiveness, political stability and absence of violence/terrorism, regulatory quality, rule of law estimate, voice, and accountability.
The remainder of the manuscript is organized as follows. The second section provides a survey of the related empirical studies. The third section presents the econometric methodology, specifically database, variables, and quantitative methods. The fourth section reports on the selected data and shows the quantitative findings of the study. The final section provides concluding remarks and policy recommendations.
2. Literature Survey
2.1. Earlier Papers Worldwide on FDI–Economic Growth Connection
The causal link between foreign direct investment (hereinafter “FDI”) and gross domestic product (hereinafter “GDP”) growth can run in either way [50]. In line with the “FDI-led growth hypothesis”, FDI influxes can arouse growth for the host countries by rising the capital stock, generating new job opportunities, and easing the spread of technology. Conversely, the “market size hypothesis” supposes that a fast GDP growth making new investment opportunities in the host state can also cause higher inflows of FDI. Even if FDI is predictable to increase host economic growth, Zhang [51] exposed that the degree to which FDI is growth-enhancing appears to hinge on nation-specific features.
Iamsiraroj and Doucouliagos [52] performed a meta-regression analysis and emphasized a positive link between growth and FDI, being higher among single country investigations than within cross-country examinations. As such, Leitão and Rasekhi [53] explored the effect of FDI on real GDP per capita of Portugal, from 1995 to 2008, via panel data fixed-effects and random-effects regression models and found that foreign direct investment promotes growth. Mahapatra and Patra [54] supported the noteworthy role of FDI towards economic growth in India. Using provincial panel data from China, Chan, Hou, Li and Mountain [3] found both in the short and long-run that FDI has a significantly positive effect on GDP. The South Asian Association for Regional Cooperation (SAARC) was explored by Saini, et al. [55] which shown that FDI influx positively influence real GDP, gross national income, and export growth, but negatively financial position and trade openness. Likewise, Mahadika, et al. [56] provided evidence for Indonesia by means of vector autoregressive model that there is a long-term connection amid GDP, FDI, and export volume. Alshamsi, et al. [57] estimated an auto regressive distributed lag model for The United Arab Emirates and confirmed that GDP per capita had a significant positive connection with FDI. For the case of South Africa, Sunde [58] identified unidirectional causality running from foreign direct investment to economic growth. Kinuthia and Murshed [59] highlighted that economic growth drives growth of FDI in Kenya, whereas increase in FDI inflows Granger-causes an increase in economic growth in Malaysia. On the contrary, Akinlo [60] established for Nigeria that FDI positively influence growth, but after a sizable lag and it is not significant. In the same vein, Abdallah and Abdullahi [61] employed the vector error-correction model as method of estimation for Nigeria during 1980–2009 and revealed the lack of causal association among FDI and growth in the short term, but a negative relationship in the long term. Also, Yalta [50] noticed that there is no statistically significant association between FDI and economic growth in China. For the case of Turkey, from 1992–2007, Temiz and Gokmen [8] proved both in the short and long-run the lack of significant relationship between FDI and economic growth. Carbonell and Werner [62] reinforced for Spain that FDI is not a driver of growth.
Furthermore, Herzer, et al. [63] pointed out that cross-country studies mostly suggest a positive role for FDI in stimulating economic growth. Ndiaye and Xu [64] studied seven countries belonging to the West African Economy Monetary Union and confirmed the positive influence of FDI on growth. For a dataset comprising 35 developing and 31 developed nations, Ketteni and Kottaridi [9] noticed a positive impact of FDI on growth, but a growing effect as the share of FDI within the state increases. In contrast, Schneider [65] revealed for a panel sample of 47 developed and developing nations, from 1970 to 1990, that FDI show no significant relationship with economic growth, except for developed countries. As well, Herzer, Klasen and Nowak-Lehmann [63] noticed for 28 developing states that there occurs neither a long-term, nor a short-term effect of FDI on growth. Moreover, Dutta and Roy [66] proved that the association between financial development and FDI inflows is strictly non-linear, similar to Kottaridi and Stengos [67] which confirmed that a non-linear association occurs between FDI influxes and growth. By means of threshold regression, Jyun-Yi and Chih-Chiang [68] documented that FDI can endorse economic growth when the host nation has reached a particular threshold of development, initial GDP, and human capital. Correspondingly, Nguyen and To [37] found two threshold levels of FDI.
An overview of the studies on the foreign direct investment–economic growth nexus worldwide is provided in Table 1.
2.2. Previous Studies in CEECS on FDI–Economic Growth Link
Transition economies may benefit from FDI since it could cover the current account scarcity, fiscal deficit, also supplementing insufficient inland funds to finance both ownership change and capital formation [35]. The CEECs reveal the advantage of refining their legal and institutional backgrounds as a prerequisite for joining the EU, thereby improving their benefits in order to call foreign investors [75]. In this regard, Jones, et al. [76] emphasized that EU affiliation had a significant consequence on the FDI in the CEECs, more than doubling the amount of the projects placed in these states compared to before the beginning of the accession dialogs. As such, a positive impact of FDI on growth is predictable. For instance, Campos and Kinoshita [77] explored 25 transition economies in Central Europe and in the former Soviet Union from 1990 to 1998 and found that the effect of FDI on economic growth is positive and statistically significant. Apergis, et al. [78] explored 27 economies in transition during 1991–2004 and concluded that FDI has a significant connection with economic growth in the case where all states are encompassed in the sample. Nevertheless, after the sample was divided into low- and high-income nations and in states with effective and not effective privatization plans, the inference preserve only for the case of the high-income economies and economies with fruitful denationalization agendas. Yormirzoev [79] investigated the states of Central and Eastern Europe, alongside the Commonwealth of Independent States, from 1992 to 2009 and confirmed a positive association between FDI and growth. Hlavacek and Bal-Domanska [49] investigated Central and Eastern European nations amid 2000 and 2012 and proved that statistically significant associations occur among economic growth, FDI, and investment growth. By exploring 16 Central, Eastern, and Southeastern European states during 1998–2013, Miteski and Stefanova [80] documented that FDI influxes in industry and services positively influence economic growth, whereas FDI in the construction sector did not show a statistically significant effect.
On the contrary, Mencinger [81] proved for a sample of eight EU candidates in 2004 a negative relationship between FDI and growth explained by the fact that takeovers were the prime means of entrance for overseas investors, while the capital employed for purchasing the companies was later focused on consumption and imports, thus failing to increase efficiency. Bačić, et al. [82] explored 11 CEECs from 1994 to 2002 and found that FDI is insignificant for growth. Kherfi and Soliman [83] found a negative or statistically insignificant effect of FDI on economic growth in MENA and non-EU accession CEECs, but a positive impact only in EU accession countries. Hence, FDI role concerning growth in transition economies is conditional upon applying extensive economic transformations or pointing out solid engagement to completing such reforms. As well, Ferencikova and Dudas [84] analyzed eight new EU member states during 1993–2003 and proved that the influx of FDI did not support economic growth, whereas wide FDI influxes are followed by slow GDP growth. Curwin and Mahutga [85] reinforced for 29 Central and Eastern European and Eurasian post-socialist transition nations from 1990 to 2010 that FDI diffusion lessens economic growth in the short and long term. Saglam [86] established for 14 European transition states for the period 1995–2014 that economic growth rate decreases by 0.0162% when FDI increases by 1%.
A summary of the existing literature on the foreign direct investment–economic growth nexus in CEECs is provided in Table 2.
2.3. Preceding Examinations on FDI–Institutional Quality Association
The association among institutional factors and FDI is generally defined through its positive or negative consequences, with features such as self-governing organizations, political solidity, and rule of law appealing FDI and issues such as corruption, tax policies and cultural distance discouraging FDI [97]. Dunning [98] postulated that a company requires ownership, location, and internalization benefits to cross borders and engage in FDI. Furthermore, the institutional theory of North [99] highlighted that institutions set out market guidelines, shape connections between economic actors and guarantee that economic arrangements are circumscribed by these directions. However, investors are refractory with reference to states where institutional ambiguities boost bribery, red tape rises the transaction cost of investment, and where the administration can seize investments [100]. Multinational corporations are fascinated by states wherein civil and political independence is valued [101]. Therefore, good quality institutions in the host state are a prerequisite for appealing FDI influxes into that nation [102].
According to Buchanan, Le and Rishi [2], FDI goes to states with better quality institutions, while reduced governance can obstruct FDI. Xu [103] supported that economic freedom of both the homebased state and the host nation are positively associated with FDI. Adversely, Daniele and Marani [104] revealed that crime appears as a disincentive for foreign investors arguing that high levels of crimes are viewed as a signal of a local socio-institutional setting adverse for FDI. Akhtaruzzaman, et al. [105] proved that a one-standard-deviation decrease in seizure risk is related with a 72% rise in FDI. Similarly, Peres, et al. [106] reported for developed states that a one-standard-deviation modification in governance affects FDI by a factor of 0.2225, while the association is not significant for developing countries. By generating ambiguity in investment outcomes and by dropping the anticipated returns, fraud daunts the investment activity of the businesses, which renders into forgone economic growth [107]. The “grease the wheels” hypothesis supported by Kato and Sato [108] advises that corruption can accelerate economic activity under conditions of weak governance structures and ineffective policy. Elheddad [109] underlined that overseas companies choose to invest their money in corrupted extents which let them more admission to the natural resource and reduced taxes. Quite the reverse, the “sand the wheels” hypothesis proved by Meon and Sekkat [110], Cooray and Schneider [111], claims that corruption can be expensive for economic activity. Farla, Crombrugghe and Verspagen [11] did not provide robust evidence of a positive connection amid “good governance” and upper levels of investment but exhibited that the interplay between foreign investment and governance has an adverse mediating consequence on investment.
A brief review of previous papers on the FDI and institutional quality connection is exhibited in Table 3.
3. Data and Methodology
3.1. Sample Selection and Variables
The dataset used in this study spans the period from 2003 to 2016, common for all selected measures and comprises 11 Central and Eastern European countries, namely Bulgaria, Croatia, Czech Republic, Estonia, Hungary, Latvia, Lithuania, Poland, Romania, Slovakia, Slovenia. World Bank and Eurostat databases have been employed to gather the statistical data. The selected variables are listed in Table 4. Throughout the sample period, there is missing data on many variables, which diminish our data set for each model differently. Following preceding studies [2,19,39,41,42,46,57,61], we consider our dependent variable as GDP per capita. In line with earlier studies [2,41,57,61,69], inflows of FDI were considered. Furthermore, we comprise measures set out in the 2030 Agenda for Sustainable Development [48], relating to poverty [13], inequality of income distribution [59,112], education [3,13,20,34,39,41,42,43,46,52,71,112,118], innovation [14,28,65,104], transport infrastructure [3,13,52,114], information technology [13,28], institutional quality [2,13,14,15,18,19,20,28,39,41,42,44,46,52,107,115,117,118]. The estimate of each Worldwide Governance Indicators provides the nation’s score on the aggregate indicator, in units of a standard normal distribution, fluctuating from roughly −2.5 to 2.5, with higher values pertaining to better governance. Moreover, country-level control measures are included, namely government expenditure [12,40,42,46,64,71,72,116], urbanization [69], domestic credit to the private sector [41,46,72] and trade [2,5,13,18,19,34,40,42,43,44,46,52,53,55,61,64,69,72,118].
3.2. Quantitative Techniques
The most common methods identified in the literature concerning the influence of FDI on economic growth are panel data fixed-effects and random-effects estimations [1,2,13,28,41,53,64,65,69,107,114], as well as the generalized method of moments [9,18,41,42,43,44,45,71,72,113,117]. Current paper employs the first approach, the econometric specifications being depicted as follows:
i = 1, 2, …, 11, t = 2003, 2004, …, 2016.
where the dependent variable is GDP per capita in CEECs. FDI is a measure of inward FDI flows. SDGs signifies a vector of explanatory variables concerning sustainable development goals [48]. CV depicts the country-level control variables. describes the country-specific intercept, – are the coefficients to be estimated, ε is the error term, i is the subscript of recipient FDI CEE nation, and t is the subscript of time and accounts for the unobservable time-invariant individual specific effect, not included in the regression [34].
Likewise, to inspect for a potential non-linear association between FDI and growth, the squared term of FDI (hereinafter “FDI_SQ”) will be encompassed in the aforementioned equation:
i = 1, 2, …, 11, t = 2003, 2004, …, 2016.
The next step is to determine the order of integration. To examine the stationarity of the series, several tests will be performed, such as Augmented Dickey–Fuller (hereinafter “ADF”) [1,3,8,14,39,56,57,58,61,70,73], Phillips–Perron (hereinafter “PP”) [1,7,39,58,61,70,73], Levin–Lin–Chu (hereinafter “LLC”) [1,13,14,39,70,73,118], Im–Pesaran–Shin (hereinafter “IPS”) [1,7,13,14,39,70,73,118] and Breitung [3,39,70,73]. In the ADF and PP tests, the size of the coefficient from the further equation should be established [58]:
where the variable depicts the first differences with n lags. signifies the variable that adjusts the errors of autocorrelation. The coefficients − and are those estimated. The ADF regression checks for the occurrence of unit root of in all model variables at time t. The null and the alternative hypothesis for the presence of unit root in variable is depicted below:
Regarding the PP test, the equations and hypotheses are analogous to those of ADF, but the lags of the variables are left out from the models, as follows:
The LLC test presumes homogeneity in the dynamics of the autoregressive coefficients for all panel members, whereas the IPS test allows heterogeneity in dynamic panel and intertemporal data [1]. Breitung proposes a test statistic that does not apply a biased adjustment whose power is considerably higher than LLC or the IPS tests by means of Monte Carlo trials [70].
Moreover, several panel co-integration tests will be achieved, respectively Pedroni [1,7,39,70], Kao [70] and Fisher-type Johansen [8,56,61,73]. If the variables are cointegrated, there occurs a force that converges into a long-run equilibrium [73]. Pedroni [120] advised the calculation of the regression residuals from the hypothesized cointegrating regression, as below:
for t = 1, …, T, i = 1, …, N, m = 1, …, M.
where T denotes the number of observations over time, N signifies the number of individual members in the panel, and M depicts the number of regression variables.
Kao [121] proposed a parametric residual-based panel co-integration, whereas Maddala and Wu [122] suggested the use of Fisher-type panel co-integration test via the methodology of Johansen [123] for the reason that the maximum-likelihood procedure has significantly large and finite sample properties.
After co-integration is settled, the long-run associations will be estimated via Fully Modified Ordinary Least Squares (hereinafter “FMOLS”) and Dynamic Ordinary Least Squares (hereinafter “DOLS”) in line with prior studies [1,14,39]. The FMOLS estimator produces consistent estimates in small samples and controls for the endogeneity of the regressors and serial correlation, whereas the DOLS estimator removes the second order bias triggered by the fact that the independent variables are endogenous [1]. Therefore, the causal relationships will be established, similar to earlier studies [7,51,58,61,70]. Thus, six tri-variate panel vector error-correction models (hereinafter “PVECM”) for investigating the connection between FDI, each institutional quality measure and economic growth will be estimated:
where IQ denotes the institutional quality variables, (1 − L) depicts the difference operator,
signifies the lagged error-correction term that ensues from the long-run cointegrating connection, exhibits the white noise serially independent random error terms. The occurrence of a significant association in first differences of the variables reveals the direction of short-run causality, whereas long-run causality is exposed by a significant t-statistic relating to the error-correction term (hereinafter “ECT”) [58].
4. Empirical Results and Discussion
4.1. Descriptive Statistics and Correlations
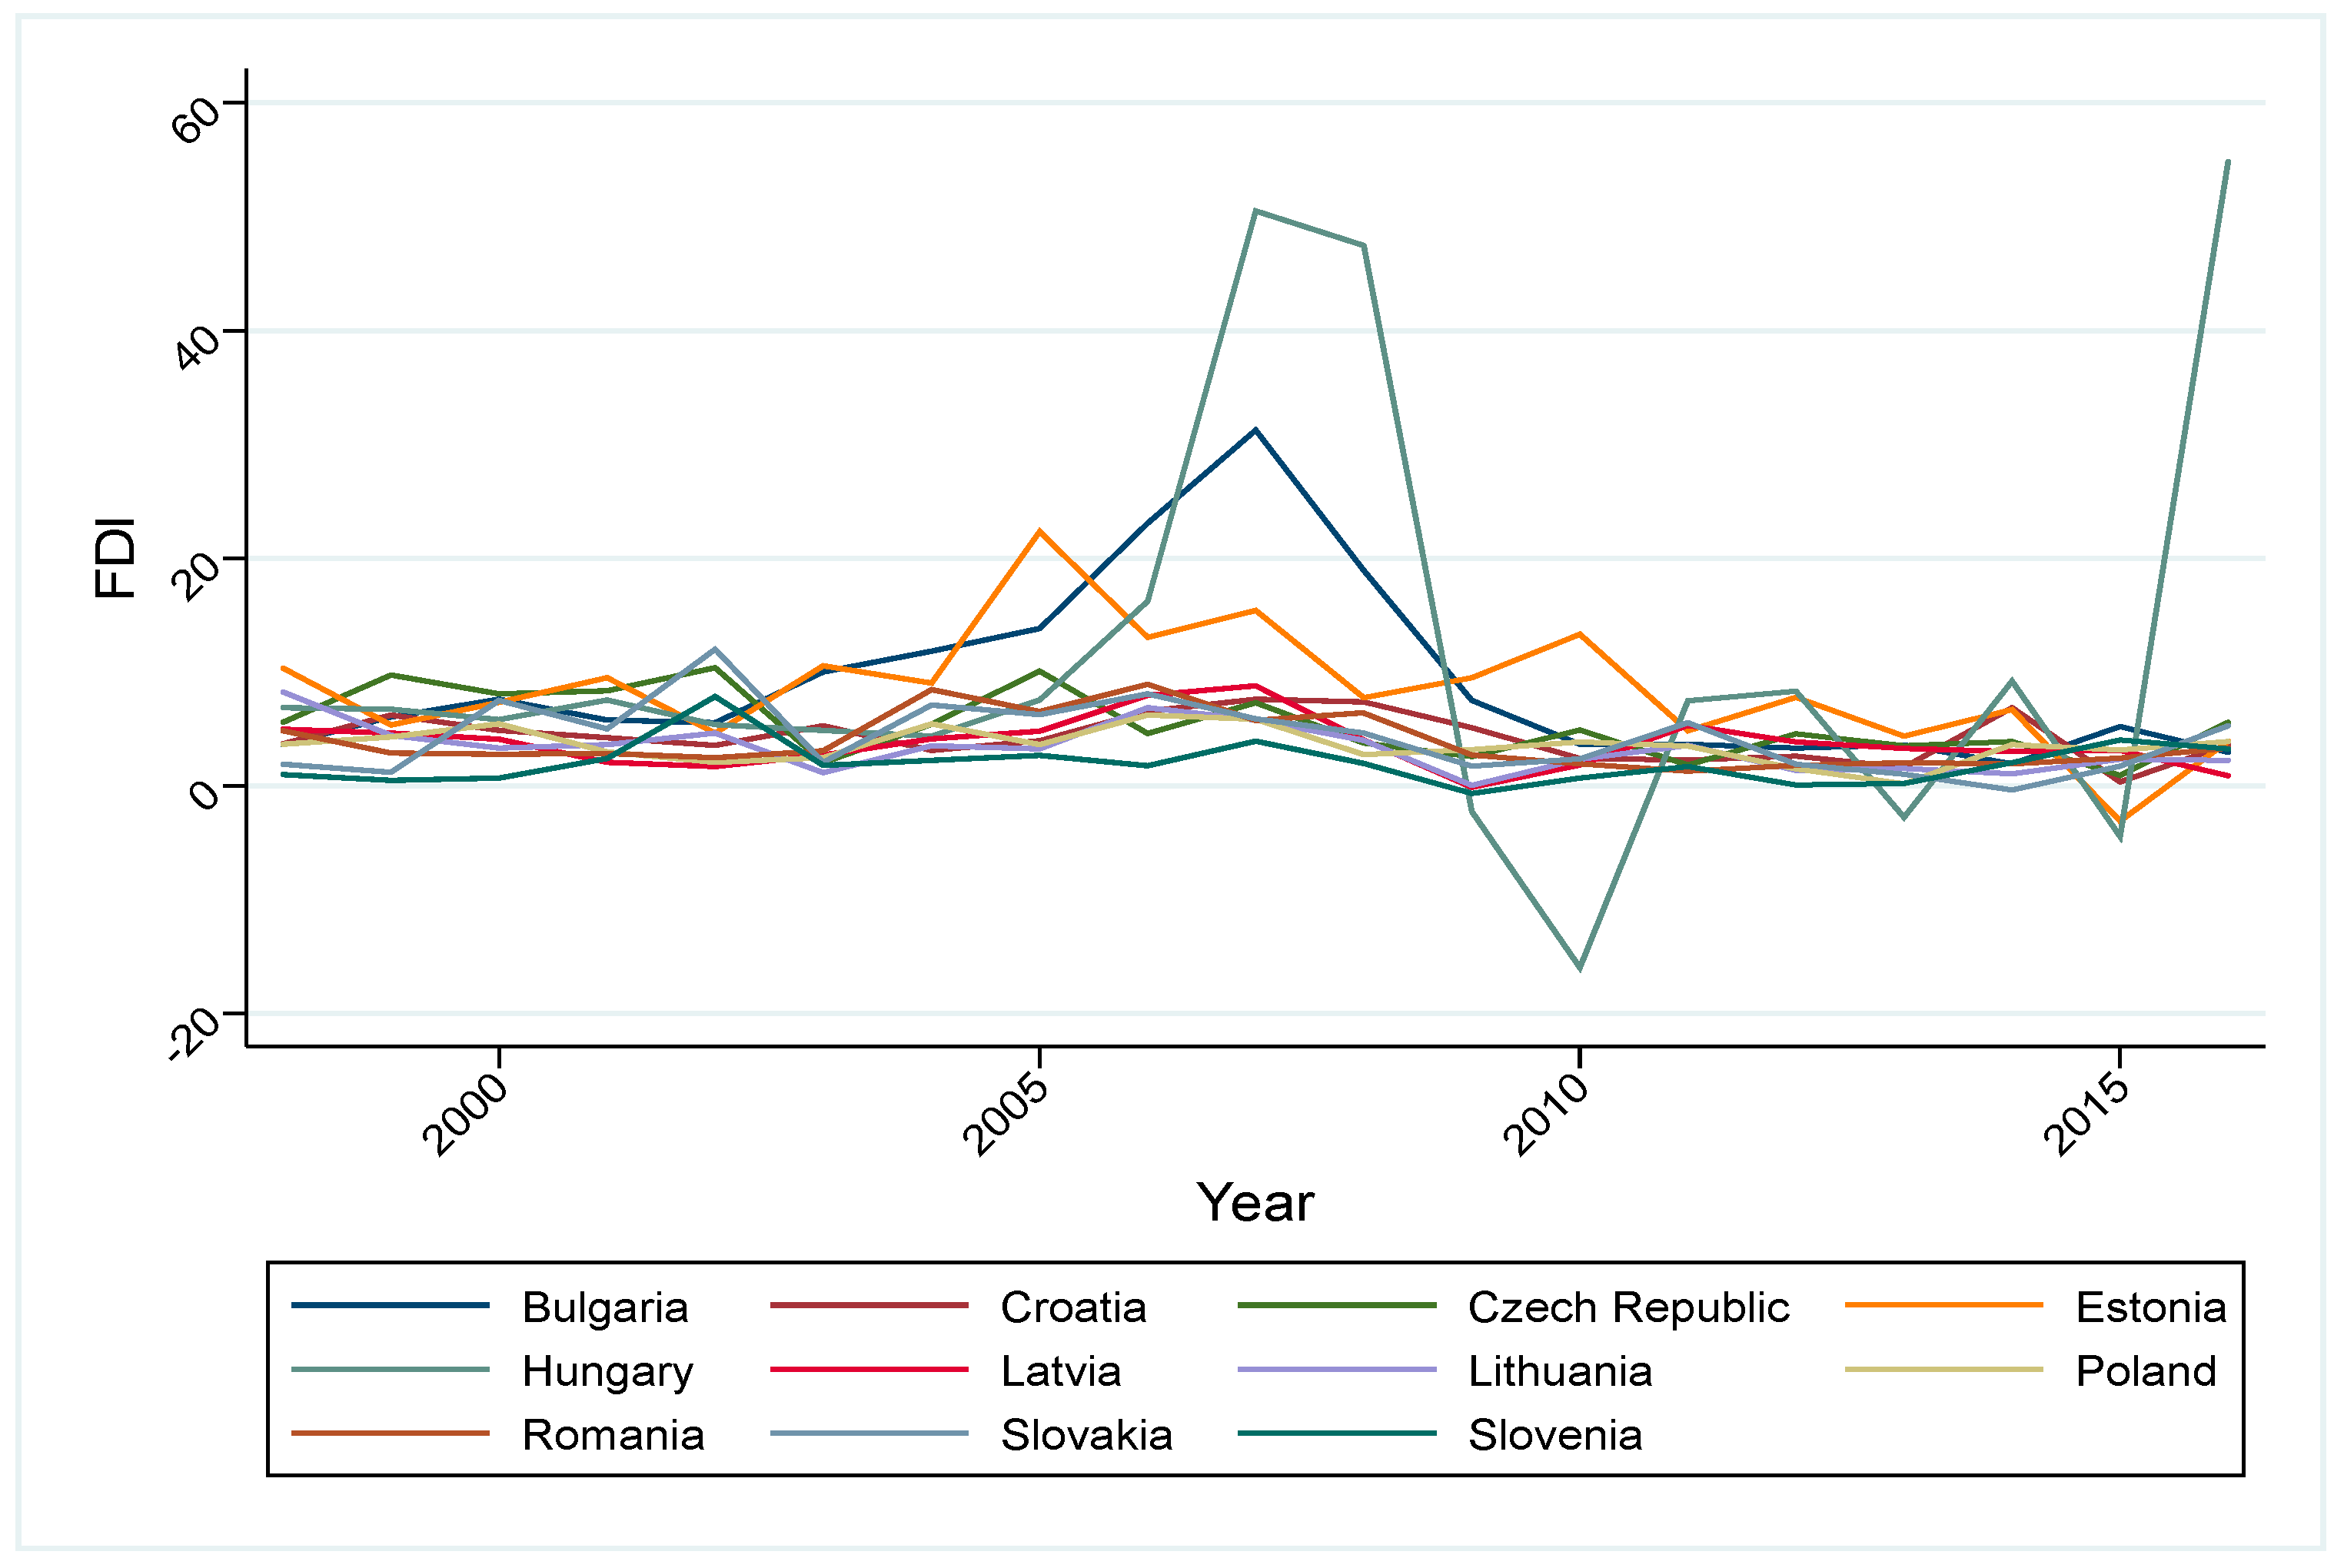
Table 5 reveals the summary statistics for the measures selected in the empirical analysis. The mean level of FDI inflows equaled 5.39% of GDP. Figure 1 shows the temporal evolution of the FDI inflows in CEECs and provides evidence that Slovenia (2.00%) and Lithuania (3.32%) registered the lowest mean values regarding FDI inflows, whereas Bulgaria (8.91%) and Hungary (11.45%) the highest average values. With reference to poverty, we notice that the mean share of individuals at risk of poverty or social exclusion is 29.39%, whereas the average income quintile share ratio is 5.06%. Moreover, a mean value of 35.55% of individuals out of CEECs are using the Internet. Concerning the average values of the variables regarding institutional quality, we notice a poor governance in the CEECs.
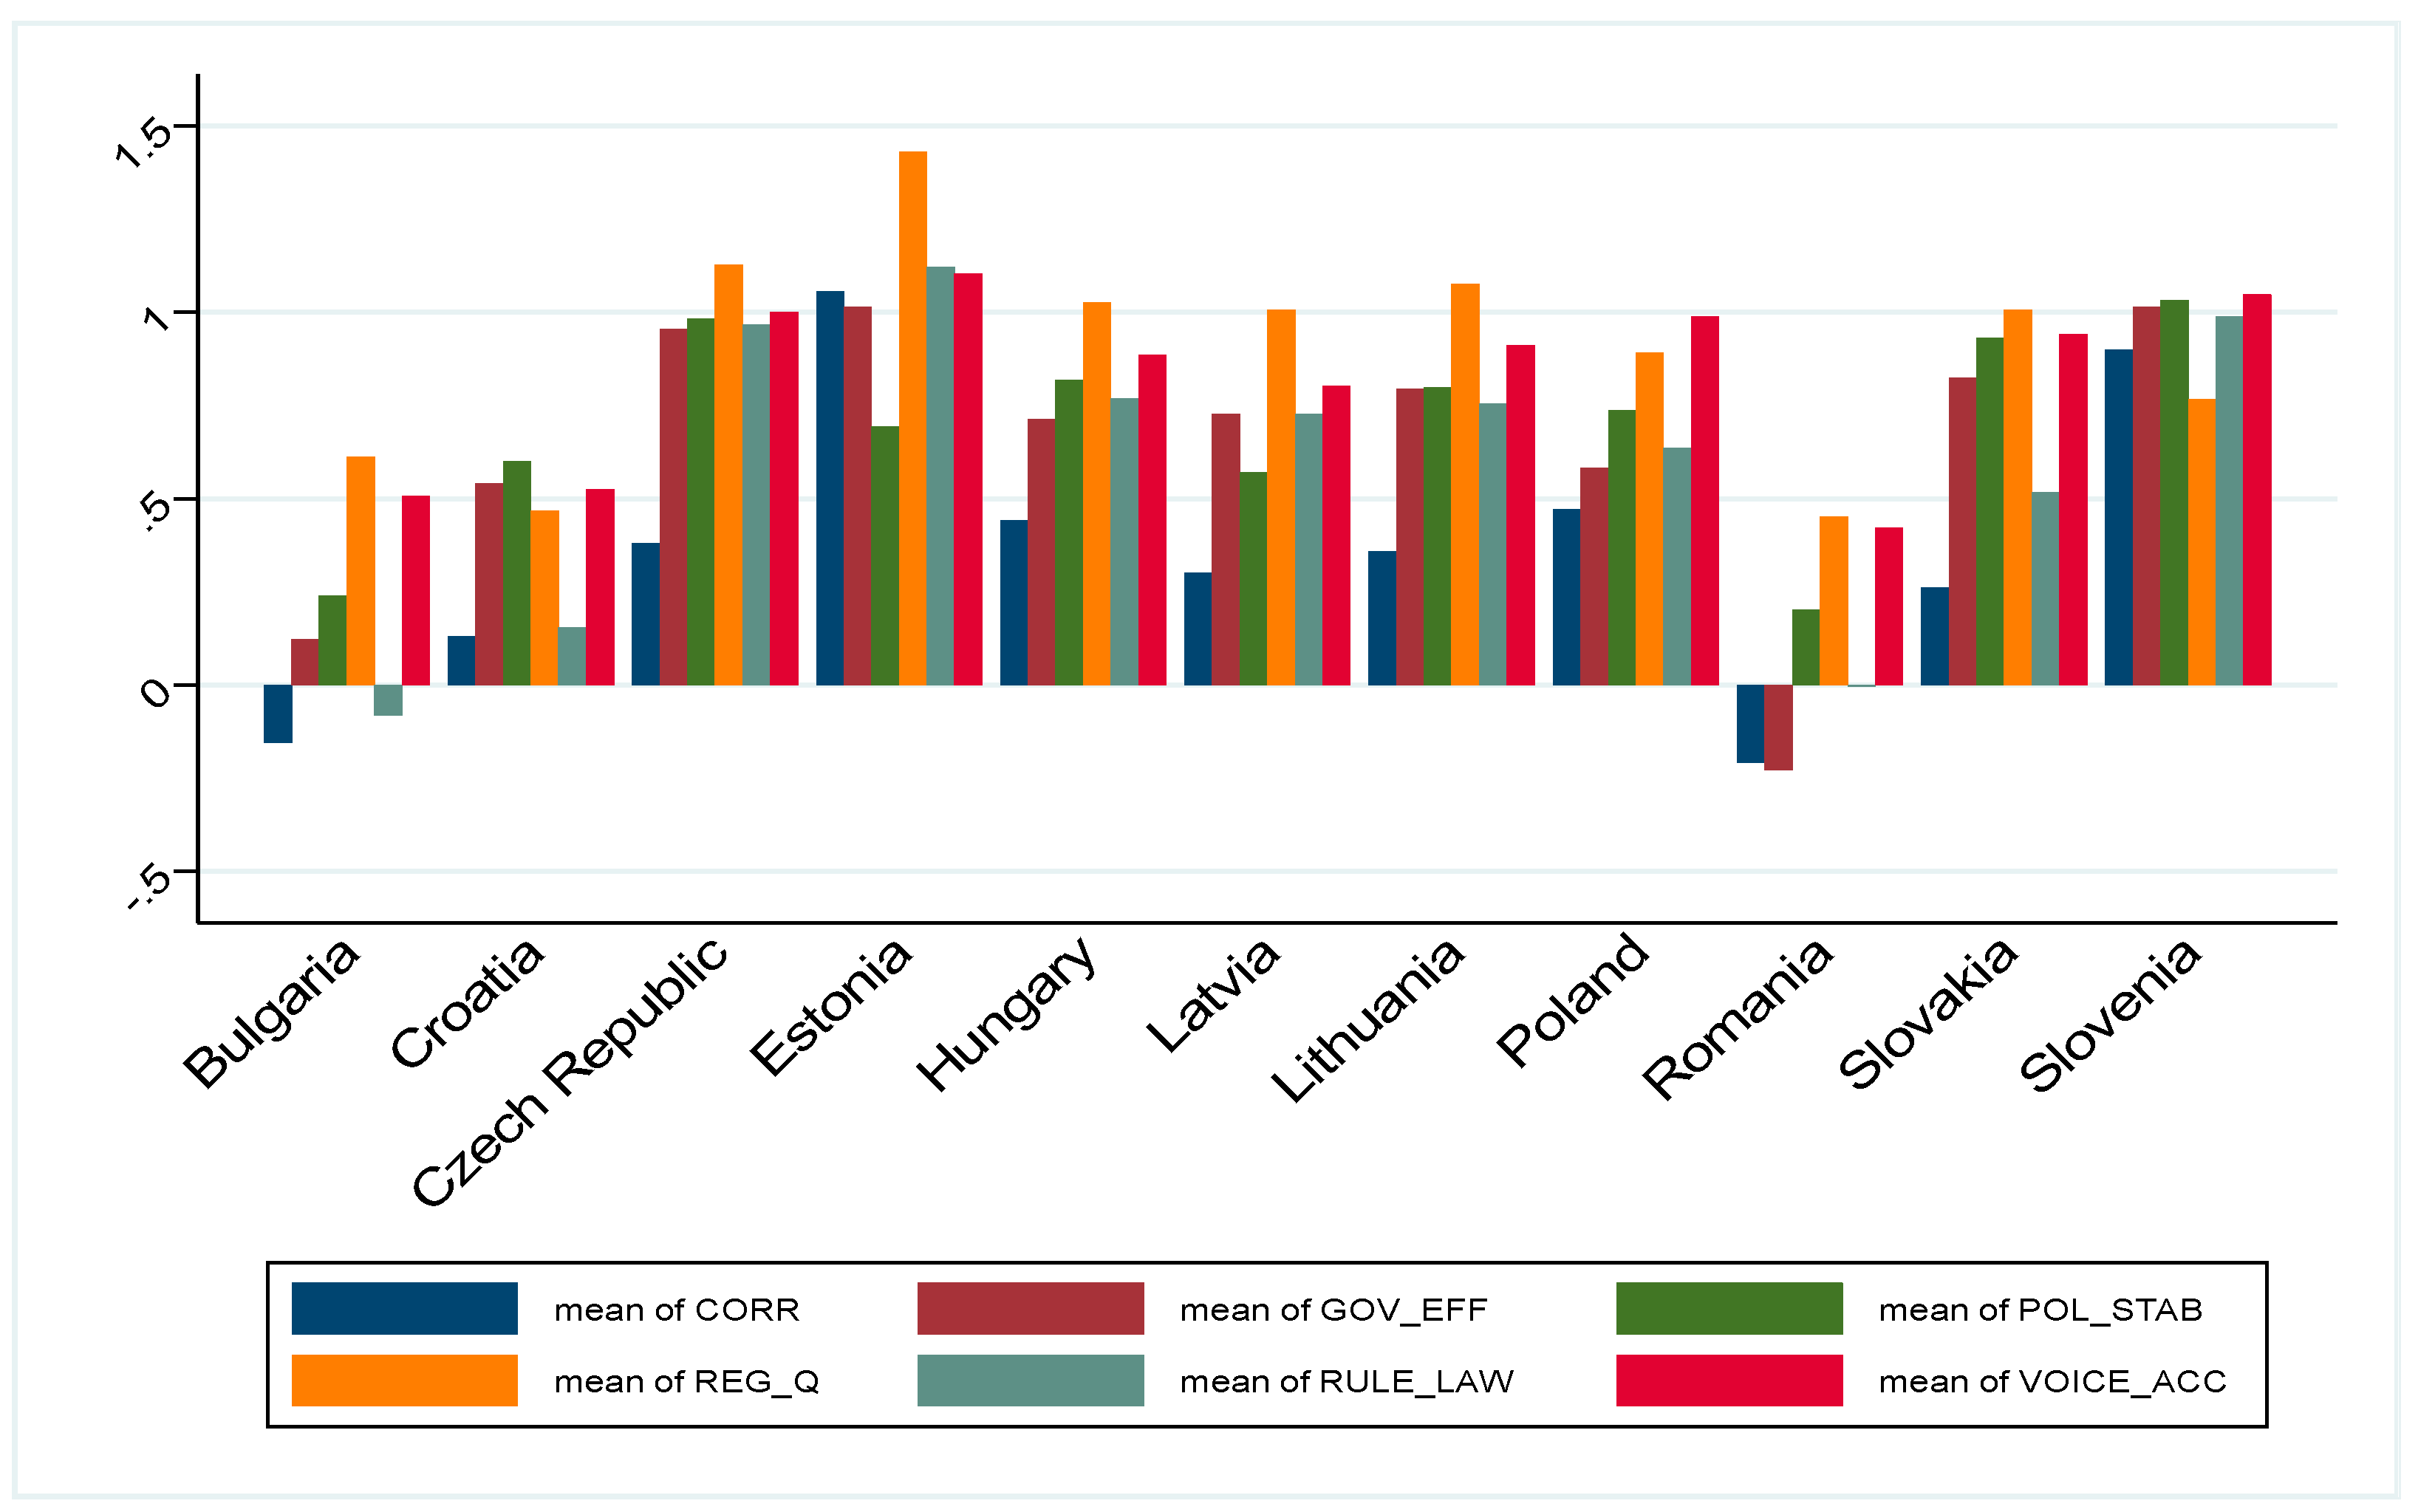
The average values of Worldwide Governance Indicators for every selected country are revealed in Figure 2. With reference to control of corruption estimate, the lowest mean values are registered in Romania (−0.21) and Bulgaria (−0.15), whereas the highest mean values in Slovenia (0.90) and Estonia (1.06). Government effectiveness estimate shows the bottom mean figures in Romania (−0.23) and Bulgaria (0.12), but the uppermost mean figures in Slovenia (1.014) and Estonia (1.015). Regarding political stability and absence of violence/terrorism estimate, the lowest mean values are reported in Romania (0.20) and Bulgaria (0.24), while the highest mean values are exhibited in the Czech Republic (0.98) and Slovenia (1.03). Regulatory quality estimate reveals the lowest average numbers in Romania (0.45) and Croatia (0.47), while the highest average numbers in the Czech Republic (1.13) and Estonia (1.43). Relating to the rule of law estimate, Bulgaria (−0.08) and Romania (0.004) shows the lowest mean values, whereas Slovenia (0.99) and Estonia (1.12) point out the highest mean values. In terms of voice and accountability estimate, Romania (0.42) and Bulgaria (0.51) displays the lowest average figures, but then again Slovenia (1.05) and Estonia (1.10) the highest mean figures.
In line with prior studies [2,4,5,46,55,72,73,112,115,116,118,119], the correlation coefficients of the selected measures are reported in Table 6. We ascertain high level of correlation amid institutional dimensions as in previous studies [2,4,13,23,28]. Therefore, to get rid of the multicollinearity issue, the highly correlated measures will be included in separate regression models.
4.2. Multivariate Analysis Outcomes
The Hausman test was accomplished for all the estimated econometric models and most of the outcomes support that panel data fixed-effects estimators are consistent than panel data random effects, as in Kayalvizhi and Thenmozhi [28]. However, Zakharov [107] contended that fixed-effects regressions eliminate time-invariant factors typical for each country and comprise time dummies to catch the common time trend.
Table 7 reports the results of estimations concerning the impact of FDI, poverty, and income inequality on growth. The estimated coefficient of FDI is negative in (1), revealing a low statistical significance, while statistically insignificant in (3). However, in (2) and (4), the coefficient of FDI is also negative, but the coefficient of FDI_SQ is positive, therefore showing a non-linear relationship with GDP per capita. The non-linear relationship between FDI and growth is in line with prior studies [37,66,67,68]. Furthermore, individuals at risk of poverty or social exclusion show a negative impact on economic growth, in estimations (1) and (2), since poverty act against human capital expansion through restraining the capacity of people to go on healthy and to contribute via talented workforce. On the contrary, estimations (3) and (4) show that income quintile share ratio positively influences economic growth, similar to Fawaz, Rahnama and Valcarcel [30].
Table 8 presents the estimation outcomes regarding the influence of FDI, education, and innovation on economic growth. The estimation results display the lack of any statistically significant relationship between FDI and growth in all the estimated models. On the other hand, the coefficients of pupils and students, in estimations (1) and (2), alongside the number of patent applications, in estimations (3) and (4), are positive and statistically significant. In fact, educational attainment would catch the absorptive capacity of the economy [46]. This implies that enhanced human capital formation, alongside innovation boost GDP per capita.
The outcomes of panel data regression models towards the impact of FDI, transport infrastructure, and information technology on economic growth are illustrated in Table 9. Analogous to the outcomes from Table 8, there is not found any statistically significant association between FDI and GDP per capita. As well, the coefficients of transport infrastructure in (1) and (2) and information technology in (3) and (4) shows a positive influence on economic growth. Nevertheless, better infrastructure rises the productivity of investment and thus spurs FDI flows [29].
Table 10 and Table 11 show the estimation outcomes regarding the impact of FDI and institutional quality on economic growth. Similar to Table 7, the results of panel data fixed-effects regression models provide evidence for a non-linear link with economic growth. Furthermore, all the Worldwide Governance Indicators positively influence growth, except political stability and absence of violence/terrorism which is not statistically significant. In case of control of corruption, the “helping hand” viewpoint [18,19,20] is confirmed. Similar to Kato and Sato [108], the “grease the wheels” hypothesis is established. As well, consistent with Iamsiraroj [46], quality of institutions exerts a critical role in augmenting economic growth directly and through FDI inflows.
With reference to country-level control measures, general government final consumption expenditure negatively influences economic growth. Iamsiraroj [46] claimed that FDI may relocate domestic saving, whereas Awad and Ragab [42] reinforced for developing states where inland sources of capital are inadequate that private-sector investment may be “crowded out” by higher levels of government spending. Urban population negatively influences economic growth, similar to some extent to Alvarado, Iñiguez and Ponce [69], but contrary to Henderson [33] which claimed that urbanization accelerates growth. Domestic credit to private sector exerts a positive influence on growth similar to Feeny, Iamsiraroj and McGillivray [41]. Trade shows a positive effect on economic growth since openness empowers a more efficient manufacture of goods and services through moving production to nations that have an inclusive benefit [46]. As such, more openness to trade determines a higher FDI influxes, thus showing a positive influence on growth.
4.3. Causality Analysis
Table 12 and Table 13 summarize the panel unit root tests, both for the variables in level and first difference, for types concerning individual intercept, as well as individual intercept and trend, to ensure more robustness. Since all the variables are highly statistically significant at first difference, we notice that all measures are integrated of order one I (1). Thus, we might expect there is a long-run connection between these variables together [109].
Table 14 summarizes the results of panel co-integration examination among the variables using the Pedroni statistics. For the first model, one out of seven Pedroni tests rejects the null hypothesis of no co-integration by means of both the panel and group forms of the Phillips–Perron and ADF tests. Onward, four statistics confirm the co-integration for the second model, three statistics for the third model, two statistics for the fourth model and the sixth models, while six statistics for the fifth model.
Furthermore, to confirm the strength of the outcomes, we apply the Kao test for panel co-integration which is a residuals-based test. Table 15 displays the results of the Kao panel co-integration test. It is obvious that ADF (t-Statistic) is significant, except the sixth model. As such, null hypothesis, specifically there is no co-integration is rejected [109]. Thus, there is a long association between selected measures.
Table 16 reports the results of the Johansen panel co-integration test. For the Johansen panel co-integration test, the suppositions of co-integration tests permit for individual effects, but no individual linear trends in vector autoregression [73]. The null hypothesis of no co-integration is rejected, thus being confirmed the incidence of a long-run association between the variables.
In as much as the variables are cointegrated, the long-run associations are further estimated via FMOLS and DOLS. The outcomes of the FMOLS and DOLS estimated co-integration connections are displayed in Table 17. The FMOLS outcomes of estimations (1), (3), (4) and (6) provide support for an undesirable influence of FDI on growth, contrary to Pegkas [1], Freckleton, Wright and Craigwell [39]. As well, the DOLS results confirm the negative impact merely in the first estimation. With reference to the institutional quality variables, the outcomes are similar to those reported in Table 10 and Table 11, but voice and accountability estimate loses its statistical significance.
The outcomes of PVECM Granger causalities are reported in Table 18. Therefore, the following causal relationships are identified for each model:
- Model (1): Short-run one-way causal link running from FDI to growth;
- Model (2): One-way causal link running from FDI to growth, along with short-run unidirectional causal link running from government effectiveness to growth;
- Model (3): Short-run one-way causal link running from FDI to growth;
- Model (4): Short-run one-way causal link running from FDI to growth, alongside one-way unidirectional causal link running from growth to regulatory quality;
- Model (5): Short-run one-way causal link running from FDI to growth and one-way unidirectional causal link running from growth to rule of law;
- Model (6): One-way causal link running from FDI to growth, besides short-run unidirectional causal link running from voice and accountability to FDI.
The significance of the ECT is valuable for discussing long-run causality. Therefore, in the long term, we acknowledge a bidirectional causal relationship between FDI and economic growth in all the PVECM models similar to Chan, Hou, Li and Mountain [3], Mahmoodi and Mahmoodi [70], as well as a one-way causal relationship running from each institutional quality indicator to economic growth and FDI.
5. Conclusions and Policy Implications
Foreign direct investment, a crucial factor of globalization, is regarded a noteworthy engine of productivity heightening, technical progress, and job creation. However, reduced institutional quality may discourage FDI inflows. Using panel data for 11 Central and Eastern European countries from 2003 to 2016, current paper examined at first glance the impact of FDI on economic growth, also covering institutional quality measures, as well as several sustainable development goals established in the 2030 Agenda for Sustainable Development [48]. The quantitative outcomes by means of panel data regression models lead us to conclude that a non-linear association occurred between FDI and GDP per capita. In terms of institutional quality, the whole Worldwide Governance Indicators, except political stability and absence of violence/terrorism, exhibited a positive influence on economic growth. Moreover, poverty, income distribution, education, innovation, transport infrastructure and, information technology appeared as significant drivers of growth. The estimations of FMOLS and DOLS confirmed the findings to a partial extent. Furthermore, the panel vector error-correction model Granger causalities provided evidence for a short-run unidirectional causal link running from FDI to growth and a long-run two-way causal connection between FDI and economic growth. Therefore, in the long run, unidirectional causal associations running from each institutional quality indicator to economic growth and FDI were established.
The outcomes may have some policy implications. Therefore, the policymakers out of the CEECs should attempt to attract higher FDI inflows to boost economic growth. Overall, for the development of an appropriate setting to attract FDI, favorable economic, political, social and cultural conditions are more than required [7], alongside macroeconomic steadiness and the decrease of the market deformations [1]. For instance, the labor force in such countries is quite trained, but modern management and worldwide manufacturing knowledge is regularly missing. Therefore, investors with the required capitals, managerial skills, marketing chain, and industry strength are crucial [35]. First, there should be shaped an economic setting that ensure proper rewards to corporations which would bring ideas from overseas and put them to use with inland funds [81]. As such, financial stimulus in form of labor subventions, energy and property rental discounts, allowance on customs duties for main machinery/raw resources, export credit conveniences or tariff shield are required [22]. Secondly, a sound institutional setting should be implemented. The “helping hand” viewpoint may be explained via the early stages of democracy in the explored region. As such, in line with Harms and Ursprung [101], Mengistu and Adhikary [100] and Sabir, Rafique and Abbas [102], the democracy in the CEECs should be deepened in order to spur the inward flow of FDI [18]. Good governance may create suitable environments for investors, respectively lower cost of doing business, lesser uncertainty and upper productivity expectation [32]. A suitable stage of institutional progress can support synergies between FDI and resident companies, thus enhancing productivity spillovers. Also, capital accumulation may be increased by means of complementarities between foreign and internal investment [38]. Moreover, in line with Jude and Levieuge [38], a better institutional quality may entice high-quality technology. Thirdly, the minority shareholders and creditor rights should be enhanced via capital market directives and banking sector reorganizations, aiming to rise equity or bond release. Thus, a better extension of domestic credit to enterprises should be allowed in the benefit of wealth creation [35]. Similarly, strengthening of trade will also help in appealing FDI. Not least, the policies concerning sustainable development goals should be promoted. In this vein, greenfield and brownfield investments may lessen unemployment, while increasing incomes, public and private consumption, capital accumulation and productivity [89]. As well, infrastructure should be improved to guarantee that FDI which is acquired manifest an increased gain to the entire economy. Accordingly, improved transport systems and modern information technology ease the spread of novel products and technologies [47].
This paper has contributed to the prevailing literature by adding evidence for the case of CEECs on the nexus between FDI and economic growth. Future research can be done to explore the drivers of FDI inflows in CEECs.
Author Contributions
Conceptualization, Ş.C.G., L.N.S. and O.S.H.; Data curation, Ş.C.G., L.N.S. and O.S.H.; Formal analysis, Ş.C.G., L.N.S. and O.S.H.; Funding acquisition, Ş.C.G., L.N.S. and O.S.H.; Investigation, Ş.C.G., L.N.S. and O.S.H.; Methodology, Ş.C.G., L.N.S. and O.S.H.; Project administration, Ş.C.G., L.N.S. and O.S.H.; Resources, Ş.C.G., L.N.S. and O.S.H.; Software, Ş.C.G., L.N.S. and O.S.H.; Supervision, Ş.C.G., L.N.S. and O.S.H.; Validation, Ş.C.G., L.N.S. and O.S.H.; Visualization, Ş.C.G., L.N.S. and O.S.H.; Writing—Original draft, Ş.C.G., L.N.S. and O.S.H.; Writing—Review and editing, Ş.C.G., L.N.S. and O.S.H.
Funding
This research received no external funding.
Conflicts of Interest
The authors declare no conflict of interest.
References
- Pegkas, P. The impact of FDI on economic growth in Eurozone countries. J. Econ. Asymmetries 2015, 12, 124–132. [Google Scholar] [CrossRef]
- Buchanan, B.G.; Le, Q.V.; Rishi, M. Foreign direct investment and institutional quality: Some empirical evidence. Int. Rev. Financ. Anal. 2012, 21, 81–89. [Google Scholar] [CrossRef]
- Chan, M.W.L.; Hou, K.; Li, X.; Mountain, D.C. Foreign direct investment and its determinants: A regional panel causality analysis. Q. Rev. Econ. Financ. 2014, 54, 579–589. [Google Scholar] [CrossRef]
- Economou, F. Economic freedom and asymmetric crisis effects on FDI inflows: The case of four South European economies. Res. Int. Bus. Financ. 2019, 49, 114–126. [Google Scholar] [CrossRef]
- Tintin, C. The determinants of foreign direct investment inflows in the Central and Eastern European Countries: The importance of institutions. Communis Post-Commun. Stud. 2013, 46, 287–298. [Google Scholar] [CrossRef]
- Iamsiraroj, S.; Ulubasoglu, M.A. Foreign direct investment and economic growth: A real relationship or wishful thinking? Econ. Model. 2015, 51, 200–213. [Google Scholar] [CrossRef]
- Mahembe, E.E.; Odhiambo, N.M. Does foreign direct investment cause economic growth? A dynamic panel data analysis for SADC countries. Int. J. Emerg. Mark. 2016, 11, 316–332. [Google Scholar] [CrossRef]
- Temiz, D.; Gokmen, A. FDI inflow as an international business operation by MNCs and economic growth: An empirical study on Turkey. Int. Bus. Rev. 2014, 23, 145–154. [Google Scholar] [CrossRef]
- Ketteni, E.; Kottaridi, C. The impact of regulations on the FDI-growth nexus within the institution-based view: A nonlinear specification with varying coefficients. Int. Bus. Rev. 2019, 28, 415–427. [Google Scholar] [CrossRef]
- Giammanco, M.D.; Gitto, L. Health expenditure and FDI in Europe. Econ. Anal. Policy 2019, 62, 255–267. [Google Scholar] [CrossRef]
- Farla, K.; Crombrugghe, D.; Verspagen, B. Institutions, Foreign Direct Investment, and Domestic Investment: Crowding Out or Crowding In? World Dev. 2016, 88, 1–9. [Google Scholar] [CrossRef] [Green Version]
- Vojtovic, S.; Klimaviciene, A.; Pilinkiene, V. The Linkages between Economic Growth and FDI in CEE Countries. Ekon. Cas. 2019, 67, 264–279. [Google Scholar]
- Gohou, G.; Soumare, I. Does Foreign Direct Investment Reduce Poverty in Africa and are There Regional Differences? World Dev. 2012, 40, 75–95. [Google Scholar] [CrossRef]
- Dincer, O. Does corruption slow down innovation? Evidence from a cointegrated panel of US states. Eur. J. Political Econ. 2019, 56, 1–10. [Google Scholar] [CrossRef]
- Brada, J.C.; Drabek, Z.; Mendez, J.A.; Perez, M.F. National levels of corruption and foreign direct investment. J. Comp. Econ. 2019, 47, 31–49. [Google Scholar] [CrossRef]
- Reiter, S.L.; Steensma, H.K. Human Development and Foreign Direct Investment in Developing Countries The Influence of FDI Policy and Corruption. World Dev. 2010, 38, 1678–1691. [Google Scholar] [CrossRef]
- Chen, D.H.; Yu, X.; Zhang, Z. Foreign direct investment comovement and home country institutions. J. Bus. Res. 2019, 95, 220–231. [Google Scholar] [CrossRef]
- Gossel, S.J. FDI, democracy and corruption in Sub-Saharan Africa. J. Policy Model. 2018, 40, 647–662. [Google Scholar] [CrossRef]
- Barassi, M.R.; Zhou, Y. The effect of corruption on FDI: A parametric and non-parametric analysis. Eur. J. Political Econ. 2012, 28, 302–312. [Google Scholar] [CrossRef] [Green Version]
- Egger, P.; Winner, H. Evidence on corruption as an incentive for foreign direct investment. Eur. J. Political Econ. 2005, 21, 932–952. [Google Scholar] [CrossRef]
- Khamfula, Y. Foreign direct investment and economic growth in EP and IS countries: The role of corruption. World Econ. 2007, 30, 1843–1854. [Google Scholar] [CrossRef]
- Gilmore, A.; O’Donnell, A.; Carson, D.; Cummins, D. Factors influencing foreign direct investment and international joint ventures—A comparative study of Northern Ireland and Bahrain. Int. Mark. Rev. 2003, 20, 195–215. [Google Scholar] [CrossRef]
- Kurul, Z. Nonlinear relationship between institutional factors and FDI flows: Dynamic panel threshold analysis. Int. Rev. Econ. Financ. 2017, 48, 148–160. [Google Scholar] [CrossRef]
- Hunya, G. Recent FDI trends, policies and challenges in SEE countriesin comparison with other regions in transition. In Proceedings of the Foreign Direct Investment in South East Europe: Implementing Best Policy Practices Parkhotel Schönbrunn, Vienna, Austria, 8–9 November 2000. [Google Scholar]
- Damijan, J.P.; Rojec, M. Foreign Direct Investment and Catching Up of New EU Member States: Is There a Flying Geese Pattern? Appl. Econ. Q. 2007, 53, 91–118. [Google Scholar]
- Acaravci, A.; Ozturk, I. Foreign Direct Investment, Export and Economic Growth: Empirical Evidence from New Eu Countries. Rom. J. Econ. Forecast. 2012, 15, 52–67. [Google Scholar]
- Popescu, G.H. FDI and Economic Growth in Central and Eastern Europe. Sustainability (Basel) 2014, 6, 8149–8163. [Google Scholar] [CrossRef] [Green Version]
- Kayalvizhi, P.N.; Thenmozhi, M. Does quality of innovation, culture and governance drive FDI?: Evidence from emerging markets. Emerg. Mark. Rev. 2018, 34, 175–191. [Google Scholar] [CrossRef]
- Asiedu, E.; Lien, D. Capital controls and foreign direct investment. World Dev. 2004, 32, 479–490. [Google Scholar] [CrossRef]
- Fawaz, F.; Rahnama, M.; Valcarcel, V.J. A refinement of the relationship between economic growth and income inequality. Appl. Econ. 2014, 46, 3351–3361. [Google Scholar] [CrossRef]
- Lipsey, R.E. Measuring the Impacts of FDI in Central and Eastern Europe; NBER Working Paper Series; National Bureau of Economic Research: Cambridge, MA, USA, 2006. [Google Scholar]
- Tun, Y.L.; Azman-Saini, W.N.W.; Law, S.H. International Evidence on the link between Foreign Direct Investment and Institutional Quality. Eng. Econ. 2012, 23, 379–386. [Google Scholar] [CrossRef]
- Henderson, V. The urbanization process and economic growth: The so-what question. J. Econ. Growth 2003, 8, 47–71. [Google Scholar] [CrossRef]
- Kottaridi, C.; Louloudi, K.; Karkalakos, S. Human capital, skills and competencies: Varying effects on inward FDI in the EU context. Int. Bus. Rev. 2019, 28, 375–390. [Google Scholar] [CrossRef]
- Krkoska, L. Foreign Direct Investment Financing of Capitalformation in Central and Eastern Europe; European Bank for Reconstruction and Development, Ed.; One Exchange Square: London, UK, 2001. [Google Scholar]
- Paul, A.; Popovici, O.C.; Calin, C.A. The Attractiveness of Cee Countries for Fdi. A Public Policy Approach Using the Topsis Method. Transylv. Rev. Adm. Sci. 2014, 42/E, 156–180. [Google Scholar]
- Nguyen, T.Q.; To, N.K. Threshold Effect in The Relationship Between Foreign Direct Investment and Economic Growth: Evidence from ASEAN Countries. Asia Pac. J. Adv. Bus. Soc. Stud. 2017, 3, 32–45. [Google Scholar]
- Jude, C.; Levieuge, G. Growth Effect of Foreign Direct Investment in Developing Economies: The Role of Institutional Quality. World Econ. 2017, 40, 715–742. [Google Scholar] [CrossRef]
- Freckleton, M.; Wright, A.; Craigwell, R. Economic growth, foreign direct investment and corruption in developed and developing countries. J. Econ. Stud. 2012, 39, 639–652. [Google Scholar] [CrossRef]
- Delgado, M.S.; McCloud, N.; Kumbhakar, S.C. A generalized empirical model of corruption, foreign direct investment, and growth. J. Macroecon. 2014, 42, 298–316. [Google Scholar] [CrossRef]
- Feeny, S.; Iamsiraroj, S.; McGillivray, M. Growth and Foreign Direct Investment in the Pacific Island countries. Econ. Model. 2014, 37, 332–339. [Google Scholar] [CrossRef]
- Awad, A.; Ragab, H. The economic growth and foreign direct investment nexus: Does democracy matter? Evidence from African countries. Thunderbird Int. Bus. Rev. 2018, 60, 565–575. [Google Scholar] [CrossRef]
- Zghidi, N.; Mohamed Sghaier, I.; Abida, Z. Does Economic Freedom Enhance the Impact of Foreign Direct Investment on Economic Growth in North African Countries? A Panel Data Analysis. Afr. Dev. Rev. 2016, 28, 64–74. [Google Scholar] [CrossRef]
- Malikane, C.; Chitambara, P. Foreign Direct Investment, Democracy and Economic Growth in Southern Africa. Afr. Dev. Rev. 2017, 29, 92–102. [Google Scholar] [CrossRef]
- Adams, S.; Opoku, E.E.O. Foreign direct investment, regulations and growth in sub-Saharan Africa. Econ. Anal. Policy 2015, 47, 48–56. [Google Scholar] [CrossRef]
- Iamsiraroj, S. The foreign direct investment–economic growth nexus. Int. Rev. Econ. Financ. 2016, 42, 116–133. [Google Scholar] [CrossRef]
- Estrin, S. Foreign direct investment and employment in transition economies. IZA World Labor 2017. [Google Scholar] [CrossRef] [Green Version]
- Stuart, L. Transforming our World: The 2030 Agenda for Sustainable Development; A/RES/70/1; United Nations Division for Social Policy and Development, Indigenous Peoples: New York, NY, USA, 2017. [Google Scholar]
- Hlavacek, P.; Bal-Domanska, B. Impact of Foreign Direct Investment on Economic Growth in Central and Eastern European Countries. Eng. Econ. 2016, 27, 294–303. [Google Scholar] [CrossRef]
- Yalta, A.Y. Revisiting the FDI-led growth Hypothesis: The case of China. Econ. Model. 2013, 31, 335–343. [Google Scholar] [CrossRef]
- Zhang, K.H. Does foreign direct investment promote economic growth? Evidence from East Asia and Latin America. Contemp. Econ. Policy 2001, 19, 175–185. [Google Scholar] [CrossRef]
- Iamsiraroj, S.; Doucouliagos, H. Does Growth Attract FDI? Economics 2015, 9, 1–35. [Google Scholar] [CrossRef]
- Leitão, N.C.; Rasekhi, S. The impact of foreign direct investment on economic growth: The Portuguese experience. Theor. Appl. Econ. 2013, 20, 51–62. [Google Scholar]
- Mahapatra, R.; Patra, S. Impact of Foreign Direct Investment (FDI) inflow on Gross Domestic Product (GDP) of India—An Empirical study. Int. J. Bus. Manag. Invent. 2014, 3, 12–20. [Google Scholar]
- Saini, A.; Madan, P.; Batra, S.K. Impact of FDI inflow on economic growth of SAARC economies. Int. J. Eng. Bus. Enterp. Appl. 2015, 12, 161–166. [Google Scholar]
- Mahadika, I.N.; Kalayci, S.; Altun, N. Relationship between GDP, Foreign Direct Investment and Export Volume: Evidence from Indonesia. Int. J. Trade Econ. Financ. 2017, 8, 51–54. [Google Scholar] [CrossRef] [Green Version]
- Alshamsi, K.H.; Rasid bin Hussin, M.; Azam, M. The impact of inflation and GDP per capita on foreign direct investment: The case of United Arab Emirates. Invest. Manag. Financ. Innov. 2015, 12, 132–141. [Google Scholar]
- Sunde, T. Foreign direct investment, exports and economic growth: ADRL and causality analysis for South Africa. Res. Int. Bus. Financ. 2017, 41, 434–444. [Google Scholar] [CrossRef]
- Kinuthia, B.K.; Murshed, S.M. FDI determinants: Kenya and Malaysia compared. J. Policy Model. 2015, 37, 388–400. [Google Scholar] [CrossRef]
- Akinlo, A.E. Foreign direct investment and growth in Nigeria—An empirical investigation. J. Policy Model. 2004, 26, 627–639. [Google Scholar] [CrossRef]
- Abdallah, Z.T.; Abdullahi, A. Relationship between Foreign Direct Investment and Per Capita GDPin Nigeria-An Empirical Analysis (1980–2009). Int. J. Bus. Humanit. Technol. 2013, 3, 152–158. [Google Scholar]
- Carbonell, J.B.; Werner, R.A. Does Foreign Direct Investment Generate Economic Growth? A New Empirical Approach Applied to Spain. Econ. Geogr. 2018, 94, 425–456. [Google Scholar] [CrossRef]
- Herzer, D.; Klasen, S.; Nowak-Lehmann, F. In search of FDI-led growth in developing countries: The way forward. Econ. Model. 2008, 25, 793–810. [Google Scholar] [CrossRef]
- Ndiaye, G.; Xu, H. Impact of Foreign Direct Investment (FDI) on Economic Growth in WAEMU from 1990 to 2012. Int. J. Financ. Res. 2016, 7, 33–43. [Google Scholar] [CrossRef]
- Schneider, P.H. International trade, economic growth and intellectual property rights: A panel data study of developed and developing countries. J. Dev. Econ. 2005, 78, 529–547. [Google Scholar] [CrossRef]
- Dutta, N.; Roy, S. Foreign Direct Investment, Financial Development and Political Risks. J. Dev. Areas 2011, 44, 303–327. [Google Scholar] [CrossRef] [Green Version]
- Kottaridi, C.; Stengos, T. Foreign direct investment, human capital and non-linearities in economic growth. J. Macroecon. 2010, 32, 858–871. [Google Scholar] [CrossRef] [Green Version]
- Jyun-Yi, W.; Chih-Chiang, H. Does Foreign Direct Investment Promote Economic Growth?Evidence from a Threshold Regression Analysis. Econ. Bull. 2008, 15, 1–101. [Google Scholar]
- Alvarado, R.; Iñiguez, M.; Ponce, P. Foreign direct investment and economic growth in Latin America. Econ. Anal. Policy 2017, 56, 176–187. [Google Scholar] [CrossRef]
- Mahmoodi, M.; Mahmoodi, E. Foreign direct investment, exports and economic growth: Evidence from two panels of developing countries. Econ. Res. Ekon. Istraz. 2016, 29, 938–949. [Google Scholar] [CrossRef]
- Gui-Diby, S.L. Impact of foreign direct investments on economic growth in Africa: Evidence from three decades of panel data analyses. Res. Econ. 2014, 68, 248–256. [Google Scholar] [CrossRef]
- Omri, A.; kahouli, B. The nexus among foreign investment, domestic capital and economic growth: Empirical evidence from the MENA region. Res. Econ. 2014, 68, 257–263. [Google Scholar] [CrossRef] [Green Version]
- Lee, J.W. The contribution of foreign direct investment to clean energy use, carbon emissions and economic growth. Energ. Policy 2013, 55, 483–489. [Google Scholar] [CrossRef]
- Tekin, R.B. Economic growth, exports and foreign direct investment in Least Developed Countries: A panel Granger causality analysis. Econ. Model. 2012, 29, 868–878. [Google Scholar] [CrossRef]
- Belaşcu, L.; Popovici, O.; Horobeţ, A. Foreign Direct Investments and Economic Growth in Central and Eastern Europe: A Panel-Based Analysis. In Emerging Issues in the Global Economy; Mărginean, S.C., Ogrean, C., Orăștean, R., Eds.; Springer: Berlin, Germany, 2018. [Google Scholar]
- Jones, J.; Serwicka, I.; Wren, C. Economic integration, border costs and FDI location: Evidence from the fifth European Union enlargement. Int. Rev. Econ. Financ. 2018, 54, 193–205. [Google Scholar] [CrossRef]
- Campos, N.F.; Kinoshita, Y. Foreign direct investment as technology transferred: Some panel evidence from the transition economies. Manch. Sch. 2002, 70, 398–419. [Google Scholar] [CrossRef]
- Apergis, N.; Lyroudi, K.; Vamvakidis, A. The relationship between foreign direct investment and economic growth: Evidence from transition countries. Transit. Stud. Rev. 2008, 15, 37–51. [Google Scholar] [CrossRef]
- Yormirzoev, M. Influence of foreign Direct Investment on the Economic growth: The case of transitional economies in Central and Eastern Europe and the Commonwealth of Independent States. Bull. Udmurt Univ. Series Econ. Law 2015, 25, 44–52. [Google Scholar]
- Miteski, M.; Stefanova, D.J. The Impact of Sectorial FDI on Economic Growth in Central, Eastern and Southeastern Europe; National Bank of the Republic of Macedonia: Skopje, Macedonia, 2017. [Google Scholar]
- Mencinger, J. Does foreign direct investment always enhance economic growth? Kyklos 2003, 56, 491–508. [Google Scholar] [CrossRef]
- Bačić, K.; Račić, D.; Ahec-Šonje, A. FDI and Economic Growth in Central and Eastern Europe: Is There a Link? Zagreb School of Economics and Management, Institute of Economics Zagreb: Zagreb, 2004. [Google Scholar]
- Kherfi, S.; Soliman, M. FDI And Economic Growth in CEE And MENA Countries: A Tale of Two Regions. Int. Bus. Econ. Res. J. 2005, 4, 113–120. [Google Scholar] [CrossRef]
- Ferencikova, S.; Dudas, T. The impact of foreign direct investment inflows on the economic growth in the new EU member states from central and eastern Europe. Ekon. Cas. 2005, 53, 261–272. [Google Scholar]
- Curwin, K.D.; Mahutga, M.C. Foreign Direct Investment and Economic Growth: New Evidence from Post-Socialist Transition Countries. Soc. Forces 2014, 92, 1159–1187. [Google Scholar] [CrossRef] [Green Version]
- Saglam, Y. FDI and Economic Growth in European Transition Economies: Panel Data Analysis. J. Yaşar Univ. 2017, 12, 123–135. [Google Scholar]
- Comes, C.A.; Bunduchi, E.; Vasile, V.; Stefan, D. The Impact of Foreign Direct Investments and Remittances on Economic Growth: A Case Study in Central and Eastern Europe. Sustainability (Basel) 2018, 10, 238. [Google Scholar] [CrossRef]
- Simionescu, M. What Drives Economic Growth in Some CEE Countries? Studia Univ. “Vasile Goldis” Arad. Econ. Ser. 2018, 28, 46–56. [Google Scholar] [CrossRef] [Green Version]
- Bayar, Y. Greenfield and Brownfield Investments and Economic Growth: Evidence from Central and Eastern European Union Countries. Naše Gospod. Our Econ. 2017, 63, 19–26. [Google Scholar] [CrossRef] [Green Version]
- Silajdzic, S.; Mehic, E. Absorptive Capabilities, FDI, and Economic Growth in Transition Economies. Emerg. Mark. Financ. Trade 2016, 52, 904–922. [Google Scholar] [CrossRef]
- Silajdzic, S.; Mehic, E. Knowledge spillovers, absorptive capacities and the impact of FDI on economic growth: Empirical evidence from transition economies. Procedia Soc. Behav. Sci. 2015, 195, 614–623. [Google Scholar] [CrossRef]
- Albulescu, C.T. Do Foreign Direct and Portfolio Investments Affect Long-Term Economic Growth in Central and Eastern Europe? Procedia Econ. Financ. 2015, 23, 507–512. [Google Scholar] [CrossRef]
- Pharjiani, S. Foreign Direct Investment on Economic Growth by Industries in Central and Eastern European Countries. Int. J. Econ. Manag. Eng. 2015, 9, 3988–3996. [Google Scholar]
- Sârbu, M.-R.; Carp, L. The Impact of Foreign Direct Investment on Economic Growth: The Case of Romania. Acta Univ. Danub. Œcon. 2015, 11, 127–137. [Google Scholar]
- Nistor, P. FDI and economic growth, the case of Romania. Procedia Econ. Financ. 2014, 15, 577–582. [Google Scholar] [CrossRef]
- Mehic, E.; Silajdzic, S.; Babic-Hodovic, V. The Impact of FDI on Economic Growth: Some Evidence from Southeast Europe. Emerg. Mark. Financ. Trade 2013, 49, 5–20. [Google Scholar] [CrossRef]
- Bailey, N. Exploring the relationship between institutional factors and FDI attractiveness: A meta-analytic review. Int. Bus. Rev. 2018, 27, 139–148. [Google Scholar] [CrossRef]
- Dunning, J.H. The Eclectic Paradigm of International Production—A Restatement and Some Possible Extensions. J. Int. Bus. Stud. 1988, 19, 1–31. [Google Scholar] [CrossRef]
- North, D.C. Institutions, Institutional Change and Economic Performance; Cambridge University Press: Cambridge, UK, 1991. [Google Scholar]
- Mengistu, A.A.; Adhikary, B.K. Does good governance matter for FDI inflows? Evidence from Asian economies. Asia Pac. Bus. Rev. 2011, 17, 281–299. [Google Scholar] [CrossRef]
- Harms, P.; Ursprung, H.W. Do civil and political repression really boost foreign direct investments? Econ. Inq. 2002, 40, 651–663. [Google Scholar] [CrossRef]
- Sabir, S.; Rafique, A.; Abbas, K. Institutions and FDI: Evidence from developed and developing countries. Financ. Innov. 2019, 5, 1–20. [Google Scholar] [CrossRef]
- Xu, T. Economic freedom and bilateral direct investment. Econ. Model. 2019, 78, 172–179. [Google Scholar] [CrossRef]
- Daniele, V.; Marani, U. Organized crime, the quality of local institutions and FDI in Italy: A panel data analysis. Eur. J. Political Econ. 2011, 27, 132–142. [Google Scholar] [CrossRef]
- Akhtaruzzaman, M.; Berg, N.; Hajzler, C. Expropriation risk and FDI in developing countries: Does return of capital dominate return on capital? Eur. J. Political Econ. 2017, 49, 84–107. [Google Scholar] [CrossRef] [Green Version]
- Peres, M.; Ameer, W.; Xu, H.L. The impact of institutional quality on foreign direct investment inflows: Evidence for developed and developing countries. Econ. Res. Ekon. Istraz. 2018, 31, 626–644. [Google Scholar] [CrossRef]
- Zakharov, N. Does corruption hinder investment? Evidence from Russian regions. Eur. J. Political Econ. 2019, 56, 39–61. [Google Scholar] [CrossRef] [Green Version]
- Kato, A.; Sato, T. Greasing the wheels? The effect of corruption in regulated manufacturing sectors of India. Can. J. Dev. Stud. 2015, 36, 459–483. [Google Scholar] [CrossRef]
- Elheddad, M.M. What determines FDI inflow to MENA countries? Empirical study on Gulf countries: Sectoral level analysis. Res. Int. Bus. Financ. 2018, 44, 332–339. [Google Scholar] [CrossRef]
- Meon, P.G.; Sekkat, K. Does corruption grease or sand the wheels of growth? Public Choice 2005, 122, 69–97. [Google Scholar] [CrossRef]
- Cooray, A.; Schneider, F. Does corruption throw sand into or grease the wheels of financial sector development? Public Choice 2018, 177, 111–133. [Google Scholar] [CrossRef] [Green Version]
- Dang, D.A. How foreign direct investment promote institutional quality: Evidence from Vietnam. J. Comp. Econ. 2013, 41, 1054–1072. [Google Scholar] [CrossRef]
- Asamoah, M.E.; Adjasi, C.K.D.; Alhassan, A.L. Macroeconomic uncertainty, foreign direct investment and institutional quality: Evidence from Sub-Saharan Africa. Econ. Syst. 2016, 40, 612–621. [Google Scholar] [CrossRef]
- Kuzmina, O.; Volchkova, N.; Zueva, T. Foreign direct investment and governance quality in Russia. J. Comp. Econ. 2014, 42, 874–891. [Google Scholar] [CrossRef] [Green Version]
- Busse, M.; Hefeker, C. Political risk, institutions and foreign direct investment. Eur. J. Political Econ. 2007, 23, 397–415. [Google Scholar] [CrossRef] [Green Version]
- Wisniewski, T.P.; Pathan, S.K. Political environment and foreign direct investment: Evidence from OECD countries. Eur. J. Political Econ. 2014, 36, 13–23. [Google Scholar] [CrossRef] [Green Version]
- Asiedu, E.; Lien, D. Democracy, foreign direct investment and natural resources. J. Int. Econ. 2011, 84, 99–111. [Google Scholar] [CrossRef] [Green Version]
- Aziz, O.G. Institutional quality and FDI inflows in Arab economies. Financ. Res. Lett. 2018, 25, 111–123. [Google Scholar] [CrossRef]
- Uddin, M.; Chowdhury, A.; Zafar, S.; Shafique, S.; Liu, J. Institutional determinants of inward FDI: Evidence from Pakistan. Int. Bus. Rev. 2019, 28, 344–358. [Google Scholar] [CrossRef]
- Pedroni, P. Critical values for cointegration tests in heterogeneous panels with multiple regressors. Oxf. B Econ. Stat. 1999, 61, 653–670. [Google Scholar] [CrossRef]
- Kao, C. Spurious regression and residual-based tests for cointegration in panel data. J. Econom. 1999, 90, 1–44. [Google Scholar] [CrossRef]
- Maddala, G.S.; Wu, S.W. A comparative study of unit root tests with panel data and a new simple test. Oxf. B Econ. Stat. 1999, 61, 631–652. [Google Scholar] [CrossRef]
- Johansen, S. Estimation and Hypothesis-Testing of Cointegration Vectors in Gaussian Vector Autoregressive Models. Econometrica 1991, 59, 1551–1580. [Google Scholar] [CrossRef]
Figure 1.
The evolution of FDI in CEECs. Source: Authors’ work. Notes: For the definition of variables, please see Table 4.
Figure 1.
The evolution of FDI in CEECs. Source: Authors’ work. Notes: For the definition of variables, please see Table 4.

Figure 2.
Worldwide Governance Indicators (mean values) in CEECs. Source: Authors’ work. Notes: For the definition of variables, please see Table 4.
Figure 2.
Worldwide Governance Indicators (mean values) in CEECs. Source: Authors’ work. Notes: For the definition of variables, please see Table 4.


Table 1.
Earlier studies on FDI and economic growth worldwide.
| Author(s) | Time Span | Database | Empirical Methods | Outcomes |
|---|---|---|---|---|
| Awad and Ragab [42] | 1989–2014 | 53 African nations | Linear dynamic panel data model | Positive effect of FDI on growth |
| Alvarado, et al. [69] | 1980–2014 | 19 Latin American states | Panel data fixed-effects models | FDI does not have a positive influence on growth except high-income countries (Chile and Uruguay) |
| Malikane and Chitambara [44] | 1980–2014 | 8 Southern African states | General Methods of Moments (GMM) | FDI has a direct positive influence on economic growth |
| Iamsiraroj [46] | 1971–2010 | 124 cross-country data | Simultaneous system of equations | Bidirectional relationship between FDI and economic growth |
| Mahmoodi and Mahmoodi [70] | 1986–2013 | 8 European developing nations and 8 Asian developing states | Panel-VECM | Two-way causality between GDP and FDI for the European developing panel |
| Gui-Diby [71] | 1980–2009 | 50 African nations | SYS-GMM | Negative link among FDI inflows and economic growth from 1980–1994 Positive link between FDI influxes and economic growth from 1995–2009 |
| Omri and kahouli [72] | 1990–2010 | 13 Middle East and North Africa states | GMM | Two-way causal relationship between foreign investment and economic growth |
| Feeny, Iamsiraroj and McGillivray [41] | 1971–2010 | 209 states | Ordinary Least Squares and GMM | FDI is related with higher rates of economic growth in the Pacific |
| Lee [73] | 1971–2009 | 19 nations of the G20 | Co-integration tests and fixed-effects models | FDI influxes drive economic growth |
| Freckleton, Wright and Craigwell [39] | 1998–2008 | 42 developing nations and 28 developed states | Panel dynamic ordinary least squares | In both the short-run and the long-run, FDI has a significant impact on economic growth |
| Tekin [74] | 1970–2009 | 18 least developed countries | Panel Granger-causality | FDI Granger-cause GDP in Benin and Togo GDP Granger-cause FDI in Burkina Faso, Gambia, Madagascar, and Malawi |
| Pegkas [1] | 2002–2012 | 18 Eurozone nations | Fully Modified OLS (FMOLS) and Dynamic OLS (DOLS) methods | FDI positively influence economic growth |
| Mahembe and Odhiambo [7] | 1980–2012 | Southern African Development Community (SADC) nations | Granger-causality | One-way causal flow from GDP to FDI in the middle-income states Lack of causality in low-income nations |
| Vojtovic, Klimaviciene and Pilinkiene [12] | 1997–2014 | 11 Central and Eastern Europe (CEE) countries | Granger-causality and Vector autoregression (VAR) | FDI Granger-causes GDP |
Source: Authors’ work based on existing literature.
Table 2.
Earlier studies on FDI and economic growth in CEECs.
| Author(s) | Time Span | Database | Empirical Methods | Outcomes |
|---|---|---|---|---|
| Vojtovic, Klimaviciene and Pilinkiene [12] | 1997–2014 | 11 CEECs | Granger-causality and VAR | FDI Granger-causes GDP |
| Comes, et al. [87] | 2010–2016 | 7 CEECs | The method of least squares and the method of least squares with dummy variables | Positive influence of FDI on economic growth |
| Simionescu [88] | 2003–2016 | 8 CEECs | Bayesian bridge regressions | FDI was the most significant driver of economic growth |
| Belaşcu, Popovici and Horobeţ [75] | 1999–2013 | 5 CEE countries | Panel least squares regression | FDI have a positive influence on economic growth |
| Bayar [89] | 2003–2015 | 11 CEECs | Panel causality test | Greenfield and brownfield investments positively impact economic growth, but the effect of greenfield investments was higher |
| Silajdzic and Mehic [90] | 2000–2011 | 10 Central and East European countries | OLS and Granger-causality test | FDI positively influence economic growth |
| Silajdzic and Mehic [91] | 2000–2013 | 10 Central and East European countries | OLS with panel-corrected standard errors - PCSE (fixed-effect) | FDI contribute to economic growth |
| Albulescu [92] | 2005–2012 | 13 CEECs | System-GMM | Direct and portfolio investments impact long-term economic growth |
| Pharjiani [93] | 1995–2012 | 10 CEECs | Ordinary least squares, random effects, fixed effects, first differences estimation | Positive link between FDI and economic growth |
| Sârbu and Carp [94] | 2000–2013 | Romania | OLS and Johansen co-integration | FDI positively influence economic growth |
| Nistor [95] | 1990–2012 | Romania | OLS | FDI inflows positively influence GDP |
| Mehic, et al. [96] | 1998–2007 | Seven southeast European nations | Prais–Winsten regression with panel-corrected standard errors | Positive and statistically significant impact of FDI on economic growth |
| Acaravci and Ozturk [26] | 1994–2008 | 10 transition European countries | ARDL bounds testing approach and the error-correction-based Granger-causality | Causal association amid FDI, export, and economic growth in four states |
Source: Authors’ work based on existing literature.
Table 3.
Earlier studies on FDI and institutional quality.
| Author(s) | Time Span | Database | Empirical Methods | Outcomes |
|---|---|---|---|---|
| Brada, Drabek, Mendez and Perez [15] | 2005–2009 | 43 home countries and 151 host countries | Poisson pseudo maximum-likelihood (PPML) estimation | Fewer FDI in corrupt nations |
| Dang [112] | 2006–2007 | 60 provinces in Vietnam | Instrumental variable (IV) approach | FDI supports the enhancement of institutions |
| Asamoah, et al. [113] | 1996–2011 | 40 Sub-Saharan African states | GARCH models | Institutional quality rises the stream of FDI |
| Buchanan, Le and Rishi [2] | 1996–2006 | 164 nations | OLS regressions | Positive influence of institutional quality on FDI Institutional quality negatively influences the volatility of FDI |
| Kuzmina, et al. [114] | 1895–1914 | Russia | OLS and IV-2SLS regressions | Greater incidence of illicit payments, alongside burden from governing organizations, enforcement authorities, and criminals diminish FDI |
| Busse and Hefeker [115] | 1984–2003 | 83 developing countries | Panel data fixed-effects and GMM regressions | Government stability, internal and external conflict, corruption and ethnic strains, regulation and order, democratic accountability of government, and quality of bureaucracy are drivers of foreign investment inflows |
| Zakharov [107] | 2004–2013 | 79 Russian regions | Panel data fixed-effects and IV estimation with fixed-effects | Negative association between corruption and the influx of FDI |
| Adams and Opoku [45] | 1980–2011 | 22 sub-Saharan African states | GMM | Regulation–FDI connections positively influence economic growth |
| Wisniewski and Pathan [116] | 1975–2009 | 33 OECD members | Pooled OLS, Fixed-effect panel, Two-way fixed-effect panel | Higher FDI are held by states with presidential systems and long democratic tradition |
| Asiedu and Lien [117] | 1982–2007 | 112 developing countries | GMM | Democracy supports FDI in nations where the portion of natural resources in total exports is reduced, but has a negative influence on FDI in nations where exports are dominated by natural resources |
| Aziz [118] | 1984–2012 | 16 Arab countries | GMM | Institutional quality measures of economic freedom, ease of doing business and international country risk positively influence FDI influxes |
| Egger and Winner [20] | 1995–1999 | 73 developed and less developed nations | Fixed effects, Hausman–Taylor, and between regressions | Corruption is an incentive for FDI |
| Delgado, McCloud and Kumbhakar [40] | 1985–2002 | 60 non-OECD countries | OLS, 2SLS, semiparametric smooth coefficient, nonparametric method of moments models | A 1-point rise in the level of corruption determines a decline of FDI returns between 0.07 and 5.91% |
| Jude and Levieuge [38] | 1984–2009 | 93 developing countries | Panel smooth regression model | FDI positively influence growth beyond a certain threshold of institutional quality |
| Zghidi, Mohamed Sghaier and Abida [43] | 1980–2013 | 4 North African countries | System GMM | The outcome of FDI is more prominent when the economic freedom measure occurs |
| Economou [4] | 1996–2017 | 4 South European states | Random-effects panel data estimations and generalized two-stage least squares (G2SLS) random-effects instrumental variable (IV) regression | Positive influence on FDI related to protection of property rights, government integrity, monetary freedom, and financial freedom |
| Tintin [5] | 1996–2009 | 6 Central and Eastern European nations | Panel data fixed-effects models | Better institutions entice more FDI influxes |
| Uddin, et al. [119] | 1972–2016 | Pakistan | Multivariate OLS regression and VAR system | Democracy rises the inward FDI in the short-run, while a military government has a stronger effect on FDI in the long run |
Source: Authors’ work based on existing literature.
Table 4.
Description of the variables.
| Variables | Definitions | Source | Data Availability |
|---|---|---|---|
| Variables concerning sustainable economic growth | |||
| (1) GROWTH | Gross domestic product per capita (current prices, euro per capita) (log values) | Eurostat (nama_10_pc) | 1975–2016 |
| Variables concerning foreign direct investment | |||
| (2) FDI | Foreign direct investment, net inflows (% of GDP) | World Bank (BX.KLT.DINV.WD.GD.ZS) | 1970–2018 |
| Variables concerning poverty | |||
| (3) POV | Individuals at risk of poverty or social exclusion (percentage) | Eurostat (ilc_peps01) | 2003–2016 |
| Variables concerning the inequality of income distribution | |||
| (4) INEQ | Income quintile share ratio as the ratio of total income received by the 20% of the population with the highest income—top quintile) to that received by the 20% of the population with the lowest income—lowest quintile (percentage) | Eurostat (ilc_di11) | 1995–2016 |
| Variables concerning education | |||
| (5) EDU | Pupils and students as the total number of persons who are enrolled in the regular education system in each country. It covers all levels of education from primary education to postgraduate studies, excluding pre-primary education (log values) | Eurostat (educ_ilev) | 1998–2012 |
| Variables towards innovation | |||
| (6) INNOV | The number of patent applications to the European patent office (log values) | Eurostat (pat_ep_ntot) | 1978–2014 |
| Variables concerning transport infrastructure | |||
| (7) TRANSP | The length of motorways, on the territory of the reporting country (km) (logarithmic values) | Eurostat (ttr00002) | 1970–2015 |
| Variables concerning information technology | |||
| (8) IT | Individuals using the Internet (% of population) | World Bank (IT.NET.USER.ZS) | 1960–2017 |
| Variables concerning institutional quality | |||
| (9) CORR | Control of Corruption Estimate captures perceptions of the extent to which public power is exercised for private gain, including both petty and grand forms of corruption, as well as “capture” of the state by elites and private interests (score) | World Bank (Worldwide Governance Indicators) | 1996–2016 |
| (10) GOV_EFF | Government Effectiveness Estimate captures perceptions of the quality of public services, the quality of the civil service and the degree of its independence from political pressures, the quality of policy formulation and implementation, and the credibility of the government’s commitment to such policies (score) | World Bank (Worldwide Governance Indicators) | 1996–2016 |
| (11) POL_STAB | Political Stability and Absence of Violence/Terrorism Estimate measures perceptions of the likelihood of political instability and/or politically motivated violence, including terrorism (score) | World Bank (Worldwide Governance Indicators) | 1996–2016 |
| (12) REG_Q | Regulatory Quality Estimate captures perceptions of the ability of the government to formulate and implement sound policies and regulations that permit and promote private-sector development (score) | World Bank (Worldwide Governance Indicators) | 1996–2016 |
| (13) RULE_LAW | Rule of Law Estimate captures perceptions of the extent to which agents have confidence in and abide by the rules of society, and in particular the quality of contract enforcement, property rights, the police, and the courts, as well as the likelihood of crime and violence (score) | World Bank (Worldwide Governance Indicators) | 1996–2016 |
| (14) VOICE_ACC | Voice and Accountability Estimate captures perceptions of the extent to which a country’s citizens can participate in selecting their government, as well as freedom of expression, freedom of association, and a free media (score) | World Bank (Worldwide Governance Indicators) | 1996–2016 |
| Country-level control variables | |||
| (15) GOV_EXP | General government final consumption expenditure (% of GDP) | World Bank (NE.CON.GOVT.ZS) | 1960–2018 |
| (16) URB | Urban population (percentage of total) | World Bank (SP.URB.TOTL.IN.ZS) | 1960–2016 |
| (17) DCPS | Domestic credit to private sector (percentage of GDP) | World Bank (FS.AST.PRVT.GD.ZS) | 1960–2016 |
| (18) TRADE | Trade is the sum of exports and imports of goods and services measured as a share of gross domestic product (percentage of GDP) | World Bank (NE.TRD.GNFS.ZS) | 1960–2016 |
Source: Authors’ work based on Eurostat and World Bank descriptions.
Table 5.
Descriptive statistics (raw data).
| Variables | Obs. | Mean | Std. Dev. | Min | Max |
|---|---|---|---|---|---|
| (1) GROWTH | 230 | 8310.43 | 4407.87 | 1000.00 | 19600.00 |
| (2) FDI | 209 | 5.39 | 7.07 | −15.99 | 54.84 |
| (3) POV | 125 | 29.39 | 10.22 | 13.30 | 61.30 |
| (4) INEQ | 146 | 5.06 | 1.39 | 3.00 | 8.30 |
| (5) EDU | 160 | 1950.91 | 2353.90 | 237.60 | 9153.10 |
| (6) INNOV | 250 | 58.55 | 86.03 | 0.50 | 609.16 |
| (7) TRANSP | 280 | 422.50 | 364.20 | 0.00 | 1883.90 |
| (8) IT | 263 | 35.55 | 28.75 | 0.00 | 87.24 |
| (9) CORR | 165 | 0.36 | 0.39 | −0.44 | 1.30 |
| (10) GOV_EFF | 165 | 0.64 | 0.39 | −0.36 | 1.19 |
| (11) POL_STAB | 165 | 0.69 | 0.31 | 0.00 | 1.30 |
| (12) REG_Q | 165 | 0.90 | 0.31 | −0.04 | 1.70 |
| (13) RULE_LAW | 165 | 0.60 | 0.41 | −0.26 | 1.37 |
| (14) VOICE_ACC | 165 | 0.83 | 0.25 | 0.30 | 1.20 |
| (15) GOV_EXP | 209 | 18.92 | 1.95 | 12.37 | 25.88 |
| (16) URB | 297 | 62.93 | 7.59 | 49.63 | 75.22 |
| (17) DCPS | 256 | 42.77 | 20.57 | 0.19 | 101.29 |
| (18) TRADE | 271 | 105.27 | 34.63 | 39.14 | 184.55 |
Source: Authors’ computations. Notes: For the definition of variables, please see Table 4.
Table 6.
Correlation matrix.
| Variables | (1) | (2) | (3) | (4) | (5) | (6) | (7) | (8) | (9) |
| (1) GROWTH | 1 | ||||||||
| (2) FDI | −0.11 | 1 | |||||||
| (3) POV | −0.89*** | 0.13 | 1 | ||||||
| (4) INEQ | −0.33*** | −0.02 | 0.74*** | 1 | |||||
| (5) EDU | −0.23** | −0.03 | 0.23* | −0.08 | 1 | ||||
| (6) INNOV | 0.64*** | −0.04 | −0.41*** | −0.50*** | 0.40*** | 1 | |||
| (7) TRANSP | 0.23*** | 0.01 | −0.23* | −0.46*** | 0.37*** | 0.46*** | 1 | ||
| (8) IT | 0.83*** | −0.04 | −0.62*** | 0.02 | −0.27*** | 0.52*** | 0.09 | 1 | |
| (9) CORR | 0.61*** | −0.01 | −0.62*** | −0.32*** | −0.45*** | 0.27** | −0.02 | 0.40*** | 1 |
| (10) GOV_EFF | 0.72*** | −0.09 | −0.78*** | −0.49*** | −0.50*** | 0.24** | −0.05 | 0.53*** | 0.80*** |
| (11) POL_STAB | 0.55*** | -0.08 | −0.76*** | −0.73*** | −0.19* | 0.35*** | 0.18* | 0.23** | 0.57*** |
| (12) REG_Q | 0.42*** | 0.06 | −0.44*** | −0.11 | −0.32*** | 0.13 | −0.21* | 0.42*** | 0.68*** |
| (13) RULE_LAW | 0.72*** | −0.03 | −0.73*** | −0.38*** | −0.37*** | 0.35*** | −0.12 | 0.56*** | 0.86*** |
| (14) VOICE_ACC | 0.53*** | −0.05 | −0.70*** | −0.46*** | −0.20* | 0.35*** | −0.01 | 0.32*** | 0.84*** |
| (15) GOV_EXP | −0.06 | 0.06 | −0.50*** | −0.56*** | −0.16* | −0.01 | 0.05 | −0.16* | 0.33*** |
| (16) URB | −0.23*** | 0.24*** | 0.18* | 0.22** | −0.08 | −0.02 | −0.21*** | 0.06 | −0.03 |
| (17) DCPS | 0.60*** | 0.03 | −0.09 | 0.13 | −0.47*** | 0.26*** | 0.03 | 0.64*** | 0.34*** |
| (18) TRADE | 0.51*** | 0.14* | −0.48*** | −0.34*** | −0.46*** | 0.29*** | 0.1 | 0.67*** | 0.40*** |
| Variables | (10) | (11) | (12) | (13) | (14) | (15) | (16) | (17) | (18) |
| (10) GOV_EFF | 1 | ||||||||
| (11) POL_STAB | 0.74*** | 1 | |||||||
| (12) REG_Q | 0.70*** | 0.46*** | 1 | ||||||
| (13) RULE_LAW | 0.87*** | 0.65*** | 0.80*** | 1 | |||||
| (14) VOICE_ACC | 0.82*** | 0.73*** | 0.79*** | 0.88*** | 1 | ||||
| (15) GOV_EXP | 0.52*** | 0.51*** | 0.32*** | 0.41*** | 0.44*** | 1 | |||
| (16) URB | 0.12 | −0.09 | 0.44*** | 0.17* | 0.08 | 0.24*** | 1 | ||
| (17) DCPS | 0.34*** | 0.02 | 0.22** | 0.33*** | 0.14† | −0.06 | 0.12† | 1 | |
| (18) TRADE | 0.57*** | 0.42*** | 0.52*** | 0.53*** | 0.45*** | 0.11† | 0.18** | 0.42*** | 1 |
Source: Authors’ computations. Notes: Superscripts ***, **, *, and † indicate statistical significance at 0.1%, 1%, 5%, and 10% respectively. For the definition of variables, please see Table 4.
Table 7.
The outcomes of panel data regression models towards the influence of FDI, poverty, and income inequality on economic growth.
Table 7.
The outcomes of panel data regression models towards the influence of FDI, poverty, and income inequality on economic growth.
| Variables | (1) | (2) | (3) | (4) | ||||
|---|---|---|---|---|---|---|---|---|
| FE | RE | FE | RE | FE | RE | FE | RE | |
| FDI | −0.00† | −0.00† | −0.01* | −0.01** | −0.00 | −0.00 | −0.01* | −0.01* |
| (−1.78) | (−1.90) | (−2.08) | (−3.26) | (−0.81) | (−0.89) | (−2.07) | (−2.21) | |
| FDI_SQ | 0.00 | 0.00** | 0.00† | 0.00* | ||||
| (1.50) | (2.60) | (1.90) | (2.02) | |||||
| INEQ | 0.07** | 0.06** | 0.08** | 0.07** | ||||
| (2.88) | (2.68) | (3.21) | (2.98) | |||||
| POV | −0.02*** | −0.02*** | −0.02*** | −0.03*** | ||||
| (−10.28) | (−10.83) | (−9.82) | (−15.82) | |||||
| GOV_EXP | 0.02 | 0.01 | 0.01 | 0.00 | −0.01 | −0.01 | −0.01 | −0.01 |
| (1.57) | (1.22) | (1.25) | (0.22) | (−0.36) | (−0.39) | (−0.77) | (−0.66) | |
| URB | −0.02† | −0.01* | −0.03* | −0.01** | −0.01 | −0.02* | −0.01 | −0.02* |
| (−1.76) | (−2.52) | (−2.03) | (−3.12) | (−0.34) | (−2.00) | (−0.91) | (−2.03) | |
| DCPS | 0.00 | 0.00 | 0.00 | 0.00*** | 0.01*** | 0.01*** | 0.01*** | 0.01*** |
| (0.68) | (1.26) | (0.65) | (3.91) | (9.00) | (8.95) | (9.05) | (9.08) | |
| TRADE | 0.01*** | 0.01*** | 0.01*** | 0.00** | 0.01*** | 0.01*** | 0.01*** | 0.01*** |
| (8.53) | (7.83) | (8.04) | (3.06) | (9.19) | (9.88) | (8.26) | (9.10) | |
| _cons | 10.31*** | 9.80*** | 10.63*** | 10.03*** | 7.57*** | 8.36*** | 8.37*** | 8.58*** |
| (10.77) | (26.05) | (10.90) | (50.77) | (6.88) | (13.36) | (7.17) | (12.77) | |
| F statistic | 49.64*** | 43.37*** | 64.39*** | 56.87*** | ||||
| R-sq. within | 0.74 | 0.73 | 0.74 | 0.60 | 0.76 | 0.75 | 0.76 | 0.76 |
| Hausman test Prob>chi2 | 0.0266 | 0.0000 | 0.0186 | 0.0945 | ||||
| Obs. | 123.00 | 123.00 | 123.00 | 123.00 | 142.00 | 142.00 | 142.00 | 142.00 |
| N Countries | 11.00 | 11.00 | 11.00 | 11.00 | 11.00 | 11.00 | 11.00 | 11.00 |
Source: Authors’ computations. Notes: Superscripts ***, **, *, and † indicate statistical significance at 0.1%, 1%, 5%, and 10% respectively. Figures in brackets show t-statistic. FE denotes fixed-effects (within) regression. RE denotes Random-effects Generalized Least Squares (GLS) regression. For the definition of variables, please see Table 4.
Table 8.
The outcomes of panel data regression models towards the influence of FDI, education, and innovation on economic growth.
Table 8.
The outcomes of panel data regression models towards the influence of FDI, education, and innovation on economic growth.
| Variables | (1) | (2) | (3) | (4) | ||||
|---|---|---|---|---|---|---|---|---|
| FE | RE | FE | RE | FE | RE | FE | RE | |
| FDI | −0.00 | −0.00 | −0.00 | −0.00 | 0.00 | −0.00 | 0.00 | −0.00 |
| (−0.16) | (−0.71) | (−0.51) | (−0.68) | (0.23) | (−0.19) | (0.07) | (−0.30) | |
| FDI_SQ | 0.00 | 0.00 | 0.00 | 0.00 | ||||
| (0.50) | (0.41) | (0.04) | (0.27) | |||||
| EDU | −0.77* | 0.03 | −0.78* | 0.02 | ||||
| (−2.15) | (0.35) | (−2.16) | (0.16) | |||||
| INNOV | 0.23*** | 0.21*** | 0.23*** | 0.21*** | ||||
| (7.13) | (7.65) | (7.08) | (7.51) | |||||
| GOV_EXP | −0.04** | −0.03* | −0.04** | −0.04** | −0.02† | −0.02† | −0.02† | −0.02* |
| (−3.03) | (−2.51) | (−3.06) | (−2.61) | (−1.91) | (−1.92) | (−1.89) | (−1.99) | |
| URB | −0.03 | −0.02* | −0.03 | −0.02* | 0.01 | −0.01 | 0.01 | −0.01 |
| (−1.38) | (−2.12) | (−1.45) | (−2.03) | (0.80) | (−1.37) | (0.78) | (−1.13) | |
| DCPS | 0.01*** | 0.01*** | 0.01*** | 0.01*** | 0.01*** | 0.01*** | 0.01*** | 0.01*** |
| (7.53) | (10.25) | (7.47) | (10.14) | (8.06) | (9.15) | (8.03) | (9.03) | |
| TRADE | 0.01*** | 0.01*** | 0.01*** | 0.01*** | 0.01*** | 0.01*** | 0.01*** | 0.01*** |
| (6.80) | (8.60) | (6.62) | (8.42) | (6.28) | (7.04) | (6.21) | (6.86) | |
| _cons | 15.49*** | 9.15*** | 15.73*** | 9.36*** | 6.71*** | 8.07*** | 6.72*** | 8.03*** |
| (5.34) | (9.09) | (5.34) | (8.48) | (6.64) | (15.87) | (6.47) | (14.63) | |
| F statistic | 73.42*** | 62.62*** | 131.10*** | 111.67*** | ||||
| R-sq. within | 0.76 | 0.75 | 0.76 | 0.75 | 0.83 | 0.83 | 0.83 | 0.83 |
| Hausman test Prob>chi2 | 0.0142 | 0.0521 | 0.0100 | 0.0472 | ||||
| Obs. | 154.00 | 154.00 | 154.00 | 154.00 | 177.00 | 177.00 | 177.00 | 177.00 |
| N Countries | 11.00 | 11.00 | 11.00 | 11.00 | 11.00 | 11.00 | 11.00 | 11.00 |
Source: Authors’ computations. Notes: Superscripts ***, **, *, and † indicate statistical significance at 0.1%, 1%, 5%, and 10% respectively. Figures in brackets show t-statistic. FE denotes fixed-effects (within) regression. RE denotes Random-effects Generalized Least Squares (GLS) regression. For the definition of variables, please see Table 4.
Table 9.
The outcomes of panel data regression models towards the influence of FDI, transport infrastructure, and information technology on economic growth.
Table 9.
The outcomes of panel data regression models towards the influence of FDI, transport infrastructure, and information technology on economic growth.
| Variables | (1) | (2) | (3) | (4) | ||||
|---|---|---|---|---|---|---|---|---|
| FE | RE | FE | RE | FE | RE | FE | RE | |
| FDI | −0.00 | −0.00 | −0.00 | −0.01 | −0.00 | −0.00 | −0.00 | 0.00 |
| (−0.82) | (−1.22) | (−0.70) | (−1.13) | (−0.01) | (−0.08) | (−0.00) | (0.14) | |
| FDI_SQ | 0.00 | 0.00 | −0.00 | −0.00 | ||||
| (0.35) | (0.59) | (−0.00) | (−0.19) | |||||
| TRANSP | 0.29*** | 0.12*** | 0.29*** | 0.12*** | ||||
| (5.45) | (3.60) | (5.34) | (3.40) | |||||
| IT | 0.01*** | 0.01*** | 0.01*** | 0.01*** | ||||
| (16.14) | (15.96) | (15.91) | (15.84) | |||||
| GOV_EXP | −0.06*** | −0.05*** | −0.06*** | −0.05*** | −0.05*** | −0.04*** | −0.05*** | −0.04*** |
| (−5.09) | (−4.05) | (−5.08) | (−4.03) | (−5.97) | (−5.44) | (−5.90) | (−5.51) | |
| URB | −0.06*** | −0.02* | −0.06*** | −0.02* | −0.03** | −0.02** | −0.03** | −0.02** |
| (−3.74) | (−2.33) | (−3.74) | (−2.34) | (−3.32) | (−3.14) | (−3.21) | (−3.07) | |
| DCPS | 0.01*** | 0.01*** | 0.01*** | 0.01*** | 0.00*** | 0.00*** | 0.00*** | 0.00*** |
| (9.46) | (10.43) | (9.43) | (10.40) | (3.82) | (3.97) | (3.80) | (3.92) | |
| TRADE | 0.01*** | 0.01*** | 0.01*** | 0.01*** | −0.00 | 0.00 | −0.00 | 0.00 |
| (9.07) | (10.64) | (8.88) | (10.39) | (−0.02) | (0.46) | (−0.01) | (0.38) | |
| _cons | 10.70*** | 9.00*** | 10.76*** | 9.04*** | 10.95*** | 10.35*** | 10.95*** | 10.42*** |
| (11.21) | (13.85) | (11.05) | (14.00) | (17.83) | (20.86) | (17.04) | (19.60) | |
| F statistic | 123.35*** | 105.21*** | 306.61*** | 261.38*** | ||||
| R-sq. within | 0.81 | 0.80 | 0.81 | 0.80 | 0.91 | 0.91 | 0.91 | 0.91 |
| Hausman test Prob>chi2 | 0.0006 | 0.0011 | 0.1073 | 0.2950 | ||||
| Obs. | 189.00 | 189.00 | 189.00 | 189.00 | 201.00 | 201.00 | 201.00 | 201.00 |
| N Countries | 11.00 | 11.00 | 11.00 | 11.00 | 11.00 | 11.00 | 11.00 | 11.00 |
Source: Authors’ computations. Notes: Superscripts ***, **, *, and † indicate statistical significance at 0.1%, 1%, 5%, and 10% respectively. Figures in brackets show t-statistic. FE denotes fixed-effects (within) regression. RE denotes Random-effects Generalized Least Squares (GLS) regression. For the definition of variables, please see Table 4.
Table 10.
The outcomes of panel data regression models towards the influence of FDI, control of corruption, government effectiveness, political stability and absence of violence/terrorism on economic growth.
Table 10.
The outcomes of panel data regression models towards the influence of FDI, control of corruption, government effectiveness, political stability and absence of violence/terrorism on economic growth.
| Variables | (1) | (2) | (3) | (4) | (5) | (6) | ||||||
|---|---|---|---|---|---|---|---|---|---|---|---|---|
| FE | RE | FE | RE | FE | RE | FE | RE | FE | RE | FE | RE | |
| FDI | −0.00 | −0.00† | −0.01* | −0.01** | −0.00 | −0.00 | −0.01† | −0.01** | −0.00 | −0.00† | −0.01* | −0.01* |
| (−1.49) | (−1.83) | (−2.24) | (−3.04) | (−0.76) | (−1.14) | (−1.84) | (−2.70) | (−1.65) | (−1.73) | (−2.21) | (−2.42) | |
| FDI_SQ | 0.00† | 0.00* | 0.00† | 0.00* | 0.00† | 0.00† | ||||||
| (1.78) | (2.50) | (1.67) | (2.45) | (1.68) | (1.86) | |||||||
| CORR | 0.48*** | 0.38*** | 0.48*** | 0.40*** | ||||||||
| (4.56) | (4.40) | (4.59) | (4.69) | |||||||||
| GOV_EFF | 0.54*** | 0.48*** | 0.54*** | 0.50*** | ||||||||
| (4.55) | (5.00) | (4.53) | (5.12) | |||||||||
| POL_STAB | −0.02 | 0.11 | −0.03 | 0.09 | ||||||||
| (−0.22) | (1.20) | (−0.29) | (0.98) | |||||||||
| GOV_EXP | −0.03* | −0.04** | −0.04** | −0.04** | −0.03* | −0.04** | −0.04* | −0.05*** | −0.04** | −0.03* | −0.05** | −0.04** |
| (−2.42) | (−2.70) | (−2.73) | (−3.16) | (−2.21) | (−3.25) | (−2.51) | (−3.56) | (−2.72) | (−2.23) | (−3.01) | (−2.58) | |
| URB | 0.03 | −0.01† | 0.02 | −0.01 | 0.02 | −0.01† | 0.02 | −0.01 | −0.00 | −0.01† | −0.01 | −0.01† |
| (1.64) | (−1.83) | (1.18) | (−1.61) | (1.39) | (−1.85) | (0.94) | (−1.63) | (−0.28) | (−1.94) | (−0.70) | (−1.80) | |
| DCPS | 0.01*** | 0.01*** | 0.01*** | 0.01*** | 0.01*** | 0.01*** | 0.01*** | 0.01*** | 0.01*** | 0.01*** | 0.01*** | 0.01*** |
| (9.10) | (8.36) | (9.17) | (8.64) | (8.64) | (8.54) | (8.70) | (8.74) | (8.56) | (8.36) | (8.61) | (8.50) | |
| TRADE | 0.01*** | 0.01*** | 0.01*** | 0.01*** | 0.01*** | 0.01*** | 0.01*** | 0.01*** | 0.01*** | 0.01*** | 0.01*** | 0.01*** |
| (8.44) | (8.57) | (7.65) | (7.77) | (7.94) | (7.58) | (7.20) | (6.89) | (7.83) | (8.94) | (7.07) | (8.19) | |
| _cons | 6.46*** | 8.95*** | 7.08*** | 9.09*** | 6.60*** | 9.06*** | 7.20*** | 9.17*** | 8.76*** | 8.95*** | 9.41*** | 9.15*** |
| (5.48) | (20.46) | (5.80) | (19.59) | (5.64) | (18.82) | (5.92) | (17.44) | (7.27) | (17.86) | (7.47) | (16.62) | |
| F statistic | 62.17*** | 54.54*** | 62.11*** | 54.30*** | 51.42*** | 45.02*** | ||||||
| R-sq. within | 0.72 | 0.71 | 0.72 | 0.72 | 0.72 | 0.71 | 0.72 | 0.72 | 0.68 | 0.67 | 0.68 | 0.68 |
| Hausman test Prob>chi2 | 0.0000 | 0.0004 | 0.0008 | 0.0121 | 0.0001 | 0.0015 | ||||||
| Obs. | 163.00 | 163.00 | 163.00 | 163.00 | 163.00 | 163.00 | 163.00 | 163.00 | 163.00 | 163.00 | 163.00 | 163.00 |
| N Countries | 11.00 | 11.00 | 11.00 | 11.00 | 11.00 | 11.00 | 11.00 | 11.00 | 11.00 | 11.00 | 11.00 | 11.00 |
Source: Authors’ computations. Notes: Superscripts ***, **, *, and † indicate statistical significance at 0.1%, 1%, 5%, and 10% respectively. Figures in brackets show t-statistic. FE denotes fixed-effects (within) regression. RE denotes Random-effects Generalized Least Squares (GLS) regression. For the definition of variables, please see Table 4.
Table 11.
The outcomes of panel data regression models towards the influence of FDI, regulatory quality, rule of law, voice, and accountability on economic growth.
Table 11.
The outcomes of panel data regression models towards the influence of FDI, regulatory quality, rule of law, voice, and accountability on economic growth.
| Variables | 1 | 2 | 3 | 4 | 5 | 6 | ||||||
|---|---|---|---|---|---|---|---|---|---|---|---|---|
| FE | RE | FE | RE | FE | RE | FE | RE | FE | RE | FE | RE | |
| FDI | −0.00 | −0.00 | −0.01† | −0.01** | −0.00† | −0.00† | −0.01† | −0.01** | −0.00 | −0.00† | −0.01* | −0.01** |
| (−1.24) | (−1.62) | (−1.68) | (−2.79) | (−1.68) | (−1.91) | (−1.96) | (−3.18) | (−1.38) | (−1.70) | (−2.21) | (−2.91) | |
| FDI_SQ | 0.00 | 0.00* | 0.00 | 0.00** | 0.00† | 0.00* | ||||||
| (1.29) | (2.32) | (1.39) | (2.59) | (1.79) | (2.41) | |||||||
| REG_Q | 0.88*** | 0.65*** | 0.87*** | 0.68*** | ||||||||
| (8.86) | (6.89) | (8.73) | (7.30) | |||||||||
| RULE_LAW | 0.87*** | 0.67*** | 0.86*** | 0.67*** | ||||||||
| (8.22) | (7.89) | (8.12) | (8.22) | |||||||||
| VOICE_ACC | 0.62** | 0.38** | 0.63** | 0.44** | ||||||||
| (3.08) | (2.73) | (3.14) | (3.07) | |||||||||
| GOV_EXP | −0.02 | −0.04** | −0.02† | −0.04** | −0.04** | −0.05*** | −0.04** | −0.05*** | −0.03* | −0.04** | −0.04** | −0.05*** |
| (−1.45) | (−3.02) | (−1.69) | (−3.27) | (−3.09) | (−4.12) | (−3.31) | (−4.33) | (−2.31) | (−2.87) | (−2.62) | (−3.33) | |
| URB | 0.03* | −0.02* | 0.03† | −0.02* | 0.04** | −0.01* | 0.03* | −0.01** | 0.04† | −0.01 | 0.03 | −0.01 |
| (2.26) | (−2.21) | (1.83) | (−1.98) | (2.62) | (−2.52) | (2.17) | (−2.86) | (1.83) | (−1.49) | (1.49) | (−1.21) | |
| DCPS | 0.01*** | 0.01*** | 0.01*** | 0.01*** | 0.01*** | 0.01*** | 0.01*** | 0.01*** | 0.01*** | 0.01*** | 0.01*** | 0.01*** |
| (8.10) | (8.38) | (8.15) | (8.49) | (6.37) | (7.07) | (6.43) | (7.12) | (8.46) | (8.47) | (8.52) | (8.65) | |
| TRADE | 0.01*** | 0.01*** | 0.01*** | 0.01*** | 0.01*** | 0.01*** | 0.01*** | 0.01*** | 0.01*** | 0.01*** | 0.01*** | 0.01*** |
| (11.92) | (10.55) | (11.03) | (9.95) | (7.65) | (7.16) | (7.03) | (6.39) | (8.75) | (9.03) | (8.02) | (8.23) | |
| _cons | 5.15*** | 8.74*** | 5.59*** | 8.79*** | 5.89*** | 9.40*** | 6.36*** | 9.59*** | 5.35*** | 8.73*** | 5.95*** | 8.82*** |
| (5.11) | (16.37) | (5.27) | (15.23) | (5.84) | (23.20) | (6.00) | (24.78) | (3.45) | (16.67) | (3.78) | (15.41) | |
| F statistic | 92.07*** | 79.51*** | 86.42*** | 74.83*** | 56.32*** | 49.47*** | ||||||
| R-sq. within | 0.79 | 0.77 | 0.79 | 0.78 | 0.78 | 0.76 | 0.78 | 0.77 | 0.70 | 0.69 | 0.70 | 0.70 |
| Hausman testProb>chi2 | 0.0000 | 0.0002 | 0.0000 | 0.0000 | 0.0002 | 0.0062 | ||||||
| Obs. | 163.00 | 163.00 | 163.00 | 163.00 | 163.00 | 163.00 | 163.00 | 163.00 | 163.00 | 163.00 | 163.00 | 163.00 |
| N Countries | 11.00 | 11.00 | 11.00 | 11.00 | 11.00 | 11.00 | 11.00 | 11.00 | 11.00 | 11.00 | 11.00 | 11.00 |
Source: Authors’ computations. Notes: Superscripts ***, **, *, and † indicate statistical significance at 0.1%, 1%, 5%, and 10% respectively. Figures in brackets show t-statistic. FE denotes fixed-effects (within) regression. RE denotes Random-effects Generalized Least Squares (GLS) regression. For the definition of variables, please see Table 4.
Table 12.
Unit root checking for variables in level.
| Variables | Level | ||||||||
|---|---|---|---|---|---|---|---|---|---|
| Individual Intercept | Individual Intercept and Trend | ||||||||
| LLC | IPS | ADF | PP | LLC | Breitung | IPS | ADF | PP | |
| (1) GROWTH | −6.89148*** | −2.83747** | 42.1514** | 58.4211*** | 0.15541 | 3.17011 | 3.01311 | 6.73929 | 6.39581 |
| (2) FDI | −5.13076*** | −4.58253*** | 60.6361*** | 56.5393*** | −3.87191*** | −3.2594*** | −3.62251*** | 50.3541*** | 56.1099*** |
| (3) POV | −6.30543*** | −3.14041*** | 50.1233*** | 54.6683*** | −6.45945*** | −2.33002** | −2.18696* | 46.6079** | 43.2553** |
| (4) INEQ | −14.2876*** | −5.9795*** | 68.0805*** | 73.5803*** | −13.3524*** | −2.57474** | −5.04005*** | 67.067*** | 103.905*** |
| (5) EDU | −14.2876*** | −5.9795*** | 68.0805*** | 73.5803*** | −3.96935*** | 3.58804 | 0.23805 | 26.7064 | 38.9658* |
| (6) INNOV | −4.17114*** | −0.5406 | 40.3984** | 29.4974 | −2.45073** | −1.68113* | −5.10344*** | 64.2222*** | 92.981*** |
| (7) TRANSP | 0.16593 | 4.22876 | 6.54 | 6.06803 | −0.71733 | 0.48229 | 0.15573 | 18.54 | 17.4855 |
| (8) IT | 2.38744 | 6.07589 | 2.12261 | 2.14089 | −0.22001 | −0.13088 | 0.75325 | 15.7589 | 12.7974 |
| (9) CORR | 0.09776 | 0.63304 | 18.3063 | 19.7321 | −0.94174 | −0.23127 | −0.7865 | 26.3428 | 33.0795† |
| (10) GOV_EFF | −2.08343* | −2.51437** | 42.9291** | 54.336*** | −2.83903** | −1.23925 | −1.9375* | 35.1402* | 42.4099** |
| (11) POL_STAB | −6.14953*** | −4.35309*** | 55.5461*** | 58.6936*** | −2.90664** | −0.53716 | −0.39607 | 22.4669 | 44.5648** |
| (12) REG_Q | −1.54727† | 0.1684 | 24.2968 | 18.8836 | −3.49729*** | 0.06775 | −1.13672 | 25.5891 | 26.3469 |
| (13) RULE_LAW | −0.63316 | 0.33652 | 23.3193 | 28.4594 | −2.75257** | −0.76952 | −2.86205** | 41.8436** | 64.9622*** |
| (14) VOICE_ACC | 0.95339 | −0.01605 | 30.1553 | 20.4843 | −2.76689** | 1.17876 | −1.59179† | 31.3506† | 26.7416 |
| (15) GOV_EXP | −3.28222*** | −3.0214** | 45.7265** | 46.235** | −4.47912*** | −1.52291† | −3.49884*** | 48.2018** | 36.4402* |
| (16) URB | 2.34336 | 2.73388 | 19.8265 | 43.537** | −2.42386** | −3.03075** | 0.44016 | 23.0641 | 7.86373 |
| (17) DCPS | −3.17298*** | −1.36901† | 33.1668† | 15.3335 | 2.36018 | 1.14294 | 1.30803 | 10.6243 | 6.93452 |
| (18) TRADE | −0.57095 | 1.36231 | 12.4385 | 12.6113 | −2.17451* | −3.09165** | −2.91162** | 43.1445** | 37.8771* |
Source: Authors’ computations. Notes: lag lengths are determined via Schwarz Info Criterion. Superscripts ***, **, * and † indicate statistical significance at 0.1%, 1%, 5% and 10% respectively. LLC reveals Levin, Lin and Chu t* stat. Breitung reveals Breitung t-stat. IPS reveals Im, Pesaran, and Shin W-stat. ADF reveals Augmented Dickey–Fuller Fisher Chi-square. PP reveals Phillips–Perron Fisher Chi-square. LLC and Breitung assumes common unit root process. IPS, ADF, and PP assumes individual unit root process. Probabilities for ADF and PP are computed using an asymptotic Chi-square distribution. Probabilities for the LLC, Breitung, and IPS tests are computed assuming asymptotic normality. For the definition of variables, please see Table 4.
Table 13.
Unit root checking for variables in first difference.
| Variables | First Difference | ||||||||
|---|---|---|---|---|---|---|---|---|---|
| Individual Intercept | Individual Intercept and Trend | ||||||||
| LLC | IPS | ADF | PP | LLC | Breitung | IPS | ADF | PP | |
| (1) ∆GROWTH | −10.0412*** | −7.1558*** | 91.0021*** | 81.29*** | −11.2039*** | −6.56351*** | −7.06473*** | 85.2992*** | 88.9451*** |
| (2) ∆FDI | −12.6609*** | −12.4626*** | 156.28*** | 452.106*** | −9.6859*** | −5.18914*** | −9.20536*** | 108.654*** | 154.953*** |
| (3) ∆POV | −5.32266*** | −3.19925*** | 47.048** | 52.9729*** | −4.40028*** | −1.41804† | −0.20066 | 24.1753 | 25.6106 |
| (4) ∆INEQ | −15.3118*** | −11.1358*** | 124.86*** | 138.282*** | −11.078*** | −1.97373* | −4.45331*** | 79.4281*** | 121.825*** |
| (5) ∆EDU | −2.61974** | −0.87694 | 30.1715 | 35.3114* | −3.47777*** | −0.0883 | −0.39812 | 29.8188 | 37.1392* |
| (6) ∆INNOV | −14.9716*** | −16.306*** | 214.13*** | 389.426*** | −14.4802*** | −7.34945*** | −17.1801*** | 210.228*** | 528.752*** |
| (7) ∆TRANSP | −10.5123*** | −10.3428*** | 127.778*** | 127.185*** | −8.72964*** | −8.15695*** | −8.93238*** | 104.849*** | 114.023*** |
| (8) ∆IT | −5.79754*** | −5.57405*** | 72.5568*** | 85.062*** | −5.04762*** | −5.30682*** | −3.84183*** | 53.1043*** | 59.786*** |
| (9) ∆CORR | −8.05233*** | −7.09242*** | 86.6963*** | 95.5046*** | −5.96343*** | −1.90304* | −4.0105*** | 54.3082*** | 85.6108*** |
| (10) ∆GOV_EFF | −12.8263*** | −10.5067*** | 123.252*** | 129.783*** | −11.0076*** | −4.84495*** | −8.46448*** | 94.4206*** | 121.1*** |
| (11) ∆POL_STAB | −10.09*** | −8.19166*** | 98.6169*** | 125.865*** | −8.98325*** | −3.30695*** | −6.80943*** | 82.317*** | 146.228*** |
| (12) ∆REG_Q | −8.07981*** | −7.17869*** | 88.8002*** | 96.2212*** | −9.70664*** | −2.96341** | −6.76272*** | 77.9188*** | 94.6873*** |
| (13) ∆RULE_LAW | −8.40469*** | −8.13053*** | 96.3068*** | 122.676*** | −8.32379*** | 0.5883 | −5.85384*** | 69.9895*** | 85.7716*** |
| (14) ∆VOICE_ACC | −9.90439*** | −8.19117*** | 99.3145*** | 130.447*** | −10.1777*** | −4.93672*** | −7.52055*** | 84.7466*** | 123.706*** |
| (15) ∆GOV_EXP | −11.3765*** | −9.19058*** | 113.171*** | 341.109*** | −8.91053*** | −7.43709*** | −7.01183*** | 82.334*** | 114.625*** |
| (16) ∆URB | 3.37016 | −0.68492 | 50.8643*** | 46.8744** | 1.10092 | −1.93539* | −3.49968*** | 59.7389*** | 87.0832*** |
| (17) ∆DCPS | −5.83659*** | −6.26303*** | 81.0564*** | 84.8147*** | −4.11108*** | 2.08777 | −4.16056*** | 61.1824*** | 64.09*** |
| (18) ∆TRADE | −12.5416*** | −10.9456*** | 141.017*** | 166.151*** | −10.6513*** | −8.69885*** | −8.84618*** | 104.826*** | 129.987*** |
Source: Authors’ computations. Notes: lag lengths are determined via Schwarz Info Criterion. Superscripts ***, **, * and † indicate statistical significance at 0.1%, 1%, 5% and 10% respectively. LLC reveals Levin, Lin and Chu t* stat. Breitung reveals Breitung t-stat. IPS reveals Im, Pesaran, and Shin W-stat. ADF reveals Augmented Dickey–Fuller Fisher Chi-square. PP reveals Phillips–Perron Fisher Chi-square. LLC and Breitung assumes common unit root process. IPS, ADF, and PP assumes individual unit root process. Probabilities for ADF and PP are computed using an asymptotic Chi-square distribution. Probabilities for the LLC, Breitung, and IPS tests are computed assuming asymptotic normality. For the definition of variables, please see Table 4.
Table 14.
The outcome of Pedroni (Engle Granger-based) panel co-integration test.
| Models | Co-integration Test Null Hypothesis: No Co-integration | Individual Intercept | Individual Intercept and Individual Trend | No Intercept or Trend | ||||
|---|---|---|---|---|---|---|---|---|
| Statistic | Weighted Statistic | Statistic | Weighted Statistic | Statistic | Weighted Statistic | |||
| (1) | GROWTH FDI CORR | Panel v-Statistic | −1.7076 | −1.5416 | 2.558375** | 2.358355** | −2.5585 | −2.5629 |
| Panel rho-Statistic | 1.7729 | 1.6675 | 2.9389 | 2.5653 | 0.6379 | 1.0724 | ||
| Panel PP-Statistic | 0.8394 | 0.6747 | 2.4321 | 1.5509 | −0.0228 | 0.6954 | ||
| Panel ADF-Statistic | −0.1785 | −0.2901 | 0.0185 | −0.1417 | −0.1750 | 0.6009 | ||
| Group rho-Statistic | 3.2381 | 3.3607 | 2.0779 | |||||
| Group PP-Statistic | 1.4325 | 1.2245 | 0.5920 | |||||
| Group ADF-Statistic | −0.0656 | −0.3940 | 0.0036 | |||||
| (2) | GROWTH FDI GOV_EFF | Panel v-Statistic | −2.0410 | −1.8150 | 5.601757*** | 3.009423** | −2.5340 | −2.5525 |
| Panel rho-Statistic | 1.6788 | 1.4922 | 2.3794 | 2.1078 | −0.0905 | 0.4903 | ||
| Panel PP-Statistic | 0.4617 | 0.3585 | 1.4419 | 0.7355 | −1.2721 | −0.8283 | ||
| Panel ADF-Statistic | 0.2270 | −0.0464 | 0.7036 | 0.2789 | −1.337236† | −0.8235 | ||
| Group rho-Statistic | 2.6590 | 3.1500 | 0.5467 | |||||
| Group PP-Statistic | 1.0769 | 1.5894 | −2.457101** | |||||
| Group ADF-Statistic | 0.3420 | 0.8662 | −2.806141** | |||||
| (3) | GROWTH FDI POL_STAB | Panel v-Statistic | −1.9435 | −1.7911 | 4.109299*** | 3.148275*** | −2.5467 | −2.5509 |
| Panel rho-Statistic | 1.6581 | 1.4842 | 2.8441 | 2.5303 | 0.7844 | 0.4696 | ||
| Panel PP-Statistic | 0.8934 | 0.4409 | 1.6648 | 0.8465 | 0.2732 | −0.6228 | ||
| Panel ADF-Statistic | 0.8873 | 0.3311 | 1.3484 | 0.5390 | 0.2050 | −0.7181 | ||
| Group rho-Statistic | 2.8741 | 3.5536 | 1.1195 | |||||
| Group PP-Statistic | 1.2001 | 1.5957 | −1.88605* | |||||
| Group ADF-Statistic | 0.9912 | 0.9094 | −2.142891* | |||||
| (4) | GROWTH FDI REG_Q | Panel v-Statistic | −1.9322 | −1.7904 | 3.827421*** | 3.100601** | −2.5047 | −2.5344 |
| Panel rho-Statistic | 1.7994 | 1.8637 | 2.4795 | 2.2650 | 0.0694 | 0.7520 | ||
| Panel PP-Statistic | 0.4580 | 0.6717 | 1.5360 | 0.8376 | −1.295661† | 0.0573 | ||
| Panel ADF-Statistic | 0.4554 | 0.3683 | 0.1285 | −0.1233 | −0.3046 | 1.0050 | ||
| Group rho-Statistic | 3.3447 | 3.4405 | 0.9909 | |||||
| Group PP-Statistic | 1.6631 | 1.8083 | −1.1041 | |||||
| Group ADF-Statistic | 0.8479 | 0.7101 | −1.1348 | |||||
| (5) | GROWTH FDI RULE_LAW | Panel v-Statistic | −1.2978 | −1.0993 | 1.394589† | 1.1297 | −2.5529 | −2.5564 |
| Panel rho-Statistic | 0.7354 | 0.7656 | 3.1147 | 2.8597 | −1.794843* | −0.9406 | ||
| Panel PP-Statistic | −1.568443† | −1.415265† | 2.8852 | 2.0077 | −3.816753*** | −3.156792*** | ||
| Panel ADF-Statistic | −1.430085† | −1.2416 | 2.3909 | 1.3439 | −2.534433** | −2.537426** | ||
| Group rho-Statistic | 2.0371 | 4.1321 | 0.3189 | |||||
| Group PP-Statistic | −1.338549† | 2.5739 | −3.770538*** | |||||
| Group ADF-Statistic | −0.9832 | 1.6086 | −2.018076* | |||||
| (6) | GROWTH FDI VOICE_ACC | Panel v-Statistic | −2.1255 | −1.9365 | 3.894971*** | 2.947807** | −2.4596 | −2.5230 |
| Panel rho-Statistic | 1.6990 | 1.6716 | 3.1083 | 2.9776 | 1.0982 | 1.8708 | ||
| Panel PP-Statistic | −0.5114 | −0.3768 | 2.7915 | 2.3235 | 0.7232 | 2.1639 | ||
| Panel ADF-Statistic | −0.3276 | 0.1174 | 2.4500 | 2.1509 | 0.0742 | 1.9391 | ||
| Group rho-Statistic | 3.0075 | 3.9313 | 1.5779 | |||||
| Group PP-Statistic | 0.0575 | 3.0209 | −0.5654 | |||||
| Group ADF-Statistic | 0.9403 | 2.4051 | −2.599532** | |||||
Source: Authors’ computations. Notes: Superscripts ***, **, * and † indicate statistical significance at 0.1%, 1%, 5% and 10% respectively. Schwarz Info Criterion was selected for lag length. For the definition of variables, please see Table 4.
Table 15.
The outcome of Kao (Engle Granger-based) panel co-integration test.
| Models | ||||||
|---|---|---|---|---|---|---|
| Null Hypothesis: No Co-Integration | (1) GROWTH FDI ORR | (2) GROWTH FDI GOV_EFF | (3) GROWTH FDI POL_STAB | (4) GROWTH FDI REG_Q | (5) GROWTH FDI RULE_LAW | (6) GROWTH FDI VOICE_ACC |
| ADF (t-Statistic) | −3.457081*** | −3.51358*** | −2.678418** | −1.799285* | −2.957034** | −0.688062 |
| Residual Variance | 0.010128 | 0.010301 | 0.010336 | 0.009971 | 0.009585 | 0.010323 |
| HAC Variance | 0.021366 | 0.022058 | 0.022258 | 0.022209 | 0.016184 | 0.023863 |
Source: Authors’ computations. Notes: Superscripts ***, **, * and † indicate statistical significance at 0.1%, 1%, 5% and 10% respectively. Schwarz Info Criterion was selected for lag length. For the definition of variables, please see Table 4.
Table 16.
The outcome of Fisher (combined Johansen) panel co-integration test.
| Models | Hypothesized No. of CE(s) | Fisher Stat. (From Trace Test) | Fisher Stat. (From Max-Eigen Test) | |
|---|---|---|---|---|
| (1) | GROWTH FDI CORR | None | 135.8*** | 116.9*** |
| At most 1 | 46.99** | 39.7* | ||
| At most 2 | 37.73* | 37.73* | ||
| (2) | GROWTH FDI GOV_EFF | None | 126.7*** | 106*** |
| At most 1 | 49.74*** | 35.41* | ||
| At most 2 | 49.92*** | 49.92*** | ||
| (3) | GROWTH FDI POL_STAB | None | 124.5*** | 100.8*** |
| At most 1 | 50.92*** | 34.92* | ||
| At most 2 | 53.41*** | 53.41*** | ||
| (4) | GROWTH FDI REG_Q | None | 110.9*** | 89.26*** |
| At most 1 | 44.86** | 31.7† | ||
| At most 2 | 50.2*** | 50.2*** | ||
| (5) | GROWTH FDI RULE_LAW | None | 102.9*** | 81.13*** |
| At most 1 | 44.29** | 33.34† | ||
| At most 2 | 44.31** | 44.31** | ||
| (6) | GROWTH FDI VOICE_ACC | None | 100.6*** | 62.01*** |
| At most 1 | 61.64*** | 39.13* | ||
| At most 2 | 66.19*** | 66.19*** | ||
Source: Authors’ computations. Notes: Superscripts ***, **, * and † indicate statistical significance at 0.1%, 1%, 5% and 10% respectively. Probabilities are computed using asymptotic Chi-square distribution. For the definition of variables, please see Table 4.
Table 17.
Panel data examination of long-run output elasticities.
| Variables | (1) | (2) | (3) | (4) | (5) | (6) | ||||||
|---|---|---|---|---|---|---|---|---|---|---|---|---|
| FMOLS | DOLS | FMOLS | DOLS | FMOLS | DOLS | FMOLS | DOLS | FMOLS | DOLS | FMOLS | DOLS | |
| FDI | −0.01* (−2.55) | −0.01** (−2.77) | 0.00 (−0.93) | 0.00 (−0.69) | −0.01** (−3.28) | −0.01 (−1.63) | −0.01† (−1.92) | −0.01 (−1.21) | 0.00 (−1.00) | −0.01 (−0.95) | −0.01** (−3.16) | −0.01 (−1.58) |
| CORR | 0.46* (2.31) | 0.35 (1.46) | ||||||||||
| GOV_EFF | 1.05*** (4.71) | 0.91** (3.29) | ||||||||||
| POL_STAB | −0.30 (−1.40) | −0.04 (−0.15) | ||||||||||
| REG_Q | 0.74*** (3.61) | 0.70** (2.73) | ||||||||||
| RULE_LAW | 1.45*** (7.49) | 1.29*** (5.99) | ||||||||||
| VOICE_ACC | −0.33 (−1.48) | −0.08 (−0.24) | ||||||||||
| R-squared | 0.63 | 0.73 | 0.68 | 0.74 | 0.63 | 0.70 | 0.67 | 0.73 | 0.77 | 0.82 | 0.64 | 0.69 |
| Adjusted R-squared | 0.60 | 0.65 | 0.65 | 0.67 | 0.59 | 0.61 | 0.64 | 0.65 | 0.75 | 0.77 | 0.60 | 0.61 |
| S.E. of regression | 0.28 | 0.26 | 0.26 | 0.25 | 0.28 | 0.27 | 0.26 | 0.26 | 0.22 | 0.21 | 0.27 | 0.27 |
| Long-run variance | 0.15 | 0.10 | 0.13 | 0.09 | 0.15 | 0.12 | 0.14 | 0.10 | 0.09 | 0.06 | 0.15 | 0.12 |
| Mean dependent var | 9.14 | 9.14 | 9.14 | 9.14 | 9.14 | 9.14 | 9.14 | 9.14 | 9.14 | 9.14 | 9.14 | 9.14 |
| S.D. dependent var | 0.44 | 0.44 | 0.44 | 0.44 | 0.44 | 0.44 | 0.44 | 0.44 | 0.44 | 0.44 | 0.44 | 0.44 |
| Sum squared resid | 10.76 | 7.85 | 9.39 | 7.48 | 10.87 | 8.81 | 9.73 | 7.80 | 6.69 | 5.23 | 10.59 | 8.87 |
Source: Authors’ computations. Notes: Superscripts ***, **, * and † indicate statistical significance at 0.1%, 1%, 5% and 10% respectively. Panel method: Pooled estimation. Heterogeneous variances. Schwarz lag and lead method in case of DOLS estimation. Figures in brackets show t-statistic. For the definition of variables, please see Table 4.
Table 18.
Panel vector error-correction model (PVECM) Granger causalities.
| Models | Excluded | Short-Run (or Weak) Granger-Causality | Long-Run Granger-Causality | ||
|---|---|---|---|---|---|
| Dependent Variables | |||||
| (1) | ∆GROWTH | ∆FDI | ∆CORR | ECT | |
| ∆GROWTH | 1.6978 | 2.3258 | −0.124502*** | ||
| ∆FDI | 12.34713** | 0.5063 | −10.96881*** | ||
| ∆CORR | 2.8356 | 3.0597 | −0.001809 | ||
| (2) | ∆GROWTH | ∆FDI | ∆GOV_EFF | ECT | |
| ∆GROWTH | 1.8875 | 1.0458 | −0.174456*** | ||
| ∆FDI | 11.45159** | 1.1969 | −9.440169** | ||
| ∆GOV_EFF | 7.444163* | 0.4843 | 0.046016 | ||
| (3) | ∆GROWTH | ∆FDI | ∆POL_STAB | ECT | |
| ∆GROWTH | 2.1091 | 1.4481 | −0.140034*** | ||
| ∆FDI | 8.041205* | 2.8072 | −8.335268** | ||
| ∆POL_STAB | 0.2664 | 1.2736 | −0.026861 | ||
| (4) | ∆GROWTH | ∆FDI | ∆REG_Q | ECT | |
| ∆GROWTH | 1.1953 | 10.78608** | −0.103463*** | ||
| ∆FDI | 12.49779** | 3.7957 | −7.632315*** | ||
| ∆REG_Q | 1.1073 | 3.1275 | 0.005832 | ||
| (5) | ∆GROWTH | ∆FDI | ∆RULE_LAW | ECT | |
| ∆GROWTH | 1.3339 | 4.764213† | −0.157890*** | ||
| ∆FDI | 11.30389** | 0.8344 | −8.213606** | ||
| ∆RULE_LAW | 0.5774 | 1.6971 | −0.001021 | ||
| (6) | ∆GROWTH | ∆FDI | ∆VOICE_ACC | ECT | |
| ∆GROWTH | 1.7856 | 2.5089 | −0.139026*** | ||
| ∆FDI | 10.69032** | 0.9557 | −6.247867* | ||
| ∆VOICE_ACC | 3.2408 | 4.73479† | 0.012596 | ||
Source: Authors’ computations. Notes: Superscripts ***, **, * and † indicate statistical significance at 0.1%, 1%, 5% and 10% respectively. ECT reveals the coefficient of the error-correction term. The number of appropriate lags is two according to Schwarz information criterion. For the definition of variables, please see Table 4.
© 2019 by the authors. Licensee MDPI, Basel, Switzerland. This article is an open access article distributed under the terms and conditions of the Creative Commons Attribution (CC BY) license (http://creativecommons.org/licenses/by/4.0/).
Share and Cite
MDPI and ACS Style
Gherghina, Ș.C.; Simionescu, L.N.; Hudea, O.S. Exploring Foreign Direct Investment–Economic Growth Nexus—Empirical Evidence from Central and Eastern European Countries. Sustainability 2019, 11, 5421. https://doi.org/10.3390/su11195421
AMA Style
Gherghina ȘC, Simionescu LN, Hudea OS. Exploring Foreign Direct Investment–Economic Growth Nexus—Empirical Evidence from Central and Eastern European Countries. Sustainability. 2019; 11(19):5421. https://doi.org/10.3390/su11195421
Chicago/Turabian StyleGherghina, Ștefan Cristian, Liliana Nicoleta Simionescu, and Oana Simona Hudea. 2019. "Exploring Foreign Direct Investment–Economic Growth Nexus—Empirical Evidence from Central and Eastern European Countries" Sustainability 11, no. 19: 5421. https://doi.org/10.3390/su11195421
Note that from the first issue of 2016, this journal uses article numbers instead of page numbers. See further details here.