A Multi-Objective Optimization Model for Green Supply Chain Considering Environmental Benefits


1
School of Economic and Management, Chongqing University of Posts and Telecommunications, Chongqing 400065, China
2
Chongqing Key Laboratory of Electronic Commerce & Supply Chain System, National Research Base of Intelligent Manufacturing Service, Chongqing Technology and Business University, Chongqing 400067, China
3
School of Management and Economics, University of Electronic Science and Technology of China, Chengdu 611731, China
*
Author to whom correspondence should be addressed.
Sustainability 2019, 11(21), 5911; https://doi.org/10.3390/su11215911
Submission received: 25 September 2019
/
Revised: 21 October 2019
/
Accepted: 22 October 2019
/
Published: 24 October 2019
(This article belongs to the Special Issue Sustainable Operations and Supply Chain Management)
Abstract
:Whether the upstream and downstream members in a supply chain (considering environmental objectives) simultaneously stabilize economic benefits has become an important problem in the process of green development. However, few quantitative studies on green supply chains have considered environmental and economic benefits to realize multi-objective optimization. To study operation and cooperation strategies with a consideration of the different objective on the level of supply chain, we first establish a green supply chain game model with profit and environment objectives simultaneously considered by the manufacturer. Then, we analyze the multi-objective decisions of the supply chain members under centralized control using a manufacturer-led Stackelberg game and revenue-sharing contract. Using the manufacturer’s environmental preference as a variable, the effects of environmental benefits on the supply chain are also investigated. Finally, this study determines that the manufacturer’s profit will be reduced after considering the objective of environmental benefits, while the retailer’s profit, product greenness, and environmental benefits will be improved. Meanwhile, the total profit of the green supply chain will first increase and then decrease. In particular, a revenue-sharing contract can facilitate the coordination of multiple objectives; in this way, both the manufacturer and the retailer achieve higher profits and environmental benefits compared to a decentralized control condition, which is of great significance in achieving a win–win situation for the economy and the environment.
1. Introduction
With the continuous deterioration of the natural environment and the increasing tension of global resources, the green supply chain has attracted more and more attention. There is an increasing recognition that organizations must address the issue of sustainability in their operations [1], and the financial and economic impact in the green supply chain management (GSCM) has become an important issue of universal concern [2]. On the one hand, the government’s regulations and standards, as well as the company’s environmental concerns, have urged the product supply chain to integrate environmental benefits into their decision-making objectives [3,4]. On the other hand, customer related concerns and the market’s fierce competition has helped environmental objectives become an important driving factor of enterprises’ development [5,6]. Indeed, companies are looking to evolve from reactive strategies to proactive positioning, developing, and implementing new management approaches, thereby incorporating sustainable development practices into their strategies [7].
Many firms presently incorporate environmental and economic responsibility considerations into their operations and supply chain management strategies [8]. For example, Sony, one of the world’s most widely known electronics companies, is working to reduce its environmental footprint to zero by 2050. Sony reduced its total amount of CO2 emissions by approximately 238,000 tons in 2018 by using renewable energy (https://www.sony.net/SonyInfo/csr_report/environment/). BYD, one of the largest Chinese car brands and the world’s top selling plug-in electric car manufacturer, deployed over 50,000 battery-electric buses across the globe in 2019, which will eliminate 84.5 million tons of CO2, 500 million tons of NOx, and 8750 tons of DPM (https://twitter.com/bydcompany/status/1128108923288936448). In addition, the China Green Supply Chain Alliance was officially established in October 2018. More than 140 member organizations actively carried out green supply chain management and technological innovation to explore enterprises’ future green development (http://www.cietc.org/article.asp?id=7611). The environmental concern of members of the supply chain is becoming a developmental trend [9].
However, the upstream manufacturers and downstream retailers in the supply chain generally focus on maximizing their own interests [10], which have different degrees of objectives, eventually leading to the loss of the enterprise’s benefits. In 2018, BYD sold 247,811 new energy vehicles, a rise of over 90 percent from 2017, but its net profits attributable to its shareholders totaled 2.78 billion Yuan, a drop of 31.63 percent year-to-year (http://www.chinadaily.com.cn/kindle/2019-03/29/content_37453218.htm). Whether the upstream and downstream members’ game behaviors in the supply chain (while considering environmental benefits) simultaneously stabilize economic benefits has become an important problem in the process of green development. Only cooperation in a supply chain enables its participators to create and capture mutual benefits, including profit or environmental protection enhancements, cost reductions, and operational flexibility to cope with the high demand uncertainty of green products [11]. The cooperation between manufacturers and retailers will be a decisive component in enabling better performance [12].
Therefore, it is very necessary to study game operation and cooperation strategies with the consideration of environmental benefits at the level of the supply chain. Recently, the multi-objective optimization of the supply chain has been considered by different researchers in the literature [13]. Due to the interaction and contradiction between economic and environmental objectives, the decision-making process is quite complex, which makes it difficult for decision-makers to make decisions easily [14]. Multi-objective optimization is also used to research the problem of GSCM operation, such as green supply chain network design [15], green supplier evaluation [16], sustainable distribution system [17], and so on. Therefore, this paper establishes a multi-objective optimization model and analyzes the game behavior and coordination contract between upstream manufacturers and downstream retailers to research whether this behavior can facilitate a win–win scenario for the profit and the ecological environment after pursuing the double objectives of economy and environment benefits. This will be of great practical significance in promoting the green transformation of traditional enterprises and achieving mutually beneficial cooperation between members in the green supply chain.
The remainder of the article is organized as follows. The following section introduces the literature and emphasizes the contributions of the study. The third section describes the hypotheses and prerequisites of the multi-objective optimization model for the green supply chain, considering environmental benefits. Subsequently, Section 4, Section 5 and Section 6 illustrate the optimal decision under the models of centralized decisions, decentralized decisions, and revenue-sharing contracts. Then, the paper compares and analyzes the above three models in Section 7 and offers simulations using numerical examples via the Maple2019 software in Section 8. Finally, the paper provides a discussion of the results and concludes with an outlook on the implications for future research in Section 9.
2. Literature Review
The green supply chain is not only an important topic in everyday society but also receives significant attention in academia. Srivastav [18] defined GSCM as integrating environmental thinking into supply-chain management, including: product design, material sourcing and selection, manufacturing processes, delivery of the final product to the consumers, as well as the end-of life management of the product after its useful life, which is the most widely used. Oliveira et al. [2] studied the research surroundings and content focus over the last decade, contextualizing the research problem of GSCM into three broad categories: the importance of the GSCM, green operations, and others; 45% of the total articles addressed green operations (at the top of the list). Enterprises are more willing to adopt GSCM practices because of increasing environmental pressures [19]. The most widely cited GSCM operation in the literature refers to operation performance [20,21], operational processes [22,23], the reduction of waste and environmental impact [24,25], and the development or selection of suppliers [26,27]. At present, a number of studies are investigating the influence of environmental concerns in supply chain management, such as those by Beske-Jannsen et al. [28] and Sancha et al. [29]. However, current green supply chain research has mainly focused on case studies, questionnaires, and other types of qualitative research but has been less involved in quantitative research [30].
In recent years, the scientific community has advanced more quantitative research on the GSCM green operation strategy via game theory to promote optimization and cooperation. Ghosh and Shah [31] set up a game model of a green supply chain consisting of manufacturers and retailers that only considered profit maximization, which the market demand determined by price and greenness. They also studied the optimal product decision under three kinds of power structures: a manufacturer-led Stackelberg game, a retailer-led Stackelberg game, and a Nash game. Zhang and Liu [32] established a three-level green supply chain consisting of manufacturers, retailers, and consumers. They compared and analyzed four decision models: centralized, decentralized, a cooperative game between the manufacturer and consumer, and a cooperative game between the retailer and the consumer. Some scholars (Tian and Zhu; Guan et al.; Shi et al.) then expanded the research field to real-world problems, such as government subsidies and consumer behaviors. Tian and Zhu [33] constructed a three-stage evolutionary game model of green supply chain management under a government subsidy and analyzed the impact of government subsidies on social welfare, product sales, and enterprises’ implementation of green supply chain management. Guan et al. [34] studied the influence of consumer perception behavior on a green operation strategy and members’ income and established a green supply chain model with a consumer perception bias. Shi et al. [35] studied the effects of fair concern behavior and a product’s green efficiency on supply chain pricing decisions. They also analyzed and compared the optimal supply chain decisions under fair concern behaviors.
There is no doubt that the trend is moving towards green development, and if the green supply chain members establish a suitable contract, this contract is expected to further enhance the initiative of enterprises implementing green transformation. Jiang and Li [36] optimized the profits between the manufacturer and retailer through a revenue-sharing contract based on the four game models of supply chain considering the product’s green degree. Zhang et al. [37] coordinated a game model for a green supply chain under the consideration of fairness and government subsidies through a cost-sharing contract. Lin and Chen [38] constructed a green manufacturing supply chain model considering corporate social responsibility and achieved supply chain coordination through a two-part pricing-cost sharing contract. Wang et al. [39] analyzed the effect of product recovery and donations on a closed-loop supply chain’s operation management and presented a two-part tariff contract with bargaining and a retailer-led revenue sharing contract to coordinate.
To summarize previous game operations and the coordination of the green supply chain literature, most of the existing studies only consider the single objective of economic benefit, while less involve the double objectives of economic benefits and environmental benefits. However, it is not uncommon for enterprises to incorporate both the economy and the environment into their decision-making goals. Current research on the economic and environmental benefits optimization of a green supply chain focus more on the supply chain’s network design. Wang et al. [40] studied the impact of environmental investment factors on supply chain network design and established a multi-objective optimization model considering the total cost and environmental influence. On this basis, Gao et al. [41] comprehensively considered the total cost and carbon emissions, aiming at the multi-level and multi-product closed-loop supply chain of household appliances and analyzed the influence of different subsidy intensities on the proportion of green consumers and the design of a supply chain network. Li and Zhu [42] aimed to minimize the total cost of the supply chain network and total carbon emissions. They established an opportunity-constrained multi-objective planning model and achieved an effective balance between economic and environmental objectives. In addition, Chen et al. [43] considered a game-theoretic decision-making model in which the government focuses on corporate revenue, consumer welfare, and environmental benefits, as well as rewards and punishments to convince manufacturers to produce energy-efficient products.
The above research on the multi-objective optimization of economic and environmental benefits focuses on the design of a supply chain network, as few studies use the method of multi-objective optimization and game theory, taking profit and environmental benefits as two objectives to make decisions on product pricing and product greening level. By taking all the above factors into consideration, this paper establishes two supply chain game models with a centralized control game model and a manufacturer-led Stackelberg game model based on the theory of multi-objective optimization, in which the manufacturer considers both profit and an environmental benefits objective. We also analyzed the impact of a manufacturer’s environmental preference for a supply chain’s optimal pricing, a product’s greening level, and overall performance. On this basis, this research further establishes a revenue-sharing contract coordination model to coordinate the behavior of manufacturers and retailers. Then, we compare the results of the above three models to determine how a revenue-sharing contract affects the decision variables of the green supply chain members. Finally, we hope to provide a decision-making reference for related enterprises to implement green supply chain management.
3. Model Hypotheses
Referring to Song and Gao [30], we studied a secondary green supply chain model consisting of a manufacturer who considers both environmental and profit-based objectives and a retailer who only considers profits. To improve the greening level, manufacturers invest in green raw materials for technological innovation to produce green products and sell them to retailers at a price of . Then, retailers sell green products to consumers at a price of . This study makes the following assumptions, and the parameters and meanings are listed in Table 1:
- (1)
- According to game theory, this paper established a decentralized decision game model (a manufacturer-led Stackelberg game model) in which the manufacturer first determines the product’s greening level and the wholesale price, and then the retailer reacts to determine the product’s retail price. We assumed that the manufacturer, as a downstream member of the supply chain, would be the leader of the decision-making. All members (the manufacturer and the retailer) were rational and pursue benefit maximization.
- (2)
- The market demand is a linear function of the product’s price and greening level. Consumers tend to buy products with high greenness and low prices [44]:where denotes the market’s total potential demand for green products, denotes the retail price of the product, denotes the parameter that influences a consumer’s sensitivity to retail price, and denotes the consumer’s green sensitivity. The greening level of the unit product is , which reflects energy efficiency labels, carbon labels, and harmful substance content. Equation (1) shows that the higher the greening level, the greater the market demand. However, this value can only reflect the profit target, rather than the impact of products on the ecological environment.
- (3)
- The manufacturer’s cost for producing products is , while the wholesale price to the retailer is . To improve the greening level, manufacturers need to invest additional green product research and development (R&D) costs . This assumes that the R&D investment has a quadratic relationship with the greening level and that the cost is entirely borne by the manufacturers [45]. In other words, green product R&D costs , where is the green investment parameter. The retailer’s cost to sell products is , which denotes the consumption based on the retailers’ marketing and promotion of products [46].
- (4)
- The environmental benefit is a measure of the environmental consequences of human social activities [47]. This paper referred to the environmental impact of enterprises in the process of the production and circulation of products [48]. Similar to the research on measuring environmental benefits through total carbon emissions [49,50,51,52], this study assumed that the utility function of an environmental benefits objective is the product of the greening level and market demand, which is:where the environmental benefits characterize the environmental influence of all products in the total production process. With an improved environmental benefits objective, the degree of environmental protection will be higher, and the total pollution will be lower. The decision-making objective of the supply chain was used to maximize the target of environmental benefits. Equations (1) and (2) show that the greening level affects both the profit targets, and the environment also benefits the targets.
- (5)
- According to the theory of multi-objective optimization, this study adopted a linearity weighted method to solve the problems based on the characteristics of the model [11,53]. The multi-objective linearity weighted function is . The weight coefficient of the manufacturer’s environmental benefits in the multi-objective function is , which represents the environmental preference of the manufacturer. The higher the , the more important the environmental benefits in the multi-objective function, which means that manufacturers pay more attention to environmental benefits. In particular, when , the manufacturer’s multi-objective optimization function degenerates to a single profit objective.
Based on the above assumption, the profit function for the manufacturer is , and its multi-objective linearity weighted function (considering the environmental objective) is . The profit function for the retailer is . The total profit function for the supply chain is , and its multi-objective linearity weighted function is .
Proposition 1.
When, the manufacturer’s multi-objective optimization functionis a strictly concave function of the greening level, and the wholesale price. The retailer’s profit functionis a strictly concave function of the retail price .
Proof.
According to the retailer’s profit function , , which denotes that is a strictly concave function of the retail price . In addition, this assumes that , is the incremental price for retailers, to get: . The Hessian matrix of equation is . is established by the equivalence relation between the negative definite Hessian Matrix and the quadratic function being strictly conjoined to the concave function. □
4. Centralized Decision Model in a Multi-Objective Situation
The core idea of a centralized control model is that manufacturers and retailers make collective decisions to maximize the overall profitability of the supply chain. This game model treats the supply chain as a whole and is a vertical integration game model [54]. Here, manufacturers and retailers no longer make individual decisions based on their own interests but instead make collective decisions to maximize the overall profitability of the supply chain [55]. At this point in the multi-objective situation, the supply chain aims to maximize the overall profit and environmental benefits and produce a multi-objective optimization function of:
According to the theory of multi-objective optimization, we adopted the linearity weighted method to solve the problem based on the characteristics of our model. We assumed that the weight coefficient of the supply chain’s environmental benefits in the multi-objective function was . Then, the supply chain’s multi-objective linearity weighted function was:
reflects the degree of the environmental preference within the whole supply chain under centralized decision-making, which is used to measure how much attention the whole supply chain attaches to the environmental benefits objective when the manufacturer considers both profit and the environmental benefits objectives. In order to facilitate the subsequent comparative analysis, we assumed that the environmental preference of the whole supply chain under centralized decision-making is the same as the manufacturer’s environmental preference.
Next, we set the first derivatives of and to zero, and got the optimal wholesale price and greening level under the multi-objective centralized decision model:
Finally, we put Equations (5) and (6) into Equations (2) and (3), and got the optimal environmental benefit and maximum profit of the whole supply chain under a multi-objective centralized decision model:
Proposition 2.
When, the optimal solution for the supply chain’s profit exists.
Proof.
, is established by the existence condition of the supply chain profit’s optimal solution, . □
5. Decentralized Decision Model in a Multi-Objective Situation
In this section, we introduced the decentralized decision game model, in which manufacturers consider both profit and environmental benefits and retailers still only consider profit. The core idea of a decentralized decision game is opposite to that of a centralized decision game. Manufacturers and retailers make their own decisions based on their own profits to maximize their own benefits, and the decision-making results are mutually influential. We examined the manufacturer-led Stackelberg game model and the dynamic game order, as follows:
Firstly, the manufacturer determines the product’s greening level and the wholesale price using the response function of the retailer; then, the retailer reacts to determine the product’s retail price. Finally, the retailer sells their products to consumers to meet market demand. At this point, the manufacturer uses the maximization of profit and environmental benefits as its decision-making objectives, and its multi-objective optimization function is:
where is the profit target of the manufacturer and is the goal of its environmental benefits. Similar to Section 3, the weight coefficient is introduced to further construct the manufacturer’s multi-objective linear weighting function under decentralized decision-making:
where reflects the manufacturer’s environmental preference under the decentralized decision-making, and is used to measure the manufacturer’s attention to the environmental benefits after considering both the profit and the environmental benefits objectives. In addition, the retailer is seeking their own profit maximization, the optimization function is:
The inverse induction method is used to solve this problem [56,57]. If we obtain the first and second derivatives of and set the first derivative equal to zero from Equation (15), we get:
Next, we put Equation (12) into Equation (10), set the first derivatives of and to zero, and got the optimal wholesale price and greening level of the manufacturer:
We then put Equations (13) and (14) into Equation (12) and obtained the optimal retail price:
Then, we put Equations (13)–(15) into Equations (9) and (11) and got the actual demand of the market, as well as the maximum profits for the manufacturer and retailer:
Finally, we obtained the maximum environmental benefits and profits of the supply chain:
Theorem 1.
, and .
Proof.
According to Equations (14) and (19):
Theorem 1 shows that when the manufacturer considers environmental benefits and leads the game, the product’s greening level and enterprise environmental benefits increase with the manufacturer’s environmental preferences. After the manufacturer considers the environmental benefits in their decision-making goals, the manufacturer will further increase their R&D investment, thereby enhancing the environmental benefits objective and satisfying the consumer market preference for green goods. □
Theorem 2.
, and .
Proof.
According to Equations (17) and (18):
Theorem 2 shows that when a manufacturer considers environmental benefits and leads the game, the retailer’s profit will increase, and the manufacturer’s profit will decrease with an increase of the manufacturer’s environmental preference. This study found that considering the environmental benefits objective had negative effects on the manufacturer’s own profits but was more beneficial to retailers’ profits. At this point, we needed a revenue-sharing coordination mechanism to adjust the profit distribution between the two sides, to encourage manufacturers to bring environmental benefits into their decision-making goals and achieve a win–win situation for both sides. □
6. Revenue-Sharing Contract Model
As the first decision-maker of the game, the manufacturer bears the green product R&D costs and faces enormous economic risks. To achieve integrated management, promote the cooperation of upstream and downstream enterprises, and ultimately obtain high overall performance, this study established a retailer-led revenue-sharing contract game model. The core idea was that the retailer would share part of their sales with the manufacturer to coordinate the distribution of profits, thereby encouraging manufacturers to consider the environmental benefits of a green supply chain. The order and rules of the game are as follows. Firstly, the manufacturer determines the wholesale price and the product’s greening level. Then, the retailer determines the retail price of the green products and provides the revenue-sharing ratio , indicating the percentage that the retailer will gain from final sales , and the remaining is shared with manufacturer [58,59,60].
The multi-objective benefits function of the manufacturer is:
and the profit of the retailer is:
where is the profit target of the manufacturer, and is the goal of its environmental benefits. The dynamic game order is the same as that in Section 3. We could obtain the first and second derivatives of and set the first derivative equal to zero from Equation (21) to get:
Next, we put Equation (22) into Equation (20), set the first derivatives of and to zero, and got the optimal wholesale price and greening level of the manufacturer:
We then put Equations (23) and (24) into Equation (22) and got the optimal retail price:
Proposition 3.
When, the supply chain multi-objective optimization functionwill be a strictly concave function of the revenue-sharing ratio .
Proof.
We put Equations (31)–(33) into Equation (22) to get , is established by the existence condition of a strict concave function, .
Next, we put the into Equation (21) and set the first derivatives of to zero to get the optimal revenue-sharing ratio:
We substituted the value of in the above expressions, got , , and :
Then, we put Equations (27)–(29) into Equations (20) and (21) and determined the actual demand of the market, as well as the maximum profits for the manufacturer and retailer under a revenue-sharing contract:
Finally, we obtained the maximum environmental benefits and profits of the supply chain:
□
7. Model Comparison and Analysis
A summary of the variables corresponding to optimal decision-making under the three models is shown in Table 2.
On the basis of the above three models, the optimal decision variables under the situation of a manufacturer that considers both profits and environmental benefits were compared and analyzed, and the following three properties were proposed.
Proposition 4.
,.
Proof.
, , ;
In summary, , . □
Proposition 4 shows that the wholesale price and the retail price under the revenue-sharing contract are smaller than those under the decentralized decision, and the retail price under the revenue-sharing contract is larger than that under the centralized decision. This illustrates that the retailer receives the latter advantage and raises the retail price of the product when the manufacturer makes the first decision, so the consumer market demand is negatively affected. Under the revenue-sharing contract, the retailer reduces the retail price by losing profits, thereby meeting the consumer’s expectations and increasing the market demand.
Proposition 5.
, .
Proof.
;
In summary, , . □
Proposition 5 shows that the greening level and environmental benefits under centralized decision-making are higher than those under a revenue-sharing contract and higher than those under manufacturer-dominated Stackelberg game decision-making. This demonstrates that the contract is more advantageous for an enterprise to accomplish its environmental benefits goal. Thus, an enterprise can provide the product with a higher greening level in the production process and achieve higher environmental benefits, thereby supporting centralized decision-making.
Proposition 6.
, .
Proof.
, .
□
Proposition 6 shows that the both manufacturer’s and retailer’s profits under the revenue-sharing contract are higher than those under manufacturer-dominated Stackelberg game decision-making. This demonstrates that a manufacturer and retailer are always willing to accept a revenue-sharing contract. Combined with Proposition 5, this contract can achieve the double optimization of profits and environmental benefits, and the supply chain can achieve perfect coordination.
8. Numerical Analysis
In the above part, the influence of a manufacturer (considering environmental benefits) on the supply chain was studied, the equilibrium solution under three different conditions was analyzed, and some management experience and inspiration were obtained. In this section, these conclusions were simulated by numerical examples using the Maple 2019 software and analyzed further. We assumed that the demand function of green products was , the cost of R&D investment was , the manufacturer’s production cost was , and the retailer’s selling cost was . From the existence conditions of Proposition 1, Proposition 2, and Proposition 3, we could get . By substituting the above values into the three cases, the decision variables under different models were obtained, and we obtained the following conclusion.
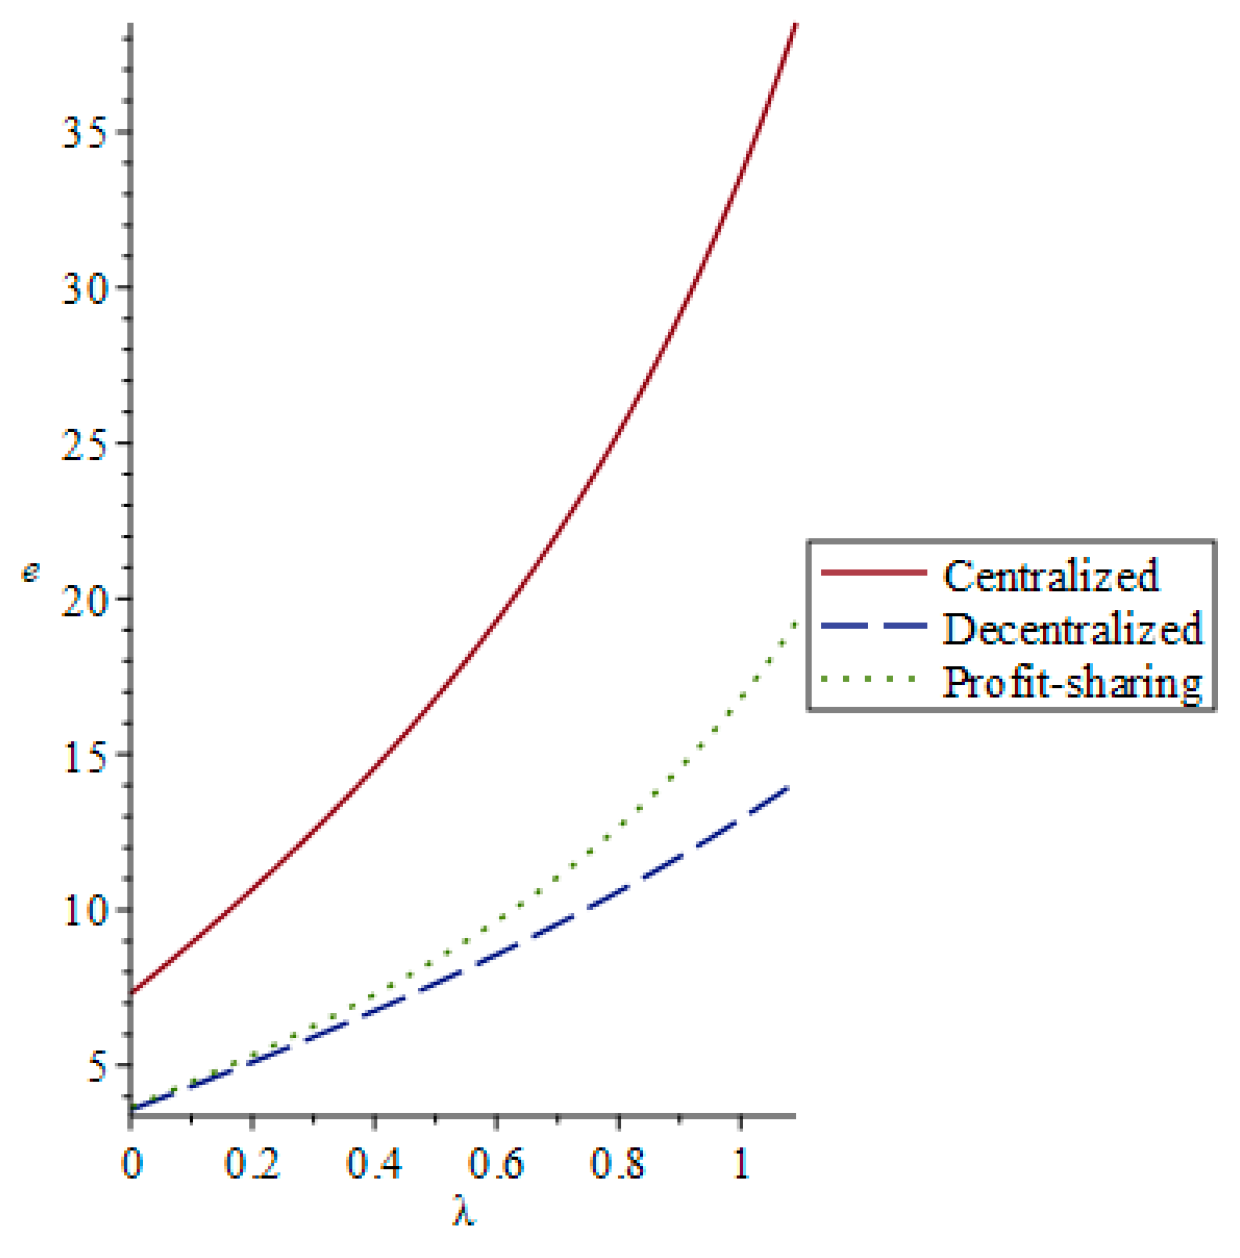
First, we analyzed the influence of the manufacturer’s environmental preference on the product’s greening level under three models: centralized decision making, decentralized decision making, and a revenue-sharing contract. As seen in Figure 1, the product greening level increased with the manufacturer’s environmental preference: . It could be concluded that the product’s greening level was the highest in centralized decision-making and the lowest in decentralized decision-making.
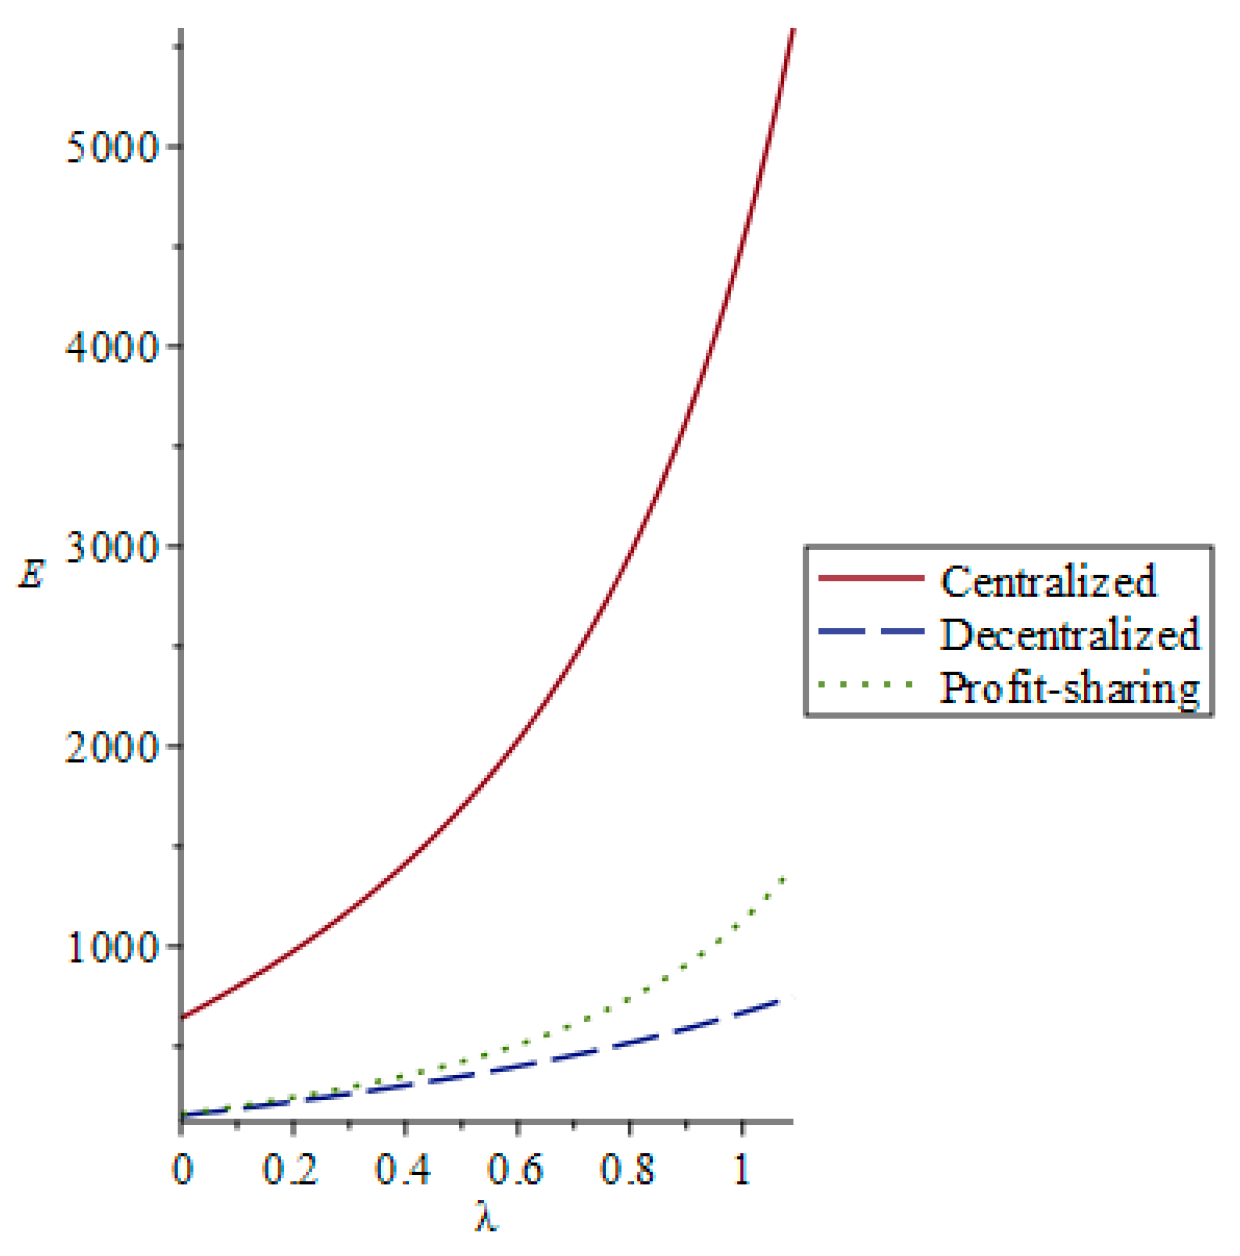
Second, we analyzed the influence of the manufacturer’s environmental preference on environmental benefits under the three models: centralized decision making, decentralized decision making, and a revenue-sharing contract. Figure 2 shows that the environmental benefits increased with the manufacturer’s environmental preference: . It also could be concluded that the environmental benefits were the highest in centralized decision-making and the lowest in decentralized decision-making. In addition, we also found that the revenue-sharing contract could coordinate the environmental benefits objective better, which was consistent with the above conclusion.
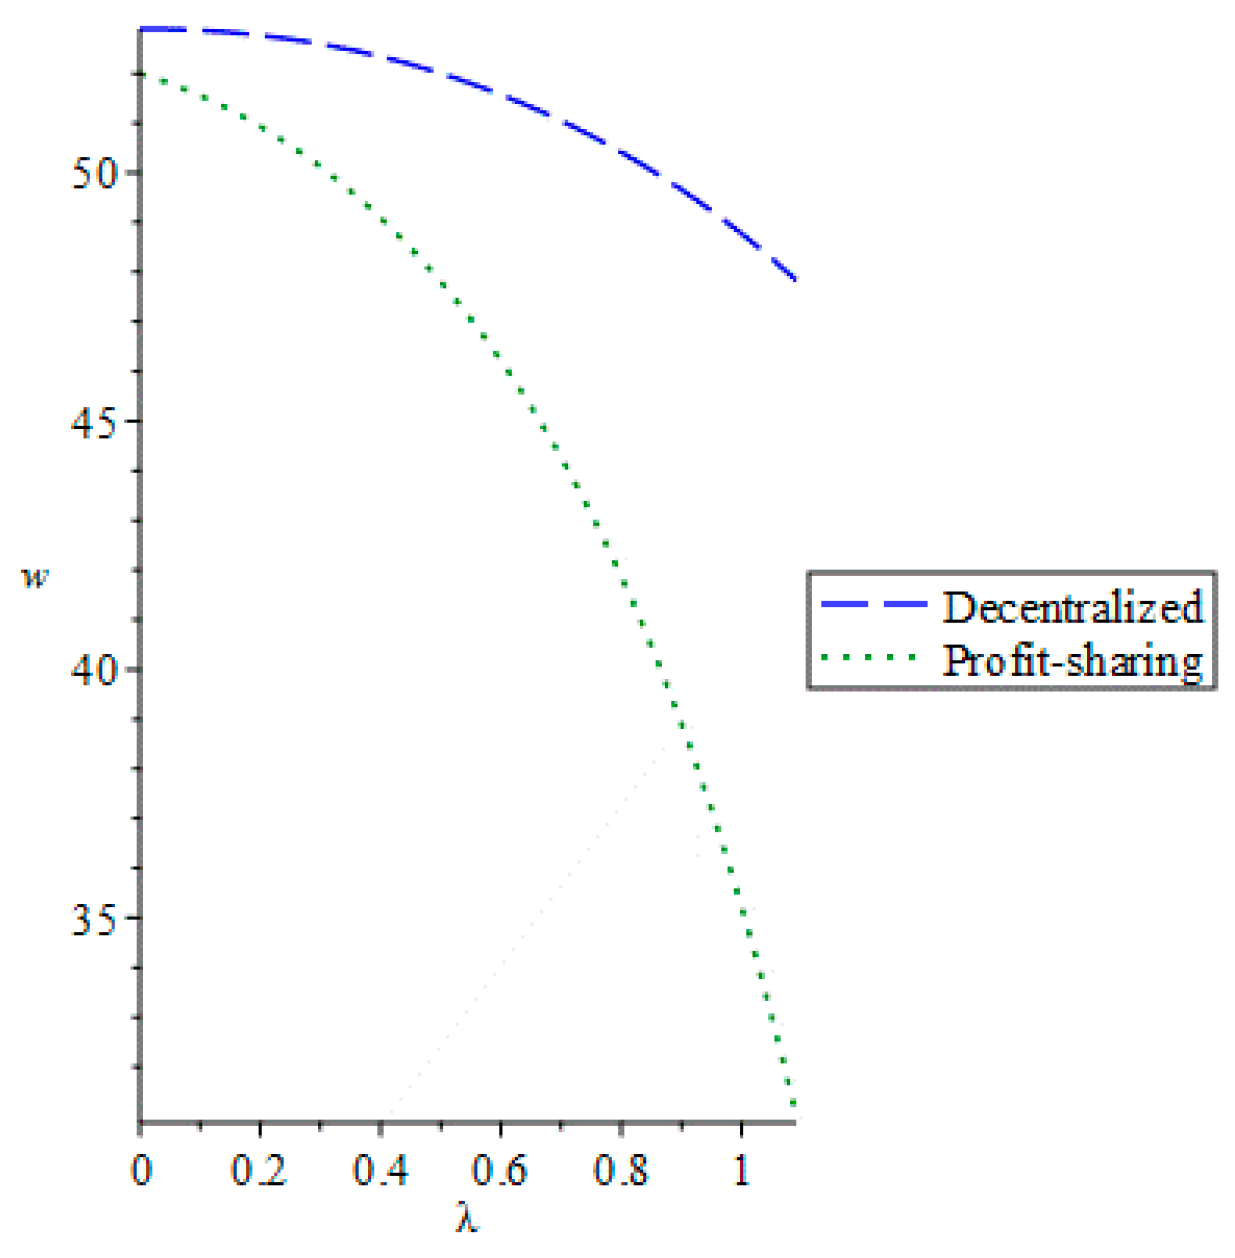
Third, we analyzed the influence of the manufacturer’s environmental preference on the wholesale price under a decentralized decision model and revenue-sharing contract model. Figure 3 shows that the wholesale price decreased with an increase of the manufacturer’s environmental preference, and the wholesale price under decentralized decision-making was higher than that under the revenue-sharing contract. Therefore, the manufacturer could make a profit by reducing the wholesale price under the revenue-sharing contract. Thus, the retailer could experience a higher profit return and coordinate the profit of the entire supply chain.
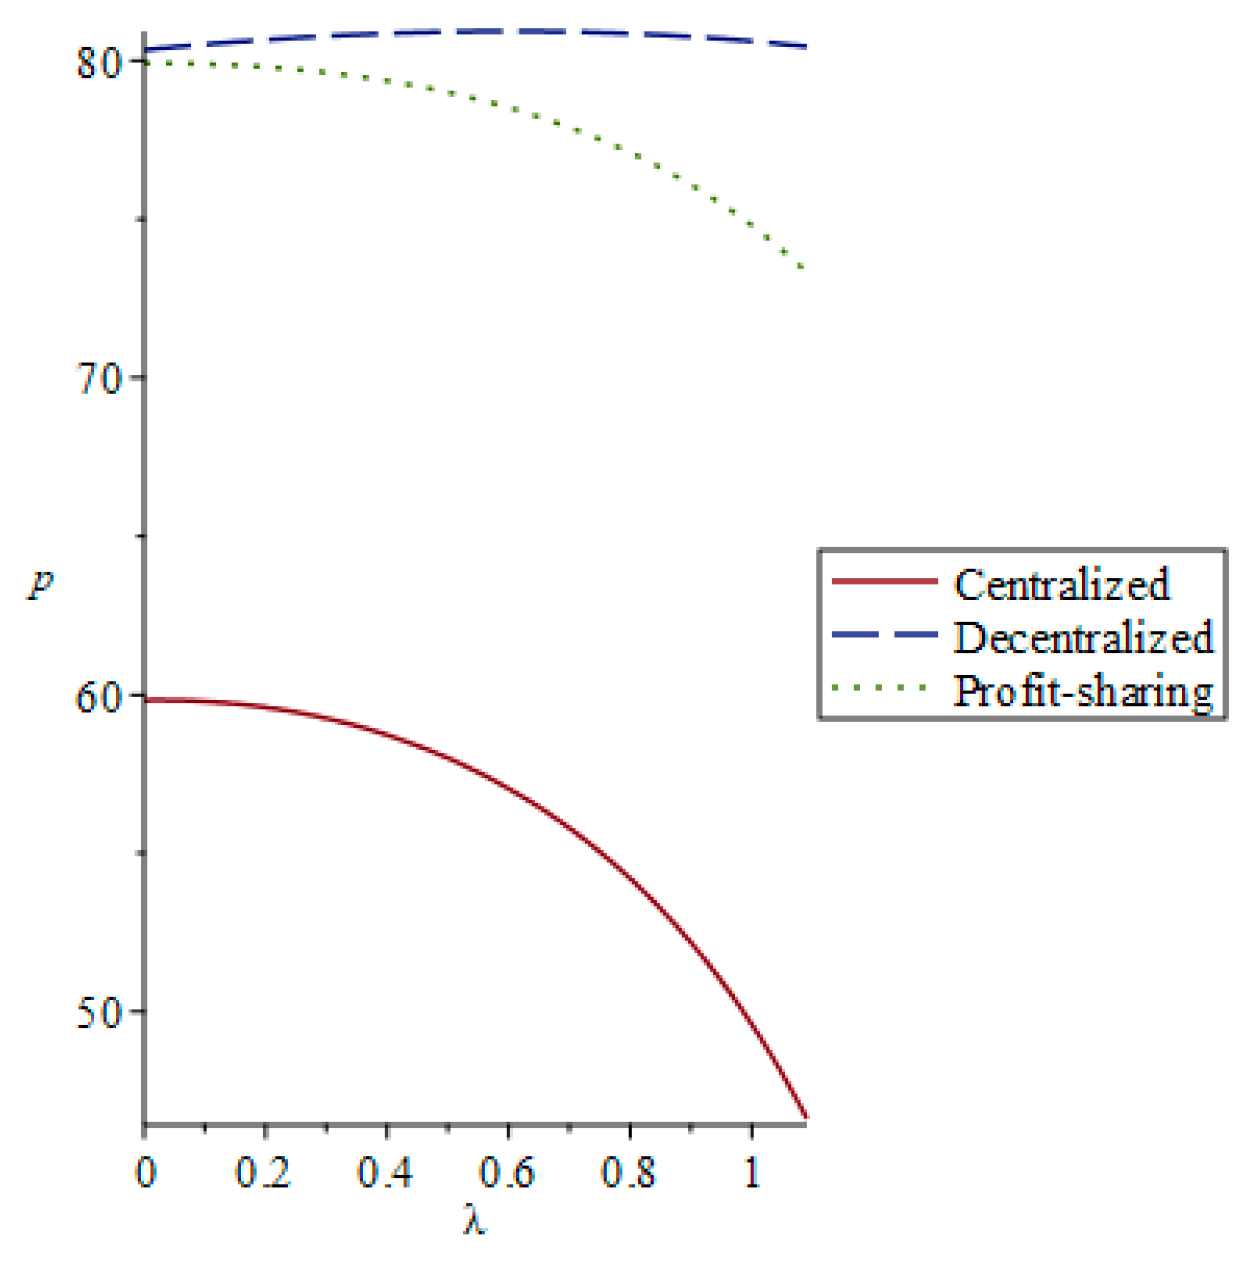
Fourth, we analyzed the influence of the manufacturer’s environmental preference on the retail price under three models: centralized decision making, decentralized decision making, and a revenue-sharing contract. Figure 4 shows that the retail price first increased and then decreased with an increase in the manufacturer’s environmental preference; the increase range was relatively small. Further, comparing the relationship between the three models obtains . Therefore, it could be concluded that the retailer could attract consumers by reducing the retail price when the manufacturer’s environmental preference was high, thereby making a small profit, selling it quickly, and achieving a higher total profit.
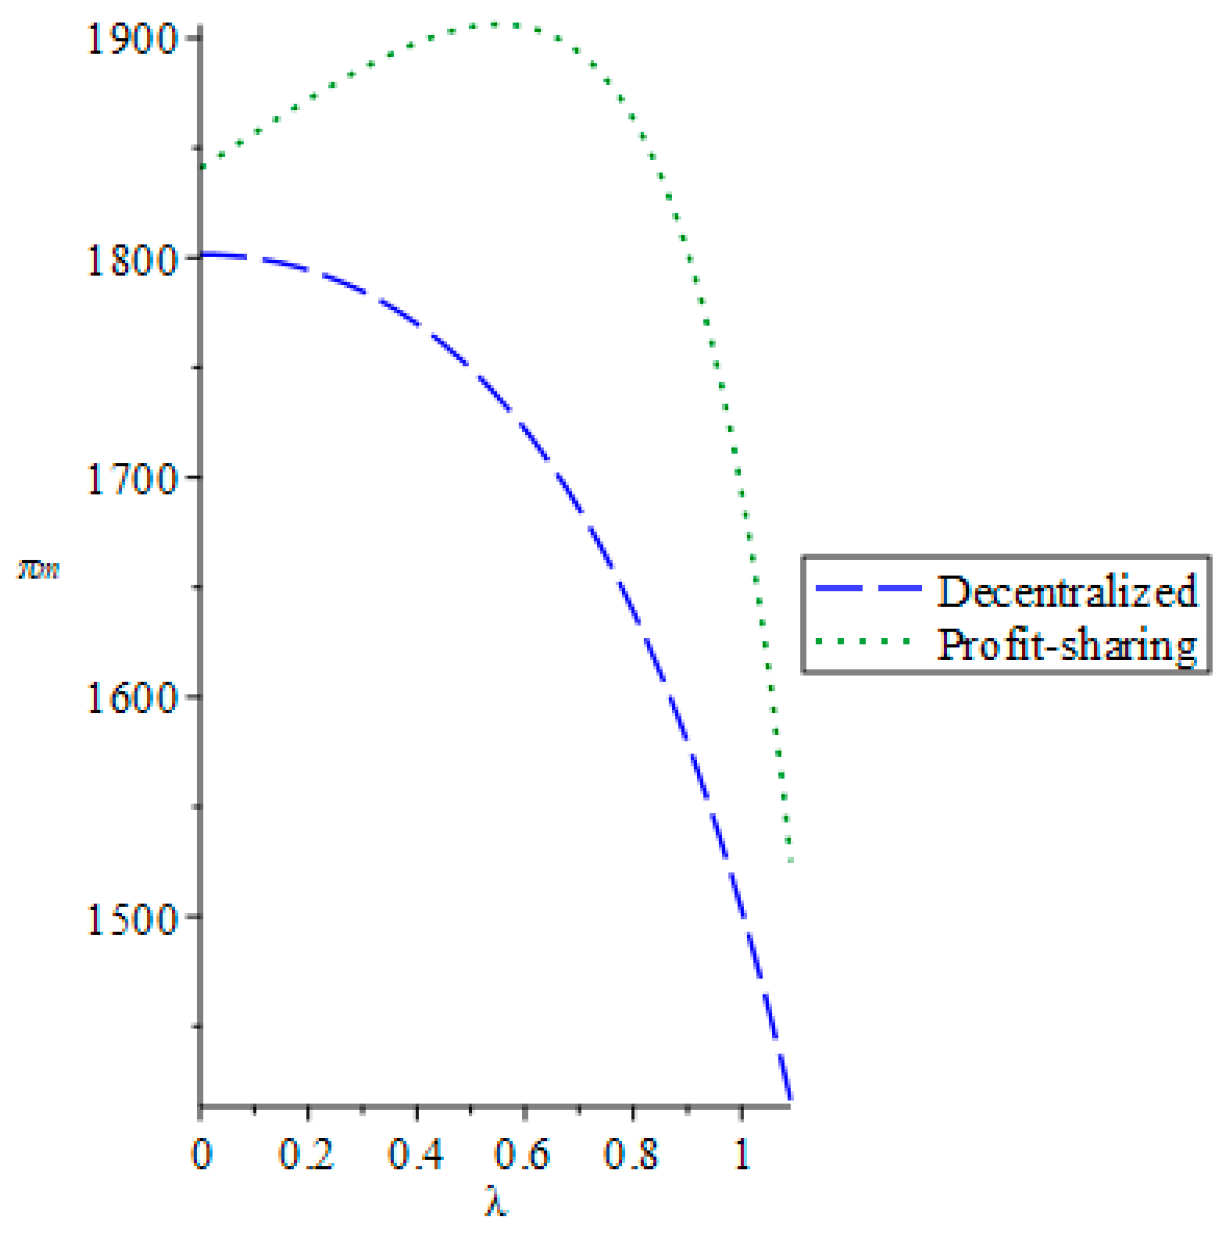
Fifth, we analyzed the influence of the manufacturer’s environmental preference on the manufacturer’s profit under a decentralized decision model and revenue-sharing contract model. Figure 5 shows that when the revenue-sharing contract was coordinated, the manufacturer’s profit first increased and then decreased with an increase of the manufacturer’s environmental preference, while its profit decreased with an increase of the manufacturer’s environmental preference when a decentralized decision was made. In addition, the manufacturer’s profit after coordination was higher. Thus, it could be concluded that the maximum profit existed under the revenue-sharing contract. The manufacturer would be more willing to consider environmental benefits as part of their decision-making goals when this condition was satisfied.
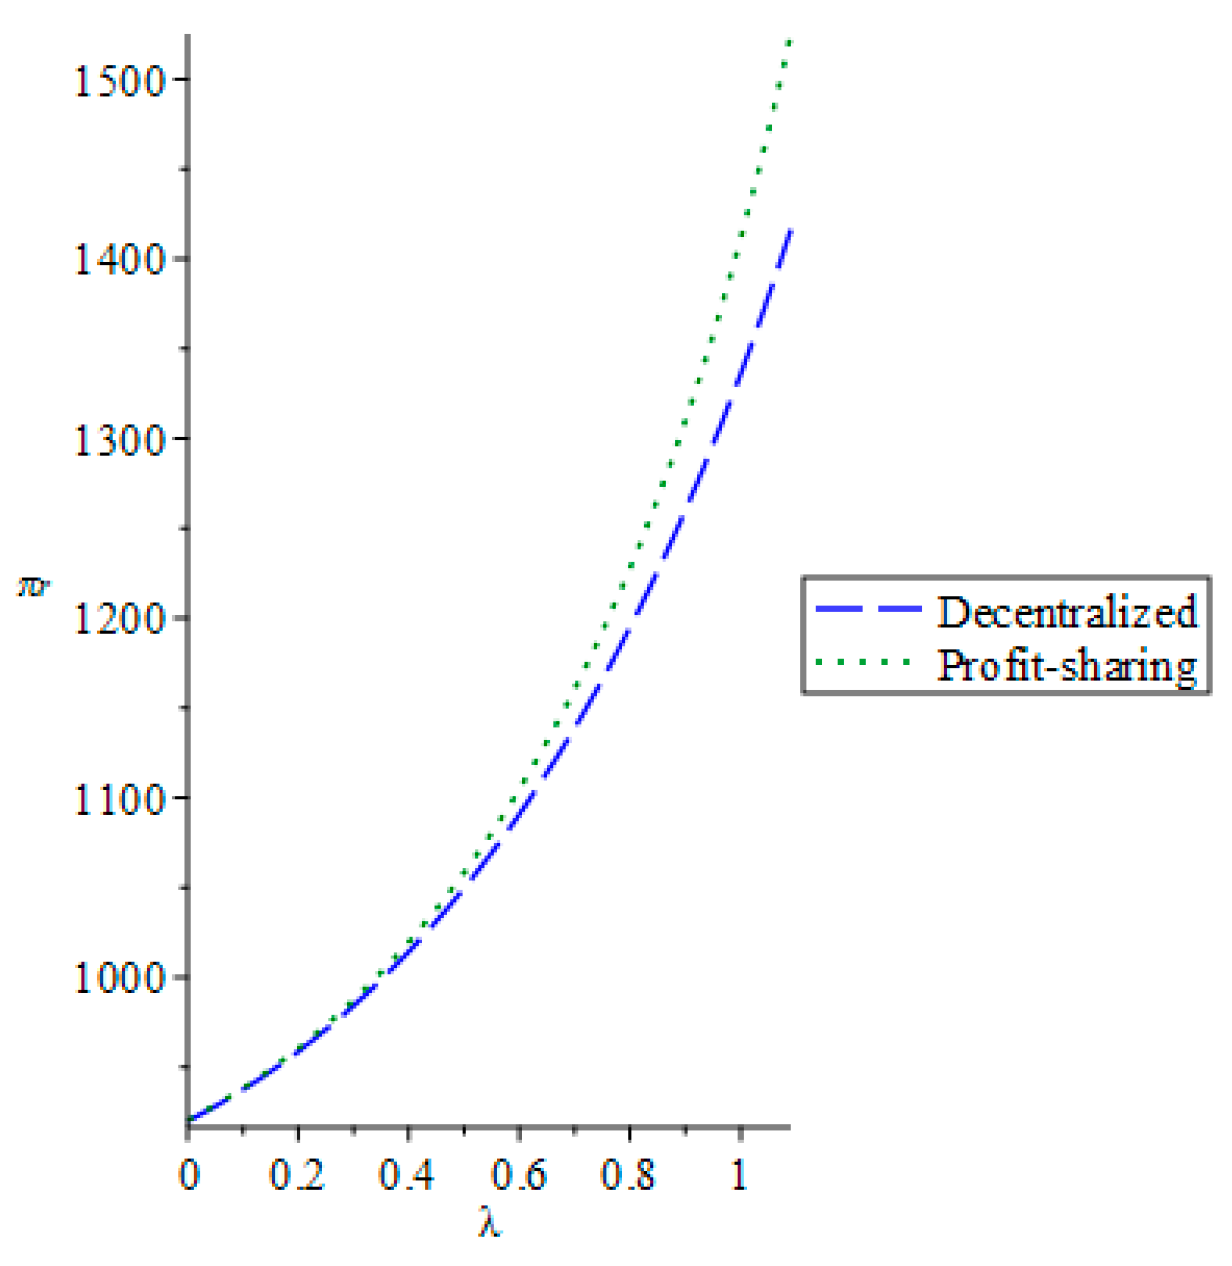
Sixth, we analyzed the influence of the manufacturer’s environmental preference on the retailer’s profit under decentralized decision model and revenue-sharing contract model. As seen in Figure 6, the retailer’s profit increased with an increase in the manufacturer’s environmental preference, and the retailer’s profit after coordination was larger. This result was consistent with the above conclusions. The manufacturer considers the environmental benefits objective to improve a retailer’s profit and achieves optimal coordination of the two sides’ decision-making goals through a revenue-sharing contract.
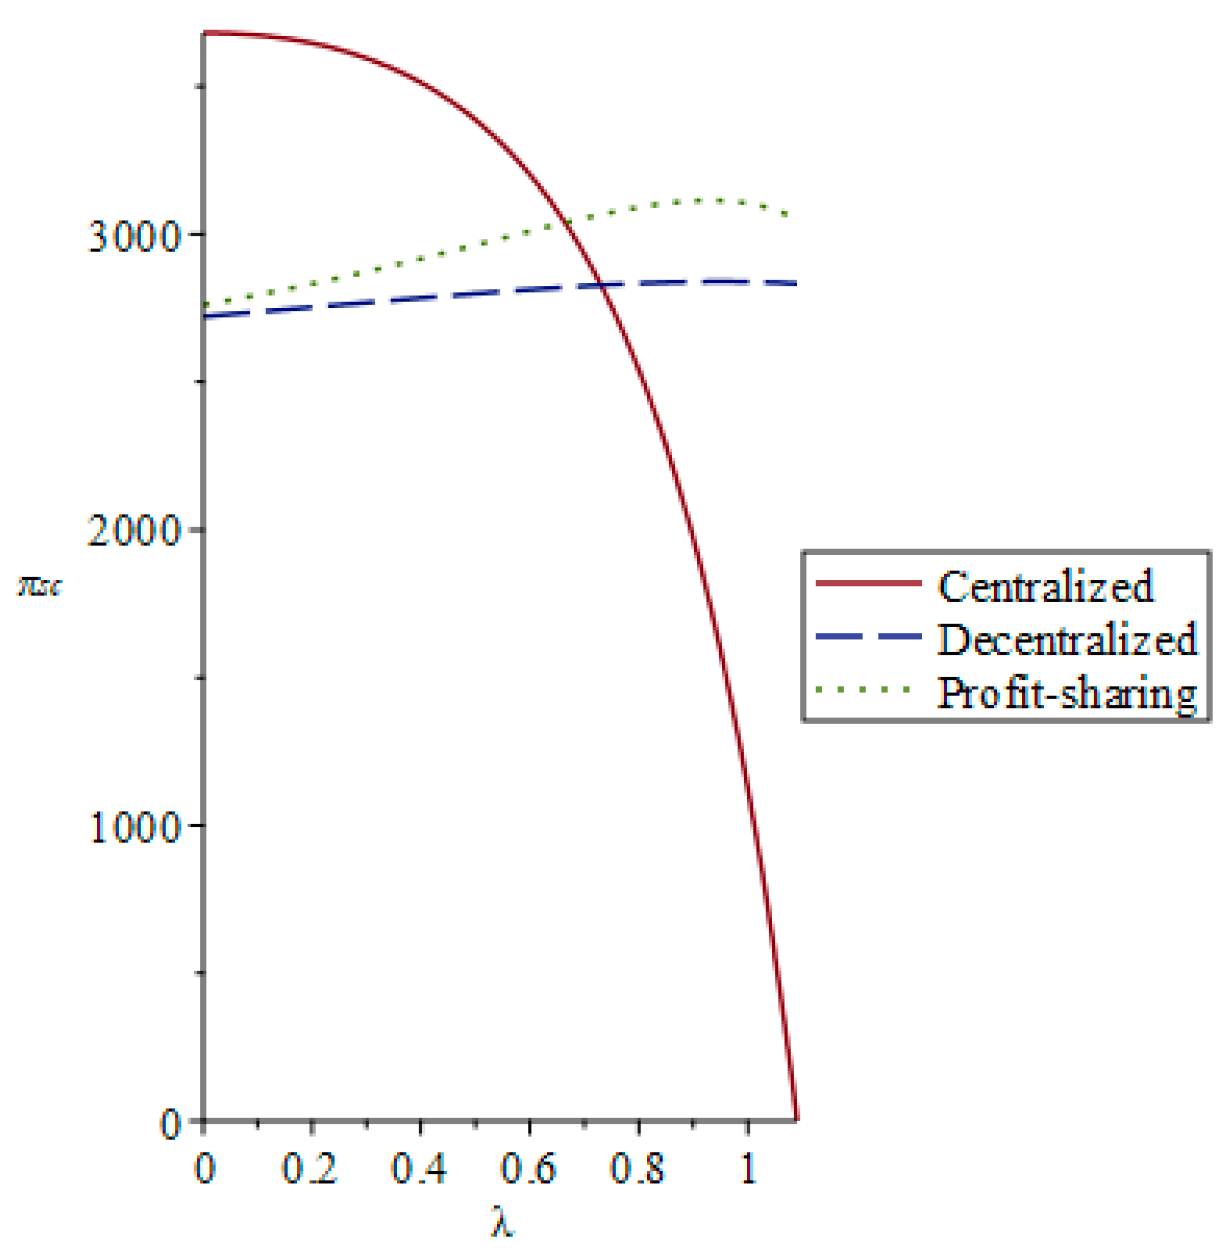
Last, we analyzed the influence of the manufacturer’s environmental preference on the supply chain’s profit under three models: centralized decision making, decentralized decision making, and a revenue-sharing contract. As seen in Figure 7, the supply profit first increased and then decreased with an increase of the manufacturer’s environmental preference when decentralized decision-making was coordinated through a revenue-sharing contract. The supply profit first increased and then decreased with an increase of the manufacturer’s environmental preference in centralized decision-making. In addition, when the manufacturer’s environmental preference was low, and when the manufacturer’s environmental preference was high. Therefore, the manufacturer’s environmental preference could not increase unlimitedly under centralized decision-making, and it could not produce growth of the overall optimal profit, as the high cost of R&D would restrain the enterprises’ green development. For decentralized decision-making and a revenue-sharing contract, the manufacturer that considers environmental benefits appropriately will not only improve the product’s green degree and the enterprise’s environmental benefits but also promote profit growth of the supply chain and facilitate a win–win situation for supply chain profits and social welfare.
9. Conclusions
In order to solve the problem of environmental protection in the current society, this paper discussed the impact of the manufacturer’s consideration of environmental benefits on a green supply chain. Based on multi-objective optimization theory, this study constructed a game model for a supply chain under different structures, under which the manufacturer uses profit and environmental benefits as its decision-making objectives. Furthermore, this study also established a revenue-sharing contract model to achieve double coordination of profit and environmental benefits. Then, the study compared and analyzed the changes of the supply chain members’ optimal decision-making under three different models and provided theoretical reference for enterprises to implement green supply chain management.
The results show that a manufacturer’s consideration of environmental benefits could always enhance the greening level and environmental benefits, which increased with the degree of environmental preference. To improve these environmental benefits, enterprises need to first change their traditional concepts, enhancing the managers’ understanding of environmental protection. In decentralized decision-making, a manufacturer’s consideration of environmental benefits would increase the retailer’s profit and decrease the manufacturer’s profit; the entire supply chain’s profit would increase first and then decrease. After considering environmental benefit, the double marginal benefit was more obvious. Retailers should not only focus on improving their own profits but also on promoting the overall performance of the green supply chain and maintaining the environmental benefits of a stable supply chain. In these circumstances, implementing a green supply chain and establishing cooperation among upstream manufacturers and downstream retailers are needed for supply chain enterprises to further develop.
Under a revenue-sharing contract, the greening level, environmental benefits, as well as the manufacturer’s and retailer’s profits would all increase. Moreover, the manufacturer’s profit had its maximum value in the range. This means that manufacturers and retailers were always willing to accept this contract, and the supply chain achieved double coordination of profit and environmental benefits. Under the premise of consumers’ green preference, the profit of the supply chain and the natural environment were not contradictory; they could develop in coordination. An appropriate coordination strategy could not only improve the degree of environmental protection but also promote an increase of the profit and facilitate the double optimization of the supply chain. The above conclusion provides a theoretical basis for enterprises to implement green sustainable development, thereby driving upstream and downstream members of the supply chain to cooperate in implementing green supply chain management.
In order to further promote coordinated cooperation between upstream and downstream enterprises and strengthen the sustainable development of the green supply chain, several aspects must improve. To illustrate, supply chain members should change the idea that most green supply chains completely depend on manufacturers to research and design products. A few retailers should start to innovate green products, while the government and society could give enterprises appropriate financial support to promote the development of green products. Furthermore, because an effective contract coordination mechanism is based on a high quality of information sharing, the members of a green supply chain should strengthen their information construction and improve their information sharing level. The information sharing in a green supply chain will effectively promote division and cooperation, further promoting the green transformation of enterprises.
This paper established a theoretical basis for supply chain enterprises to actively implement green sustainable development and provided a decision-making reference for manufacturers and retailers for product pricing and greening level. Although our study offered several innovations, there were still a few shortcomings and deficiencies remaining. For example, this study only considered green supply chain management based on a manufacturer’s concerns about environmental benefits. The retailer’s part in leading the implementation of green management was not considered and ignored the driving role of the government in the process of enterprises’ green transformations. Future research should focus on this issue and try to resolve the problem.
Author Contributions
conceptualization, L.J., J.S. and J.J.; methodology, L.J. and Y.G.; formal analysis, Y.G. and L.J.; supervision, J.J.; project administration, J.J.; writing—original draft preparation, Y.G. and Y.A.; writing—review and editing, J.J., J.S. and L.J.
Funding
This research was funded by the National Social Science Foundation of China (15BGL204), the Humanity and Social Science Research Project of Chongqing Education Committee (17SKG058), and the Scientific and Technological Research Program of Chongqing Municipal Education Commission (KJQN201900606).
Conflicts of Interest
The authors declare no conflict of interest.
References
- Ahi, P.; Searcy, C. A comparative literature analysis of definitions for green and sustainable supply chain management. J. Clean. Prod. 2013, 52, 329–341. [Google Scholar] [CrossRef]
- de Oliveira, U.R.; Espindola, L.S.; Da Silva, I.R.; Da Silva, I.N.; Rocha, H.M. A systematic literature review on green supply chain management: Research implications and future perspectives. J. Clean. Prod. 2018, 187, 537–561. [Google Scholar] [CrossRef]
- Xu, L.; Mathiyazhagan, K.; Govindan, K.; Haq, A.N.; Ramachandran, N.V.; Ashokkumar, A. Multiple comparative studies of Green supply chain management: Pressures analysis. Resour. Conserv. Recycl. 2013, 78, 26–35. [Google Scholar] [CrossRef]
- Luthra, S.; Garg, D.; Haleem, A. The impacts of critical success factors for implementing green supply chain management towards sustainability: An empirical investigation of Indian automobile industry. J. Clean. Prod. 2016, 121, 145–158. [Google Scholar] [CrossRef]
- Yang, J.; Su, J.; Song, L. Selection of Manufacturing Enterprise Innovation Design Project Based on Consumer’s Green Preferences. Sustainability 2019, 11, 1375. [Google Scholar] [CrossRef]
- Su, J.F.; Li, C.; Zeng, Q.J.; Yang, J.; Zhang, J. A Green Closed-Loop Supply Chain Coordination Mechanism Based on Third-Party Recycling. Sustainability 2019, 11, 5335. [Google Scholar] [CrossRef]
- Seuring, S.; Müller, M. From a literature review to a conceptual framework for sustainable supply chain management. J. Clean. Prod. 2008, 16, 16,1699–1710. [Google Scholar] [CrossRef]
- Ferri, L.M.; Pedrini, M. Socially and environmentally responsible purchasing: Comparing the impacts on buying firm’s financial performance, competitiveness and risk. J. Clean. Prod. 2018, 174, 880–888. [Google Scholar] [CrossRef]
- Su, J.F.; Yu, Y.; Tao, Y. Measuring knowledge diffusion efficiency in R&D network. Knowl. Manag. Res. Pract. 2018, 16, 208–219. [Google Scholar]
- Jiang, L.; Zhang, Y.Y.; Jian, J. Decision models for supply chain with two competing manufactures considering different fairness concern reference points. Comput. Integr. Manuf. Syst. 2019, 25, 224–234. [Google Scholar]
- Lou, G.X.; Xia, H.Y.; Zhang, J.Q.; Fan, T.J. Investment Strategy of Emission-Reduction Technology in a Supply Chain. Sustainability 2015, 7, 10684–10708. [Google Scholar] [CrossRef] [Green Version]
- Bai, Y.; Sun, Z.; Zeng, B.J.; Long, J.; Li, L.; de Oliveira, J.V.; Li, C. A comparison of dimension reduction techniques for support vector machine modeling of multi-parameter manufacturing quality prediction. J. Intell. Manuf. 2019, 30, 2245–2256. [Google Scholar] [CrossRef]
- Yeh, W.C.; Chuang, M.C. Using multi-objective genetic algorithm for partner selection in green supply chain problems. Expert. Syst. Appl. 2011, 38, 4244–4253. [Google Scholar] [CrossRef]
- Su, J.F.; Li, C.; Tsai, S.B.; Lu, H.; Liu, A.J.; Chen, Q. A Sustainable Closed-Loop Supply Chain Decision Mechanism in the Electronic Sector. Sustainability 2018, 10, 1295. [Google Scholar] [CrossRef]
- Soleimani, H.; Govindan, K.; Saghafi, H.; Jafari, H. Fuzzy multi-objective sustainable and green closed-loop supply chain network design. Comput. Ind. Eng. 2017, 109, 191–203. [Google Scholar] [CrossRef]
- Lu, L.Y.; Wu, C.H.; Kuo, T.C. Environmental principles applicable to green supplier evaluation by using multi-objective decision analysis. Int. J. Prod. 2007, 45, 18–19. [Google Scholar] [CrossRef]
- Long, J.Y.; Sun, Z.Z.; Panos, M.; Ying, H.; Zhang, S.H.; Li, C. A hybrid multi-objective genetic local search algorithm for the prize-collecting vehicle routing problem. Inform. Sci. 2019, 478, 40–61. [Google Scholar]
- Srivastava, S.K. Green supply-chain management: A state-of-the-art literature review. Int. J. Manag. Rev. 2007, 9, 53–80. [Google Scholar] [CrossRef]
- Tian, Y.H.; Govindan, K.; Zhu, Q.H. A system dynamics model based on evolutionary game theory for green supply chain management diffusion among Chinese manufacturers. J. Clean. Prod. 2014, 80, 96–105. [Google Scholar] [CrossRef]
- Wei, F.; Liu, S.F.; Yin, L.J.; Li, W.Z.; Yu, Z.Y. Research on performance evaluation system for green supply chain management based on the context of recycled economy-taking Guangxi’s manufacturing industry as example. J. Grey Syst. 2014, 26, 177–187. [Google Scholar]
- Mirhedayatian, S.M.; Azadi, M.; Saen, R.F. A novel network data envelopment analysis model for evaluating green supply chain management. Int. J. Prod. Econ. 2014, 147, 544–554. [Google Scholar] [CrossRef]
- Perotti, S.; Zorzini, M.; Cagno, E.; Micheli, G.J. Green supply chain practices and company performance: The case of 3PLs in Italy. Int. J. Phys. Distrib. Logist. Manag. 2012, 42, 640–672. [Google Scholar] [CrossRef]
- Govindan, K.; Khodaverdi, R.; Vafadarnikjoo, A. Intuitionistic fuzzy based DEMATEL method for developing green practices and performances in a green supply chain. Expert Syst. Appl. 2015, 42, 7207–7220. [Google Scholar] [CrossRef]
- Pelton, R.E.O.; Smith, T.M. Hotspot scenario analysis: Comparative streamlined LCA approaches for green supply chain and procurement decision making. J. Ind. Ecol. 2015, 19, 427–440. [Google Scholar] [CrossRef]
- Savino, M.M.; Manzini, R.; Mazza, A. Environmental and economic assessment of fresh fruit supply chain through value chain analysis. a case study in chestnuts industry. Prod. Plan. Control 2015, 26, 1–18. [Google Scholar] [CrossRef]
- Bhardwaj, B.R. Role of green policy on sustainable supply chain management: A model for implementing corporate social responsibility (CSR). Benchmarking 2016, 23, 456–468. [Google Scholar] [CrossRef]
- Wu, C.; Barnes, D. Partner selection in green supply chains using PSO—A practical approach. Prod. Plan. Control 2016, 27, 1041–1061. [Google Scholar] [CrossRef]
- Beske-Janssen, P.; Johnson, M.P.; Schaltegger, S. 20 years of performance measurement in sustainable supply chain management–what has been achieved. Supply Chain Manag. Int. J. 2015, 20, 664–680. [Google Scholar] [CrossRef]
- Sancha, C.; Gimenez, C.; Sierra, V. Achieving a socially responsible supply chain through assessment and collaboration. J. Clean. Prod. 2016, 112, 1934–1947. [Google Scholar] [CrossRef]
- Song, H.H.; Gao, X.X. Green supply chain game model and analysis under revenue-sharing contract. J. Clean. Prod. 2017, 170, 183–192. [Google Scholar] [CrossRef]
- Ghosh, D.; Shah, J. A comparative analysis of greening policies across supply chain structures. Int. J. Prod. Econ. 2012, 135, 568–583. [Google Scholar] [CrossRef]
- Zhang, C.T.; Liu, L.P. Research on coordination mechanism in three-level green supply chain under non-cooperative game. Appl. Math. Model. 2013, 37, 3369–3379. [Google Scholar] [CrossRef]
- Tian, Y.H.; Zhu, Q.H. Game model for diffusion of green supply chain management based on price subsidies of government. J. Syst. Eng. 2016, 31, 526–535. [Google Scholar]
- Guan, Z.M.; Qu, B.; Ye, T.; Bai, C.Y. Impact of consumers’ perceptual biases on green innovation-advertisement strategies in supply chain. Comput. Integr. Manuf. Syst. 2019, 25, 480–490. [Google Scholar]
- Shi, P.; Yan, B.; Shi, S. Pricing and product green degree decisions in green supply chains with fairness concerns. Syst. Eng.-Theory Pract. 2016, 36, 1937–1950. [Google Scholar]
- Jiang, S.Y.; Li, S.C. Green supply chain game models and revenue sharing contract with product green degree. Chin. J. Manag. Sci. 2015, 23, 169–176. [Google Scholar]
- Zhang, H.; Huang, J.M.; Cui, Y.Y. Game models and contract of green supply chain considering fairness preference and government subsidies. J. Ind. Tech. Econ. 2018, 37, 111–121. [Google Scholar]
- Lin, Z.B.; Chen, M.F. Research on green manufacturing strategy and supply chain coordination with corporate social responsibility perspective. Comput. Integr. Manuf. Syst. 2019, 1–16. Available online: http://kns.cnki.net/kcms/detail/11.5946.tp.20190426.1326.022.html (accessed on 29 April 2019).
- Wang, Y.; Wang, Z.; Li, B.Y.; Liu, Z.; Zhu, X.D.; Wang, Q.X. Closed-loop supply chain models with product recovery and donation. J. Clean. Prod. 2019, 227, 861–876. [Google Scholar] [CrossRef]
- Wang, F.; Lai, X.; Shi, N. A multi-objective optimization for green supply chain network design. Decis. Support Syst. 2011, 51, 262–269. [Google Scholar] [CrossRef]
- Gao, J.H.; Wang, R.; Wang, H.Y. Closed-loop supply chain network design under carbon subsidies. Comput. Integr. Manuf. Syst. 2015, 21, 3033–3040. [Google Scholar]
- Li, J.; Zhu, D.L. Multi-objective programming model and algorithm for low-carbon closed-loop supply chain network design under fuzzy environment. Comput. Integr. Manuf. Syst. 2018, 24, 494–504. [Google Scholar]
- Chen, W.T.; Hu, Z.H.; Yu, C. Green supply chain model with premium and penalty mechanism under different government goals. Control Decis. 2019, 1–12. [Google Scholar] [CrossRef]
- Ghosh, D.; Shah, J. Supply chain analysis under green sensitive consumer demand and cost sharing contract. Int. J. Prod. Econ 2015, 164, 319–329. [Google Scholar] [CrossRef]
- Zhao, J.; Wei, J. The coordinating contracts for a fuzzy supply chain with effort and price dependent demand. Appl. Math. Model. 2014, 38, 2476–2489. [Google Scholar] [CrossRef]
- Shang, W.F.; Chen, Y.Y. Research on green supply chain strategy based on consumer environmental awareness. J. Ind. Tech. Econ. 2018, 37, 103–108. [Google Scholar]
- Montagnini, F.; Nair, P.K.R. Carbon sequestration: An underexploited environmental benefit of agroforestry systems. Agrofor. Syst. 2004, 281, 61–62. [Google Scholar]
- Ha, A.Y.; Tian, Q.; Tong, S. Information sharing in competing supply chains with production cost reduction. M. SOM-Manuf. Serv. Oper. Manag. 2017, 19, 246–262. [Google Scholar] [CrossRef]
- Yu, W.; Han, R. Coordinating a two-echelon supply chain under carbon tax. Sustainability 2017, 9, 2360. [Google Scholar] [CrossRef]
- Cheng, F.X.; Shao, S.L.; Xu, L.F.; Sun, L.C. Optimal strategy of government subsidized initiative carbon reduction. Chin. Popul. Resour. Environ. 2015, 25, 32–39. [Google Scholar]
- Marler, R.T.; Arora, J.S. The weighted sum method for multi-objective optimization: New insights. Struct. Multidiscip. Optim. 2010, 41, 853–862. [Google Scholar] [CrossRef]
- Waas, T.; Hugé, J.; Block, T.; Wright, T.; Benitez-Capistros, F.; Verbruggen, A. Sustainability assessment and indicators: Tools in a decision-making strategy for sustainable development. Sustainability 2014, 6, 5512–5534. [Google Scholar] [CrossRef]
- Stanimirovic, I.P.; Zlatanovic, M.L.; Petkovic, M.D. On the linear weighted sum method for multi-objective optimization. Facta Acta Univ. 2011, 26, 49–63. [Google Scholar]
- Du, S.; Hu, L.; Wang, L. Low-carbon supply policies and supply chain performance with carbon concerned demand. Ann. Oper. Res. 2017, 255, 569–590. [Google Scholar] [CrossRef]
- Madani, S.R.; Rasti-Barzoki, M. Sustainable supply chain management with pricing, greening and governmental tariffs determining strategies: A game-theoretic approach. Comput. Ind. Eng. 2017, 105, 287–298. [Google Scholar] [CrossRef]
- Wen, X.Q.; Cheng, H.F.; Cai, J.H.; Lu, C. Government subside policies and effect analysis in green supply chain. Chin. J. Manag. 2018, 15, 625–632. [Google Scholar]
- Zhang, N.; Jian, J.; Su, J.F. Dual hesitant fuzzy linguistic power-average operators based on archimedean t-conorms and t-norms. IEEE Access. 2019, 7, 40602–40624. [Google Scholar] [CrossRef]
- Bernstein, F.; Federgruen, A. Decentralized supply chains with competing retailers under demand uncertainty. Manag. Sci. 2005, 51, 18–29. [Google Scholar] [CrossRef]
- Leng, M.; Parlar, M. Lead-time reduction in a two-level supply chain: Non-cooperative equilibria vs. coordination with a revenue-sharing contract. Int. J. Prod. Econ. 2009, 118, 521–544. [Google Scholar] [CrossRef]
- Wang, W.B.; Ding, J.F.; Da, Q.L. Cost-profit sharing contract for a closed-loop supply chain under reward-penalty mechanism. Control Decis. 2019, 34, 843–850. [Google Scholar]
Figure 1.
Product greening level vs. .

Figure 2.
Environmental benefits vs. .

Figure 3.
Wholesale price vs. .

Figure 4.
Retail price vs. .

Figure 5.
Manufacturer’s profit vs. .

Figure 6.
Retailer’s profit vs. .

Figure 7.
Supply chain’s profit vs. .


Table 1.
Parameters and their meanings.
| Parameter | Meaning | Parameter | Meaning |
|---|---|---|---|
| The total market potential | The environmental benefits | ||
| Consumer sensitivity to retail price | Consumer sensitivity to greening level | ||
| The greening level of products | The green investment parameter | ||
| The wholesale price | The cost of R&D investment | ||
| The retail price | The environmental preference | ||
| The cost of producing products | The cost of selling products |
Table 2.
Comparison table of the three models.
| Centralized Decision Model | Decentralized Decision Model | Revenue-Sharing Contract Model | |
|---|---|---|---|
© 2019 by the authors. Licensee MDPI, Basel, Switzerland. This article is an open access article distributed under the terms and conditions of the Creative Commons Attribution (CC BY) license (http://creativecommons.org/licenses/by/4.0/).
Share and Cite
MDPI and ACS Style
Jian, J.; Guo, Y.; Jiang, L.; An, Y.; Su, J. A Multi-Objective Optimization Model for Green Supply Chain Considering Environmental Benefits. Sustainability 2019, 11, 5911. https://doi.org/10.3390/su11215911
AMA Style
Jian J, Guo Y, Jiang L, An Y, Su J. A Multi-Objective Optimization Model for Green Supply Chain Considering Environmental Benefits. Sustainability. 2019; 11(21):5911. https://doi.org/10.3390/su11215911
Chicago/Turabian StyleJian, Jie, Yu Guo, Lin Jiang, Yanyan An, and Jiafu Su. 2019. "A Multi-Objective Optimization Model for Green Supply Chain Considering Environmental Benefits" Sustainability 11, no. 21: 5911. https://doi.org/10.3390/su11215911
Note that from the first issue of 2016, this journal uses article numbers instead of page numbers. See further details here.