Real-Time Pedestrian Flow Analysis Using Networked Sensors for a Smart Subway System


1
Graduate School of Information, Yonsei University, 50, Yonsei-ro, Seodaemun-gu, Seoul 03722, Korea
2
Division of Computer Science and Engineering, Sunmoon University, 70, Sunmoon-ro221beon-gil, Tangjeong-myeon, Asan-si, Chungcheongnam-do 31460, Korea
*
Author to whom correspondence should be addressed.
Sustainability 2019, 11(23), 6560; https://doi.org/10.3390/su11236560
Submission received: 28 September 2019
/
Revised: 13 November 2019
/
Accepted: 15 November 2019
/
Published: 20 November 2019
(This article belongs to the Special Issue Spatial Analysis and Geographic Information Systems)
Abstract
:The application of smart city technologies requires new data analysis methods to interpret the voluminous data collected. In this study, we first analyzed the transfer behavior of subway pedestrians using the fingerprinting technique using data collected by more than 100 MAC (Media Access Control) ID sensors installed in a congested subway station serving two subway lines. We then developed a model that employs an AI (Artificial Intelligence)-based methodology, the cumulative visibility of moving objects (CVMO), to present the data in such a manner that it could be used to address pedestrian flow issues in this real-world implementation of smart city technology. The MAC ID location data collected during a three-month monitoring period were mapped using the fingerprinting wireless location sensing method to display the congestion situation in real time. Furthermore we developed a model that can inform immediate response to identified conditions. In addition, we formulated several schemes for disbursing congestion and improving pedestrian flow using behavioral economics, and then confirmed their effectiveness in a follow-up monitoring period. The proposed pedestrian flow analysis method cannot only solve pedestrian congestion, but can also help to prevent accidents and maintain public order.
1. Introduction
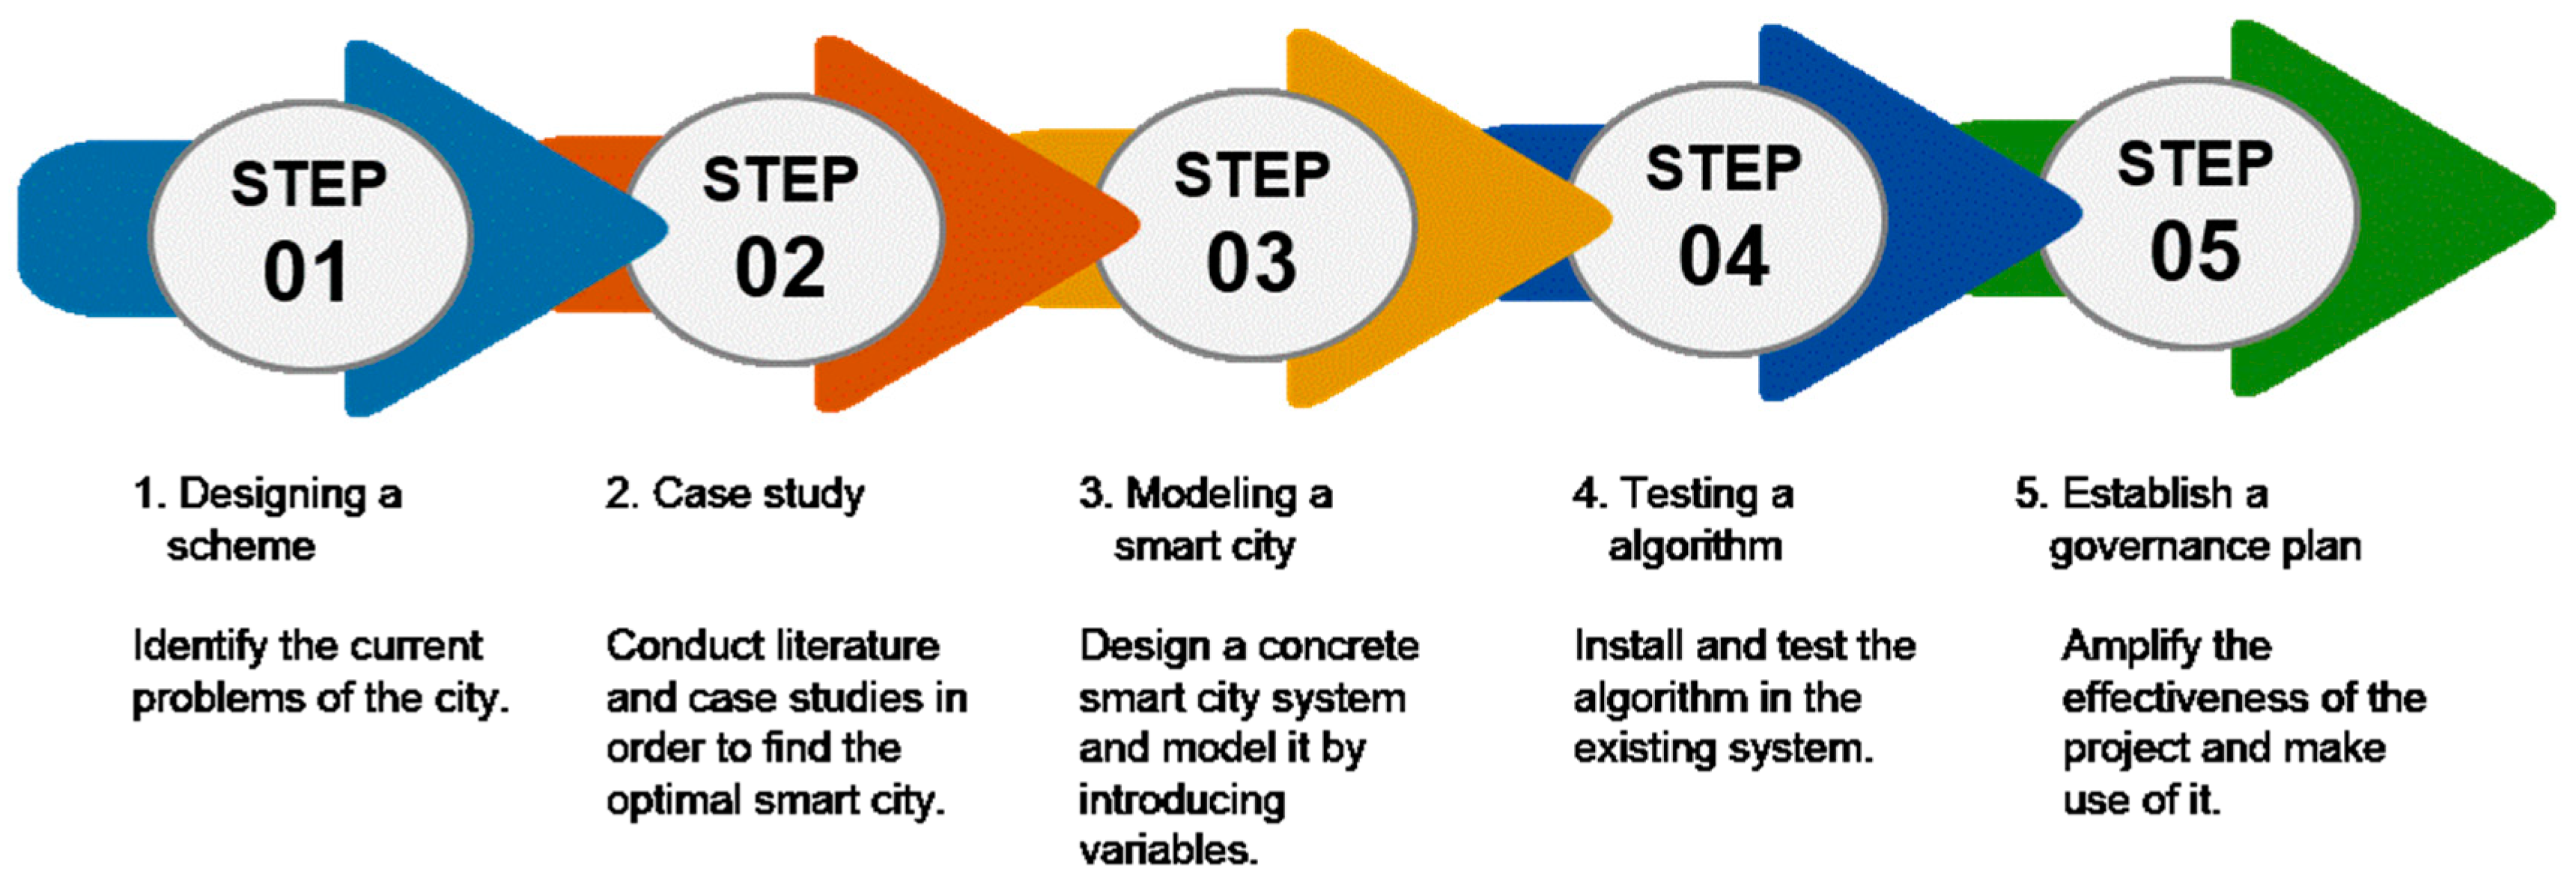
A smart city is a comprehensive combination of smart services that exploits information and communications technology (ICT), the internet of things (IoT), and artificial intelligence (AI) to secure and enrich the urban living environment in sectors such as traffic and energy usage [1]. The smart city concept has been studied from the perspective of various fields, including optimization of transportation and logistics, energy and waste management, personal security, social disaster management, and, recently, air quality improvement [2]. In order to build a successful smart city, it is important to solve the urban problems specific to each city. Although this means that each solution may be unique to each implementation, most smart city projects can be generally divided into the five stages depicted in Figure 1. First, during the scheme design stage, the current problems of the city need to be identified and a consensus regarding prioritization reached. Second, literature review and case studies must be conducted to find the optimal smart city solutions for the identified urban problems. Third, a concrete smart city system should be designed and modeled by introducing variables. Fourth, to actually apply the planned system, instrumentation must be installed to test the algorithm in a field environment. Finally, to amplify the effectiveness of the project and optimally exploit it, a governance plan should be established and public relations activities conducted [3].
The existing approach to urban improvement policy has solved many problems of the city by investing considerable financial resources over the long term to expand manpower input or infrastructure. The smart city, however, strives to strategically assign the necessary resources to the right place and utilize them efficiently by collecting and analyzing information from all over the city based on IoT, creating models, and encouraging citizen participation in an otherwise autonomous environment. Many researchers have used sensors to collect urban information and have analyzed the collected data to find ways to address current urban issues. In recent years, as mobile devices equipped with small sensors have become widespread, various location-based services (LBS) have emerged that are of considerable value to smart city efforts.
LBS is a software application that uses a specific device to determine its exact location, giving users some sort of access to online services and streaming data. Whereas LBS is a software-level service, there are two practical and representative techniques for locating users specifically, the GNSS (global navigation satellite system) and the IPS (indoor positioning system). Of the two, GNSS is the standard generic term for satellite navigation systems that provide autonomous geo-spatial positioning with global coverage. The advantage to having access to multiple satellites is accuracy, integrity, continuity, and availability at all times. The performance of GNSS is assessed using four criteria: accuracy, integrity, continuity, and availability. Accuracy refers to the difference between a receiver’s measured and real position, speed, or time; integrity is a system capacity that can provide confidence thresholds and provide an alarm if there is an abnormality in the location data; continuity is a system’s ability to function without interruption; and availability is the percentage of time a signal fulfils the accuracy, integrity, and continuity criteria [4]. GNSS includes the GPS (global positioning system), GLONASS (global navigation satellite system), Galileo, Beidou, and other regional systems [5]. GPS provides relatively accurate geodesic information within several tens of centimeters of error less than positioning in navigation. GPS is typically applied in vehicle navigation, and is mainly used in outdoor environments. However, various smart projects have recently been conducted in large buildings with complex structures such as subway stations, shopping malls, and hospitals, and the need for an IPS that can be used indoors has been increasingly emphasized [6]. In particular, the pedestrian-oriented location-based service market is rapidly growing. Many studies utilize Wi-Fi, Bluetooth, infrared sensors, beacons, radio-frequency identification (RFID), and visible light to navigate indoor locations. Each provides varying degrees of accuracy and cost due to their technical nature. In particular, radio-frequency (RF) signal-based technologies have shown high accuracy at relatively low cost compared to other technologies. Therefore, in many indoor measurement studies, RF signal-based wireless technologies such as Wi-Fi positioning system (WPS) have been recently used [7]. A WPS utilizes the 2.4 GHz band signal of the IEEE 802.xx standard, and is the most widely used IPS technology at present. It collects and processes indoor wireless access point (AP) data to construct a radio map and determine a user’s location. At present, to achieve this, a wireless measurement algorithm is required, and the fingerprint technique, which compares the constructed radio map data with the radio signal information collected during the measurement process to determine the user’s current location [8], is the most widely used of such algorithms.
In this study, we used the fingerprint technique to determine pedestrian information in a congested subway station and to construct an algorithm that displays this information in such a manner as to inform changes to the station to allow pedestrians to move about in a more secure and functional environment. In conducting this research, we studied the urban problems of transit congestion and established a research basis for the construction of future smart city technologies. The reminder of this paper is organized as follows. Section 2 presents the theoretical background and methodology for conducting the case study project. Section 3 introduces the specific procedures used to design and construct models in this research. Section 4 presents the expected effects of using the new model proposed as a result of our research. Finally, Section 5 discusses the implications and limitations of the current study, and proposes future work that builds upon our findings.
2. Background
2.1. Types of Indoor Positioning Systems (IPS)
The most widely used positioning technologies rely upon GPS or GNSS. However, GPS cannot be used for indoor positioning owing to the radio disturbances caused by the structure. To solve such interference problems, research into IPS methods using wireless local-area network (WLAN), ultra-wide band (UWB), and RFID technologies have been conducted. The main methods of IPS are the triangulation, radio fingerprinting, proximity, dead reckoning, and fusion methods, detailed in Table 1.
The triangulation method calculates the distance between three or more AP devices and mobile devices. The position of the AP observation instrument is fixed and thus known in advance. Each AP device then calculates the distance between it and the mobile device using radio wave characteristics such as received signal strength (RSSI), to estimates the position of the mobile device [9]. At least three AP devices are required to locate a mobile device node, which is accomplished by finding the point where the three AP signal circles intersect the mobile device node, and the distance is defined as the radii of these circles. To function in this manner, the AP device must be placed on the ceiling without obstruction such that the time delay due to refraction of radio waves is minimized. Therefore, in most cases, the mobile device node is located below the AP device, so the error between the AP device and the mobile device node is notable because the height difference is not considered in the triangulation [10]. To solve the problem of the different heights of AP devices and mobile device nodes, many studies have used a common chord from three circles whose radii indicate the distance between AP devices and mobile device nodes. The most common method of doing so is the time of arrival (TOA) method in which the distance between the AP device and the mobile device node is calculated using the time it requires for a signal to travel back and forth between the two [11]. The triangular positioning method has limited accuracy because of RSSI errors caused by radio wave blocking, refraction, and absorption by obstacles. Notably, fingerprinting techniques can be used to solve the problem of reduced signal strength due to the presence of such obstacles [12].
Fingerprinting methods use stochastic modeling techniques to build a radio signal map in advance and then estimate the RSSI value using data from the AP devices placed in each zone. Noise and environmental information are then used to assist location tracking. Currently, fingerprinting is the most widely used method of WPS-based IPS [13]. The fingerprinting algorithm first divides the indoor space in which positioning must be conducted into a fixed range and then stores the reference point (RP) position values in the database. Next, the distance is measured according to the position value and the signal strength between the AP device and the mobile device [14]. This signal strength is then compared with the radio map to determine the position of the mobile device by weighting the sum of positions on the similarity radio map. To improve the accuracy of the fingerprinting method, the K-nearest neighbors (KNN) algorithm classifies a large quantity of data without classification criteria. Then a feature vector algorithm is used to find and classify data with high similarity using the cosine angle between two vectors [15]. This represents a simple and effective method that does not require assumptions about what type of distribution the data follow, but requires substantial computer memory.
The proximity method determines the proximity of a target using the known position of surrounding sensors, and is mainly used with RFID technology. Thus, in order to use the proximity method, a considerable number of AP devices must be installed in fixed positions. There are several ways to detect proximity [16], all of which generally require a three-step process: first, it is determined whether the AP device is contacted by a pressure/touch sensing tag; second, the AP device recognizes the tag attached to the target; third, the target position is estimated using the position of the AP device that recognized the target device. Such direct sensing tags rely upon RFID, Bluetooth (beacon), infrared, or ultrasonic technology [17].
Dead reckoning is a method of estimating current position according to the measurement of the moving distance and direction that the tracked target follows from its initial position [18]. Dead reckoning consists of step detection, step length estimation, and azimuth estimation processes. Notably, this method can be used for position estimation even if the target device is equipped only with an inertial sensor and no other sensors, so it can be used in various fields such as pedestrian navigation, emergency response, and public safety [19]. For example, the movement path of the target can be recorded by the position recognition system using the acceleration sensor of a smartphone, then the GPS signal can be used to correct the error. However, battery consumption can be considerable when using GPS because it must use a constant incoming signal to calculate location. For this reason, dead reckoning predominantly uses the accelerometer to estimate position and only occasionally relies upon GPS signals for correction. Unfortunately, the accelerometers used in smart phones produce considerable errors. Therefore, when a smartphone accelerometer is continuously used for dead reckoning, the error of the user position can become significant. The landmark method is commonly used to correct such errors by designating a landmark as the point against which the sensor value is constantly measured (such as an elevator), the area where the RSSI of the Wi-Fi is measured to be very high, or the radio shadow area [20].
To solve the problem of position recognition precision, methods combining two or more of the above techniques have been widely applied. For example, the GPS signal attenuation due to ground obstructions and RF interference causes instantaneous signal loss and thus reduces the accuracy of the position determined using GPS. Under these conditions, a combination of GPS with an inertial navigation system (INS) is an effective solution for determining the exact location of a target [21]. In this scenario, the GPS provides location, velocity, and time data based on satellite signals, and the INS compensates for GPS signal problems using device gyros to measure the angular rate of change in inertial space and accelerometers to achieve high reliability and a constant power ratio by measuring the linear acceleration of the inertial system [22]. In this way, the vulnerability of GPS to physical and RF interference can be overcome.
2.2. Visibility-Based Techniques for Analyzing Pedestrian Flows
Walking movements have complex meanings as they define human space as an intermediate space and the movement itself as the object of the human environment. Additionally, pedestrian activity can be broadly defined to express changes in the physical structure for human walking, utilization of the surrounding environment, and qualitative improvement in the walking experience [23]. Space syntax, which quantitatively analyzes the attributes of spatial structure, was introduced as a method to understand the social phenomena that occur in an urban space in terms of architecture or urban typology. In other words, space syntax emerged from the belief that if the city can be analyzed according to the topological relationships between individuals and their surrounding spatial structure, one could interpret the social properties embedded in each space through the relationship between spaces. Thus, it is a representative theory that considers the social characteristics inherent in spatial structures based on the relationship between unit spaces [24]. This can be interpreted to mean that the spatial structure is the most important factor in determining human walking patterns. However, this is difficult to analyze in detail and shows the limitation of recognizing pedestrians only as objects of spatial analysis. For this reason, many previous studies investigated methodologies that reflect human visual attributes.
The visibility graph analysis (VGA) model has been applied to the space syntax by adding the concept of the human visual field. It uniformly divides the space into a lattice consisting of identical unit spaces. This solves the problem of randomness of the space segment, enabling the undefined space to be analyzed in detail, and the method to be applicable to most open spaces. In other words, the VGA model can reflect human visual attributes because it utilizes a visibility graph organized by visual connection, unlike space syntax, which is constructed topologically. Additionally, because the size of the unit space can be adjusted, more detailed spatial analysis is possible [25]. The analysis index calculated using the VGA model is typically the visual integration, calculated as the average value of the number of changes in the moving direction of the visual connections between each point in the entire space. The higher the visual integration, the higher the frequency of pedestrian activity. In particular, visual integration in the VGA model refers to the visual structure phase of the space according to the shortest visual path instead of the shortest physical distance. Visual integration is composed of a total integration that calculates accessibility within a certain space and a local integration that calculates accessibility from a certain space to a certain point. Advantageously, in the VGA model, the integration of local concepts can be adopted and analyzed. The VGA model has been applied in many practical studies. When space syntax is applied with the VGA model to an urban space, the predictive power of the VGA model was found to be significantly higher, and revealed that walking pattern data together with visual analysis can function as a spatial strategy to encourage pedestrians to make purchases in a commercial space where consumption is occurring. A higher visual integration in the VGA model means that the walking frequency of the pedestrian is higher, and this model actively reflects the visual centrality of pedestrian activity [26].
The VGA model, however, has the disadvantage of it being difficult to directly observe the relationship between each unit space when there are a large number of unit spaces, especially when compared with other analysis techniques. That is, in the visibility graph, the number of unit spaces varies with the lattice spacing, and the number of unit spaces increases exponentially with increasingly finer analyses. For this reason, it can be difficult to directly observe the relationship between many different unit spaces. Prior research has accordingly graphed indices on a color plane to indirectly examine the phase of each unit space through its distribution. This is an appropriate method for the comparative analysis of pedestrian behavior using quantitative statistics such as occupancy and walking, but only a section of the spatial structure can be observed at any time [27]. To overcome these drawbacks in the past, previous studies reduced the number of unit spaces by enlarging the lattice spacing, but once the lattice spacing is sufficiently large, the accuracy of the analysis suffers. Prior studies have also proposed a method for analyzing the spatial structure by using a cluster analysis technique on the visibility graph to group only the representative units. However, based on recent advances in computational capabilities, a method of dividing a widely spaced grid into a plurality of units and estimating a new value in each unit space to improve spatial accuracy has been introduced.
Space-time kernel density estimation (STKDE) is a technique used to address the disadvantages of the grid structure used in VGA. In this method, it is assumed that the form of human walking inherently involves human temporal and spatial movements to help identify continuous and dynamic patterns of walking data, allowing researchers to grasp the spatiotemporal concentration or spreading phenomena at a specific point in a walking space that shows a repetitive form of flow, such as the movements of public transportation users. Because such movements are more likely to appear in a certain simple pattern rather than an unpredictable complex pattern, it is important to focus on capturing the pedestrian movement behavior over a certain period, rather than tracking various movement paths. As STKDE accordingly collects only time and space information such as latitude, longitude, and time from mobile devices, it is an economical and simple method for creating a movement analysis model in space. Additionally, it can provide realistic data with important implications for pedestrian management, public safety, and the associated consumer marketing. If the pedestrian circulation within a public transportation system such as the subway or bus network is smooth, issues of public interest such as safety and the promotion of public transportation can benefit. Therefore, STKDE offers a potentially advantageous methodology for evaluating strategies for solving delays in a section of a public transportation system where people tend to concentrate [28]. The results of STKDE can be expressed as a heatmap using QGIS, a free GIS program, providing a visual and intuitive reference for interpreting spatiotemporal characteristics by identifying hotspots where the spatiotemporal movement density is high and cold spots where spatiotemporal movement density is low. Using such an analysis, the locations and extents of walking and stopping areas can be easily determined, or the walking speed of a specific user at a specific place expressed on the map can be lowered [29].
2.3. IoT in Smart Cites
The smart city is a future-oriented city concept that provides citizens with desired services through various devices anytime and anywhere using ICT. The concept of the smart city was envisioned in 1988 by Mark Weiser to bring the concept of ubiquitous computing to the physical environment. This concept creates a third space by fusing the electronic space and physical space using ICT such as sensors and networks. In doing so, the smart city creates new services by combining ICT with traditional services such as those provided by the medical, logistics, construction, and manufacturing industries [30]. The objective of the smart city has been defined in various ways by scholars. However, these multiple objectives can be divided into three general categories: improvement of quality of life, economic growth and job creation, and implementation of a new industrial ecosystem. In particular, most researchers agree that the smart city should be governed in a manner that emphasizes the role of social capital and relationships in urban development. Caragliu [31], who established the European Smart City Strategy, has argued that the smart city is fueling sustainable economic growth and a higher quality of life through investment in human and social capital and traditional and modern infrastructure, and emphasized the role of government in the wise management of natural resources and citizen participation. The British Standards Institution (BSI) explained that the smart city provides citizens with an effective built environment to enable a sustainable, developmental, and inclusive future. Indeed, the smart city has recently evolved beyond simply utilizing ICT to spread the residences and activities of citizens in a more comprehensive and complex form that does not merely pursue functional achievement, into a system for facilitating cooperation and system integration between the silos that simultaneously constitute the city. Other smart city projects are pursuing more efficient city management, improved citizen quality of life, and sustainable growth [32]. To pursue such objectives, it is first necessary to generate meaningful data by upgrading various systems such as the energy, transportation, and communication infrastructure within the city. Next, a data-hub system must be created to collect and transmit data from various inputs such as sensors, CCTV, IoT, and other devices. Finally, it is necessary to store, analyze, predict, and diagnose issues based on the collected city data and provide new business opportunities to the private sector in the form of open data sets [33]. According to these developmental needs, in this study we classified the values of a smart city into the five categories shown in Table 2: convenience, competitiveness, resilience, efficiency, and sustainability. The service and business domains were divided among these categories and the development stages of the relevant technologies in each category were then defined. These categorizations were used to guide the development of our smart city research, of which this study is a part.
3. Methods
3.1. Experimental Settings
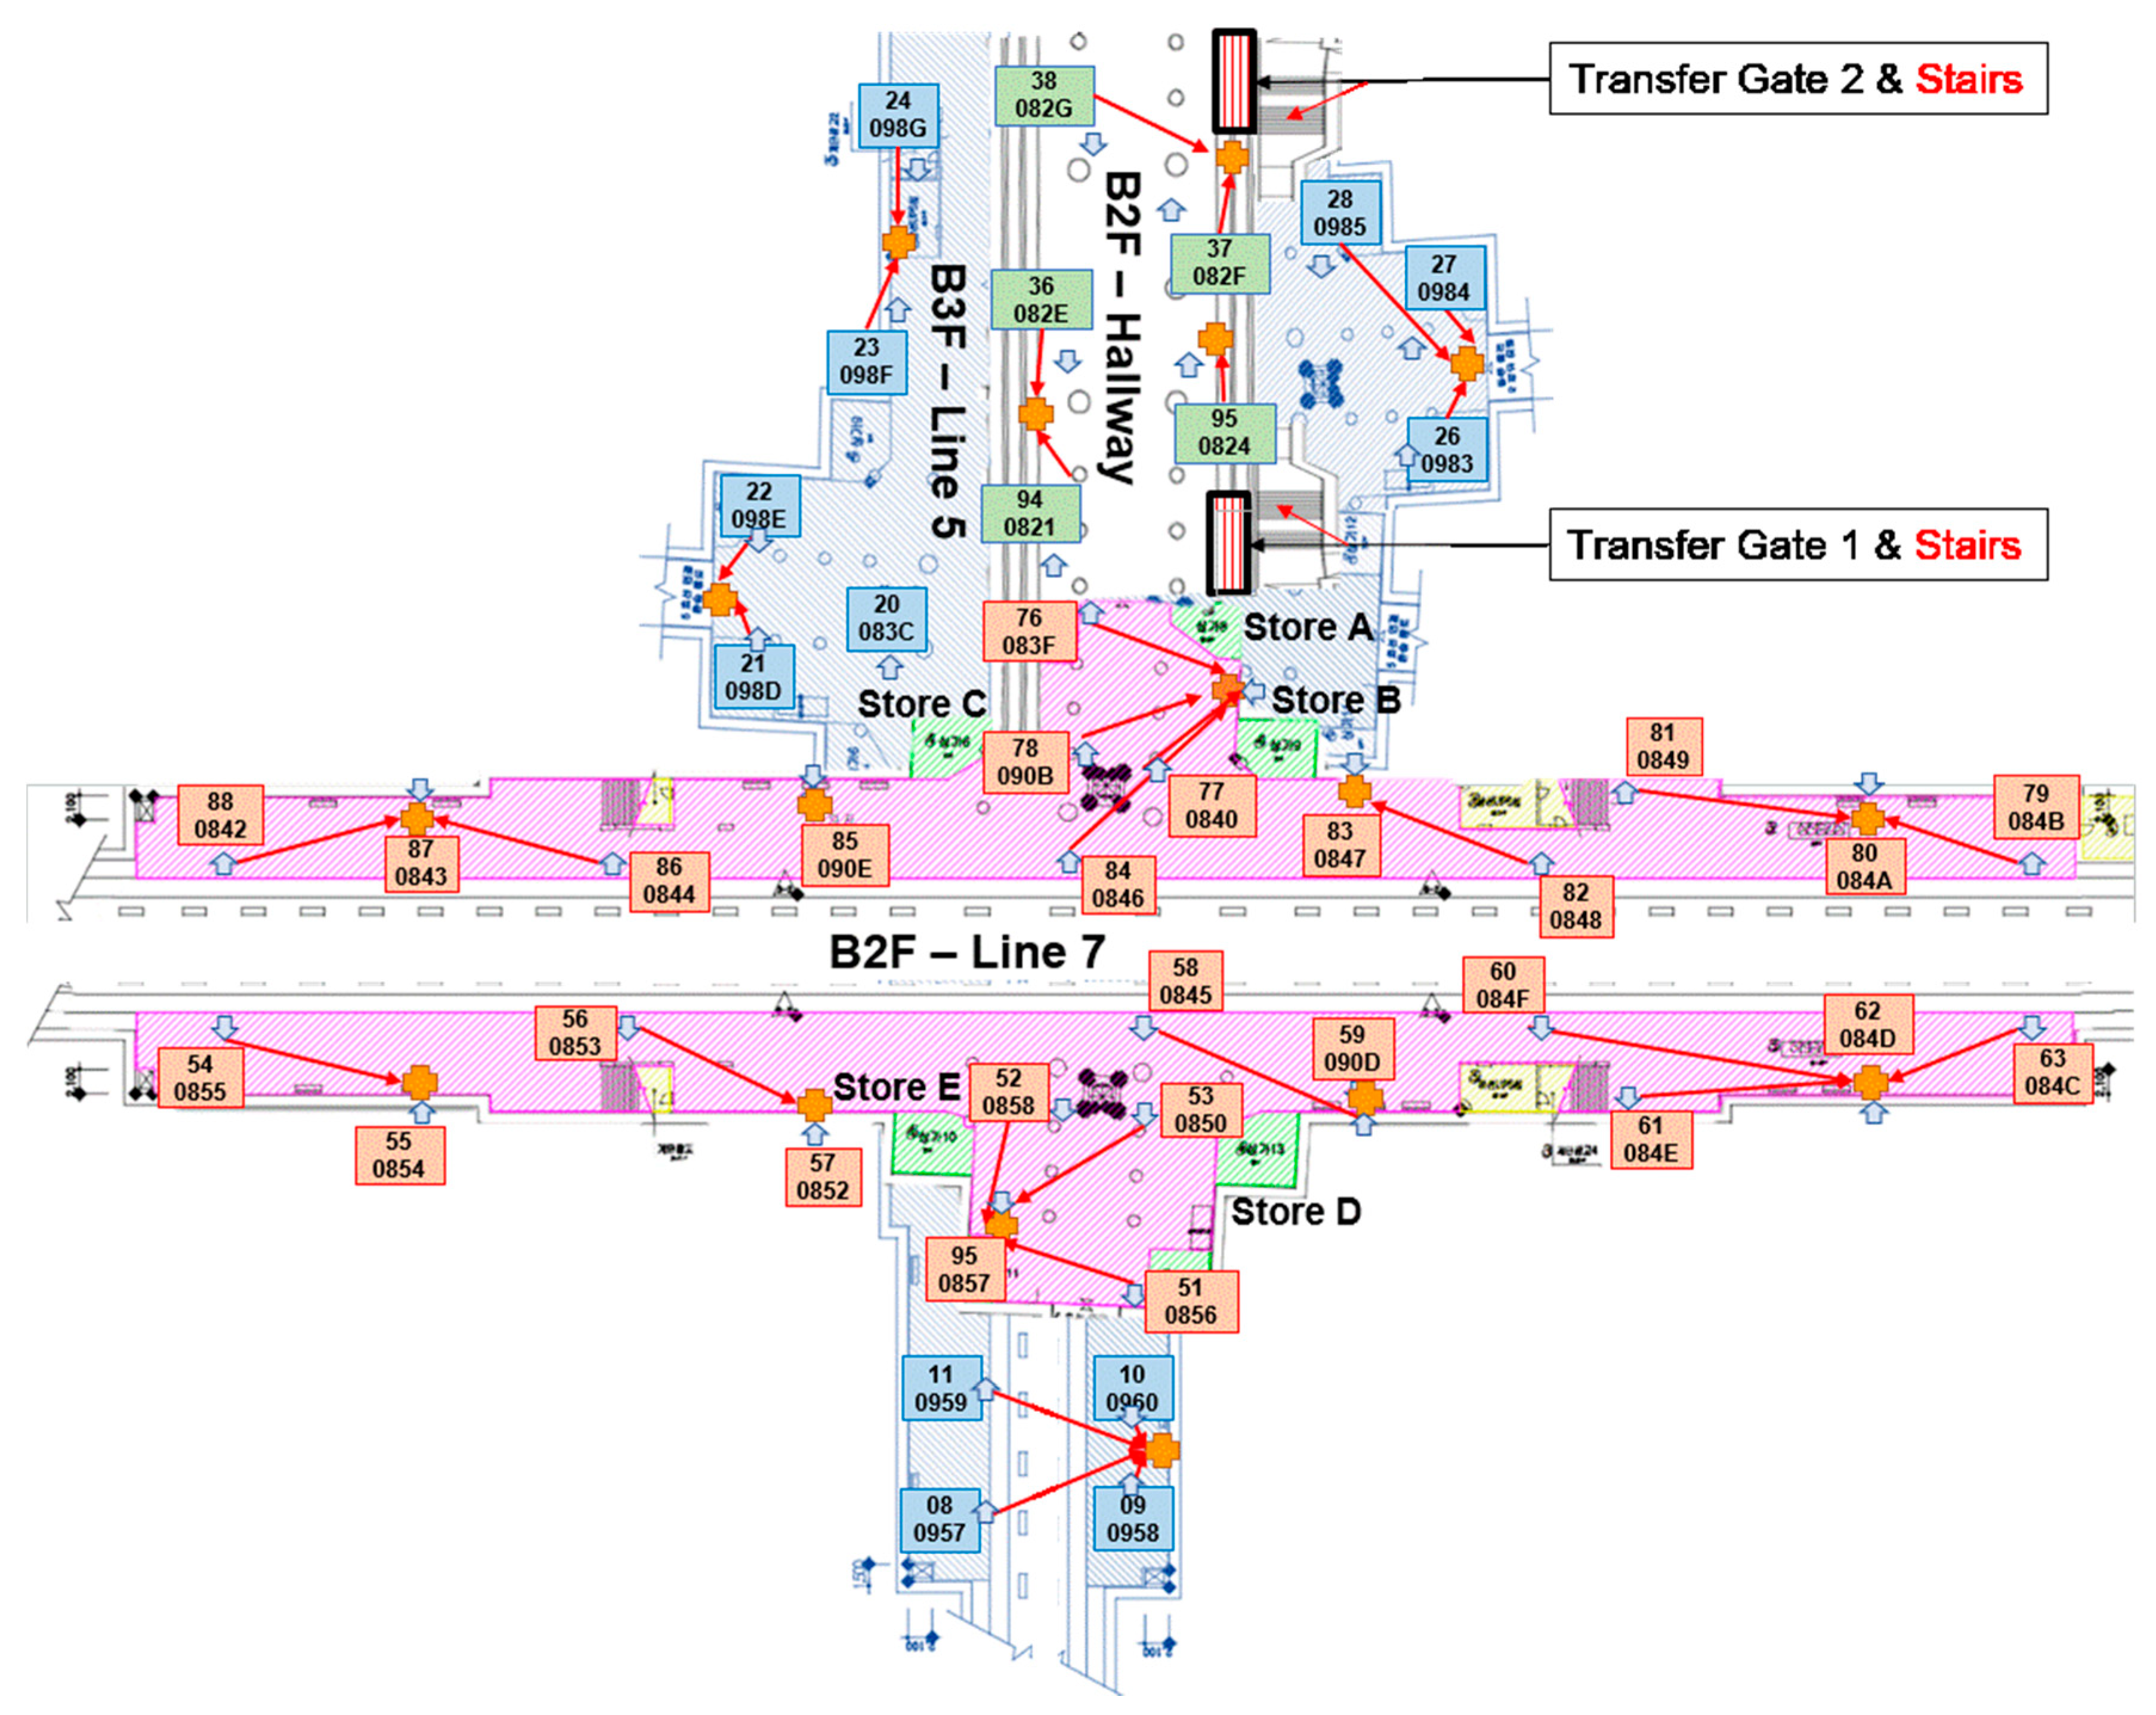
As part of our smart city implementation research, we conducted a project led by Company A to investigate the transfer behavior of subway passengers in Station B of a major metropolitan city, and to create and apply a real-time pedestrian dispersion model to prevent possible accidents during times of heavy passenger congestion. Station B, a very congested station with a large population of people using two subway lines, consists of one ground floor and three basement floors. The first basement level is mainly for shops, the second is for subway Line 7 running east–west, and the third is for subway Line 5 running north–south. In this study, we installed 100 MAC ID (mobile-specific unique identifier) sensors in Station B, as shown in Figure 2, to provide passenger location and movement data using the fingerprinting method.
As mentioned in Section 2.1, fingerprinting is a technique used to detect the position of pedestrians via a matrix signal in the form of a grid or net covering a certain location. Sensors in such a system collect the MAC IDs of people in the target location at 15-s intervals. We installed 70 of these MAC ID sensors in the second basement level carrying Line 7 and the hallway, and 30 sensors in the third basement level carrying Line 5. Of particular note, Station B has two escalators that run between the second and third basement levels for subway transfer. Of these, the escalator located at Gate 1 provides the shortest transfer distance and has three shops around it, which was observed to cause severe congestion during commuting hours.
3.2. Networked Sensor-Based Infrastructure
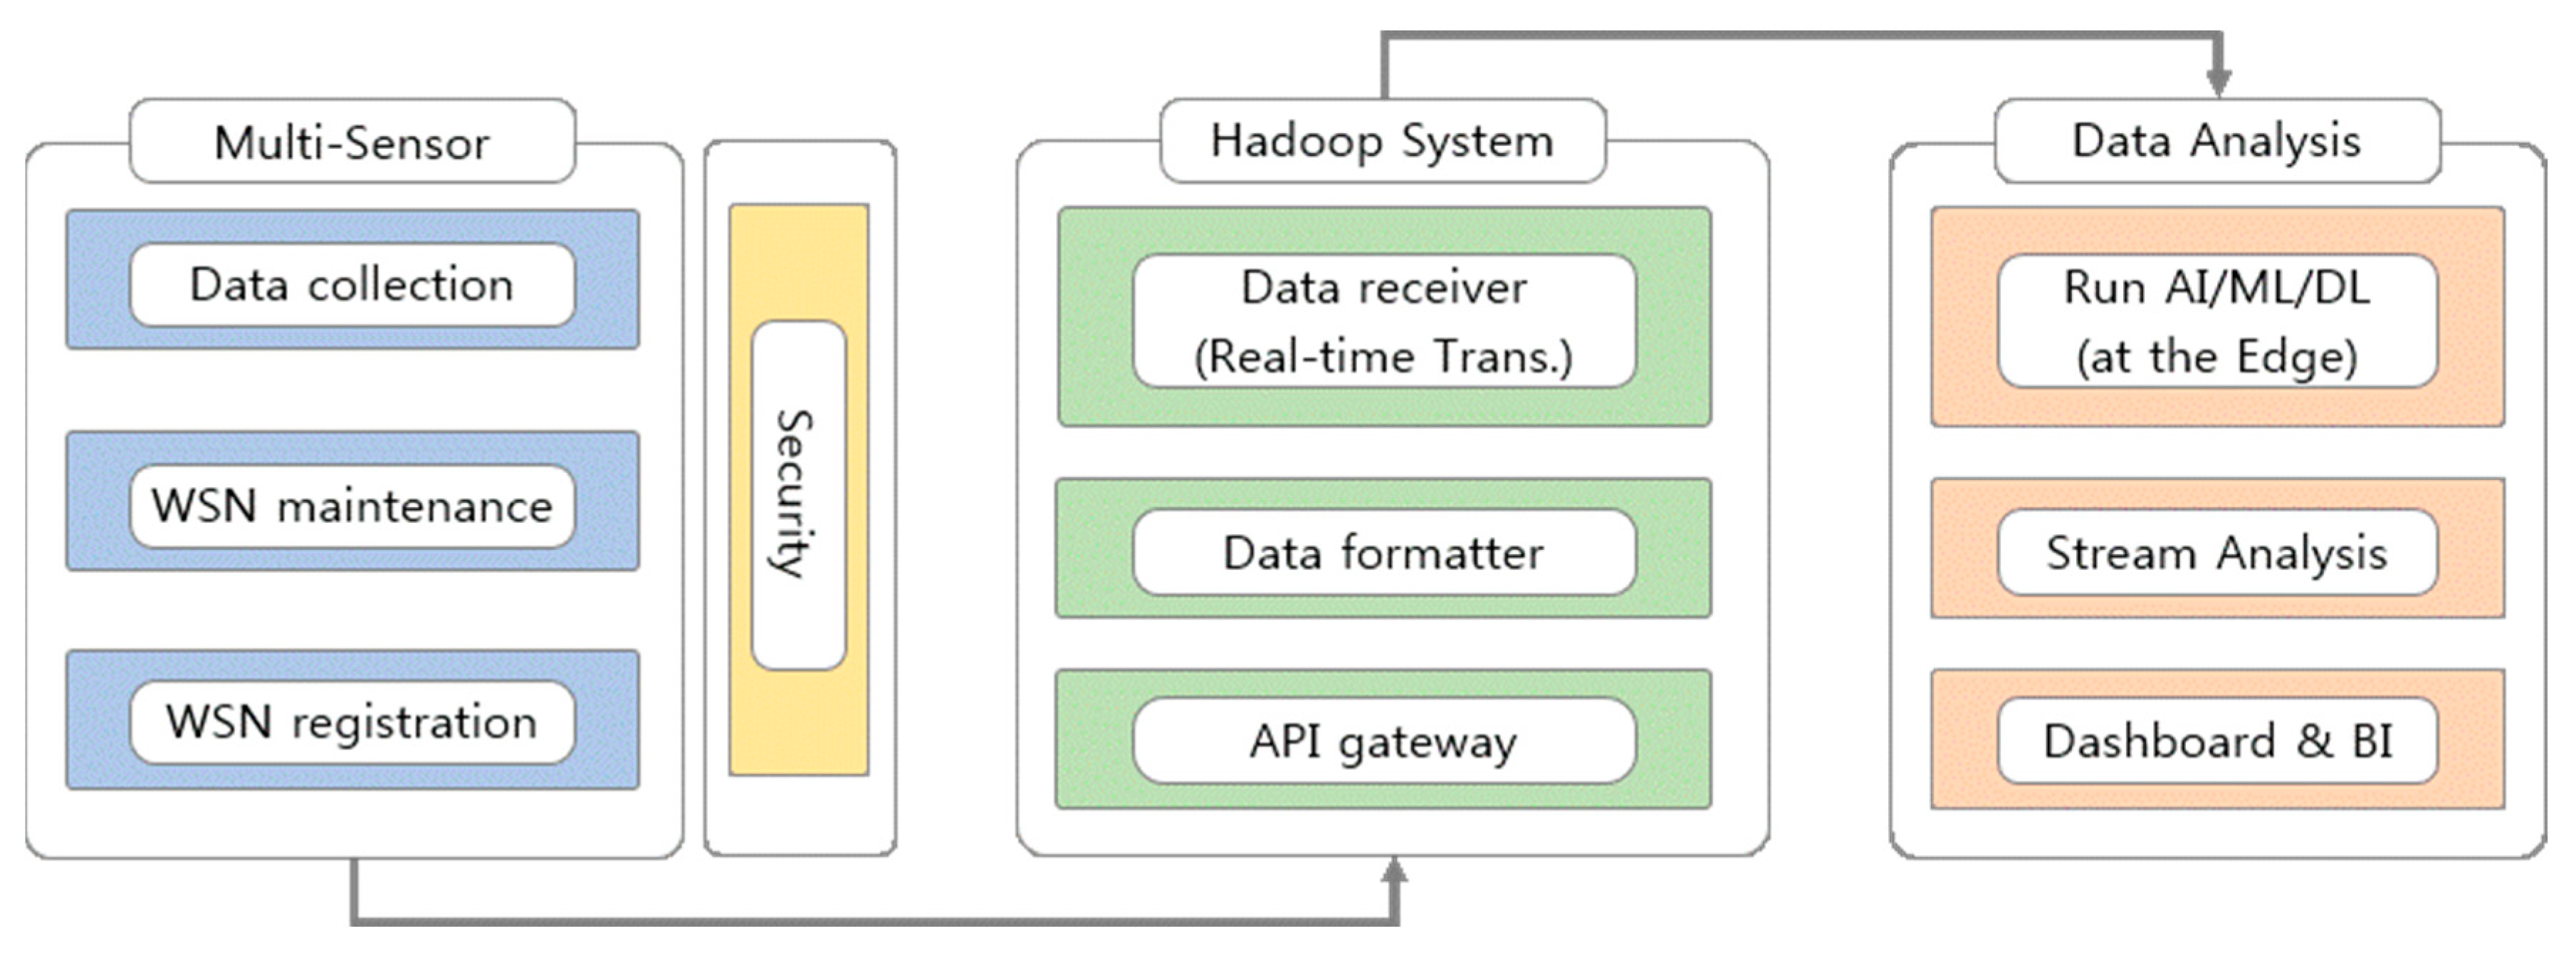
We built a sensor and server environment for indoor positioning estimation using the fingerprinting method with BLE (Bluetooth Low Energy) Wi-Fi gateway sensors at a PHY (Physical Layer) data processing rate of 2.4 GHz and a bandwidth of 150 Mbps to collect location information from passengers in the subway station. This sensor was particularly suitable for our study because it has a recognition range of 30m, far enough to minimize the sensors needed but short enough to accommodate the limited size of the station efficiently. The log data collected by the sensors in the form of Wi-Fi signal and the associated location information were stored on a 2 TB server with an Intel i7-8700 (3.2 GHz) CPU (Central Processing Unit), an NVIDIA GeForce RTX 2060 GPU (Graphics Processing Unit), and 16 GB of RAM (Random Access Memory) using the Hadoop (Hortonworks) system.
We constructed a three-stage server infrastructure, shown in Figure 3, to collect large-capacity sensing data and analyze it in real time. The first stage is the multi-sensor system, which includes data collection, wireless sensor network (WSN) maintenance, WSN registration, and in–out encryption scheme processes. The second system consists of a data receiver, a data formatter, and an API (Application Programming Interface) gateway, built on a Hadoop system intended to accumulate large quantities of unstructured data in real time. The third system is an on-demand server for data analysis, including a dashboard and BI (Business Intelligence), that performs stream analysis.
3.3. Pre-Processing
We collected the position information from pedestrians through the matrix signal, which contained the data shown in Table 3. As mentioned in Section 3.2, each detector collected the MAC ID of the devices in its zone every 15 s. However, if a mobile device did not have its Wi-Fi enabled, we were unable to collect its MAC ID. Thus, the utilized method could only detect the movements of pedestrians with Wi-Fi enabled devices. It has been determined in past research that, in general, approximately 50% of people have the Wi-Fi on their devices activated [42]. Therefore, it is not excessive to assume that approximately double the number of pedestrians measured in this study were present in the target station.
The directions and velocities of each pedestrian were calculated using the position coordinates collected by each detector. In particular, we attempted to determine where people were the most congested and the main causes of this congestion using the route and speed of pedestrians during commuting hours. There were, invariably, daily deviations, but on average, 26,000 data points were collected by each detector per day. More than 20,000 of these data points were accumulated in only two hours of the daily commute. In total, we collected and analyzed approximately 230 million data points in approximately three months from 27 August 2018 to the end of November 2018. Additionally, we developed a real-time congestion analysis model (first-round study) to analyze the causes of congestion and inform potential solutions. We then collected 212 million new data points over approximately three months from 11 February 2019 to 13 April 2019 to verify the effectiveness of the changes made to the station based on the developed analytical model (second-round study).
3.4. Methodology
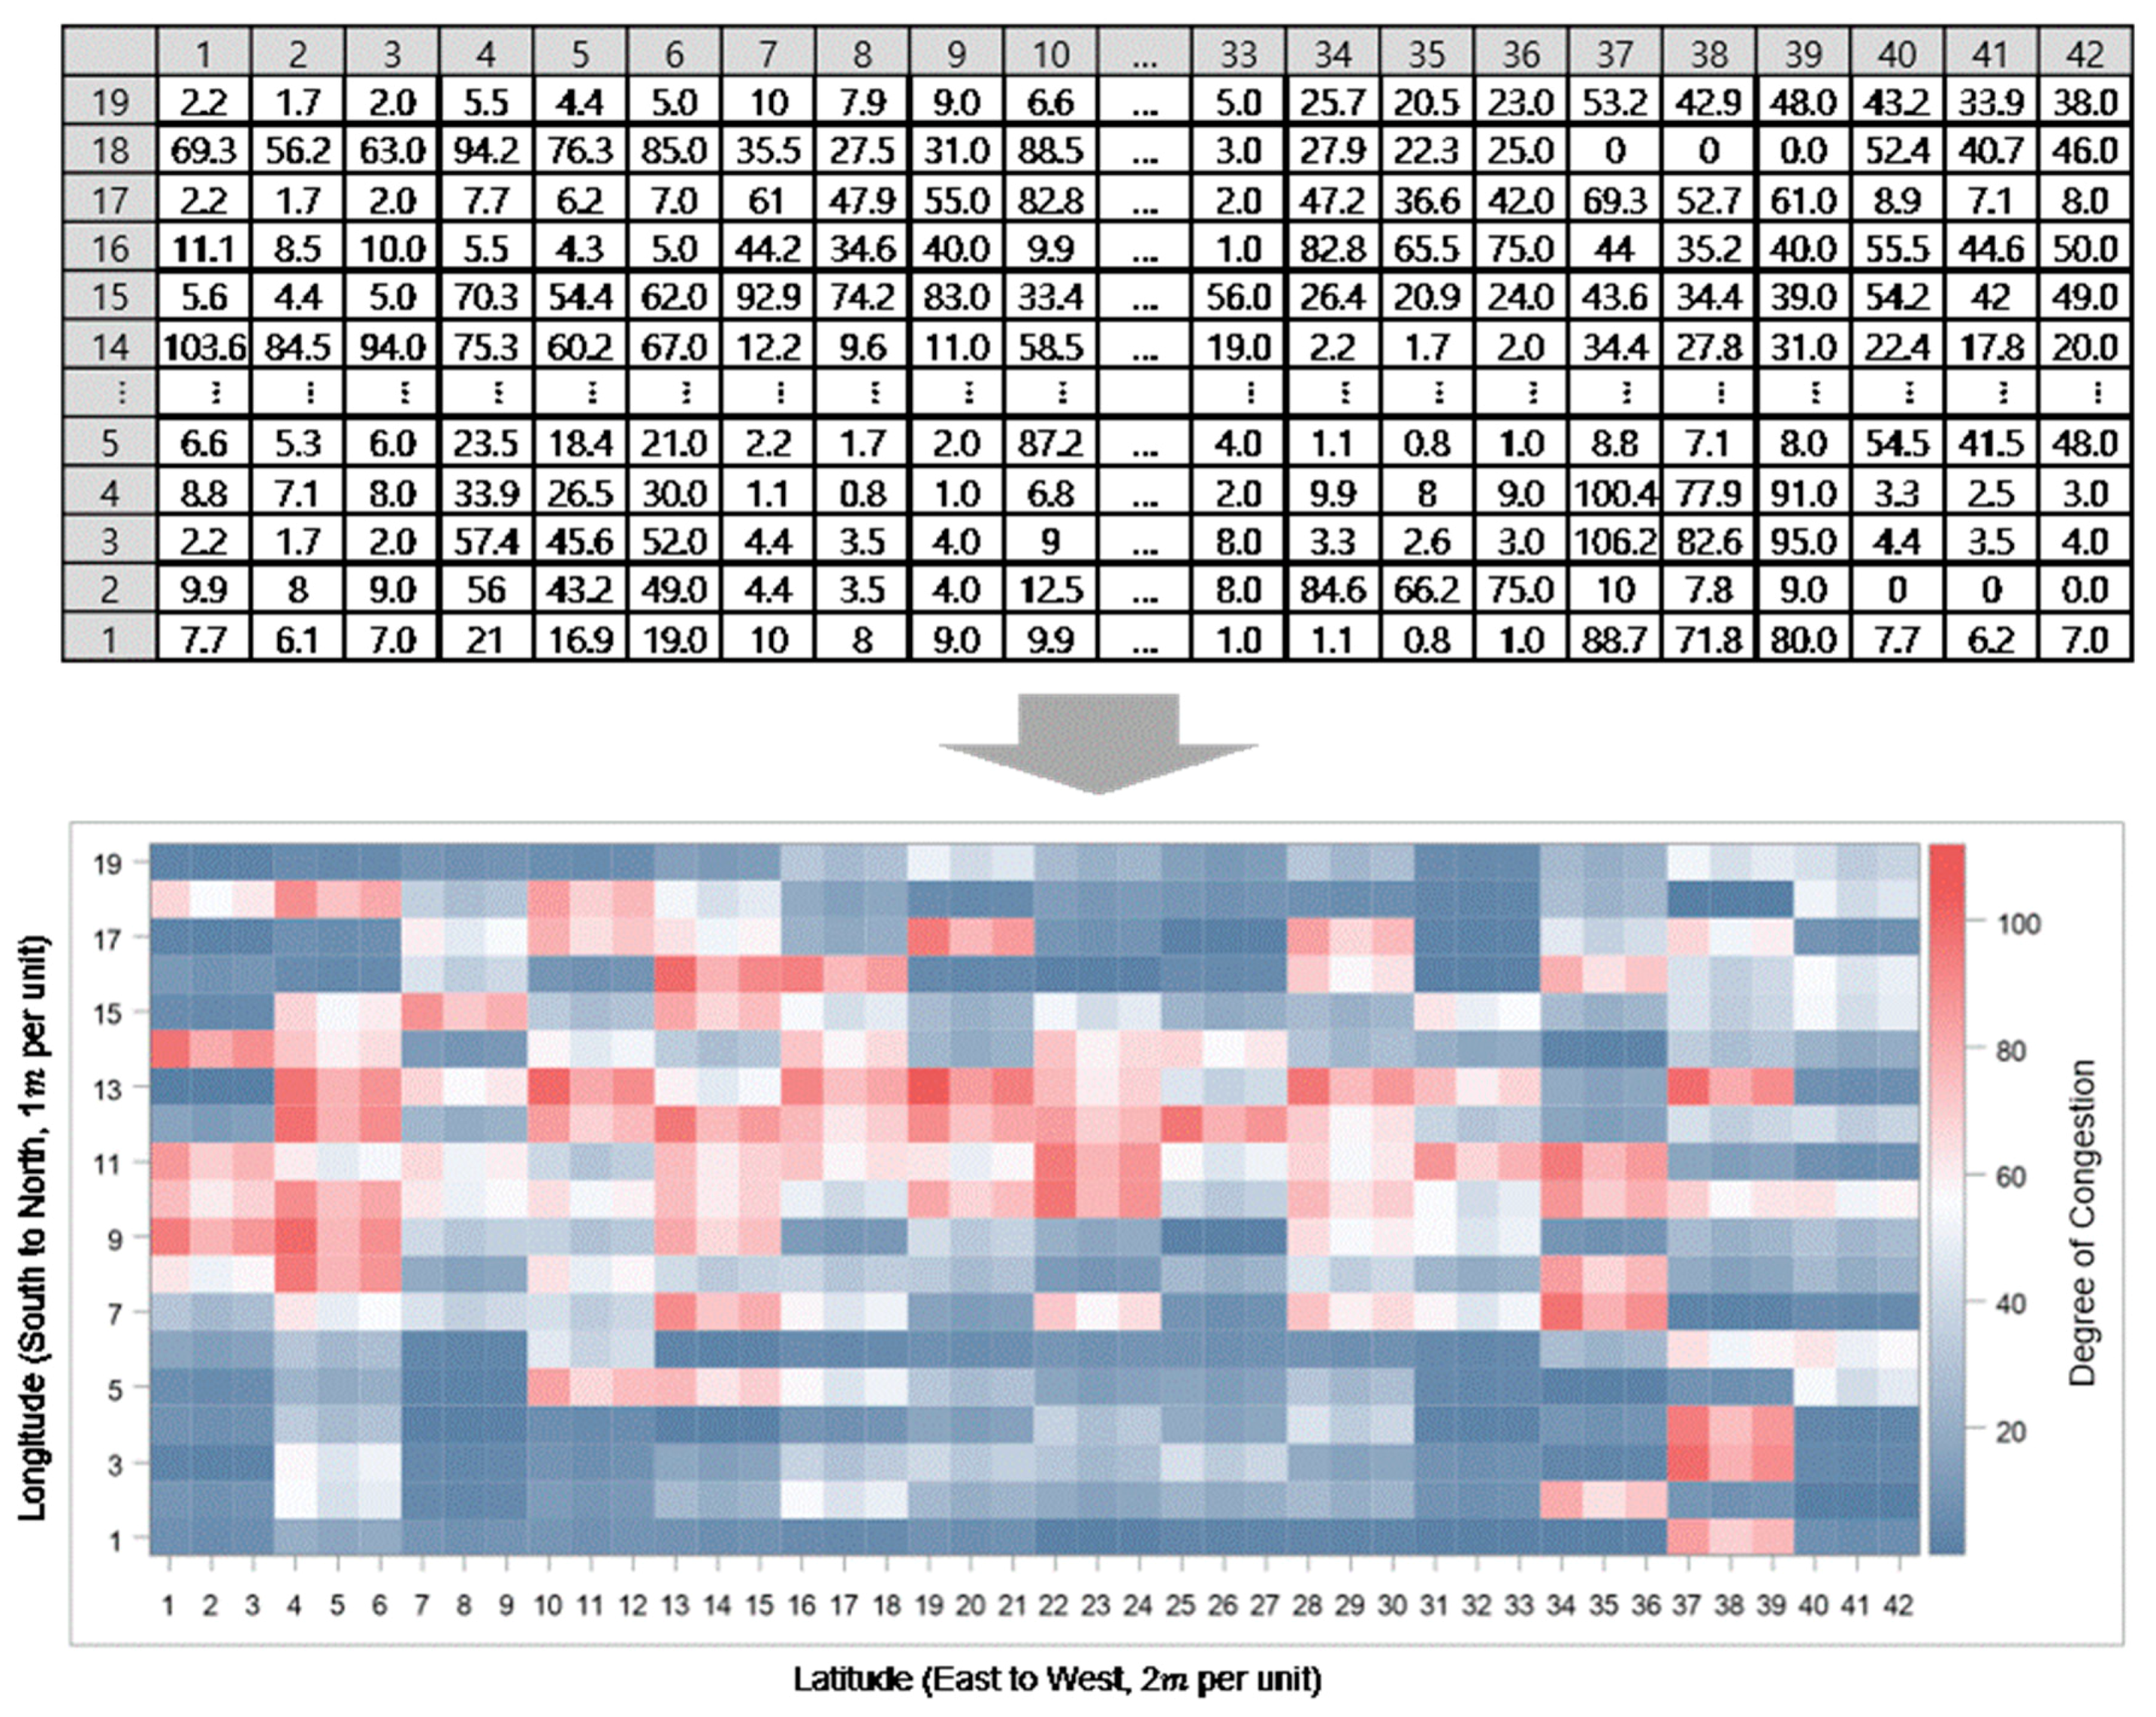
In this study, we applied some of the more representative visualization techniques for pedestrian flows to create the cumulative visibility of moving objects (CVMO) technique, which is a type of heatmap based on the moving trajectory of the target object. This model was constructed by changing the cumulative pixel over a period based on the intersectional heatmap method applied using the existing STKDE method.
As shown in Figure 4, a pedestrian passing through a certain area equipped with a grid sensor system is detected and their location is collected as data in an ordered pair. In this case, we can assume two possible issues with the collected data. One possible issue is that pedestrians who pass through a section in under 15 s cannot actually be sampled. To solve this problem, we performed grid scanning and accumulation of each region redundantly using several sensors. The other possible issue is that because the coordinates appearing on the signal grid of each detector are different, they must be corrected by synchronizing the grid positions for each detector into latitude and longitude, the common position reference of the GPS. We then used this value to calculate the cumulative presence and movement of pedestrians and finally visualize these data as a heatmap.
Although the data are collected in real-time and the output is immediately available, the ability to sense the movement of a pedestrian and send it immediately to the heatmap has many limitations. To address these limitations, we applied a binarization technique that shows the cumulative value of a certain period on the heatmap after separating the object from the background. This makes it possible to accurately express the afterimage of a non-sensed object that has already been pushed out of the detector signal or is no longer traceable in the signal. Indeed, the model possesses stored information about the moving object trajectory in units of one minute, which we used to create the object motion binarization file. We also entered the data into a database (DB) after conducting all processing required for graphing. The process for representing the binary cumulative values as a heatmap is as follows. First, the initial pixel values are all initialized to zero, and the object to which the unique ID is assigned moves to accumulate one pixel wherever it is located. Second, accumulating once per second, each pixel value increases as each object passes through each pixel over time. If a pixel continuously accumulates value once per second, the maximum value is 3600 for one hour. Dividing this value by 360 expresses a visually distinguishable heatmap in 10 color units. Third, an accumulation value database is created to capture the moving trajectory for one minute after the location measurement, and 60 pixel accumulation values calculated after one hour are displayed as a new accumulation value table.
4. Results
4.1. Results of First-Round Analysis
As discussed in Section 3, in this study we used heatmaps to represent the congestion level of the target subway transfer section over time, based on three months of pedestrian sensing data. We then searched for different ways to rearrange traffic flow or reduce congestion using this developed real time cumulative sensing heatmap model.
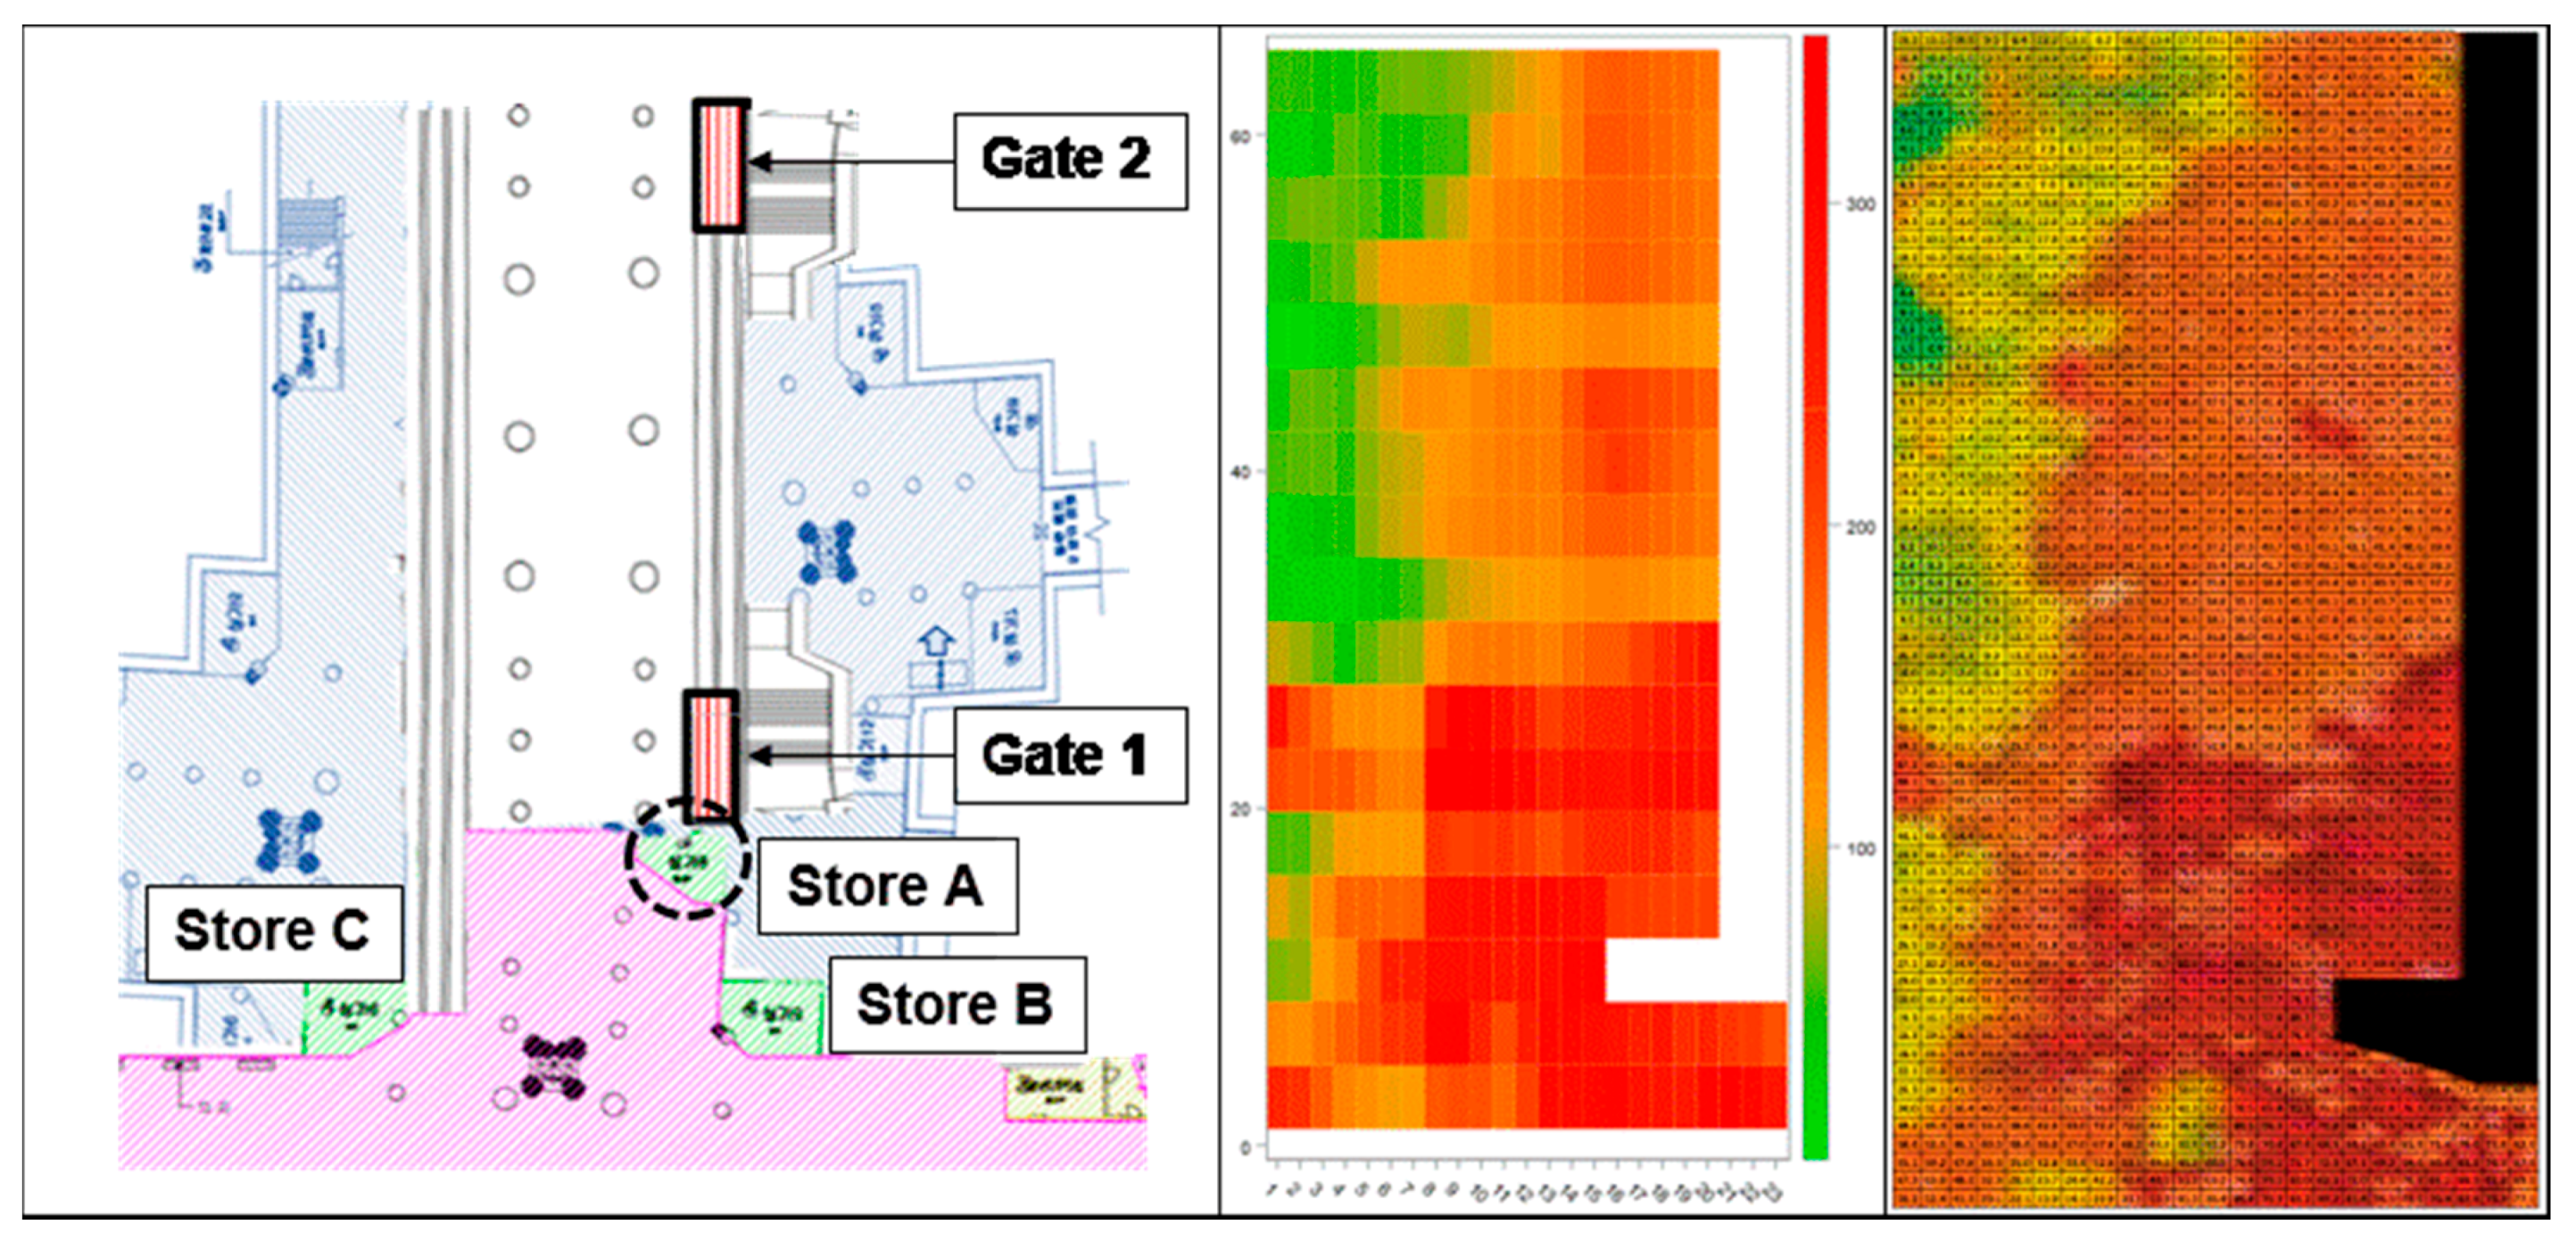
As shown in Figure 5, the heatmap before rearrangement shows extreme congestion, especially at Gate 1, which had the shortest transfer distance between subway lines. On the other hand, it is clear that Gate 2, which requires a longer transfer distance, was considerably less crowded. Furthermore, when we calculated the pedestrian movement speed during commuting hours and lower traffic times, we found that the pedestrian movement speed was very fast, especially during the morning rush hour, even despite the congestion. We also found from Figure 5 that most of the traffic is present on the right-hand side of the transfer corridor where Gate 1 and 2 are located. In other words, it was found that not only the pedestrian traffic connecting from Line 7 to Line 5 was considerable, but that because pedestrians were more likely to use the gate side of the passageway without following the basic rules of right-side passage, the congestion was made even worse. We found one additional problem in the form of the stores in the corridor, which are small metal building spaces operated by the subway company. We found such stores in three of the four corners of the subject transfer corridor. From the map, it is clear that Store A, which sells mobile cases and accessories, actually protruded enough to present an obstacle to pedestrians.
To solve these traffic problems, first, we proposed moving Store A to the opposite side of the corridor. We expected that there would be no objection because the store was a simple structure that would not require a significant construction cost to relocate such a short distance. Second, we proposed that Gate 2 be forced into heavier use by blocking Gate 1 if the congestion level increased to a certain level, as there were too many people going up and down through Gate 1, especially during crowded hours. We suggested that this congestion situation could be directly linked to safety accidents, and that increasing the pedestrian travel distance line would be an effective way to prevent such accidents. In particular, we found that people who are motivated by transfer time often move quickly through Gate 1, as it has a short transfer distance. By forcing pedestrians to walk an additional distance of about 120 m, we increased the moving distance and widened the pedestrian activity space leading to the gate, preventing dangerous situations. Our final suggestion was to install a structure to maintain the rules of right-hand traffic flow. There was not even a simple center line in the transfer corridor before rearrangement, so we accordingly proposed to install a simple steel handrail structure in the center of the corridor to separate traffic. In this way, we hoped to reduce the bias toward the right side of the corridor observed in Figure 5.
As shown in Figure 5, we implemented two types of heatmaps. Note that the heatmaps from commonly used video images and those from mobile signal accumulation as a new methodology in our study are completely different concepts. We also presented two distinct heatmaps for our new form of mobile cumulative signaling. The first is the temporary mapping method (middle-side figure) implemented with one-day static data, and the second is the periodic mapping method (right-side figure) implemented with three-months accumulative data. It can be seen that the two figures show very similar heat patterns. We found that these results mean that our model based on accumulative training and validation data could be applicable to daily target data, and that we can monitor congested pedestrian walkways in real-time.
4.2. Results of Second-Round Analysis
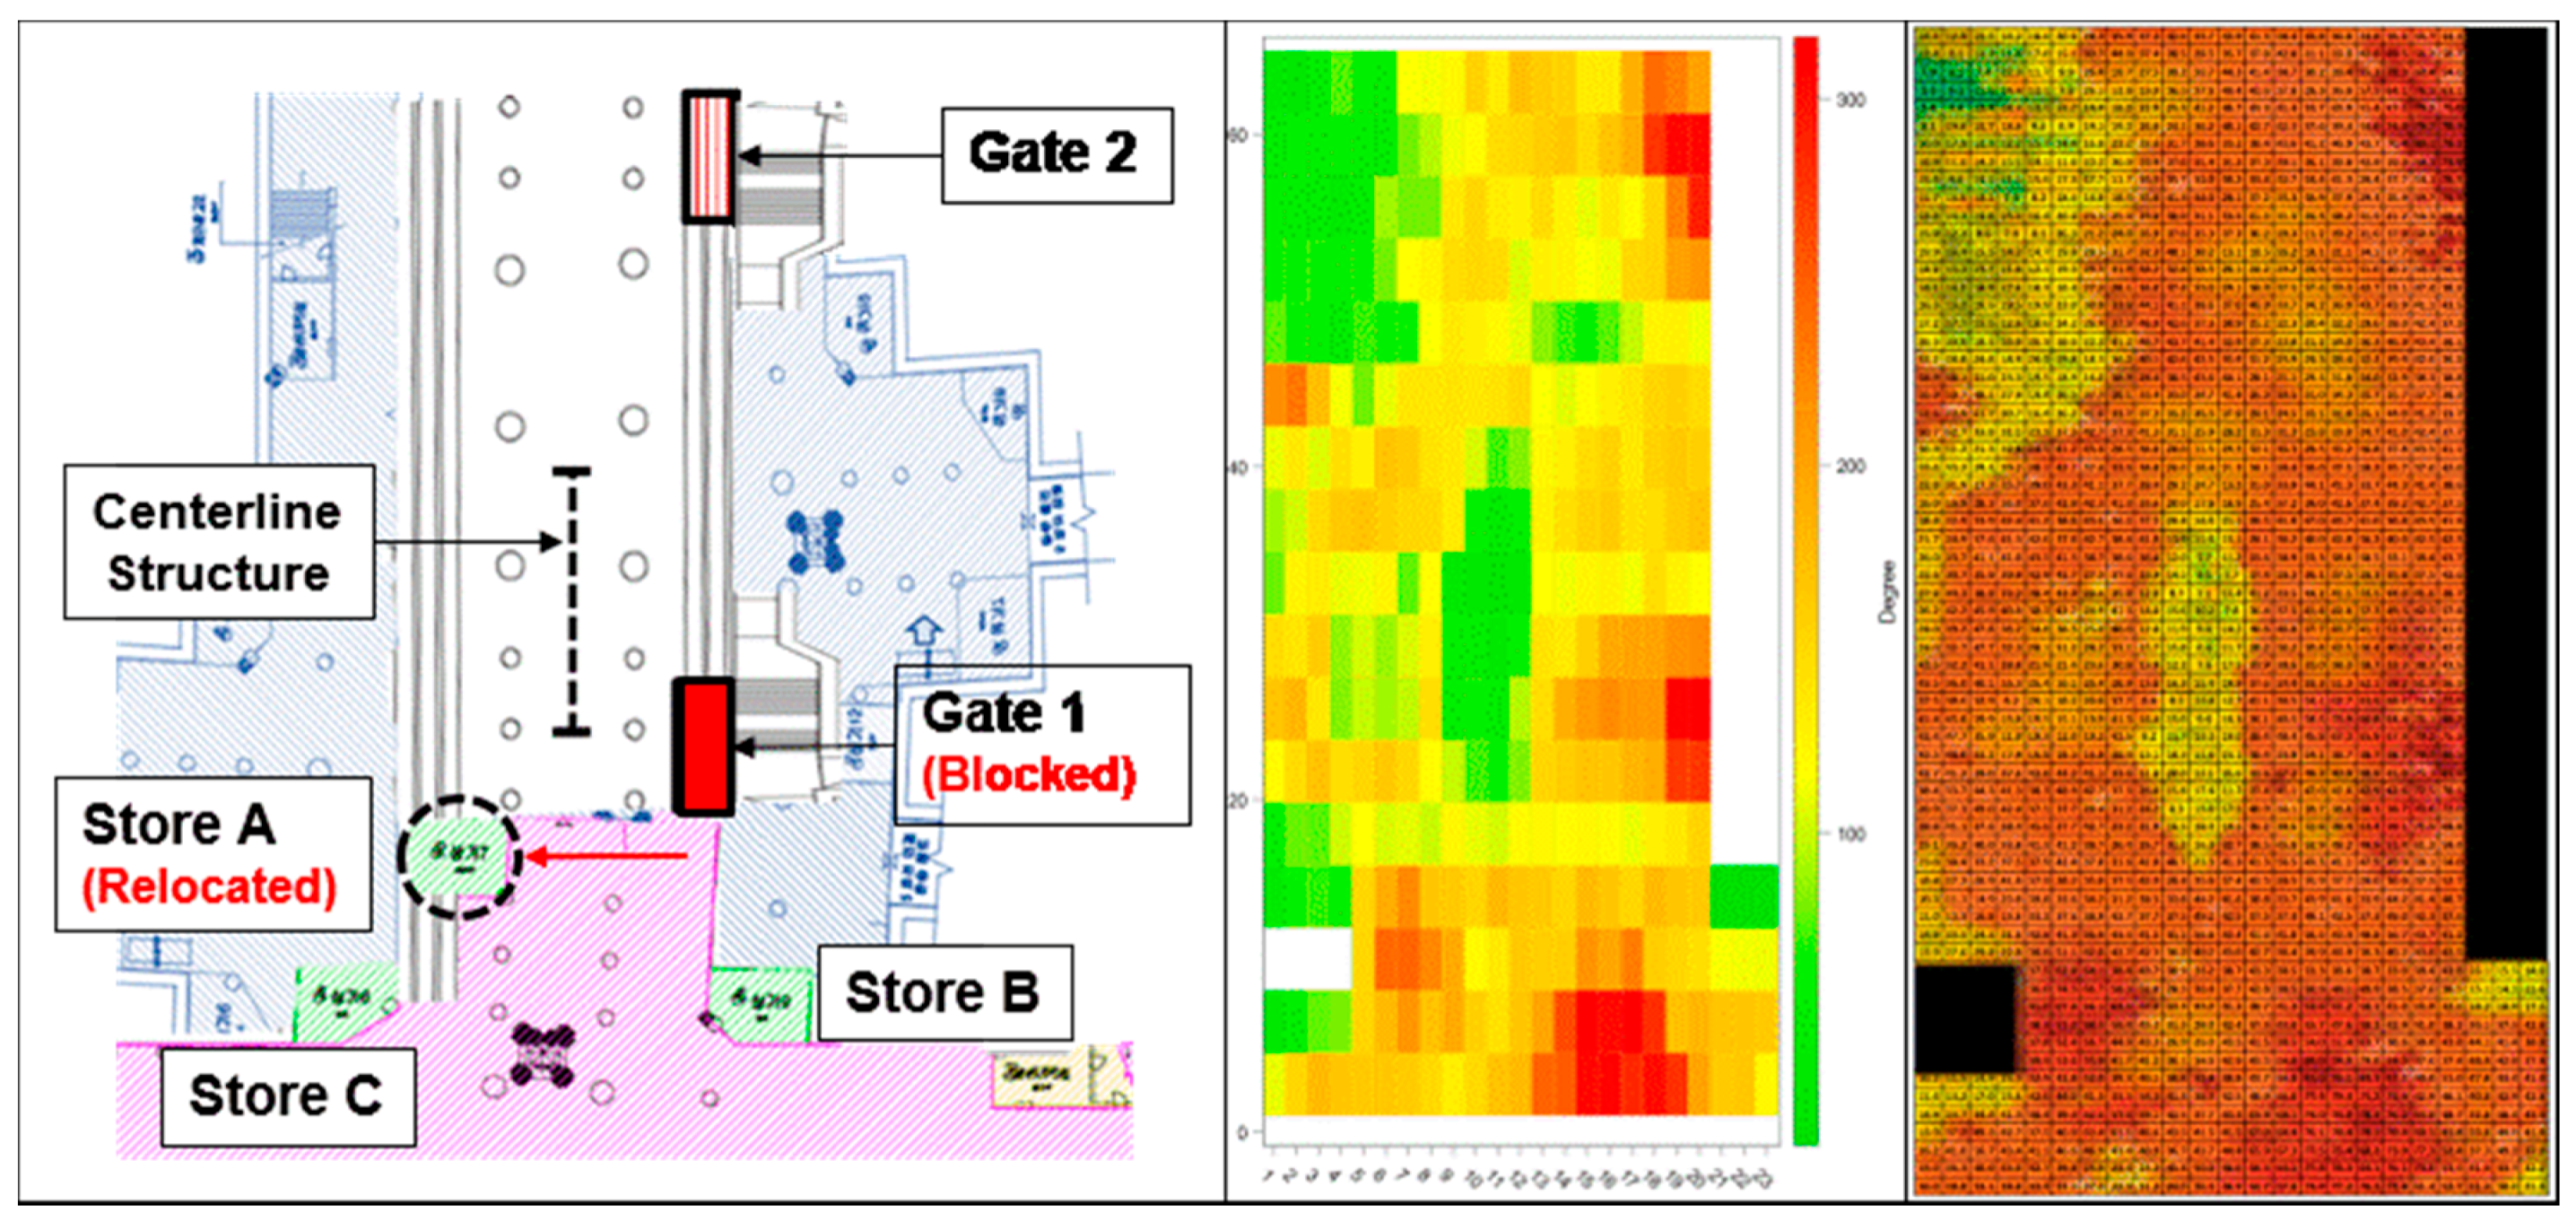
Using the results of the first-round analysis of real-time cumulative heatmaps, we proposed three solutions for rearranging the station to improve pedestrian flow. To study the effectiveness of these proposed solutions after they were implemented, we collected new sensing data for three months from February 2019 in the same format, and compared the results after the rearrangement with the original heatmap. As shown in Figure 6, we found that the presence of red in the heatmap had clearly been reduced by the rearrangement. Additionally, we found that the handrail installed along the center of the corridor, indicated by the yellow region, had a positive effect on traffic flow. We confirmed that the left hand-heavy traffic phenomenon observed in the original heatmap was reduced by the blocking of Gate 1 with a shutter and the relocating of Store A. We conducted a more detailed analysis of Figure 6 that found, encouragingly, that both directions of pedestrian traffic, which were previously observed to be biased toward the gate side of the corridor, began to walk on the right side of their own will. As shown in the figure, after rearrangement, more people were found on the left side of the corridor opposite Gate 1. Indeed, it can be observed that the heatmap is overall a pale orange, indicating a more uniform distribution of pedestrian traffic. We found that such a simple handrail structure acted as a behavioral restriction on the pedestrians, encouraging people to make their own effective choices. In effect, we were able to determine that the ascendant and descendant walkers chose to make the right pass according to their respective criteria when confronted with the centerline handrail structure. Overall, we found that congestion was dispersed by the suggested rearrangement, thereby increasing overall traffic efficiency.
As shown in Figure 6, we also presented two types of heatmaps after the rearrangement. This is the temporary mapping method (middle-side figure) implemented with one-day static data, and the other is the periodic mapping method (right-side figure) implemented with three-months accumulative data. Comparing the two types of heatmaps, it can be seen that the periodic mapping method looks more fluid because it uses three months of cumulative data. As explained earlier, we are convinced that these results provide sufficient basis for our model to monitor real-time pedestrian congestion.
We are convinced that this phenomenon of traffic redistribution is another validation of the so-called “nudge effect”, which has been studied in the field of behavioral economics and was posited by Richard Thaler to describe the application of simple tools or signals to cause certain people to constrain or trigger their own actions [43].
5. Conclusions
In this study, we built a grid signal sensor system in a subway station to collect pedestrian location data for traffic analysis. These pedestrian location data, obtained via the MAC ID of pedestrian mobile Wi-Fi devices, was collected in 15 second intervals for three months to build an analytical model. In particular, we found that the escalator and stairway leading to Gate 1, which allows for a shorter transfer distance between subway lines than Gate 2, exhibit a considerable degree of congestion. We noticed not only that the transfer corridor was crowded with people during commute time, but also that there were many factors that interfered with pedestrian traffic flow, indicating an ineffective arrangement in the corridor. The real-time density model we created and visualized was then used to determine where pedestrian accumulation density over time was excessive, and to inform three proposed improvements to the station to allow users to move more efficiently during crowded times: we closed Gate 1 during congested times, moved a shop that disturbed the movement of pedestrians to the other side of the corridor, and installed a centerline handrail structure to encourage traffic division and path dispersion. After the proposed physical rearrangements were implemented in the subway station, we collected and analyzed three months of follow-up data using the model and confirmed that the congestion in the identified area of the subway station was reduced. Thus, we were able to confirm the academic contributions and practical implications of the data collection and modeling method proposed in this study.
This study makes the following three main academic contributions:
- We applied the fingerprinting technique for indoor positioning to an actual subway station rather than an experimental space, proving that fingerprinting can be used to analyze the movement data of pedestrians in an uncontrolled space and develop a real-time model.
- We proposed a more sophisticated modeling method based on a newly devised technique for accumulating and cumulatively analyzing moving information data of pedestrians for a specific period rather than analyzing it by the conventional intersection method. We introduced advanced analytical techniques to visualize the degree of congestion by calculating the traffic density using sensor technology with CVMO to create heatmaps. This is more capable than past technologies that have simply presented data using existing image capturing techniques.
- We were able to confirm the behavioral insights on pedestrian traffic flow we identified in the first round analysis using a second-round study. The closing of Gate 1 during congested times to force transfers to walk farther and the relocation of Store, A, which was an obstacle, showed positive effects on pedestrian flow. We also confirmed the action of the “nudge effect” by installing a centerline handrail to separate traffic and induce path dispersion. We used this rail as a kind of hedge to guide people to their destination on their way along a certain section of the route, leading them to make effective walking choices on their own. Indeed, ascending and descending walkers used the centerline structure to incorporate their movement into righthand traffic according to their own standards. As a result, we found that traffic efficiency increased.
We expect that our findings will contribute to further elucidating behavioral economics, and accordingly, this study has many practical implications. We proposed a method to more effectively monitor pedestrian traffic in metro stations that will be prepared for future smart city applications. Upgrading metro systems is an indispensable part of building a smart city in more advanced and populous metropolitan areas. This research has not only helped to solve pedestrian congestion more directly by using sensors, but also helped to prevent accidents and improve public order. Additionally, the model we developed in this study can detect congestion in real time, allowing operators to respond instantly, so it should be readily commercializable and exportable.
Our study analyzed and developed a pedestrian congestion prevention model using pedestrian location information. In the current study, pedestrian speed was measured by calculating the moving distance of the pedestrian for a certain time based on the pedestrian’s mobile device MAC ID. However, we have not yet been able to develop a new model that considers this speed due to various constraints such as limited time and project cost. We hope to propose more sophisticated methods and new insights by creating a model that considers both pedestrian density as well as speed in subsequent research. Additionally, in this project, we developed a model for only a single subway station. In future studies, we hope to perform similar analyses on more stations using other sensing methods, such as dead reckoning or a fusion method, in addition to fingerprinting. We will further develop models that utilize heatmaps in complex subway stations with many transit sections, as well as modeling individual walking speeds over IPS to find more accurate bottlenecks and resolve them. Our method can be used in everyday life to help detect inefficient paths and cope with building more advanced smart cities. For example, we can create a model that sets anomalous phenomena at the point where the speed slows by more than two-standard deviations than the average speed in all areas of the subway station. We expect this basic model to be the foundation for building sophisticated and efficient smart city systems. We also expect that our research will provide additional ideas for other researchers and serve as a motivation for their research, making their follow-up studies more diverse candidates for constructing systematic smart cities.
Author Contributions
Formal analysis, S.H. and J.K.; Investigation, Z.L.; Methodology, S.H. and J.K.; Project administration, J.K.; Resources, J.K.; Validation, Z.L.; Writing—original draft, S.H. and J.K.; Writing—review & editing, Z.L. and J.K.
Funding
This work was supported by the Sun Moon University Research Grant of 2019.
Conflicts of Interest
The authors declare no conflict of interest.
References
- Ringenson, T.; Höjer, M.; Kramers, A.; Viggedal, A. Digitalization and Environmental Aims in Municipalities. Sustainability 2018, 10, 1278. [Google Scholar] [CrossRef]
- Kim, J.; Hwangbo, H. Sensor-Based Optimization Model for Air Quality Improvement in Home IoT. Sensors 2018, 18, 959. [Google Scholar] [CrossRef] [PubMed]
- Allam, Z.; Newman, P. Redefining the Smart City: Culture, Metabolism and Governance. Smart Cities 2018, 1, 4–25. [Google Scholar] [CrossRef]
- El Manaily, E.; Rabbou, M.A.; El-Shazly, A.; Baraka, M. Enhanced Local Ionosphere Model for Multi-Constellations Single Frequency Precise Point Positioning Applications: Egyptian Case Study. Artif. Satell. 2018, 53, 141–157. [Google Scholar] [CrossRef]
- Mouri, A.; Karatsu, Y.; Okuda, G.; Sugimoto, S.; Kubo, Y.; Ohashi, M. New PPP/VPPP Algorithms by using Multiple Antennas. Trans. Inst. Syst. Control Inf. Eng. 2016, 29, 525–534. [Google Scholar] [CrossRef]
- Mohammadi, M.; Al-Fuqaha, A.; Guizani, M.; Oh, J.-S. Semisupervised Deep Reinforcement Learning in Support of IoT and Smart City Services. IEEE Internet Things J. 2017, 5, 624–635. [Google Scholar] [CrossRef]
- Bellini, P.; Cenni, D.; Nesi, P.; Paoli, I. Wi-Fi based city users’ behaviour analysis for smart city. J. Vis. Lang. Comput. 2017, 42, 31–45. [Google Scholar] [CrossRef]
- Li, Z.; Zhao, X.; Liang, H. Automatic Construction of Radio Maps by Crowdsourcing PDR Traces for Indoor Positioning. In Proceedings of the IEEE International Conference on Communications (ICC), Kansas City, MO, USA, 20–24 May 2018; pp. 1–6. [Google Scholar]
- De Angelis, A.; Moschitta, A.; Carbone, P.; Calderini, M.; Neri, S.; Borgna, R.; Peppucci, M. Design and Characterization of a Portable Ultrasonic Indoor 3-D Positioning System. IEEE Trans. Instrum. Meas. 2015, 64, 2616–2625. [Google Scholar] [CrossRef]
- Wang, C.; Wang, L.; Chi, X.; Liu, S.; Shi, W.; Deng, J. The research of indoor positioning based on visible light communication. China Commun. 2015, 12, 85–92. [Google Scholar] [CrossRef]
- Xu, H.; Ding, Y.; Li, P.; Wang, R.; Li, Y. An RFID Indoor Positioning Algorithm Based on Bayesian Probability and K-Nearest Neighbor. Sensors 2017, 17, 1806. [Google Scholar] [CrossRef]
- Kantarci, B.; Mouftah, H.T. Sensing services in cloud-centric Internet of Things: A survey, taxonomy and challenges. In Proceedings of the IEEE International Conference on Communication Workshop (ICCW), London, UK, 8–12 June 2015; pp. 1865–1870. [Google Scholar]
- De Blasio, G.; Quesada-Arencibia, A.; García, C.R.; Molina-Gil, J.M.; Caballero-Gil, C. Study on an Indoor Positioning System for Harsh Environments Based on Wi-Fi and Bluetooth Low Energy. Sensors 2017, 17, 1299. [Google Scholar] [CrossRef] [PubMed]
- He, S.; Chan, S.-H.G. Wi-Fi Fingerprint-Based Indoor Positioning: Recent Advances and Comparisons. IEEE Commun. Surv. Tutor. 2015, 18, 466–490. [Google Scholar] [CrossRef]
- Yang, C.; Shao, H.R. WiFi-based indoor positioning. IEEE Commun. Mag. 2015, 53, 150–157. [Google Scholar] [CrossRef]
- Xie, C.; Guan, W.; Wu, Y.; Fang, L.; Cai, Y.; Wu, X. The LED-ID Detection and Recognition Method Based on Visible Light Positioning Using Proximity Method. IEEE Photonics J. 2018, 10, 1–16. [Google Scholar] [CrossRef]
- Kim, H.; Han, S. Accuracy Improvement of Real-Time Location Tracking for Construction Workers. Sustainability 2018, 10, 1488. [Google Scholar] [CrossRef]
- Ban, R.; Kaji, K.; Hiroi, K.; Kawaguchi, N. Indoor positioning method integrating pedestrian Dead Reckoning with magnetic field and WiFi fingerprints. In Proceedings of the Eighth International Conference on Mobile Computing and Ubiquitous Networking (ICMU), Hakodate, Japan, 20–22 January 2015; pp. 167–172. [Google Scholar]
- Zou, H.; Chen, Z.; Jiang, H.; Xie, L.; Spanos, C. Accurate indoor localization and tracking using mobile phone inertial sensors, WiFi and iBeacon. In Proceedings of the IEEE International Symposium on Inertial Sensors and Systems (INERTIAL), Kauai, HI, USA, 27–30 March 2017; pp. 1–4. [Google Scholar]
- Pratama, A.R.; Widyawan; Hidayat, R. Smartphone-based pedestrian dead reckoning as an indoor positioning system. In Proceedings of the International Conference on System Engineering and Technology (ICSET), Bandung, Indonesia, 11–12 September 2012; pp. 1–6. [Google Scholar]
- Zhang, K.; Wang, M.; Wei, B.; Sun, D. Identification and Prediction of Large Pedestrian Flow in Urban Areas Based on a Hybrid Detection Approach. Sustainability 2017, 9, 36. [Google Scholar] [CrossRef]
- Sung, Y. RSSI-Based Distance Estimation Framework Using a Kalman Filter for Sustainable Indoor Computing Environments. Sustainability 2016, 8, 1136. [Google Scholar] [CrossRef]
- Middleton, J. Sense and the city: Exploring the embodied geographies of urban walking. Soc. Cult. Geogr. 2010, 11, 575–596. [Google Scholar] [CrossRef]
- Marcus, L.; Giusti, M.; Barthel, S. Cognitive affordances in sustainable urbanism: Contributions of space syntax and spatial cognition. J. Urban Des. 2016, 21, 439–452. [Google Scholar] [CrossRef]
- Li, X.; Lv, Z.; Zheng, Z.; Zhong, C.; Hijazi, I.H.; Cheng, S. Assessment of lively street network based on geographic information system and space syntax. Multimed. Tools Appl. 2017, 76, 17801–17819. [Google Scholar] [CrossRef]
- Cenci, L.; Disperati, L.; Persichillo, M.G.; Oliveira, E.R.; Alves, F.L.; Phillips, M. Integrating remote sensing and GIS techniques for monitoring and modeling shoreline evolution to support coastal risk management. GISci. Remote Sens. 2018, 55, 355–375. [Google Scholar] [CrossRef]
- Zheng, Y.; Wu, W.; Chen, Y.; Qu, H.; Ni, L.M. Visual Analytics in Urban Computing: An Overview. IEEE Trans. Big Data 2016, 2, 276–296. [Google Scholar] [CrossRef]
- Nakaya, T.; Yano, K. Visualising Crime Clusters in a Space-time Cube: An Exploratory Data-analysis Approach Using Space-time Kernel Density Estimation and Scan Statistics. Trans. GIS 2010, 14, 223–239. [Google Scholar] [CrossRef]
- Demar, U.; Buchin, K.; van Loon, E.E.; Shamoun-Baranes, J. Stacked space-time densities: A geovisualisation approach to explore dynamics of space use over time. GeoInformatica 2015, 19, 85–115. [Google Scholar] [CrossRef]
- Picon, A. Urban Infrastructure, Imagination and Politics: From the Networked Metropolis to the Smart City. Int. J. Urban Reg. Res. 2018, 42, 263–275. [Google Scholar] [CrossRef]
- Caragliu, A.; del Bo, C.F. Smart innovative cities: The impact of Smart City policies on urban innovation. Technol. Forecast. Soc. Chang. 2019, 142, 373–383. [Google Scholar] [CrossRef]
- Cowley, R.; Joss, S.; Dayot, Y. The smart city and its publics: Insights from across six UK cities. Urban Res. Pract. 2018, 11, 53–77. [Google Scholar] [CrossRef]
- D’Aquin, M.; Davies, J.; Motta, E. Smart Cities’ Data: Challenges and Opportunities for Semantic Technologies. IEEE Internet Comput. 2015, 19, 66–70. [Google Scholar] [CrossRef]
- Wu, S.M.; Chen, T.-C.; Wu, Y.J.; Lytras, M. Smart Cities in Taiwan: A Perspective on Big Data Applications. Sustainability 2018, 10, 106. [Google Scholar] [CrossRef]
- Krishnamachari, B.; Power, J.; Kim, S.H.; Shahabi, C. I3: An IoT marketplace for smart communities. In Proceedings of the 16th Annual International Conference on Mobile Systems, Applications, and Services, Munich, Germany, 10–15 June 2018; pp. 498–499. [Google Scholar]
- Visvizi, A.; Lytras, M.D. Rescaling and refocusing smart cities research: From mega cities to smart villages. J. Sci. Technol. Policy Manag. 2018, 9, 134–145. [Google Scholar] [CrossRef]
- Leitner, H.; Sheppard, E.; Webber, S.; Colven, E. Globalizing urban resilience. Urban Geogr. 2018, 39, 1276–1284. [Google Scholar] [CrossRef]
- De Falco, S.; Angelidou, M.; Addie, J.P.D. From the “smart city” to the “smart metropolis”? Building resilience in the urban periphery. Eur. Urban Reg. Stud. 2019, 26, 205–223. [Google Scholar] [CrossRef] [Green Version]
- Abdel-Basset, M.; Mohamed, M. The role of single valued neutrosophic sets and rough sets in smart city: Imperfect and incomplete information systems. Measurement 2018, 124, 47–55. [Google Scholar] [CrossRef] [Green Version]
- Yigitcanlar, T.; Kamruzzaman, M. Does smart city policy lead to sustainability of cities? Land Use Policy 2018, 73, 49–58. [Google Scholar] [CrossRef]
- Visvizi, A.; Lytras, M.D.; Damiani, E.; Mathkour, H. Policy making for smart cities: Innovation and social inclusive economic growth for sustainability. J. Sci. Technol. Policy Manag. 2018, 9, 126–133. [Google Scholar] [CrossRef] [Green Version]
- Hwangbo, H.; Kim, J.; Kim, S.; Lee, Z. Store layout optimization using indoor positioning system. Int. J. Distrib. Sens. Netw. 2017, 13, 1550147717692585. [Google Scholar] [CrossRef]
- Benartzi, S.; Beshears, J.; Milkman, K.L.; Sunstein, C.R.; Thaler, R.H.; Shankar, M.; Tucker-Ray, W.; Congdon, W.; Galing, S. Should Governments Invest More in Nudging? SSRN Electron. J. 2017, 28, 1041–1055. [Google Scholar]
Figure 1.
General process for building a smart city project.

Figure 2.
Layout of sensor installation in the subway map.

Figure 3.
Hadoop-based infrastructure.

Figure 4.
Cumulative visibility of moving objects.

Figure 5.
Heatmap on rush hour (before rearrangement).

Figure 6.
Heatmap on rush hour (after rearrangement).


Table 1.
Types of IPS (Indoor Positioning Systems).
| Type | Description | Literatures |
|---|---|---|
| Triangulation | The location of the mobile device is located at a point where three circles intersect each other with a distance between the mobile device and the three AP devices. | De Angelis et al. [9]; Wang et al. [10]; Xu et al. [11]; Kantarci and Mouftah [12] |
| Fingerprinting | Divide the indoor space into a certain range and store the position value of the Reference Point (RP) in the database. Then, measure the distance by measuring the position value and the signal strength from the AP device to the mobile device. | Blasio et al. [13]; He and Chan [14]; Yang et al. [15] |
| Proximity | Measures the proximity of the sensor and AP device that already knows the position and find out its position. | Xie et al. [16]; Alarifi et al. [17] |
| Dead Reckoning | The current position is estimated by measuring the moving distance according to the direction in which the pedestrian moves from the initial position. | Ban et al. [18]; Zou et al. [19]; Pratama et al. [20] |
| Fusion | Improves accuracy through a combination of technologies, such as the integration of GPS and INS. | Kumar et al. [21]; Chen et al. [22] |
Table 2.
The value category and their technologies in the smart city.
| Five Value of Smart City | Ref. | Service Domain | Development Stage | ||
|---|---|---|---|---|---|
| Current Commercial Technology | Advanced Leading Technology | Future Innovation Technology | |||
| Convenience | [34,35] | Transportation, Home IoT, Smart Health, Connected Car | Smart Sensor, Wi-Fi, Payment System | Smart Measuring, IP Camera | Power Regulator, Automatic Driving |
| Competitiveness | [36] | Finance, Manufacturing, Distribution, Agriculture | Cloud, LCD Projector, Card Reader | Contact Breaker, WCDA, Table Monitor, | Spotter, Block Chain, Smart Farm |
| Resilience | [37,38] | Disaster Mgmt., Welfare, Enhancement Recognition | Beacon, Web touchscreen | Wearable Tag, AI Speaker, U-health | LPWA, Augmented Reality |
| Efficiency | [39] | Smart Infra, Data-hub, Governance | LTE, Digital Board, LED lighting | Weather Research Craft, | LSN, LORA |
| Sustainability | [40,41] | Environment Mgmt., Building Mgmt., CEMS | Video Gallery, Firewall System | Classifying System, Crosswalk Safety | Sensor Wall, SCHM, CM |
Table 3.
Sample of data array.
| Detector Id | Site Id | Site | Time | MAC Id | Coordinate |
|---|---|---|---|---|---|
| D86595040805 | 35 | Hallway (B2F) ↑ | 08:12:00 | fnac5755d72a20db4ff6c8b2e14 | (0.73, 0.14) |
| D86595040805 | 35 | 08:12:15 | fnac5755d72a20db4ff6c8b2e14 | (0.69, 0.82) | |
| D8659504098G | 24 | Line 5 (B3F) ↓ | 21:37:45 | c3c1f575cb03a6512754da6c8ka | (0.89, 0.53) |
| D8659504098G | 24 | 21:38:00 | c3c1f575cb03a6512754da6c8ka | (0.90, 0.49) | |
| D8659504098G | 24 | 21:38:15 | c3c1f575cb03a6512754da6c8ka | (0.87, 0.52) | |
| D86595040844 | 86 | Line 7 (B2F) ↑ | 16:32:30 | Vf1r459bfb541f9e842caf355r2 | (0.52, 0.14) |
| D86595040844 | 86 | 16:32:45 | Vf1r459bfb541f9e842caf355r2 | (0.48, 0.19) |
© 2019 by the authors. Licensee MDPI, Basel, Switzerland. This article is an open access article distributed under the terms and conditions of the Creative Commons Attribution (CC BY) license (http://creativecommons.org/licenses/by/4.0/).
Share and Cite
MDPI and ACS Style
Hwang, S.; Lee, Z.; Kim, J. Real-Time Pedestrian Flow Analysis Using Networked Sensors for a Smart Subway System. Sustainability 2019, 11, 6560. https://doi.org/10.3390/su11236560
AMA Style
Hwang S, Lee Z, Kim J. Real-Time Pedestrian Flow Analysis Using Networked Sensors for a Smart Subway System. Sustainability. 2019; 11(23):6560. https://doi.org/10.3390/su11236560
Chicago/Turabian StyleHwang, Sewoong, Zoonky Lee, and Jonghyuk Kim. 2019. "Real-Time Pedestrian Flow Analysis Using Networked Sensors for a Smart Subway System" Sustainability 11, no. 23: 6560. https://doi.org/10.3390/su11236560
Note that from the first issue of 2016, this journal uses article numbers instead of page numbers. See further details here.