GIS-Based Livelihood Vulnerability Index Mapping of the Socioeconomy of the Pekan Community


1
Institute for Environment and Development (LESTARI), Universiti Kebangsaan Malaysia, UKM Bangi, Selangor Darul Ehsan 43600, Malaysia
2
Smart & Sustainable Township Research Center (SUTRA) & Civil Engineering Program, Faculty of Engineering and Built Environment, Universiti Kebangsaan Malaysia, UKM Bangi, Selangor Darul Ehsan 43600, Malaysia
*
Author to whom correspondence should be addressed.
Sustainability 2019, 11(24), 6935; https://doi.org/10.3390/su11246935
Submission received: 9 October 2019
/
Revised: 20 November 2019
/
Accepted: 21 November 2019
/
Published: 5 December 2019
Abstract
:Monsoon floods that annually hit the east coast of Malaysia have brought a variety of implications, especially for those who inhabit the most vulnerable areas. This study aims to find the relationship between the socioeconomy of the community living and flood events in the district of Pekan, Pahang. This involved geographic analyses which combined data on vulnerability index components represented by Geographical Information System (GIS) mapping. A field survey was conducted to assess the Livelihood Vulnerability Index (LVI), comprising major and sub-components of vulnerability for ten sub-districts in Pekan. LVI mapping was performed for every major component of the LVI with spatial data on the district. Households in the Gancung sub-district were found to be more vulnerable to flooding impact, with a high exposure index (0.59), but reported a positive vulnerability based on adaptive capacity (0.06). Penyur (0.51) was the most vulnerable and sensitive in terms of food security during the flood season. LVI assessment in the Pekan district could be used as an indicator to change livelihoods, survival food storage practices, and other preventive measures in order to curb damages and injuries when annual flooding strikes in the future.
1. Introduction
Flooding is a catastrophe that often strikes Malaysia. It can be said that flood events will happen every year, especially during the monsoon season. The northeastern monsoon usually begins in November and ends in late March. The eastern coastal states of Peninsular Malaysia are more affected by wind, with speeds that can reach 30 knots or more during a strong air-cooled flight from the north (cold-roaring) [1]. The states on the east coast of Peninsular Malaysia received an average amount of rain during the early- to mid-northeastern monsoon. However, during the months of November, December, and January, the maximum average rainfall causes disastrous floods [2]. Flooding is thought to be one of the worst forms of disaster that could hit the country. The crash left the country devastated by property damage, life loss, and money loss. The increase in vulnerability to flooding has increased in significance over the last 20 years [3]. Flooding also damages productive agricultural land and livestock [4]. These are important areas to mankind, and such events can put a hold on the earning of livelihoods. When a flood occurs and these areas are affected, it damages the earning potential of society for a certain amount of time [5].
The concept of vulnerability to environmental change as an interconnected process affecting both nature and culture and, in particular, poverty and lack of protection from environmental threats [6]. The Intergovernmental Panel on Climate Change (IPCC) defined vulnerability as a function of exposure, sensitivity, and adaptive capacity [7,8]. First of all, the exposure defined by the IPCC is the nature and degree to which a system is exposed to significant climate variation [8]. On the other hand, exposure can also be described in terms of objects that can experience harm from natural disasters, and includes physical and socioeconomic aspects both directly and indirectly [9]. In the context of this study, the human population living in a floodplain is considered as social exposure (in terms of the potential of mortality); and buildings and machinery are considered as physical exposure related to economic damage. These two exposure components are combined and referred to as socioeconomic exposure [10]. Secondly, sensitivity is defined as the degree to which a system is affected either by perturbations or beneficially by climate-related stimuli [8,11].
Last but not least, the adaptive capacity is defined as the ability of a system to adjust to withstand environmental hazards or policy reformation and to grow in its range of variability to cope with the consequences [8,11]. Instead of actions to break down this vulnerability of the inferior group—that is, the poorer parts of the social-ecological system—adaptive measures often reduce this vulnerability through excellent governance institutions [12]. This vulnerability has regularly been assessed through indices [13,14,15,16,17]. Most of the indices developed using socioeconomic and biophysical indicators were transformed into components of exposure, sensitivity, and adaptive capacity [10,18]. Thus, the outcome of the vulnerability assessment was mainly designed to particularly distinguish vulnerable people or communities in a region [19].
In order to analyze the average ability of households to withstand shocks, the Livelihood Vulnerability Index (LVI) approach was applied to assess the vulnerability of communities to flood impacts [6]. The approach was designed to be flexible so that development planners can refine and focus their analyses to suit the needs of each geographic area [6]. This study used the integration of contributing factors to the composite index of LVI and IPCC to estimate the impact of flooding on the community living in the flood-prone area. LVI–IPCC uses multiple indicators to assess the exposure factor of households to natural disasters and climate variability components, socio-demographic profiles, livelihood strategies, and social network characteristics which affect their adaptive capacity, as well as current health, food, water resource, land, housing, finance, and income characteristics that determine their sensitivity to flooding impacts. The LVI–IPCC framework is designed to provide a practical tool for development organizations, policy makers, and public health practitioners to aid in understanding the vulnerability of the community based on individual experiences during the flood season.
In a flood study, the Geographical Information System (GIS) is an information system used to interpret and manipulate data, as well as a source of information-based science communication to help support the needs of consumers in vulnerable communities (flood victims), civil society, and decision-makers, especially in the event of property destruction on a large scale [20]. The GIS was designed with great support and has greatly contributed to the increase in accuracy in managing predictions and preliminary flood disaster management practices [21]. The modern GIS contains a database, a model, data display (in-space graphics) and analysis, decision support, and a user interface [22,23,24,25]. The GIS approach is used to integrate various aspects related to flood disasters and reduce potential threats and risks for future generations. It is very important that it is developed as a comprehensive approach to manage disasters such as floods, whether seasonal floods or flash floods, in areas that are always flood-hit areas [26]. This study focuses on the Pahang River Basin in the decision-making process regarding the flood. The GIS built in this study is different from the GIS for flood management commonly reported based on the prediction management and early warning of floods. The GIS built here emphasizes socioeconomic data and the use of socioeconomic aspects in order to assist in the decision-making process of flood risk management. The novelty of this study is the integrated vulnerability assessment mapping that was performed in Malaysia, since this is a new angle of study.
This research aims to study the relationship between the socioeconomy of community living in the flood-prone district in Pekan, Pahang, and flood events involving geographic analyses that combine data on vulnerability index components represented by GIS mapping specifically in that area.
2. Materials and Methods
2.1. Study Area
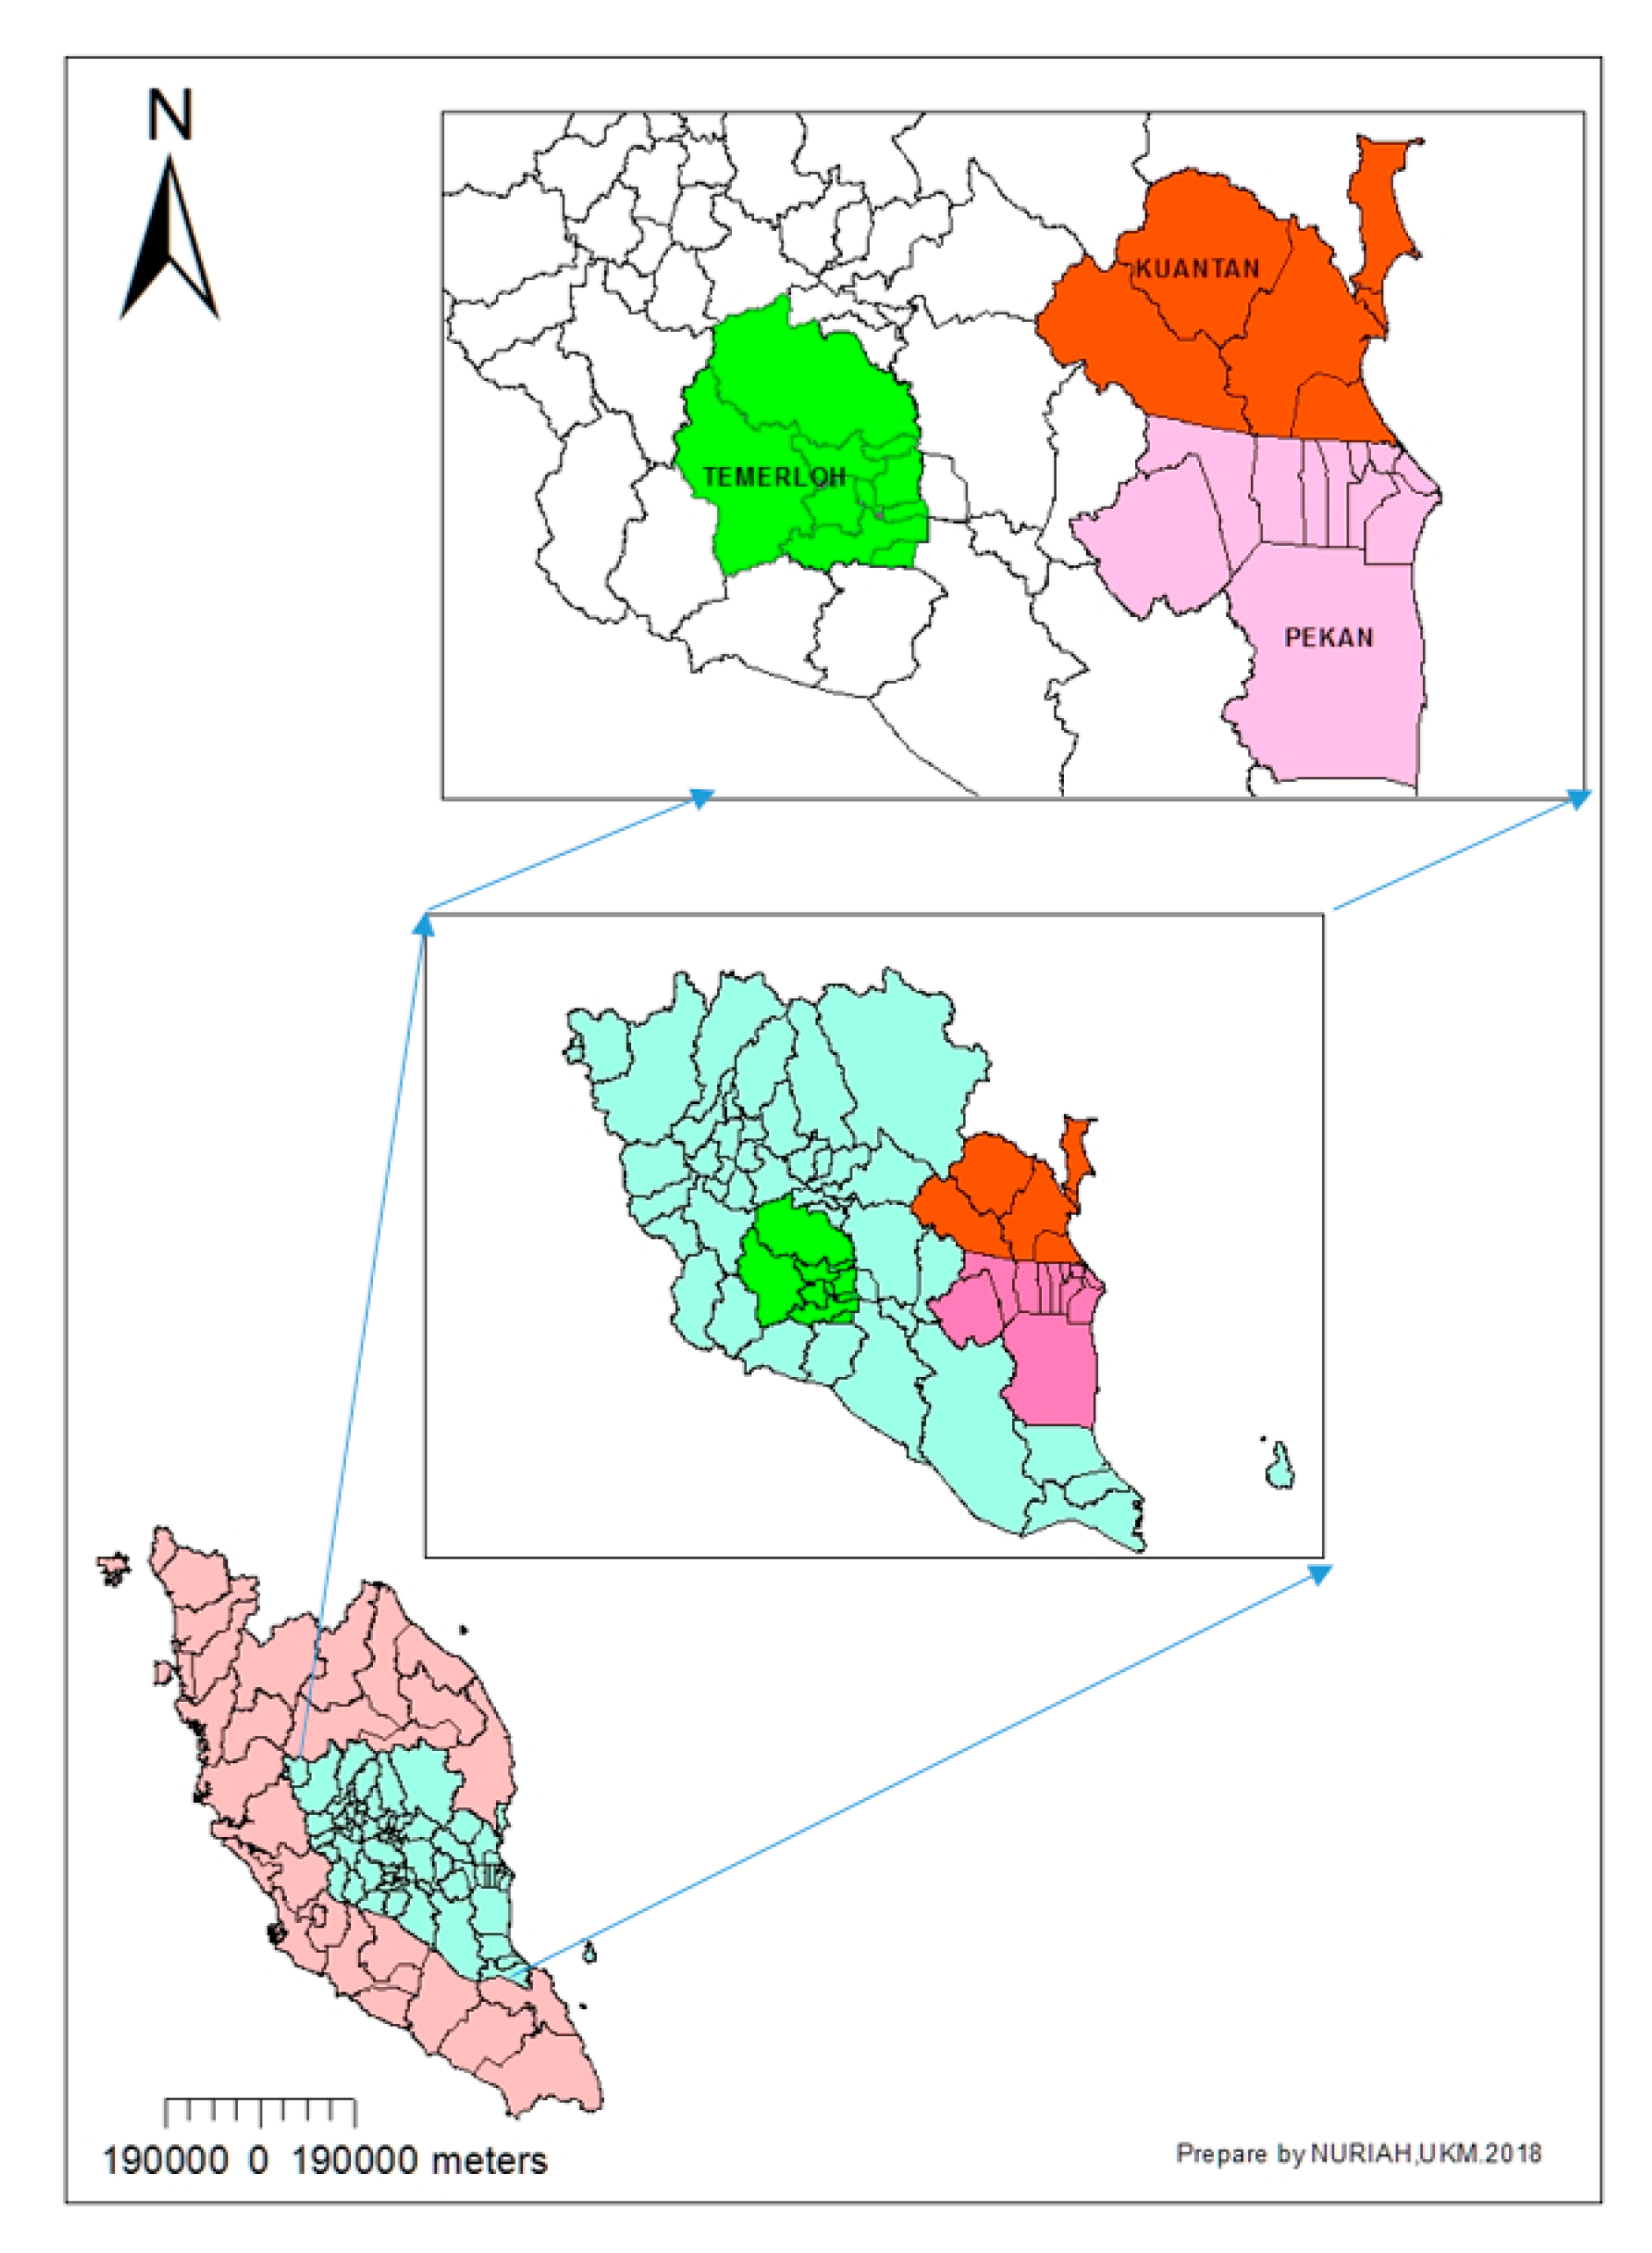
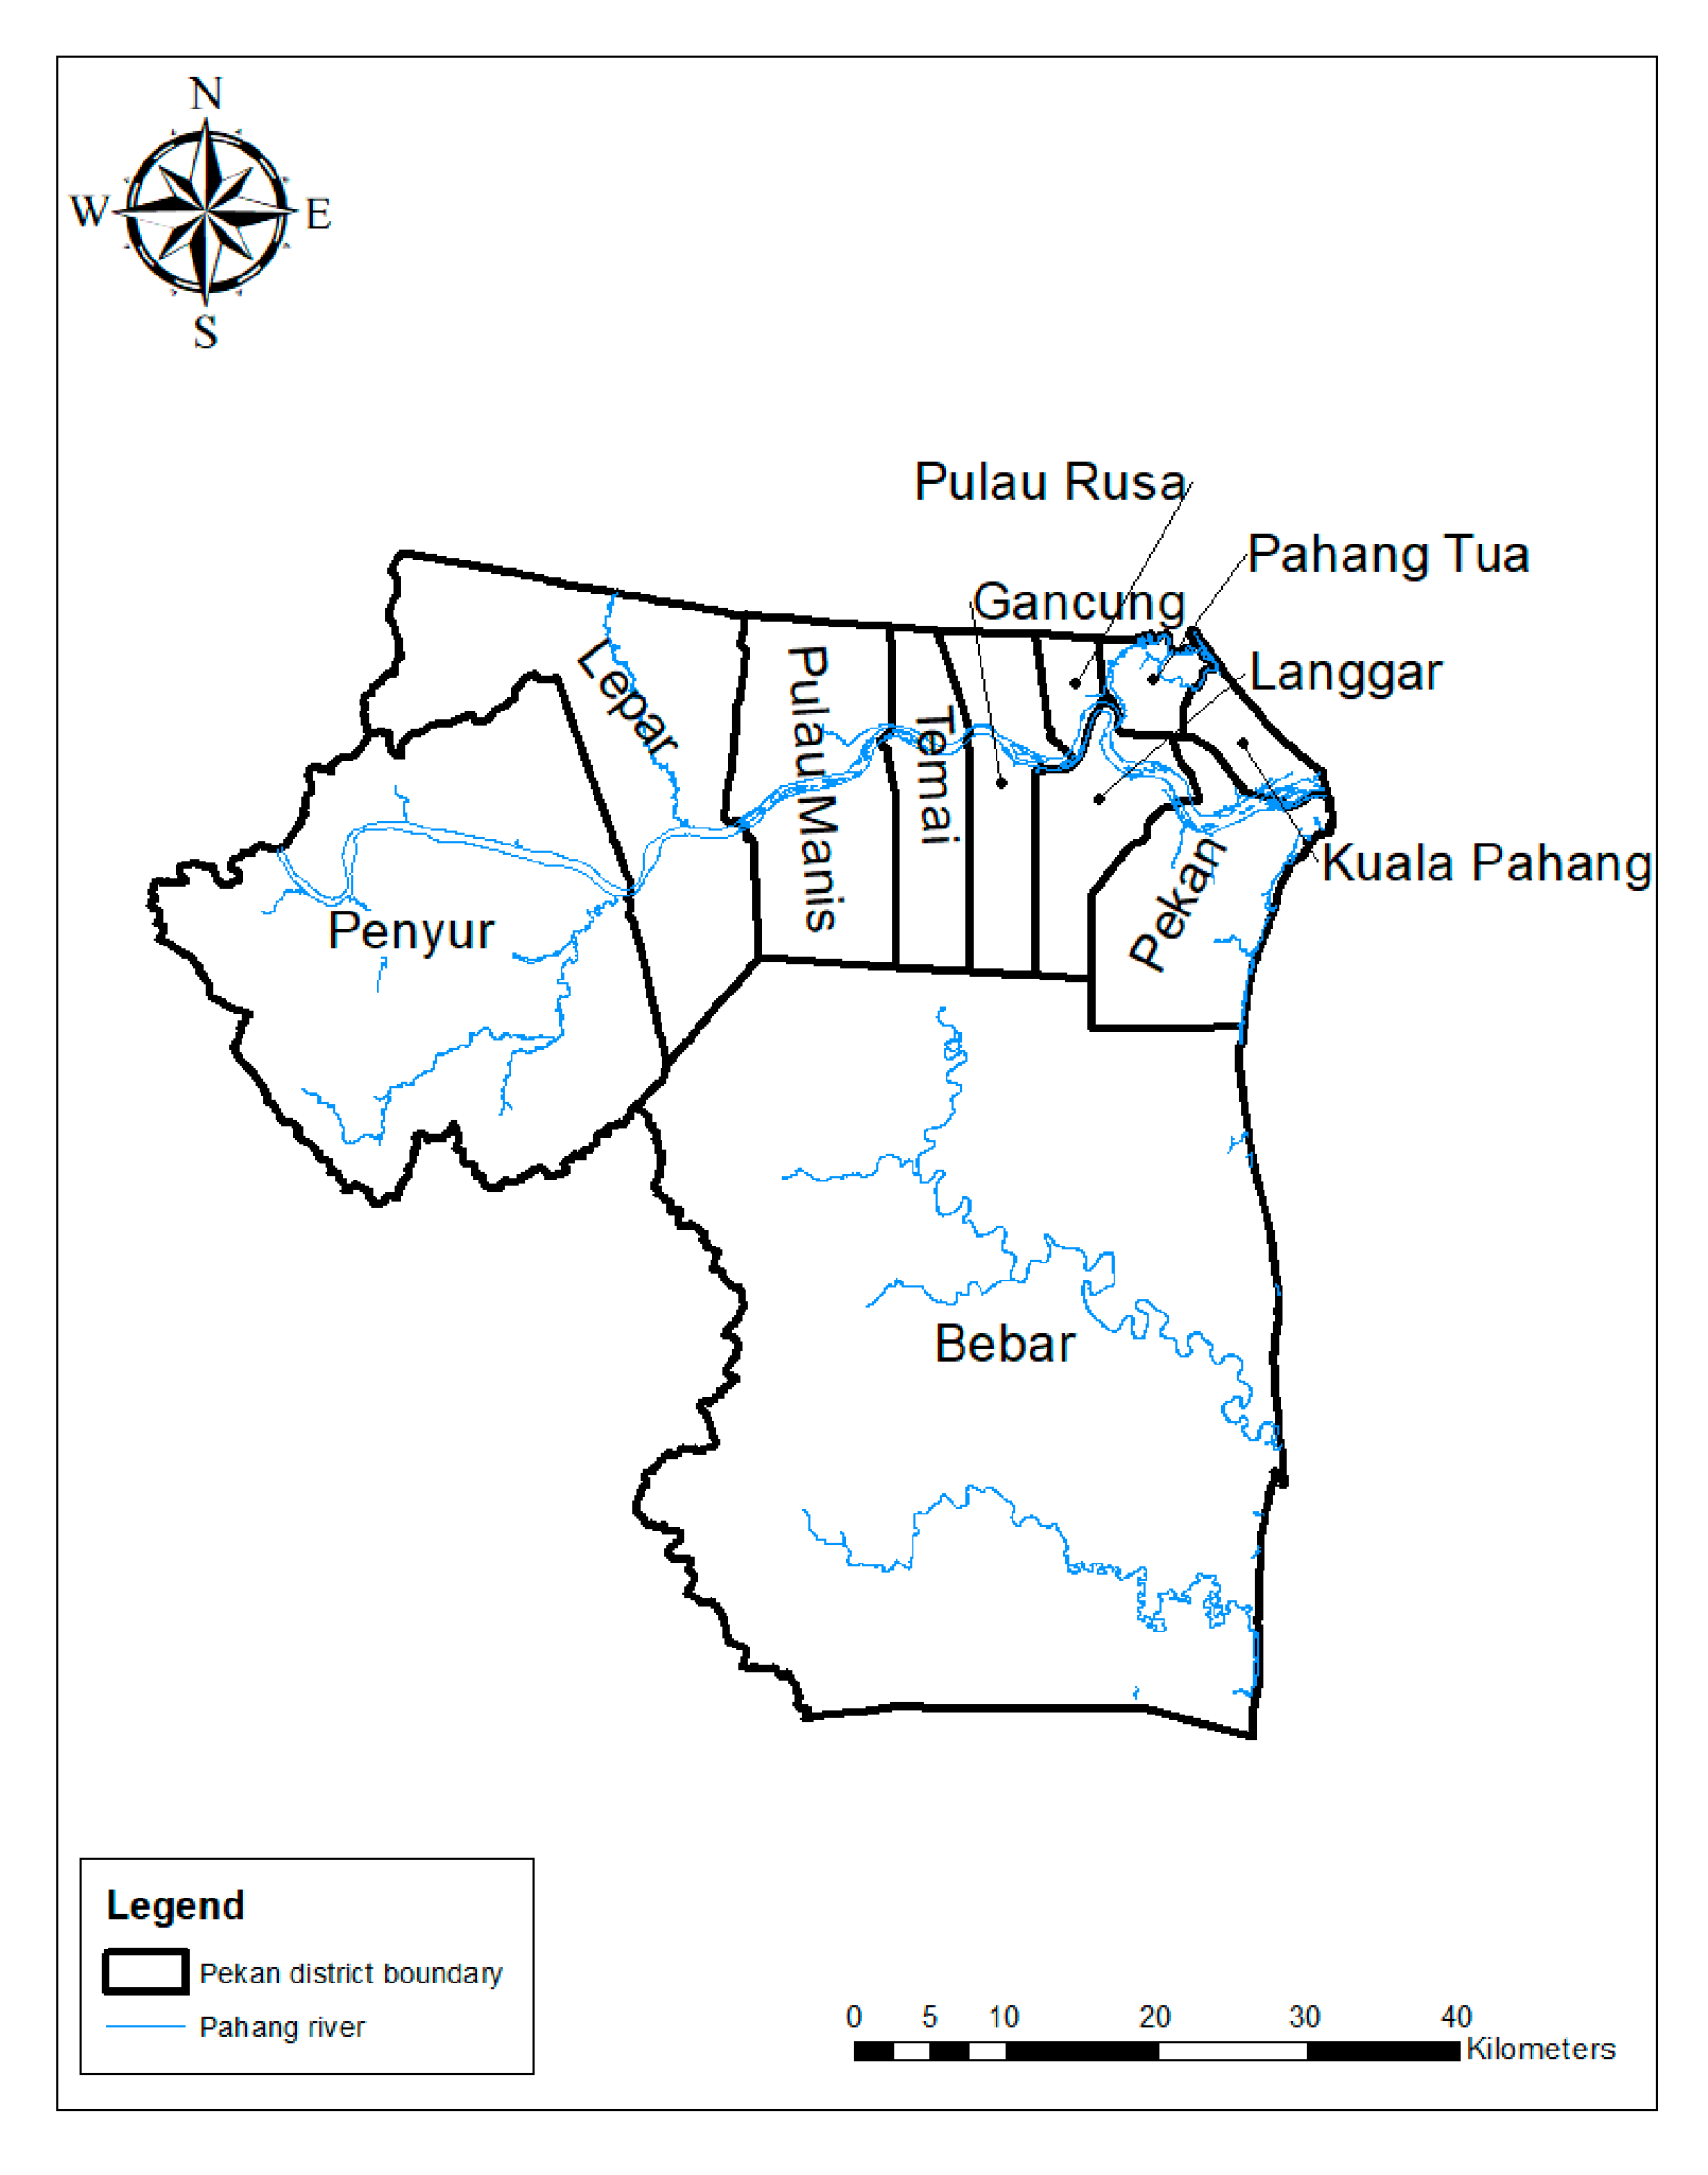
Located along the eastern coast, Pahang is one of the worst-hit areas along the east coast of Peninsular Malaysia. Annual floods take place around the Pahang River Basin, which is also the largest catchment area in Pahang state, affecting the residents and economic activities in communities living in Pekan up to the Temerloh district every year [27]. The flood in Pahang at the end of 2014 was recorded as affecting a total of 116 villages, affecting approximately 80,000 people in the districts of Pekan, Kuantan, and Temerloh (Figure 1) [28]. The flood situation in this position is capable of causing severe consequences to the people living mainly in major towns along the Pahang River, especially in Temerloh, Pekan, and Kuantan. All three of these major cities have been hit by massive floods that have brought a variety of implications, especially to those living in the most vulnerable areas. The Pekan district was selected to be the focus area of this study. It is divided into 11 sub-districts, namely Penyur, Bebar, Pahang Tua, Pulau Rusa, Pulau Manis, Gancung, Pekan, Lepar, Temai, Langgar, and Kuala Pahang (Figure 2). Pekan is a rural town with a total population of 105,822 residents [29] which has increased more than 2% in recent years [30]. The majority of its residents belong to the middle- and low-income groups. About 26.5% of the Pekan population were considered to have poverty status, with a monthly income below the Poverty Line Income (PLI) of RM520 [28]. As the royal capital of Pahang State, where major economic centers were situated along the coastline, the district’s economy is dominated by its agriculture, forestry, and fishery sectors. Pekan district has the third-largest coverage of oil palm plantations and the second-largest coverage of paddy fields in the State of Pahang. The lowland and swamp area in the town of Pekan is easily flooded when heavy rains cause water spillover from the Pahang River. Hence, communities in Pekan were the most affected among the surrounding districts during the massive flood in the year 2014 [31]. It is reported that Pekan has the highest numbers of victims compared with the other six districts that were flooded (Temerloh, Maran, Kuantan, Bera, and Jerantut), with a total of 11,154 people affected, and an estimated value of RM58 million for basic infrastructure and individual damage [4,28].
2.2. Household Surveys
The field survey was conducted in July 2019, and the primary source of the data came from people living in the Pekan district. A questionnaire comprising 42 key variables (sub-components)—derived from the 10 major components that were used in calculating the LVI—was designed, tested, and administrated at the household level (Table 1) [27]. A total of 300 residents in Pekan were interviewed referring to the flood events before the year 2019. The focus sample group of this research consisted of the residents that were living in the area most likely to flood and had a different social group. Thus, the sub-district Bebar was not included in this study, as their household was reportedly not affected during the monsoon floods in the previous years.
2.3. LVI Calculation
This paper applied the composite index approach developed to assess LVI [6,32]. The LVI in this study is comprised of ten major components—namely Socio-Demographic Profile, Livelihood Strategies, Social Networks, Health, Food, Water, Housing, Land, Finance and Income, and Natural Disasters and Climate Variability. Every major component consists of a small group of sub-components (Table 1).
The indicators were selected based on a previous study by Hanh et al. (2009) [6] and the IPCC (2001) [8]. The Socio-Demographic Profile is the first major component; it is comprised of the quantification of the dependency ratio of the population—the percentage of households in which the female is the head, their ages, whether they attended school or not, and lived with orphans and poor, compared with the number of family members in a household. The Livelihood Strategies component is based on the idea of normally adaptive responses to the key element. The major component of Livelihood Strategies is measured from percentages of individual experiences of a household with knowledge of and exposure to flooding. These strategies cover households with a family member working in a different community, whether or not they depend solely on agriculture as a source of income, and diversification of agriculture, such as animal husbandry and farming of natural resources, as well as growing crops. The Social Network major component includes sub-components to calculate the average of the ratio of the borrowing to lending of money of households, together with the percentages of the households that received help or participated as volunteers during a flood, as well as households that were not involved in any organization and did not go to their local government for assistance during the flood. The Health component is evaluated from the average time taken to reach a health facility, as well as the percentages of households with a family member having a chronic illness and got sick due to flooding, with an average of two weeks before returning to school or work. The Food major component is determined from the average of the sub-components that include the crop diversity index, percentages of households that are unable to save food during floods, and households that do not sell or barter crops for other food supplies. The Water major component is counted from the percentages of households that utilized natural water sources and the average time taken to get to the sources, households that do not have a consistent water supply, and the inverse of the average number of liters of water stored per household (1/Liters). The Housing major component is quantified by calculating the average of the following sub-components: Percentages of households with non-solid wood, houses not elevated by high ground to avoid the flood, and the housing that is affected by a flood. The Land major component is made up of two sub-components, which are the percentages of households without ownership of the land on which they live and households with a small land area. The Finance and Income major component encompassed two sub-components, which are the percentages of households that borrow money and households whose income was affected due to flooding. The last major component, Natural Disasters and Climate Variability, is calculated with the average of the following sub-components: The frequency of floods encountered by households in the past seven years, together with the percentages of households with injury or death within that period, households that lost physical assets (house or machinery) due to flooding, and households that did not receive a warning about flooding. Table 1 consists of a description of how each sub-component was measured from the adaptation of various sources of survey design [6]. Differences in every sub-component’s measurement needed to be standardized as an index. This standardization is represented in Equation (1) below:
where is the model sub-component for district d, and and are the minimum and maximum values for every sub-component, respectively. This is followed by calculating the average for standardization of the sub-components using Equation (2):
where is one of the ten major components for district d, is expressed as the sub-component of index i, and n is the number of sub-dimensions in a major dimension of . The 10 major components are Socio-Demographic Profiles (SDP), Social Networks (SN), Livelihood Strategies (LS), Health (H), Food (F), Water (W), Land (L), Housing (Hou), Finance and Income (FI), and Natural Disaster and Climate Variability (NDCV). Values for each of the ten major components for a region are calculated to be averaged in Equation (3) to obtain the LVI for the district level:
which gives:
where represents the Livelihood Vulnerability Index for district d, comprised of the weighted average of the ten major components, and is determined by a number of sub-components that combine each of the major components and proportionately contribute to the overall LVI. LVI is scaled from 0 (least vulnerable) to 1 (most vulnerable) for this study.
2.4. Incorporating the LVI–IPCC Framework Approach
This study applied the LVI–IPCC framework as the alternative approach developed by Hanh et al., integrating the LVI method with the vulnerability-contributing factors defined by the IPCC [6]. The sub-components detailed in Table 1 were used together with Equations (1), (2), and (3) to calculate the LVI–IPCC. Major components of the LVI were merged and categorized with IPCC-defined factors in Table 1, and are then calculated according to the Equation (5):
where reresents the contribution factor (exposure, sensitivity, or adaptive capacity) as defined by the IPCC for district d, is the weightage for every major component, is comprised of the major components for district d, indexed by i, and n individually represents the number of major components in their contribution factors. Once exposure, sensitivity, and adaptive capacity were calculated, the three contributing factors were combined using Equation (6):
where is the LVI for district d expressed using the IPCC vulnerability framework, is the exposure score calculated for district d (corresponding to the Natural Disaster and Climate Variability major component), is the calculated adaptive capacity score for district d (weighted average for the Socio-Demographic, Social Networks, and Livelihood Strategies major components), and S is the sensitivity score calculated for district d (weighted average of Health, Food, Water, Land, Housing, and Finance and Income major components). The LVI–IPCC is scaled from −1 (least vulnerable) to +1 (most vulnerable). A total of 42 sub-component values were computed from the scored responses of individuals in each community (Table 1). All individual scores were used for computing the values of the variable components for the community. After that, scores were verified with their respective values, and all values were found to be significant at p < 0.05 by using the three-standard deviation rule and a standard error of 0.1.
2.5. LVI Mapping Using GIS
In this study, ArcMap 10.5 software, Esri, Malaysia was used as a GIS platform to combine various aspects of data information, such as spatial data on land use and topography gained from the Pekan District Department and hydrological history data from the Department of Irrigation and Drainage [28]. Latitude and longitude coordinates of villagers’ houses surveyed in Pekan were also recorded during fieldwork to form a single layer of household locations in GIS. Absent or invalid household coordinates were removed during quality control procedures. Combined results from multiple layers in GIS will eventually integrate with socioeconomic data from a questionnaire survey. LVI for every major component were classified into four ranges of vulnerability from most invulnerable (0.000000–0.239500) to most vulnerable (0.718501–1.00000), as shown in Table 2, and mapped respectively.
3. Results
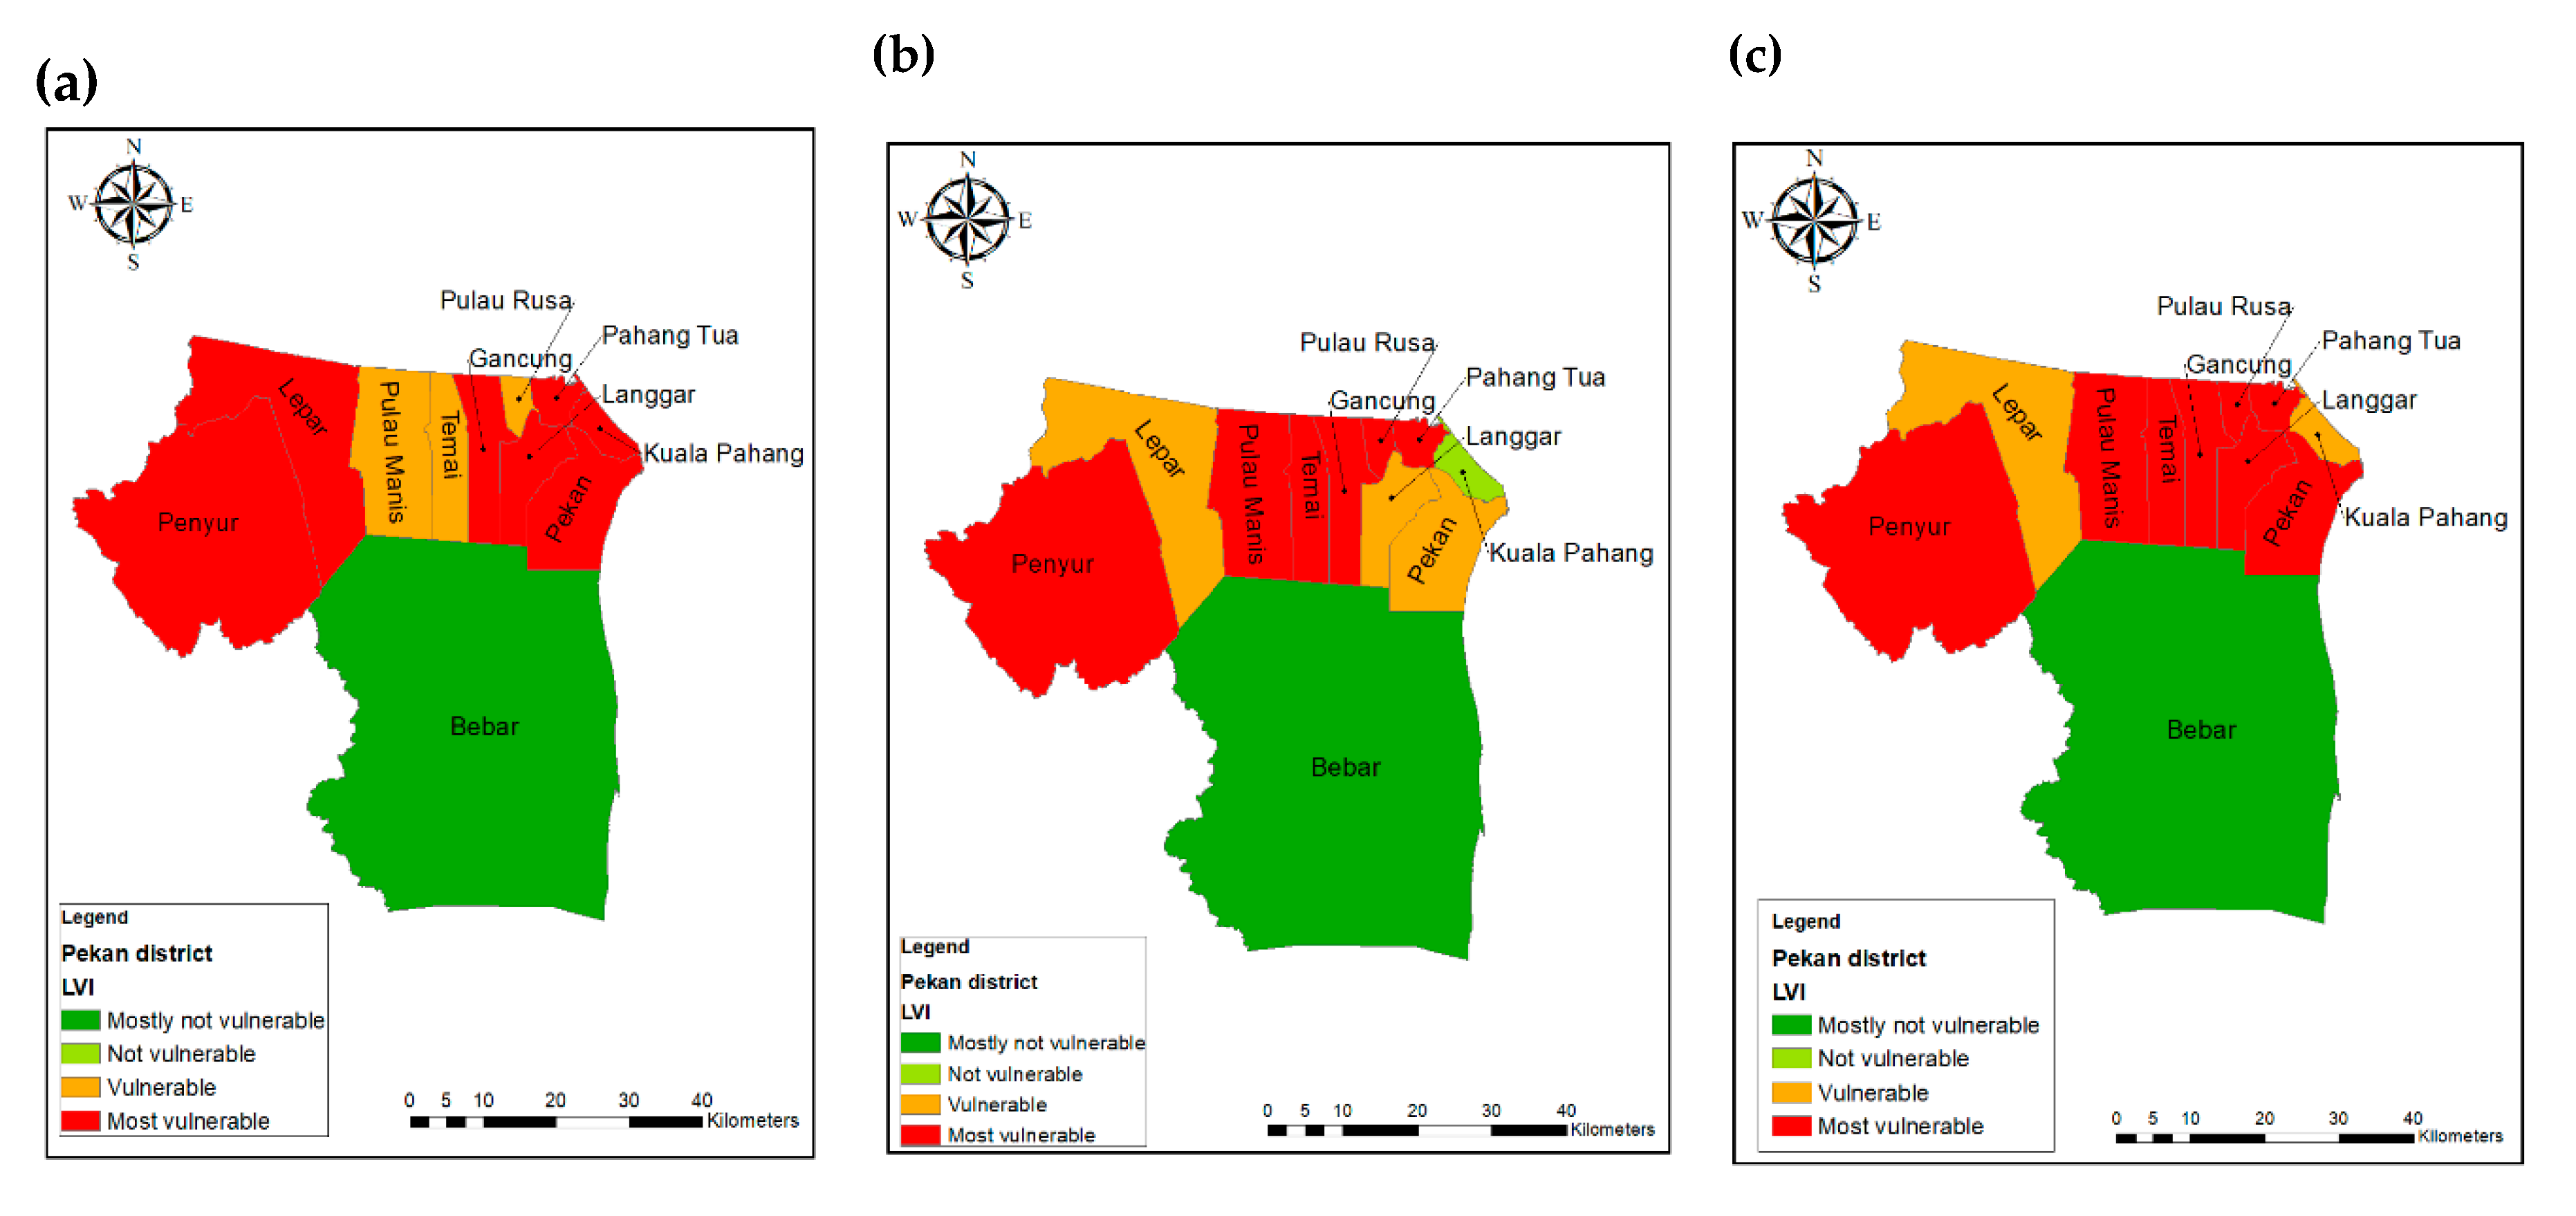
The sub-components indexed for each sub-district are presented in Table 3. Table 4 represents the major components and the overall LVI for all 10 sub districts of Pekan (as Bebar sub-district is not included in this study). The dependency ratio was the highest in the Pekan sub-district (1.44) compared to the lowest in Pulau Manis (0.04). In general, the highest vulnerability on the Socio-Demographic Profile index was shown by Pahang Tua (SDPPahang Tua 0.36), followed by Langgar (SDPLanggar 0.35), Pekan (SDPPekan 0.34), Penyur (SDPPenyur 0.32), Kuala Pahang (SDPKuala Pahang 0.31), Lepar (SDPLepar 0.29), and Gancung (SDPGancung 0.28). Pahang Tua respondents reported the highest ages of female heads of households with an average of 70.6 years, with 25% of households having a female head, which is slightly lower than in Penyur (31.5%). On the other hand, the lowest vulnerability for the same component is represented by Pulau Rusa (SDPPulau Rusa 0.24) with an average of 5.15 family members in a household, which is still classified as vulnerable (Figure 3a).
Penyur showed the highest vulnerability on the Livelihood Strategies component (0.45), along with Pulau Manis (0.41), Temai (0.38), Pahang Tua (0.38), Gancung (0.36), and Pulau Rusa (0.37). Kuala Pahang had the lowest vulnerability index for this component (LSKuala Pahang 0.214), indicating that this sub-district is not vulnerable.
Most of the sub-districts are highly vulnerable according to the Social Networks component (Figure 3c). Pahang Tua, Penyur, Pulau Manis, Pekan, Lepar, and Temai were fully dependent on the aid provided during the flood season. Furthermore, compared with the lowest vulnerability, shown by Kuala Pahang (0.58), the highest vulnerability was represented by Penyur (0.80), which showed that their households received the most help due to flooding, but 92.6% of households have not gone to their local government for assistance.
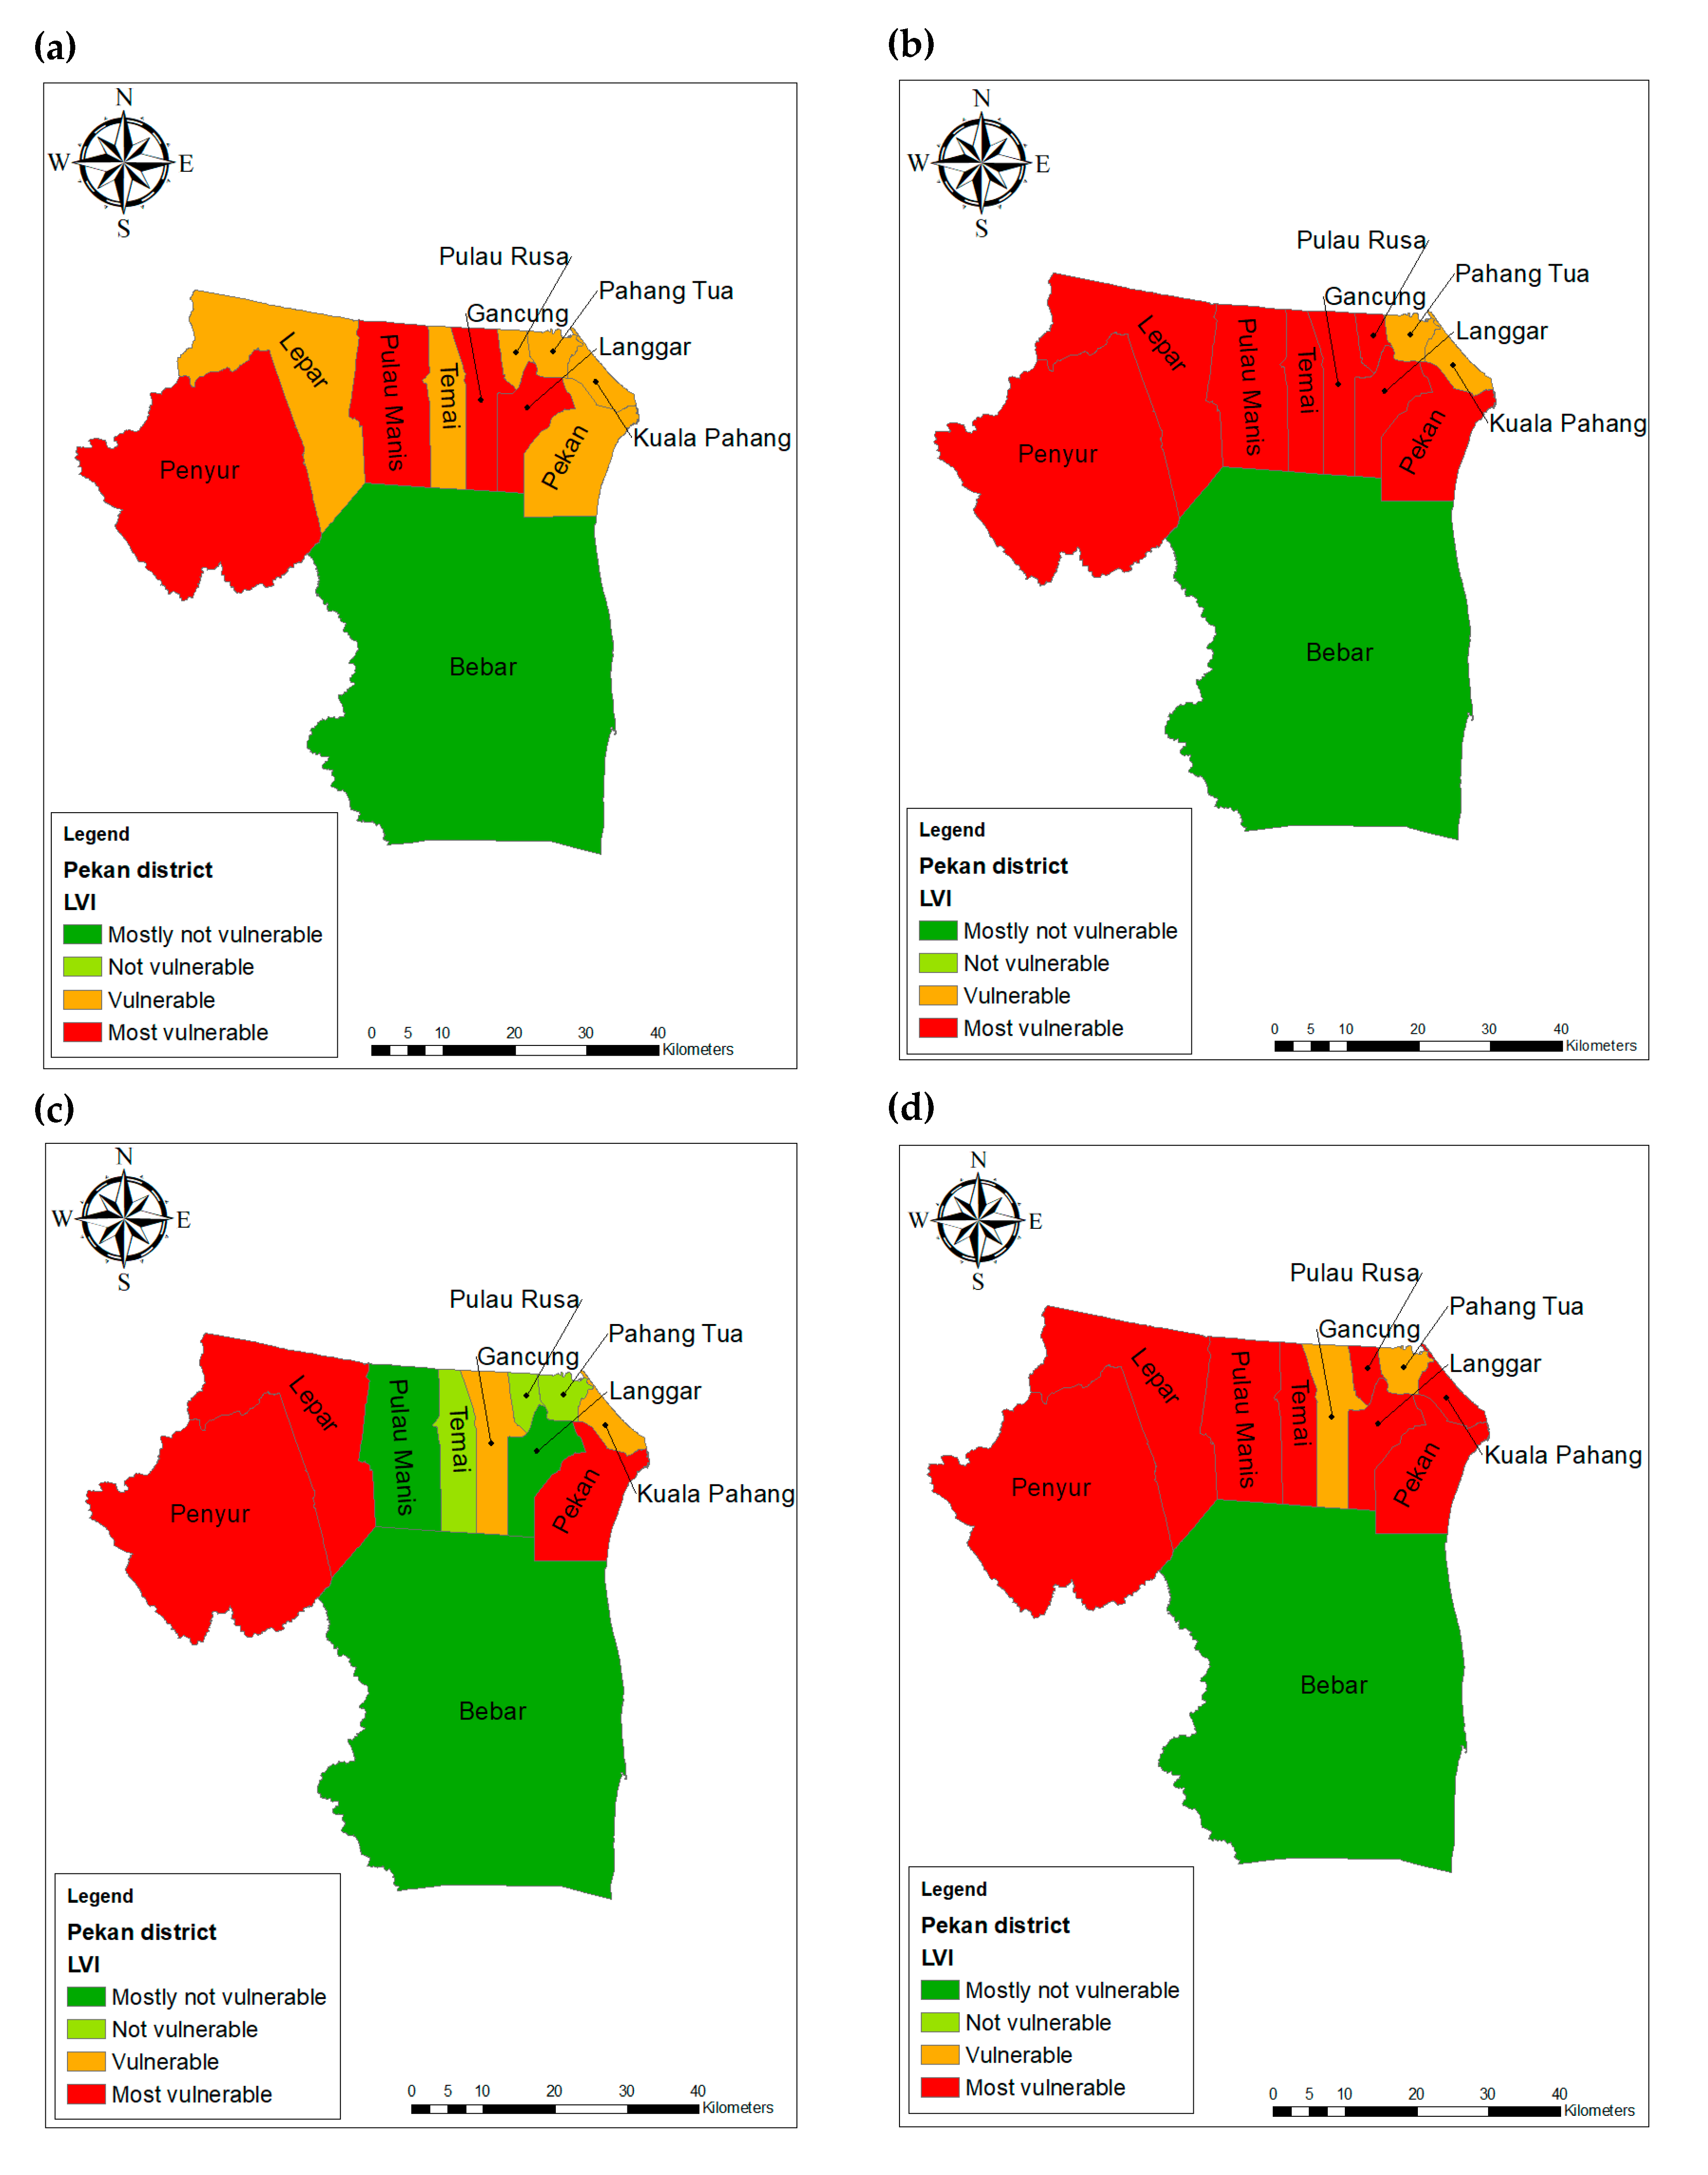
This situation can be seen from the sub-components with 0% of households with a family member working in a different community, and none of their jobs affected during a flood. In addition, households without nonagricultural livelihood income contributions and households that fish during flood season each show percentages of zero (Figure 3b). The overall Health vulnerability score for Pulau Manis (0.50) was the highest when the sub-components were combined. About 34.6% of Pulau Manis households reported that their family members were affected with illnesses during flood season. On the contrary, none of the family members living in Lepar were affected by illnesses during flood season. Thus, Lepar (0.29) was the least vulnerable, as shown in Figure 4a.
Almost all households from sub-districts in Pekan reported struggling to find adequate food for their families during a flood (Figure 4b). Thus, the Food vulnerability index scored the highest among the major components (Table 4). All family members in Penyur, Pekan, Lepar, and Pulau Rusa are unable to save food during flood season.
Three sub-districts are categorized as the most vulnerable for the Water vulnerability component (Pekan 0.48, Lepar 0.42, Penyur 0.41). Pekan households reported that they took an average of 24.66 min to get water resources. The highest average time taken to collect water resources reflected the highest amount of water stored per household in the Pekan sub-district (0.82) compared to other areas (Table 3). On the other hand, Pulau Rusa (0.16), Temai (0.14), Pahang Tua (0.12), Pulau Manis (0.11), and Langgar (0.09) have the lowest Water vulnerability scores and are classified as not vulnerable (Figure 4c).
In general, the Pekan district is classified as vulnerable according to the Housing vulnerability index (Figure 4d). Almost all houses in the Pekan district were affected by the flood. However, only 6% of households in the Pekan sub-district did not have housing affected by flooding; thus, 94% of their houses are not elevated by high ground to avoid flooding (Table 3).
Nevertheless, only Lepar and Pulau Rusa are categorized as not vulnerable; the sub-districts scored 0.26 and 0.22, respectively, for the Land vulnerability component (Figure 4e). In 8 out of the 10 sub-districts (excluding Lepar and Pulau Rusa), more than half of the households reported having small land areas (0.1–0.5 ha).
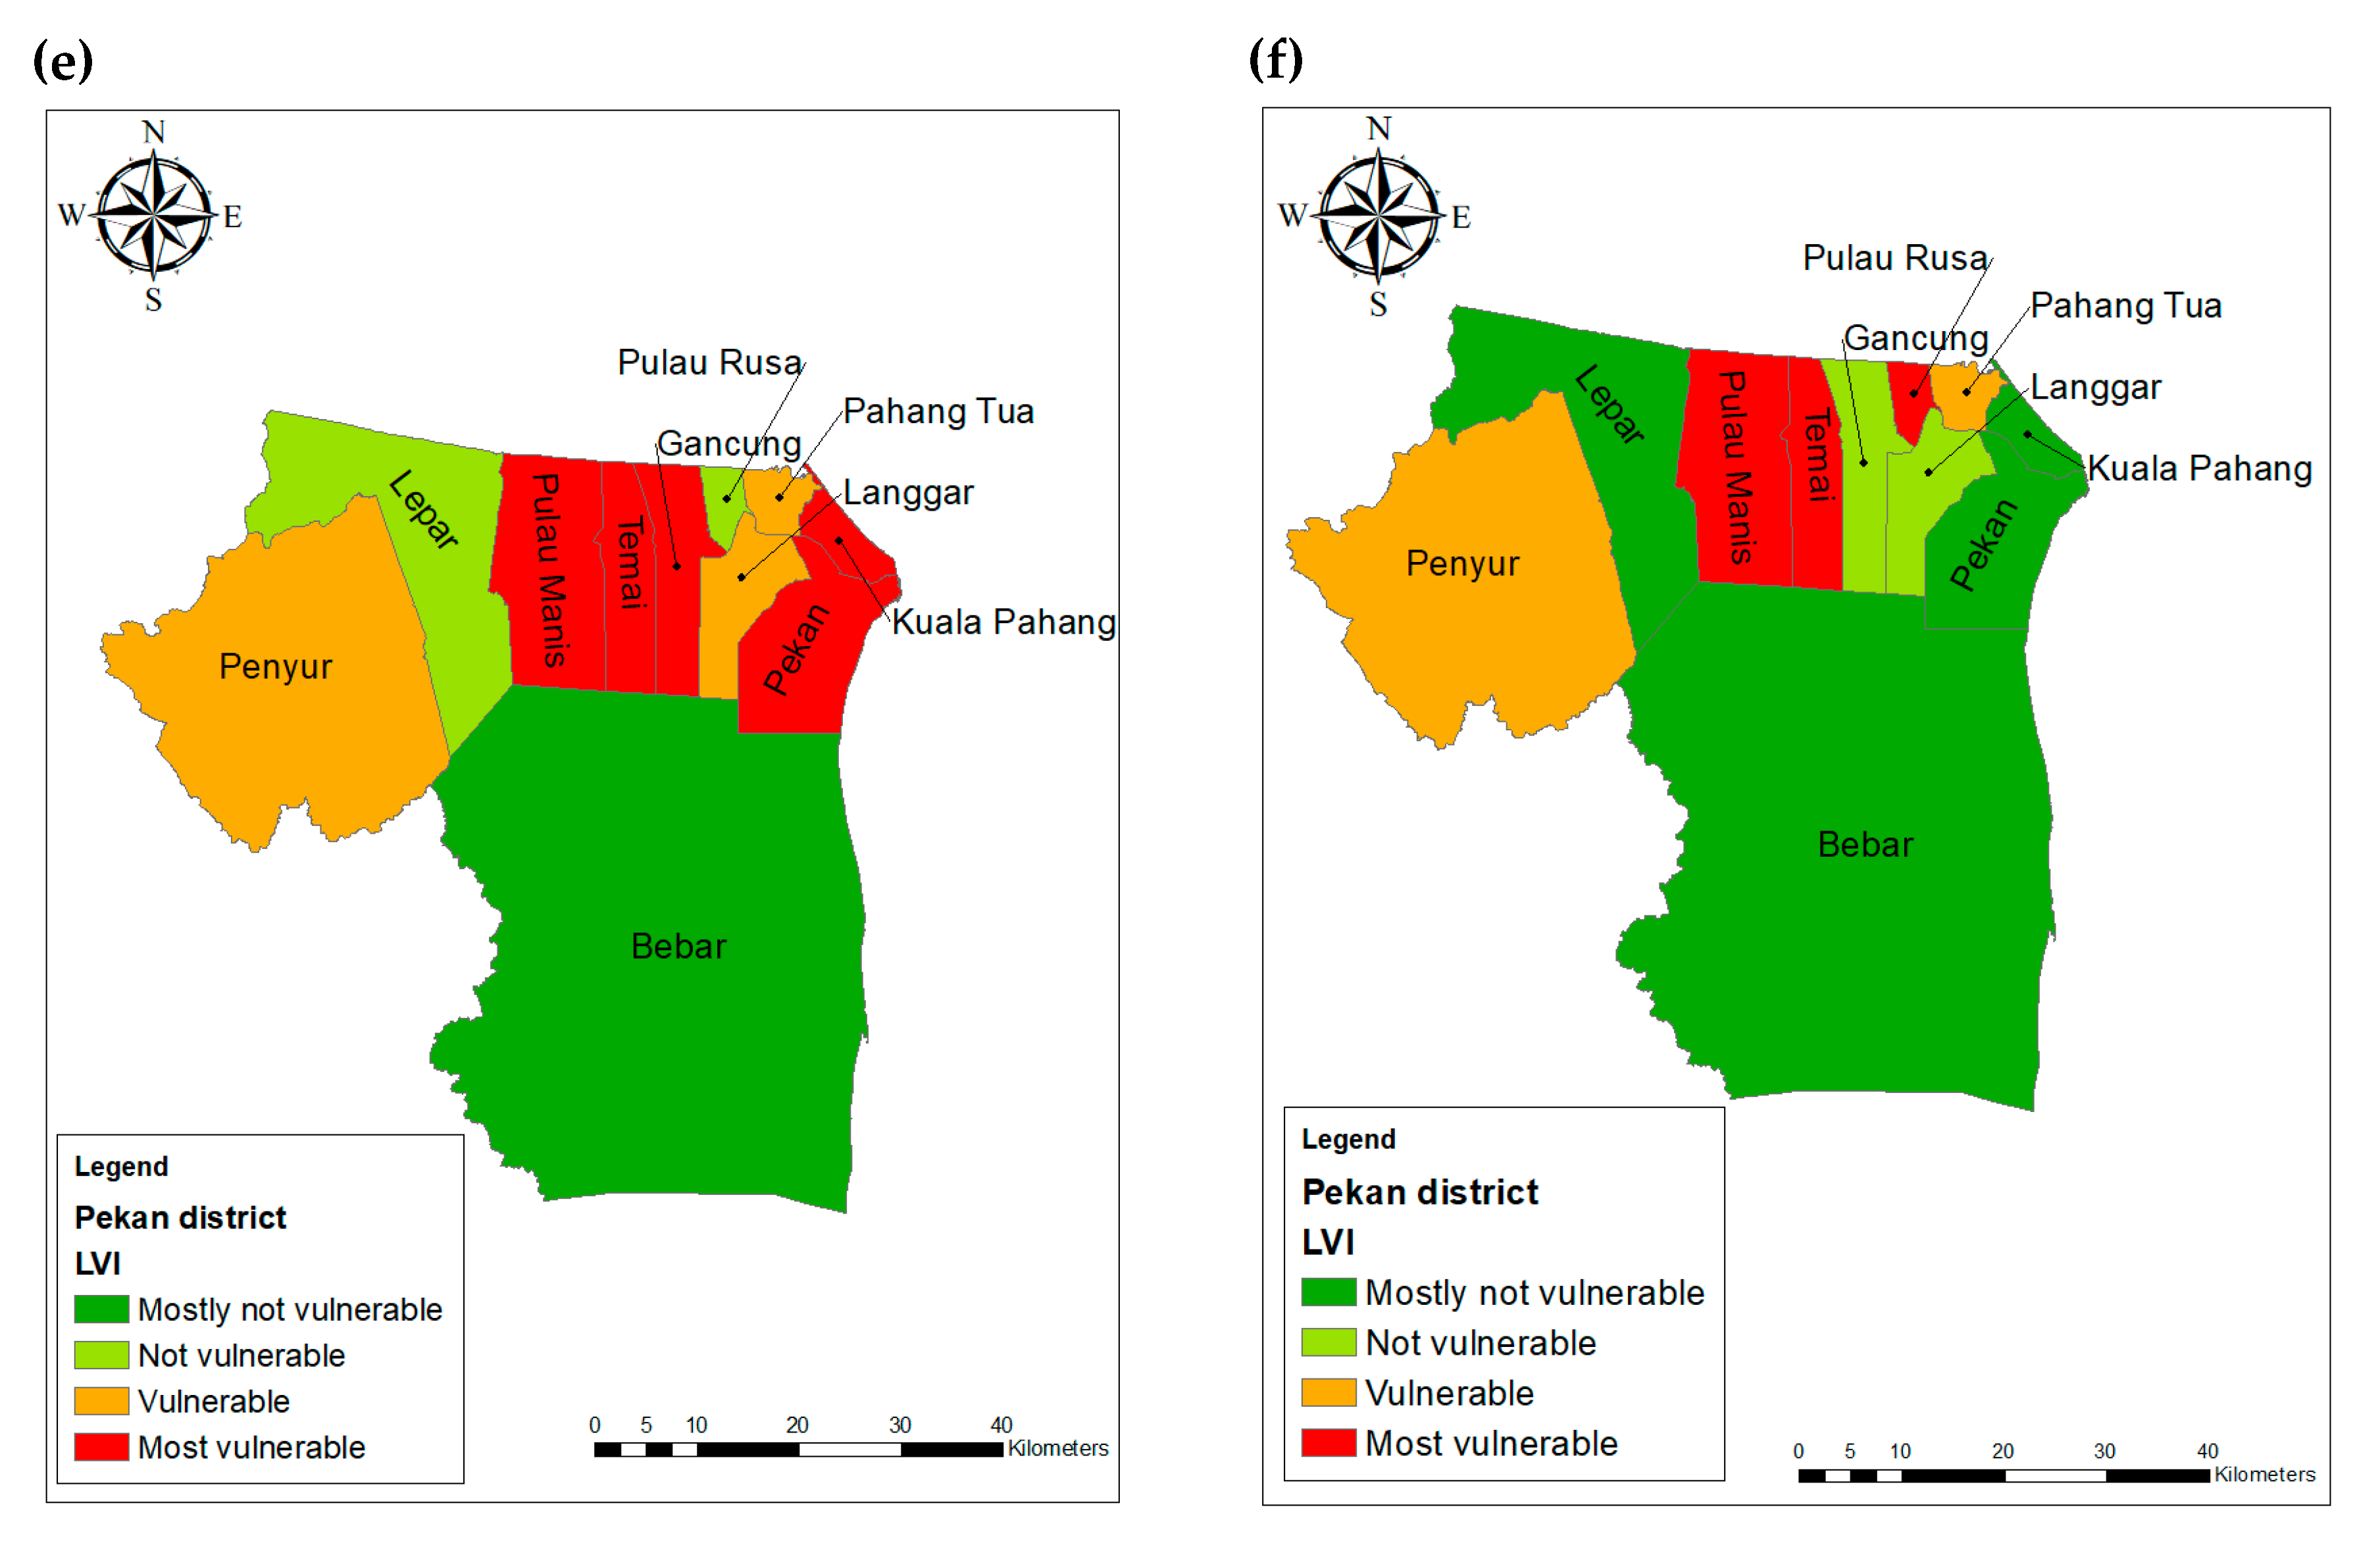
Pulau Manis (0.46), Temai (0.42), and Pulau Rusa (0.35) scored the highest vulnerability indexes for the Finance and Income component, followed by Penyur (0.29) and Pahang Tua (0.25). About 46.2% of Pulau Manis households borrowed money because their income was affected by a flood. However, Gancung (0.21) and Langgar (0.18) scored a lower vulnerability index which is classified as not vulnerable, followed by Lepar (0.06), Kuala Pahang (0.05), and Pekan (0.09), that showed the lowest vulnerability scores (Figure 4f).
Gancung showed the highest vulnerability for the Natural Disaster and Climate Variability component (0.59), followed by Kuala Pahang (0.32). Generally, both sub-districts receive a warning about floods during the flood season (Table 3). However, the other sub-districts scored a lower vulnerability index and were classified as not vulnerable (Figure 5).
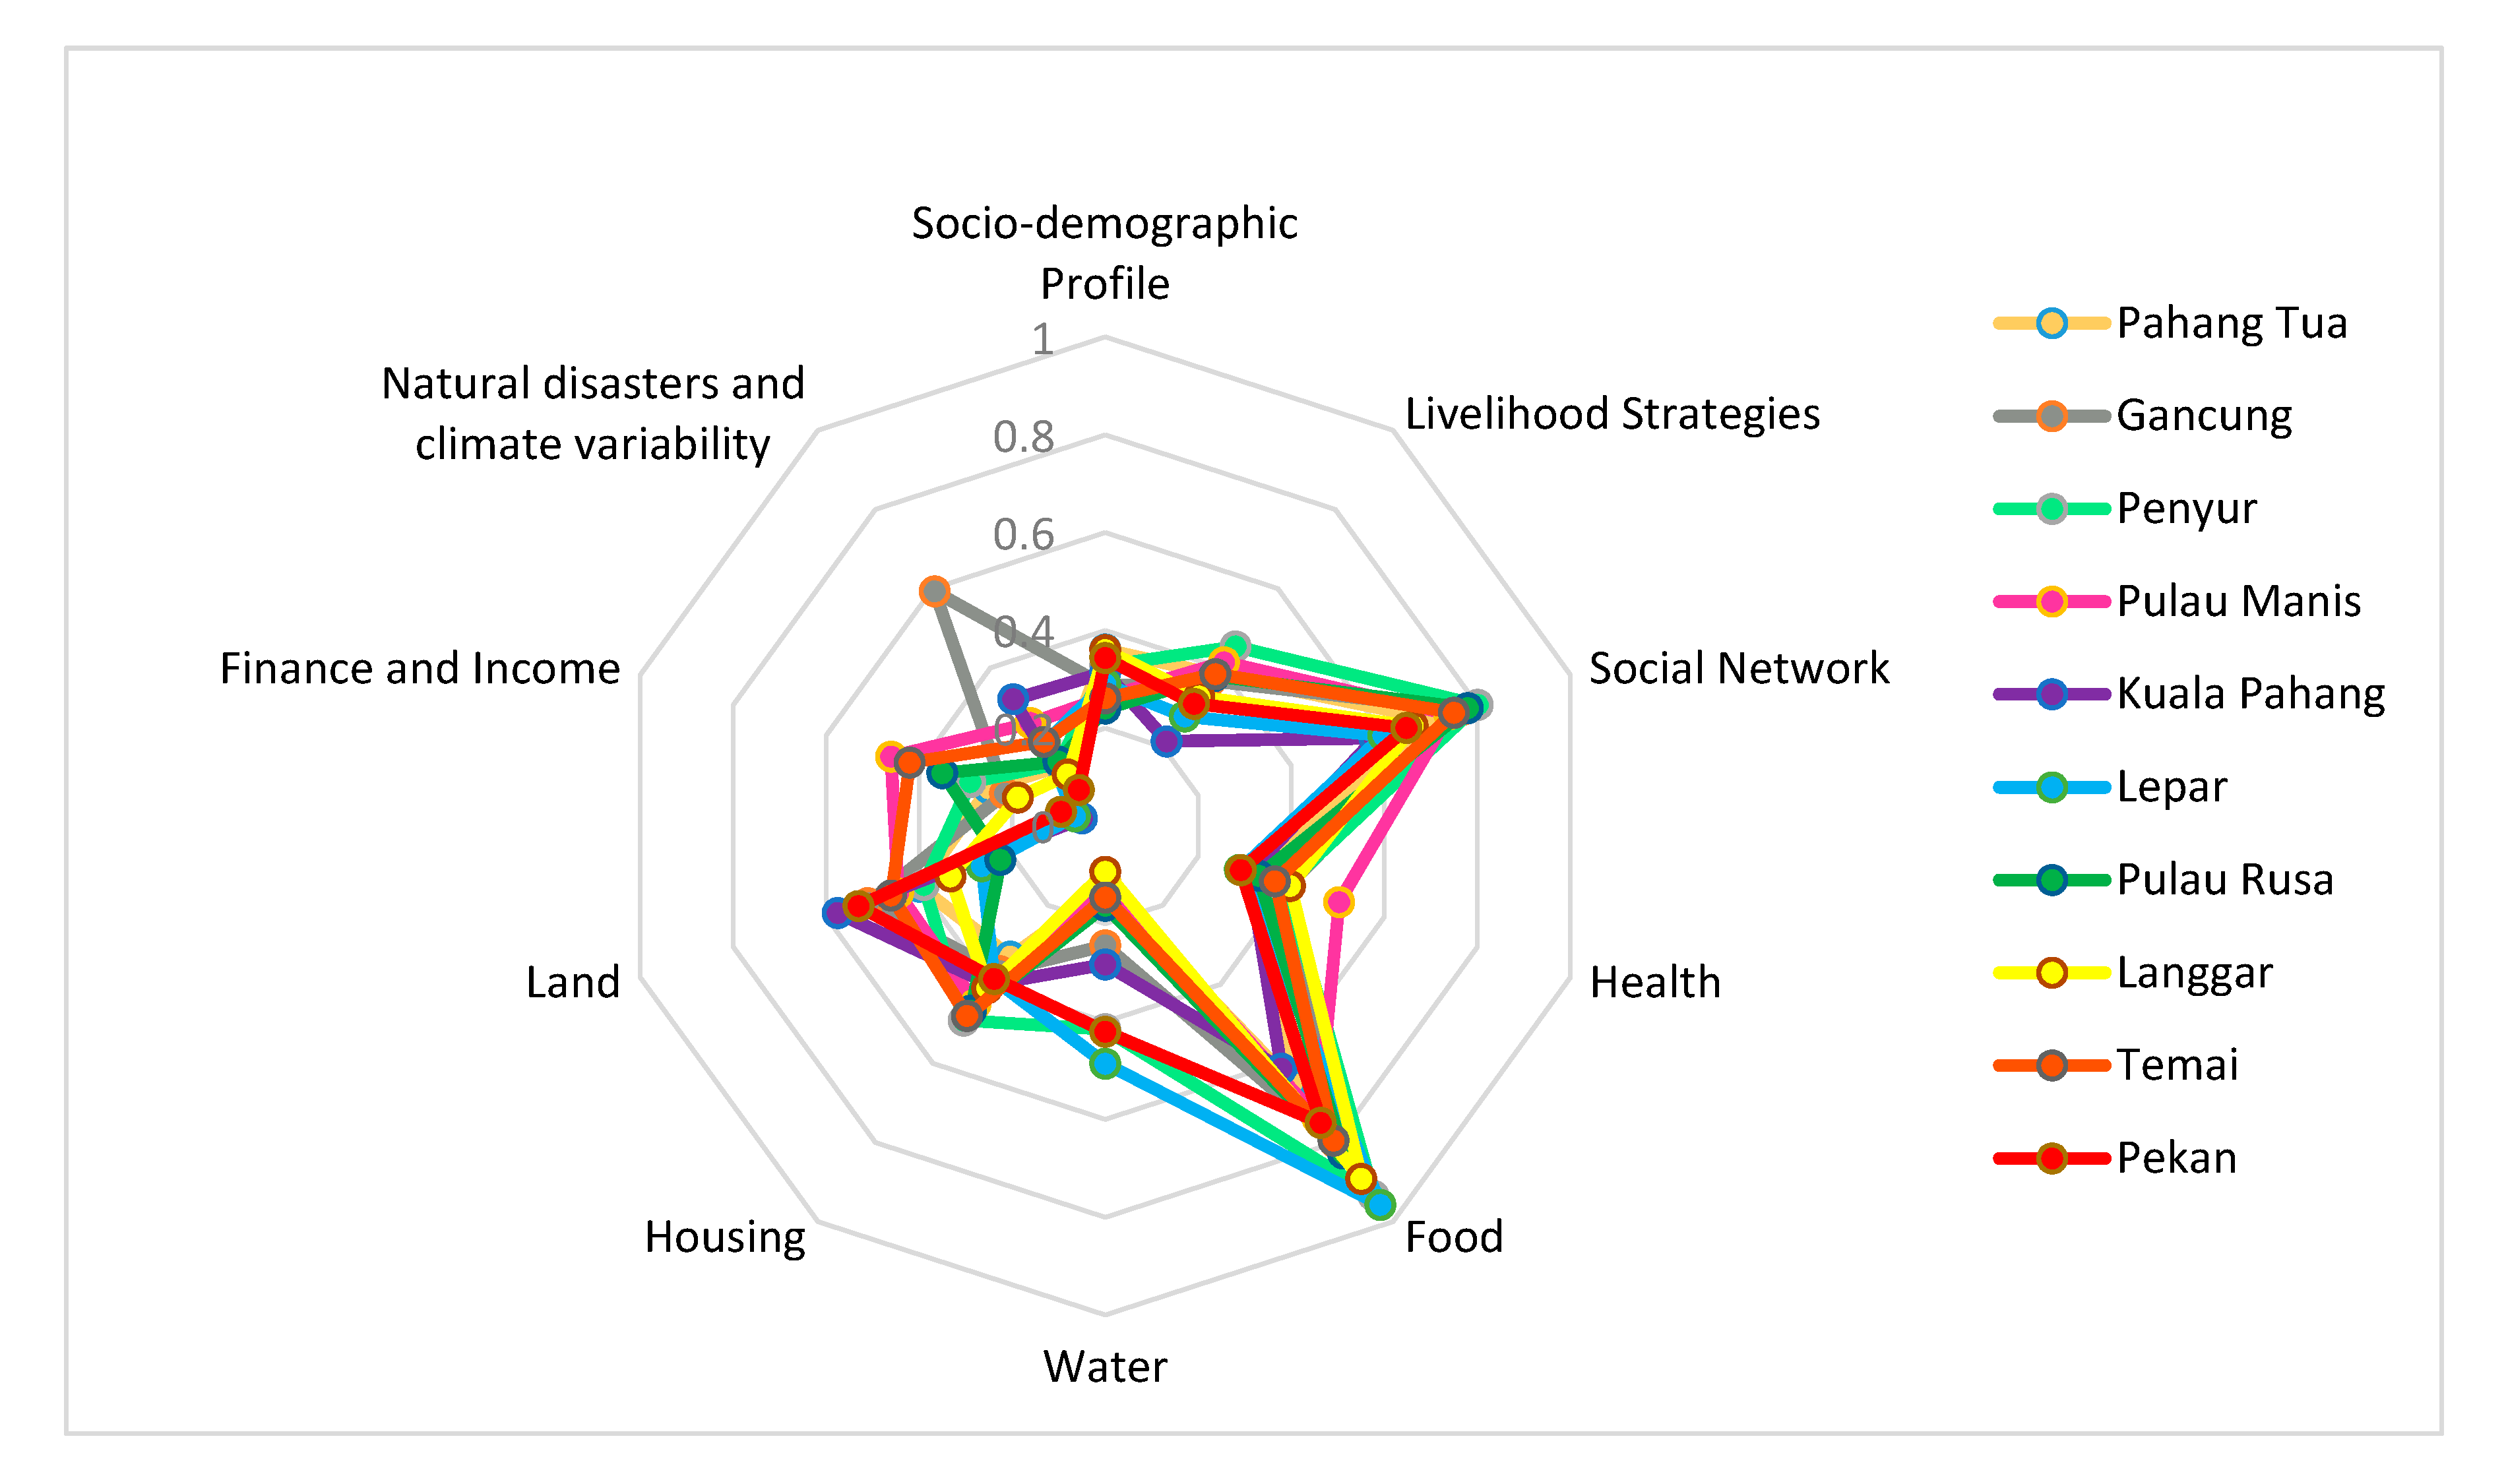
Finally, Langgar sub-district had a higher overall LVI (0.78), which shows a relatively greater vulnerability to flooding impacts. The results of the indices of the major components are presented together in a spider diagram (Figure 6). The scale of the diagram ranges from 0 (not vulnerable) at the center of the web, with a 0.2 unit gap, to the highest unit (1) ranked as the most vulnerable at the outside edge.
However, the initial readings of the findings suggest little difference between the two LVI approaches. The overall LVI for sub-districts Langgar and Kuala Pahang are 0.78 and 0.35, respectively (Table 4). Further calculation found that the LVI–IPCC indices generated by Gancung and Penyur are 0.06 and -0.17, respectively (Table 5).
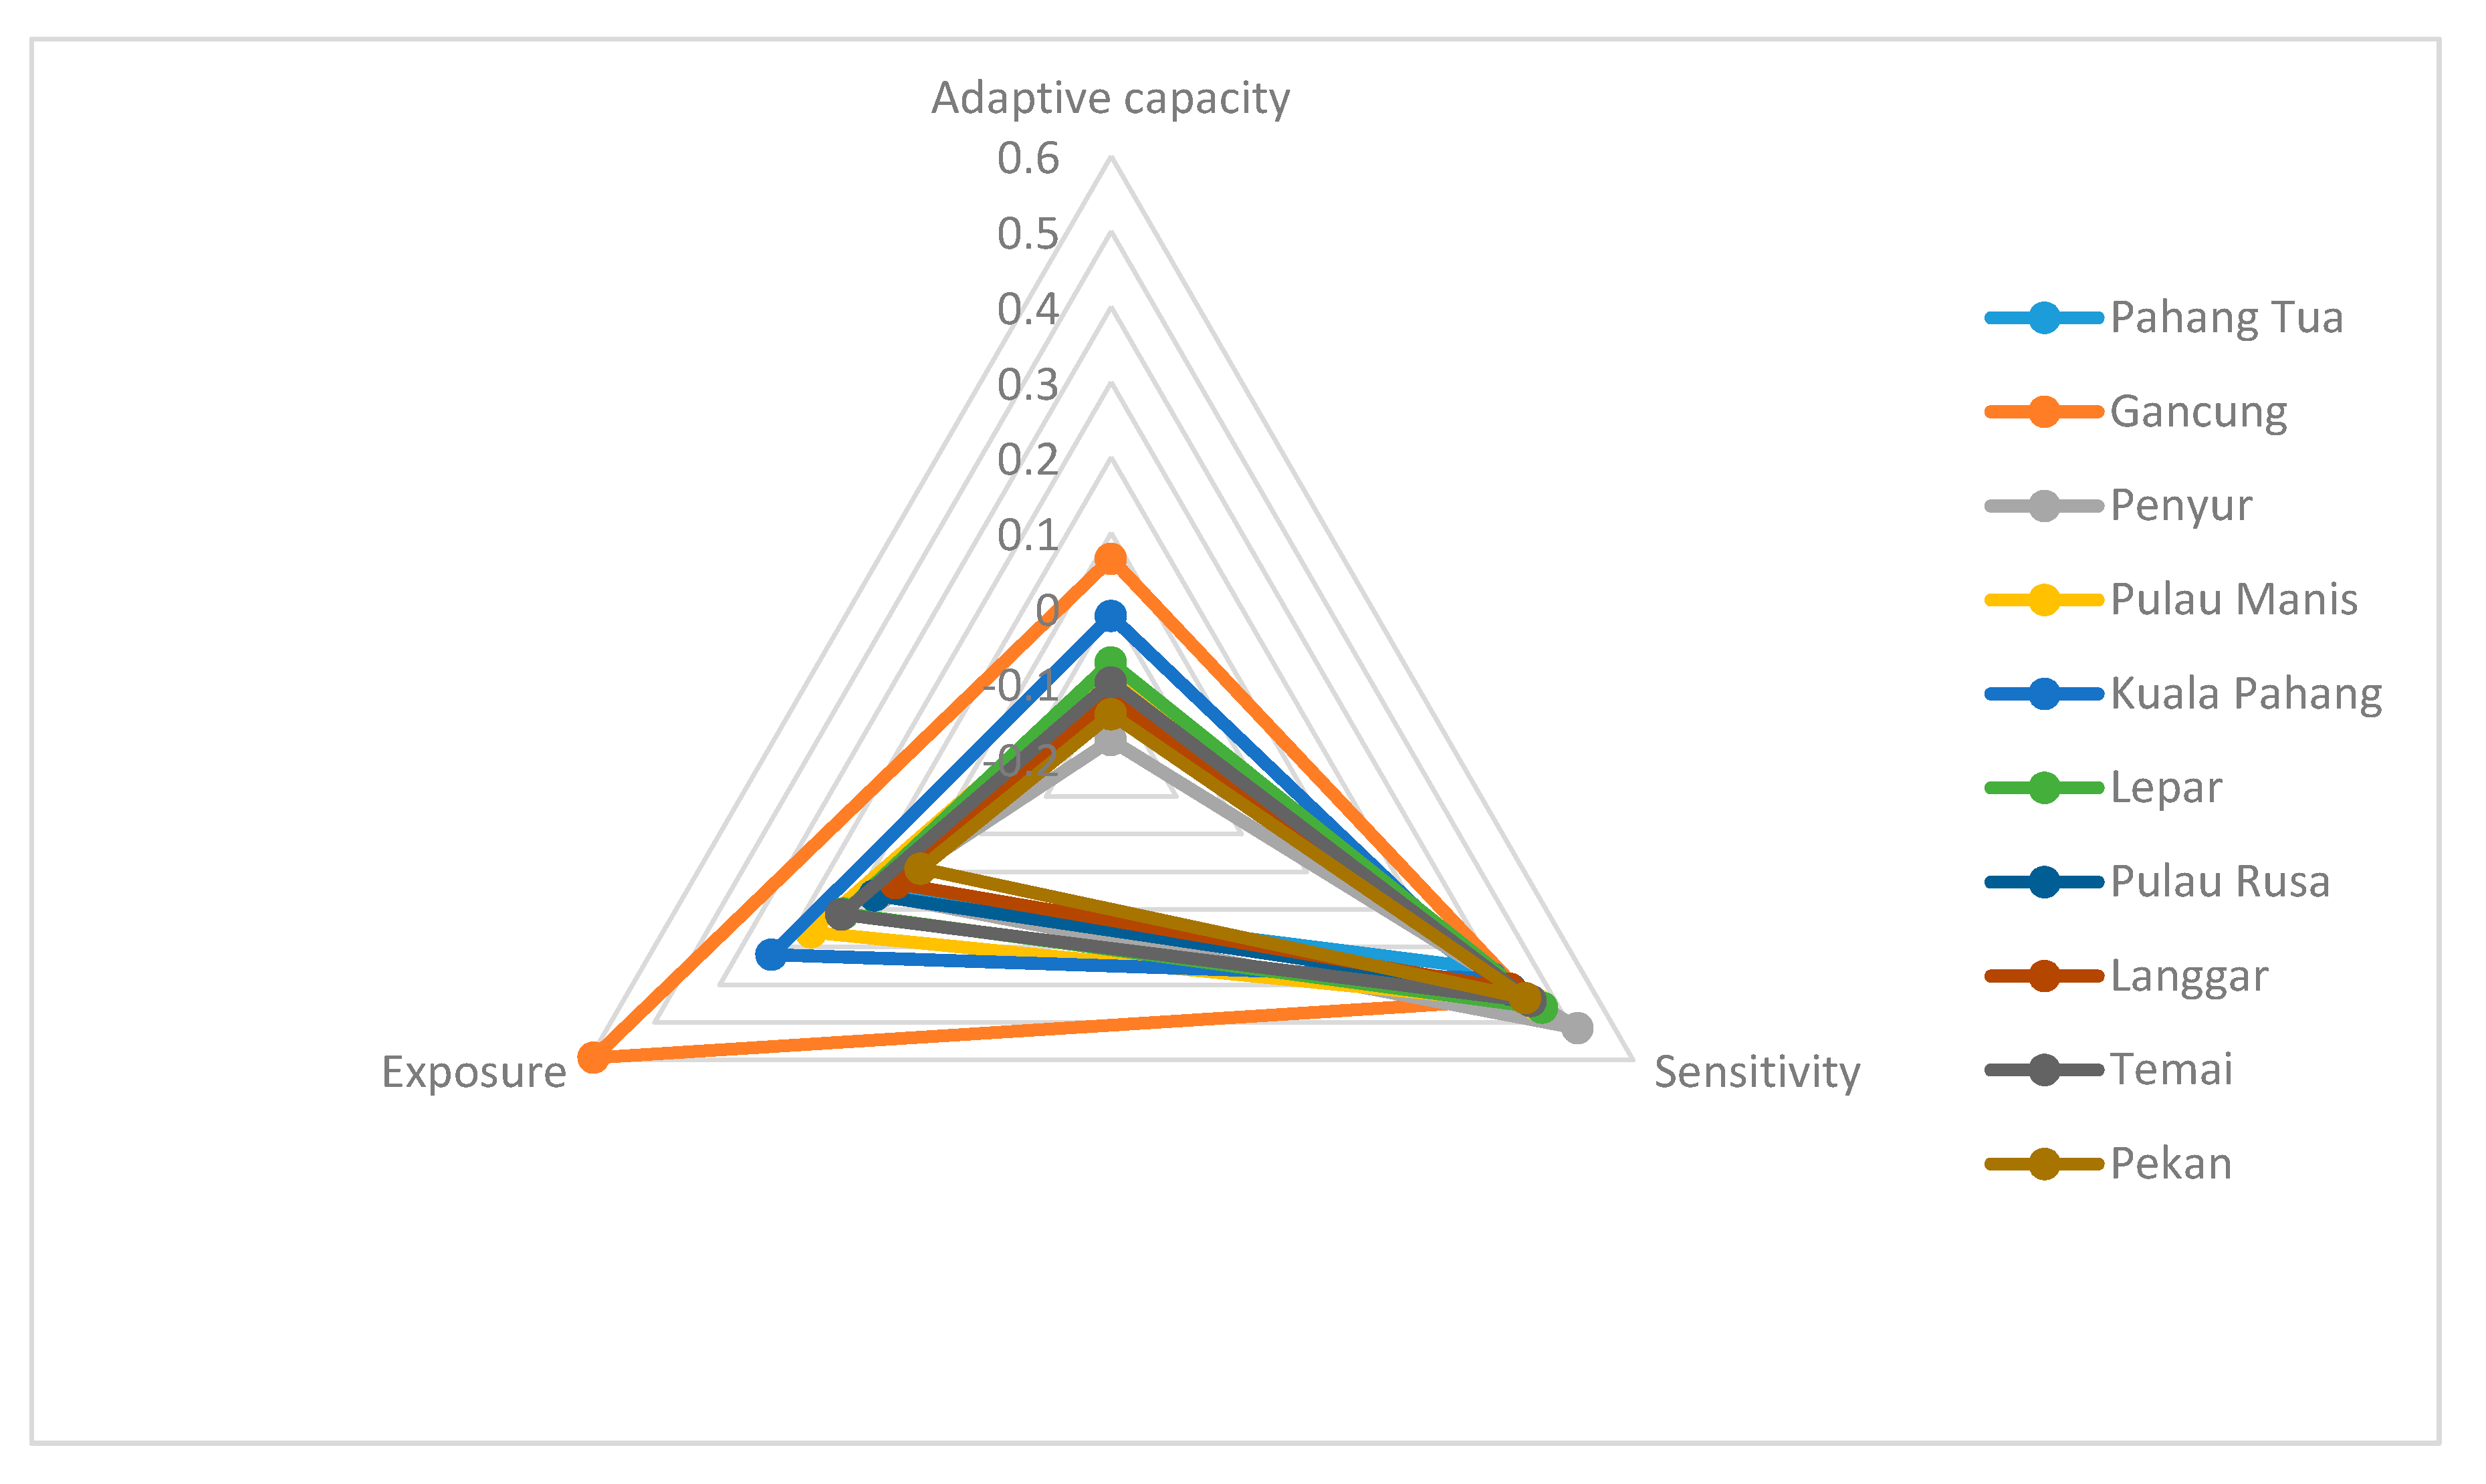
Figure 7 shows a vulnerability triangle that plots the contributing factor scores for exposure, adaptive capacity, and sensitivity. The triangle indicates that Gancung may be more vulnerable to flood impacts with its exposure index (0.59) compared to Pekan sub-district. Gancung also showed the highest adaptive capacity (0.06) based on demographics, livelihoods, and social networks. However, Penyur showed the highest sensitivity in terms of flood impacts relating to its land and food security.
4. Discussion
This paper discussed the indices that represent relative values and are compared across the whole of Pekan district in Pahang within the study sample. In general, all sub-districts in Pekan were vulnerable in terms of the Socio-Demographic Profile index. At least 5% of households have a female head with an average age of 41 years old, showing that the population of this district is the most vulnerable to flooding.
Kuala Pahang sub-district was not exposed to vulnerability, as it has the lowest vulnerability index for the Livelihood Strategies component. It can be seen from Figure 2 that the Pahang River does not flow directly across this sub-district as it is near to the coast. As parts of Livelihood Strategies, households’ knowledge of and exposure to natural disasters were different depending on individual experiences. These strategies include a lack of family members migrating to other areas, depending solely on agriculture as a source of income, and the diversification of agriculture. Households in Pekan district were more likely to have diversification strategies, such as growing crops, animal husbandry, and farming natural resources, which shows their livelihood diversification instead of relying solely on agriculture income during flood season.
Most of the sub-districts in Pekan are highly vulnerable according to the Social Networks component (Figure 6) [27]. Pahang Tua, Penyur, Pulau Manis, Pekan, Lepar, and Temai were fully dependent on the aid provided during flood season. Pahang River overflows during floods, limiting respondents’ movements to go to their local governments for assistance. Moreover, the highest vulnerability was shown by Penyur (0.80), with 92.6% of households not having gone to their local government for assistance, since borrowing from relatives and close friends—rather than from the community—is more convenient [27]. Good social networking also seems to ease the impact of climatic stresses on individual households [33].
Health vulnerability in the Pekan district is relatively low (Figure 6). Although households reported that they suffer from health issues arising from flooding, such as coughs and colds, flu, fever, sore throats, and headaches, the time to reach a health facility was only 14.8 min with an average distance of 5.6 km [34] (Table 3). This shows that decent access to health care is vital in improving socioeconomic development, thus lowering the vulnerability of the community.
Most of the residents rent or live in homes inherited to them. Their houses are built from wood that is often used in building traditional villages. This kind of house is highly vulnerable to flood damage as years pass [28]. Furthermore, an average of about 44.53% of Pekan households live in houses that are not elevated by high ground. This number should be reduced, as it has been found that houses in Pekan district were mostly affected by floodwater rising up to 8 feet high [35]. Thus, building a house on high ground is recommended to lower household vulnerability in terms of flood events in the future.
This study also identified that non-landowners have limited access to the formal safety nets and other entitlements, making them highly vulnerable [27]. Since Pekan is considered a rural district, most of the households reside in houses on small pieces of land of about 0.1–0.5 ha. Thus, they opted not to plant crops, as they only have limited space for livelihood. This situation explains the high vulnerability index for the Land components. Moreover, most Pekan households traditionally reside close to the Pahang River banks, so their main source of income has a higher chance of being affected by flooding [28,36]. Thus, crop planting is not their main option for growing survival food, as it will only get damaged during flood season. Furthermore, Penyur sub-district comprises two small islands situated on the huge Pahang River. Thus, limited resources on the islands made it tougher for their households to obtain food during flood events.
Last but not least, although Gancung households reported the highest vulnerability score for the Natural Disasters and Climate Variability component, Kuala Pahang had twice the number of houses hit by floods compared to Gancung in the past seven years. The lower elevation in Kuala Pahang reflected this situation, with 35% of households reporting that their houses and machinery were damaged due to flooding, but no injury or death was announced.
Bebar sub-district was not included in the survey, as it was not affected by monsoon floods during previous years. This is because the Bebar Rivers flow from the coast and are not connected to the Pahang River, as shown in Figure 2. Since Bebar is only affected by coastal flooding, it is not considered vulnerable to monsoon flooding. Thus, this study could be extended with broader criteria for assessing vulnerability of the socioeconomy of a community that is affected by other types of flooding.
Basically, those who are living in natural disaster areas such as a river basin affected by flooding are naturally exposed to the hazard [37]. However, since Pekan district has a large coverage of oil palm and paddy plantations, a huge land clearing should be scaled down for agriculture [38]. Further land clearing for economic growth other than agriculture in Pekan—such as industrial parks—is expanding at a higher rate [39]. Infrastructure development during the urbanization process in this district is also one of the factors that lead to the increase of stagnant water during flood season. Improved facilities catalyzed population growth, thus increasing demand for a comfortable livelihood and increasing the pressure for development growth within this district [40]. This situation creates the utmost conflict within Pekan district, where further land clearing has exposed households living at the lowland and swampy areas of this district, which are highly vulnerable when the Pahang River water overflow during heavy rains. This situation can get worse over time where economic liabilities are rising, leading to higher socioeconomic exposure and eventually increased vulnerability of the community. In addition, land degradation at the uphill and sensitive areas of Pahang State also contributes significantly to the increased sedimentation and higher stream runoff, thus increasing the lower river-line floods which are supposedly responsible for the considerable socioeconomic consequences [40].
Generally, the whole Pekan district is exposed to high socioeconomic vulnerability due to the low capacity to adapt after a monsoon flood event. Thus, the findings reported in this paper will help in distinguishing hot spots to support policymakers, public authorities, and responders, as well as in guiding towards implementing proper risk management policies and measures in rural development planning [41]. Further development in the floodplain of Pekan district should be slowed down, as the management strategies for reducing socioeconomic exposure to the flood damage limit the number of households and property within Pahang River Basin over time. Strict enforcement on buildings and infrastructure, such as tougher building materials, elevated structures, and flood proofing, is also required as an alternative to flood risk mitigation for the community.
5. Conclusions
This study involved the LVI assessment of the socioeconomic impact on the flood-prone districts in Pekan, Pahang integrated with index map layering. The LVI–IPCC was applied to assess the relative vulnerability of communities to flood impacts. The LVI index used in map layering was found to be useful in measuring the livelihood vulnerability in terms of socioeconomy of households with spatial data incorporated so that changes in livelihoods, food storage behavior, and other long-term survival activities can be conducted. Spider and triangle diagrams that were built to compare the vulnerability scores between sub-districts found that Pekan district was the most vulnerable due to high exposure to flood impact. We also discovered that networking in their society was relatively high, and contributes largely to the adaptive capacity of the community, leading to positive vulnerability scores. This research suggests that the strong bond within the community helps to reduce stress and trauma during the flooding season. Furthermore, Pekan district was found to be more sensitive to food storage, which adds up to a higher vulnerability during floods. Early preparation by storing food and livestock is important, as food security is able to enhance a household’s resilience to external stress and shock due to extreme climatic events. Therefore, it is crucial for scaling down vulnerability, which is determined by sensitivity and the ability of the community to withstand risk through their adaptive capacity. Integrating better flood mitigation actions with sustainable land-use policy for further development will help to combat socioeconomic vulnerability within the river basin to enhance the sustainable livelihood of the floodplain community.
Author Contributions
Conceptualization, writing—review and editing, validation, supervision: N.A.M.; software, formal analysis, visualization, writing—original draft preparation: N.M.N.; resources, data curation, N.D.M.I.; project administration, funding acquisition: M.R.T.
Funding
This research and the APC was funded by PTJ Research Development Fund for the project “Application of Geographical Information System (GIS) for Mapping the Livelihood Vulnerability Index in Pahang River Basin”, grant number DPP-2018-008.
Conflicts of Interest
The authors declare no conflict of interest. The funders had no role in the design of the study; in the collection, analyses, or interpretation of data; in the writing of the manuscript, or in the decision to publish the results.
References
- Utaberta, N.; Spalie, N.; Abdullah, N.G. Design Flexibility of Growing and Transformable House in Malaysia. Adv. Mater. Res. 2010, 168, 545–548. [Google Scholar] [CrossRef]
- Ali, A.M. Flood Inundation Modeling and Hazard Mapping under Uncertainty in the Sungai Johor Basin, Malaysia; CRC Press/Balkema—Taylor & Francis Group: Delft, The Netherlands, 2018. [Google Scholar]
- Idrus, S.; Ismail, S.M.; Hami, A.S.; Mohamed, A.F.; Abu-Bakar, N.; Rameli, N.L.F.; Sulaiman, S.U.; Zubir, F.I. Cabaran Banjir Luar Biasa dan Implikasi Terhadap Dayahuni bandar Kecil di Malaysia. Persidangan Kebangsaan Geografi Alam Sekitar 2015, 5, 946–954. [Google Scholar]
- Floods: Six Districts Still Affected in Pahang. 2015. Available online: http://www.thestar.com.my/News/Nation/2015/01/06/Floods-Six-districts-Pahang/ (accessed on 1 August 2019).
- Ainullotfi, A.A.; Ibrahim, A.L.; Masron, T. A Study on Integrated Community Based Flood Mitigation with Remote Sensing Technique in Kota Bharu, Kelantan. In IOP Conference Series: Earth and Environmental Science; IOP Publishing: Bristol, UK, 2014; Volume 18, p. 012133. [Google Scholar]
- Hanh, M.B.; Riederer, A.M.; Foster, S.O. The livelihood vulnerability index: A pragmatic approach to assessing risks from climate variability and change—A case study in Mozambique. Glob. Environ. Chang. 2009, 19, 74–88. [Google Scholar]
- IPCC. Climate change 2007: The physical science basis. In Contribution of Working Group II to the Forth Assessment Report of the Intergovernmental Panel on Climate Change (Ch.9); Cambridge University Press: Cambridge, UK, 2007. [Google Scholar]
- IPCC. Climate change 2001: Impacts, adaptation and vulnerability. In Contribution of Working Group II to the Third Assessment Report; Cambridge University Press: Cambridge, UK, 2001. [Google Scholar]
- Marin, G.; Modica, M. Socio-economic exposure to natural disasters. Environ. Impact Assess. Rev. 2017, 64, 57–66. [Google Scholar] [CrossRef]
- Patterson, L.A.; Doyle, M.W. Assessing Effectiveness of National Flood Policy through Spatiotemporal Monitoring of Socioeconomic Exposure. J. Am. Water Resour. Assoc. 2009, 45, 237–252. [Google Scholar] [CrossRef]
- Adger, W.N. Vulnerability. Glob. Environ. Chang. 2006, 16, 268–281. [Google Scholar] [CrossRef]
- Adger, W.N.; Arnell, N.W.; Tompkins, E.L. Successful adaptation to climate change across scales. Glob. Environ. Chang. 2005, 15, 77–86. [Google Scholar] [CrossRef]
- Tao, S.; Xu, Y.; Liu, K.; Pan, J.; Gou, S. Research progress in agricultural vulnerability to climate change. Adv. Clim. Chang. Res. 2011, 2, 203–210. [Google Scholar] [CrossRef]
- Millari, A.E. Climate change vulnerability assessment in the Agriculture sector: Typhoon Santi Experience. Procedia-Soc. Behav. Sci. 2016, 216, 440–451. [Google Scholar] [CrossRef] [Green Version]
- Sabine, L.P.-N. The vulnerability of beach tourism to climate change—An index approach. Clim. Chang. 2010, 100, 579–606. [Google Scholar]
- Raquel, S.L.; Clave, S.A.; Saladie, O. The vulnerability of coastal tourism destination to climate change: The usefulness of policy analysis. Sustainability 2017, 9, 2062. [Google Scholar]
- Malik, S.M.; Awan, H.; Khan, N. Mapping vulnerability to climate change and its repercussions on human health in Pakistan. Glob. Health 2012, 8, 31. [Google Scholar] [CrossRef] [PubMed] [Green Version]
- Contreras, D.; Chamorro, A. The spatial dimension in the assessment of socio-economic vulnerability challenges for an application on an urban scale, a systematic review. Nat. Hazards Earth Syst. Sci. Discuss. 2019, 147, 1–43. [Google Scholar] [CrossRef] [Green Version]
- Hinkel, J. “Indicators of vulnerability and adaptive capacity”: Towards a clarification of the science-policy interface. Glob. Environ. Chang. 2011, 21, 198–208. [Google Scholar] [CrossRef]
- Pattusamy, S.; Purusothaman, B.M. Disaster management and mapping using Remote Sensing and GIS. J. Comput. Biosci. Eng. 2014, 1, 1–7. [Google Scholar]
- Tam, T.H. Development of flood risk mapping in Kota Tinggi, Malaysia. In IOP Conference Series: Earth and Environmental Science; IOP Publishing: Bristol, UK, 2014; Volume 18, p. 012192. [Google Scholar]
- Katami, S.; Khazaei, B. Benefits of GIS Application in Hydrological Modeling: A Brief Summary. VATTEN J. Water Manag. Res. 2014, 70, 41–49. [Google Scholar]
- Abd Majid, N.; Rainis, R. Application of Geographical Information Systems (GIS) and Discriminant Analysis in Modelling Slope Failure Incidence in Pulau Pinang, Malaysia. Sains Malaysiana. 2019, 48, 1367–1381. [Google Scholar] [CrossRef]
- Abd Majid, N.; Rainis, R.; Ibrahim, W.M.M.W. Spatial modeling various types of slope failure using Artificial Neural Network (ANN) in Pulau Pinang, Malaysia. J. Teknologi. 2018, 80, 135–146. [Google Scholar] [CrossRef]
- Abd Majid, N.; Rainis, R.; Ibrahim, W.M.M.W. Pemodelan ruangan pelbagai jenis kegagalan cerun di Pulau Pinang menggunakan kaedah nisbah kekerapan. Geografi 2017, 5, 13–26. [Google Scholar]
- Nasiri, H.; Shahmohammadi-Kalalagh, S. Flood vulnerability index as a knowledge base for flood risk assessment in urban area. J. Nov. Appl. Sci. 2013, 2, 269–272. [Google Scholar]
- Nor-Diana, M.I.; Chamhuri, S.; Raihan, T.M.; Ashikin, A.N. Assessing local vulnerability to climate change by using Livelihood Vulnerability Index: Case study in Pahang region, Malaysia. In IOP Conference Series: Materials Science and Engineering; IOP Publishing: Bristol, UK, 2019; Volume 506, p. 012059. [Google Scholar]
- Siwar, C.; Mohd-Idris, N.D.; Ghazali, R.; Alias, N.A. Kajian Impak Sosioekonomi Golongan Terjejas Banjir. In Kajian Banjir Pahang 2014: Pendekatan Dan Impak Terhadap Sosioekonomi, Kesihatan Dan Alam Sekitar; Penerbit Universiti Kebangsaan Malaysia: Selangor, Malaysia, 2017. [Google Scholar]
- Department of Statistics Malaysia. Preliminary Count Report—Population and Housing Census Malaysia 2010. 2017. Available online: https://www.dosm.gov.my/v1/index.php?r=column/cone&menu_id=VE92aHBpclBjMGw0S0N0NkZyVkFIdz09 (accessed on 1 August 2019).
- Mohit, M.A.; Sellu, G.M. Development of Non-structural Flood Mitigation Policies and Measures for Pekan town, Malaysia. Asian J. Behav. Stud. 2017, 2, 9–20. [Google Scholar] [CrossRef] [Green Version]
- Manap, N.; Govindasamy, G.; Mohamed, S.; Kasim, N.; Musa, S.M.S.; Yahya, M.Y. Performance of Dredged Sediment as a Replacement for Fine Aggregates in Concrete Mixture: Case Study at Sungai Pekan, Pahang. In MATEC Web of Conferences; EDP Sciences: Les Ulis, France, 2019; Volume 266, p. 1017. [Google Scholar]
- Sullivan, C. Calculating a water poverty index. World Dev. 2002, 30, 1195–1210. [Google Scholar] [CrossRef]
- Madhuri-Tewar, H.R.; Bhowmick, P.K. Livelihood vulnerability index analysis: An approach to study vulnerability in the context of Bihar. Jamba J. Disaster Risk Stud. 2014, 6, 1–13. [Google Scholar]
- Mohammed-Nawi, A.; Wan-Puteh, S.E.; Ahmad, I.S.; Idris, I.B.; Hod, R. Banjir Dan Kesan Kesihatan Terhadap Manusia. In Kajian Banjir Pahang 2014: Pendekatan Dan Impak Terhadap Sosioekonomi, Kesihatan Dan Alam Sekitar; Penerbit Universiti Kebangsaan Malaysia: Selangor, Malaysia, 2017. [Google Scholar]
- Heng, L.Y.; Zainuddin, M.S.; Abdullah, N.F.; Reza, M.I.H.; Choy, E.A.; Elfitri, R.; Siwar, C.; Sharifah, E.; Nurul, A. Sistem Sokongan Keputusan (DSS) untuk Pengurusan Risiko Bencana Banjir di Pahang. In Kajian Banjir Pahang 2014: Pendekatan Dan Impak Terhadap Sosioekonomi, Kesihatan Dan Alam Sekitar; Penerbit Universiti Kebangsaan Malaysia: Selangor, Malaysia, 2017. [Google Scholar]
- Isahak, A.; Reza, M.; Siwar, C.; Ismail, S.M.; Sulaiman, N.; Hanafi, Z.; Zainuddin, M.S.; Taha, M.R. Delineating risk zones and evaluation of shelter centres for flood disaster management along the Pahang River Basin, Malaysia. Jàmbá J. Disaster Risk Stud. 2018, 10, a501. [Google Scholar] [CrossRef] [PubMed]
- Fussel, H.M. Vulnerability: A generally applicable conceptual framework for climate change research. Glob. Environ. Chang. 2007, 17, 155–167. [Google Scholar] [CrossRef]
- Elfithri, R.; Halimshah, S.; Abdullah, M.P.; Mokhtar, M.; Toriman, M.E.; Embi, A.F.; Abdullah, M.; Heng, L.Y.; Ahmad-Maulud, K.N.; Salleh, S.; et al. Pahang Flood Disaster: The Potential Flood Drivers. Malays. J. Geosci. 2017, 1, 34–37. [Google Scholar] [CrossRef]
- East Coast Economic Region Development Council (ECERDC). ECER Master Plan 2.0. In The Next Leap 2018–2025; UKM Pakarunding Sdn Bhd: Selangor, Malaysia, 2019. [Google Scholar]
- Idrus, S.; Mohamad-Ismail, S.; Zubir, F.I.; Rameli, N.F. Bencana Banjir. In Kajian Banjir Pahang 2014: Pendekatan Dan Impak Terhadap Sosioekonomi, Kesihatan Dan Alam Sekitar; Penerbit Universiti Kebangsaan Malaysia: Selangor, Malaysia, 2017. [Google Scholar]
- Abdullah, M.P.; Salleh, S.; Elfithri, R.; Mokhtar, M.; Toriman, M.E.; Embi, A.F.; Abdul-Maulud, K.N.; Maimon, A.; Heng, L.Y.; Halimshah, S.; et al. Stakeholders′ Response and Perspectives on Flood Disaster of Pahang River Basin. Malays. J. Geosci. 2017, 1, 43–49. [Google Scholar] [CrossRef]
Figure 1.
Map of Pahang State, Peninsular Malaysia.

Figure 2.
Map of Pekan district in the State of Pahang, Peninsular Malaysia.

Figure 3.
LVI of the adaptive capacity factor for 11 sub-districts of Pekan for components: (a) Socio-demographic Profile, (b) Livelihood Strategies, and (c) Social Network.
Figure 3.
LVI of the adaptive capacity factor for 11 sub-districts of Pekan for components: (a) Socio-demographic Profile, (b) Livelihood Strategies, and (c) Social Network.

Figure 4.
LVI of sensitivity factor for 11 sub-districts of Pekan for components: (a) Health, (b) Food, (c) Water, (d) Housing, (e) Land, and (f) Finance and Income.
Figure 4.
LVI of sensitivity factor for 11 sub-districts of Pekan for components: (a) Health, (b) Food, (c) Water, (d) Housing, (e) Land, and (f) Finance and Income.


Figure 5.
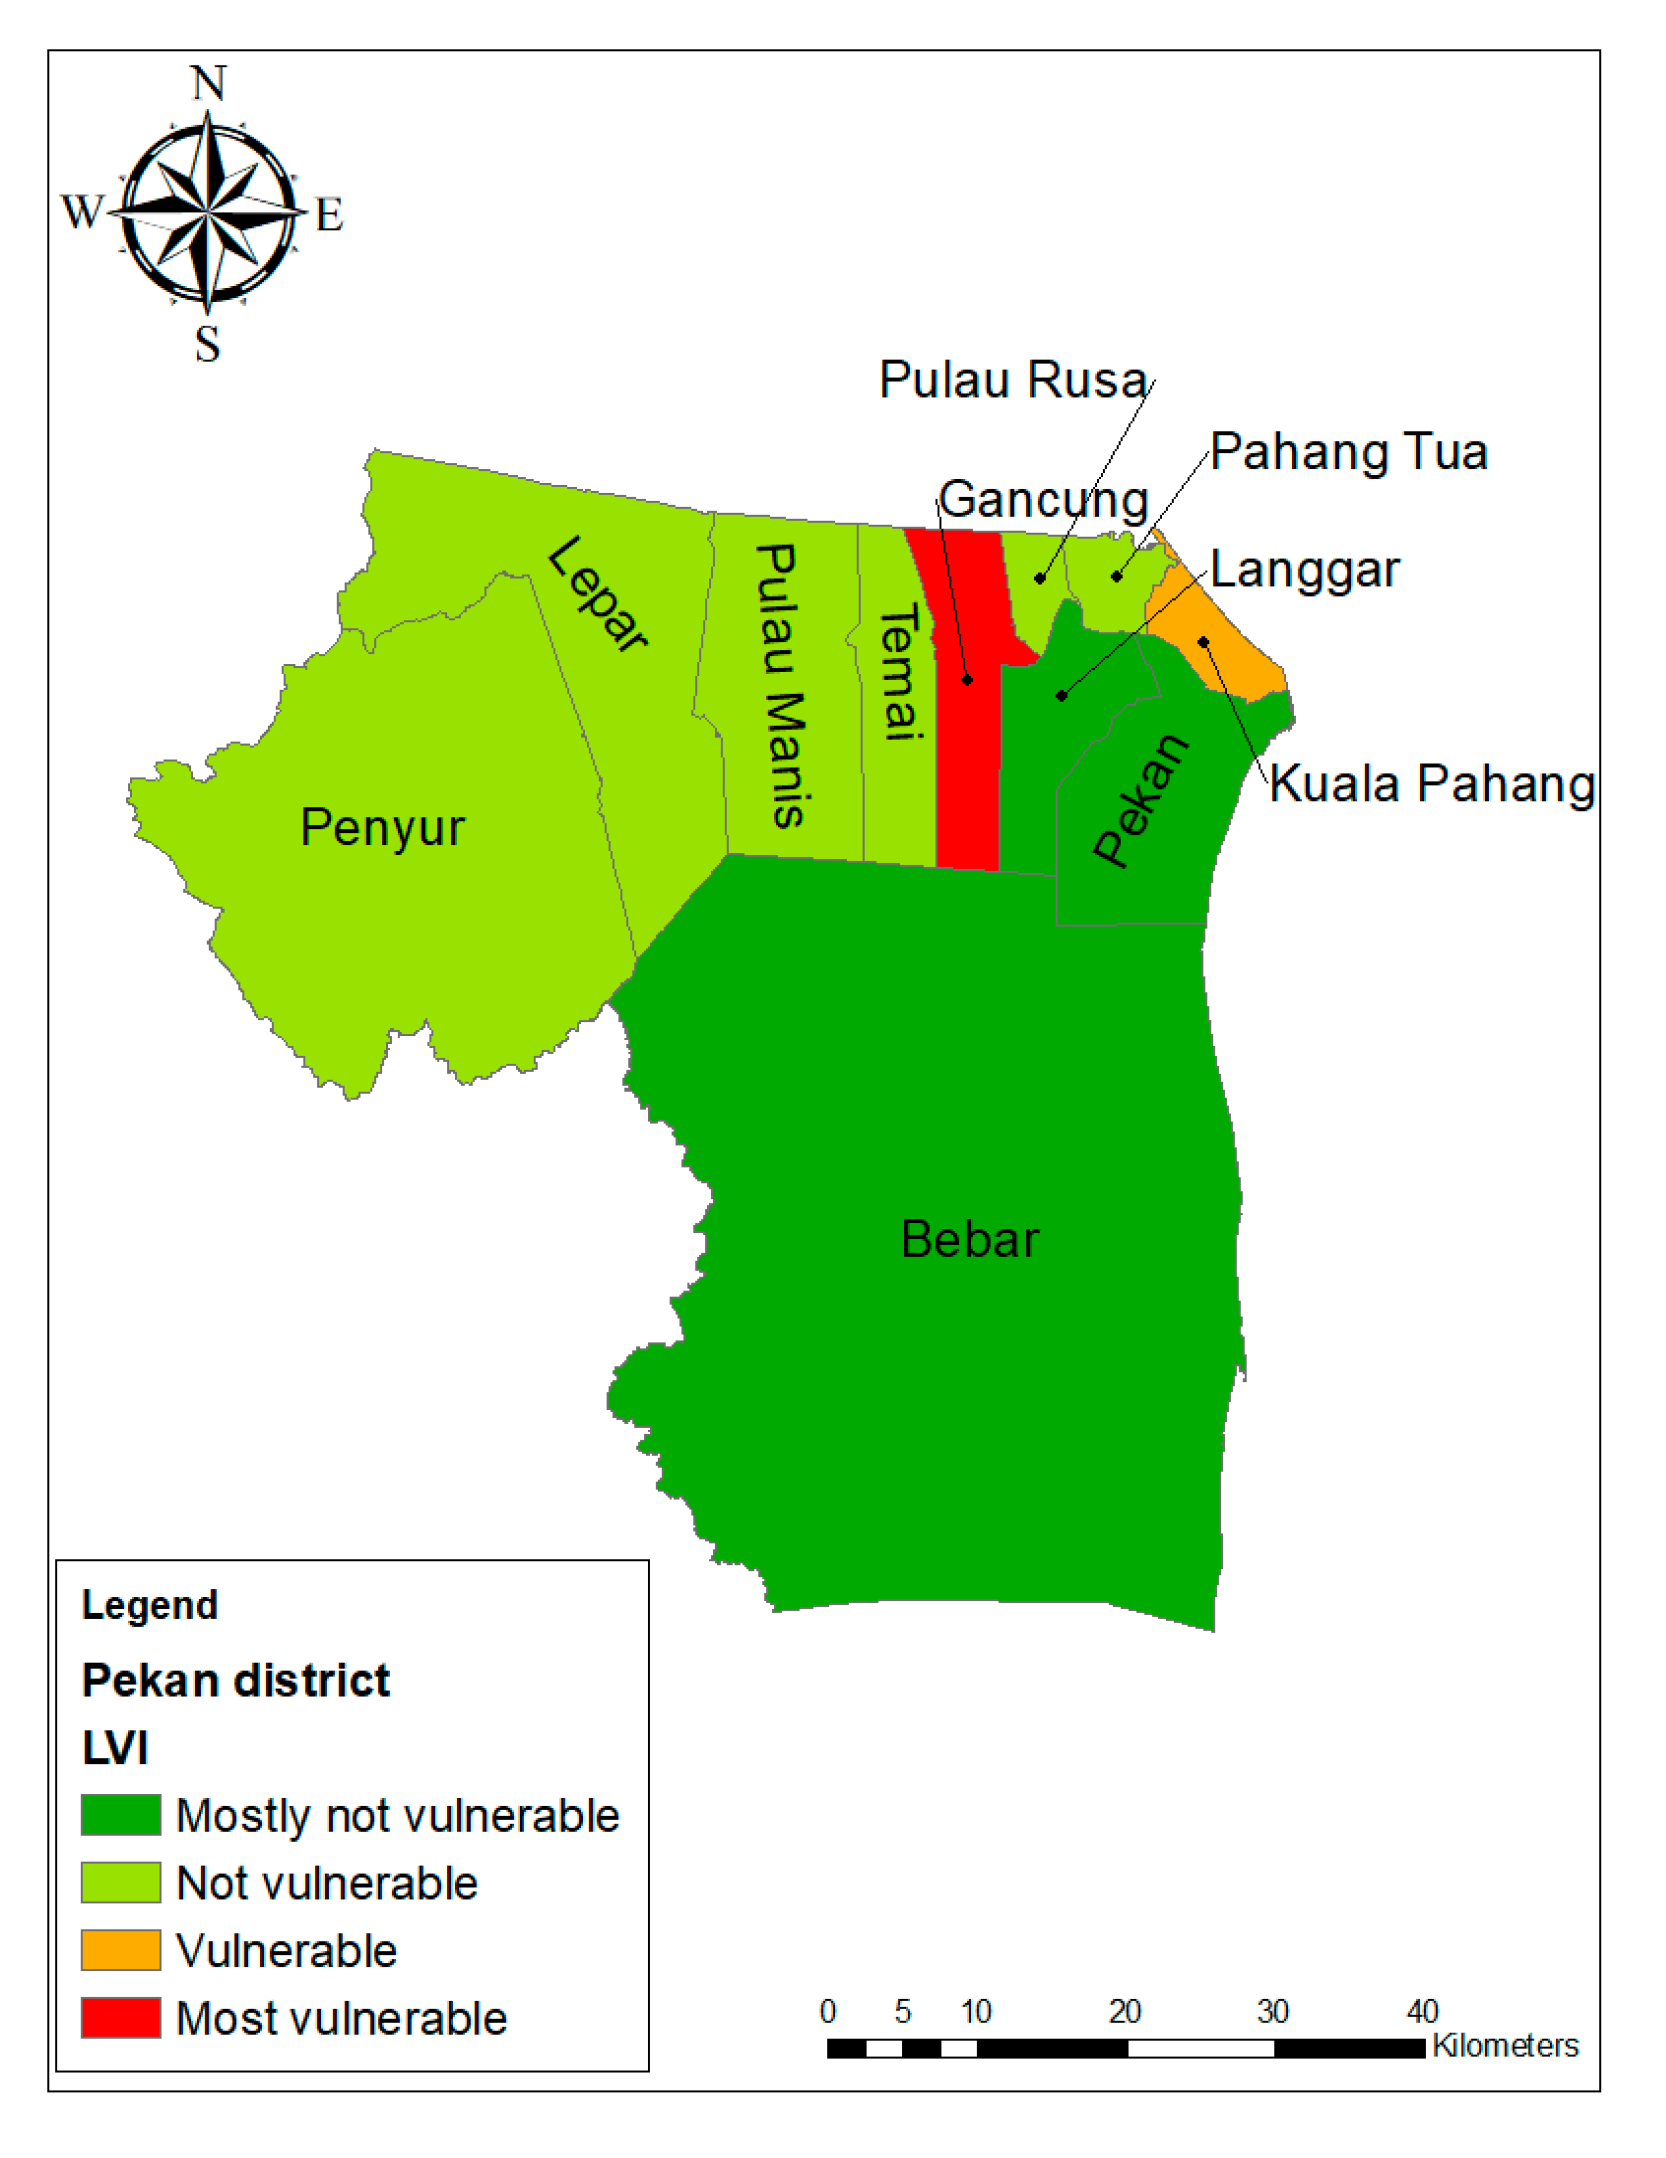
LVI of exposure factor for 11 sub-districts of Pekan for the Natural Disasters and Climate Variability component.
Figure 5.
LVI of exposure factor for 11 sub-districts of Pekan for the Natural Disasters and Climate Variability component.

Figure 6.
Spider diagram of vulnerability in terms of the 10 major components of the LVI for 10 sub-districts of Pekan.
Figure 6.
Spider diagram of vulnerability in terms of the 10 major components of the LVI for 10 sub-districts of Pekan.

Figure 7.
Vulnerability triangle diagram of the contributing factors of the LVI–IPCC for 10 sub-districts of Pekan.
Figure 7.
Vulnerability triangle diagram of the contributing factors of the LVI–IPCC for 10 sub-districts of Pekan.


Table 1.
Livelihood Vulnerability Index (LVI) major components and sub-components classified into Intergovernmental Panel on Climate Change (IPCC) contributing factors of vulnerability for LVI–IPCC calculation.
Table 1.
Livelihood Vulnerability Index (LVI) major components and sub-components classified into Intergovernmental Panel on Climate Change (IPCC) contributing factors of vulnerability for LVI–IPCC calculation.
| IPCC Contributing Factors to Vulnerability | Major Components | Sub-components | Units |
|---|---|---|---|
| Adaptive capacity | Socio-demographic profile | Dependency ratio | Ratio |
| Percent of female-headed households | % | ||
| Average age of female head of household | count | ||
| Percent of households where head of household has not attended school | % | ||
| Percent of households with orphans | % | ||
| Percent of poor households (income below RM940) | % | ||
| Average number of family members in a household | count | ||
| Livelihood strategies | Percent of households with a family member working in a different community | % | |
| Percent of households dependent solely on agriculture as a source of income | % | ||
| Percent of households with no job during flood season | % | ||
| Average agriculture livelihood diversification index (range: 0.20–1) | 1/#livelihoods | ||
| Percent of households without a non-agricultural livelihood income contribution | % | ||
| Percent of households exploring NR (during flood seasons) | % | ||
| Percent of households that fish (during flood season) | % | ||
| Social network | Average money borrowing–lending ratio | Ratio | |
| Percent of households that receive help due to flooding | % | ||
| Percent of households participating as volunteers during floods | % | ||
| Percent of households that have not been participating in any organizations | % | ||
| Percent of households that have not gone to their local government for assistance | % | ||
| Sensitivity | Health | Average time to get to a health facility | Minutes |
| Percent of households with a family member with a chronic illness | % | ||
| Percent of households where a family had to miss work or school in the last 2 weeks due to illness | % | ||
| Percent of households with a family member who got ill due to flooding | % | ||
| Food | Average crop diversity index | 1/#crops | |
| Percent of households that do not save food | % | ||
| Percent of households that not cultivate 3rd crops | % | ||
| Percent of households that do not sell/barter crops for other food supplies | % | ||
| Water | Percent of households that utilize a natural water source | % | |
| Percent of households that do not have a consistent water supply | % | ||
| Average time to water sources | Minutes | ||
| Inverse of the average number of liters of water stored per household (range: 0–1) | 1/Liters | ||
| Housing | Percent of households with non-solid houses (wood) | % | |
| Percent of households with houses not elevated by high ground to avoid floods | % | ||
| Percent of households with housing affected by floods | % | ||
| Land | Percent of households without ownership of the lands they live on (landless) | % | |
| Percent of households with small land area (0.1–0.5 ha) | % | ||
| Finance & Income | Percent of households that borrow money | % | |
| Percent of households with income affected due to flooding | % | ||
| Exposure | Natural Disasters and Climate Variability | Average number of floods in the past 7 years | count |
| Percent of households with losses of physical assets (machinery) due to flooding | % | ||
| Percent of households with injuries or deaths from natural disasters in the last 7 years | % | ||
| Percent of households that did not receive a warning about flooding | % |
Table 2.
LVI classified into four vulnerability ranges.
| Classification | Range |
|---|---|
| Most invulnerable | 0.000000–0.239500 |
| Not vulnerable | 0.239501–0.479000 |
| Vulnerable | 0.479001–0.718500 |
| Most vulnerable | 0.718501–1.000000 |
Table 3.
Indexed sub-components and maximum and minimum values for 10 sub-districts in Pekan.
| Major Components | Sub-Components | Pahang Tua | Penyur | Gancung | Langgar | Pulau Manis | Pekan | Kuala Pahang | Lepar | Pulau Rusa | Temai | Maximum Value in all Sub-Districts | Minimum Value in all Sub-Districts |
|---|---|---|---|---|---|---|---|---|---|---|---|---|---|
| Socio-Demographic Profile | Dependency ratio | 0.33 | 0.30 | 0.20 | 0.53 | 0.04 | 1.44 | 0.33 | 0.25 | 0.18 | 0.19 | 3 | 0 |
| Percent of female-headed households | 25 | 31.50 | 27 | 31 | 23 | 14 | 30 | 20 | 5 | 8 | 100 | 0 | |
| Average age of female head of household | 70.60 | 59.50 | 51 | 61.60 | 50.10 | 61.60 | 62 | 63.30 | 41 | 60.50 | 71 | 0 | |
| Percent of households where head of household has not attended school | 5 | 5 | 0 | 5 | 0 | 3.5 | 10 | 7 | 5 | 0 | 100 | 0 | |
| Percent of households with orphans | 5 | 7 | 7 | 13 | 15 | 0 | 5 | 0 | 0 | 12 | 100 | 0 | |
| Percent of poor households (income below RM940) | 45 | 49.30 | 60 | 33.70 | 30.80 | 27.30 | 45 | 30 | 20 | 28 | 100 | 0 | |
| Average number of family members in a household | 4.40 | 3 | 1.90 | 4.30 | 3 | 4.10 | 2.25 | 2.93 | 5.15 | 3.08 | 7 | 0 | |
| Livelihood Strategies | Percent of households with a family member working in a different community | 50 | 39.50 | 30 | 41 | 46 | 32 | 0 | 30 | 30 | 28 | 100 | 0 |
| Percent of households dependent solely on agriculture as a source of income | 20 | 16.50 | 23 | 5 | 23 | 3.5 | 20 | 13 | 25 | 0 | 100 | 0 | |
| Percent of households with no job during flood season | 25 | 36.55 | 20 | 20.15 | 46.20 | 7.35 | 0 | 3.30 | 30 | 60 | 100 | 0 | |
| Average agriculture livelihood diversification index (range: 0.20–1) | 0.98 | 0.99 | 1 | 1 | 1 | 1 | 1 | 1 | 0.98 | 1 | 1 | 0.2 | |
| Percent households without non-agricultural livelihood income contributions | 5 | 19.50 | 23.30 | 15.40 | 11.50 | 0 | 0 | 0 | 0 | 12 | 100 | 0 | |
| Percent of households exploring NR (during flood seasons) | 15 | 4.75 | 3.30 | 2.65 | 19.20 | 46.65 | 5 | 0 | 5 | 12 | 100 | 0 | |
| Percent of households that fish (during flood season) | 30 | 34.05 | 33.30 | 20.15 | 19.20 | 2 | 0 | 23.30 | 50 | 32 | 100 | 0 | |
| Social Network | Average money borrowing–lending ratio | 1.25 | 1.21 | 1.2 | 1.15 | 1.46 | 1.26 | 0.90 | 0.88 | 1.35 | 1.18 | 2 | 0.5 |
| Percent of households that receive help due to flooding | 100 | 100 | 96.70 | 92.35 | 100 | 100 | 70 | 100 | 95 | 100 | 100 | 0 | |
| Percent of households that participate as volunteers during floods | 20 | 53.55 | 26.70 | 7.65 | 46.20 | 10 | 20 | 23.30 | 45 | 60 | 100 | 0 | |
| Percent of households that are in any organizations | 80 | 73.55 | 90 | 76.95 | 57.70 | 98 | 50 | 30 | 65 | 60 | 100 | 0 | |
| Percent of households that have not gone to their local government for assistance | 70 | 92.60 | 90 | 76.95 | 69.20 | 32 | 90 | 86.70 | 95 | 76 | 100 | 0 | |
| Health | Average time to get to a health facility | 4.25 | 8.31 | 9.40 | 9.64 | 12.08 | 14.8 | 6.30 | 7.33 | 12.45 | 11.84 | 22 | 0 |
| Percent of households with family members with chronic illness | 65 | 36.80 | 46.70 | 61.45 | 42.30 | 27.35 | 70 | 43.30 | 40 | 36 | 100 | 0 | |
| Percent of households where a family member had to miss work or school in the last 2 weeks due to illness | 30 | 36.55 | 56.70 | 25.15 | 69.20 | 16 | 0 | 40 | 25 | 40 | 100 | 0 | |
| Percent of households with a family member contract an illness due to floods | 15 | 21.55 | 10 | 27.75 | 34.60 | 5.35 | 25 | 0 | 10 | 16 | 100 | 0 | |
| Food | Average crop diversity index | 0.20 | 0.41 | 0.20 | 0.33 | 0.25 | 0 | 0 | 0.50 | 0.33 | 0.33 | 0.5 | 0 |
| Percent of households that do not save food | 75 | 100 | 96.70 | 97.50 | 80.80 | 100 | 60 | 100 | 100 | 76 | 100 | 0 | |
| Percent of households that do not cultivate 3rd crops | 80 | 97.50 | 93.30 | 97.50 | 96.20 | 100 | 100 | 100 | 90 | 100 | 100 | 0 | |
| Percent of households that do not sell/barter crops for other food supplies | 65 | 92.75 | 90 | 94.85 | 69.20 | 100 | 85 | 83.30 | 75 | 76 | 100 | 0 | |
| Water | Percent of households that utilize a natural water source | 10 | 71.30 | 80 | 5.25 | 11.50 | 0 | 10 | 73.30 | 35 | 12 | 100 | 0 |
| Percent of households that do not have a consistent water supply | 20 | 21.55 | 0 | 5 | 23.10 | 36.65 | 0 | 96.70 | 10 | 20 | 100 | 0 | |
| Average time to get to water sources | 0.78 | 20.68 | 6 | 2.41 | 4.15 | 24.66 | 1.5 | 11.67 | 0.13 | 9.08 | 49 | 0 | |
| Inverse of the average number of liters of water stored per household (range: 0–1) | 0.19 | 0.08 | 0.05 | 0.22 | 0.01 | 0.82 | 1 | 0 | 0.19 | 0.07 | 1 | 0 | |
| Housing | Percent of households with non-solid houses (wood) | 15 | 11.90 | 3.30 | 36.60 | 11.50 | 16 | 0 | 3.30 | 20 | 24 | 100 | 0 |
| Percent of households with houses not elevated by high ground to avoid floods | 20 | 60.1 | 56.7 | 25.25 | 46.2 | 94 | 25 | 30 | 60 | 28 | 100 | 0 | |
| Percent of households with housing affected by floods | 65 | 75.60 | 50 | 61.20 | 76.90 | 6 | 95 | 83.30 | 60 | 92 | 100 | 0 | |
| Land | Percent of households without ownership of the lands they live on (landless) | 15 | 21.50 | 9.90 | 15.25 | 38.50 | 29.35 | 30 | 16.63 | 5 | 12 | 100 | 0 |
| Percent of households with small land area (0.1–0.5 ha) | 65 | 56.55 | 93.30 | 51.20 | 50 | 76.65 | 85 | 36.30 | 40 | 80 | 100 | 0 | |
| Finance & Income | Percent of households that borrow money | 25 | 21.65 | 23.30 | 17.75 | 46.20 | 11.35 | 10 | 10 | 40 | 24 | 100 | 0 |
| Percent of households with income affected due to floods | 25 | 36.55 | 20 | 20.15 | 46.2 | 7.35 | 0 | 3.30 | 30 | 60 | 100 | 0 | |
| Natural Disasters and Climate Variability | Average number of floods in the past 7 years | 2.15 | 0.73 | 3.57 | 2.06 | 2.69 | 1.42 | 6.50 | 2.20 | 2.45 | 3.44 | 7 | 0 |
| Percent of households with losses to physical assets (house/machinery) due to flooding | 25 | 36.20 | 33.30 | 20.15 | 61.50 | 10 | 35 | 50 | 20 | 16 | 100 | 0 | |
| Percent of households with injury or death from natural disasters in the last 7 years | 5 | 0 | 0 | 0 | 3.80 | 0 | 0 | 0 | 0 | 4 | 100 | 0 | |
| Percent of households that did not receive a warning about flooding | 0 | 16.90 | 0 | 2.65 | 0 | 6 | 0 | 3.30 | 10 | 16 | 100 | 0 |
Table 4.
Indexed major components and overall LVI for 10 sub-districts in Pekan.
| Major Component | Pahang Tua | Gancung | Penyur | Pulau Manis | Kuala Pahang | Lepar | Pulau Rusa | Langgar | Temai | Pekan |
|---|---|---|---|---|---|---|---|---|---|---|
| Socio-Demographic Profile | 0.36 | 0.28 | 0.32 | 0.26 | 0.31 | 0.29 | 0.24 | 0.35 | 0.26 | 0.34 |
| Livelihood Strategies | 0.38 | 0.36 | 0.45 | 0.41 | 0.21 | 0.27 | 0.37 | 0.32 | 0.38 | 0.30 |
| Social Network | 0.70 | 0.76 | 0.80 | 0.74 | 0.58 | 0.59 | 0.78 | 0.66 | 0.75 | 0.64 |
| Health | 0.32 | 0.39 | 0.38 | 0.50 | 0.31 | 0.29 | 0.33 | 0.39 | 0.36 | 0.29 |
| Food | 0.65 | 0.80 | 0.93 | 0.74 | 0.61 | 0.95 | 0.82 | 0.89 | 0.79 | 0.75 |
| Water | 0.12 | 0.24 | 0.41 | 0.11 | 0.28 | 0.48 | 0.16 | 0.09 | 0.14 | 0.42 |
| Housing | 0.33 | 0.36 | 0.49 | 0.45 | 0.40 | 0.38 | 0.46 | 0.41 | 0.48 | 0.38 |
| Land | 0.40 | 0.51 | 0.39 | 0.44 | 0.57 | 0.26 | 0.22 | 0.33 | 0.46 | 0.53 |
| Finance and Income | 0.25 | 0.21 | 0.29 | 0.46 | 0.05 | 0.06 | 0.35 | 0.18 | 0.42 | 0.09 |
| Natural Disasters and Climate Variability | 0.15 | 0.59 | 0.15 | 0.26 | 0.32 | 0.21 | 0.16 | 0.13 | 0.21 | 0.09 |
| LVI | 0.38 | 0.45 | 0.47 | 0.43 | 0.35 | 0.39 | 0.39 | 0.78 | 0.41 | 0.61 |
Table 5.
LVI–IPCC contributing factors values for 10 sub-districts in Pekan.
| IPCC Contributing Factors to Vulnerability | Pahang Tua | Gancung | Penyur | Pulau Manis | Kuala Pahang | Lepar | Pulau Rusa | Langgar | Temai | Pekan |
|---|---|---|---|---|---|---|---|---|---|---|
| Adaptive capacity | −0.10 | 0.06 | −0.17 | −0.08 | −0.01 | −0.07 | −0.11 | −0.12 | −0.09 | −0.14 |
| Sensitivity | 0.35 | 0.43 | 0.51 | 0.45 | 0.38 | 0.46 | 0.41 | 0.41 | 0.44 | 0.43 |
| Exposure | 0.15 | 0.59 | 0.15 | 0.26 | 0.32 | 0.21 | 0.16 | 0.13 | 0.21 | 0.09 |
| LVI–IPCC | −0.10 | 0.06 | −0.17 | −0.08 | −0.01 | −0.07 | −0.11 | −0.12 | −0.09 | −0.14 |
© 2019 by the authors. Licensee MDPI, Basel, Switzerland. This article is an open access article distributed under the terms and conditions of the Creative Commons Attribution (CC BY) license (http://creativecommons.org/licenses/by/4.0/).
Share and Cite
MDPI and ACS Style
Abd Majid, N.; Muhamad Nazi, N.; Mohd Idris, N.D.; Taha, M.R. GIS-Based Livelihood Vulnerability Index Mapping of the Socioeconomy of the Pekan Community. Sustainability 2019, 11, 6935. https://doi.org/10.3390/su11246935
AMA Style
Abd Majid N, Muhamad Nazi N, Mohd Idris ND, Taha MR. GIS-Based Livelihood Vulnerability Index Mapping of the Socioeconomy of the Pekan Community. Sustainability. 2019; 11(24):6935. https://doi.org/10.3390/su11246935
Chicago/Turabian StyleAbd Majid, Nuriah, Nurafiqah Muhamad Nazi, Nor Diana Mohd Idris, and Mohd. Raihan Taha. 2019. "GIS-Based Livelihood Vulnerability Index Mapping of the Socioeconomy of the Pekan Community" Sustainability 11, no. 24: 6935. https://doi.org/10.3390/su11246935
Note that from the first issue of 2016, this journal uses article numbers instead of page numbers. See further details here.