Failing Services on Urban Waste Management in Developing Countries: A Review on Symptoms, Diagnoses, and Interventions


1
BreAd B.V., 6131 AG Sittard, The Netherlands
2
Faculty of Management Science and Technology, Open University of the Netherlands, P.O. box 2960, NL-6401 DL Heerlen, The Netherlands
*
Author to whom correspondence should be addressed.
Sustainability 2019, 11(24), 6977; https://doi.org/10.3390/su11246977
Submission received: 31 October 2019
/
Revised: 16 November 2019
/
Accepted: 4 December 2019
/
Published: 6 December 2019
(This article belongs to the Section Sustainable Engineering and Science)
Abstract
:The potential and scale of cities enable economic growth and the improvement of citizens’ access to jobs, education, healthcare, culture, public utilities and services. Solid waste management (SWM) is one of the key services provided by cities. Its operations are complex, very visible to the general public, and impacted by strong financial, societal, and political constraints. Performances in developing countries, however, are not positive. United Nations research shows urban collection services covering no more than 39% of the population in low-income countries. Why are many cities in developing countries not able to use their increasing wealth and scale for basic SWM services such as city cleaning, collection, and sustainable landfilling? This paper provides a review of literature on this question over the last decade. It shows that research is mostly on symptoms and has not led to a deeper diagnosis of causes. Lack of resources, infrastructure, awareness, and institutional strength are often pinpointed as causes but, in fact, they should be addressed as symptoms. These symptoms should be designated as dependent variables in a complex causal network with systemic feedbacks, hindering or neutralizing attempts to improve performances if not properly dealt with. Research should concentrate more on assessing the relations between urbanization, urban processes, and urban governance that shape the performance of urban solid waste management. System dynamics modeling may provide new approaches for this diagnosis.
1. Introduction
The availability of proper management of municipal solid waste (MSW) is a blessing to citizens around the world. In urban settings, it drastically helps to prevent diseases, to improve general wellbeing, and to boost city attractiveness. The absence of urban services on solid waste management (SWM) leads to costs of inaction that sum up to 5–10 times those of appropriate services [1]. Against this backdrop, it is bitter to learn that in lower income countries, still 61% of the population has to live without access to waste collection and 93% of all collected waste is disposed of in open and uncontrolled dumpsites [2]. The social injustice of this situation is even more poignant when considering that mostly the urban poor are exempted from services, whereas they are burdened with most of its adverse effects [3].
In this literature review, the authors will show that research on SWM services in cities in developing countries (CDCs) covers quite adequately the symptoms of this failing performance. At the same time, diagnosing causes and designing suitable interventions seem to attract less scholarly attention. This review will provide a conceptual model to bridge this gap by relating urbanization to governance and other urban processes that dominate the performance of SWM services in CDCs. The review reveals that causal relations in this model are multi-dimensional, complex, and dynamic. The authors postulate that root causes may be predominantly in deficient political, operational, and financial causal trajectories. The authors propose to elaborate the conceptual model into a diagnosis tool that will enhance analyzing and improving SWM services. The challenge in this elaboration will be to find a versatile trade-off between needed holism, data availability, and practical usability.
Forecasts show that cities in developing countries will accommodate 93% of the world’s future population growth. By 2030, 60% of the population of developing countries is expected to be urban [4,5]. This process of urbanization enables and challenges the provision of public urban services, such as solid waste management. The enabling effect is a result of the economies of scale that are reached. They have been the driving forces behind economic growth and the improvement of citizens’ access to jobs and an array of public services [4,5,6]. In fact, urban growth provides public authorities with the needed scale when trying to achieve progress on sustainable development goals [6,7,8]. Nevertheless, urban authorities in developing countries are also challenged by this increase of their populations which, in some cases, equals the yearly addition of a population of an entire city like Rotterdam with 650,000 inhabitants. Often, this task is extra burdened with a number of drawbacks. Issues like urban poverty, weak institutional capacities, limited budgets, inadequate infrastructure, corruption, and increasing local responsibilities, add to a situation of sometimes uncontrollable urbanization and sprawl [3,4,5,9]. In a number of cities, especially in Africa, this situation is out of control and prohibits their socio-economic and sustainable development [6].
As said, waste collection services in low-income countries reaches no more than 39% of the population. For lower-middle income countries a collection coverage of around 51% is mentioned and for upper-middle income countries coverage is going up to 82% [1,2,10,11]. Cities perform better than their homelands, with coverages of 48%, 71%, and 85%, respectively. Once waste is collected, it has to be removed out of the cities and brought to proper treatment facilities. But, also for these activities, developing countries show deficiencies. Excessive littering, illegal dumping, and burning can be observed. Municipal treatment facilities in developing countries can mostly be characterized as open dumps, lacking management and environmental protection [12,13,14,15,16,17,18].
Unmistakably, the global role of CDCs in housing future populations is pivotal. Nevertheless, we can conclude that many of these cities are not (yet) able to use their scale and wealth for providing good SWM services to all their residents. This paper acknowledges the Sisyphean character of this role. It reviews recent literature on the development of SWM under dynamic urban circumstances in developing countries, thereby considering all relevant urban processes (i.e., changing social, cultural, economic, financial, political, institutional, legal, infrastructural, and other circumstances) and the way they are affected by urban governance (i.e., the way governments control and interact with stakeholders). The review uses the analogy of medical problem solving, using consecutive steps of symptoms-assessment/diagnoses/intervention, in order to classify the literature’s subjects and methods. In doing so, it concludes that the academic attention needs a shift towards improved understanding of root causes and towards informed interventions. The central questions of this paper are therefore phrased as follows.
- Can we diagnose why many CDCs fail to provide good SWM services and, in doing so, can we address crucial causes and urban processes affecting this failure?
- Based on this, can we design a conceptual model that may serve as a framework to shape future research in this field and as a tool to analyze feasible interventions as a part of urban governance?
The remaining part of this introduction will be dedicated to a first conceptualization. For this purpose, the concept of SWM and its relation to urbanization, urban processes, and urban governance need to be specified in more detail.
SWM comprises the management of all activities, infrastructure, services, regulations, planning, arrangements, contracts, organizational entities, etc., related to the production, collection, treatment, and disposal of solid waste. Street cleaning should, together with waste collection, be regarded as part of the priority activities of cities’ SWM services, as preventing direct human contact with waste and averting clogged drainage and sewage systems are crucial in improving public health [19,20,21]. But also, the abatement of wash off of plastics into rivers and marine environments and the need to improve the general cleanliness and attractiveness of cities necessitate a 100% coverage of these services [1,12,22]. Over time, authorities in developed countries started including the disposal of waste in their responsibilities. And, as a result of limited availability of disposal facilities and public concerns, the interest in recycling was sparked [1]. Nowadays, we see that prevention, reduction, reuse, recycling, and circular economy concepts have gained a priority position in policies around the world, and have led to a broad array of industries involved in using waste as resources. For developing countries, this evolution is often still in its infancy. Wilson et al. provide a historical overview of conceptual paradigms of managing waste such as integrated waste management (IWM) and integrated sustainable waste management (ISWM) [23]. These authors claim that IWM is a developed-world concept that predominantly focuses on technical aspects, whereas ISWM considers the wider context by including financial, social, and institutional aspects. ISWM has been used widely when assessing SWM in developing countries [1,2,24]. Its holistic approach has opened doors for a diversity of claims and discussions. These discussions left aside, the general consensus is that ISWM is in need of deeper systems analysis and the use of dynamic modeling in order to understand the reasons for lacking SWM performance [17,25,26]. This review considers this wider context of ISWM in its relation to urban processes and governance but, at the same time, it will be restricted to the basic chain of urban SWM services for city cleaning, waste collection, transport, and disposal, as this is still paramount in most developing countries. The availability and sustainability of these physical services and infrastructure of course needs to be underpinned with adequate policies and governance, and sound organization and finances. The integrated system of this basic chain and its underpinning aspects will, in this review, be referred to as the “SWM Backbone”.
The supply of public services like SWM is strongly influenced by the rate of urbanization and the quality of urban governance. Obeng-Odoom provides an overview of the history of concepts on urban governance [27]. The concepts have shifted from urban planning towards urban management and then on to urban governance. Where urban planning referred to traditional political top–down implementation of urban programs, urban management focused on improving the efficiency of urban services by introducing business methods. Urban governance emphasizes the importance of social issues and the complementary roles of governmental, entrepreneurial, and civil stakeholders [28]. Governance is then referred to as the system of interaction in the action space of this network of stakeholders. Gradually, the notion has gained ground that urban governance is a dynamic process that does not benefit from static checklist approaches often used in urban planning. Harpham et al. referred to urbanization as the engine that propels a continuous change in urban circumstances and processes and requires ongoing adaptation of its governance [29]. At the same, this need for dynamism suffers from different types of inertia (infrastructural, organizational, and social), keeping it from adequate adaptation to changing circumstances [30,31]. The need is felt for solutions that do not just tweak or repair existing systems but, instead, transform them in order to deal with inertia [31]. Bai et al. and Childers call for a shift from mapping output towards understanding processes that enables cities to deal with cross-sectoral complexity, dynamics, and uncertainty [31,32]. Bai et al. advocate the use of a systems approach as it may hold a promise for improved understanding and interventions [7]. Examples in the field of SWM are the use of financial incentives, the emergence of consumer activism, and the introduction of extended producer responsibility [32]. This line of thought overlaps with developments in urban ecology research. McPhearson et al. provide an overview on how classical ecology (ecology in cities) was linked to social processes in concepts that consider the city itself an ecological system (ecology of cities) [33]. The last ten years have shown a further broadening of the use of this concept with other disciplines into holistic models (ecology for cities). For example, Wu appeals for developing system models for cities that integrate and cope with complexity, inertia, dynamics, and feedback systems [34]. Where urban ecology tries to analyze by connecting more and more detailed aspects of urban processes, academic developments around scaling city processes seem to go the opposite way. Scaling investigates statistical relations between size, shape, and an array of urban variables making this method valuable for forecasting [35,36].
Overlooking the above, we may define the relations between urbanization, urban processes, urban governance, and SWM as presented in Figure 1. It places urban processes in the center. These processes are powered by urbanization and controlled by urban governance (which, in itself, can also be looked at as a process). The processes relevant to SWM, lead to a performance (output, outcome, and impact) of SWM and this performance then feeds back as input for governance, thus adding to an overall dynamic system. External variables, such as (inter) national developments with regard to policies, economics, and finance, may have their influences on urbanization, processes, and governance and are included on the input-side of the model. The relations between urbanization and processes and between urban governance and processes are bidirectional representing that they are mutually influencing each other. Not represented in this figure is the assumption that many urban processes are influencing each other. As this scheme relates to the abstract level of processes and variables, also stakeholders and their roles are not included.
2. Method and Analytical Framework
2.1. Literature Review
The aim of this review is to gain insight in the factors restraining CDCs from offering all of their citizens, companies, and institutions access to good SWM services. The literature review therefore uses the following scope:
- Only cities in low-income and middle-income countries (CDCs) are considered.
- Only larger cities (with more than 0.5 million inhabitants) are considered.
- Only MSW is considered. It includes waste from households, urban services (street sweeping, park maintenance, market waste), and small shops, offices, institutions, schools, restaurants etc., with the latter only for as much as it is collected by the municipality. In an urban setting, it is the most important type of waste because it is all around, it has the most detrimental effects and it is the most visible type of waste.
- The review is restricted to the SWM Backbone of services and infrastructure as defined above, including all technical, social, cultural, financial, organizational, legal, psychological, and governance aspects that play a role in managing them. This restriction leaves out aspects such as prevention, recycling, waste-to-energy, and circular economy.
- As for journals, only peer reviewed academic journals are included.
- As for non-journal sources, only publications (reports, books etc.) are included when referred to in multiple articles.
- Only publications from the last 10 years are considered. Earlier articles are not considered, unless they appeared as interesting references in later publications (via backward snowballing).
- Only articles written in English are considered.
The review was performed in March 2019. The used keywords for the search were: city cleaning, waste collection, cleanliness, waste management, solid waste management, model(s), public services, coverage, supply chain, cities/urban/city, urbanization, developing countries. These keywords were used separately and, if the resulting number of articles was too large, in combinations of up to four.
The resulting 1951 articles were scanned on usability based on their titles and, if needed for more details, abstracts. Articles were excluded in case the titles referred to developed countries only, to treatment options other than dumping/landfilling, to waste management in rural areas and small islands, to operational optimizations like collection routes and site selection, and to circular economy and health effects.
Publications on assessment methods such as environmental and social impact assessment, life cycle analysis, life cycle costing, multi criteria decision making, and eco-efficiency analysis were excluded as these methods are mostly prospective and are rarely used in diagnosing current or past performances.
Included were those articles referring to assessment methods such as benchmarking, (dynamic) modeling and simulation, path analysis, material flow analysis, cashflow analysis, statistical analyses of databases and expert interviews, and mixed methods case studies.
After this selection, 44 articles and reports remained and all of these were analyzed based on their full text by using the same criteria mentioned above. In doing so, 39 articles and reports remained. The references in these articles were snowballed and some of the articles were used to find usable new articles citing them. Eventually, 47 publications were used as the corpus for this review.
2.2. Analytical Framework
This review maps the current research on causes of, and interventions for, failing urban SWM services. It does so by categorizing the publications based on their position in the chain of analyses needed to solve the problem. There are a number of conceptual frameworks defining a logical sequence of problem solving as, for example, defined by:
- Heifetz et al. for adaptive leadership by using iterations of the observe–interpret–intervene cycle [37].
- John Boyd for military use by analyzing situations and developing strategies through his observe–orient–decide–act (OODA) cycle [38].
- Van de Ven in formulating research problems through a sequence of situating, grounding, diagnosing, and resolving the problem [39].
- Watkins et al. in assessing development needs using the chain identify–analyze–decide [40].
To enhance the clarity of this review, we reframe these problem-solving methods into the analogy of a medical investigation of a patient by distinguishing the three most important stages being the assessment of symptoms, the diagnosis of causes, and the formulation of interventions.
- Symptoms do not explain; they just signal. In the context of this research, they can be all those signs, indications, facts, variables, and ratios that can be observed, measured, calculated, or in any other way be directly or indirectly derived from the current or past performance of a system. Examples for SWM include waste generation, collection coverage, deployed workforce and equipment, efficiency ratios, facilities (number, quality, capacity), waste treatment characteristics, financial data, involvement of third parties, availability of laws and policies, application of permits, and enforcement.
- Diagnosis uses knowledge, tests, or models to search for plausible root causes and establish the most likely ones [41]. In the framework of this review, a root cause is defined as the most original starting point of a sequence of effects. It can be an exogenous cause, coming from outside the urban system, or endogenous cause, inflicted by urban system deficiencies (inability), or deliberate decisions and actions by urban actors (neglect). In general, multiple causes can be expected.
- Interventions follow from diagnosis (except maybe in crisis situations) and should affect the most important causes in order to have a lasting, effective, and efficient impact. Mechanisms that just diminish the effect or initiate unwanted side effects, should be avoided.
Sometimes, inadequate problem-solving portrays symptoms as causes, and treats them as such. A diagnosis must hone the problem with adequate tools in order to prevent this treating of symptoms. Of course, in many cases, causes themselves can be regarded as symptoms of ever deeper lying causes. Somewhere, the diagnosis has to stop. Rooney et al. postulate that the root is reached when causes are specific, identifiable, controllable, and preventable [41]. Symptoms or causes can sometimes feedback their influence into the system. This adds to the complexity, especially when these feedbacks are time-delayed.
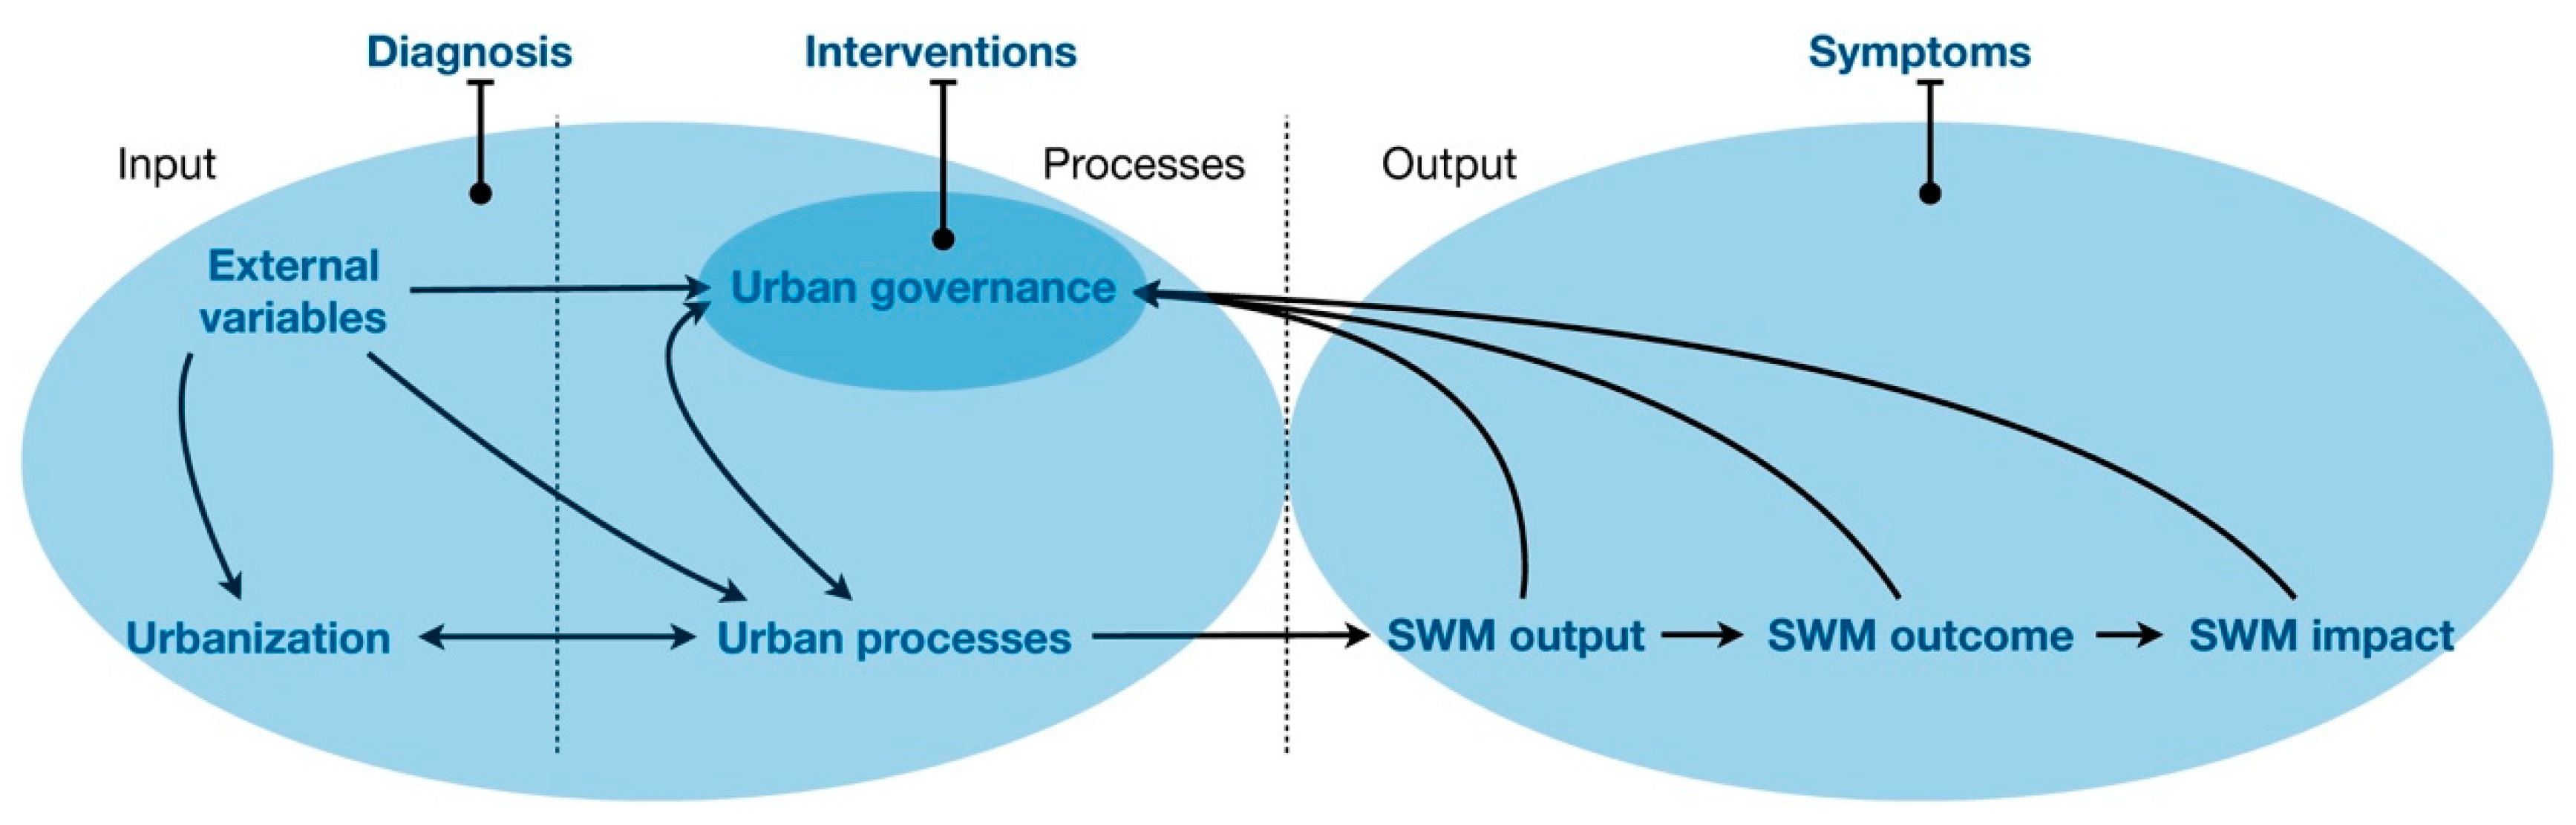
This format enables us to analyze where and how a publication contributes to solving the problem, and it synchronizes well with the system relations presented in Figure 1, as now presented in Figure 2.
It shows that symptoms primarily overlap with the output-part of the system on the right, whereas diagnosis covers both the input and processes on the left and in the middle. Interventions can be seen as part of the territory of urban governance which, as stated before, can be qualified as a process in itself.
All individual 47 publications, selected in this literature review, were assessed by:
- categorizing their arguments as related to “symptoms”, “diagnosis” or “interventions”;
- thereby, evaluating whether symptoms are portrayed as causes;
- and assessing whether claims are shouldered by evidence by referring to literature or the publication’s results.
In case a single publication holds arguments in multiple categories, it will be dealt with in all these categories. In case a publication’s argument does not refer to one of the three categories, it will be categorized as “data/tools”. This may, for example, be the case when a claim pertains to the development of a specific assessment method.
Under “diagnosis”, relevant causes and processes, as reported in the publications, will be synthesized separately for a cluster of processes by drafting up illustrative causal-loop-diagrams (CLDs) as, for example, described by Morecroft [42]. It will be shown that drawing up such individual CLDs may be a stepping stone towards deriving a more integrated and holistic system-description.
3. Results
3.1. Overview
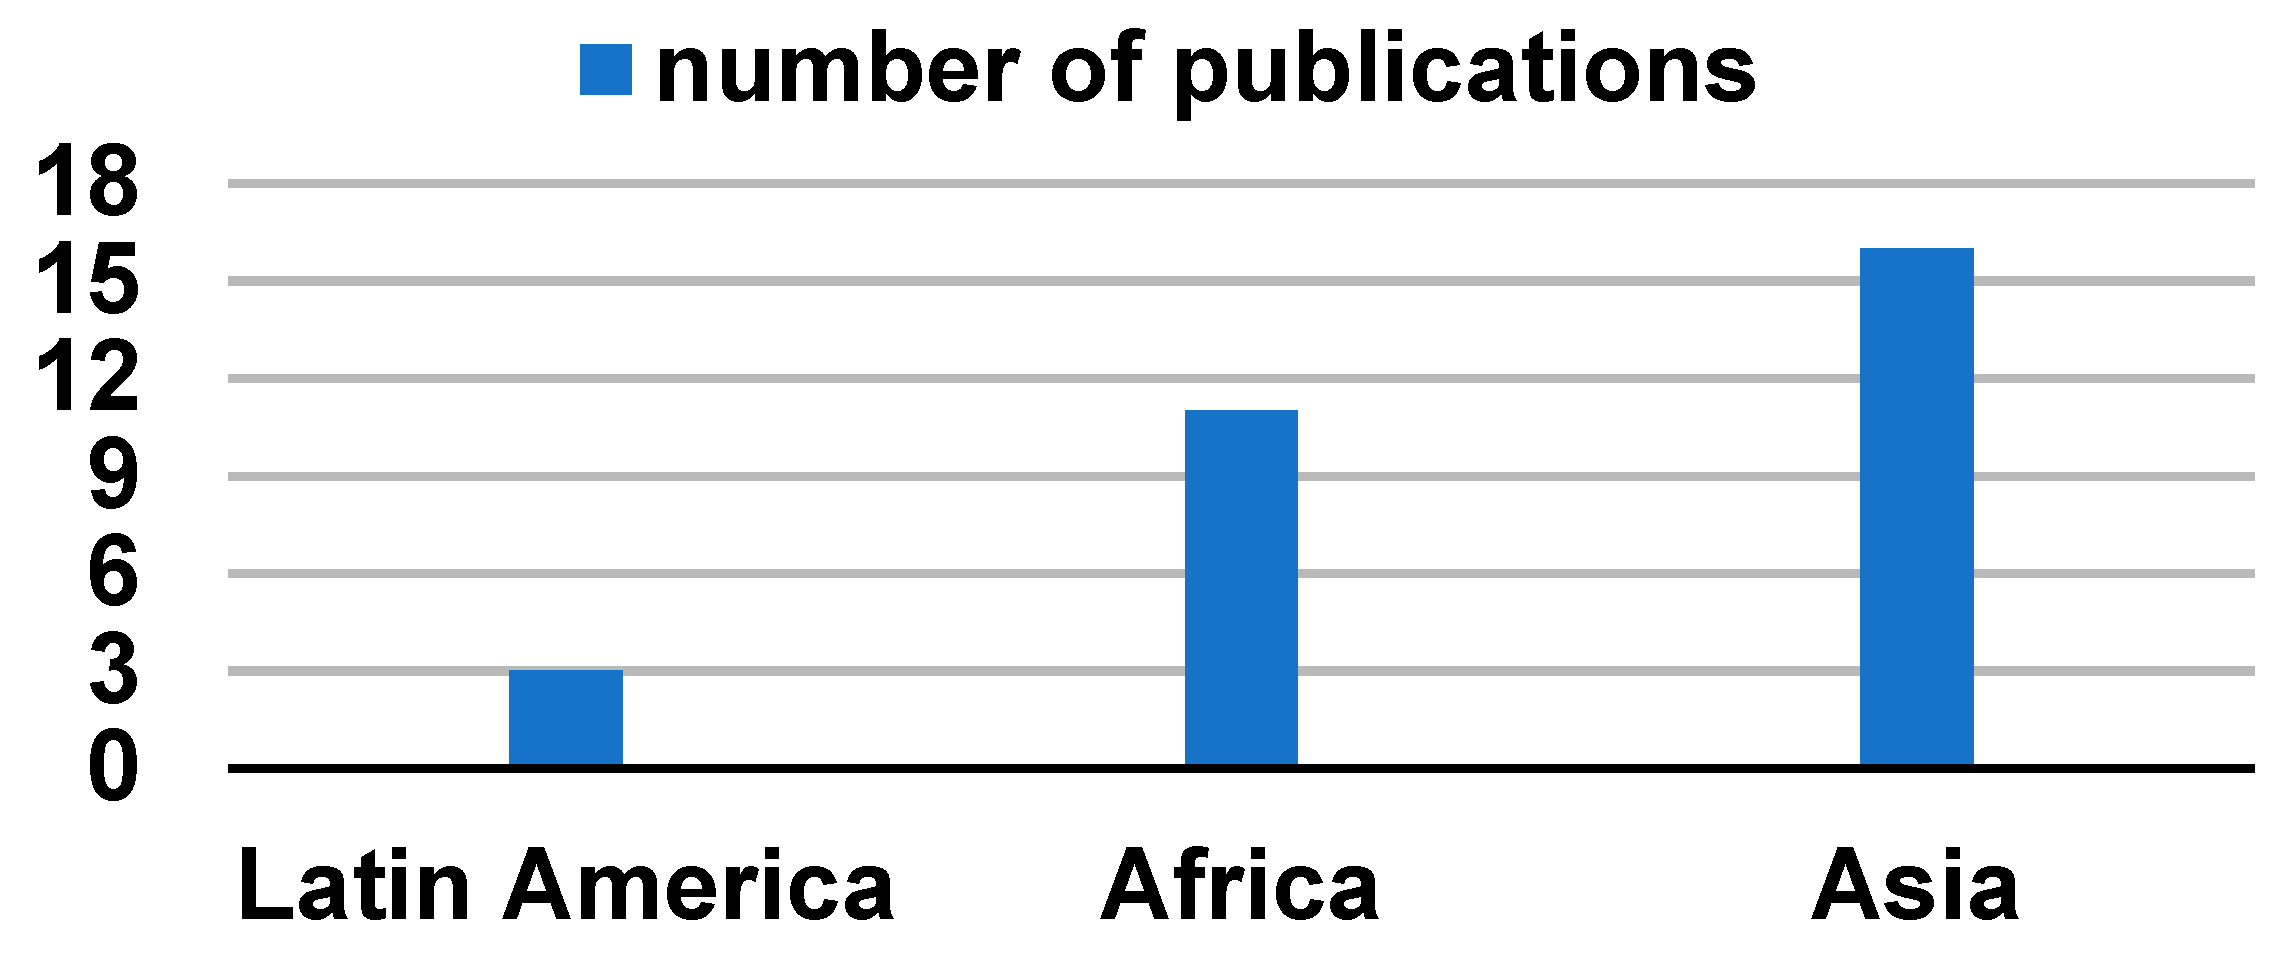
The summary of the literature review is provided in Appendix A. It shows that, during the last 10 years, the number of publications, matching the scope, keywords, and exclusion-criteria of this literature review, has grown towards 5–10 per year. Forty percent (19) of all selected publications can be characterized as reviews, cross-sectionally aggregating study results. These publications relate to one specific aspect or to regional or global benchmarking studies. Sixty percent (28 publications) cover a specific country or city. Thirty publications cover aspects in specific cities, countries, and continents. Most of these pertain to Asia (16) and Africa (11), as presented in Scheme 1. Only 3 publications relate to Latin America, whereas no relevant publications cover (middle-income) countries in Eastern Europe. These numbers may adequately reflect these continents developmental status and size. Publications for Asia were mostly on India (5), and for Africa, the interest was most on Kenya (3). Both continents show a similar variety in research subjects.
Only 5 references comprised books, reports, and dissertations. The other 42 publications were found in scientific journals of which 15 were in “Waste Management” and 4 in “Waste Management and Research”. The remaining 23 were found in 17 other journals.
Appendix A also summarizes the categorization as described in the analytical framework. Texts in Appendix A, that are written in red, refer to claims that are not substantiated by (empirical) evidence. Numerically, the results of this analysis are presented in Scheme 2.
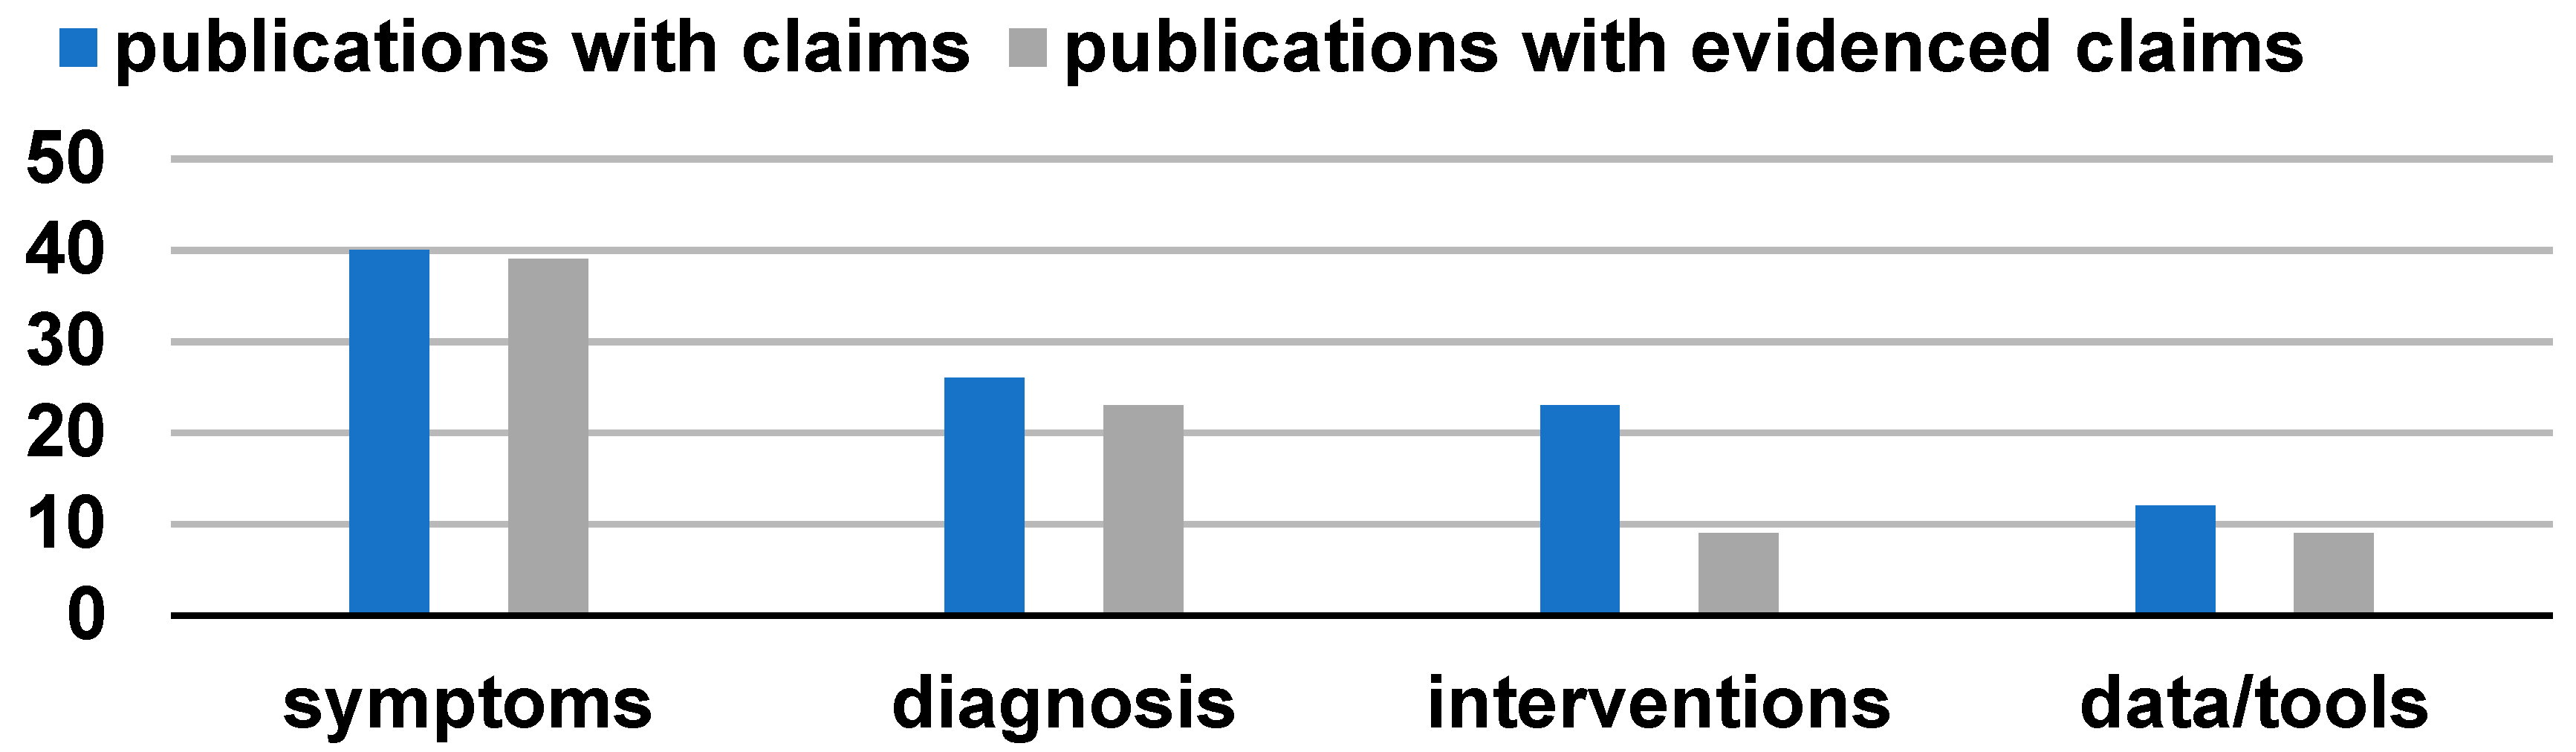
The result seems to indicate that most research in this field focuses on symptoms, rather than on making a diagnosis and finding the right interventions. This holds even more when non-evidenced claims are left out. With 39 documents having substantiated claims on symptoms, 23 documents having them on diagnosis and 9 documents producing them on interventions, the question arises why researchers dwell so much on effects, while less on causes and least on remedies. Possible explanations will be dealt with under Discussion.
3.2. Symptoms
The 39 publications with substantiated claims on symptoms are in many regards in unison; the SWM situation in most developing world cities is grave. These claims are underpinned by scores of case studies and public data.
Waste problems are strongly related to the amount of generated waste. Every person produces waste, and even more when incomes rise. Population growth in cities is high and sometimes an annual 8% is reported, as in the case of Kathmandu [16]. Data on per capita waste generation (WG) tend to vary strongly, especially for developing countries where the availability of well-defined and trusted data is poor. WG data ranging from 0.25 to 1.0 kg per capita per day can be found. A broad consensus seems to be available with regard to the relation between WG and income levels, expressed in GDP (gross domestic product), GNI (gross national income), or HDI (Human Development Index). Xu et al. use path analysis to show that these may be correlated but not based on causality [43]. Education level and family size seem to be the most important independent variables. Nonetheless, economic growth (EG) is a firm indicator of growth in WG [2].
Serving city-populations with adequate collection services is difficult (Appendix A). The percentage of un-serviced households in low- and middle-income countries, as reported in the reviewed publications, shows a very broad range of 5%–88%. Kaza et al. report that this percentage goes down when countries and cities develop [2], whereas other researchers report increasing percentages of un-serviced households for Nairobi and Dar es Salaam [44,45].
When being collected, the next challenge is to dispose it off in an environmentally sound manner. This seems to be an even tougher job as most of the reported percentages of unmanaged disposal of waste, via littering, burning, and dumping (albeit in designated dumpsites) range between 60% and 100% (Appendix A).
The effects are worrying. Uncollected waste adds to an overall poor sanitation in many cities [46]. Estimates show that about 20% of all waste is directly littered in the streets [16]. In Kathmandu, 3% of waste is being burned inside urban areas [47] and a high percentage of collected waste is being dumped elsewhere inside the city. Haregu et al. report that 50% of the households in Mombasa routinely burn their waste [44]. Litter leads to blockage of drainage and choking of sewerage causing sewage water to flood the streets [1,2,10]. The impact on health and safety is most severe with children, women, waste-workers and, in general, the poorest inhabitants being the ones harmed most [1]. Secondary effects are the emission of greenhouse gases [2], the runoff of waste with rainwater to rivers and estuaries causing marine plastic littering [12], the invitation to patronage, corruption, and crime [48], and the loss of overall urban attractiveness leading to low interest of investors and tourists [1].
Wilson et al. show in their report that the overall cost of not-managing waste (also referred to as “cost of inaction”, mostly relating to health-related costs) may be well over 5–10 times the costs of proper SWM operations [1]. Nevertheless, CDCs seem to be struggling for finding sufficient budgets as evidenced by many reports on lacking finances. Kaza et al. show that municipalities in low-income and middle-income countries spend 19% and 11% respectively of their budget on SWM, whereas cities in high-income countries spend an average of 4% [2]. Data on cost recovery through SWM-fees charged on individual households are few [2]. Most of the money is supplied by the general municipal and national budgets. Kaza et al.’s review also indicates that lack of finance seems to be almost twinned with lack of governance.
The complexity often seems to be overwhelming both for political as for civic leaders [3,19,49]. In response to this convolution, the paths of decentralization and privatization are often followed, but not always with success [44,50,51,52,53].
Lack of infrastructure is depicted as a negative symptom in several ways. Firstly, because urban sprawl and informal settlements lead to town-quarters, inaccessible to collection vehicles, secondly because of overall poor road and traffic conditions [54,55,56], and thirdly because of the near absence of essential SWM-infrastructure such as waste transfer-stations [2,57,58].
The informal sector is highly involved in waste management in developing countries. Haregu et al. report 2000 informal workers in Nairobi [44], Kafeel estimates 100,000 for Delhi [59], and India as a whole shows a workforce of some 1.7 million urban poor in this sector [53]. Their role is frequently appreciated for its prevention of public spending on waste collection and treatment [1,17,60], although this role also has its downsides on, for example, improper waste handling, working circumstances, and child labor, as reported by [18,61]. Kazuva et al. observe that informal sector players are only interested in collection and recycling as long as high market prices are available [45]. This affects the continuity of their services.
Similar to the way the role of the informal sector is presented as both positive and negative, it is also done for other aspects of solid waste and SWM. These aspects are population growth (as it also provides a good labor market) and the organic contents of the waste (as it is both the source of infectious diseases as a potential source of compost production) [58,62].
Many of the publications, listed under “symptoms” in Appendix A, claim or suggest that lack of money, knowledge, experience, awareness, coordination, policies, governance, infrastructure, and equipment are the cause of failing SWM. Nevertheless, within the analytical framework of this review, these explanations should be categorized as symptoms, on the output side of the relations model in Figure 1, because they are the result of other, underlying causes.
3.3. Diagnosis
The 23 publications that dig deeper are able to reveal some of the underlying causes, although the researchers themselves do not claim to have reached the root. Also, their work is mostly limited to one or few aspects. Only Guerrero et al. have tried to pinpoint the relative importance of multiple aspects affecting the quality and efficiency of SWM systems by using a combination of case studies and interviews [57]. Political leaders’ commitment and infrastructure quality are the prevailing aspects; more than, for example, the legal framework and policies or the availability of local service providers.
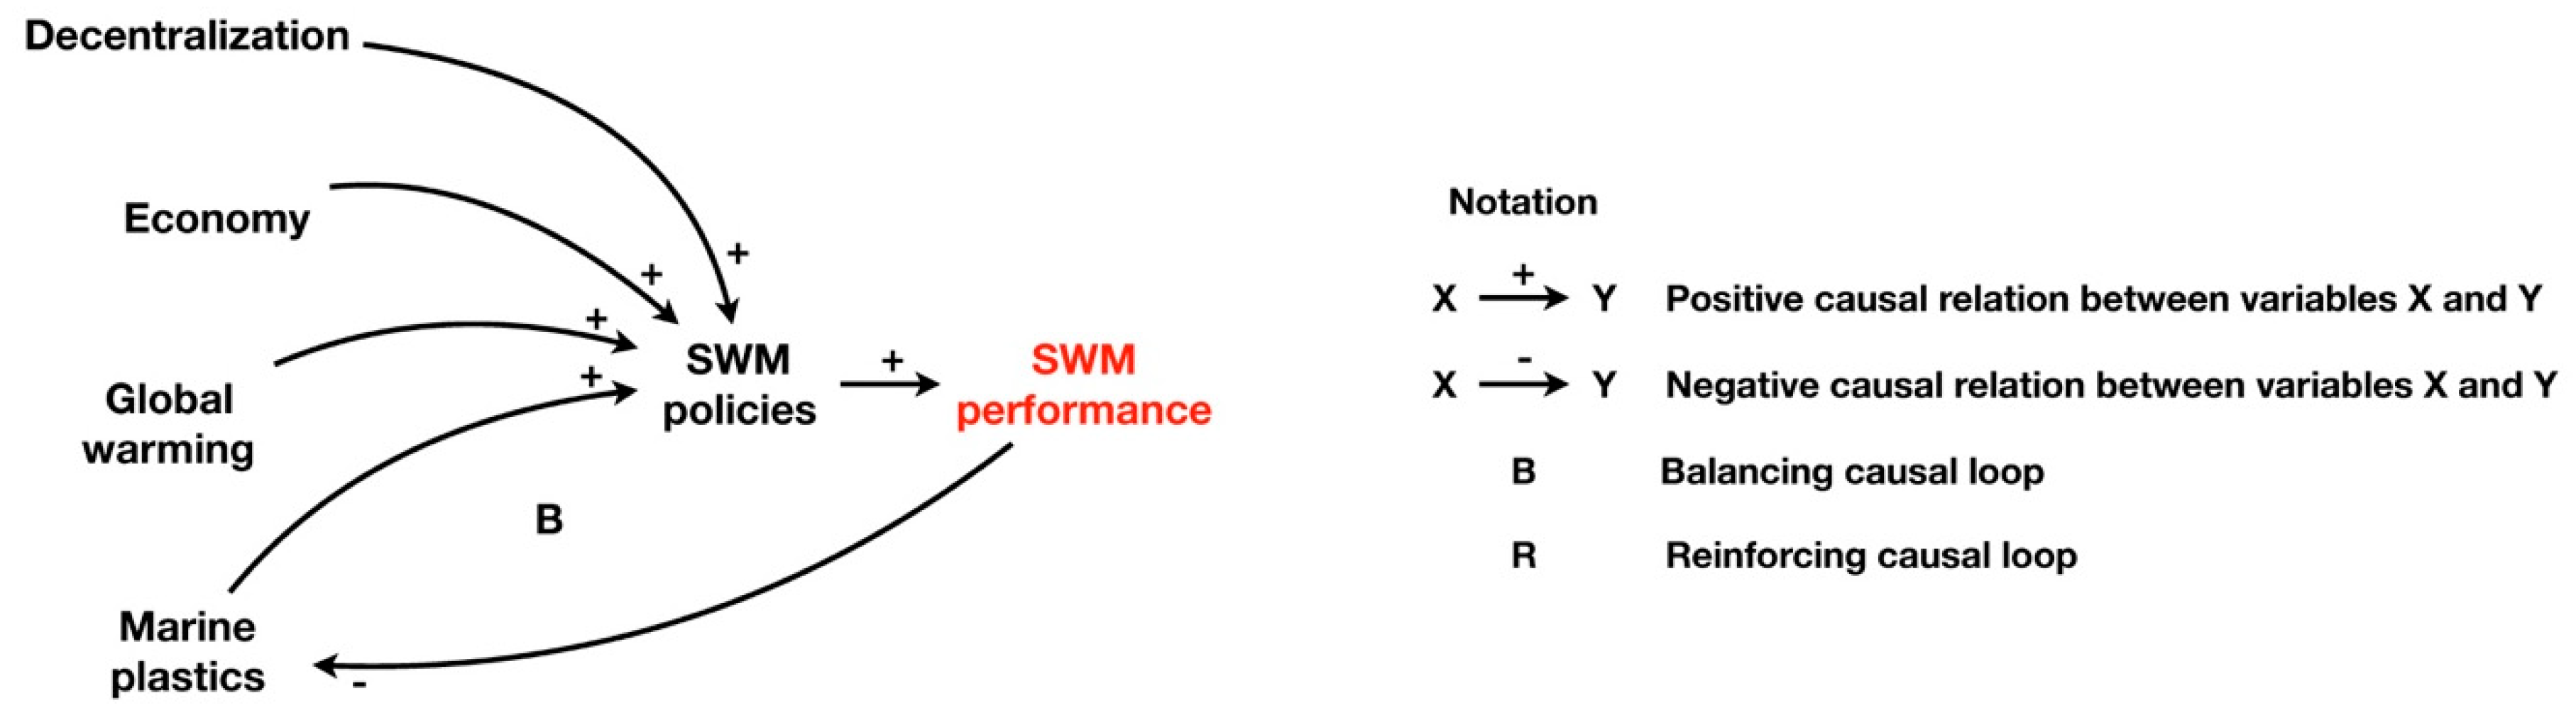
External variables (on the input side of the model in Figure 1) like the economy, international environmental policies, and the introduction of decentralization, receive little attention in diagnostic studies. Of course, the relation with GHG emissions is often referred to [1,2,58]. In causal terms, this last relation mostly works just in one direction as global warming is only for a small percentage influenced by failing SWM. Also, the relation between SWM and marine plastics is often mentioned. This causal relation is stronger and works reciprocal, as shown quantitatively by Lebreton et al. [12].
These external variables may affect both directly and indirectly (via governance) urban processes, for example, through their effect on the contents and implementation of SWM policies. In that case, these relations may be plotted in a causal loop as presented in Figure 3.
All other publications relate to governance and processes as presented in the “processes” part in the model of Figure 1.
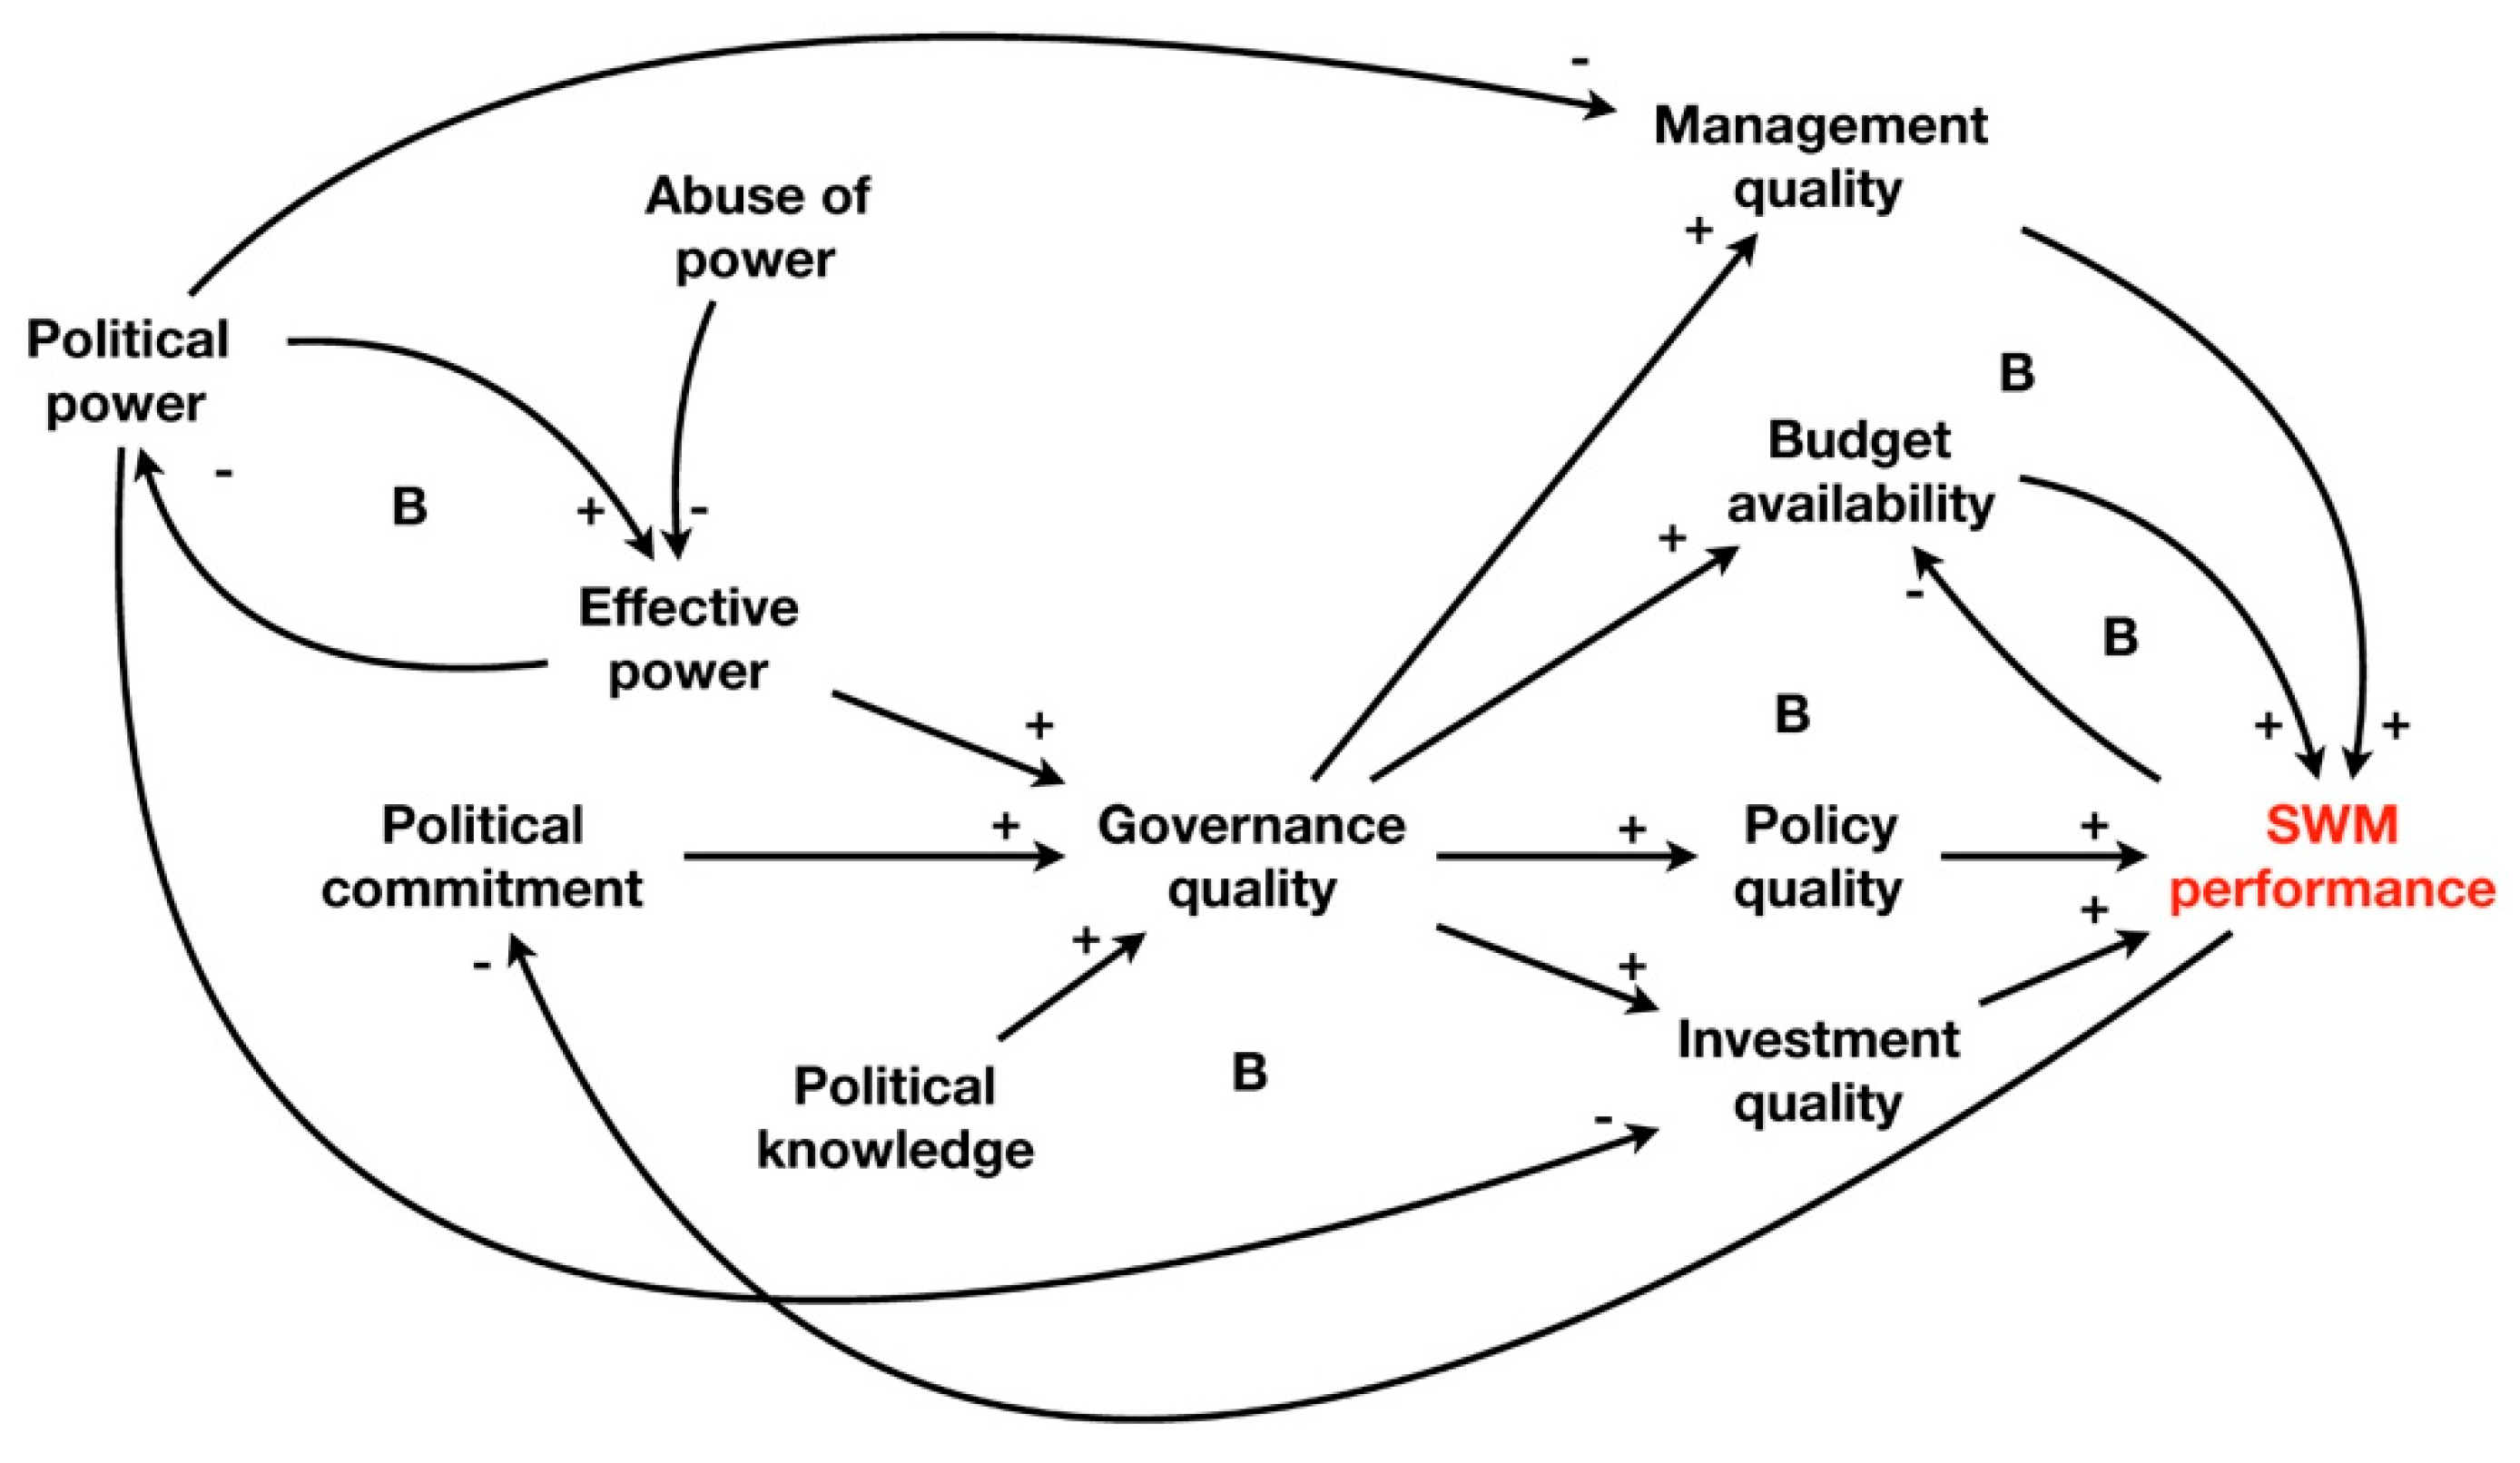
Governance and political processes were investigated in a number of studies. Using Matland’s ambiguity/conflict model, Yang et al. conclude that the governance of SWM can be categorized as “symbolic implementation” indicating the occurrence of conflicting interests along with vagueness on aims and means [63]. Under these circumstances, governance has to provide clear frameworks and has to showcase effectiveness. Kaza et al. confirm the need for strong governance and sustainable finances and typify them as crucial and necessary conditions [2]. Also, Nidugala et al. show how a combination of strong political and organizational commitment, rigid change management, and extensive communication campaigns were able to turn Indore into one of the most successful SWM cities in India [64]. Strength of governance should not be equated with autocracy. According to Nzalalemba et al., autocracies often lead to top–down decisions, to neglect of interests of the urban poor in SWM-decisions and to tendencies to introduce western SWM-systems that propagate social injustice [3]. Bjerkli revealed how abuse of power may bread nepotism and disrupt needed development of urban SWM-knowledge and experience through political appointments of staff [48]. On the opposite side, Kazuva et al. argue that government responses to SWM challenges are often too weak and inadequate and, in this neglect, may worsen the situation over a longer period of time [45]. Cetrulo et al. claim that political interference in operational and judicial issues, tend to be detrimental, as not always SWM interests are served [52]. They also argue that, having policies is good, but not sufficient. If not combined with budgets and adequate training, the issuing of policies is senseless. All aspects considering, the authors derive the causal loop diagram given in Figure 4.
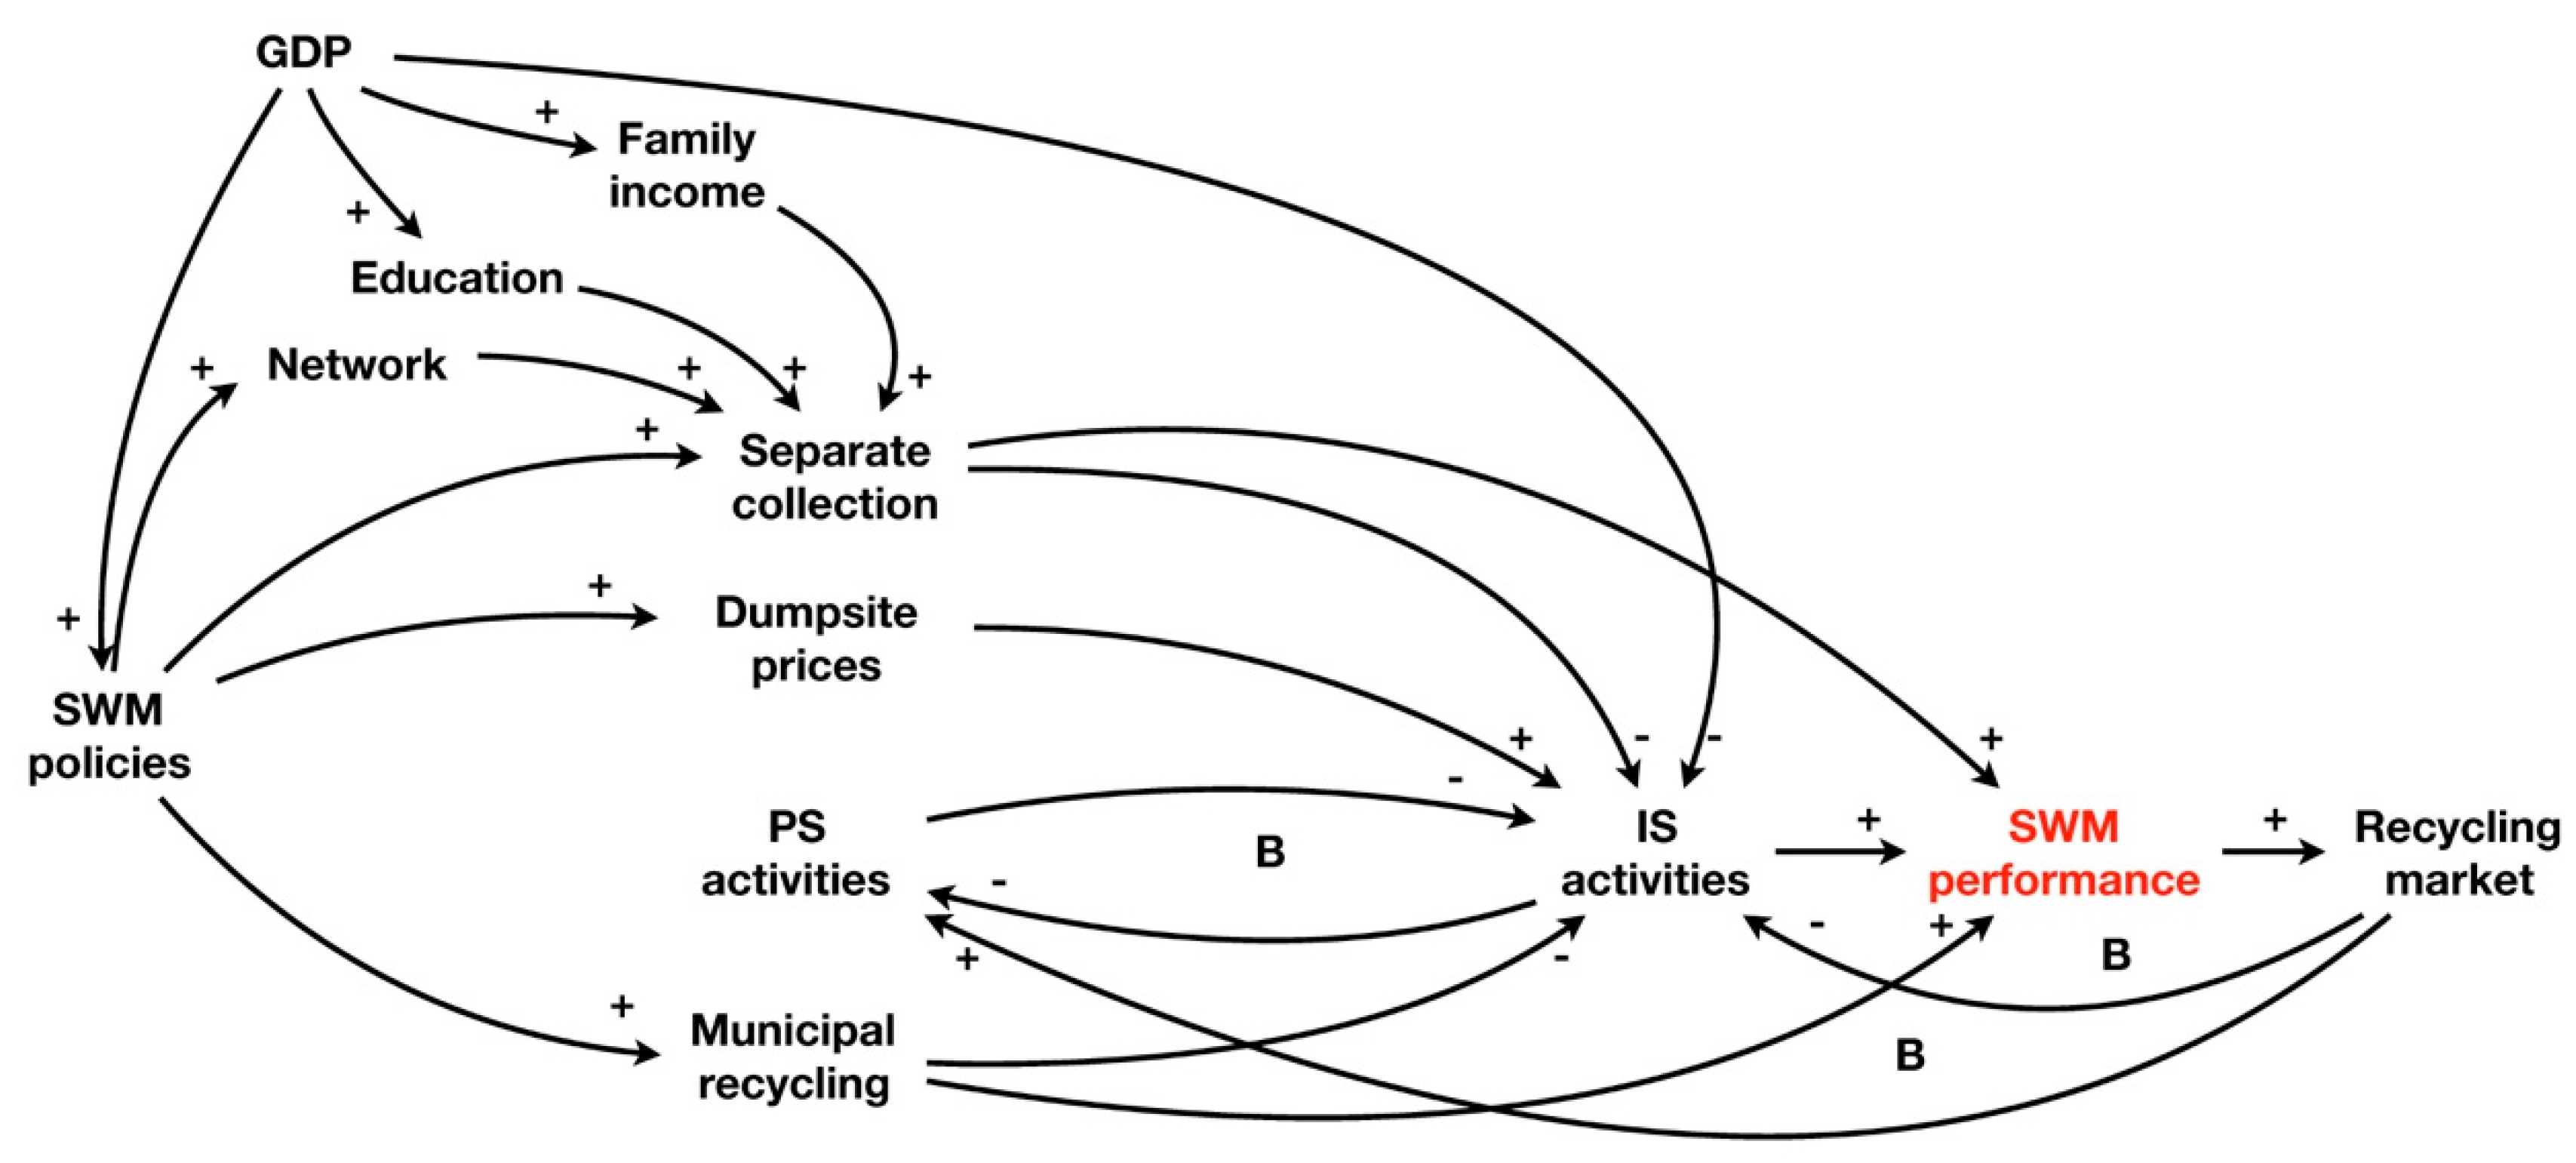
Social and economic processes in this field, tend to focus mostly on the role of the private sector and informal sector. Scheinberg highlights the important role of the informal sector [17]. The author infers that unfairly low dumpsite tariffs, the startup of municipal recycling activities, and the introduction of Western SWM-concepts impede or even threaten this role. Sandhu et al. come to a similar conclusion for the situation in Amritsar (India) [53], and Haregu et al. conclude that the operation of separate waste collection challenges informal recycling activities [44]. According to the literature review of Ma et al., the same holds for privatization of public services through public–private partnerships [18].
Chauhan et al. use structural modeling to conclude that the success of the recycling industry is mainly limited by availability of labor force, availability of capital, high investments, and high transport costs [65]. The availability of input material, low quality of products, competition, landfilling costs, and red tape are less important. These factors seem to favor the private sector over informal sector when cities’ economies develop. And in general, it may explain the higher recycling rates in low-income countries when comparing them to middle-income countries [1]. Developing economies seem to lower the chances of the informal sector, leading first to a decrease in recycling rates, later followed by an increase when municipal recycling and private companies (often formalized, former informal sector players) take over.
Ma et al. reviewed the way participation in collection and recycling is enhanced by providing a dense and convenient network of services. Also, higher income and education raises willingness to pay and participate [18].
The following causal diagram in Figure 5 provides an attempt by the authors to describe these relations.
Operational and financial processes are analyzed by Kinobe et al., using interviews in a case study on Kampala [55,56]. According to their findings, inadequacies such as the needed removal of illegal dumping and the manual loading of waste into trucks deteriorate the efficient deployment of collection vehicles. They also show how limited budgets lead to investments in too small trucks and how lack of knowledge leads to improper routing of collection trucks. This “nesting” of multiple inefficiencies eventually leads to a vicious circle, destroying available budgets.
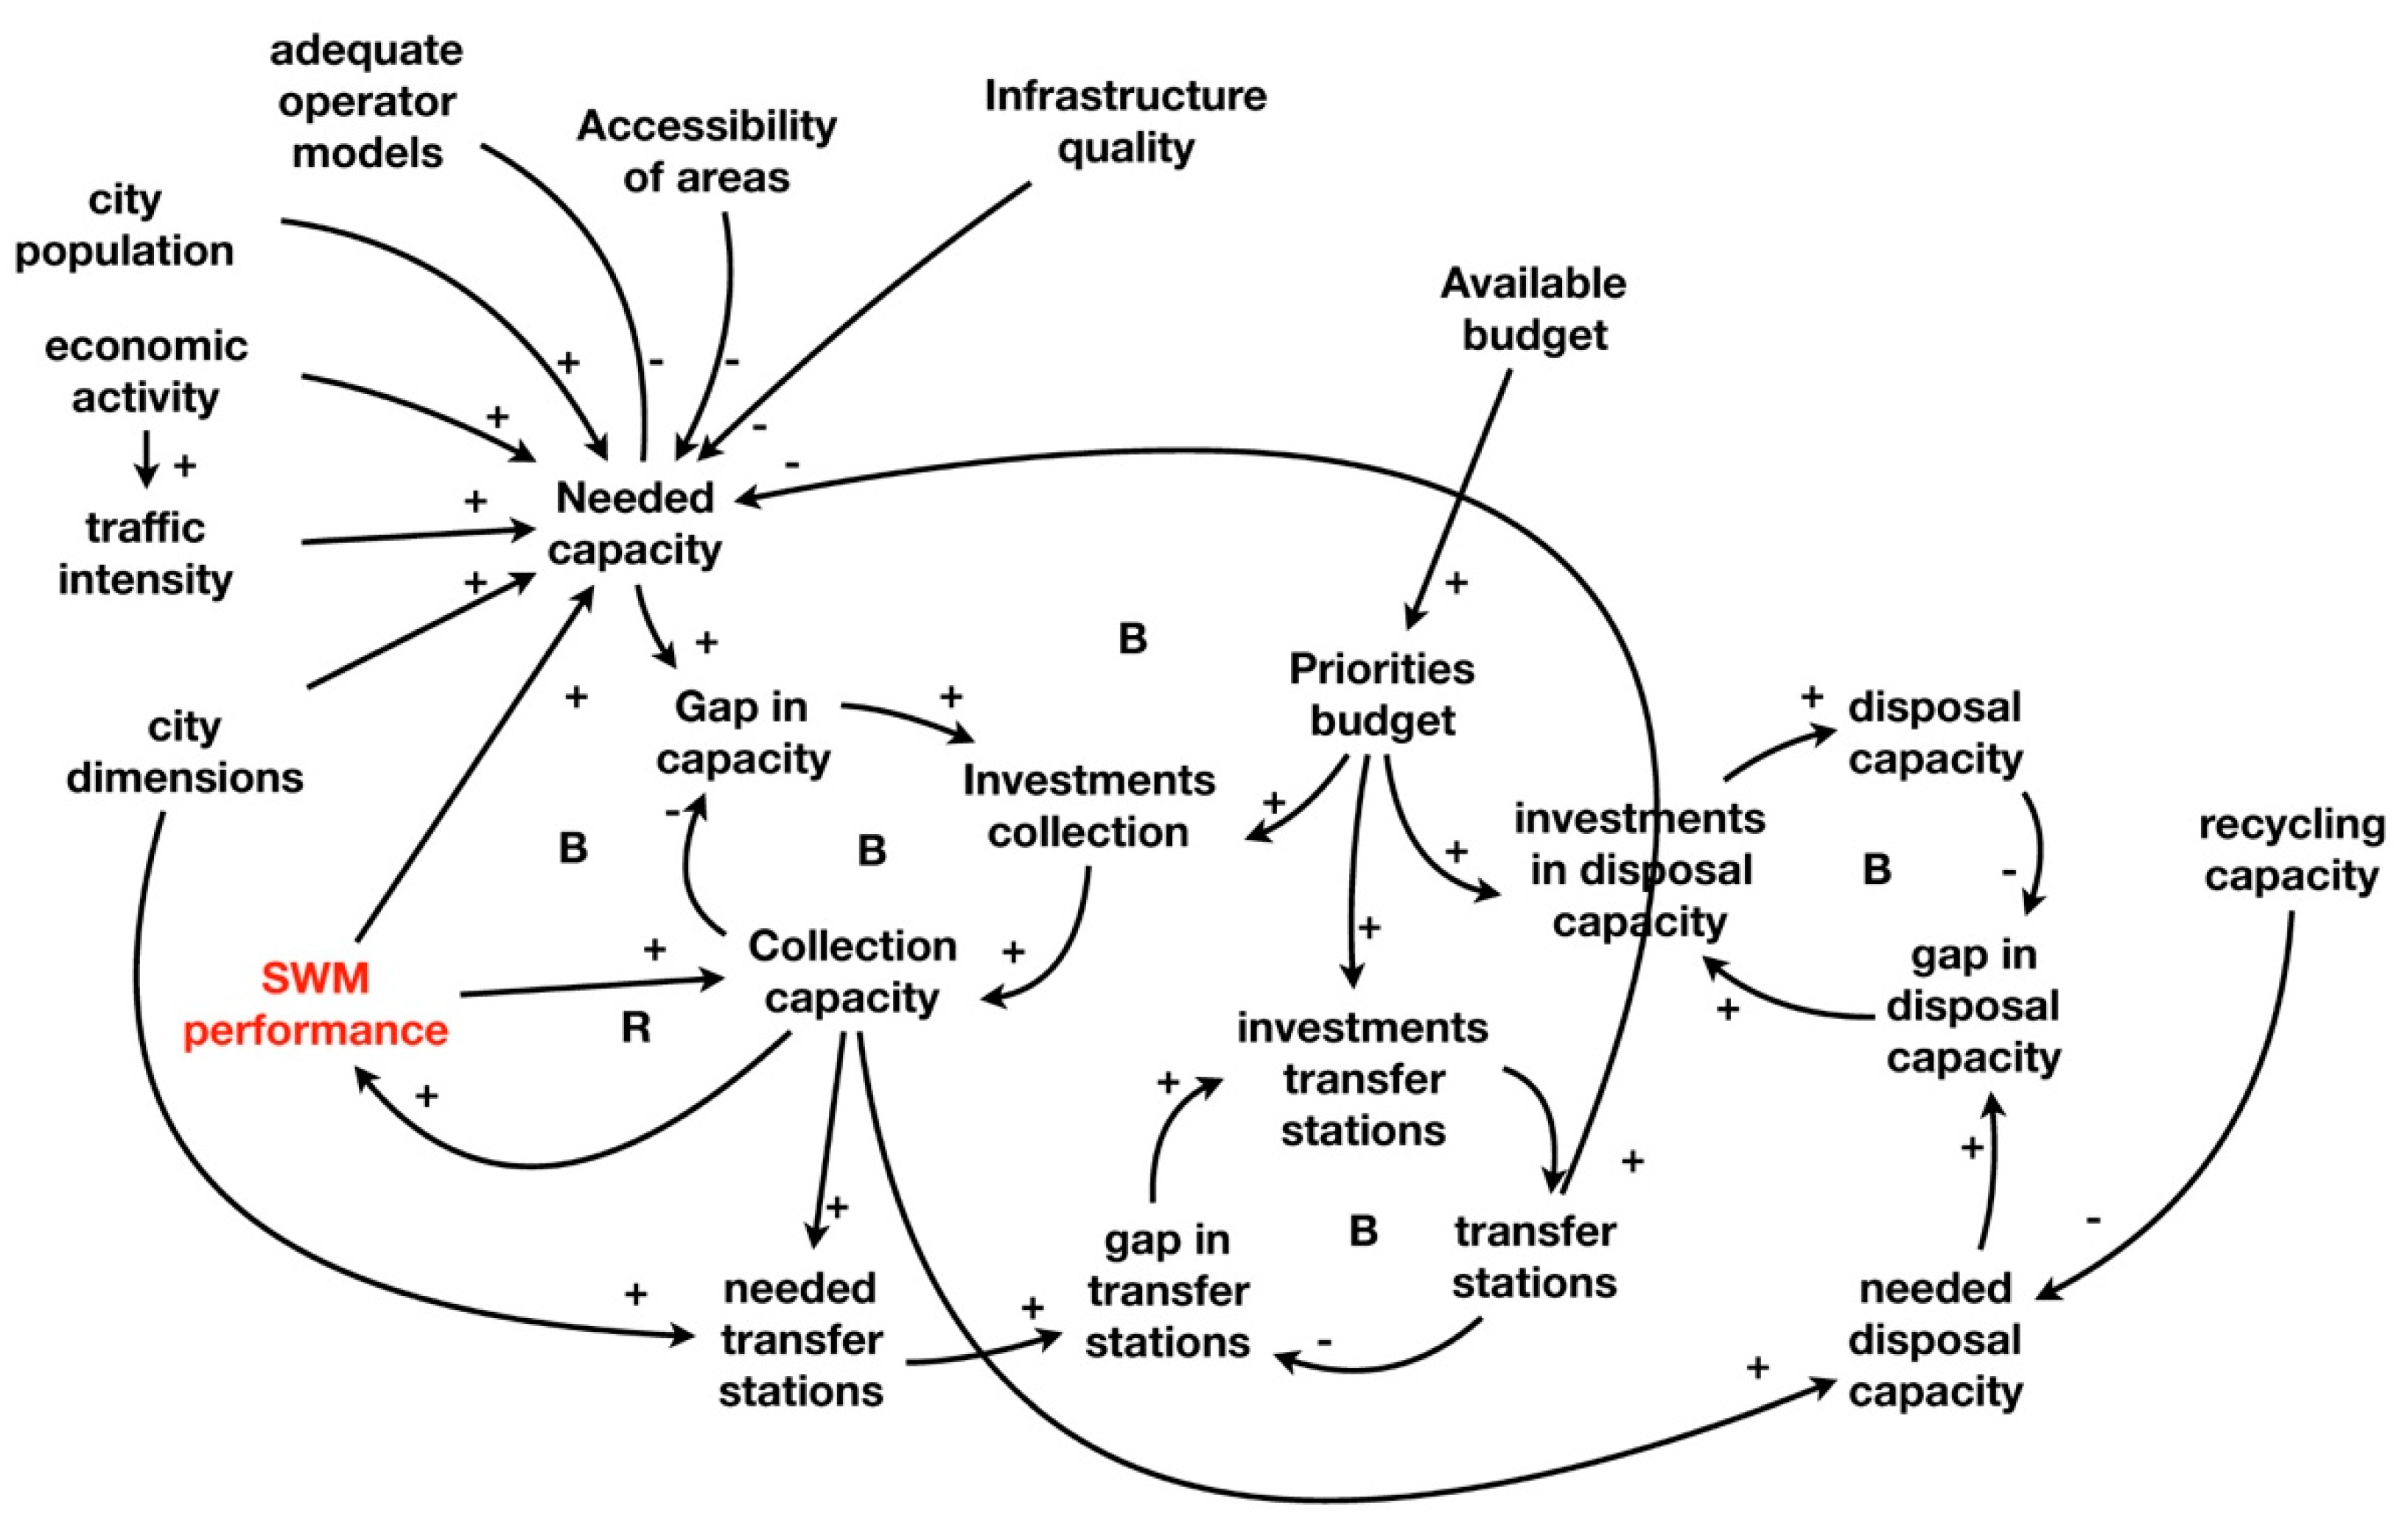
Aleluia et al. mention the absence transfer stations as being one of the major causes for high collection costs [58]. Other authors observed this same absence [2,25]. Aleluia et al. also underline the missed opportunity in many Asian cities by not using the high organic contents of waste for recycling [58]. Wilson et al. analyze that operating single operator models (for example, only public or only private collectors) are in general not capable of reaching the poorer parts of towns [66]. Da Silva shares this conclusion and does so based on system dynamics modeling of business-as-usual scenarios for Curitiba (Brazil) [67]. The continuation and expansion of regular collection and disposal, lead to strong increases in overall costs and needed investments in landfills. He further concludes that fluctuating market prices for recycling products limit the success of recycling options. Sufian et al. used system dynamics modeling for the city of Dhaka [68]. They analyzed the (negative) way insufficient and delayed municipal budget allocation affects the ability to collect the growing amount of waste and how collection and treatment compete for available budgets. Kafeel used system dynamics modeling to analyze the financial interaction of growing waste volumes with the introduction of recycling facilities in Delhi, to conclude that these facilities are able to generate sufficient revenues for their operations [59]. For Bangkok, Sukholthaman used system dynamics modeling to infer that policies on separate collection may well be able to drastically reduce the need for new landfills and will lead to a reduction of overall spending [69].
Merging these results into one causal diagram may lead to the set up presented in Figure 6.
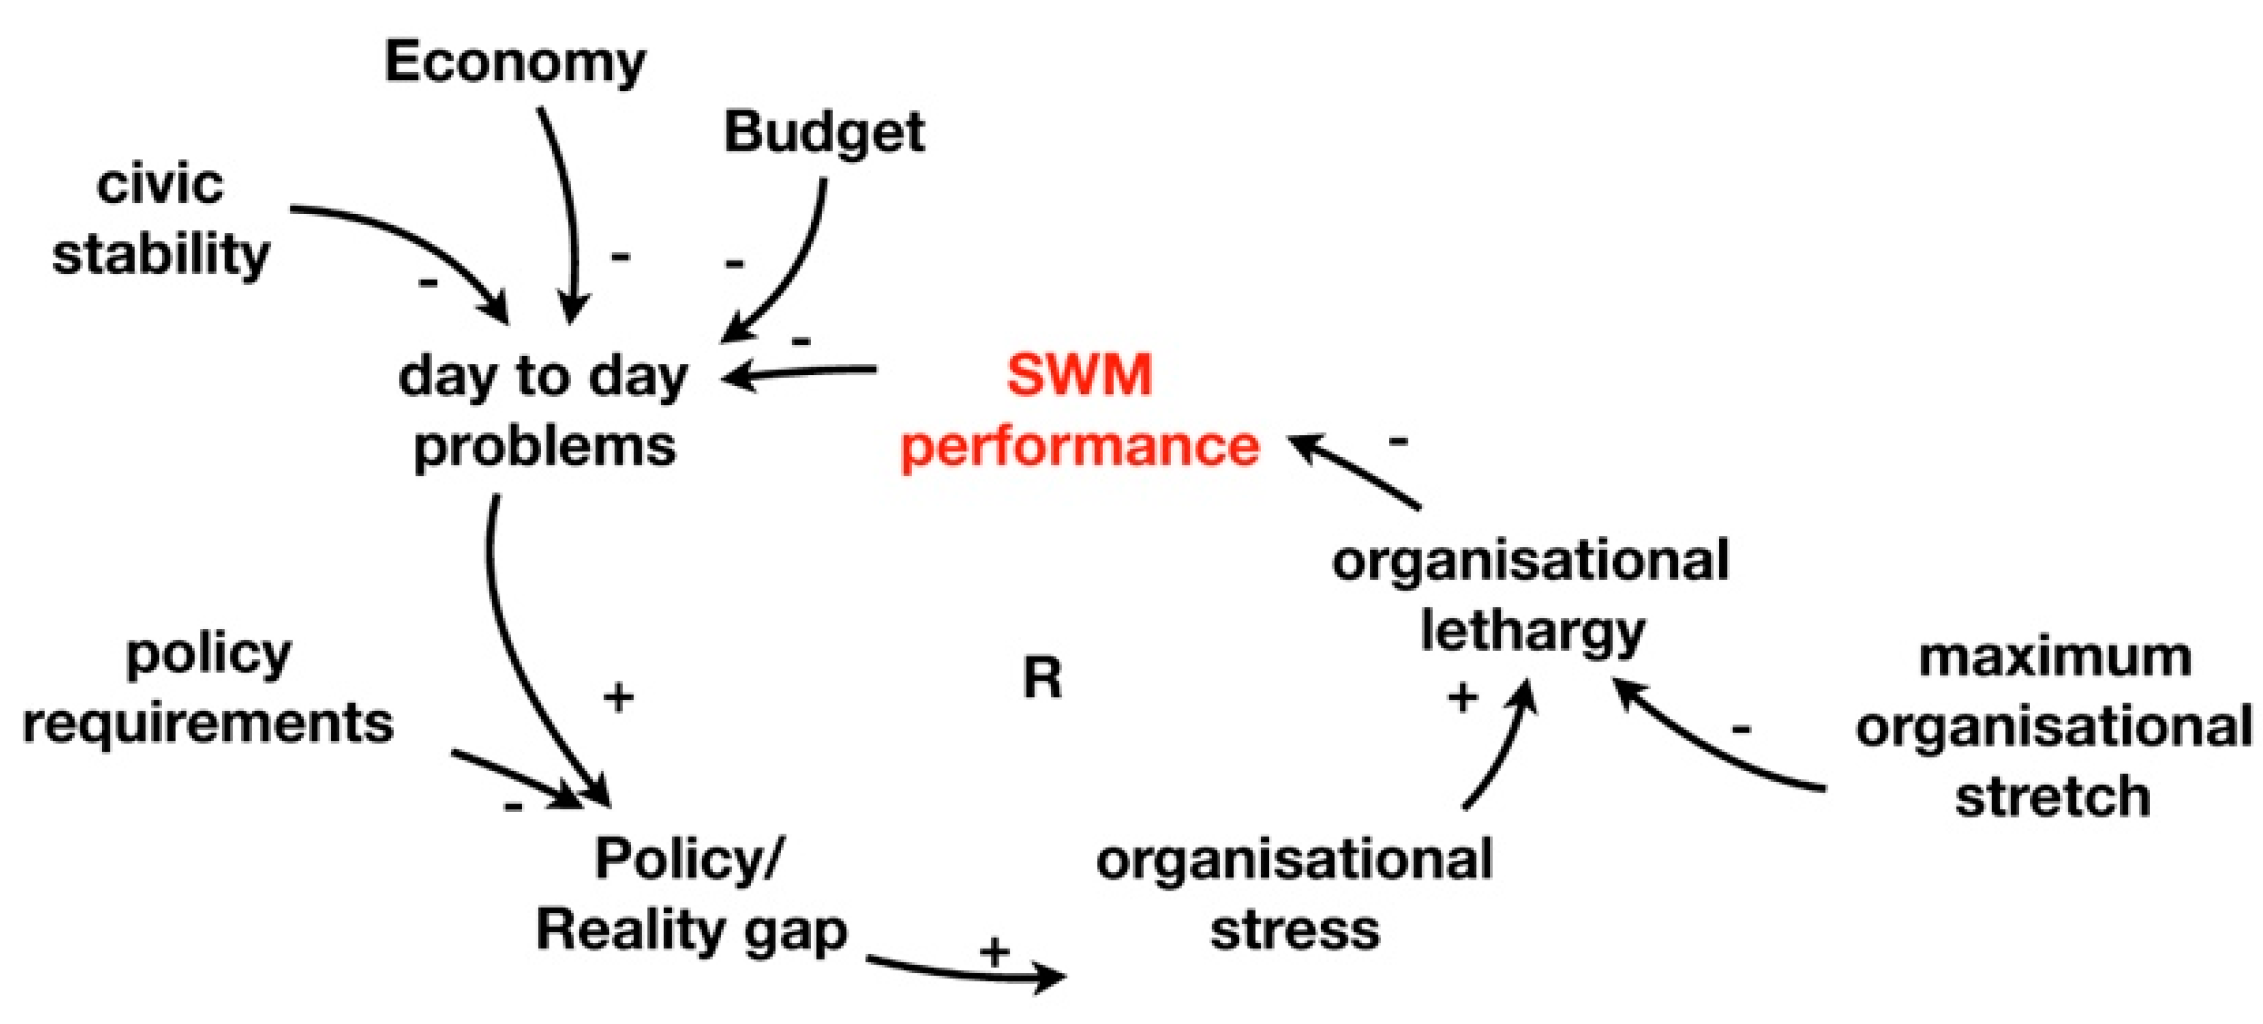
Nzalalemba et al. bring an organizational/psychological aspect in play when narrating the immense task resting on the shoulders of municipal authorities, having to accomplish this task with little knowledge and under brutal circumstances as in the Congo. As an effect, authorities can be overwhelmed by this responsibility, leading them to lethargy and so causing further damage [3]. In causal terms, this may look like sketched in Figure 7.
3.4. Interventions
As stated before, interventions fall within the domain of governance in the model presented in Figure 1.
With regard to socio-economic interventions, Sandhu et al. and Scheinberg both propose to intervene by enhancing the informal sector and integrate their roles in overall urban SWM [17,53].
On the side of political, institutional, and legal interventions, Nzalalemba et al. table to implement a legally enforceable right on clean living circumstances in order to provide equitable access to city cleaning and waste collection [3]. Nidugala et al. claim that a combination of a firm strategy and strong political and operational leadership will work [64]. Yang et al. claim that symbolic implementation of policies calls for economic incentives, display of governance effectiveness, and the promotion of social acceptance and social control [63].
Suggested interventions relating to finance and operations relate to the implementation of treatment options [59,67], awareness, and separate collection [69] in order to achieve sustainable budgets. Wilson et al. encourage to use mixed operator models in order to be able to service also the shanty parts of towns [66]. In addition, they call for strong client organizations within the authorities in order to manage private service operators.
3.5. Data/Tools
The review of Kaza et al. provides the most comprehensive global dataset on SWM [2]. Aleluia et al. do so for Asian countries and cities and they propose a model to categorize them based on GDP and organic waste contents [58]. Aparcana reviews the different options to formalize informal sector players in urban SWM [61] and Kinobe et al. assess a number of collection models in developing countries [56].
Assessment methods are reviewed in a number of publications. Chang et al. reviewed 14 methods and concluded that systems engineering should be incorporated in these methods [26]. Marshall et al. reject fragmented assessment methods and call for more integration, for more emphasis on social aspects, and for the use of methods on complex adaptive systems [19]. Lohri et al. also reviewed 14 methods and postulate that there is a need for more dedicated methods that include the use of mass balances [50]. On the other side, there are Zurbrügg et al. who call for simpler methods that fit the low availability of data in developing countries [70]. The review by Allesch et al. also calls for simpler assessments which should, on the other hand, be more holistic [71].
Recent years have shown a substantial interest in a benchmark method called “Wasteaware”. This method, developed under endorsement of UN-Habitat, enables to score the performance of cities along a set of 12 indicators [1]. It has led to a substantial database of benchmarks for cities around the world. The indicators can be categorized as symptoms within the definition of this paper.
4. Discussion
Most of the reviewed publications relate to symptoms, located on the output-side of the scheme in Figure 1, and less to diagnosis and interventions. There is, of course, a logical explanation for this imbalance as diagnosis and interventions need to be preceded by research of symptoms. This notwithstanding, it looks like the academic field lacks the impetus to use the knowledge on symptoms for a deeper understanding of the causes of failing SWM services. It may be because research in this discipline lacks a clear distinction between symptoms and underlying causes, as pointed at the end of the “Symptoms” paragraph above. Another reason may be that diagnosing such a problem is deemed too complex. Hoornweg et al., Kaza et al., Marshall et al., Wilson et al., and Zurbrügg et al. [1,2,10,19,20] and some 15 other publications claim, or at least suggest, that this complexity can only be diagnosed through holistic approaches. Nevertheless, no such diagnostic approaches were found. A last possible reason could be that the most cited publications in this field are from renowned institutions as the World Bank [2,10], UN Habitat [11], and UNEP/ISWA (United Nations Environmental Programme and International Solid Waste Association) [1]. These documents have become the reference guides and entry points for many researchers. Their comprehensiveness, status, and the certitude of their claims may give the impression that all is known that needs to be known. References to these documents tend to parrot the arguments and may be the reason to stop further research.
Wasteaware has become a standard for benchmarking cities’ performances on SWM around the world. It is a valuable method to map symptoms but a number of authors (mis)use it as a method for diagnosis, simply by mirroring the defaults (for example: lack of money) into idle advises on interventions (same example: more money is needed). The other pitfall of Wasteaware may be that its specific choice of indicators is mainstreaming, not only the position on this matter among practitioners, but also in research. This may, for example, be the case for the importance that is given to the indicator “inclusivity” and the role of the informal sector. This could have invoked the considerable percentage of literature that deals with this aspect. On the other hand, achieving financial sustainability by generating stable revenues, is less pronounced in Wasteaware, and so we see in the literature. Diagnosis-research on the reasons for low availability of money is fully absent, although many publications on symptoms have called it one of the pivotal factors.
All diagnostic research taken together; one can state that it is far from being comprehensive. Literature on processes relating to street cleaning seem to be fully absent. And, as for finance, there is little to no attention for urban processes relating to variables such as traffic intensity, street quality, available knowledge and experience, public willingness to participate, workers’ salaries and motivations, prices for equipment and fuels, and access to financing facilities.
System dynamics modeling is used by 4 authors in their analyses. Most of them are only on financial/operational processes. Some publications reveal the existence of balancing feedbacks (as also represented in the causal loop diagrams). The inertia often referred to in governance concepts, is not covered in these publications. Inertia may indeed come from balancing feedbacks, but also from delays and slow processes. Only one reference to this effect was mentioned in relation to needed growth of public budgets [68], whereas one would expect it to play an important role in governance and many other processes.
Although there’s a strong appeal for holistic approaches, publications on diagnosis seem to go the reductionist path of analyzing well defined, single aspects. This holistic call and reductionist reality do not necessarily have to be contradictive. Reductionist research of isolated phenomena may well be the key to fill in a holistic framework and prevent it from rendering hollow. System dynamics modeling may have good cards, not only when it comes to describing a diversity of (urban) processes, but also when working on integrating different processes into a multidimensional framework. Morecroft shows its versatility in this regard [42].
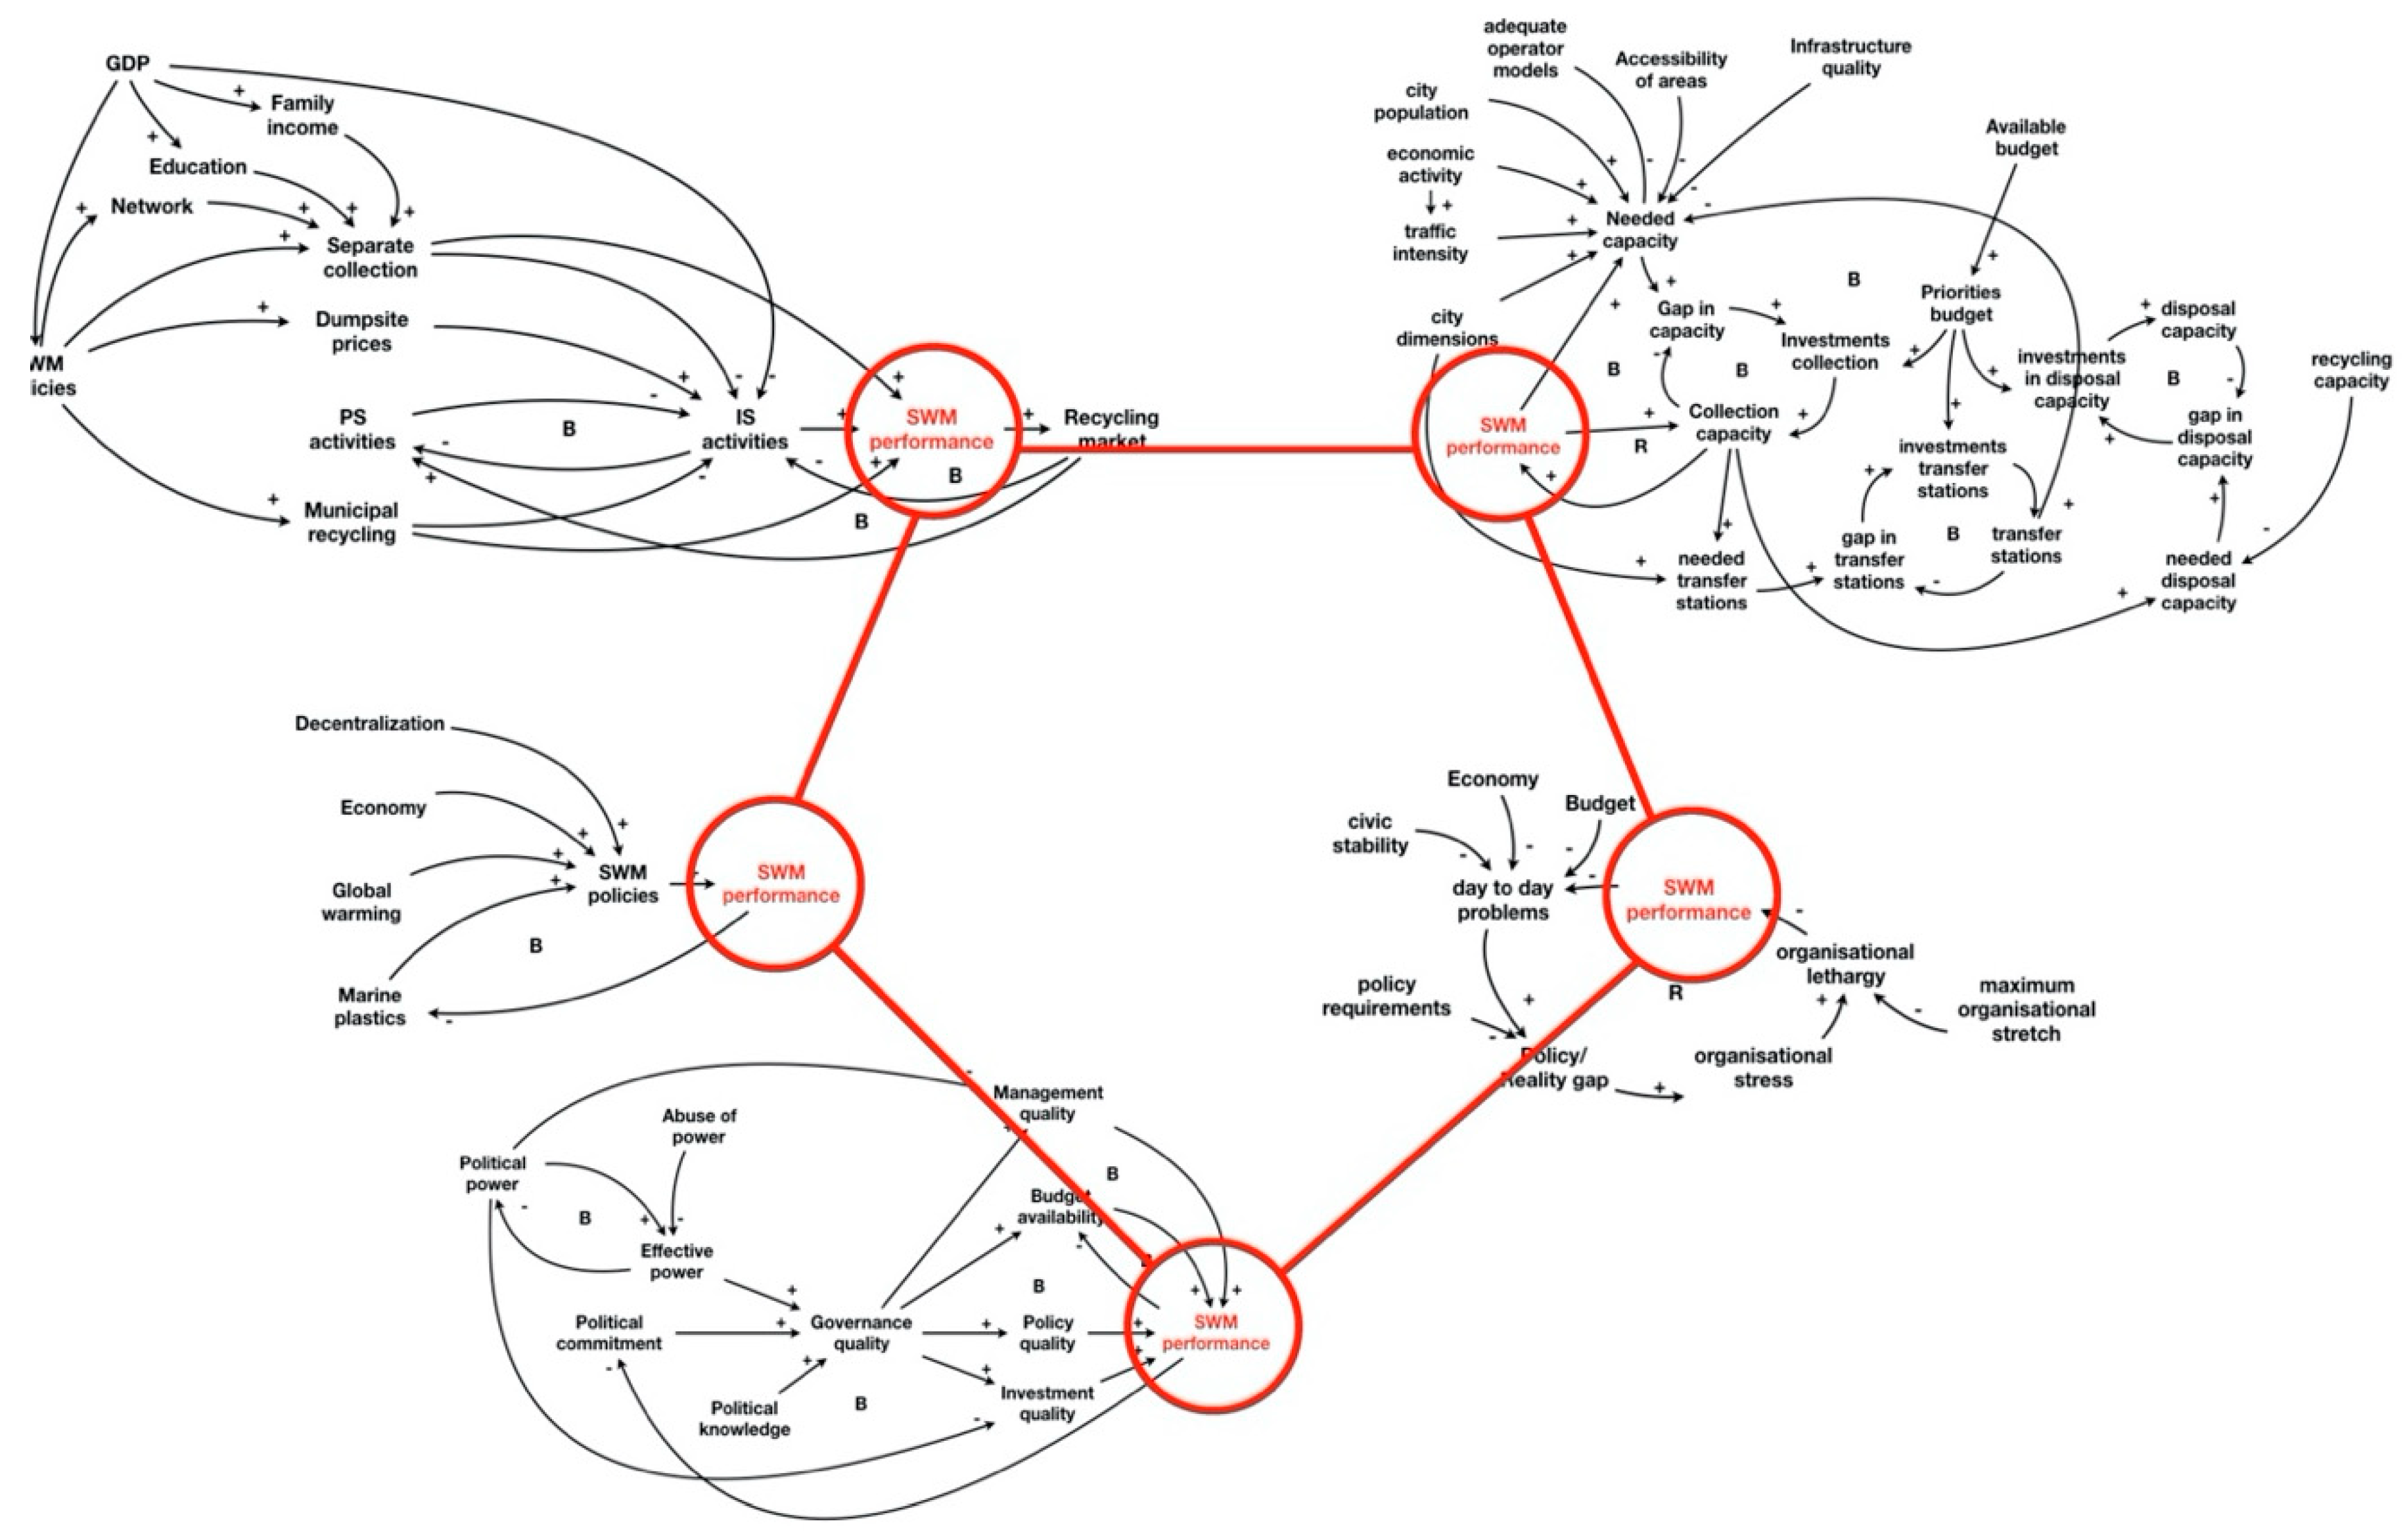
Integrating isolated CLDs into consolidated ones, can be done through the connection of variables, such as SWM performance, as illustrated in Figure 8 for the CLDs described above.
Drawing up causal loops, combining them in a network, and translating them into stock/flow-diagrams may well be the most usable method for further analyzing the field of urban SWM. The following three examples may illustrate this.
- Multiple authors observe that the absence of transfer stations leads to high collection costs [2,25,58]. The exact relation is not revealed but, obviously, when cities are growing in population, density, traffic, and scale, the time a collection vehicle needs to go from its collection-route towards the dumpsite and back increases exponentially. If transfer stations are available, the effect could be that one truck can do 3 or 4 routes per day instead of one, increasing the collection capacity with the same factor.
- Haregu et al. observed that the number of un-serviced households in Nairobi went down from 90% to 20% in the 1970s but, after this good result, it went up again towards 30% in 2010 and 35% in 2016 [44]. This effect may well be described by SDM, for example, by modeling the accelerating rates of urbanization, urban poverty, and economic growth. Their combined effect on waste growth, sprawl, and traffic may have been so strong that it could not be met by politicians, strategies, budgets, management, investments, and the slow processes they are working in. If, in such a case, the experience on, for example, coping strategies for logistical challenges is lacking, deterioration is accelerated.
- Also, the differences in recycling rates between low, middle, and high-income countries, as described by Wilson et al. [1], may be convincingly described by SDM as the result of the dwindling role of the IS when public authorities and private parties step up and the improving economy is drawing away workers from informal occupations.
5. Conclusions
Based on this literature review, we can conclude that more research is needed on diagnosing failing SWM services in CDCs in order to enable improved interventions. The research field needs more holistic approaches; able to cope with the complexity and dynamics of urban circumstances. There is, however, no sign of any developments in this direction. The way forward could lay in applying system dynamics modeling to describe relevant urban processes, relate them to urban governance and their effect on SWM performance, and merge these relations in one overarching model.
We presented a first framework for these relations. The further elaboration of this model needs the combined input of many researchers from different backgrounds. The challenge may be in finding the right tradeoff between complexity, data-availability, usability for further research, and simplicity, needed for its use as a tool in urban management.
Author Contributions
The review was performed and written by H.B. H.K. and A.L. contributed by guiding the review work, discussing ideas, and supervising the writing of this paper.
Funding
This research received no external funding.
Conflicts of Interest
The authors declare no conflict of interest.
Appendix A

Table A1.
Schematic analytical review.
| Ref. | Year | Geography | Symptoms | Diagnosis | Intervention | Data/Tools |
|---|---|---|---|---|---|---|
| [68] | 2007 | Dhaka (Bangladesh) |
|
| ||
| [46] | 2008 | Accra (Ghana) |
|
| ||
| [14] | 2009 | India, 59 cities. |
|
| ||
| [11] | 2010 | Global, 20 developed and developing cities |
|
| ||
| [16] | 2010 | Kathmandu (Nepal) |
| |||
| [17] | 2011 | Global, 20 developed and developing cities. |
|
|
| |
| [26] | 2011 | n.a. |
| |||
| [62] | 2012 | Abuja (Nigeria) |
|
| ||
| [24] | 2012 | Global, 20 developed and developing cities |
|
|
| |
| [70] | 2012 | Gianyar (Indonesia) |
|
|
| |
| [10] | 2012 | Global |
| |||
| [19] | 2013 | Global |
|
|
| |
| [57] | 2013 | 36 cities in developing countries |
|
|
| |
| [21] | 2014 | Global, 5 developed and developing cities |
| |||
| [43] | 2014 | Xiamen Island (China) |
| |||
| [20] | 2014 | Developing countries |
| |||
| [50] | 2014 | Bahir Dar (Ethiopia) |
|
|
| |
| [71] | 2014 | n.a. |
| |||
| [48] | 2015 | Addis Ababa (Ethiopia) |
|
| ||
| [15] | 2015 | 52 cities in India |
| |||
| [56] | 2015 | Kampala (Uganda) |
|
|
| |
| [55] | 2015 | Kampala (Uganda) |
|
| ||
| [51] | 2015 | Makassar (Indonesia) |
|
| ||
| [72] | 2015 | Global |
| |||
| [1] | 2015 | Global |
|
|
| |
| [59] | 2015 | Delhi (India) |
|
|
| |
| [25] | 2015 | Latin-American and Asian countries and Baltic states |
|
| ||
| [18] | 2016 | Global |
|
| ||
| [3] | 2016 | Kinshasa (DR Congo) |
|
|
| |
| [58] | 2016 | Developing countries in Asia |
|
|
|
|
| [69] | 2016 | Bangkok (Thailand) |
|
|
| |
| [53] | 2017 | Amritsar (India) |
|
|
| |
| [44] | 2017 | Nairobi, Mombasa (Kenya) |
|
| ||
| [66] | 2017 | 28 CDCs |
|
|
| |
| [54] | 2017 | Kisumu (Kenya) |
|
| ||
| [64] | 2017 | Indore (India) |
|
| ||
| [61] | 2017 | 20 CDCs |
|
|
| |
| [2] | 2018 | Global |
|
|
| |
| [52] | 2018 | Brazil |
| |||
| [49] | 2018 | Botswana |
| |||
| [47] | 2018 | Kathmandu (Nepal) |
|
| ||
| [63] | 2018 | China |
|
| ||
| [67] | 2018 | Curitiba (Brazil) |
|
| ||
| [45] | 2018 | Dar es Salaam (Tanzania) |
|
|
| |
| [65] | 2018 | India |
| |||
| [60] | 2019 | Gujranwala (Pakistan) |
|
|
| |
| [12] | 2019 | Global |
|
|
SDM: system dynamics modeling ; PG: population growth per year; WG: per capita waste generation; USH: un-serviced households as % of population; UD: unmanaged disposal (open dumping); Kcd: kilogram waste/capita/day; (S)LR: (systematic) literature review; PDR: public data research; FI: field investigations; Q/I: questionnaires and interviews; SA: sample analyses; IS: informal sector; CS: case study; B/D/T: book/Dissertation/Thesis; BM: benchmarking; PFD: process flow diagram; SM: structural modeling ; PA: path analysis; WEEE: waste electrical and electronic equipment; BaU: business as usual; PS: private sector; PAYT: pay as you throw; n.a.: not applicable.
References
- Wilson, D.C.; Rodic, L.; Modak, P.; Soos, R.; Rogero, A.; Velis, C.; Lyer, M.; Simonett, O. Global Waste Management Outlook; UNEP: Nairobi, Kenya, 2015; ISBN 9789280734799. [Google Scholar]
- Kaza, S.; Yao, L.; Bhada-Tata, P.; Van Woerden, F. What a Waste 2.0, a Global Snapshot of Solid Waste Management to 2050; World Bank Group: Washington, DC, USA, 2018; ISBN 9781464813290. [Google Scholar]
- Kubanza, N.S. Danny Simatele Urban Environmental Problems: Social and Environmental Injustices in Solid Waste Management in Kinshasa, the Democratic Republic of Congo. Local Environ. 2016, 21, 866–882. [Google Scholar] [CrossRef]
- Cohen, B. Urbanization in developing countries: Current trends, future projections, and key challenges for sustainability. Technol. Soc. 2006, 28, 63–80. [Google Scholar] [CrossRef]
- Zhang, X.Q. The trends, promises and challenges of urbanisation in the world. Habitat Int. 2016, 54, 241–252. [Google Scholar] [CrossRef]
- Cobbinah, P.B.; Erdiaw-Kwasie, M.O.; Amoateng, P. Africa’s urbanisation: Implications for sustainable development. Cities 2015, 47, 62–72. [Google Scholar] [CrossRef]
- Bai, X.; Webb, R.; Elmqvist, T.; Toussaint, J.-P.; Siri, J.G.; Güneralp, B.; Stafford-Smith, M.; Surveyer, A.; Shrivastava, P.; Gatzweiler, F.W.; et al. Defining and advancing a systems approach for sustainable cities. Curr. Opin. Environ. Sustain. 2017, 23, 69–78. [Google Scholar]
- Rodić, L.; Wilson, D.C. Resolving governance issues to achieve priority sustainable development goals related to solid waste management in developing countries. Sustainability 2017, 9, 404. [Google Scholar] [CrossRef] [Green Version]
- Güneralp, B.; Seto, K.C. Environmental impacts of urban growth from an integrated dynamic perspective: A case study of Shenzhen, South China. Glob. Environ. Chang. 2008, 18, 720–735. [Google Scholar] [CrossRef]
- Hoornweg, D.; Bhada-Tata, P. What a Waste. A global Review of Solid Waste Management; World Bank Group: Washington, DC, USA, 2012. [Google Scholar]
- Un-Habitat. Solid Waste Management in the World’s Cities; Scheinberg, A., Ed.; Un-Habitat: Nairobi, Kenya, 2010; ISBN 9781849711692. [Google Scholar]
- Lebreton, L.; Andrady, A. Future scenarios of global plastic waste generation and disposal. Nature 2019, 5, 6. [Google Scholar] [CrossRef] [Green Version]
- Onibokun, A.G. Managing the Monster; International Development Research Center: Ottawa, ON, Canada, 1999; ISBN 0-88936-880-5. [Google Scholar]
- Kumar, S.; Bhattacharyya, J.K.; Vaidya, A.N.; Chakrabarti, T.; Devotta, S.; Akolkar, A.B. Assessment of the status of municipal solid waste management in metro cities, state capitals, class I cities, and class II towns in India: An insight. Waste Manag. 2009, 29, 883–895. [Google Scholar] [CrossRef]
- Gupta, N.; Yadav, K.K.; Kumar, V. A review on current status of municipal solid waste management in India. J. Environ. Sci. (China) 2015, 37, 206–217. [Google Scholar] [CrossRef]
- Urynowicz, M.A.; Reddy, J.M.; Pretz, C.R.; Gerow, K.G.; Dangi, M.B. Municipal solid waste generation in Kathmandu, Nepal. J. Environ. Manag. 2010, 92, 240–249. [Google Scholar]
- Scheinberg, A. Value Added: Modes of Sustainable Recycling in the Modernisation of Waste Management Systems. Ph.D. Thesis, Wageningen University, Wageningen, The Netherlands, 2011. [Google Scholar]
- Ma, J.; Hipel, K.W. Exploring social dimensions of municipal solid waste management around the globe—A systematic literature review. Waste Manag. 2016, 56, 3–12. [Google Scholar] [CrossRef] [PubMed]
- Marshall, R.E.; Farahbakhsh, K. Systems approaches to integrated solid waste management in developing countries. Waste Manag. 2013, 33, 988–1003. [Google Scholar] [CrossRef] [PubMed]
- Zurbrügg, C.; Caniato, M.; Vaccari, M. How assessment methods can support solid waste management in developing countries-a critical review. Sustainability 2014, 6, 545–570. [Google Scholar] [CrossRef] [Green Version]
- Wilson, D.C.; Cowing, M.J.; Oelz, B.; Scheinberg, A.; Stretz, J.; Velis, C.A.; Rodic, L.; Masterson, D.; Vilches, R.; Whiteman, A.D. ‘Wasteaware’ benchmark indicators for integrated sustainable waste management in cities. Waste Manag. 2014, 35, 329–342. [Google Scholar] [CrossRef] [PubMed]
- Löhr, A.; Savelli, H.; Beunen, R.; Kalz, M.; Ragas, A.; Van Belleghem, F. Solutions for global marine litter pollution. Curr. Opin. Environ. Sustain. 2017, 28, 90–99. [Google Scholar] [CrossRef] [Green Version]
- Wilson, D.C.; Velis, C.A.; Rodic, L. Integrated sustainable waste management in developing countries. Waste Resour. Manag. 2013, 166, 52–68. [Google Scholar] [CrossRef]
- Wilson, D.C.; Rodic, L.; Scheinberg, A.; Velis, C.A.; Alabaster, G. Comparative analysis of solid waste management in 20 cities. Waste Manag. Res. 2012, 30, 237–254. [Google Scholar] [CrossRef] [Green Version]
- Leal Filho, W.; Stenmarck, Å.; Kruopienė, J.; Moora, H.; Brandli, L. Benchmarking approaches and methods in the field of urban waste management. J. Clean. Prod. 2015, 112, 4377–4386. [Google Scholar] [CrossRef]
- Chang, N.B.; Pires, A.; Martinho, G. Empowering systems analysis for solid waste management: Challenges, trends, and perspectives. Crit. Rev. Environ. Sci. Technol. 2011, 41, 1449–1530. [Google Scholar] [CrossRef]
- Obeng-Odoom, F. On the origin, meaning, and evaluation of urban governance. Nor. Geogr. Tidsskr. 2012, 66, 204–212. [Google Scholar] [CrossRef]
- Obeng-Odoom, F. Urban Governance in Africa Today: Reframing, Experiences, and Lessons. Growth Chang. 2017, 48, 4–21. [Google Scholar] [CrossRef]
- Harpham, T.; Boateng, K.A. Urban Governance in Relation to the Operation of Urban Services in Developing Countries. Habitat Int. 1997, 21, 65–77. [Google Scholar] [CrossRef]
- Rahmasary, A.N.; Robert, S.; Chang, I.S.; Jing, W.; Park, J.; Bluemling, B.; Koop, S.; van Leeuwen, K. Overcoming the Challenges of Water, Waste and Climate Change in Asian Cities. Environ. Manag. 2019, 63, 520–535. [Google Scholar] [CrossRef] [PubMed] [Green Version]
- Childers, D.L.; Pickett, S.T.A.; Grove, J.M.; Ogden, L.; Whitmer, A. Advancing urban sustainability theory and action: Challenges and opportunities. Landsc. Urban Plan. 2014, 125, 320–328. [Google Scholar] [CrossRef]
- Bai, X.; McPhearson, T.; Cleugh, H.; Nagendra, H.; Tong, X.; Zhu, T.; Zhu, Y.-G. Linking Urbanization and the Environment: Conceptual and Empirical Advances. Annu. Rev. Environ. Resour. 2017, 42, 215–240. [Google Scholar] [CrossRef] [Green Version]
- Mc Phearson, T.; Pickett, S.T.A.; Grimm, N.B.; Niemelä, J.; Alberti, M.; Elmqvist, T.; Weber, C.; Haase, D.; Breuste, J.; Qureshi, S. Advancing Urban Ecology toward a Science of Cities. Bioscience 2016, 66, 198–212. [Google Scholar] [CrossRef] [Green Version]
- Wu, J. Urban ecology and sustainability: The state-of-the-science and future directions. Landsc. Urban Plan. 2014, 125, 209–221. [Google Scholar] [CrossRef]
- Batty, M. The Size, Scale, and Shape of Cities. Science 2008, 319, 769–771. [Google Scholar] [CrossRef] [Green Version]
- Bettencourt, L.M.A. The Origins of Scaling in Cities. Science 2013, 340, 1438–1441. [Google Scholar] [CrossRef] [Green Version]
- Heifetz, R.; Grashow, A.; Linsky, M. The Practice of Adaptive Leadership; Tools and Tactics for Changing Your Organization and the World; Harvard Business Press: Boston, MA, USA, 2009; ISBN 9781422132401. [Google Scholar]
- Osinga, F.P.B. Science, Strategy and War: The Strategic Theory of John Boyd; Routledge: Abingdon, UK, 2007. [Google Scholar]
- Van de Ven, A.H. Engaged Scholarship, A Guide for Organizational and Social Research; Oxford University Press: Oxford, UK, 2007; ISBN 9780199226290. [Google Scholar]
- Watkins, R.; Meiers, M.W.; Visser, Y.L. A Guide to Assessing Needs; The World Bank: Washington, DC, USA, 2012; ISBN 9780821388686. [Google Scholar]
- Rooney, J.J.; Lee, N. Vanden Heuvel Root Cause Analysis for Beginners. Qual. Prog. 2004, 37, 45–53. [Google Scholar]
- Morecroft, J.D.W. Strategic Modelling and Business Dynamics; John Wiley & Sons: Hoboken, NJ, USA, 2015; ISBN 9781118844687. [Google Scholar]
- Xu, Y.; Cui, S.; Lin, T.; Ye, Z.; Xiao, L.; Xu, L. Path analysis of factors influencing household solid waste generation: A case study of Xiamen Island, China. J. Mater. Cycles Waste Manag. 2014, 18, 377–384. [Google Scholar] [CrossRef]
- Haregu, T.N.; Ziraba, A.K.; Aboderin, I.; Amugsi, D.; Muindi, K.; Mberu, B. An assessment of the evolution of Kenya’s solid waste management policies and their implementation in Nairobi and Mombasa: Analysis of policies and practices. Environ. Urban. 2017, 29, 515–532. [Google Scholar] [CrossRef] [Green Version]
- Kazuva, E.; Zhang, J.; Tong, Z.; Si, A.; Na, L. The DPSIR model for environmental risk assessment of municipal solid waste in Dar es Salaam city, Tanzania. Int. J. Environ. Res. Public Health 2018, 15, 1692. [Google Scholar] [CrossRef] [PubMed] [Green Version]
- Fobil, J.N.; Armah, N.A.; Hogarh, J.N.; Carboo, D. The influence of institutions and organizations on urban waste collection systems: An analysis of waste collection system in Accra, Ghana (1985–2000). J. Environ. Manage 2008, 86, 262–271. [Google Scholar] [CrossRef] [PubMed]
- Das, B.; Bhave, P.V.; Sapkota, A.; Byanju, R.M. Estimating emissions from open burning of municipal solid waste in municipalities of Nepal. Waste Manag. 2018, 79, 481–490. [Google Scholar] [CrossRef] [PubMed]
- Bjerkli, C.L. Power in waste: Conflicting agendas in planning for integrated solid waste management in Addis Ababa, Ethiopia. Nor. Geogr. Tidsskr. 2015, 69, 18–27. [Google Scholar] [CrossRef]
- Mmereki, D. Current status of waste management in Botswana: A mini-review. Waste Manag. Res. 2018, 36, 555–576. [Google Scholar] [CrossRef]
- Lohri, C.R.; Camenzind, E.J.; Zurbrügg, C. Financial sustainability in municipal solid waste management—Costs and revenues in Bahir Dar, Ethiopia. Waste Manag. 2014, 34, 542–552. [Google Scholar] [CrossRef] [Green Version]
- Permana, A.S.; Towolioe, S.; Aziz, N.A.; Ho, C.S. Sustainable solid waste management practices and perceived cleanliness in a low income city. Habitat Int. 2015, 49, 197–205. [Google Scholar] [CrossRef]
- Cetrulo, T.B.; Marques, R.C.; Cetrulo, N.M.; Pinto, F.S.; Moreira, R.M.; Mendizábal-Cortés, A.D.; Malheiros, T.F. Effectiveness of solid waste policies in developing countries: A case study in Brazil. J. Clean. Prod. 2018, 205, 179–187. [Google Scholar] [CrossRef]
- Sandhu, K.; Burton, P.; Dedekorkut-Howes, A. Between hype and veracity; privatization of municipal solid waste management and its impacts on the informal waste sector. Waste Manag. 2017, 59, 545–556. [Google Scholar] [CrossRef] [PubMed]
- Sibanda, L.K.; Obange, N.; Awuor, F.O. Challenges of Solid Waste Management in Kisumu, Kenya. In Urban Forum; Springer: Berlin/Heidelberg, Germany, 2017; Volume 28, pp. 387–402. [Google Scholar]
- Kinobe, J.R.; Bosona, T.; Gebresenbet, G.; Niwagaba, C.B.; Vinnerås, B. Optimization of waste collection and disposal in Kampala city. Habitat Int. 2015, 49, 126–137. [Google Scholar] [CrossRef]
- Kinobe, J.R.; Niwagaba, C.B.; Gebresenbet, G.; Komakech, A.J.; Vinnerås, B. Mapping out the solid waste generation and collection models: The case of Kampala City. J. Air Waste Manag. Assoc. 2015, 65, 197–205. [Google Scholar]
- Guerrero, L.A.; Maas, G.; Hogland, W. Solid waste management challenges for cities in developing countries. Waste Manag. 2013, 33, 220–232. [Google Scholar] [CrossRef] [PubMed]
- Aleluia, J.; Ferrão, P. Characterization of urban waste management practices in developing Asian countries: A new analytical framework based on waste characteristics and urban dimension. Waste Manag. 2016, 58, 415–429. [Google Scholar] [CrossRef]
- Kafeel, A. A System Dynamics Modeling of Municipal Solid Waste Management Systems in Delhi. Int. J. Res. Eng. Technol. 2015, 01, 628–641. [Google Scholar]
- Ali, M.; Geng, Y.; Robins, D.; Cooper, D.; Roberts, W.; Vogtländer, J. Improvement of waste management practices in a fast expanding sub-megacity in Pakistan, on the basis of qualitative and quantitative indicators. Waste Manag. 2019, 85, 253–263. [Google Scholar] [CrossRef]
- Aparcana, S. Approaches to formalization of the informal waste sector into municipal solid waste management systems in low- and middle-income countries: Review of barriers and success factors. Waste Manag. 2017, 61, 593–607. [Google Scholar] [CrossRef] [Green Version]
- Ezeah, C.; Roberts, C.L. Analysis of barriers and success factors affecting the adoption of sustainable management of municipal solid waste in Nigeria. J. Environ. Manage 2012, 103, 9–14. [Google Scholar] [CrossRef]
- Yang, Q.; He, L.; Liu, X.; Cheng, M. Bayesian-based conflict conversion path discovery for waste management policy implementation in China. Int. J. Confl. Manag. 2018, 29, 347–375. [Google Scholar] [CrossRef]
- Nidugala, G.K.; Pant, A. Cleanest cities in India 2017: Indore’s meteoric rise to no. 1 spot. J. Public Aff. 2017, 17, e1674. [Google Scholar] [CrossRef]
- Chauhan, A.; Singh, A.; Jharkharia, S. An interpretive structural modeling (ISM) and decision-making trail and evaluation laboratory (DEMATEL) method approach for the analysis of barriers of waste recycling in India. J. Air Waste Manag. Assoc. 2018, 68, 100–110. [Google Scholar] [CrossRef] [PubMed]
- Wilson, D.C.; Kanjogera, J.B.; Soós, R.; Briciu, C.; Smith, S.R.; Whiteman, A.D.; Spies, S.; Oelz, B. Operator models for delivering municipal solid waste management services in developing countries. Part A: The evidence base. Waste Manag. Res. 2017, 35, 820–841. [Google Scholar] [CrossRef] [PubMed]
- Da Silva, C.L. Proposal of a dynamic model to evaluate public policies for the circular economy: Scenarios applied to the municipality of Curitiba. Waste Manag. 2018, 78, 456–466. [Google Scholar] [CrossRef]
- Sufian, M.A.; Bala, B.K. Modeling of urban solid waste management system: The case of Dhaka city. Waste Manag. 2007, 27, 858–868. [Google Scholar] [CrossRef]
- Sukholthaman, P.; Sharp, A. A system dynamics model to evaluate effects of source separation of municipal solid waste management: A case of Bangkok, Thailand. Waste Manag. 2016, 52, 50–61. [Google Scholar] [CrossRef]
- Zurbrügg, C.; Gfrerer, M.; Ashadi, H.; Brenner, W.; Küper, D. Determinants of sustainability in solid waste management-The Gianyar Waste Recovery Project in Indonesia. Waste Manag. 2012, 32, 2126–2133. [Google Scholar] [CrossRef]
- Allesch, A.; Brunner, P.H. Assessment methods for solid waste management: A literature review. Waste Manag. Res. 2014, 32, 461–473. [Google Scholar] [CrossRef]
- Kawai, K.; Tasaki, T. Revisiting estimates of municipal solid waste generation per capita and their reliability. J. Mater. Cycles Waste Manag. 2015, 18, 1–13. [Google Scholar] [CrossRef] [Green Version]
Figure 1.
Model of relations between, governance, urbanization, and urban processes in Solid Waste Management (SWM).
Figure 1.
Model of relations between, governance, urbanization, and urban processes in Solid Waste Management (SWM).

Figure 2.
Analytical framework.

Scheme 1.
Number of publications by geographical classification.

Scheme 2.
Number of publications with categorized claims.

Figure 3.
Illustrative causal loop diagram of effects exogenous variables.

Figure 4.
Illustrative causal loop diagram on governance and political processes.

Figure 5.
Illustrative causal loop diagram on social and economic aspects.

Figure 6.
Illustrative causal loop diagram on operational and financial aspects.

Figure 7.
Illustrative causal loop diagram on organizational and psychological processes.

Figure 8.
Example of consolidation of causal loop diagrams.

© 2019 by the authors. Licensee MDPI, Basel, Switzerland. This article is an open access article distributed under the terms and conditions of the Creative Commons Attribution (CC BY) license (http://creativecommons.org/licenses/by/4.0/).
Share and Cite
MDPI and ACS Style
Breukelman, H.; Krikke, H.; Löhr, A. Failing Services on Urban Waste Management in Developing Countries: A Review on Symptoms, Diagnoses, and Interventions. Sustainability 2019, 11, 6977. https://doi.org/10.3390/su11246977
AMA Style
Breukelman H, Krikke H, Löhr A. Failing Services on Urban Waste Management in Developing Countries: A Review on Symptoms, Diagnoses, and Interventions. Sustainability. 2019; 11(24):6977. https://doi.org/10.3390/su11246977
Chicago/Turabian StyleBreukelman, Hans, Harold Krikke, and Ansje Löhr. 2019. "Failing Services on Urban Waste Management in Developing Countries: A Review on Symptoms, Diagnoses, and Interventions" Sustainability 11, no. 24: 6977. https://doi.org/10.3390/su11246977
Note that from the first issue of 2016, this journal uses article numbers instead of page numbers. See further details here.