Experimental and Numerical Analysis for Earth-Fill Dam Seepage
by
 , and
, and
Ahmed Mohammed Sami Al-Janabi
1 ,
,
Abdul Halim Ghazali
1, 
Yousry Mahmoud Ghazaw
2,3,
Haitham Abdulmohsin Afan
4,
Nadhir Al-Ansari
5 and
and
Zaher Mundher Yaseen
6,*
1
Department of Civil Engineering, Faculty of Engineering, Universiti Putra Malaysia, UPM Serdang, Selangor 43400, Malaysia
2
Department of Irrigation and Hydraulics, Faculty of Engineering, Alexandria University, Alexandria 21544, Egypt
3
Department of Civil Engineering, College of Engineering, Qassim University, Buraydah 51431, Saudi Arabia
4
Institute of Research and Development, Duy Tan University, Da Nang 550000, Vietnam
5
Civil, Environmental and Natural Resources Engineering, Lulea University of Technology, 97187 Lulea, Sweden
6
Sustainable Developments in Civil Engineering Research Group, Faculty of Civil Engineering, Ton Duc Thang University, Ho Chi Minh City, Vietnam
*
Author to whom correspondence should be addressed.
Sustainability 2020, 12(6), 2490; https://doi.org/10.3390/su12062490
Submission received: 25 February 2020
/
Revised: 20 March 2020
/
Accepted: 20 March 2020
/
Published: 22 March 2020
(This article belongs to the Special Issue Sustainable Geotechnics—Theory, Practice, and Applications)
Abstract
:Earth-fill dams are the most common types of dam and the most economical choice. However, they are more vulnerable to internal erosion and piping due to seepage problems that are the main causes of dam failure. In this study, the seepage through earth-fill dams was investigated using physical, mathematical, and numerical models. Results from the three methods revealed that both mathematical calculations using L. Casagrande solutions and the SEEP/W numerical model have a plotted seepage line compatible with the observed seepage line in the physical model. However, when the seepage flow intersected the downstream slope and when piping took place, the use of SEEP/W to calculate the flow rate became useless as it was unable to calculate the volume of water flow in pipes. This was revealed by the big difference in results between physical and numerical models in the first physical model, while the results were compatible in the second physical model when the seepage line stayed within the body of the dam and low compacted soil was adopted. Seepage analysis for seven different configurations of an earth-fill dam was conducted using the SEEP/W model at normal and maximum water levels to find the most appropriate configuration among them. The seven dam configurations consisted of four homogenous dams and three zoned dams. Seepage analysis revealed that if sufficient quantity of silty sand soil is available around the proposed dam location, a homogenous earth-fill dam with a medium drain length of 0.5 m thickness is the best design configuration. Otherwise, a zoned earth-fill dam with a central core and 1:0.5 Horizontal to Vertical ratio (H:V) is preferred.
1. Introduction
1.1. Research Background
Earth-fill (embankment) dams are the most common types of dam. In addition, they are considered as the most economical choice when utilizing locally available materials. Further, they have been part of a usual practice to store and control river water for a long time [1,2]. Such dams are normally built by placement and compaction of a complex semi-plastic mound of various soil, rock, sand, or clay compositions [3]. Stability and seepage are important in an earth dam as they were found to be the main reasons of dam failure [4,5]. Earth-fill dams lose water from the dam reservoir through evaporation and from the dam body through seepage [6,7,8]. Losses due to evaporation cannot be controlled, but with good construction techniques, seepage losses can be minimized [9]. Seepage is the outcome of the difference in water height upstream and downstream. Seepage rate depends on various factors, including the soil medium, the type of fluid, as well as the dams’ geometric conditions [10,11,12].
Soil seepage, which is the hydraulic conductivity of the soil and the pressure gradient, can be affected by a combination of factors acting on water [13]. Seepage in both homogenous and non-homogeneous earth-fill dams occur from the slow percolation of water on the dam and its foundation [14]. Inadequate seepage control has led to several seepage-related problems and failures on earth-fill dams [15]. Earth dams are more susceptible to internal erosion and piping due to seepage and require continuous maintenance. As the internal erosion and piping due to seepage are the main causes of failure in earth-fill dams, the control of seepage is extremely important in the design, construction, and safe operation of dams [4,9,16]. Although all earth-fill dams have at least some seepage, designing such dams should takes sufficient control of seepage into consideration, in order to ensure that the seepage does not adversely affect the safety and sustainability of the dam.
Several theories including Dupuit’s, Schaffernak–VanIterson’s, and Casagrande’s have been used to determine the seepage line and calculate the seepage rate through earth-fill dams [17,18,19]. In addition, several studies have been numerically and experimentally performed with the aim of calculating the seepage rate and the ways to minimize it [17,20,21,22,23,24]. This study aims to investigate the seepage line through earth-fill dams and estimate the rate of seepage using three methods, namely, physical models, mathematical calculations, and numerical models. This study also aims to investigate how the results from mathematical calculations and numerical models fit the observed seepage line and rate from the physical models.
1.2. Study of Seepage Through Earth-Fill Dams
The dam failures recorded in the 1700s and 1800s motivated the research for more scientific ways of designing and constructing dams. The first studies that quantitatively represented fluid flow through a porous media were published by Henri Darcy in 1856; he based his formula (now popular as Darcy’s law) on the flow of water through vertical filters in laboratory set-ups [25]. From the experiments, he demonstrated a simple relationship between the discharge velocity and the hydraulic gradient which he expressed as follows:
where Q is rate of seepage (m3/s), vd is discharge velocity (m/s), i is hydraulic gradient (m/m), k is coefficient of permeability (m/s), and A is cross-sectional area normal to the direction of flow (m2).
vd = k · i = Q/A
Q = k · i · A
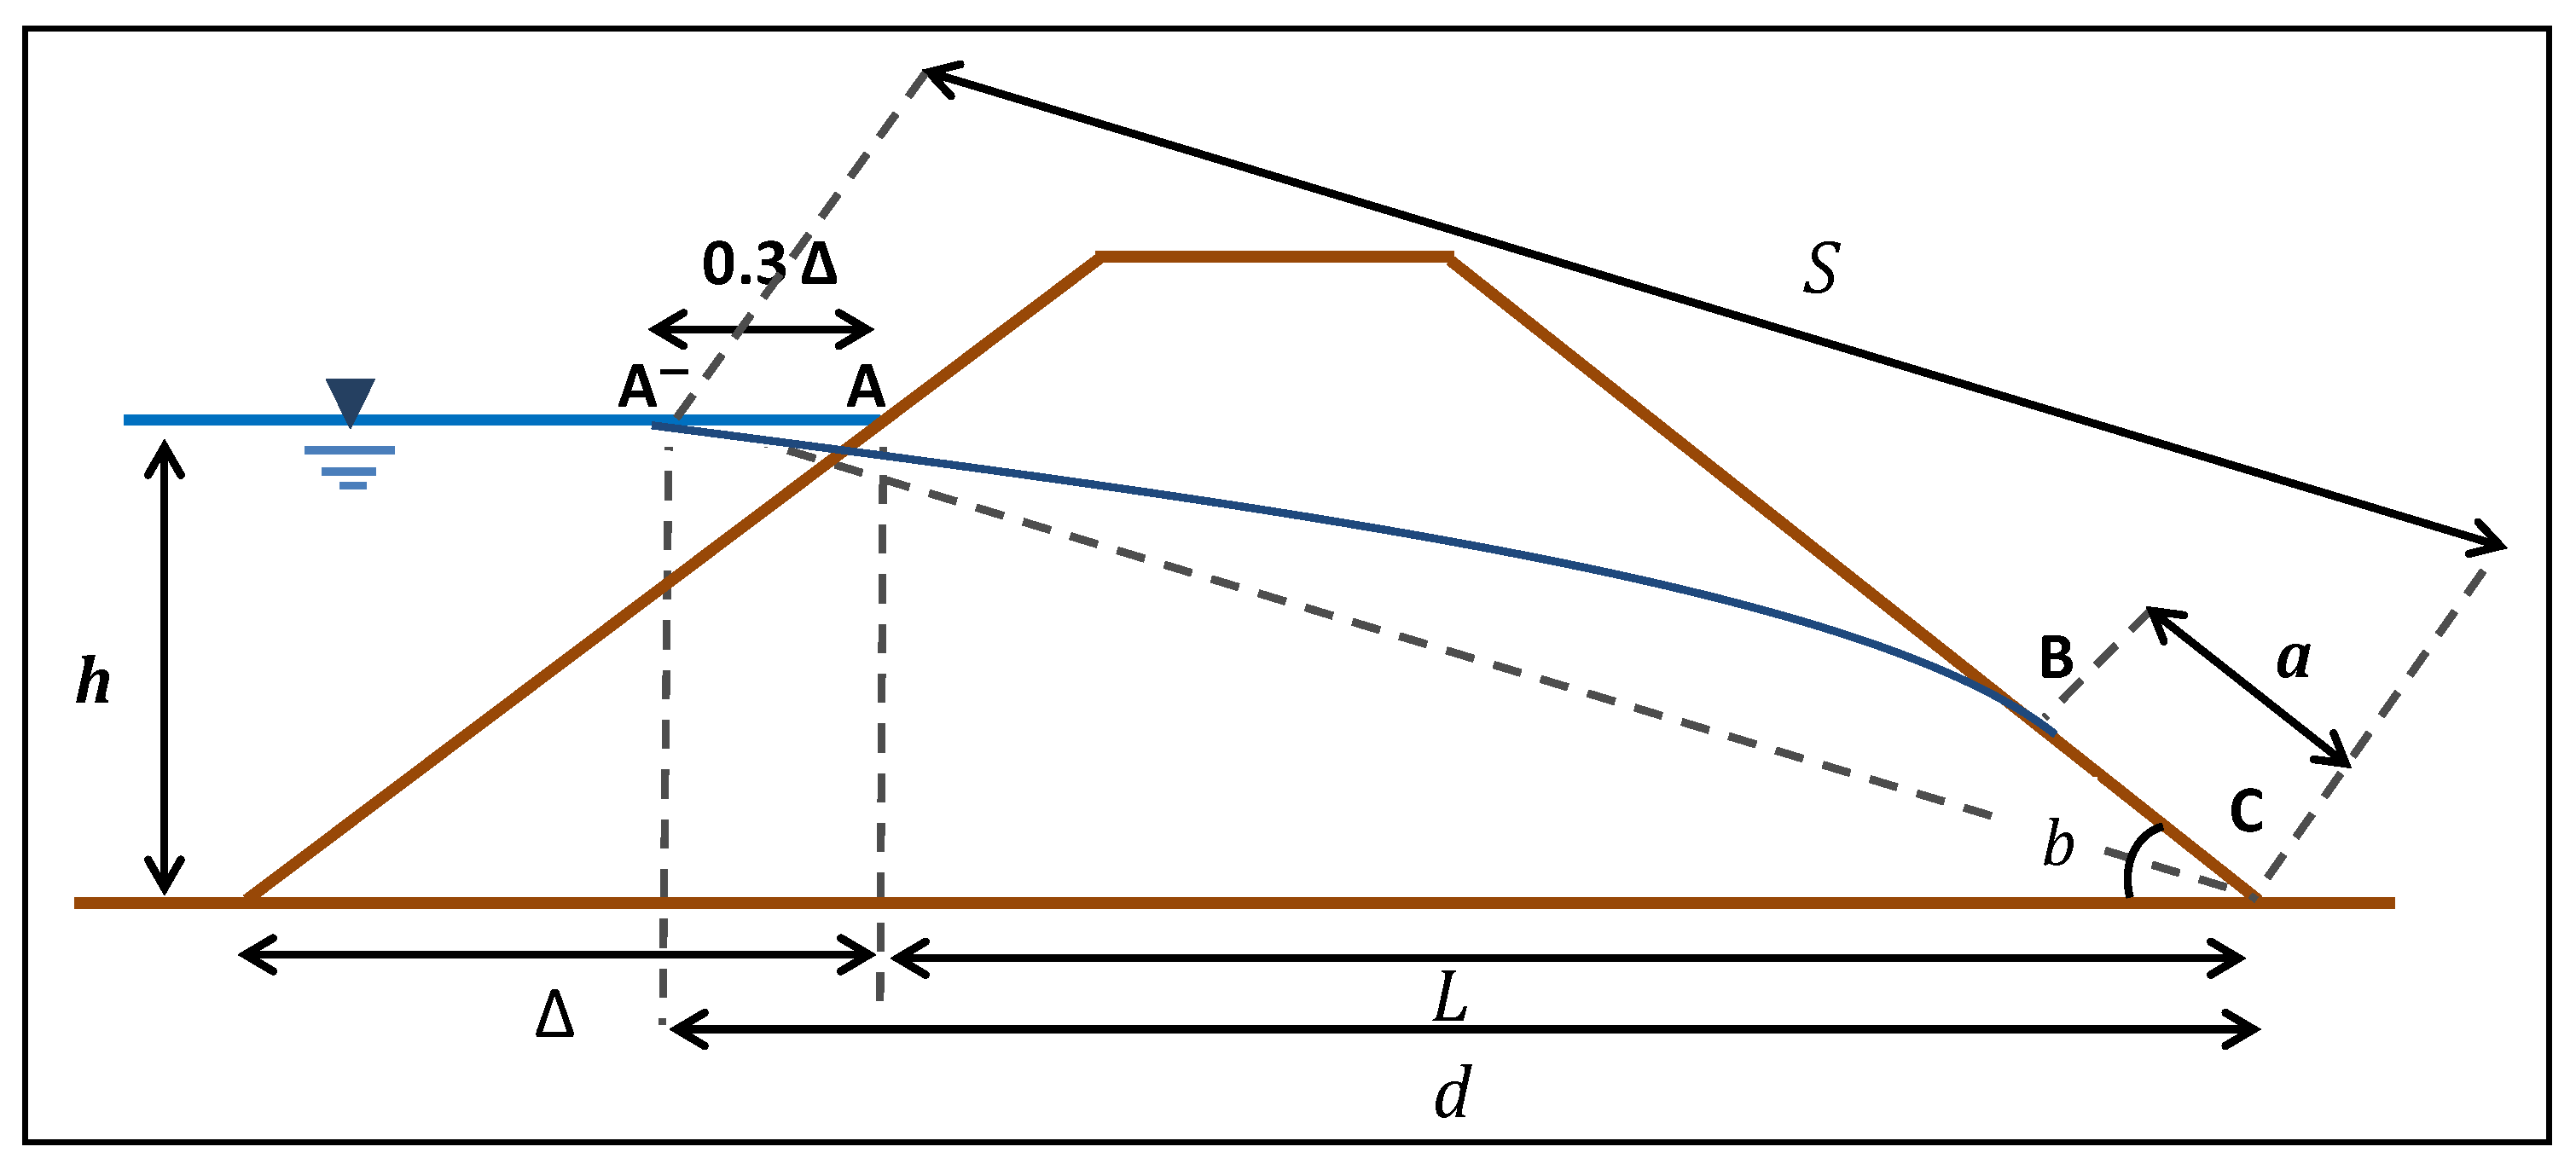
In the 1880s, Forchheimer demonstrated that the distribution of water pressure and velocity within a seepage medium is governed by the Laplace differential equation. Early in the 1900s, a powerful graphical method was developed independently by Forchhiemer in Germany and Richardson in England to obtain approximate solutions of the Laplace equation [26]. This method was widely used for earth dams after the publication of a comprehensive research that was conducted by researchers [19]. Since then, the solution of the Laplace equation by the graphical procedure or with electrical analog models has become a standard procedure for seepage analysis [4]. However, the graphical method requires a long procedure of plotting, is time consuming, and subjected to personal skills [4]. The rate of seepage using the L. Casagrande solution (Figure 1) is:
where q is the Darcy flux or flow rate (m2/s), k is the hydraulic conductivity or permeability (m/s), a is the length of the seepage surface (m), and is the angle of the downstream slope.
q = k · a · sin2 β
The length of the seepage surface a using upstream head h is calculated as:
where S is the length of the curve ĀBC (m), and h is the upstream head (m).
However, with about a 4–5% error, we can approximate S as the length of the straight line ĀC. Hence:
1.3. The Use of Physical and Numerical Models
Although the study of seepage through earth-fill dam needs an investigation of hydrological and geological conditions in sites, numerous studies have been conducted using physical models, (e.g., [16,28,29]), because physical models give a general picture of seepage behavior through earth-fill dams, including the phreatic line and the flow rate. Moreover, tests conducted on physical models can be an essential tool for investigating seepage behavior before the construction of the earth-fill dams and help to verify the initial design of dams by revealing potential demerits of a proposed design and to explore solutions.
However, as physical modeling has many limitations and constraints, the numerical modeling which is based on the mathematical solutions is the other way used in many researches (e.g., [30,31,32]), to solve the most complex engineering problems including seepage studies.
Numerical modeling is a rapid and less expensive technique and its results can be easily shared with the concerned parties. Being a purely mathematical approach, numerical modeling differs significantly from both laboratory-scale physical and full-scaled field modeling [10]. In situations where numerical modeling is considered improperly validated, physical modeling is normally recommended; such situations may include complex hydraulic conditions, non-standard or irregular site-specific conditions, or project performance improvement using non-standard designs.
In this study, the seepage through earth-fill dams was investigated using three methods, namely, physical, mathematical, and numerical models, and then the results were compared with each other. Subsequently, an example of seepage analysis for seven different configurations of an earth-fill dam was conducted using the SEEP/W software.
2. Materials and Methods
2.1. Experimental Setup
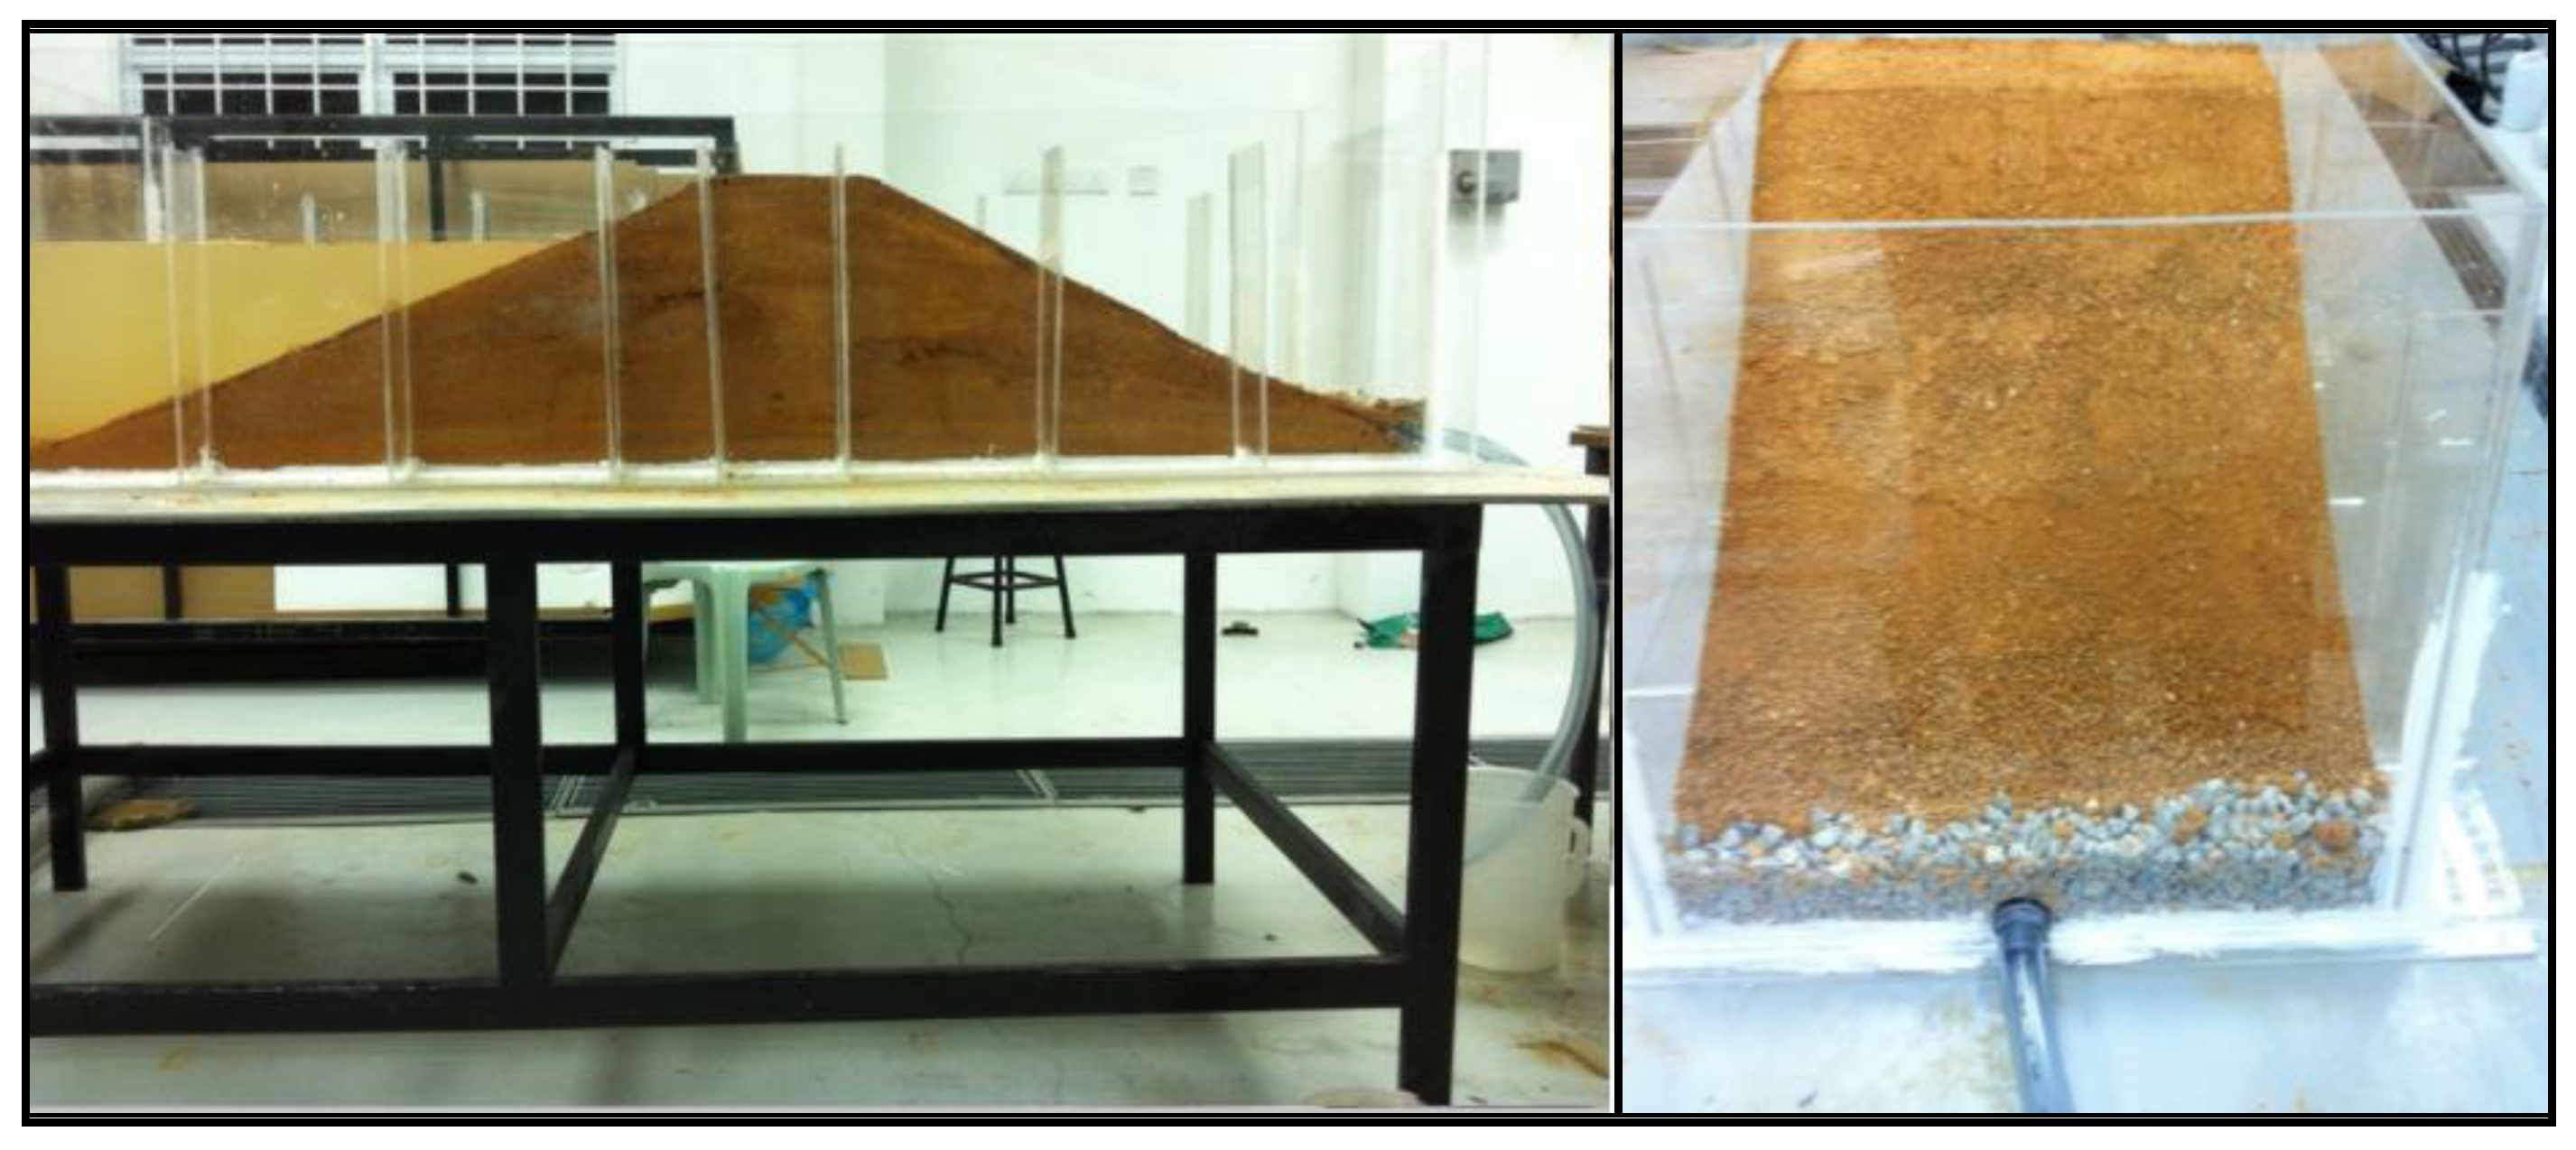
Two physical models of earth-fill dam were constructed in the hydraulic laboratory at Universiti Putra Malaysia. The models were placed inside rectangular tanks made of Perspex acrylic clear sheets, each with a length of 2.4 m, width of 0.5 m, and height of 0.5 m (Figure 2). Both models were homogenous with different drainage configuration, one with toe drain and the other with maximum length of horizontal drain.
The maximum length of horizontal drain was calculated using an equation [33] which is expressed as follows:
where Lmax is the length of horizontal drain (m), Fb is free board (m), m is upstream slope (m), n is downstream slope (m), T is crest width (m), and h is upstream head (m).
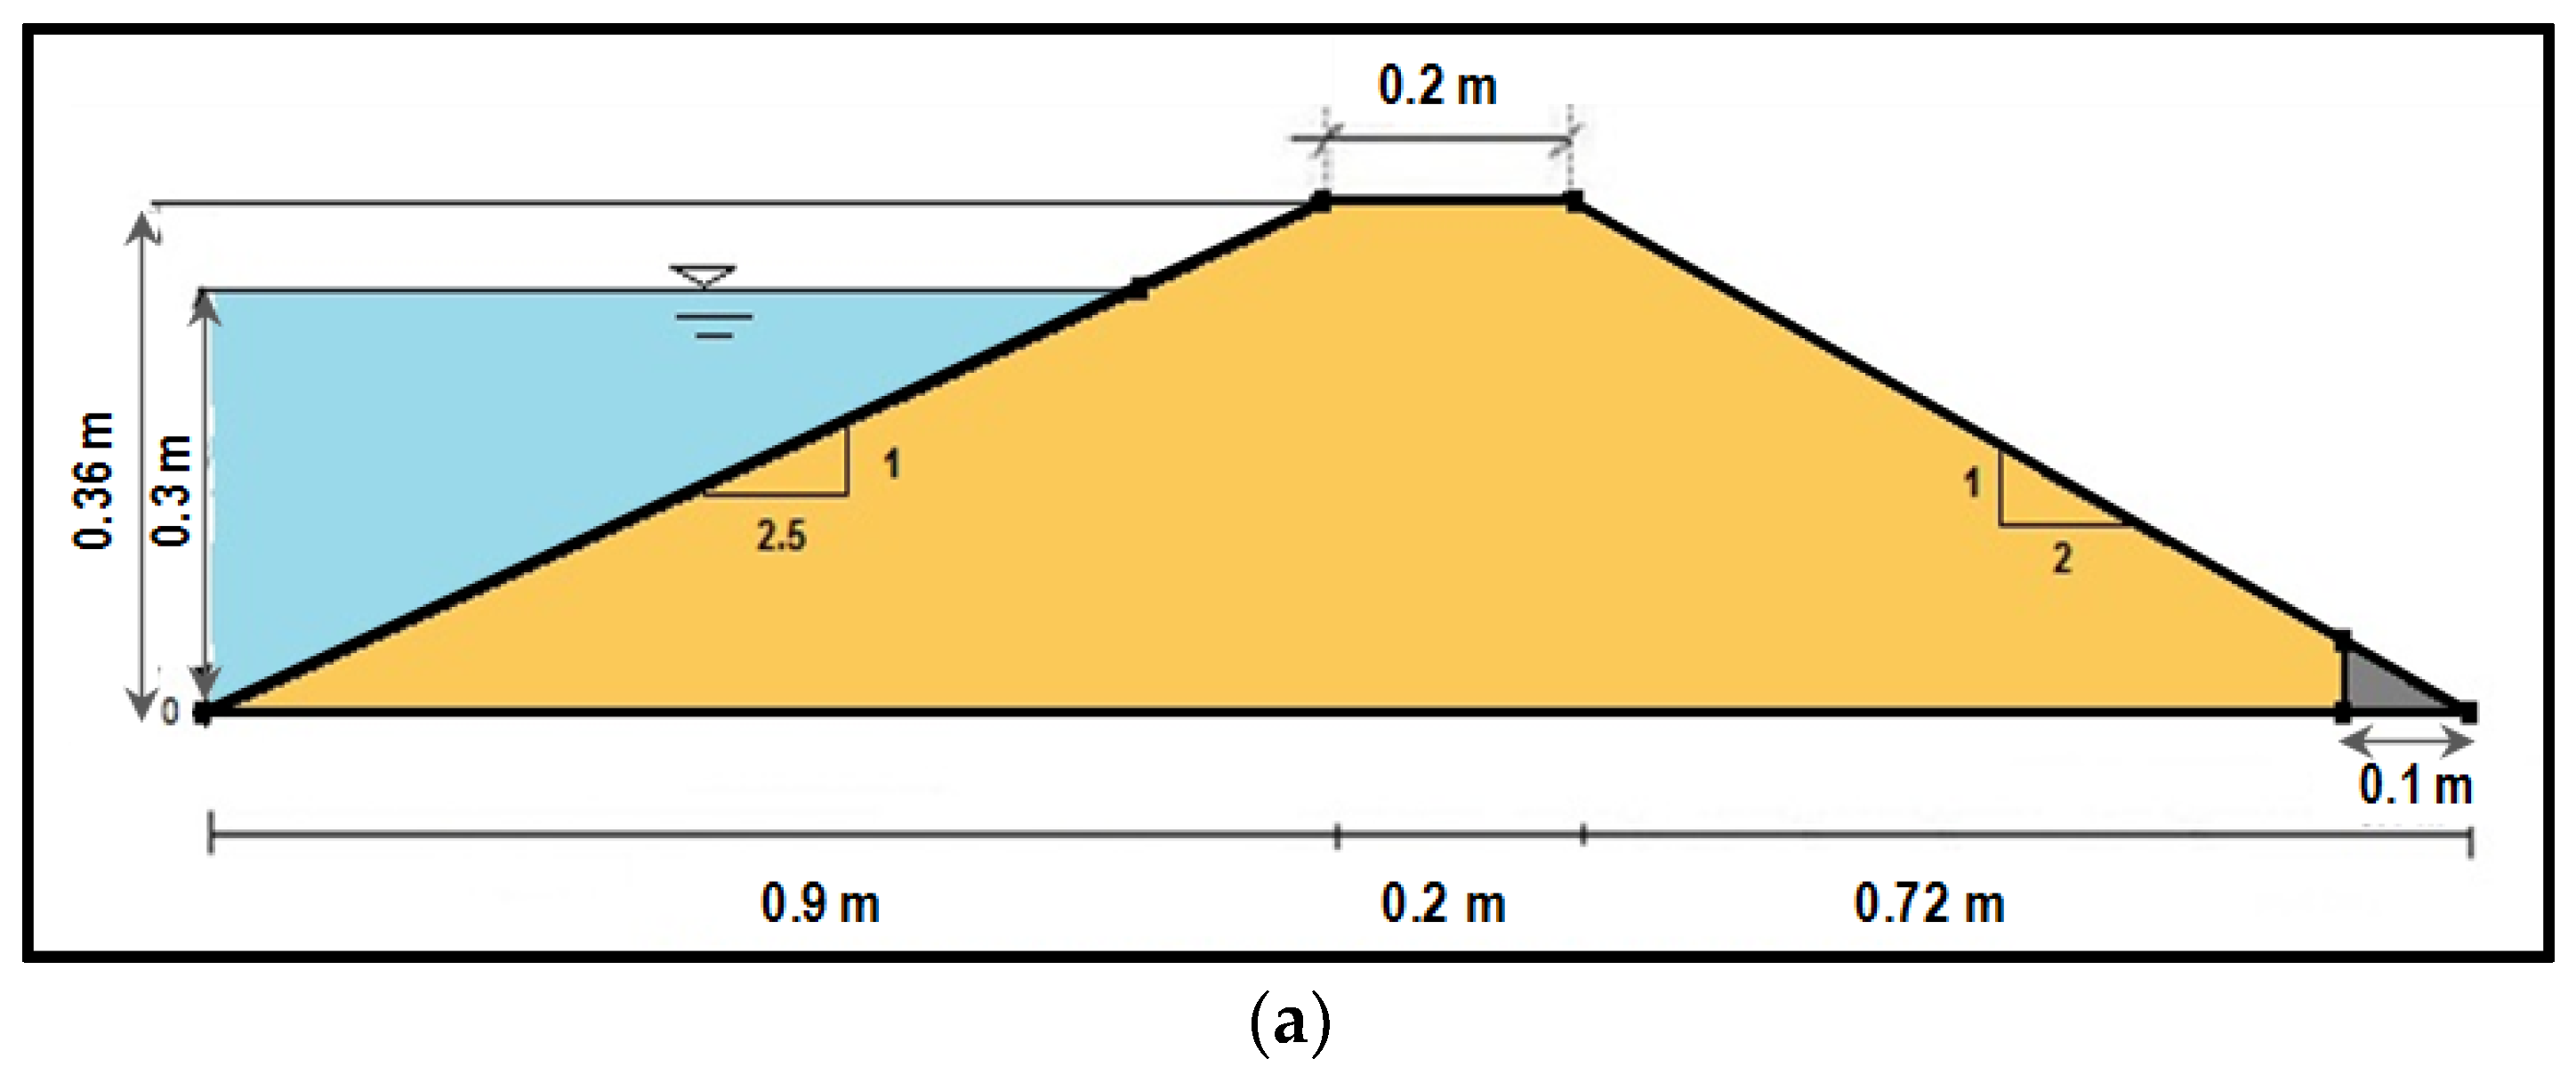
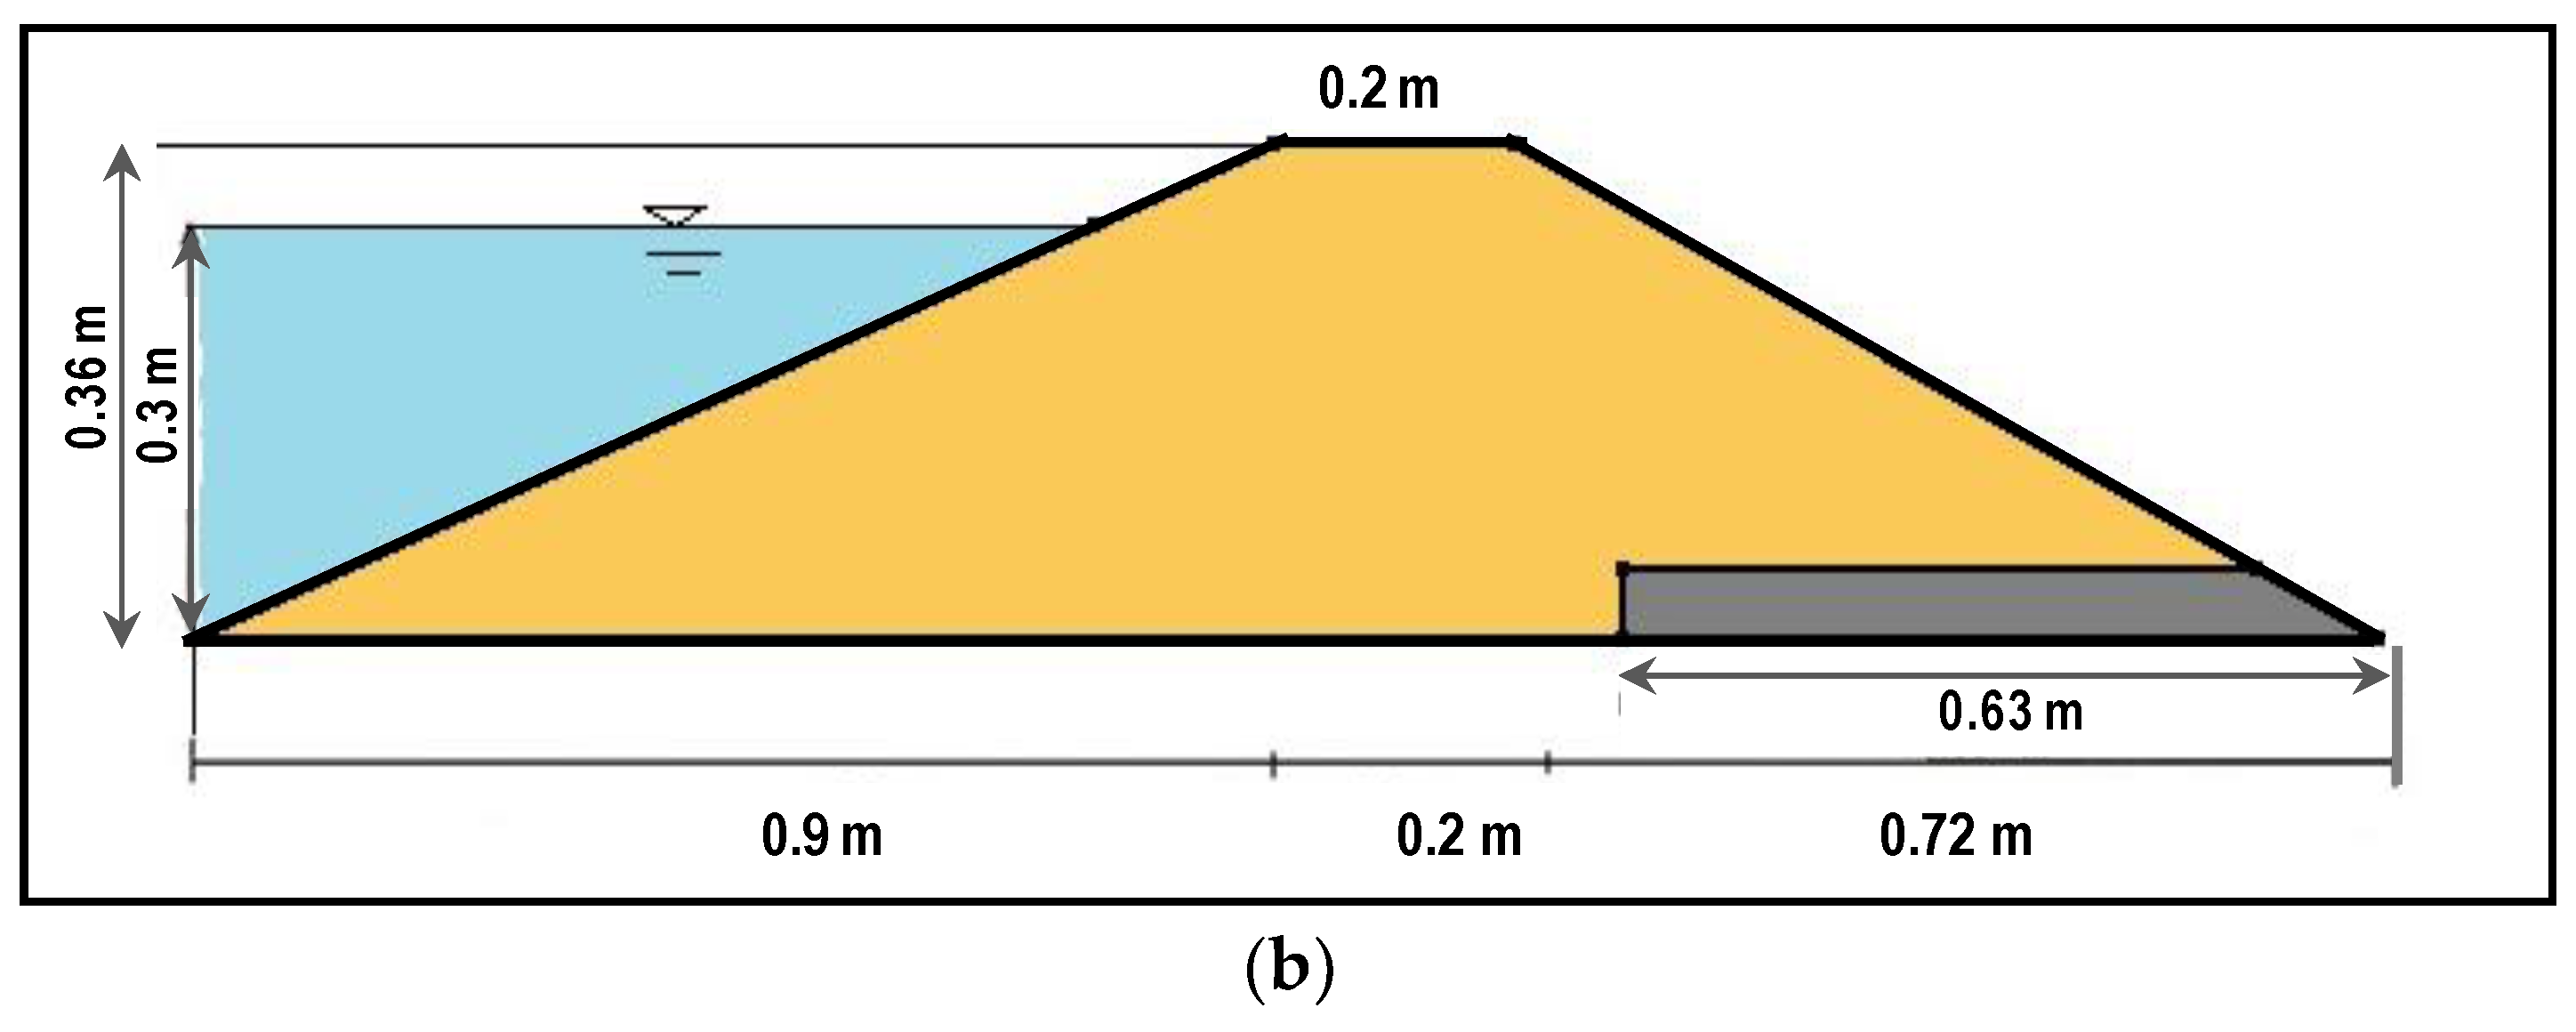
Details of models’ cross-sections are shown in Figure 3. Soil used to construct the earth-fill dam models was collected from the area of Gabai River near Langat Dam located in Hulu Langat, Selangor, Malaysia. Laboratory tests revealed that the soil sample was silty-sand, the optimum moisture of soil compaction was 20%, and the hydraulic conductivities for well and low compacted soil were 1.74562 × 10⁻⁸ m/s and 3.493 × 10⁻⁶ m/s, respectively. For the toe and horizontal drains, gravel with hydraulic conductivity of 0.016 m/s was used. During the construction of the physical models, soil was placed in layers of 5 cm and compacted accordingly, and the slopes of dam upstream and downstream were further compacted to fit the slope of 2.5:1 and 2:1 respectively.
2.2. Experimental Tests
The experiments were carried out with a constant upstream water level of 0.3 m. The reservoir of dam models was filled in water to the target level and kept at that level up to 9 h to get a fully saturated soil that has a constant seepage rate. To observe the phreatic line, four holes were drilled in the downstream slope of the dam to measure the height of water. Heights of the holes from the heel of the dam models were 0.87, 1.04, 1.28, and 1.46 m. The seepage rate through the dam models was calculated by a volumetric method, which involves measuring the volume of water outflow from the model. Hence, the total seepage rate was calculated by dividing the volume of water collected from the outlet (Figure 2) in a certain period of time.
2.3. Mathematical Calculation Using L. Casagrande Solution
The mathematical and graphical methods proposed by some researchers [34] were used to plot the phreatic line through the two physical models of earth-fill dam. Five and four points were allocated along the x-axis of models with toe drain and with maximum length of horizontal drain, respectively. The rate of seepage has been calculated mathematically using the L. Casagrande mathematical solution (Equations (3)–(6)).
2.4. Numerical Modeling Using SEEP/W Software
The SEEP/W software is a numerical model that depends on the finite element method. It can mathematically simulate the real physical process of water flowing through a particulate medium. The program deals with the fundamental flow laws for steady state and transient flow, and it shows how these laws are represented in numerical form. The mathematical equations used in SEEP/W are Darcy’s law, partial differential water flow equations, finite element water flow equations, temporal integration, numerical integration, hydraulic conductivity matrix, mass matrix, flux boundary vector, and density-dependent flow. In this study, the SEEP/W program was used to plot the phreatic line through the two physical models of earth-fill dam and to calculate the seepage rate through them.
3. Results and Analysis
3.1. Earth-Fill Dam Model with Toe Drain
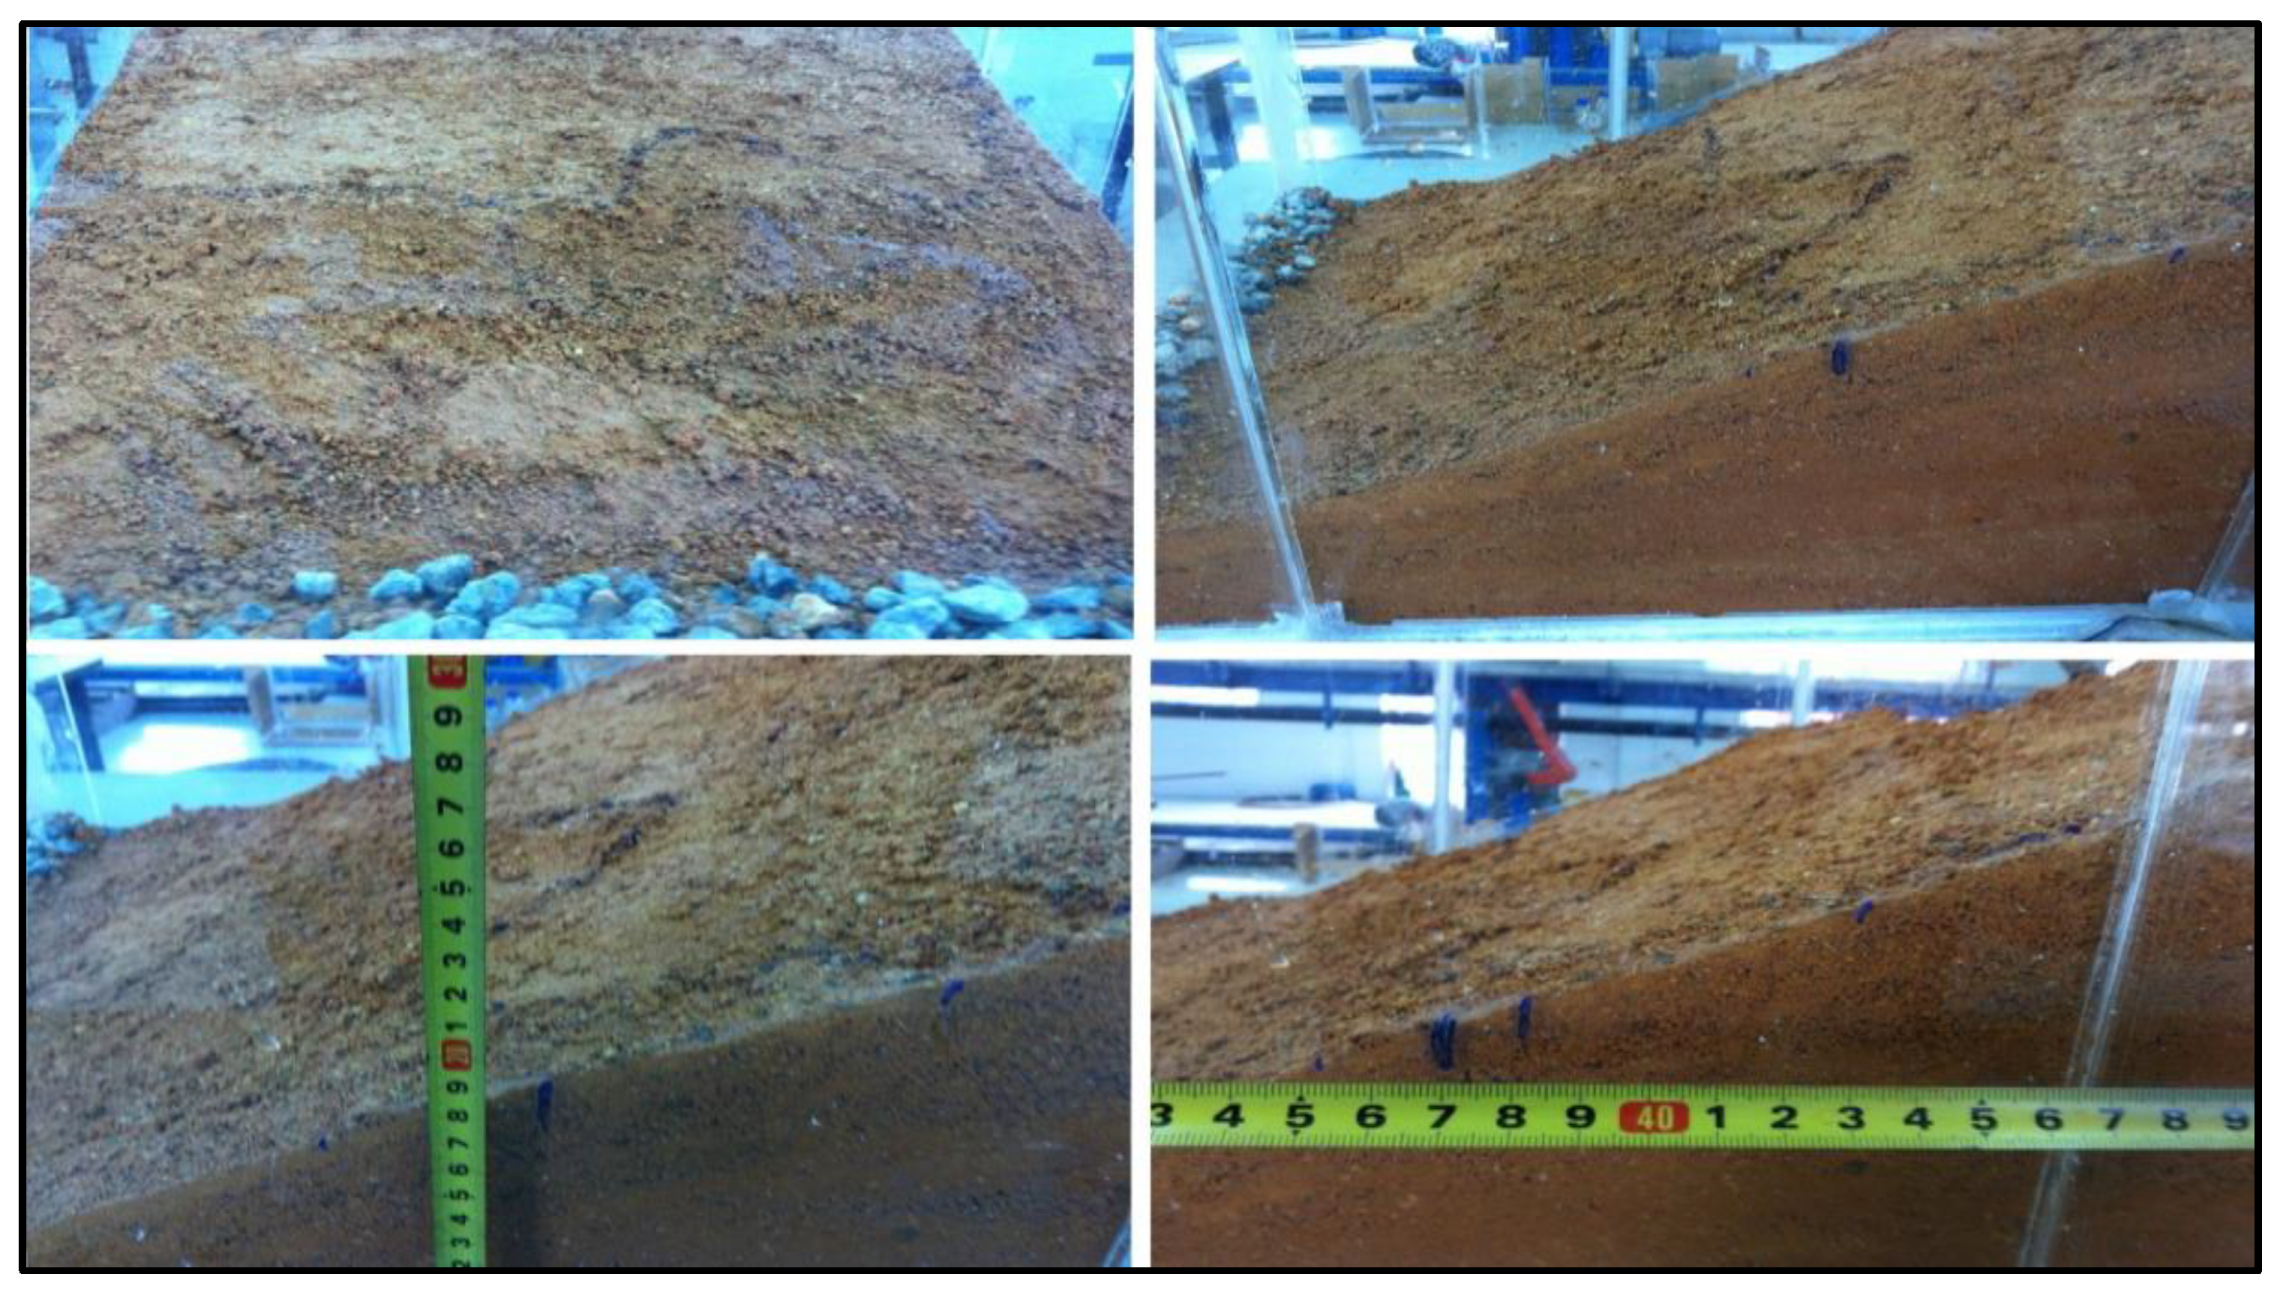
For the dam model with toe drain, observations revealed that the heights of phreatic line were 0.27, 0.24, 0.193, and 0.175 m for holes located in 0.87, 1.04, 1.28, and 1.46 m from the heel of the dam models, respectively. Observations also revealed that some of the seepage exited at the downstream face of the dam model and flow out between the distances of 1.41 to 1.48 m from the heel of the dam (Figure 4). This phreatic line intersection with the downstream slope would influence the stability of the earth dam because of potential piping. The total seepage flow through the model was 6.3889 × 10⁻⁷ m3/s (2.3 l/h), and the discharge of seepage was 1.277 × 10⁻⁶ m3/s/m.
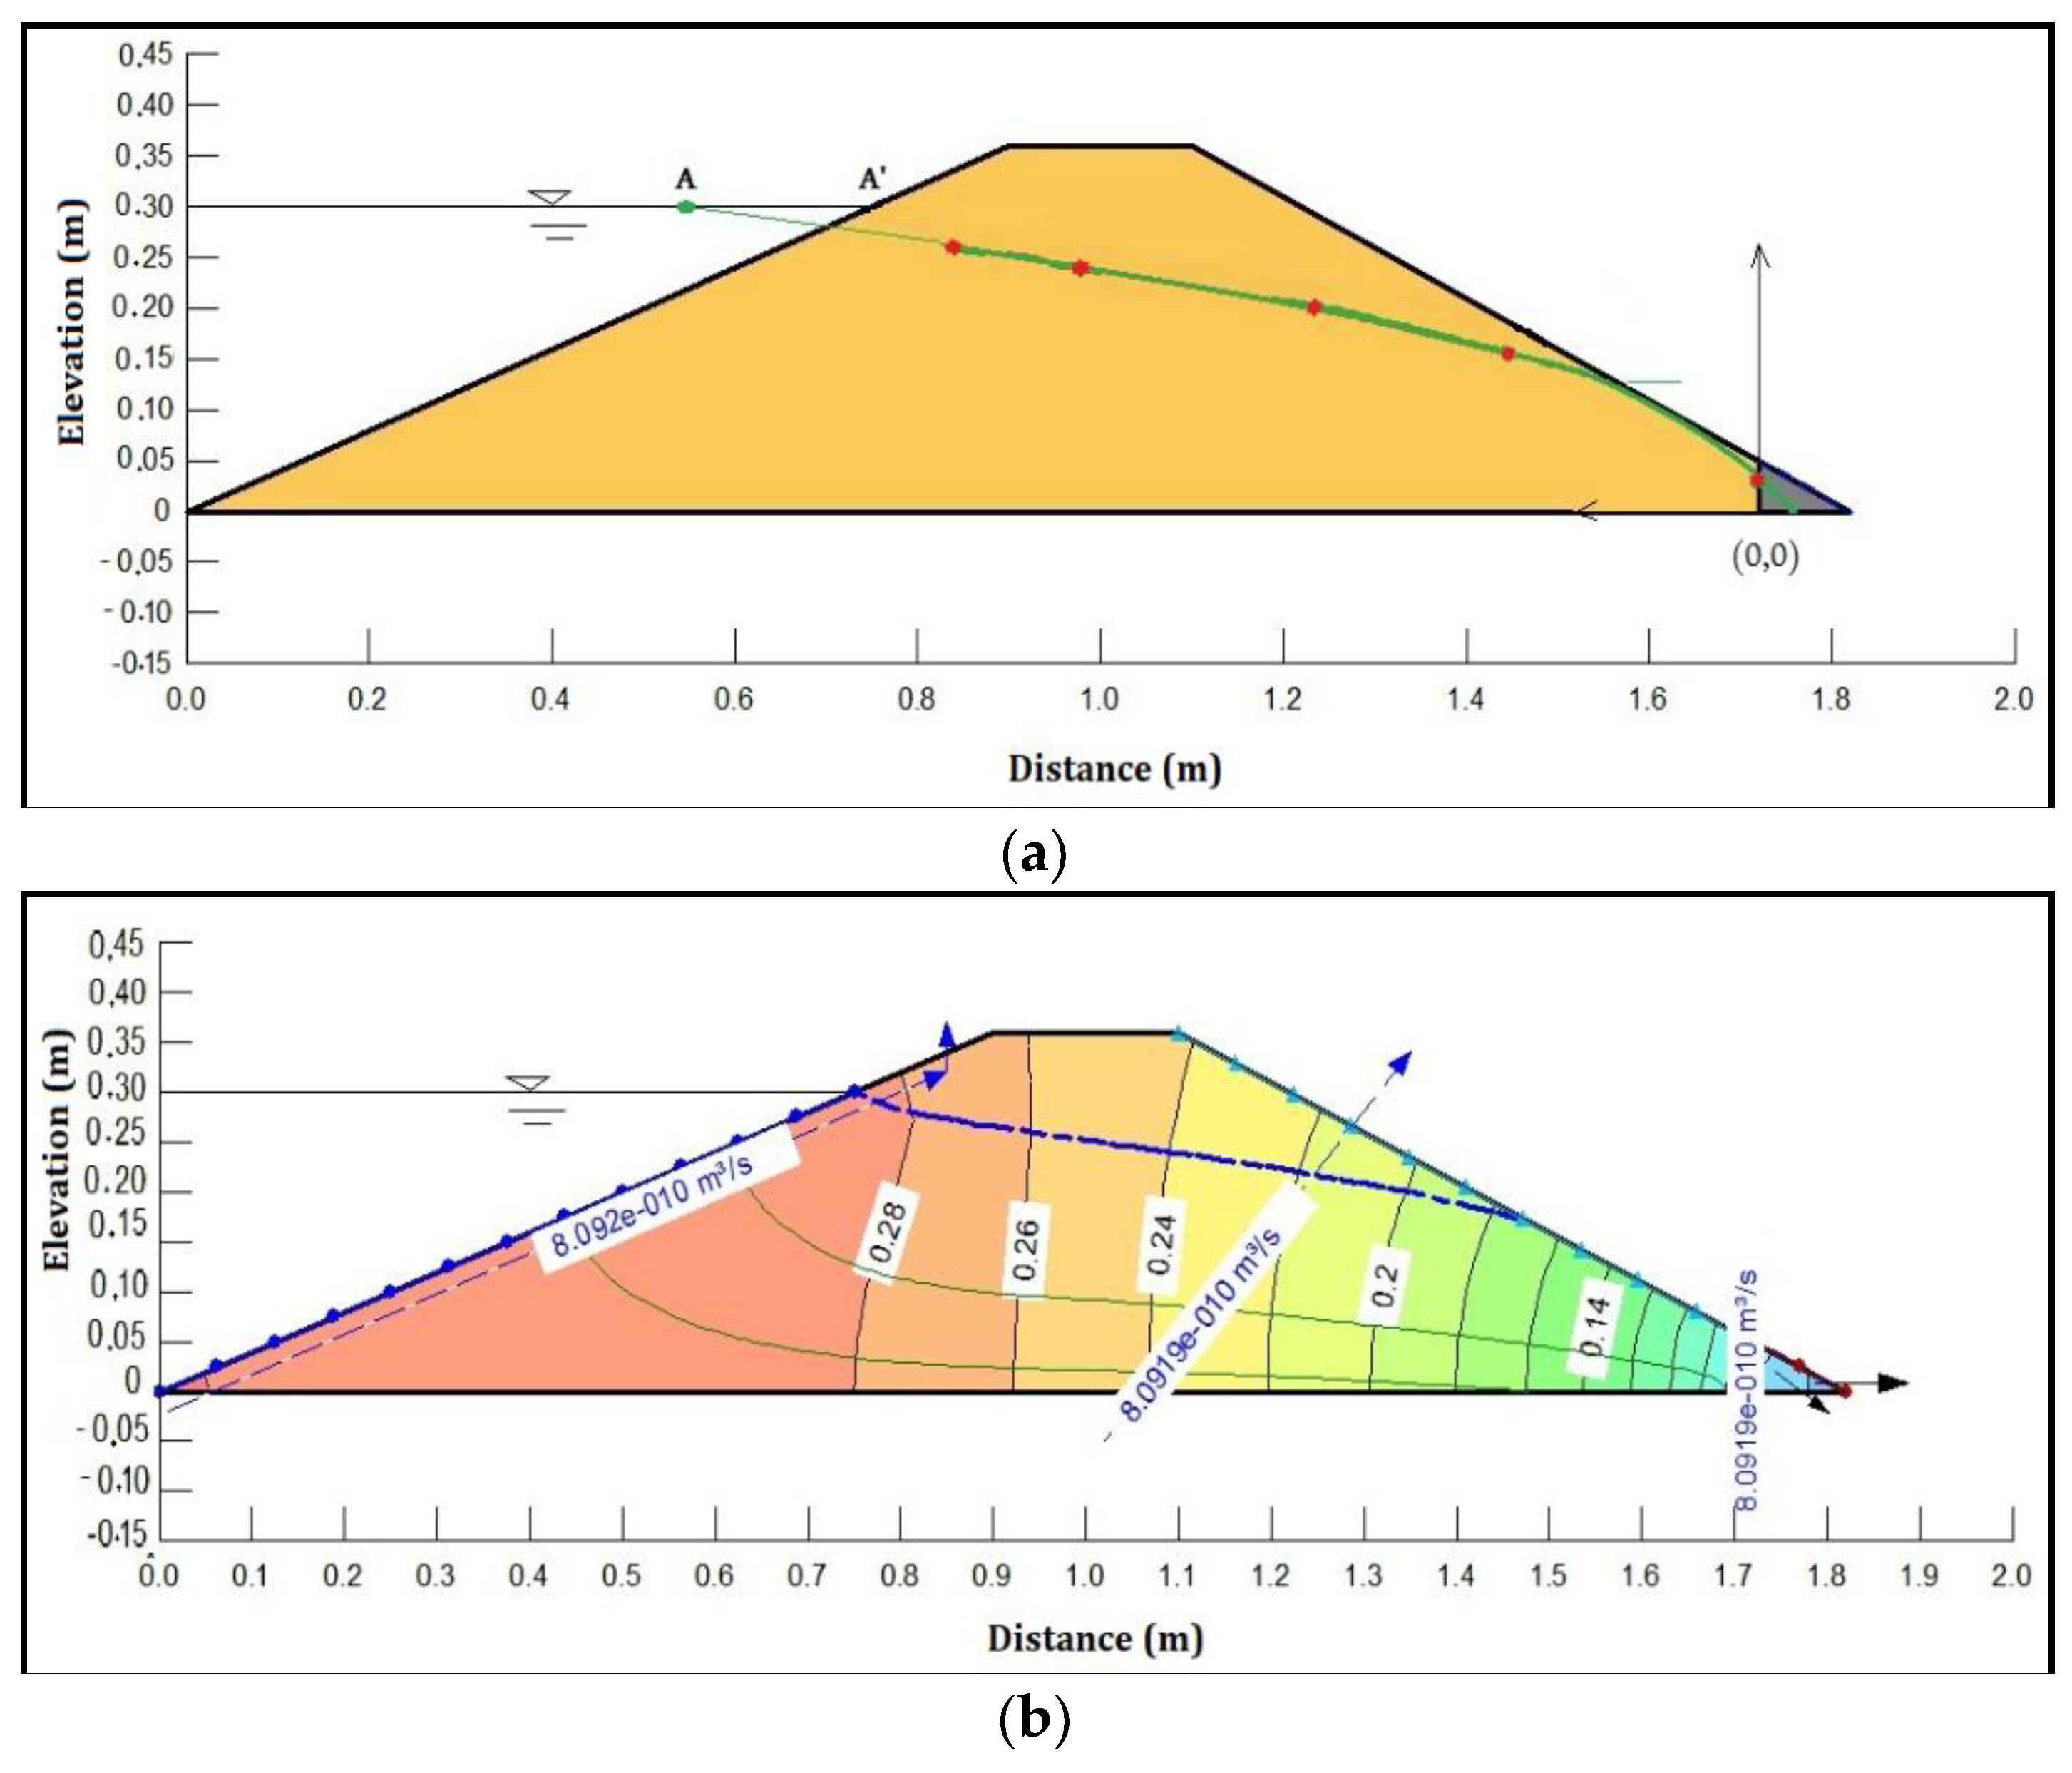
Mathematical calculations using L. Casagrande solutions showed that the seepage losses through the dam were q = 6.4588 × 10⁻¹⁰ and 1.2924 × 10⁻⁷ m3/s/m for well and low compacted soil, respectively, and the heights of phreatic line were 0.267, 0.243, 0.203 0.167, and 0.037 m for points located 0.82, 0.99, 1.23, 1.41, and 1.77 m from the heel of the dam, respectively (Figure 5a).
Figure 5b shows the seepage line, flux at different points, and the contours of the total head using the SEEP/W model. From Figure 5b, the seepage flow rate is q = 8.092 × 10⁻¹⁰ m3/s/m for well compacted soil. It is clear from Figure 5b that the seepage line touches the downstream face of the dam model between the distances of 1.46 to 1.7 m from the heel of the dam.
3.2. Earth-Fill Dam Model with Maximum Drain Length
For the dam model with maximum drain length, observations revealed that the heights of phreatic line were 0.21, 0.201, 0.146, and 0.118 m for holes located in 0.87, 0.9, 1.04, and 1.1 from the heel of the dam models, respectively, while the phreatic line remained within the drain after 1.2 m from the heel. Thus, the observations confirmed that using horizontal drains prevent seepage from exiting the downstream of the dam model. The total seepage flow through the model is 2.2222 × 10⁻⁷ (0.8 l/h) and the discharge of seepage is 4.441 × 10⁻⁷ m3/s/m.
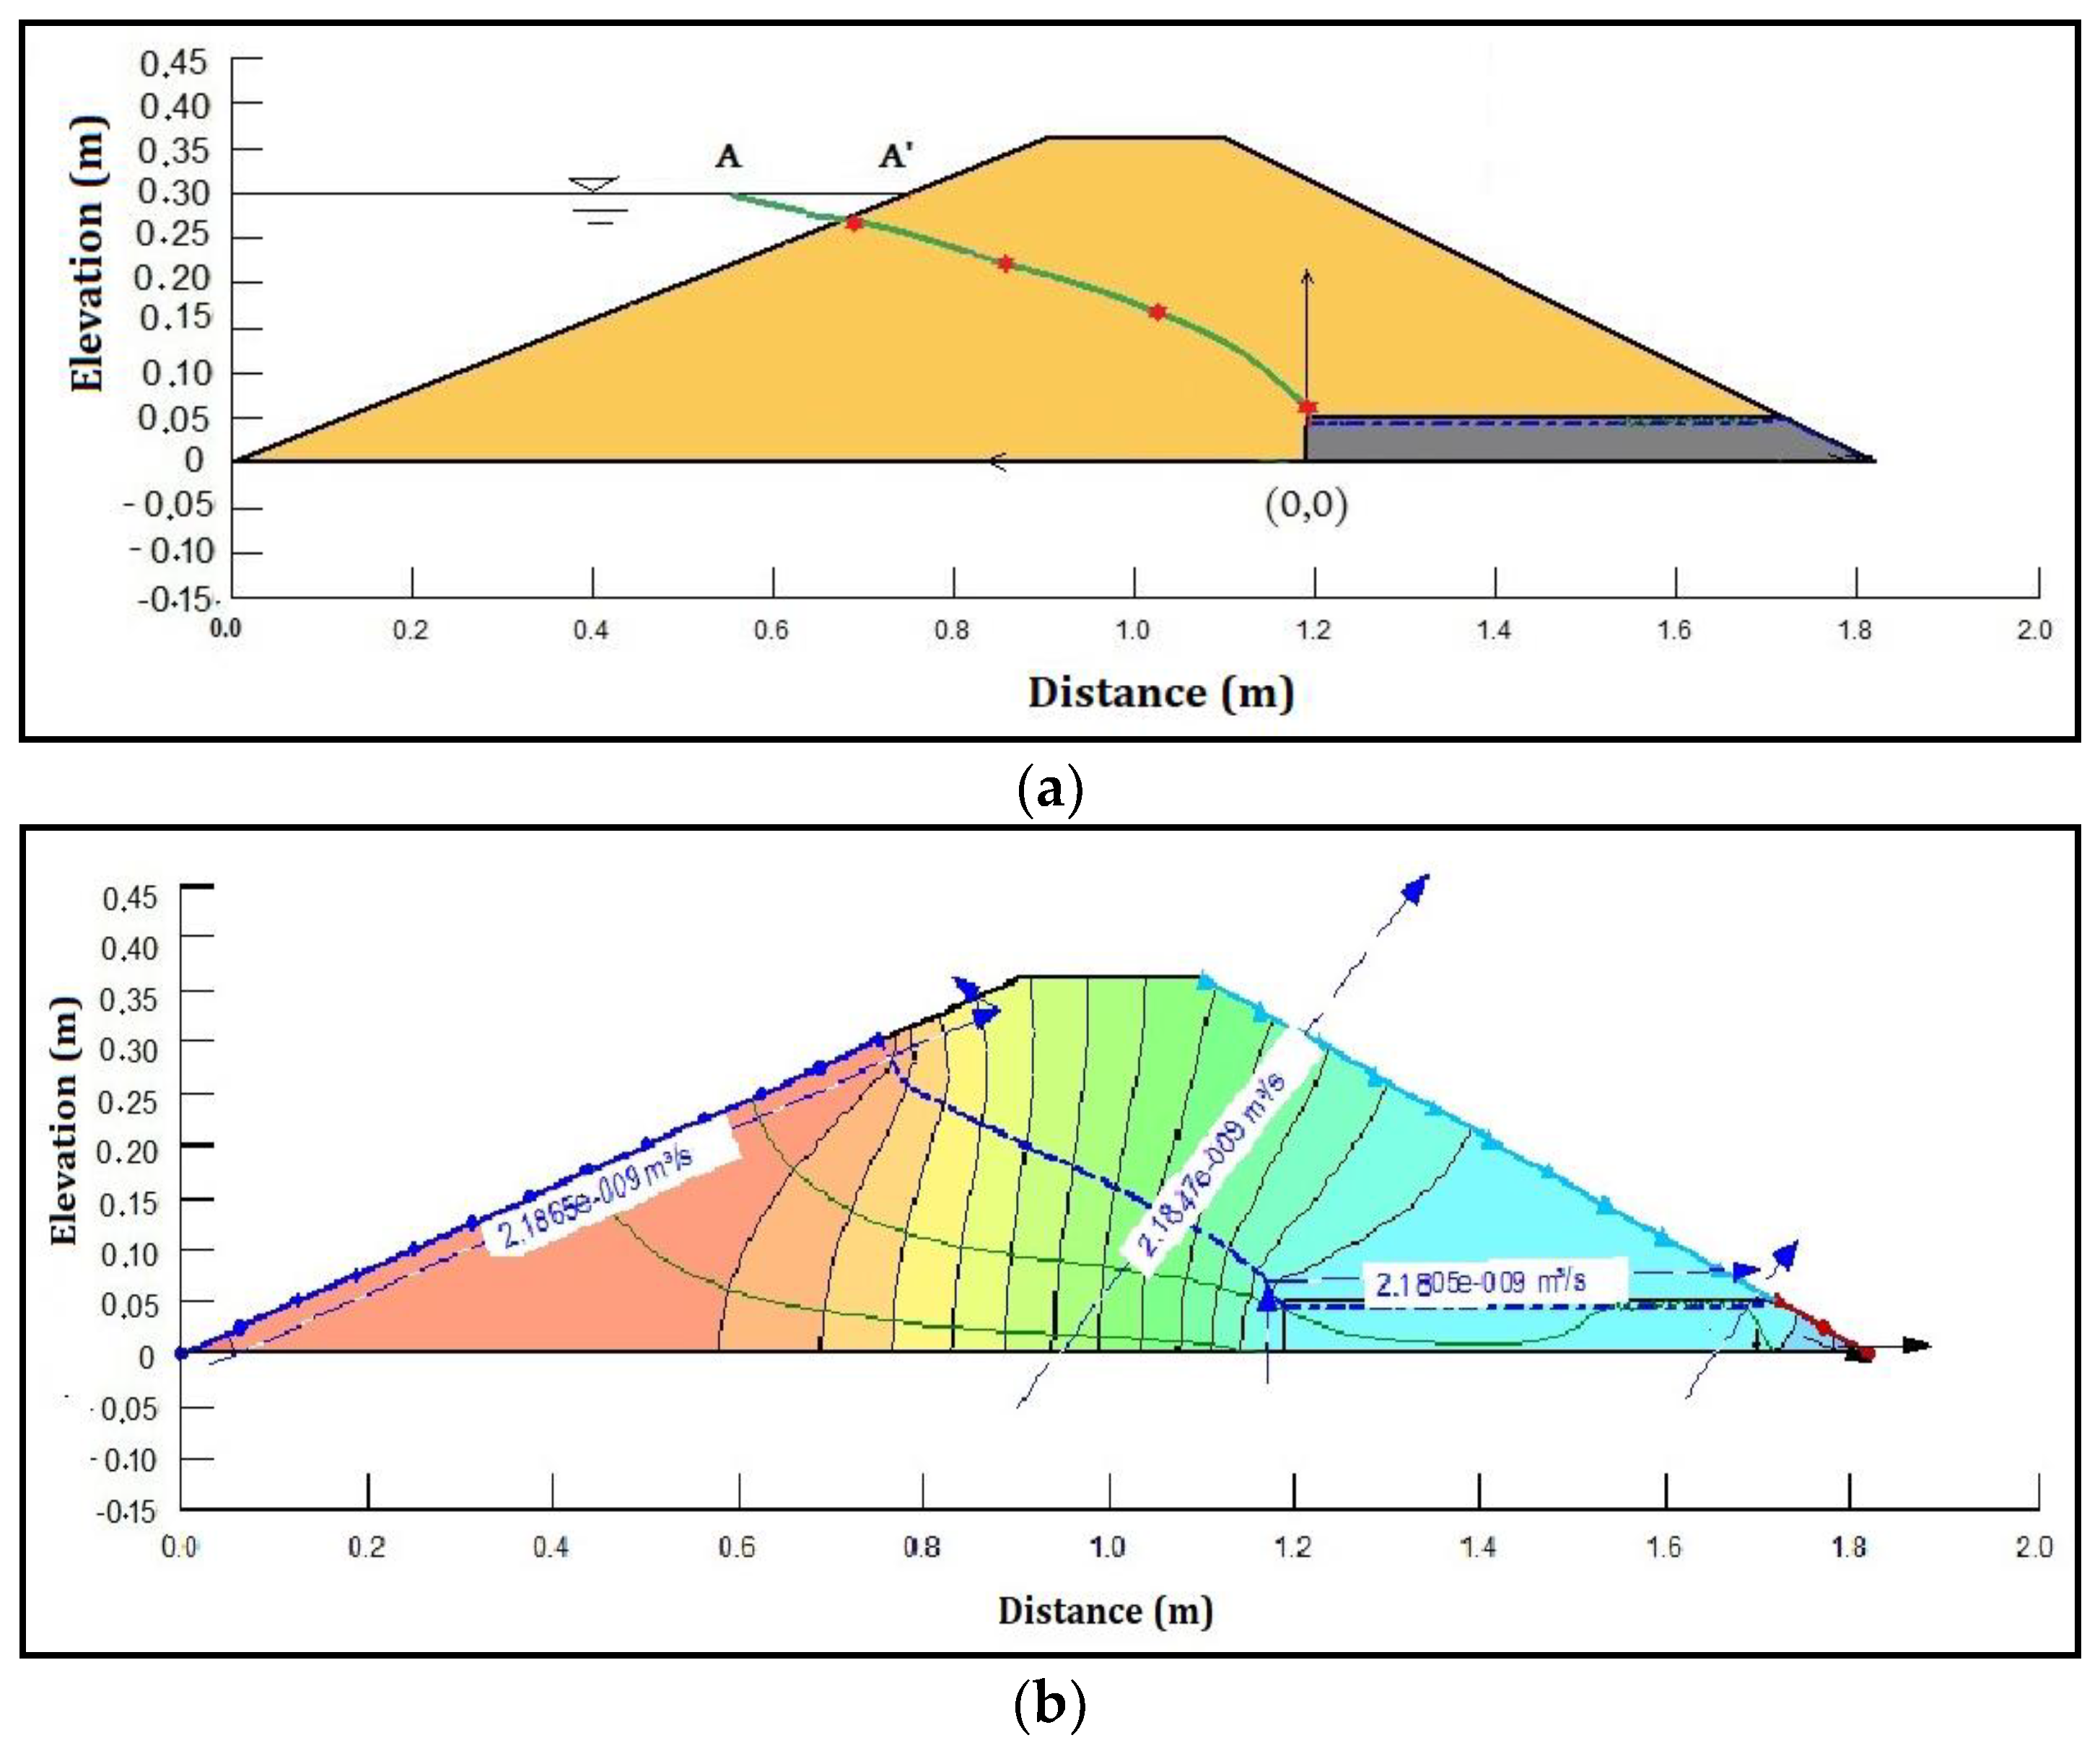
From L. Casagrande solutions, the seepage losses through the dam were q = 1.1259 × 10⁻⁹ and 2.253 × 10⁻⁷ m3/s/m for well and low compacted soil, respectively, and the height of phreatic line were 0.2717, 0.225, 0.1574, and 0.0645 m for points located 0.66, 0.84, 1.04, and 1.2 m from the heel of the dam respectively (Figure 6a).
The seepage line, flux, and the contours of the total head using the SEEP/W model are shown in Figure 6b, from which the seepage flow rate is q = 2.1847 × 10⁻⁹ m3/s/m for well compacted soil.
4. Discussion
4.1. Comparison of Results From Experimental, Mathematical, and Numerical Methods
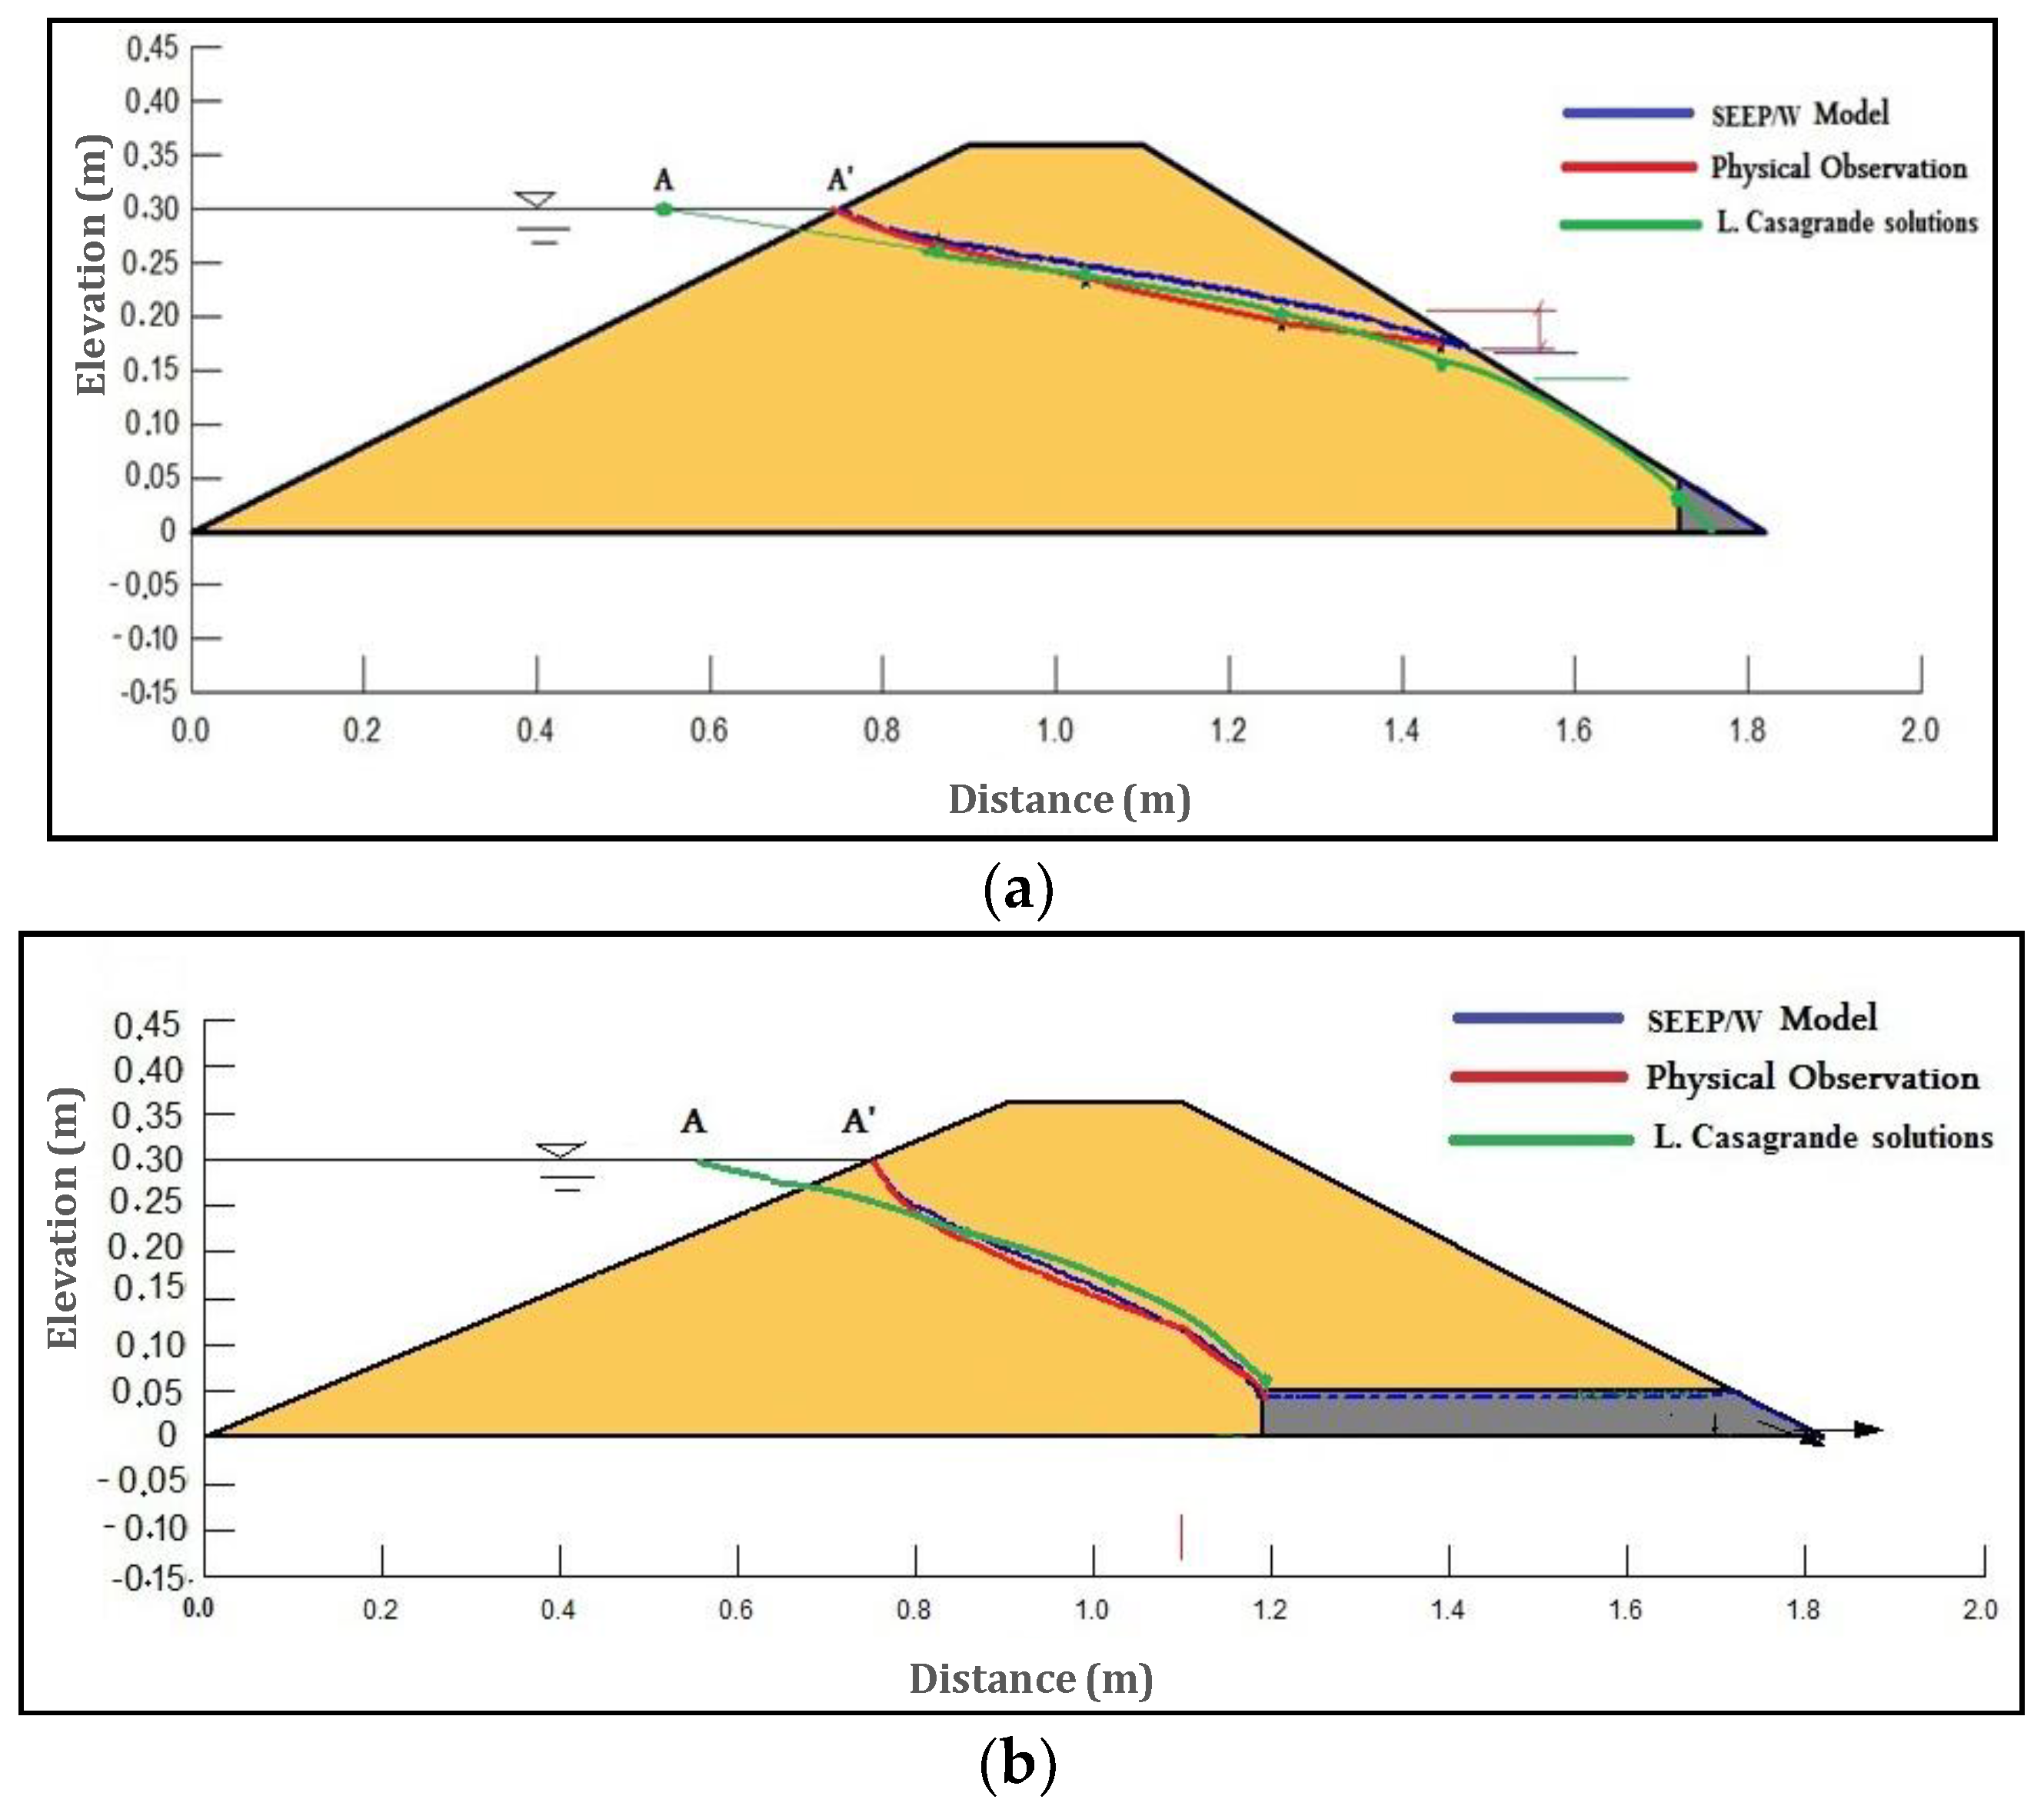
The phreatic line for seepage through the two physical models using the three methods is presented in Figure 7. The results revealed that both L. Casagrande solutions and the SEEP/W model have a plotted seepage line compatible with the observed seepage line.
The results of the seepage flow rate using the three methods are summarized in Table 1. As shown in the table, the seepage rate through the model with toe drain obtained from SEEP/W is close to that calculated by the L. Casagrande solution. However, the seepage rate observed from the physical model is higher than calculated with the other methods, even when considering low compacted soil. This difference in results indicates that when seepage flow intersects the downstream slope, water will exit the body of the dam and then follow the characteristics of surface water flow. Moreover, the intersection with downstream slope softens and weakens the soil mass, hence, increases the possibility of piping within the body of the physical dam model that eventually increases the total seepage rate.
For the model with horizontal drain, the seepage rate observed from the physical models is approximately the same as that obtained from SEEP/W and close to that calculated by the L. Casagrande solution when considering low compacted soil.
4.2. Example of Seepage Analysis using SEEP/W Models
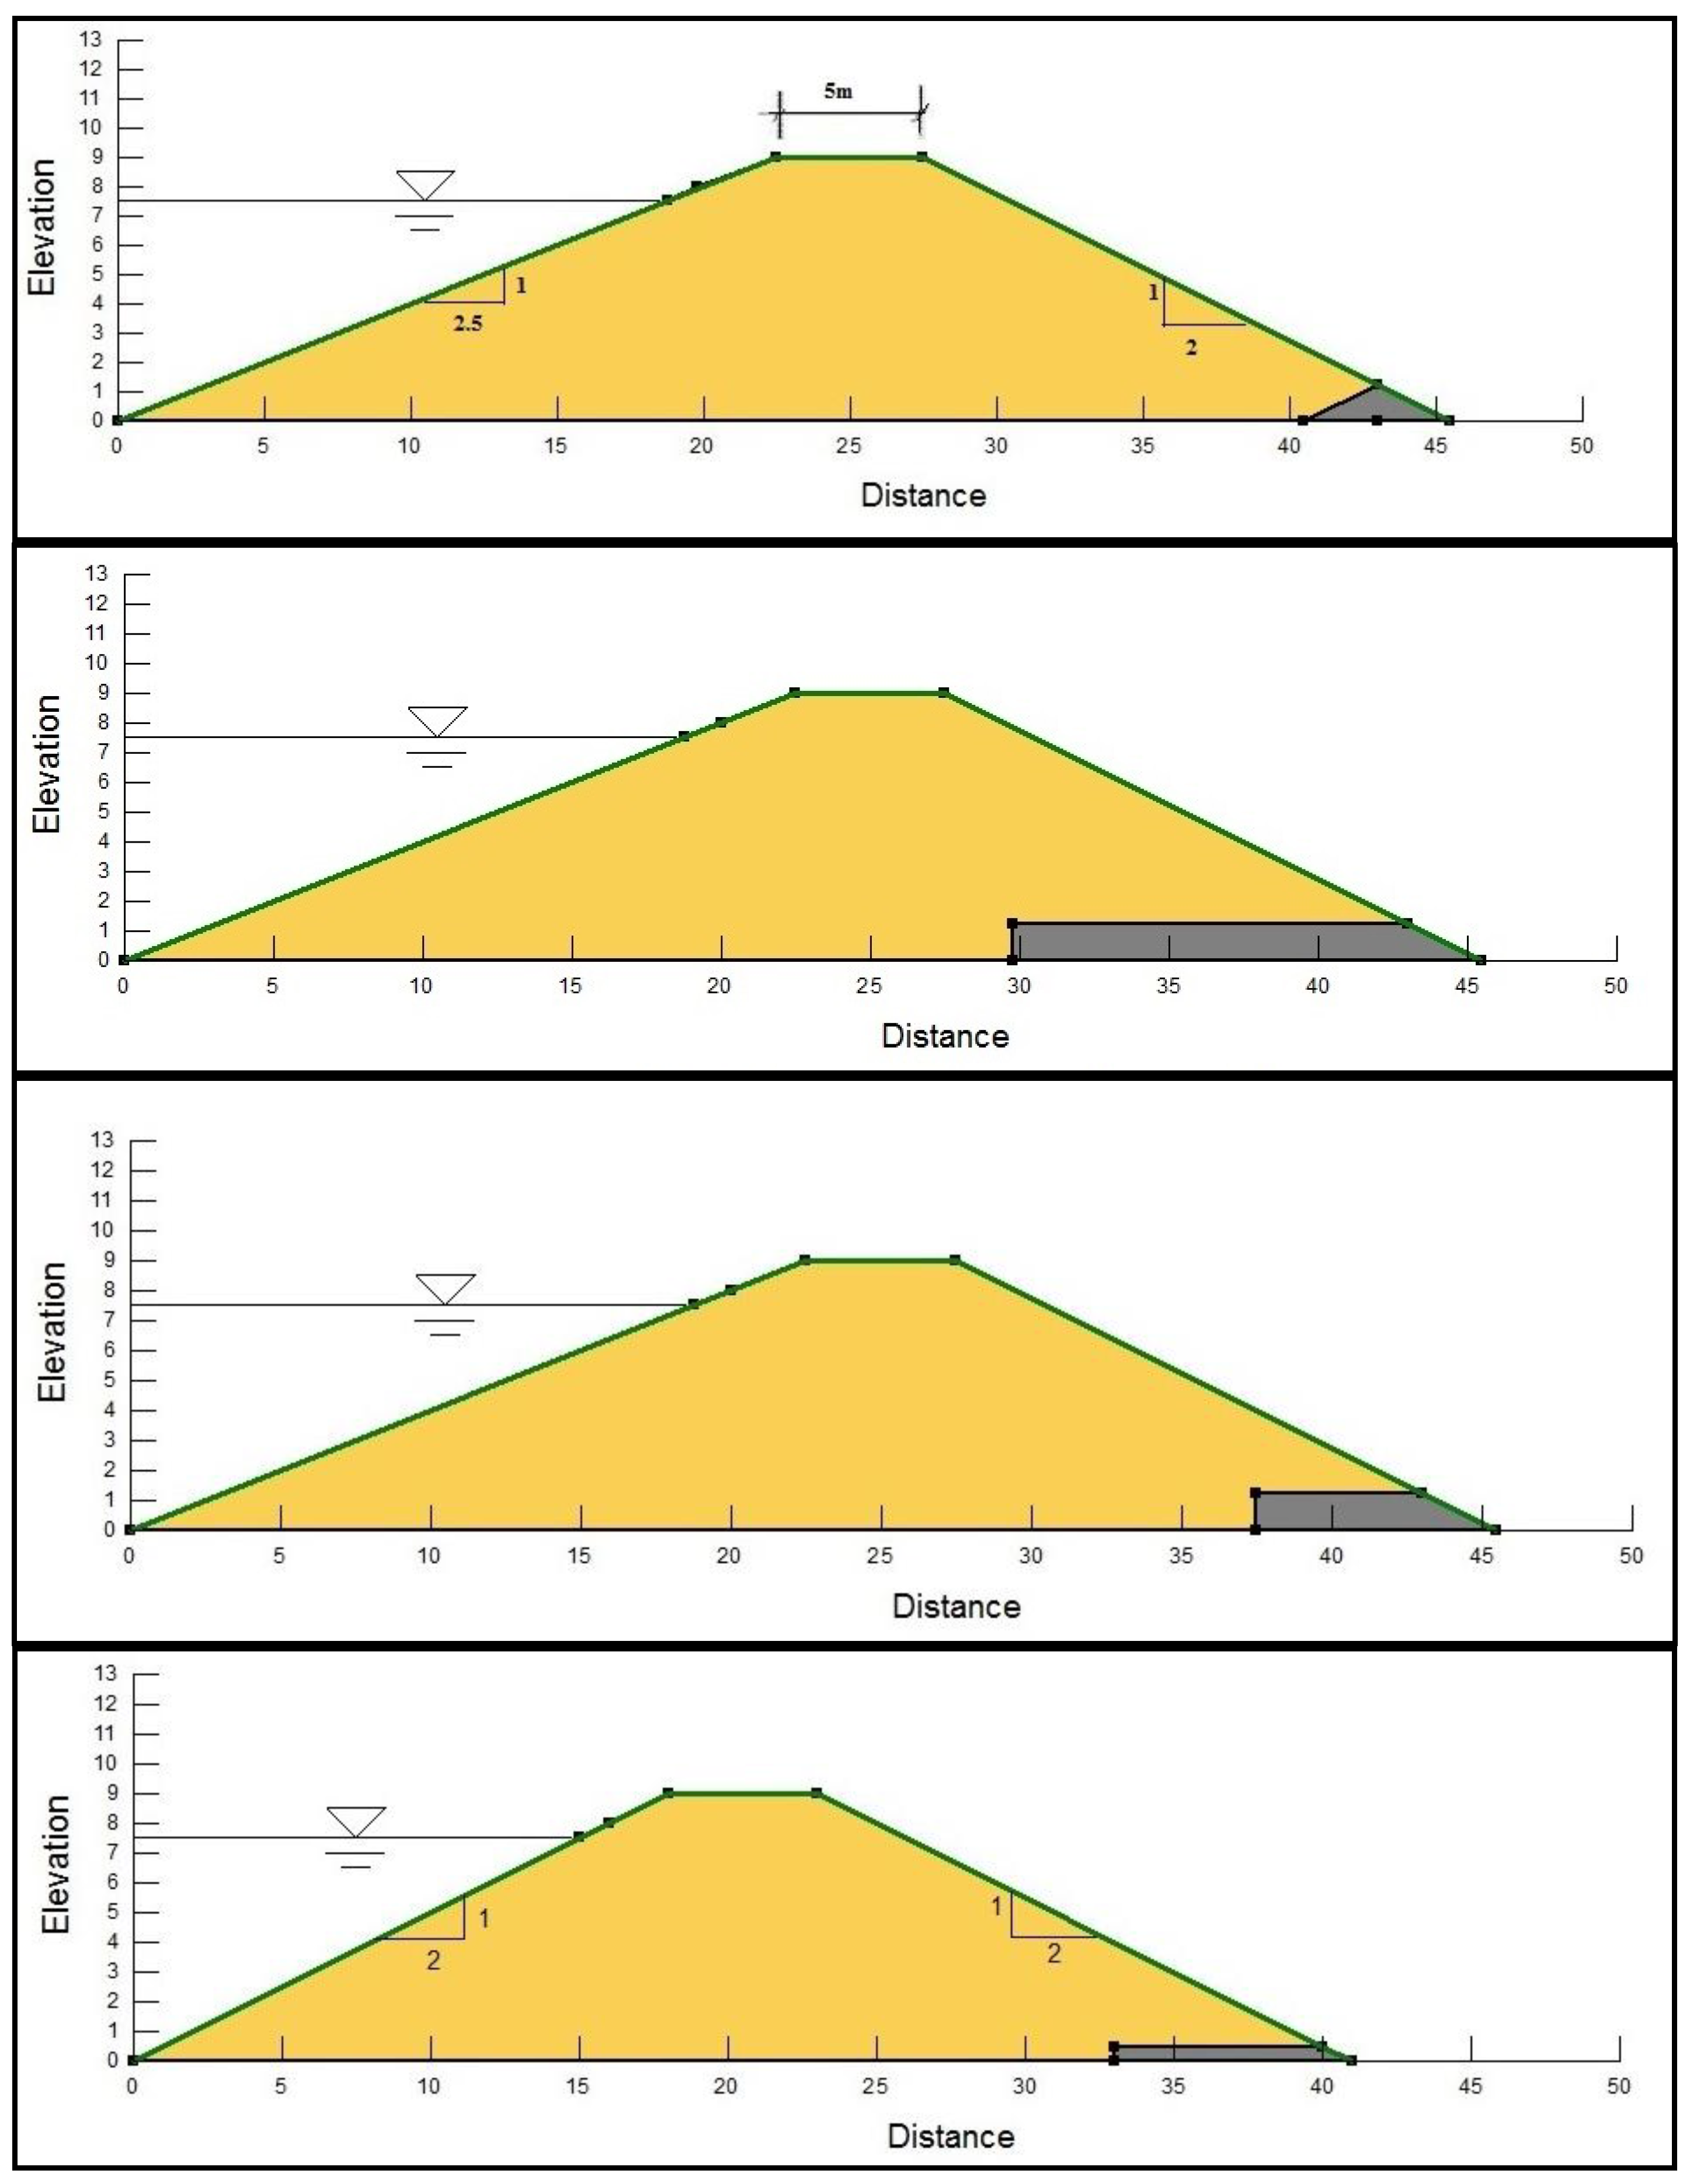
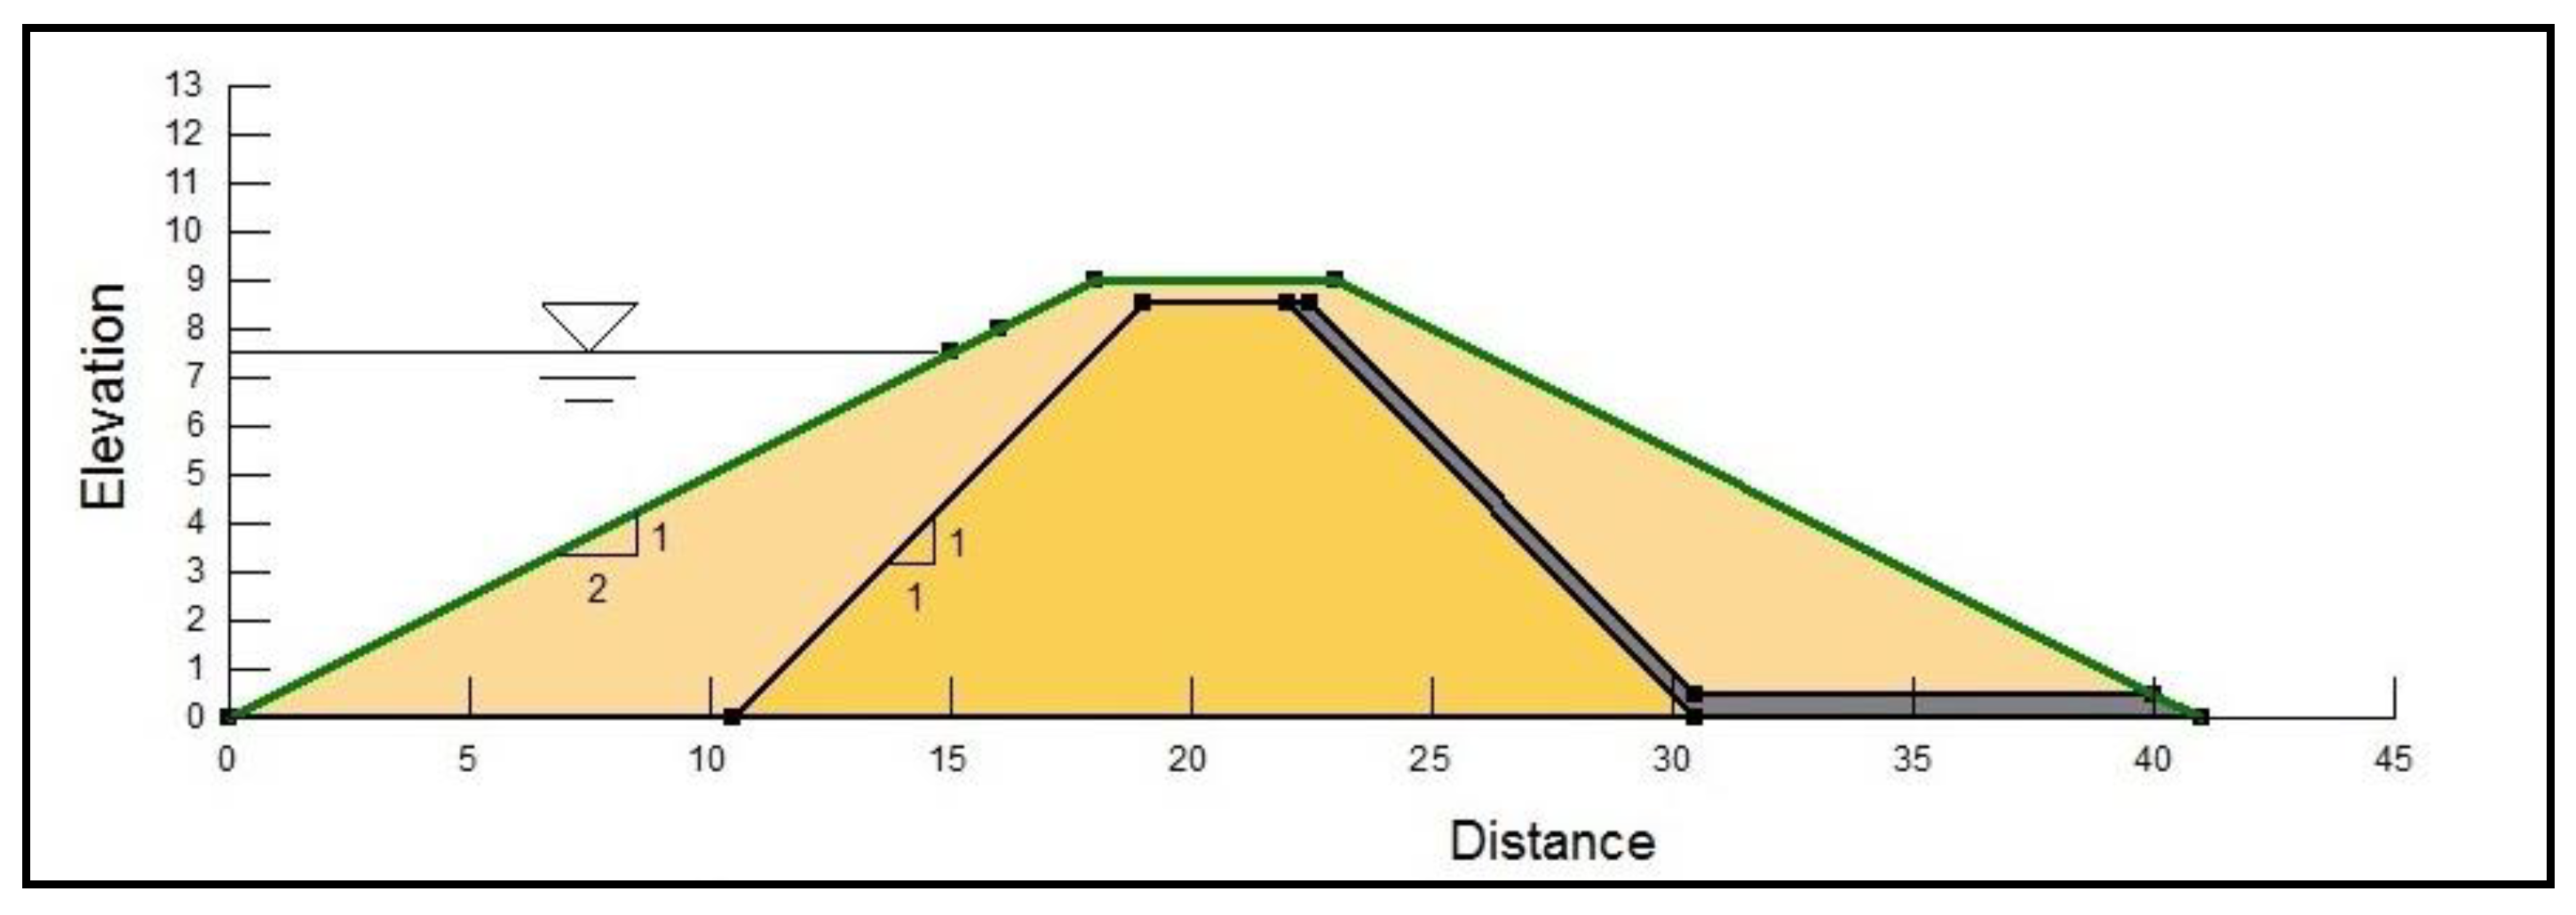
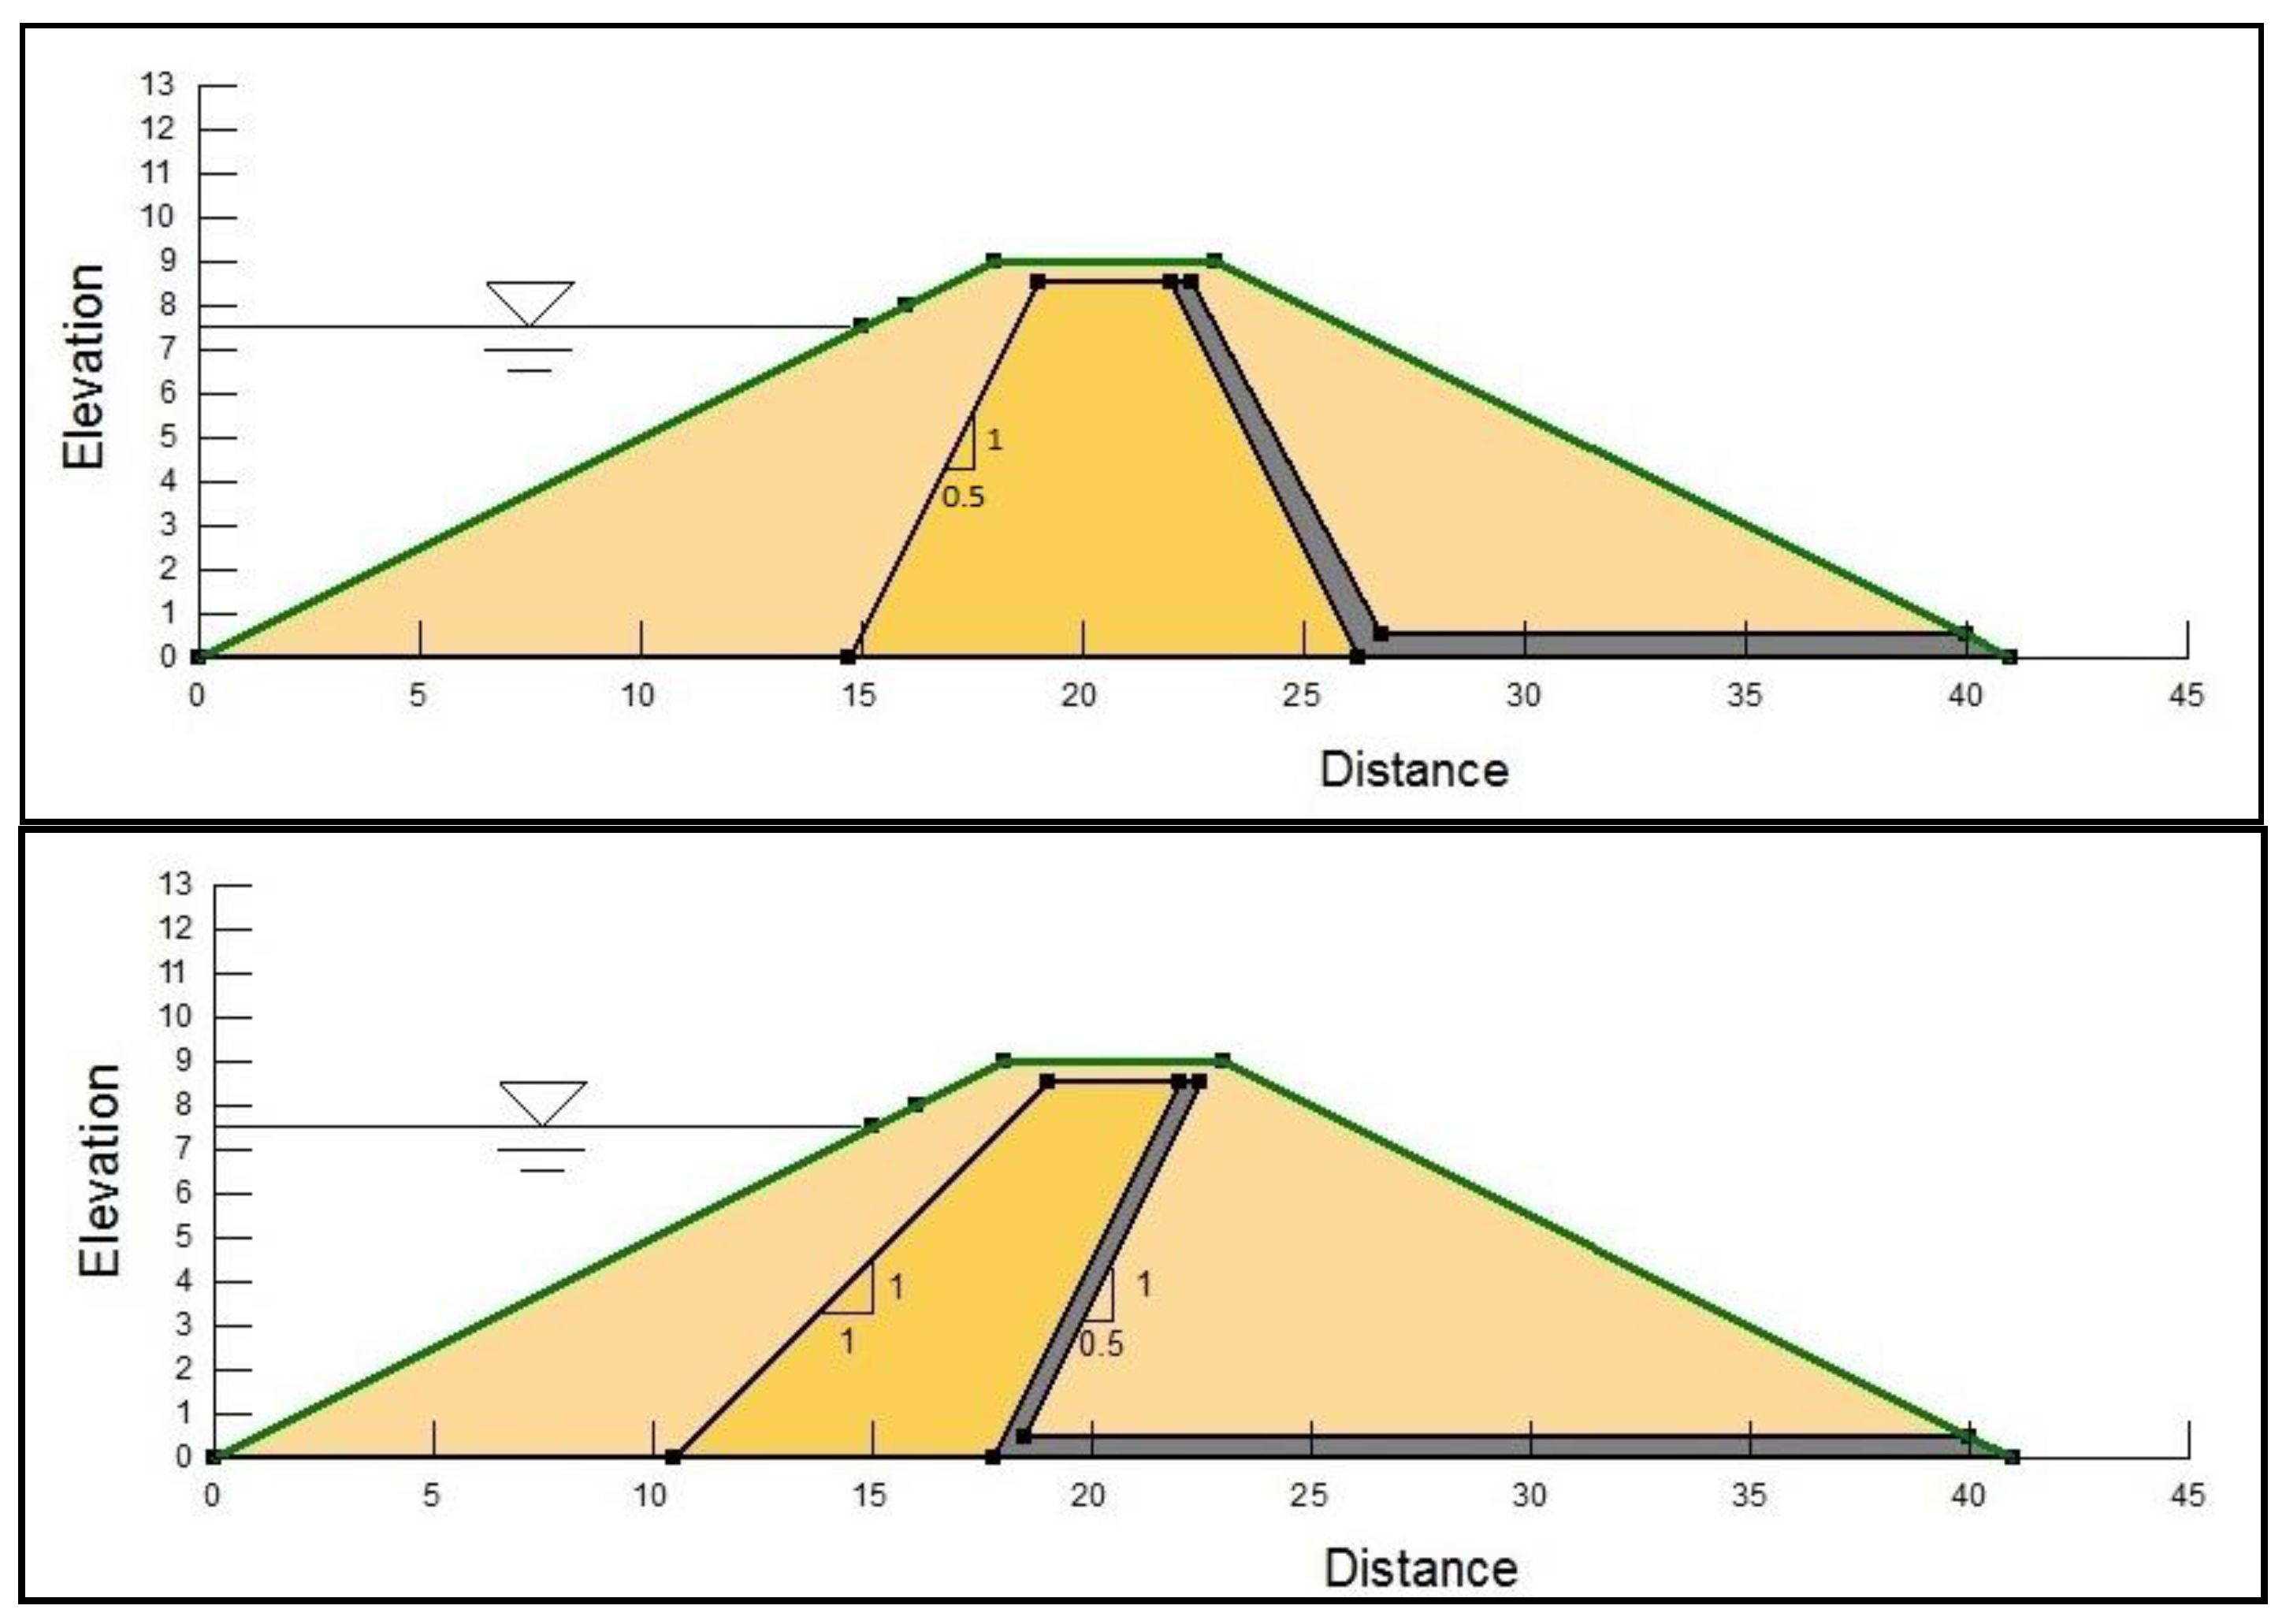
The SEEP/W model was used to study seepage through a theoretical case of an earth-fill dam. The study consisted of analyzing seepage behavior with a total of 34 test trails through seven different configurations of a dam with 9 m height in order to recommend the most appropriate configuration based on seepage behavior. The seven dam configurations consisted of four homogenous dams and three zoned dams (Figure 8 and Figure 9).
The four configurations of homogenous dams (Figure 8) consisted of toe drain, maximum length of horizontal drain of 16 m, minimum length of horizontal drain of 8 m, and medium length of horizontal drain of 12 m.
The three configurations of homogenous dams (Figure 9) consisted of a central core of 1:1 (H:V) for upstream (U/S) and downstream (D/S) slope, a central core of 1:0.5 (H:V) for upstream (U/s) and downstream (D/S) slope, and inclined cores of 1:1 and 1:0.5 (H:V) for upstream (U/S) and downstream (D/S) slope, respectively. Details of the seven configurations are presented in Table 2.
The soil conditions were similar to those of the physical model used in this study. The normal and maximum water level at the dam reservoir was assumed to be 7.5 and 8 m, respectively. The normal freeboard (NFB) is 1.5 m, however, both normal and maximum water level was assessed. For each homogenous configuration, seepage analysis was conducted for two deferent drainage thicknesses (i.e., 1.25 and 0.5 m) and at two upstream water levels (i.e., normal and maximum upstream water levels of 7.5 and 8 m, respectively), while for each zoned configurations, seepage analysis was conducted for three deferent shell material permeability (i.e., 10, 100, and 1000 times of core material permeability) and at two upstream water levels (i.e., normal and maximum upstream water levels).
Table 3 shows the summary of results from the homogenous dam models. From the table, models with toe drain should be ignored because the seepage line either intersects with the downstream slope or have a very small space. Therefore, SEEP/W was unable to calculate seepage rates correctly. Model (b) is not preferable, because the seepage flow rate is very high. Model (c) is the best as its downstream cover of seepage is sufficient and has the lower seepage flow rate. Moreover, a medium drain length with 0.5 m thickness is preferable compared with 1.25 m thickness, because it is easier to construct and the difference in flow rate between them is insignificant.
Table 4 shows the summary of results from zoned dam models. As shown in the table, inclined core contains the smallest cross section area of core, but the seepage flow rate is very high compared with other models. The seepage flow rate for a central core with a 1:0.5 slope is slightly higher than the central core with a 1:1 slope, but the difference in cross section area makes it preferable.
Based on the seepage analysis, it is concluded that if sufficient quantity of silty sand soil is available around the proposed dam location, homogenous earth-fill dam with medium drain length of 0.5 m thickness is the ideal design configuration. If there is not enough soil available, the zoned earth-fill dam with central core and 1:0.5 slope would be the optimum design criteria.
Although the physically based numerical methods have been certified capable of performing spatial and/or temporal simulation of certain systems, seepage flow through earth dams are still significantly affected by natural, random, and real-world conditions such as anisotropy and heterogeneity, thereby limiting their application. For instance, a dam’s hydraulic conductivity can experience a deviation from the designed value due to operation or construction-related problems. Such situation demands the use of physical-based models to determine the model inputs and the associated output predictions before introducing other simulation models. This case is particularly when there are not enough field data and thus an accurate prediction is desired when conceiving the physics [35,36].
5. Conclusions
The study of seepage through earth-fill dams is very important for constructed dams to ensure that the control of seepage is sufficient for the safe and sustainable operation of the dam. It is also important in the design and construction of new dams to ensure that the seepage through and under the dam will be well controlled. In this study, the experimental and numerical analyses of seepage through earth-fill dam models were conducted. Results from two physical models were compared with those obtained from L. Casagrande equations and the SEEP/W program. Comparisons revealed that the location of the seepage line obtained from the three methods was almost the same. Moreover, when the seepage flow intersects the downstream slope and piping takes place, using SEEP/W to calculate flow rate becomes useless as it cannot calculate the volume of water flow in pipes. This was revealed by the big difference in the results between physical and numerical models in the first physical model, while the results were compatible in the second physical model when the seepage line stayed within the body of dam and low compacted soil was adopted. The results have proven the importance of using horizontal drains to control the phreatic line position for the stability of earth dams, as touching the downstream slope would soften and weaken the soil mass and increase the potential piping. Seven different dam configurations at normal and maximum water levels have been studied (four homogenous and three zoned dams) to find the most appropriate configuration among them, according to seepage analysis. Seepage analysis revealed that if a sufficient quantity of silty sand soil is available around the proposed dam location, a homogenous earth-fill dam with medium drain length of 0.5 m thickness is the best design configuration. Otherwise, a zoned earth-fill dam with a central core and 1:0.5 (H:V) is recommended.
Author Contributions
Conceptualization, Z.M.Y., A.H.G., A.M.S.A.-J., Y.M.G., and N.A.-A.; Data curation, A.M.S.A.-J.; Formal analysis, Z.M.Y., A.M.S.A.-J., Y.M.G., H.A.A., and N.A.-A.; Investigation, Z.M.Y., A.H.G., A.M.S.A.-J., and Y.M.G.; Methodology, A.M.S.A.-J.; Project administration, Z.M.Y.; Resources, A.H.G.; Supervision, A.H.G., Y.M.G., and N.A.-A.; Validation, A.M.S.A.-J. and H.A.A.; Visualization, A.M.S.A.-J., Y.M.G., and H.A.A.; Writing—original draft, Z.M.Y., A.H.G., A.M.S.A.-J., Y.M.G., H.A.A., and N.A.-A.; Writing—review and editing, Z.M.Y., A.H.G., A.M.S.A.-J., Y.M.G., H.A.A., and N.A.-A. All authors have read and agreed to the published version of the manuscript.
Funding
This research received no external funding.
Conflicts of Interest
The authors declare no conflicts of interest.
References
- Graf, W.L. Dam nation: A geographic census of american dams and their large-scale hydrologic impacts. Water Resour. Res. 1999. [Google Scholar] [CrossRef]
- Sayl, K.N.; Muhammad, N.S.; Yaseen, Z.M.; El-Shafie, A. Estimation the Physical Variables of Rainwater Harvesting System Using Integrated GIS-Based Remote Sensing Approach. Water Resour. Manag. 2016, 30, 3299–3313. [Google Scholar] [CrossRef]
- Yener Ozkan, M. A review of considerations on seismic safety of embankments and earth and rock-fill dams. Soil Dyn. Earthq. Eng. 1998. [Google Scholar] [CrossRef]
- Chahar, B.R. Determination of Length of a Horizontal Drain in Homogeneous Earth Dams. J. Irrig. Drain. Eng. 2004, 130, 530–536. [Google Scholar] [CrossRef]
- Yaseen, Z.M.; Ameen, A.M.S.; Aldlemy, M.S.; Ali, M.; Abdulmohsin Afan, H.; Zhu, S.; Sami Al-Janabi, A.M.; Al-Ansari, N.; Tiyasha, T.; Tao, H. State-of-the Art-Powerhouse, Dam Structure, and Turbine Operation and Vibrations. Sustainability 2020, 12, 1676. [Google Scholar] [CrossRef] [Green Version]
- Richards, K.S.; Reddy, K.R. Critical appraisal of piping phenomena in earth dams. Bull. Eng. Geol. Environ. 2007. [Google Scholar] [CrossRef]
- Calamak, M.; Yanmaz, A.M. Probabilistic assessment of slope stability for earth-fill dams having random soil parameters. In Proceedings of the 5th IAHR International Symposium on Hydraulic Structures, Brisbane, Australia, 25–28 September 2014; Engineers Australia: Barton, Australia, 2014. [Google Scholar]
- Athani, S.S.; Solanki, C.H.; Dodagoudar, G.R. Seepage and Stability Analyses of Earth Dam Using Finite Element Method. Aquat. Procedia 2015. [Google Scholar] [CrossRef]
- Fell, R.; Wan, C.F.; Cyganiewicz, J.; Foster, M. Time for development of internal erosion and piping in embankment dams. J. Geotech. Geoenviron. Eng. 2003. [Google Scholar] [CrossRef]
- Özer, A.T.; Bromwell, L.G. Stability assessment of an earth dam on silt/clay tailings foundation: A case study. Eng. Geol. 2012. [Google Scholar] [CrossRef]
- Riahi-Madvar, H.; Dehghani, M.; Akib, S.; Shamshirband, S.; Chau, K. Developing a mathematical framework in preliminary designing of detention rockfill dams for flood peak reduction. Eng. Appl. Comput. Fluid Mech. 2019. [Google Scholar] [CrossRef]
- Al-Janabi, A.M.S.; Ghazali, A.H.; Yusuf, B.; Mohammed, T.A. Permeable channel cross section for maximizing stormwater infiltration and seepage rates. J. Irrig. Drain. Eng. 2018, 144. [Google Scholar] [CrossRef]
- Erfeng, Z.; Ji, L.; Yufeng, J. The seepage evolution law under the fault creep in right bank of Longyangxia Dam. Eng. Fail. Anal. 2014. [Google Scholar] [CrossRef]
- Jassam, M.G.; Abdulrazzaq, S.S. Theoretical Analysis of Seepage through Homogeneous and Non-homogeneous Saturated-Unsaturated Soil. J. Eng. 2019, 25, 52–67. [Google Scholar] [CrossRef] [Green Version]
- Kermani, E.; Barani, G. Seepage Analysis through Earth Dam Based on Finite Difference Method. J. Basic Appl. Sci. Res. 2012, 2, 11621–11625. [Google Scholar]
- Al-Janabi, A.M.S. Study of Seepage through Earth-Fill Dam Using Physical and Numerical Models. Master’s Thesis, University Putra Malaysia, Seri Kembangan, Malaysia, 2013. [Google Scholar]
- Phatak, D.R.; Pathak, S.R.; Birid, K.C. Estimation of Phreatic Line Using Dimensional Analysis. In Proceedings of the Fifth International Conference on Case Histories in Geotechnical Engineering, New York, NY, USA, 13–17 April 2004. [Google Scholar]
- Stello, M.W. Seepage Charts for Homogeneous and Zoned Embankments. J. Geotech. Eng. 1987, 113, 996–1012. [Google Scholar] [CrossRef]
- Casagrande, A. Seepage Through Dams. J. N. Engl. Water Works Assoc. 1937, 1, 131–172. [Google Scholar]
- Chen, S.; Zhong, Q.; Cao, W. Breach mechanism and numerical simulation for seepage failure of earth-rock dams. Sci. China Technol. Sci. 2012. [Google Scholar] [CrossRef]
- Cho, S.E. Probabilistic analysis of seepage that considers the spatial variability of permeability for an embankment on soil foundation. Eng. Geol. 2012. [Google Scholar] [CrossRef]
- Mansuri, B.; Salmasi, F. Effect of Horizontal Drain Length and Cutoff Wall on Seepage and Uplift Pressure in Heterogeneous Earth Dam with Numerical Simulation. J. Civil Eng. Urban. 2013, 3, 114–121. [Google Scholar]
- Alekseevich, A.N.; Sergeevich, A.A. Numerical modelling of tailings dam thermal-seepage regime considering phase transitions. Model. Simul. Eng. 2017. [Google Scholar] [CrossRef] [Green Version]
- Sivakumar, G.L.; Vasudevan, A.K. Seepage velocity and piping resistance of coir fiber mixed soils. J. Irrig. Drain. Eng. 2008. [Google Scholar] [CrossRef]
- Hofmann, J.R.; Hofmann, P.A. Darcy’ s Law and Structural Explanation in Hydrology. In PSA: Proceedings of the Biennial Meeting of the Philosophy of Science Association; The University of Chicago Press: Chicago, IL, USA, 1992; Volume 1, pp. 23–35. [Google Scholar]
- Sherard, J.L.; Woodward, R.J.; Gizienski, S.J. Earth and Earth Rock Dams: Engineering Problems of Design and Construction; John Wiley & Sons Inc: Hoboken, NJ, USA, 1963; ISBN 9780471785477. [Google Scholar]
- Das, B.M. Advanced Soil Mechanics, 5th ed.; CRC Press: Boca Raton, FL, USA, 2019; ISBN 9781351215176. [Google Scholar]
- Malekpour, A.; Farsadizadeh, D.; Hosseinzadeh Dalir, A.; Sadrekarimi, J. Effect of horizontal drain size on the stability of an embankment dam in steady and transient seepage conditions. Turk. J. Eng. Environ. Sci. 2012, 36, 139–152. [Google Scholar] [CrossRef]
- Vaskinn, K.A.; Løvoll, A.; Höeg, K.; Morris, M.; Hanson, G.J.; Hassan, M.A. Physical modeling of breach formation: Large scale field tests. Prec. Dam Saf. 2004, 1–16. Available online: https://pdfs.semanticscholar.org/29c4/fc2938493ad843240e87a6a63e9d1633847b.pdf (accessed on 22 March 2020).
- Chahar, B.R.; Graillot, D.; Gaur, S. Storm-Water Management through Infiltration Trenches. J. Irrig. Drain. Eng. 2012, 138, 274–281. [Google Scholar] [CrossRef] [Green Version]
- Abdul Jabbar Jamel, A.; Ibrahim Ali, M. Influence of Cavity Under Hydraulic Structures on Seepage Characteristics. Int. J. Eng. Technol. 2018, 7, 461. [Google Scholar] [CrossRef]
- Ullah, A.; Kassim, A.; Alam, I.; Junaid, M.; Ahmad, I.S. Efficiency analysis of seepage of Baz Ali small dam, Kurram Agency using clay blanket and cut-off wall with sand filter. Bull. Geol. Soc. Malays. 2019, 67, 113–118. [Google Scholar] [CrossRef]
- Chahar, B.R. Closure to “Determination of Length of a Horizontal Drain in Homogeneous Earth Dams” by Bhagu R. Chahar. J. Irrig. Drain. Eng. 2006, 132, 89–90. [Google Scholar] [CrossRef]
- Casagrande, A. Seepage through dams. Natl. Acad. Sci. Eng. Med. 1937, 51, 131–172. [Google Scholar]
- Pham-Van, S.; Hinkelmann, R.; Nehrig, M.; Martinez, I. A comparison of model concepts and experiments for seepage processes through a dike with a fault zone. Eng. Appl. Comput. Fluid Mech. 2011. [Google Scholar] [CrossRef]
- Yaseen, Z.M.; Sulaiman, S.O.; Deo, R.C.; Chau, K.-W. An enhanced extreme learning machine model for river flow forecasting: State-of-the-art, practical applications in water resource engineering area and future research direction. J. Hydrol. 2018, 569, 387–408. [Google Scholar] [CrossRef]
Figure 1.
L. Casagrande’s solution for flow through an earth dam [27].
Figure 1.
L. Casagrande’s solution for flow through an earth dam [27].

Figure 2.
Earth-fill dam models inside the rectangular tanks.

Figure 3.
The cross-sections of the physical earth-fill dam models: (a) model with toe drain, (b) model with maximum drain length.
Figure 3.
The cross-sections of the physical earth-fill dam models: (a) model with toe drain, (b) model with maximum drain length.


Figure 4.
Seepage line touches the downstream slope of the model with toe drain.

Figure 5.
(a) Seepage phreatic line for the model with toe drain using the Casagrande method, (b) seepage line, flux at different points, and the contours of the total head for the model with toe drain, using the SEEP/W model.
Figure 5.
(a) Seepage phreatic line for the model with toe drain using the Casagrande method, (b) seepage line, flux at different points, and the contours of the total head for the model with toe drain, using the SEEP/W model.

Figure 6.
(a) Seepage phreatic line for the model with horizontal drain using the L. Casagrande method, (b) seepage line, flux at different points, and the contours of the total head for the model with horizontal drain, using the SEEP/W model.
Figure 6.
(a) Seepage phreatic line for the model with horizontal drain using the L. Casagrande method, (b) seepage line, flux at different points, and the contours of the total head for the model with horizontal drain, using the SEEP/W model.

Figure 7.
The phreatic line using the three methods: (a) model with toe drain, (b) model with horizontal drain.
Figure 7.
The phreatic line using the three methods: (a) model with toe drain, (b) model with horizontal drain.

Figure 8.
Cross section of the homogenous dam configurations.

Figure 9.
Cross section of the zoned dam configurations.


Table 1.
Seepage flow rate using the three methods.
| Models | q (m3/s/m) | ||||
|---|---|---|---|---|---|
| Physical | L. Casagrande | SEEP/W | |||
| Well Compacted | Low Compacted | Well Compacted | Low Compacted | ||
| Toe drain | 1.277 × 10⁻⁶ | 6.459 × 10⁻¹⁰ | 1.292 × 10⁻⁷ | 8.092 × 10⁻¹⁰ | 1.621 × 10⁻⁷ |
| Horizontal drain | 4.441 × 10⁻⁷ | 1.126 × 10⁻⁹ | 2.253 × 10⁻⁷ | 2.185 × 10⁻⁹ | 4.373 × 10⁻⁷ |
Table 2.
Details of the seven configurations of the earth-fill dam.
| Design Details | Configuration | ||||||
|---|---|---|---|---|---|---|---|
| (a) | (b) | (c) | (d) | (e) | (f) | (g) | |
| Type | Homogenous | Zoned | |||||
| Height (m) | 9 | 9 | 9 | 9 | 9 | 9 | 9 |
| Crest W(m) | 5 | 5 | 5 | 5 | 5 | 5 | 5 |
| NFB (m) | 1.5 | 1.5 | 1.5 | 1.5 | 1.5 | 1.5 | 1.5 |
| U/S Slope (H:V) | 2.5:1 | 2.5:1 | 2.5:1 | 2:1 | 2:1 | 2:1 | 2:1 |
| D/S Slope (H:V) | 2:1 | 2:1 | 2:1 | 2:1 | 2:1 | 2:1 | 2:1 |
| Dam Material | ========== Silty sand ========== | - | |||||
| Shell | - | - | - | - | ===== Sand or gravel ===== | ||
| Core | - | - | - | - | ======= Silty sand ======= | ||
| Core type | - | - | - | - | Central | Central | Inclined |
| Core slope | - | - | - | - | 1:1 | 1:0.5 | 1:1 U/S 1:0.5 D/S |
| Core height | - | - | - | - | 8.5 | 8.5 | 8.5 |
| Core Crest | - | - | - | - | 3 | 3 | 3 |
| Type of drainage | Toe drain | Horizontal /Blanket (thickness of 1.25 and 0.5 m) | Chimney and horizontal | ||||
| LMax = 16 m | LMin = 8 m | LMid = 12 m | |||||
Table 3.
Details of seepage lines and rates from homogenous models.
| Models | Drain Details | Normal Water Level | Maximum Water Level | ||
|---|---|---|---|---|---|
| Seepage Line | Seepage q (m3/s/m) | Seepage line | Seepage q (m3/s/m) | ||
| a | Small toe drain (L = 2.5m) | Intersected | 3.817 × 10⁻⁶ | Intersected | 3.265 × 10⁻⁶ |
| Toe drain (L = 5.0 m) | Small space | 4.395 × 10⁻⁶ | Small space | 4.695 × 10⁻⁶ | |
| b | Drainage thickness = 1.25 m | OK | 7.55 × 10⁻⁶ | OK | 9.244 × 10⁻⁶ |
| Drainage thickness = 0.5 m | OK | 7.655 × 10⁻⁶ | OK | 9.3 × 10⁻⁶ | |
| c | Drainage thickness = 1.25 m | OK | 4.9 × 10⁻⁶ | OK | 5.86 × 10⁻⁶ |
| Drainage thickness = 0.5 m | OK | 5.02 × 10⁻⁶ | OK | 5.99 × 10⁻⁶ | |
| d | LMid with 0.5 m thickness | OK | 5.23 × 10⁻⁶ | OK | 6.18 × 10⁻⁶ |
| Toe drain | Intersected | 3.38 × 10⁻⁶ | Intersected | 5.15 × 10⁻⁶ | |
Table 4.
Details of seepage lines and rates from zoned models.
| Models | Core Detail | Required Core Material (m3/m) | Shell Permeability | Normal Water Level | Maximum Water Level | ||
|---|---|---|---|---|---|---|---|
| Seepage Line | Seepage q (m3/s/m) | Seepage Line | Seepage q (m3/s/m) | ||||
| e | Central 1:1 (H:V) | 97.75 | Kshell = 10 Kcore | OK | 8.45 × 10⁻⁶ | OK | 9.85 × 10⁻⁶ |
| Kshell = 100 Kcore | OK | 8.73 × 10⁻⁶ | OK | 1.01 × 10⁻⁵ | |||
| Kshell = 1000 Kcore | OK | 8.75 × 10⁻⁶ | OK | 1.02 × 10⁻⁵ | |||
| f | Central 0.5:1 (H:V) | 61.63 | Kshell = 10 Kcore | OK | 1.23 × 10⁻⁵ | OK | 1.41 × 10⁻⁵ |
| Kshell = 100 Kcore | OK | 1.16 × 10⁻⁵ | OK | 1.51 × 10⁻⁵ | |||
| Kshell = 1000 Kcore | OK | 1.32 × 10⁻⁵ | OK | 1.48 × 10⁻⁵ | |||
| g | Inclined | 43.56 | Kshell = 10 Kcore | OK | 2.75 × 10⁻⁵ | OK | 3.05 × 10⁻⁵ |
| Kshell = 100 Kcore | OK | 2.9 × 10⁻⁵ | OK | 3.24 × 10⁻⁵ | |||
| Kshell = 1000 Kcore | OK | 2.62 × 10⁻⁵ | OK | 3.41 × 10⁻⁵ | |||
© 2020 by the authors. Licensee MDPI, Basel, Switzerland. This article is an open access article distributed under the terms and conditions of the Creative Commons Attribution (CC BY) license (http://creativecommons.org/licenses/by/4.0/).
Share and Cite
MDPI and ACS Style
Al-Janabi, A.M.S.; Ghazali, A.H.; Ghazaw, Y.M.; Afan, H.A.; Al-Ansari, N.; Yaseen, Z.M. Experimental and Numerical Analysis for Earth-Fill Dam Seepage. Sustainability 2020, 12, 2490. https://doi.org/10.3390/su12062490
AMA Style
Al-Janabi AMS, Ghazali AH, Ghazaw YM, Afan HA, Al-Ansari N, Yaseen ZM. Experimental and Numerical Analysis for Earth-Fill Dam Seepage. Sustainability. 2020; 12(6):2490. https://doi.org/10.3390/su12062490
Chicago/Turabian StyleAl-Janabi, Ahmed Mohammed Sami, Abdul Halim Ghazali, Yousry Mahmoud Ghazaw, Haitham Abdulmohsin Afan, Nadhir Al-Ansari, and Zaher Mundher Yaseen. 2020. "Experimental and Numerical Analysis for Earth-Fill Dam Seepage" Sustainability 12, no. 6: 2490. https://doi.org/10.3390/su12062490
Note that from the first issue of 2016, this journal uses article numbers instead of page numbers. See further details here.