Physical Responsibility Versus Financial Responsibility of Producers for E-Wastes

1
Department of Industrial and Systems Engineering, Chung Yuan Christian University, Taoyuan 32023, Taiwan
2
Department of Industrial Engineering and Engineering Management, Mapua University, Muralla Street, Intramuros, Manila 1002, Philippines
*
Author to whom correspondence should be addressed.
Sustainability 2020, 12(10), 4037; https://doi.org/10.3390/su12104037
Submission received: 16 April 2020
/
Revised: 7 May 2020
/
Accepted: 8 May 2020
/
Published: 14 May 2020
(This article belongs to the Section Economic and Business Aspects of Sustainability)
Abstract
:Extended producer responsibility (EPR) is a legislative mandate that requires a producer to be accountable for the whole life cycle of its product—from product design to final disposal. The EPR system is imposed to solve the problem of the growing e-waste in different areas of the world. Different countries have different system designs and approaches in EPR, depending on the country’s legislation, customer demand, incentives, and resources; it can either be a physical responsibility or a financial responsibility. Physical responsibility is when the producers are responsible for the physical movements of the e-wastes necessary, while financial responsibility is when the producers are financially supporting all the costs needed to successfully fulfil the EPR goals. In this study, we will determine which type of EPR system is better by doing a comparison on its social welfare value using a social welfare model. This study uses a notebook computer as an example, and based on our analysis, we conclude that the physical responsibility is better if and only if the rate of return of e-waste is equal to or greater than a certain percentage. Otherwise, the financial responsibility model outperforms the physical responsibility model. A sensitivity analysis is also carried for each parameter used in the two models for determining the significance.
1. Introduction
E-wastes are electronic products that have reached their end-of-life (EOL) or simply been disposed of by the consumers. These e-wastes are continuously rising due to the high rate of technology development [1,2]. Products under the category of e-waste can go from as small as a mobile phone to as big as washing machines, or simply products that are electrical-powered. The WEEE (Waste Electrical and Electronic Equipment) Directive [3] sets 10 categories for reporting purposes. They are the following: large household appliances; small household appliances; IT and telecommunications equipment; consumer equipment; lighting equipment; electrical and electronic tools; toys, leisure and sports equipment; medical devices; monitoring and control instruments; and automatic dispensers.
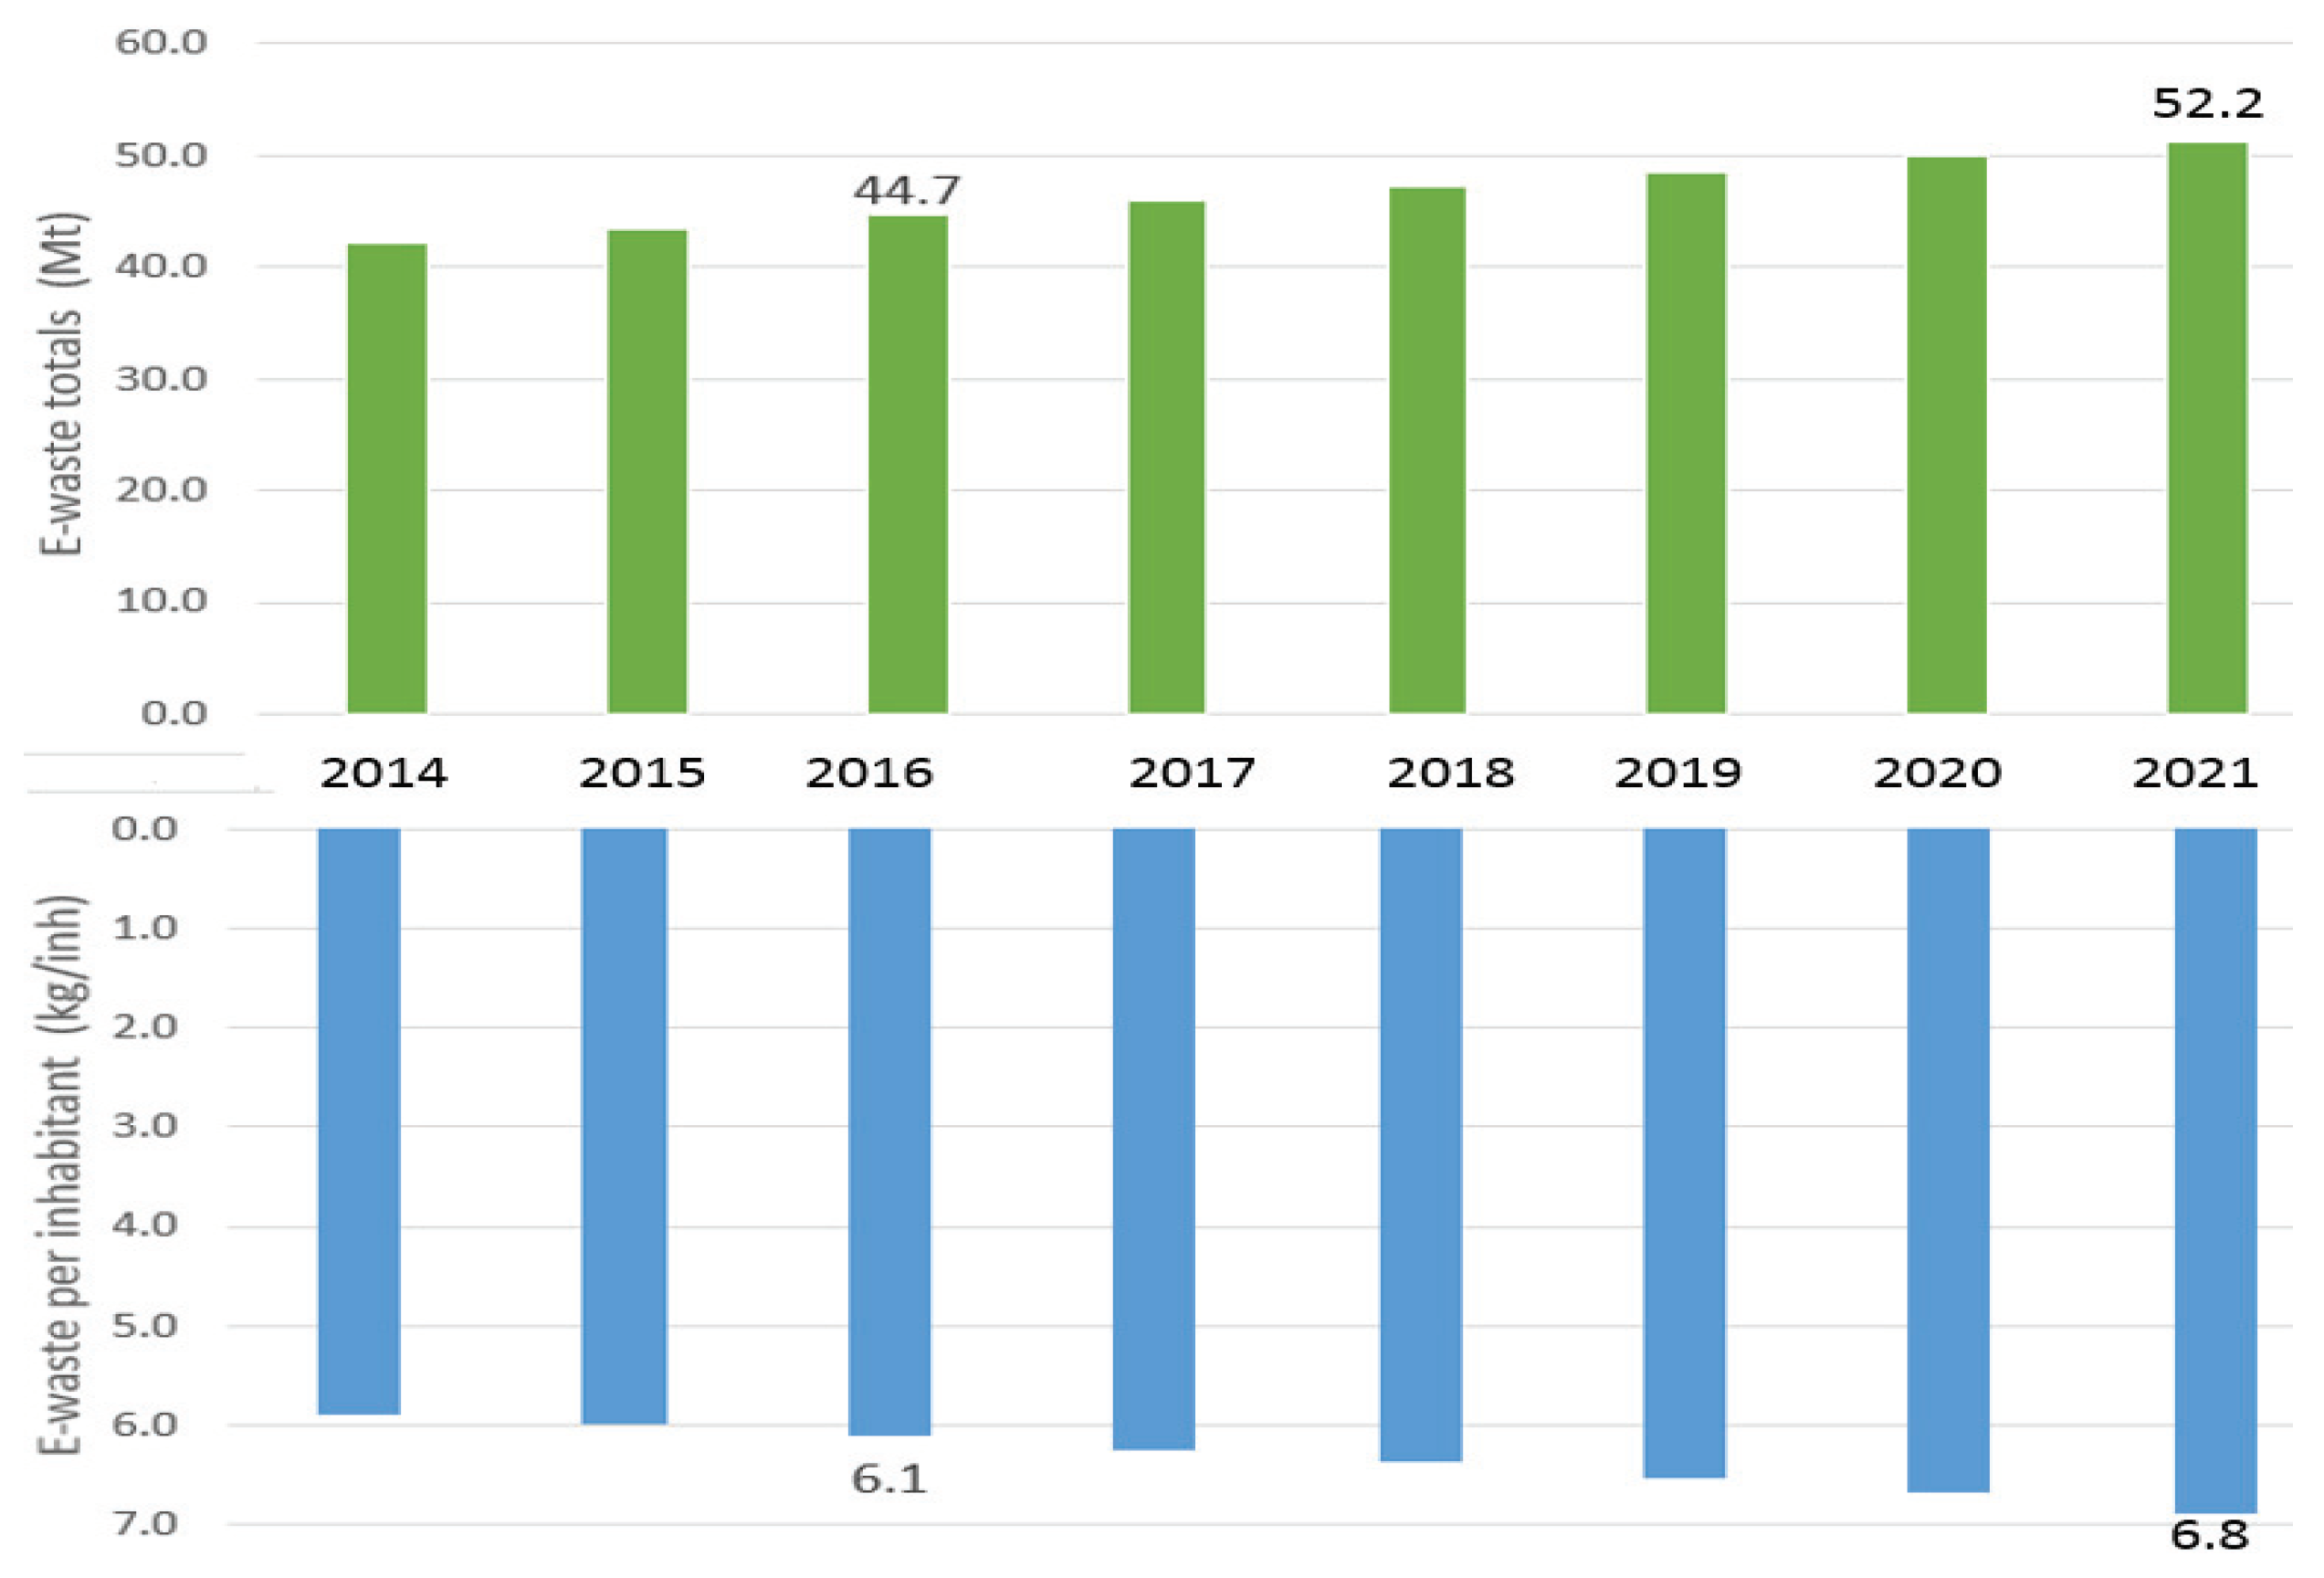
A massive usage of electrical and electronic equipment (EEE) nowadays leads to an expected increase of e-wastes two to three times faster than any other waste material worldwide [4,5]. These e-wastes contain hazardous elements such as lead, chromium, cadmium, and mercury, which are dangerous to both the human race and the environment [6]. As we all know, the consumption of EEE is probably most prevalent in developed countries, but developing countries show a rapid growth of consumption of EEE. Typically, the former ones have 1% to 5% growth rates annually on weight basis, and the latter ones range from 10% to 25% [7]. However, 44.7 Mt of e-waste were generated globally in 2016 [8], as shown in Figure 1, but only 15%–20% of e-wastes are recycled; the rest of these electronics go directly into landfills and incinerators [9].
These accumulated electronic wastes have been not only posing threats to the ecological environment but also causing valuable resources to be wasted or destroyed. In order to resolve the problem and other issues, in 2015, the United Nations and all member states adopted the ambitious 2030 Agenda for Sustainable Development, and they identified 17 Sustainable Development Goals (SDGs) and 169 targets to end poverty, protect the planet, and ensure prosperity for all over the next 15 years [10]. This agenda wanted to increase levels of awareness of e-waste, improper and unsafe treatment, and disposal through incineration or in landfills, which posed significant challenges to the environment and human health [7]. Goal 12 is especially intended for having responsible consumption and production.
In line with these goals, different countries around the world put great efforts into devising a fairly complex and costly system to manage e-wastes and practice extended producer responsibility (EPR), where the producers are responsible financially and/or physically for the entire life cycle of their products, from the point of sale up to the final disposal [11,12]. The concept of EPR was introduced by Lindhqvist and Lidgren in 1990 [13]. According to the OECD (Organisation for Economic Co-operation and Development) definition, EPR is “an environmental policy approach in which a producer’s responsibility for a product is extended to the post-consumer stage of a product’s life cycle.” Its policy has the following characteristics: the shifting of responsibility away from municipalities but upstream toward the producer; and the provision of incentives to producers to take into account environmental considerations when designing their products [14,15].
According to van Rossem et al. [16], an effective EPR should achieve two main environmentally related goals. The first is to design improvements of products—the EPR system should provide incentives for manufacturers to improve products and systems surrounding the life cycle of products. The second is high use of product and material quality through effective collection and reuse or recycling. The second goal can be divided into three subgoals, which are effective collection, environmentally sound treatment of collected products, and high use of products and materials in the form of reuse and recycling. Thus, a design for the environment (DfE) is also a part of the EPR movement which includes recycled materials and repair feature. Other comparative existing studies are available, as can be seen in the works of [6,16,17,18,19].
Extended producer responsibility can be executed as either physical responsibility or financial responsibility [17,20]. Physical responsibility (or organisational responsibility [19], operational responsibility [21]) is when the producer is responsible for the necessary physical movements (collection, recycling, disposal, etc.) of the e-wastes, while financial responsibility (or economic responsibility [18]) is when the producer is financially supporting all the costs needed to successfully fulfil the EPR goals. In other words, the producers under the financial responsibility program only need to pay the fee annually based on the regulation; however, they are not responsible for collection of the used products, whereas the producers under the physical responsibility program need to not only pay the fee but also be responsible for fulfilling the collection rate announced.
In an EPR system, the common players are the producers (manufacturers), consumers, government, and recyclers. These players have different roles depending on what type of EPR system they are involved in and in what country. Usually, the government is involved in the physical flows of an EPR system but always involved in the cash flows for all types as the main organizer who mandates the system. On the other hand, consumers are commonly noted as an independent variable in the system. To help us have a clearer view of the difference between financial responsibility and physical responsibility, we will take Taiwan and South Korea’s EPR systems for notebook computers as an example to compare their difference. Taiwan’s EPR system is of a typical financial responsibility, whereas South Korea’s EPR system is of a typical physical responsibility [18,22]. Thus, this paper aims to answer the following questions:
- Which type of EPR system for e-wastes is better?
- If any type is better, is any condition involved?
- What are the factors to be considered in each type of system?
In the rest of this paper, a thorough discussion of the forward and reverse logistics of e-wastes with a financial responsibility model and a physical responsibility model will be discussed, and the presentation of the social welfare model with the equilibrium is presented in Section 2. We then conduct a comparison of the two models with parameter sensitivity analysis in Section 3 and form our conclusion in Section 4.
2. Model Development
2.1. Financial Responsibility EPR System
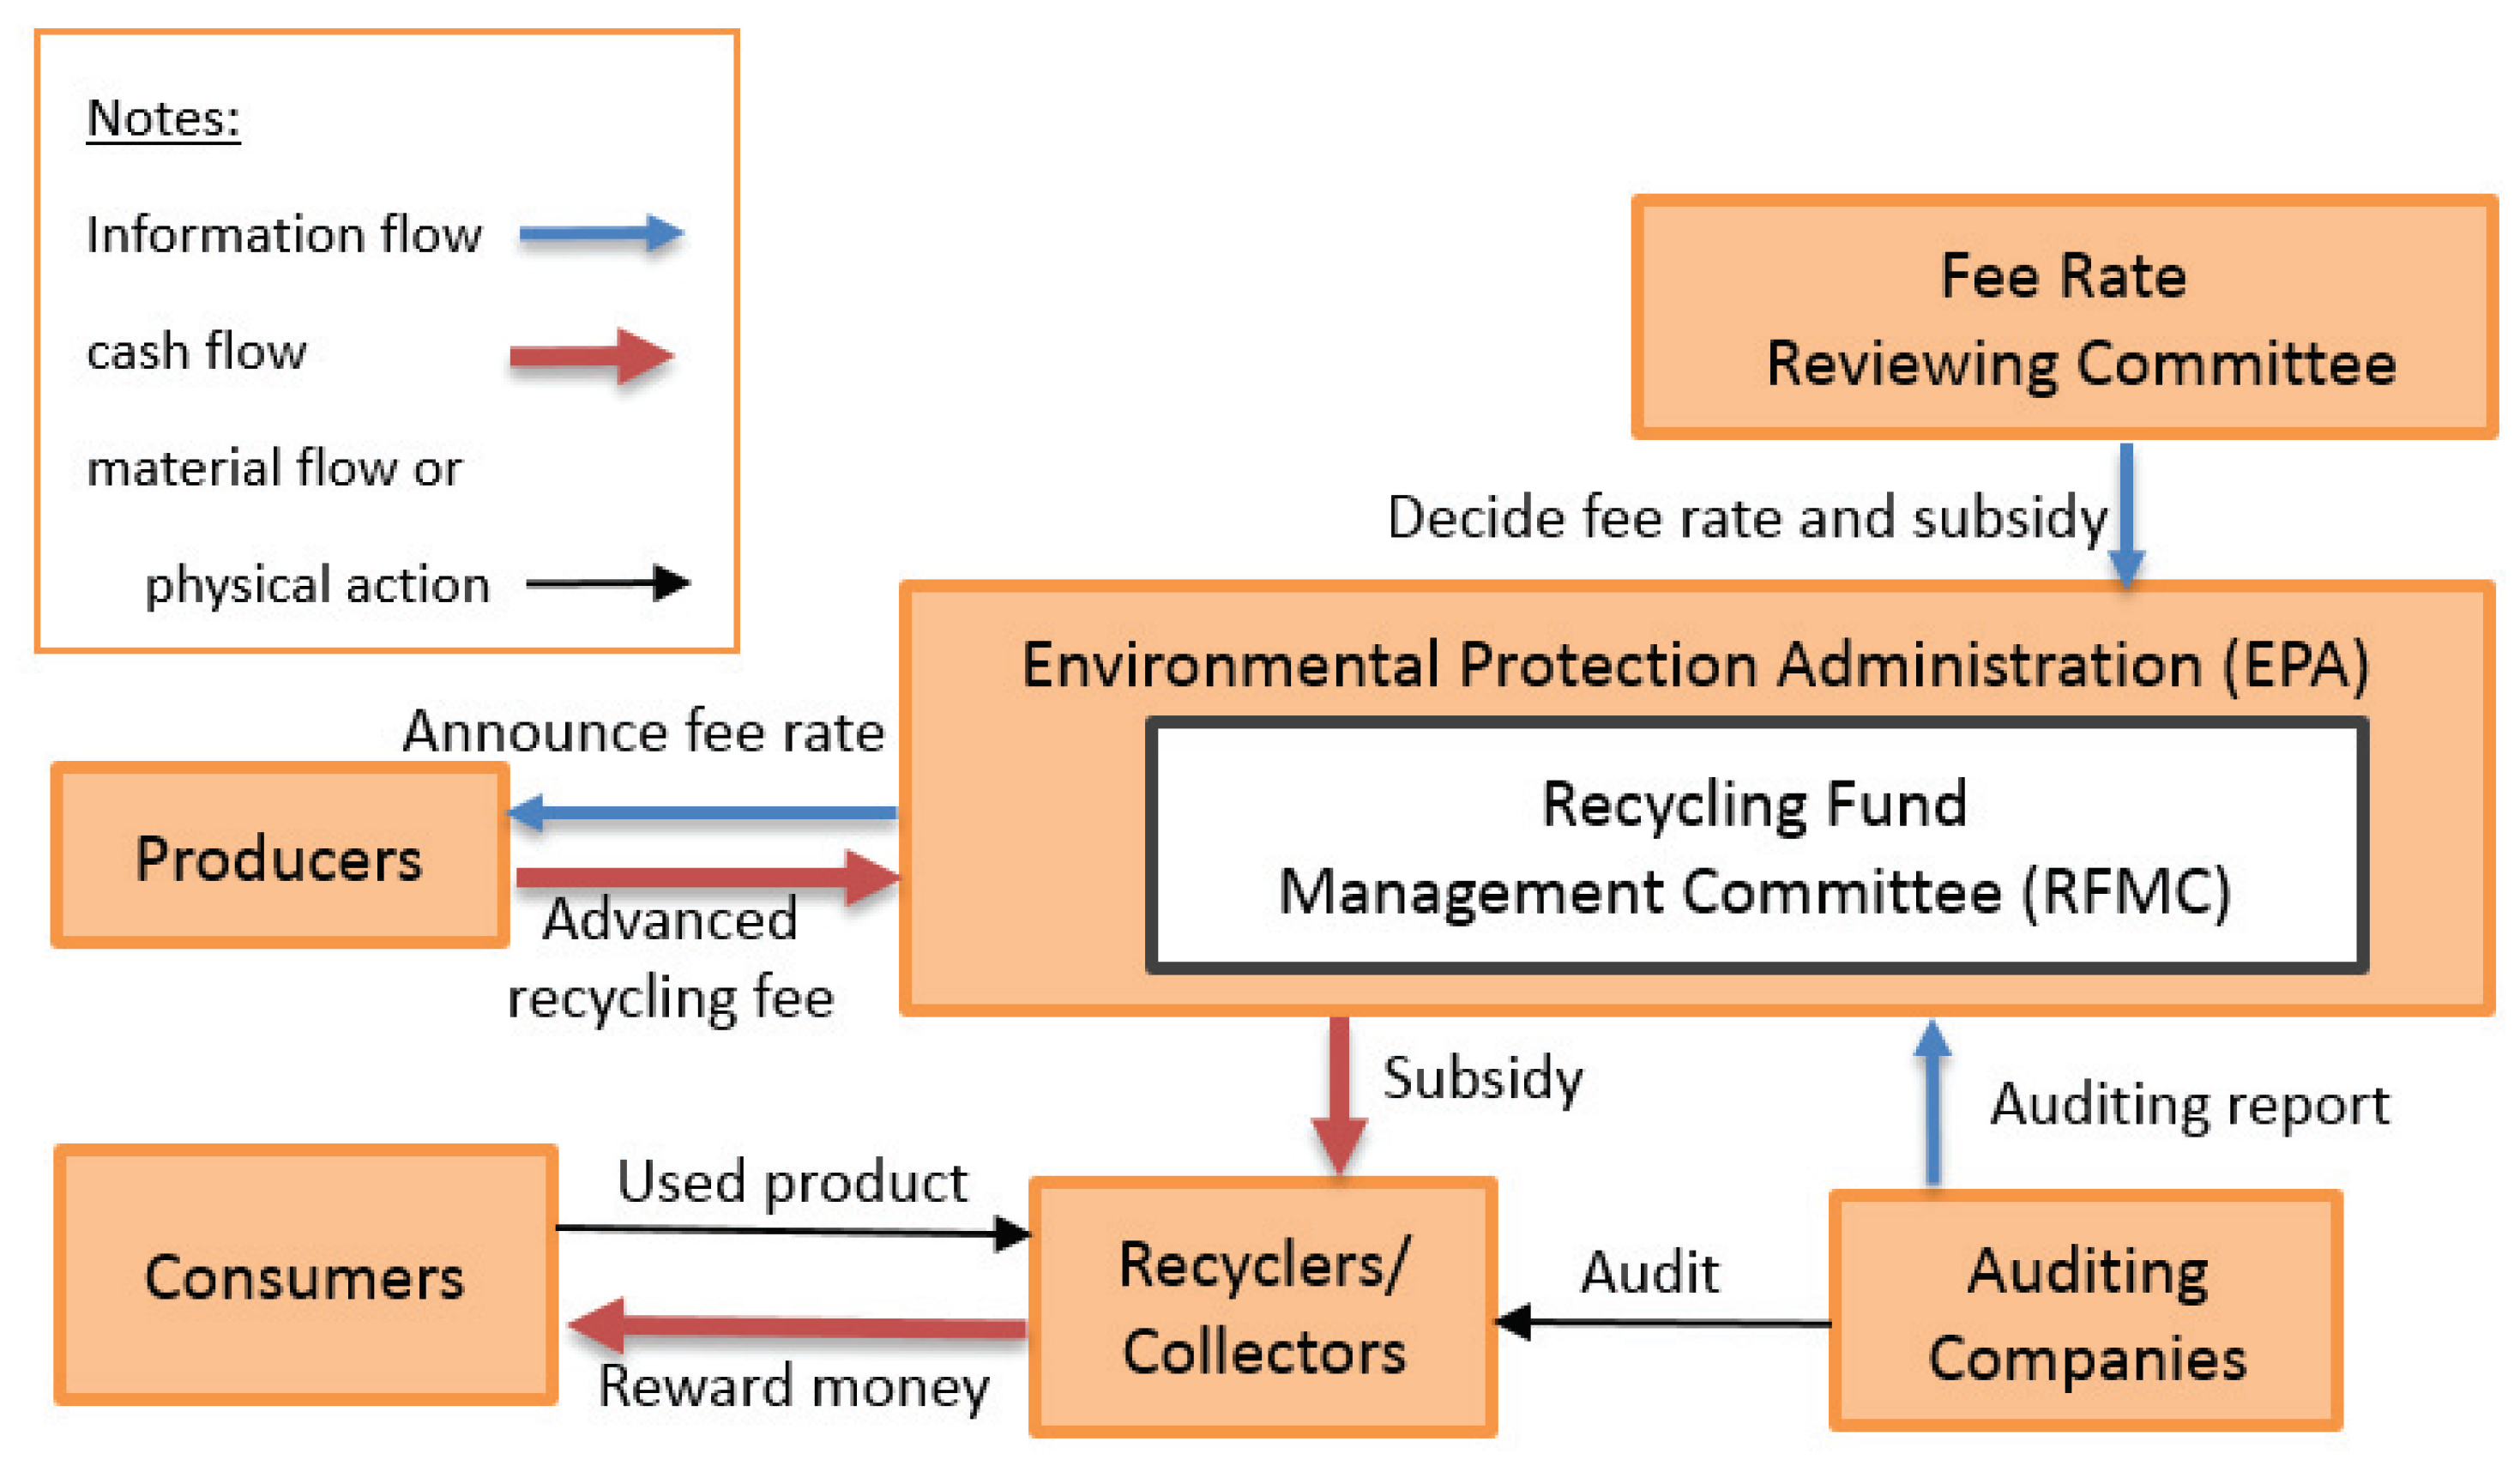
Figure 2 shows the EPR system performed in Taiwan [19], and Table 1 shows the roles and responsibilities of each player under the EPR system in Taiwan. The Fee Rate Reviewing Committee (FRRC), organized by representatives from government, academia, producers, and consumer groups, annually determines the fee rate and subsidy for each recyclable product. The information is passed on to the Recycling Fund Management Committee (RFMC), which is a bureau of the Environment Protection Administration (EPA), to collect fees from producers and give subsidies to the recyclers for collecting and recycling wastes, including e-wastes. The fee collected from the producer is determined by the sales volume of the previous year and the cost of collection and recycling per item.
The amount of subsidy given to the recycler has to go through an auditing process to make sure that the waste is complete enough. Here, the producers only need to pay the fees to the RFMC, and the rest of the tasks, such as collection and recycling, are handled by other parties, hence why the EPR system in Taiwan belongs to the type of financial responsibility [22].
2.2. Physical Responsibility EPR System
In this type, we take South Korea’s EPR system as an example. The Korean Ministry of Environment (KMOE) introduced the EPR system in 2003, as shown in Figure 3. Roles and responsibilities of each player under the EPR system in South Korea are shown in Table 2. KMOE may request that the Korea Environment Corporation (K-eco), established under the Korea Environment Corporation Act in 2010, provide financial assistance to companies running recycling businesses and review technical matters, such as inspection and analysis for circular resources [22,23]. Producers of consumer electronic products are required to achieve the official recycling targets set by KMOE. Producers can comply with their target by either outsourcing the job to commercial recycling companies, constructing their own recycling plant, or joining the Producer Responsibility Organization (PRO), where producers need to pay fees and let PRO do the recycling. Producers who fail to meet their obligations are subject to standard recycling fees and extra charges, which is about 15%–30% of the standard recycling fees [23,24].
The forward logistics in this system are identical to the forward logistics of Taiwan. However, its reverse logistics are quite different. In South Korea, a Volume-based Waste Fee (VBWF) System is imposed as one of the waste reduction strategies.
The VBWF system follows the “producer-pays” principle, requiring users to pay the disposal cost according to the quantity of wastes they acquire. An inspection is conducted once a year to ensure proper use or distribution of disposal items. If unlawful use of disposable products is caught, a fine of 3 million Korean won shall be imposed. Moreover, the government implemented a reward system due to the weak implementation and monitoring of the VBWF system at its earlier stage, which leads to a remarkable positive result [26].
In line with the EPR system, it leaves consumers two options on how to dispose of their used product, whether through replacement to the producer which does not need a collection fee or to the local government where they need to pay a collection fee for every used product to be surrendered or collected by the local government. In South Korea, citizens are greatly encouraged to participate in the recycling schemes available due to the difference between the collection fee and the penalty amount imposed by the government and the threat of being caught for improperly disposing of their used products because of the benefit to possible witnesses due to the reward system also imposed by the government.
2.3. Social Welfare Model Formulation
The social welfare model for the two EPR systems was developed and optimized in the following. In each model, four players are involved, they are producer, government, recycler, and consumer, which are simplified for modeling. Table 3 shows the parameters and decision variables used in the models.
2.3.1. Financial Responsibility Model
The financial responsibility model (FR model) adopted the approach of Hong and Ke’s study [27], where it follows a decentralized approach since the model consists of independent entities that may not be willing to share information with each other in a format of a Stackelberg-type model, with assumptions that the government is the leader and determines the recycling fees, while the producer and recycler are the followers and select their best response to the government-determined rates. A social welfare approach is used. However, this study considered the effects of repaired parts recycling and using recycled materials in production and determined the effects of them on the social welfare value, which are more practical but not considered in Hong and Ke’s study [27].
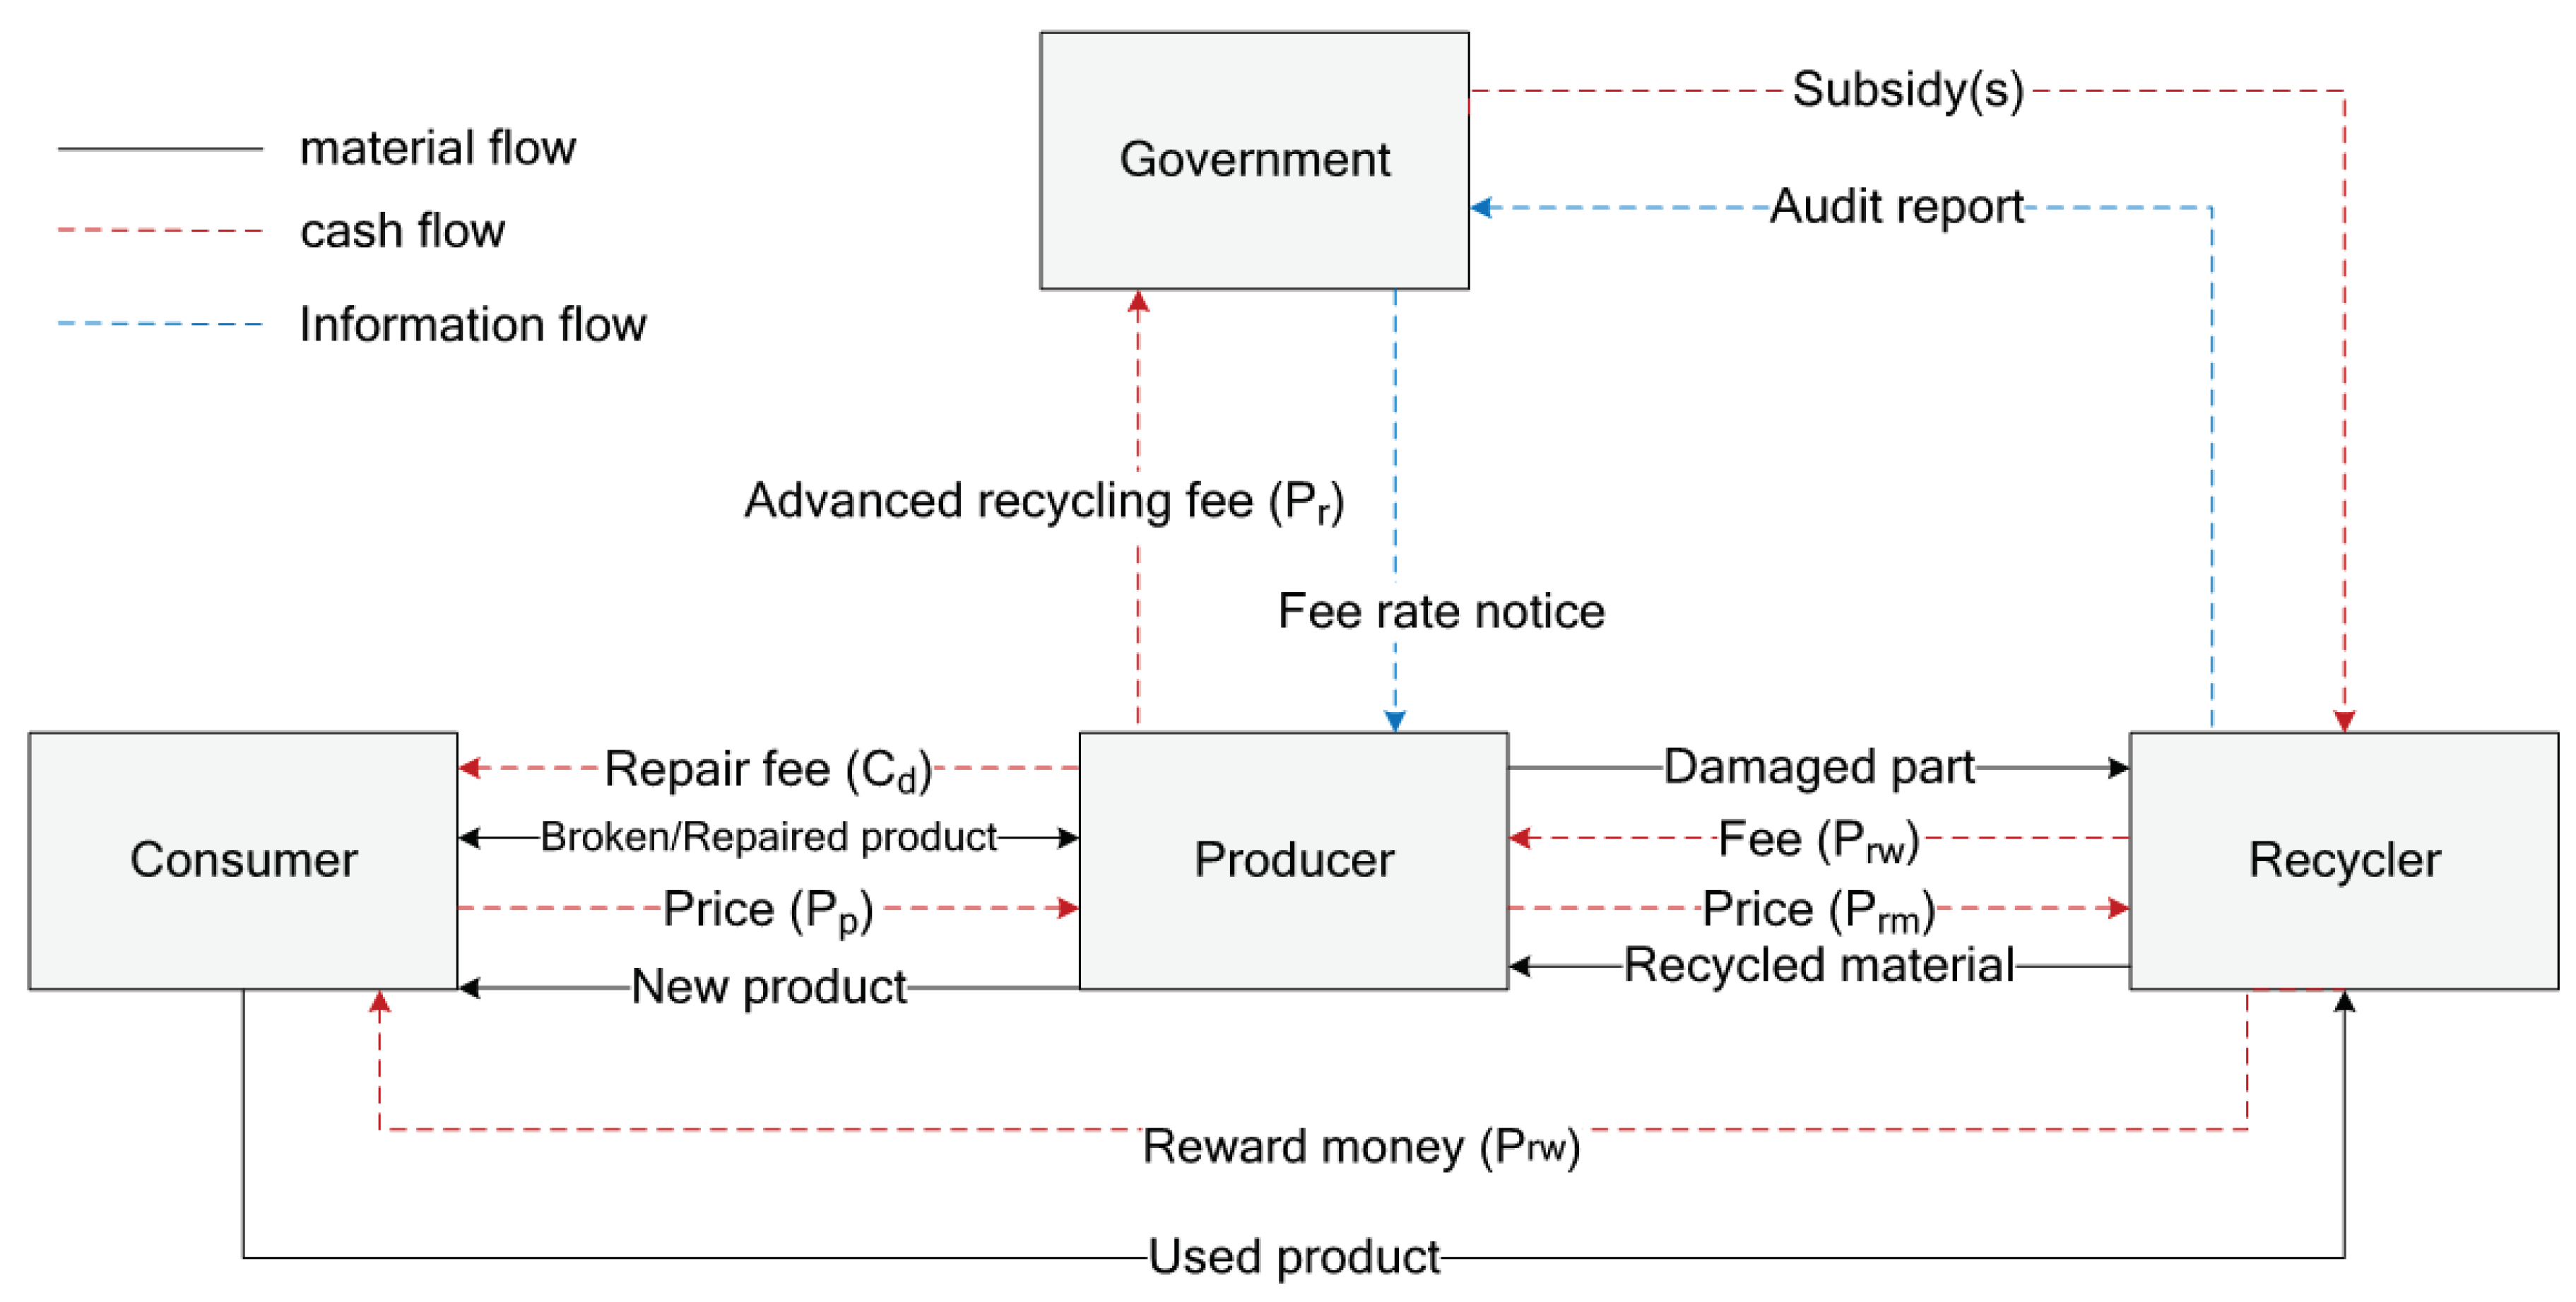
In Figure 4, Taiwan’s e-waste EPR system is shown as an example; the material, cash, and information flows of notebooks are identified. The main information flow is that the government announces the fee rate to the producer for each recyclable product in order for the producer to pay the ARF. In addition, after receiving the audit report, the government can pay the subsidy to the recycler. The first activity in the material flow is the flow of production cycle. It begins with the identification of the elements needed to produce a notebook computer, followed by its consumer usage, repair, and the moment it is discarded. The second activity is referred to as the process of collecting discarded notebook computers by the recycler with the goal of forming recycled materials.
In the production process, producers purchase recycled materials from the recycler to integrate with the new computer notebook production and the new notebook computer is offered to the consumer. In every product, it is inevitable that the product will incur damages during usage. In this case, if the product is still within its warranty period, the consumer will return the product to the producer for repair. The broken part in the product is fixed and replaced by the producer, and the repaired products are returned to the consumer. The product is used until it is no longer desired by the consumer. End-of-life products will then be sent to recyclers, which is the last activity in forward logistics.
On the other hand, reverse logistics will start as soon as the used products are sent to the recyclers. The collected used products will undergo the recycling process to recover recyclable materials that are used in new notebook computer production. In this case, additional profit can be obtained by the recycler. For the consumer, as a reward for giving up the end-of-life product to the recycler, the recycler will provide the corresponding reward money to the consumer.
In the FR model, the social welfare will be optimized, which can be defined as the sum of the producer profit, recycler profit, government profit, consumer surplus, and the environmental externality cost. Each item will be introduced in the following.
The cash inflows in the producer’s perspective are the sales generated in selling notebook computers, , and the savings it gets in using recycled materials produced by the recycler for production denoted as symbolizes the damaged parts that came from the broken products being surrendered to the producer. As a form of repair, the producer replaces the damaged parts with a new one which needs an additional cost (called ) for the producer aside from the production cost per unit ) and an advanced recycling fee per unit ). Upon replacing the broken parts, the repaired product is returned to the customer, and the damaged parts are sold to the recycler, giving them an additional income of . Thus, the producer’s profit () is:
As the law of demand indicates, if all other factors remain equal, the higher the price of the product, the less people will demand the product. In this study, we assumed that the product price and quantity of demand have a linear function noted as . Whenever > 0, the profit function is concave in . Thus, when the profit function shown in Equation (1) is differentiated on its first-order condition with respect to , it is at its maximum, as is equal to
Substituting Equation (2) in the demand function shows that, at equilibrium, the product price is
The aggregate revenue of recycler comes from the accumulated subsidies for recycling the used product collected from the consumer and damaged parts collected from the producer; this cash inflow is denoted as . Another source of revenue of the recycler is the sales of the recycled materials it produces from the amount of used products and damaged parts it recycled. The income it generates in selling recycled materials is denoted as . Conversely, the aggregate cost of the recycler is the recycling cost per unit ) of collected used products and damaged parts and the reward money given for each used product surrendered by the consumer or damaged parts sold by the producer. Thus, the profit of the recycler () is
For the recycler, an increase in reward money results in an increase of quantity collected, a similar concept of the law of supply. Therefore, . If > 0, the profit function is concave in . Thus, the profit of the recycler is at its maximum when it is differentiated on its first-order condition with respect to . Maximum profit occurs at
In Equation (5), it shows that is dependent on . Since it is assumed that all players will choose their best response to the fees set by the government, when Equation (2) is substituted in Equation (5), it gives us the optimal reward money formula of
and substituting Equation (6) in the source supply function yields to
The profit of the government comes from the cumulative product of the advanced recycling fee and quantity produced less the accumulated subsidy that the government will provide to the recycler for the recycling costs per unit of used products and damaged parts collected. Thus, the profit of the government () is
Usually, the government entity does not aim to earn a maximum profit but aims to balance the system.
For the environmental externality cost or environmental cost (), it is denoted as
where the first term is the total indirect pollution cost of uncollected e-scraps, and the second term is the total indirect pollution cost of each notebook computer produced for demand.
Consumer surplus includes two portions: one is from the new product market, and the other is from the used product market. Based on the study of [27], consumer surplus () can be expressed as
where the first term is for the new product market, and the rest is for the used product market.
From Equations (1), (4), (8), (9), and (10), the social welfare () can be found as
We can take the first-order derivative of Equation (11) with respect to the advanced recycling fee () and subsidy () individually, then the maximum social welfare value can be found at
2.3.2. Physical Responsibility Model
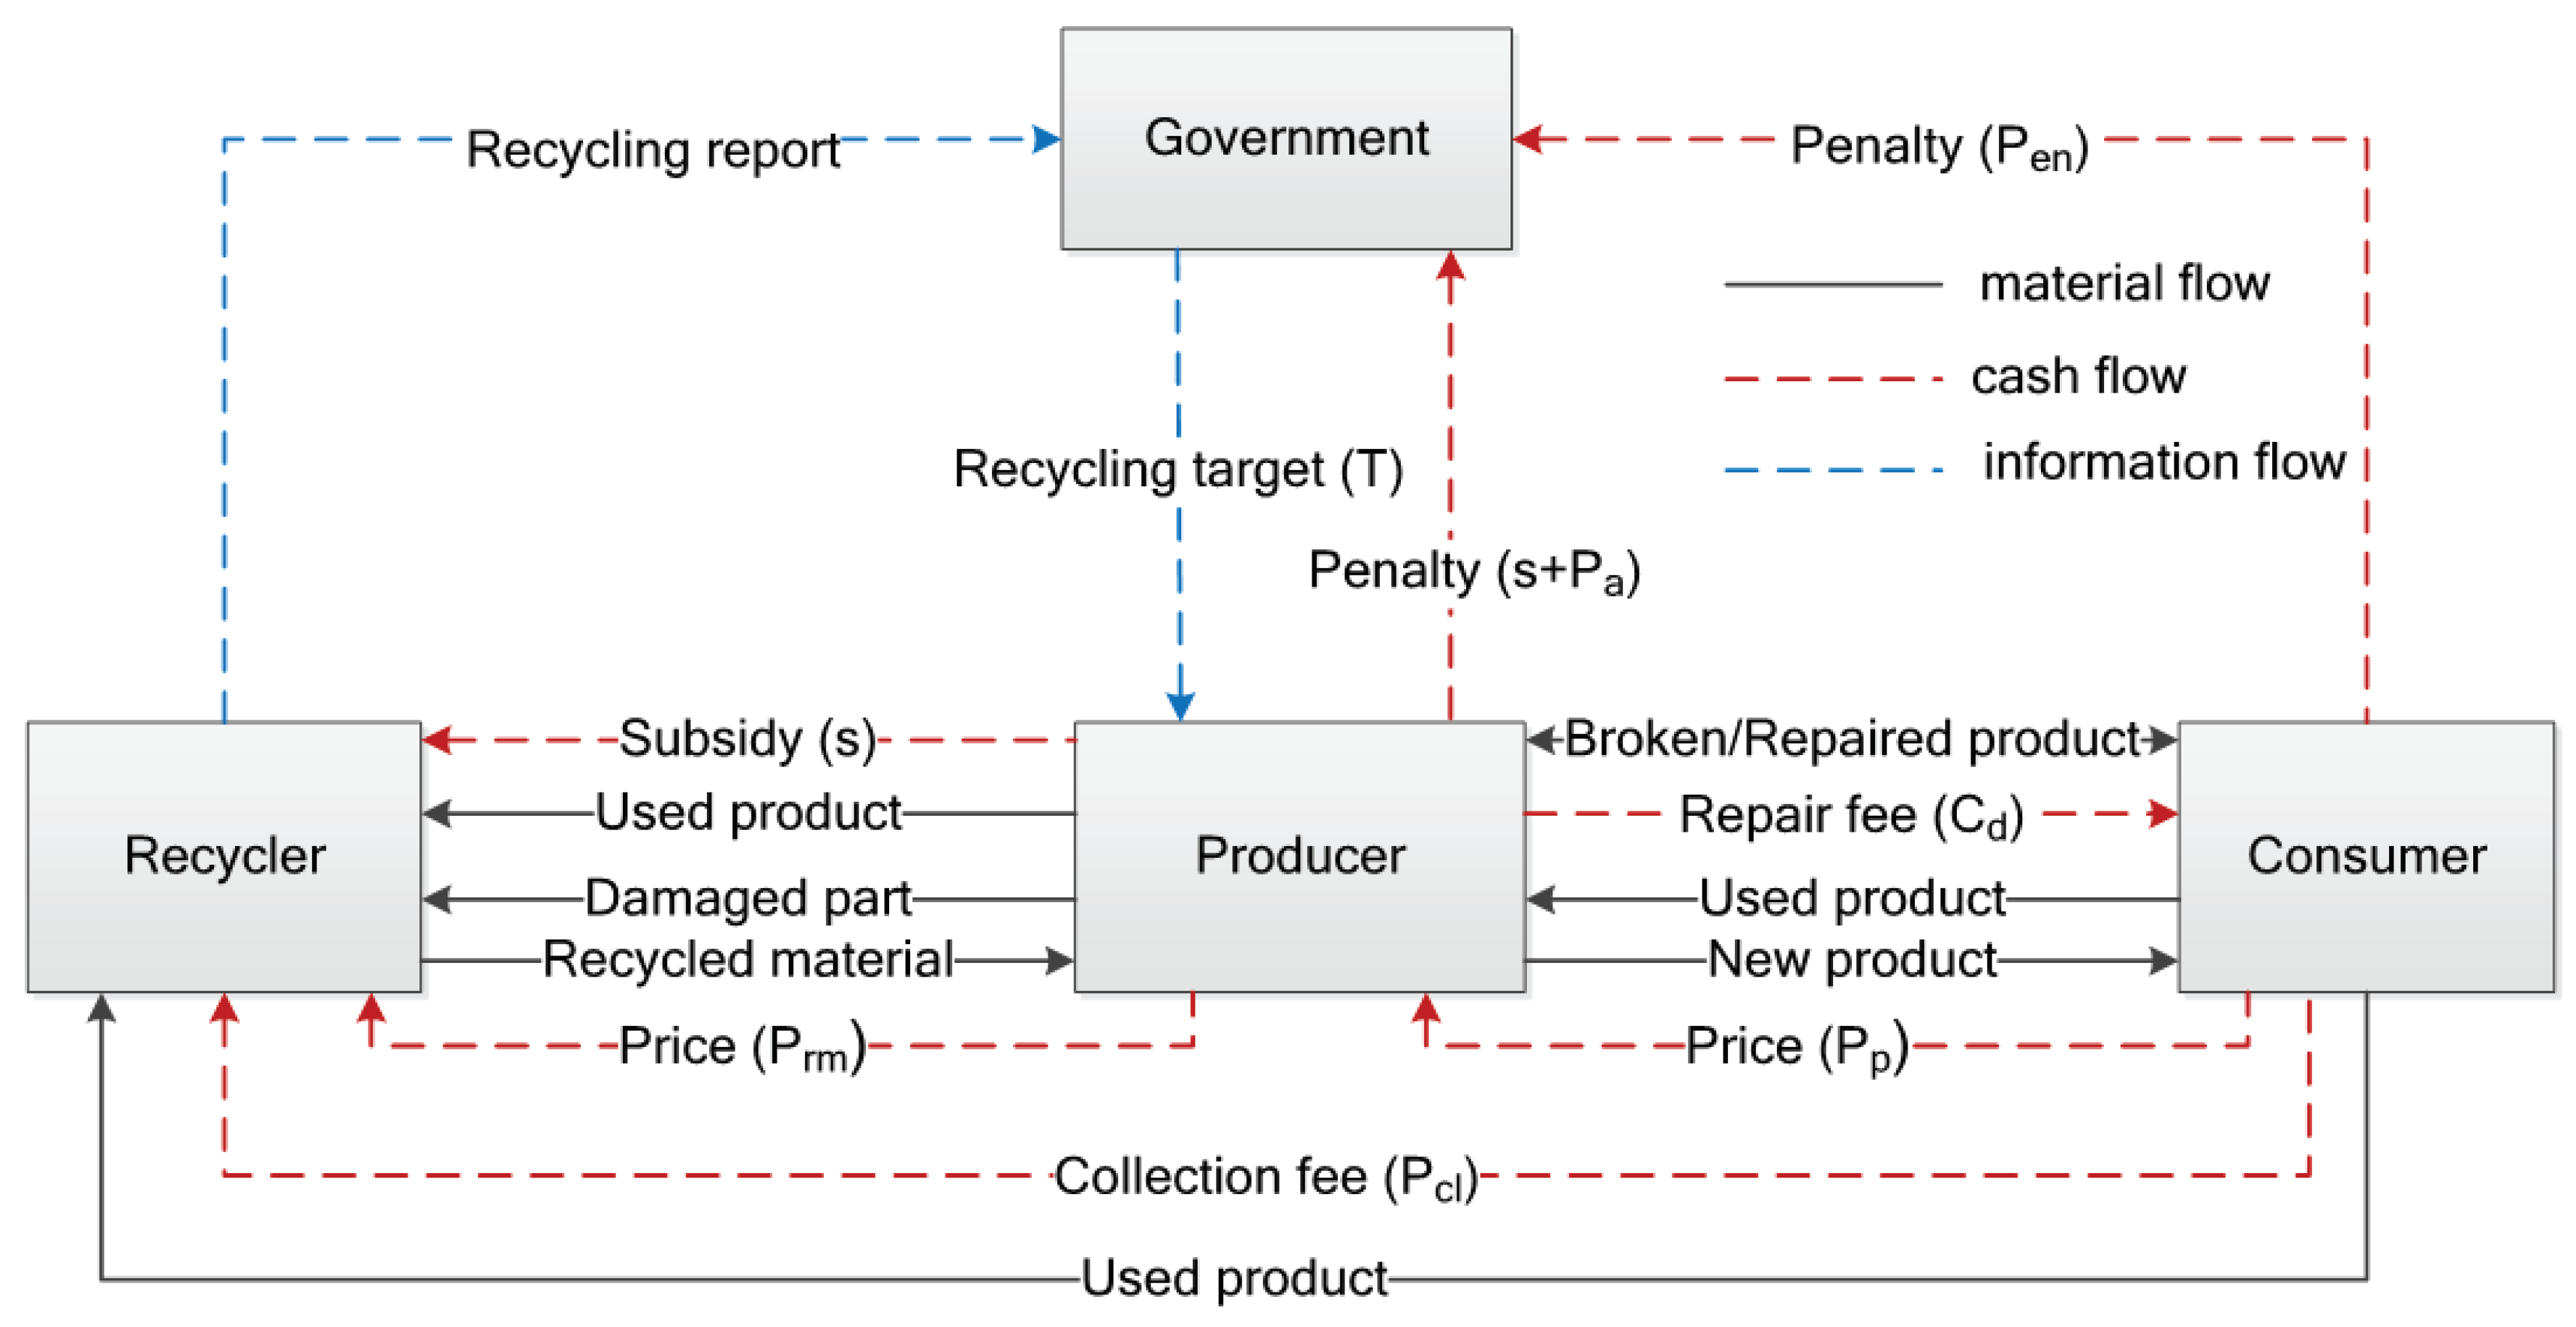
Korea’s EPR system is shown as an example for the physical responsibility model (PR model) in Figure 5. Some cash flows of the PR model are similar to the FR model as follows. Inflow has the sales generated in selling notebook computers ( and the savings it gets in using recycled materials where the collection includes producer’s collection and recycler’s collection (). Outflow consists of production cost and replacement cost for the repair products.
The difference in the two models is that, in this model, instead of giving an advanced recycling fee to the government to finance the costs of recycling collected used products and damaged parts, the producer or PRO is the one who directly gives the subsidy to the recycler in an amount proportional to the used products and damaged parts collected by them. Hence, the amount of subsidy is computed by . The tax being paid by the producer to the government is in the form of a penalty, where the amount is the total subsidy charged by the recycler for the uncollected used products that complements the mandatory recycling quantity and an additional recycling charge [18]. The penalty can be denoted as , where is the subsidy, the price that is charged by the recycler to recycle one unit of used product, and is the additional recycling charge; let Thus, the producer’s profit () is
The relation of and also follows the equation . Consequently, the profit function is concave in whenever b > 0. Hence, the profit of the producer is at its maximum if it made its best decision on how many notebook computers to be produced. The best can be derived from the first-order condition of with respect to when the demand function is substituted to Equation (14), which gives us
Similarly, substituting Equation (15) in the demand function gives us the best product price, which is shown below:
The recycler collects and recycles used products headed by the local government. The revenue of the recycler is from its products and services it offers to the producer and consumer. The expected number of used products to be collected by the recycler is multiplied by the collection fee , which is their collection service revenue. While the used products surrendered to the producer and damaged parts from the repair service are directly forwarded to the recycler, the recycler charges the producer for a subsidy per unit of used product surrendered. Subsidies obtained from the producer are used to finance all the associated costs in recycling products and/or parts. Whereas product sale revenue is from the recycled materials sold to the producer that is used for the producer’s production, the price of recycled materials for each quantity is noted as . However, a certain percentage should be taken into consideration to open the chances that the recycler will not avail the whole amount of recycled materials for sales. On the contrary, the cost being incurred by the recycler is the recycling cost Cr, where the recycling processes cost, collection cost, and all other associated costs in recycling a used product are included. Thus, the profit of the recycler () is
The relationship between the quantity collected by the recycler and the collection cost is inversely proportional to each other. However, the difference between the penalty imposed by the government and the collection fee set by the recycler is the one that triggers the consumers as to whether they surrender their used product to the local government or not. Thus, the higher the difference of the collection cost () and the penalty , the higher the quantity to be collected by the local government and the relationship is believed to be ). With this relationship, the profit function Πr is concave in if d is greater than zero. Therefore, the best decision of the recycler for its reward money in response to the fees set by the government is
where the expected optimal quantity to be collected by the recycler is obtained by substituting Equation (18) to , which results in
The report , given by the recycler to the government, is the amount of the units recycled from the used product and damaged parts that came from the producer. The producer’s failure to comply with the mandatory recycling amount, , requires the producer to pay the penalty, , where is the target recycling rate. Moreover, a penalty is also being collected from the consumer for every improperly disposed used product. The amount of the improperly disposed used product can be computed by the difference of the expected return rate of end-of-life products and the accumulated collected used products and parts of the producer and recycler. Thus, the profit of the government () is
Similarly, the environmental externality cost or environmental cost () and consumer surplus () for the PR model can be expressed as
From Equations (14), (17), (20), (21), and (22), the social welfare () can be found as
We can take the first-order derivative of Equation (23) with respect to the penalty () and subsidy () individually, then the maximum social welfare value will occur at
3. Case Study Illustration
In order to have a better understanding of the difference between the two models, this section will use the data collected from literature for illustration. Meanwhile, a sensitivity analysis of all given values will be performed for broader consideration.
3.1. Data Collection
Some of the data of parameters used in this study referred to the studies of Hong and his associates [27,28], and they are: = 33,000 NTD (New Taiwan Dollars), = 0.01 NTD/unit, = 5600 NTD, = 80 unit/NTD, = 29,000 NTD, = 50 NTD, = 0.97%, = 2175 NTD/unit, = 135 NTD/unit. Whereas, the quantity to be collected by the producer in the PR model is equal to , because there is no collection fee or reward money being offered to consumers who surrender their used notebook computers to the producers. Conversely, T is 0.5 as a result of the excel solver add-in in computing the target recycling rate in the PR model.
From the data obtained in local companies, it was possible to determine the cost of replacement for the damaged parts borne by the producer (), which is 112 NTD. It is computed by getting the sum of the product of the annualized failure rate and product price, then multiplying it by the average malfunction rate per year. Conversely, the value of is 65 NTD per unit of recycled used product, while is the difference in raw material and recycled material prices for every unit of used product recycled, which is 817 NTD. This study assumed that = = λ = 100% to maximize the potential profit of the recycler and producer. Lastly, is 0.022 based on the studies of Sands and Tseng [29], where the total amount of broken products for three years is 37.8% and calculated from the product average of failure rates and part price. In this study, we assumed that the laptops being repaired are within the warranty of three years.
3.2. Solution Methods
This study used Maple software to help derive the formula needed in getting the optimal social welfare as shown in Equations (11) and (23) for the FR model and the PR model, respectively, and obtain their values by inputting the data collected. Furthermore, in order to obtain reasonable results, we have to give constraints to the items derived. In this study, we simply assumed that the value of all items is greater than zero; otherwise, the government profit has a negative value when we want to optimize the social welfare value. Practically or regularly, the government does not aim to maximize its profit, rather, it aims to balance the system.
Under the above constraints, we are looking for the optimal value of the social welfare as an objective function in the Excel Solver. In the FR model, the advanced recycling fee to be given by the producer to the government () and the subsidy to be given by the government to the recycler () are the decision variables. In the PR model, the decision variables are the penalty to the consumer who improperly disposed of their used products () and the subsidy to be given by the producer to the recycler ().
3.3. Results and Discussions
3.3.1. Comparison between FR and PR Models
Table 4 shows four FR models: (FR1) without considering the effect of repaired parts recycling (RPR) and using recycled materials (URM) in production, (FR2) with considering the RPR effect, (FR3) with considering the URM effect, and (FR4) with considering the effect of RPR and URM. In the FR2 model, although the producer has the benefit due to the repaired part recycling, the producer is responsible for the repair under the warranty period, which costs more; thus, the producer’s profit is lower, as is the social welfare. For the FR3 model, the producer can save money by using the recycled materials, and it leads to higher producer’s profit and social welfare. Hong and Ke’s study [27] belongs to the FR1 model. Our study proposed the FR4 model, which considers the effect of RPR and URM and has the higher social welfare than the FR1 model. In addition, the FR4 model has the highest recycler’s profit and the lowest environment cost, which are due to the effects of URM and RPR. Its environment cost is less than the FR1 model by 17.3%, and its recycler’s profit is more than the FR1 model by 3197%. In other words, the FR4 model is the best model for our environment among the four FR models.
Similarly, Table 5 shows four PR models: (PR1) without considering the effect of repaired parts recycling (RPR) and using recycled materials (URM) in production, (PR2) with considering the RPR effect, (PR3) with considering the URM effect, and (PR4) with considering the effect of RPR and URM. The PR3 model has the highest social welfare, then PR4, PR1, and PR2 follow in that sequence. In addition, the PR4 model has the lowest environment cost (less than the PR1 model by 16.7%) and the highest recycler’s profit (higher than the PR1 model by 1063%), which are also due to the effects of URM and RPR. In other words, the PR4 model is the best model for our environment among the four PR models, which indicates that the consideration of URM and RPM is on the right direction.
Comparing the two sets of EPR models, all the FR models have the better consumer surplus than the PR models, and the main reason is that, in the PR models, the consumer needs to pay the recycler for the returned product, whereas in the FR models, the consumer would be offered reward money from the recycler. Moreover, almost all the FR models have lower producer’s profit, except for the FR2 model. This is probably due to the higher ARF to be paid to the government, and in the PR2 model, the producer has the lower profit due to the higher subsidy paid to the recycler and higher penalty paid to the government. In addition, the recycler in the FR3 and FR4 models has the much higher profit due to the higher subsidy from the government. It leads to the higher social welfare than the PR models. Finally, almost all the FR models have the higher social welfare under the parameters set, except for the FR2 model, and the reasons are discussed in the above and in Table 4 and Table 5.
3.3.2. The Effect of Return Rate
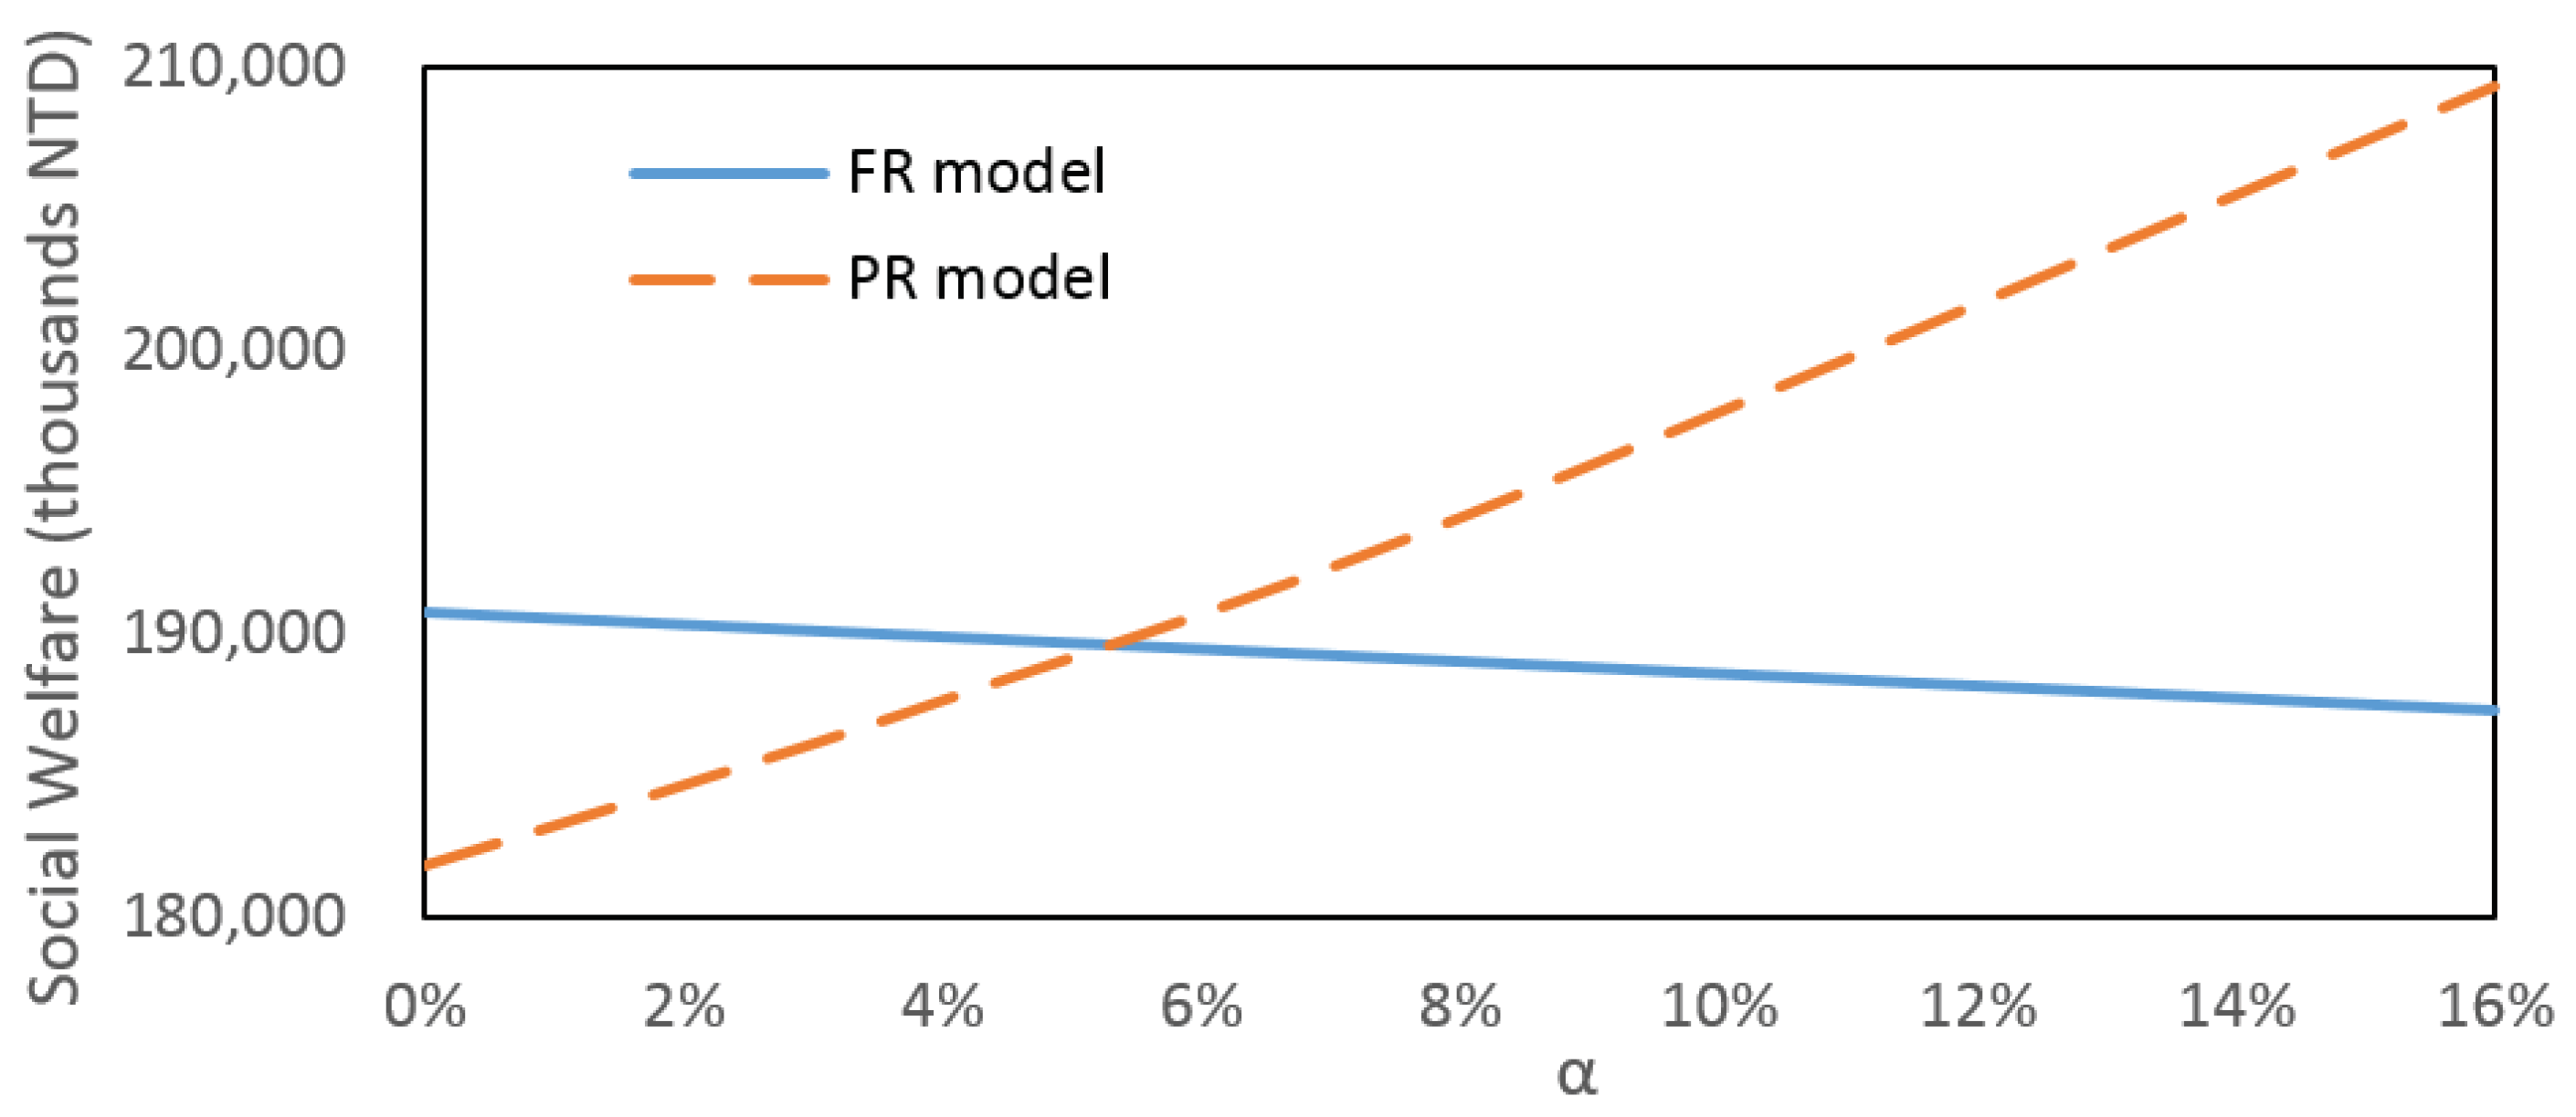
In the following study, we used the FR4 model and PR4 model to represent the FR model and PR model, respectively, because they consider the RPR and URM, which are more practical. In the above discussion, when the expected return rate = 0.97%, the performance of the FR model is better; however, when we look at more cases with increasing values (in recent years, the return rate value increases to around 4%–8% in Taiwan), the results are different and are shown in Table 6 and Figure 6. In the FR model, when is increased, the producer’s profit and consumer surplus are decreased, but the recycler’s profit and environmental externality cost are increased, then finally the social welfare is decreased. The main contribution for the decreasing welfare is the producer, and the reason is due to the ARF increase offered to the government. However, in the PR model, the situation is different. When α is increased, the producer’s profit, recycler’s profit, environmental externality cost, and consumer surplus are all increased, and this leads to an increase in the social welfare. As shown in Table 6 and Figure 6, in the beginning, the social welfare of the PR model is less than the FR model, but when = 8% or below, the social welfare of the PR model is greater than the FR model. The main contributions are the increasing rate of producer’s profit (from sales volume and savings from using used products), consumer surplus (from sales volume of new products), and recycler’s profit (from return revenue of the consumer). Here, we obtained significant insight for the government and producer in that, when the return rate is low, then the FR model is better; whereas, when the return rate is higher, then the PR model can be used.
3.3.3. The Effect of Repair Rate
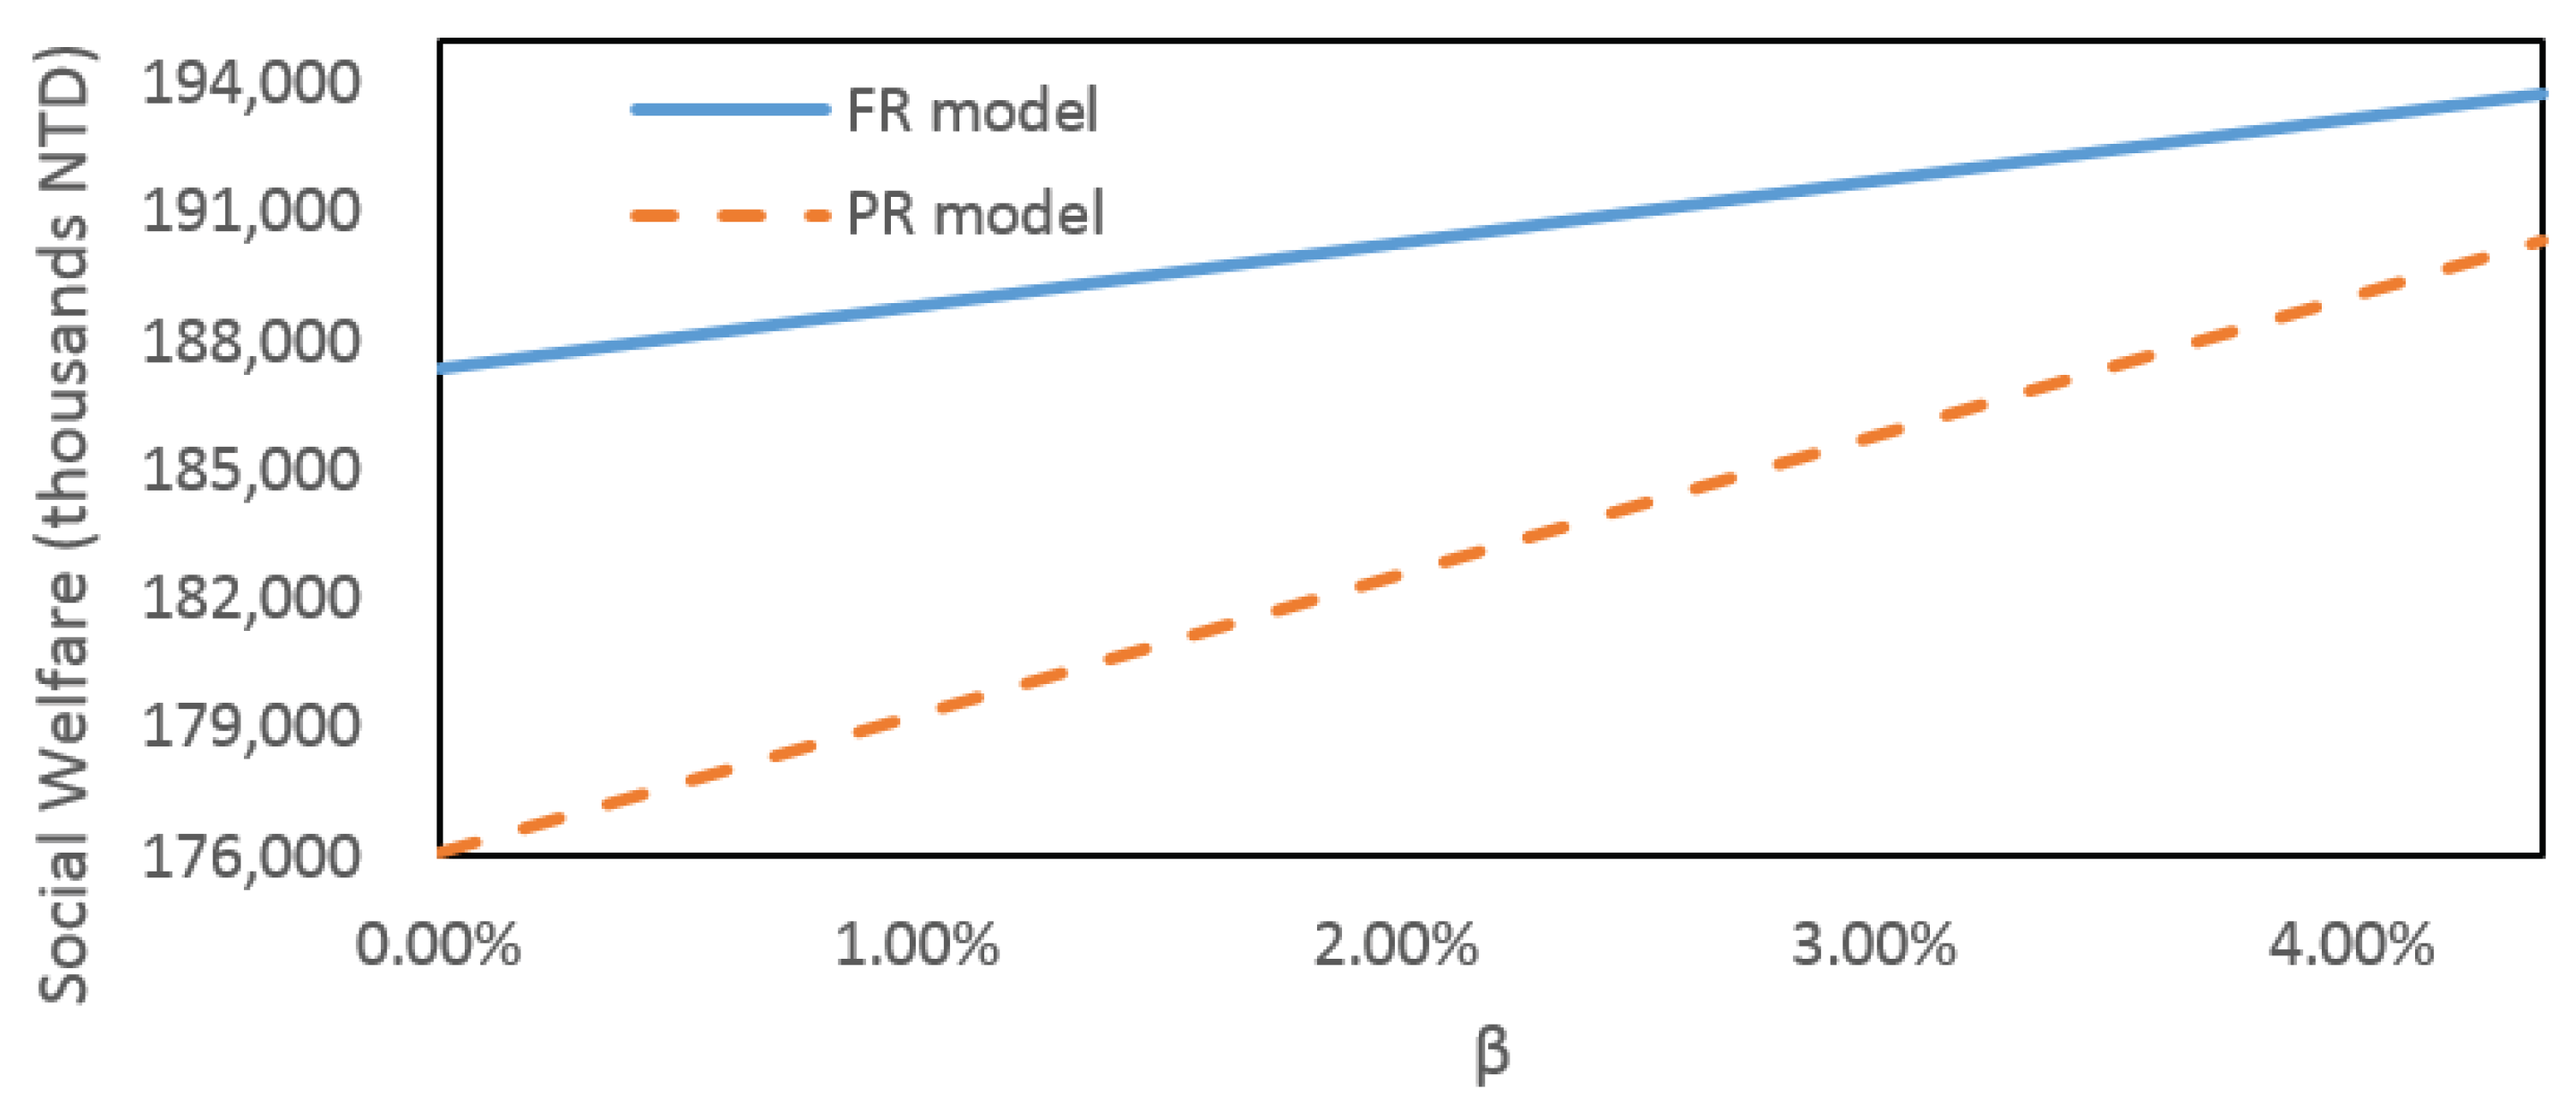
Figure 7 shows the effect of parameter β (repair rate) on the social welfare value. This research assumed that the producer has the responsibility for the repair of the broken product under the warranty period, and the broken parts or products after replacement will be sent to the recycler for recycling. When β increases, the social welfare also increases for both FR and PR models. The main contribution is from the recycler; its profit increases more than the other partners. In addition, the recycler’s profit in the PR model increases more significantly than that in the FR model as β increases; in turn, its social welfare increases faster.
3.3.4. The Effect of Recycling
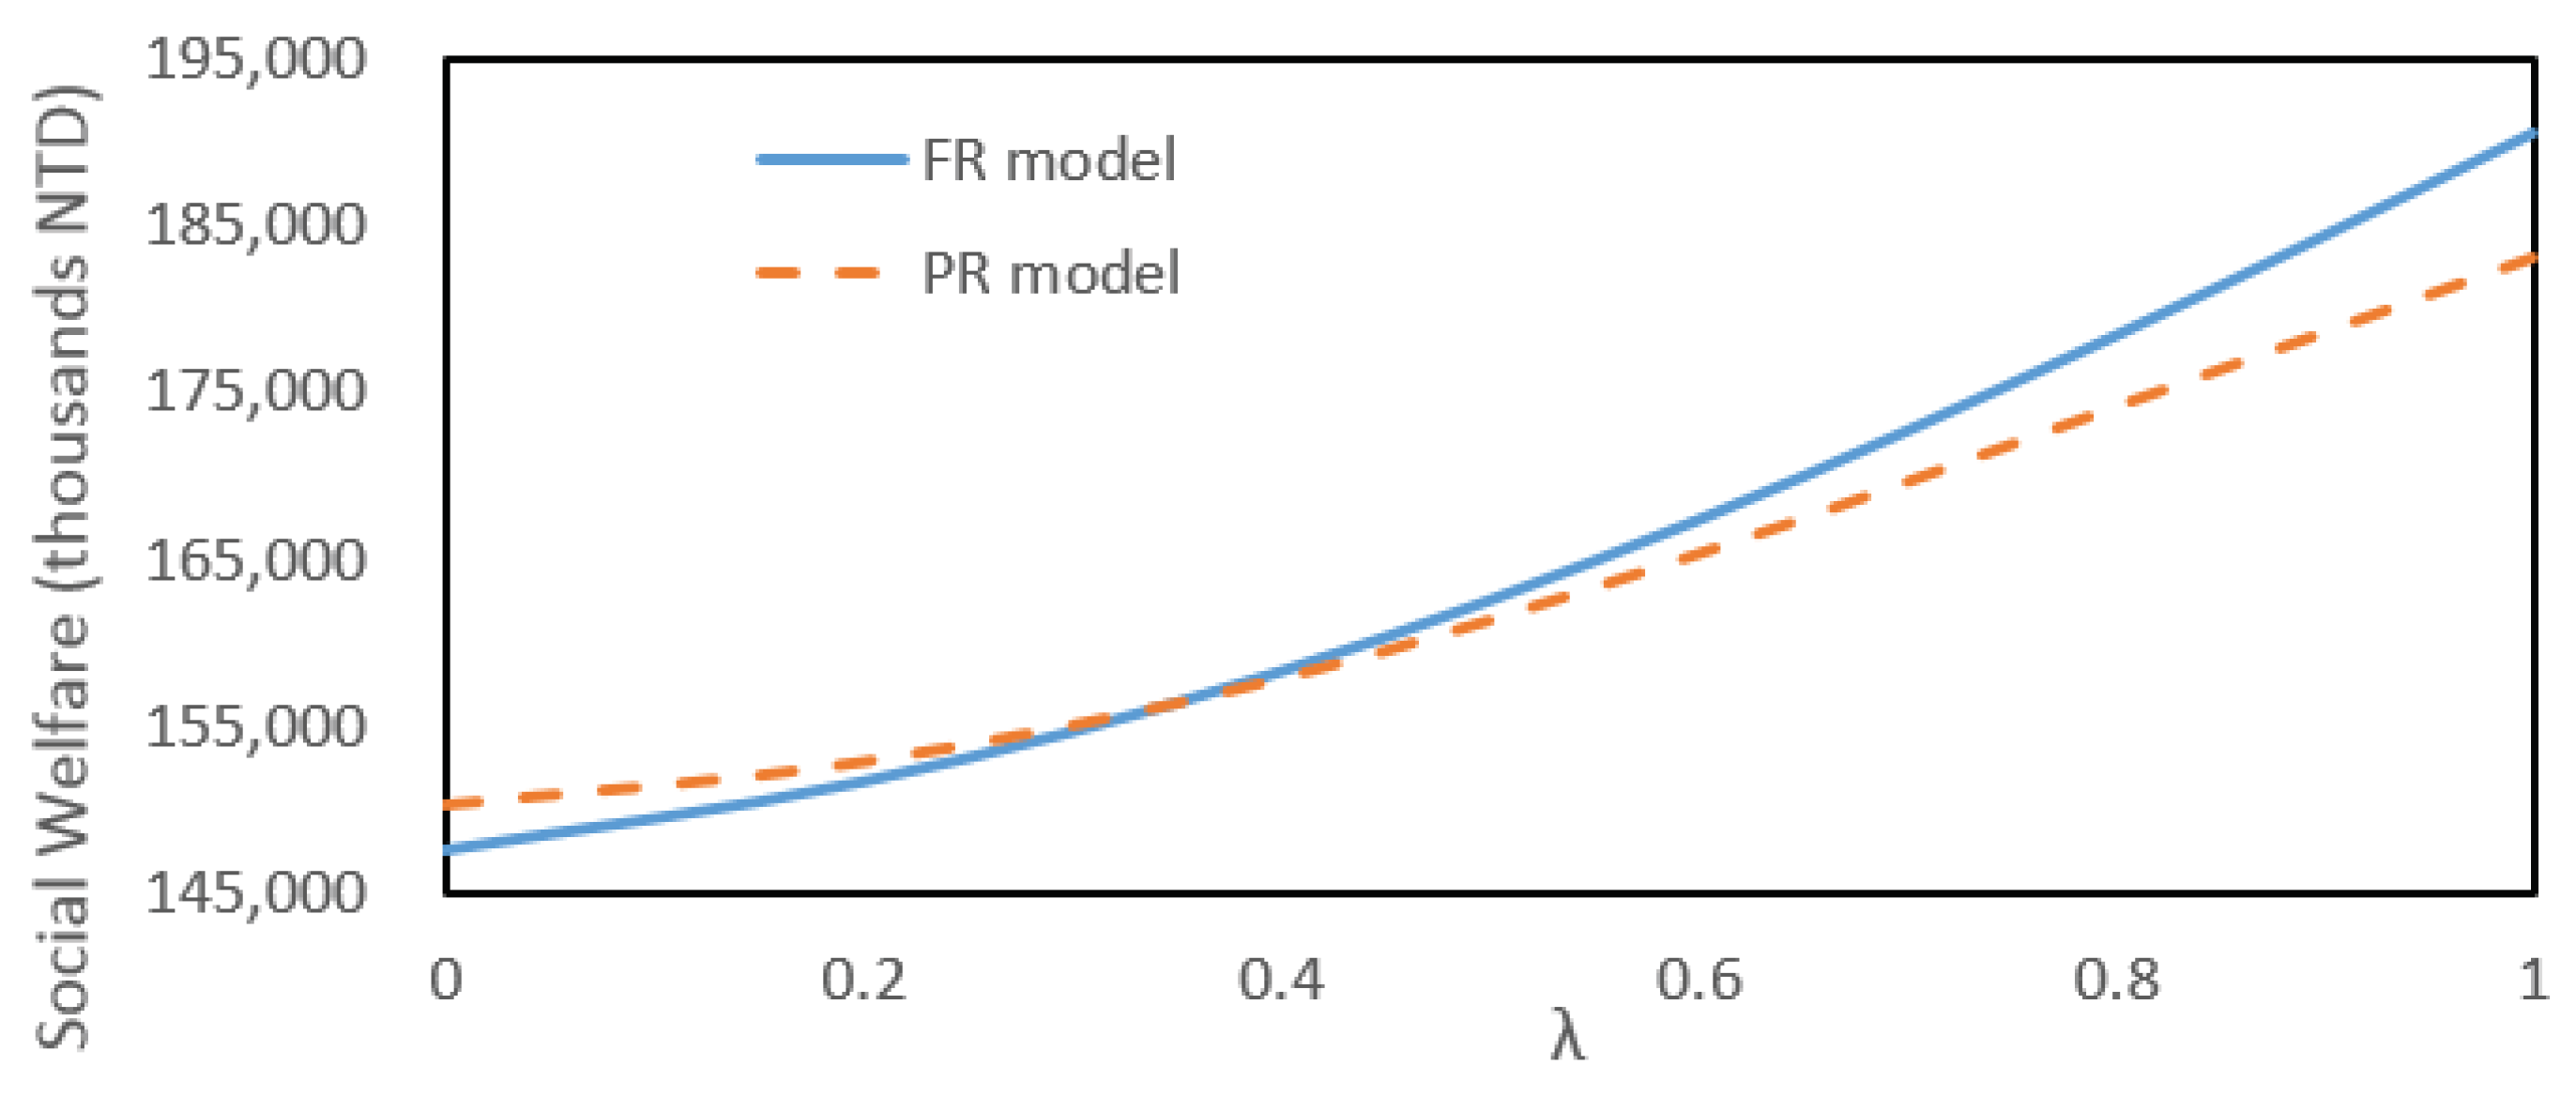
In Figure 8, when = = λ = 100%, the social welfare has the highest value for both FR and PR models. If we do not reuse the materials at all, the social welfare will drop 22.5% and 17.9% in the FR and PR models, respectively, which indicates that λ is a very significant factor. The main contribution for the drop is from the recycler (94.8% and 72.4% for both models), then the producer (4.9% and 23.3%). In other words, the recycling benefits to the producer and recycler are significant.
3.3.5. Sensitivity Analysis
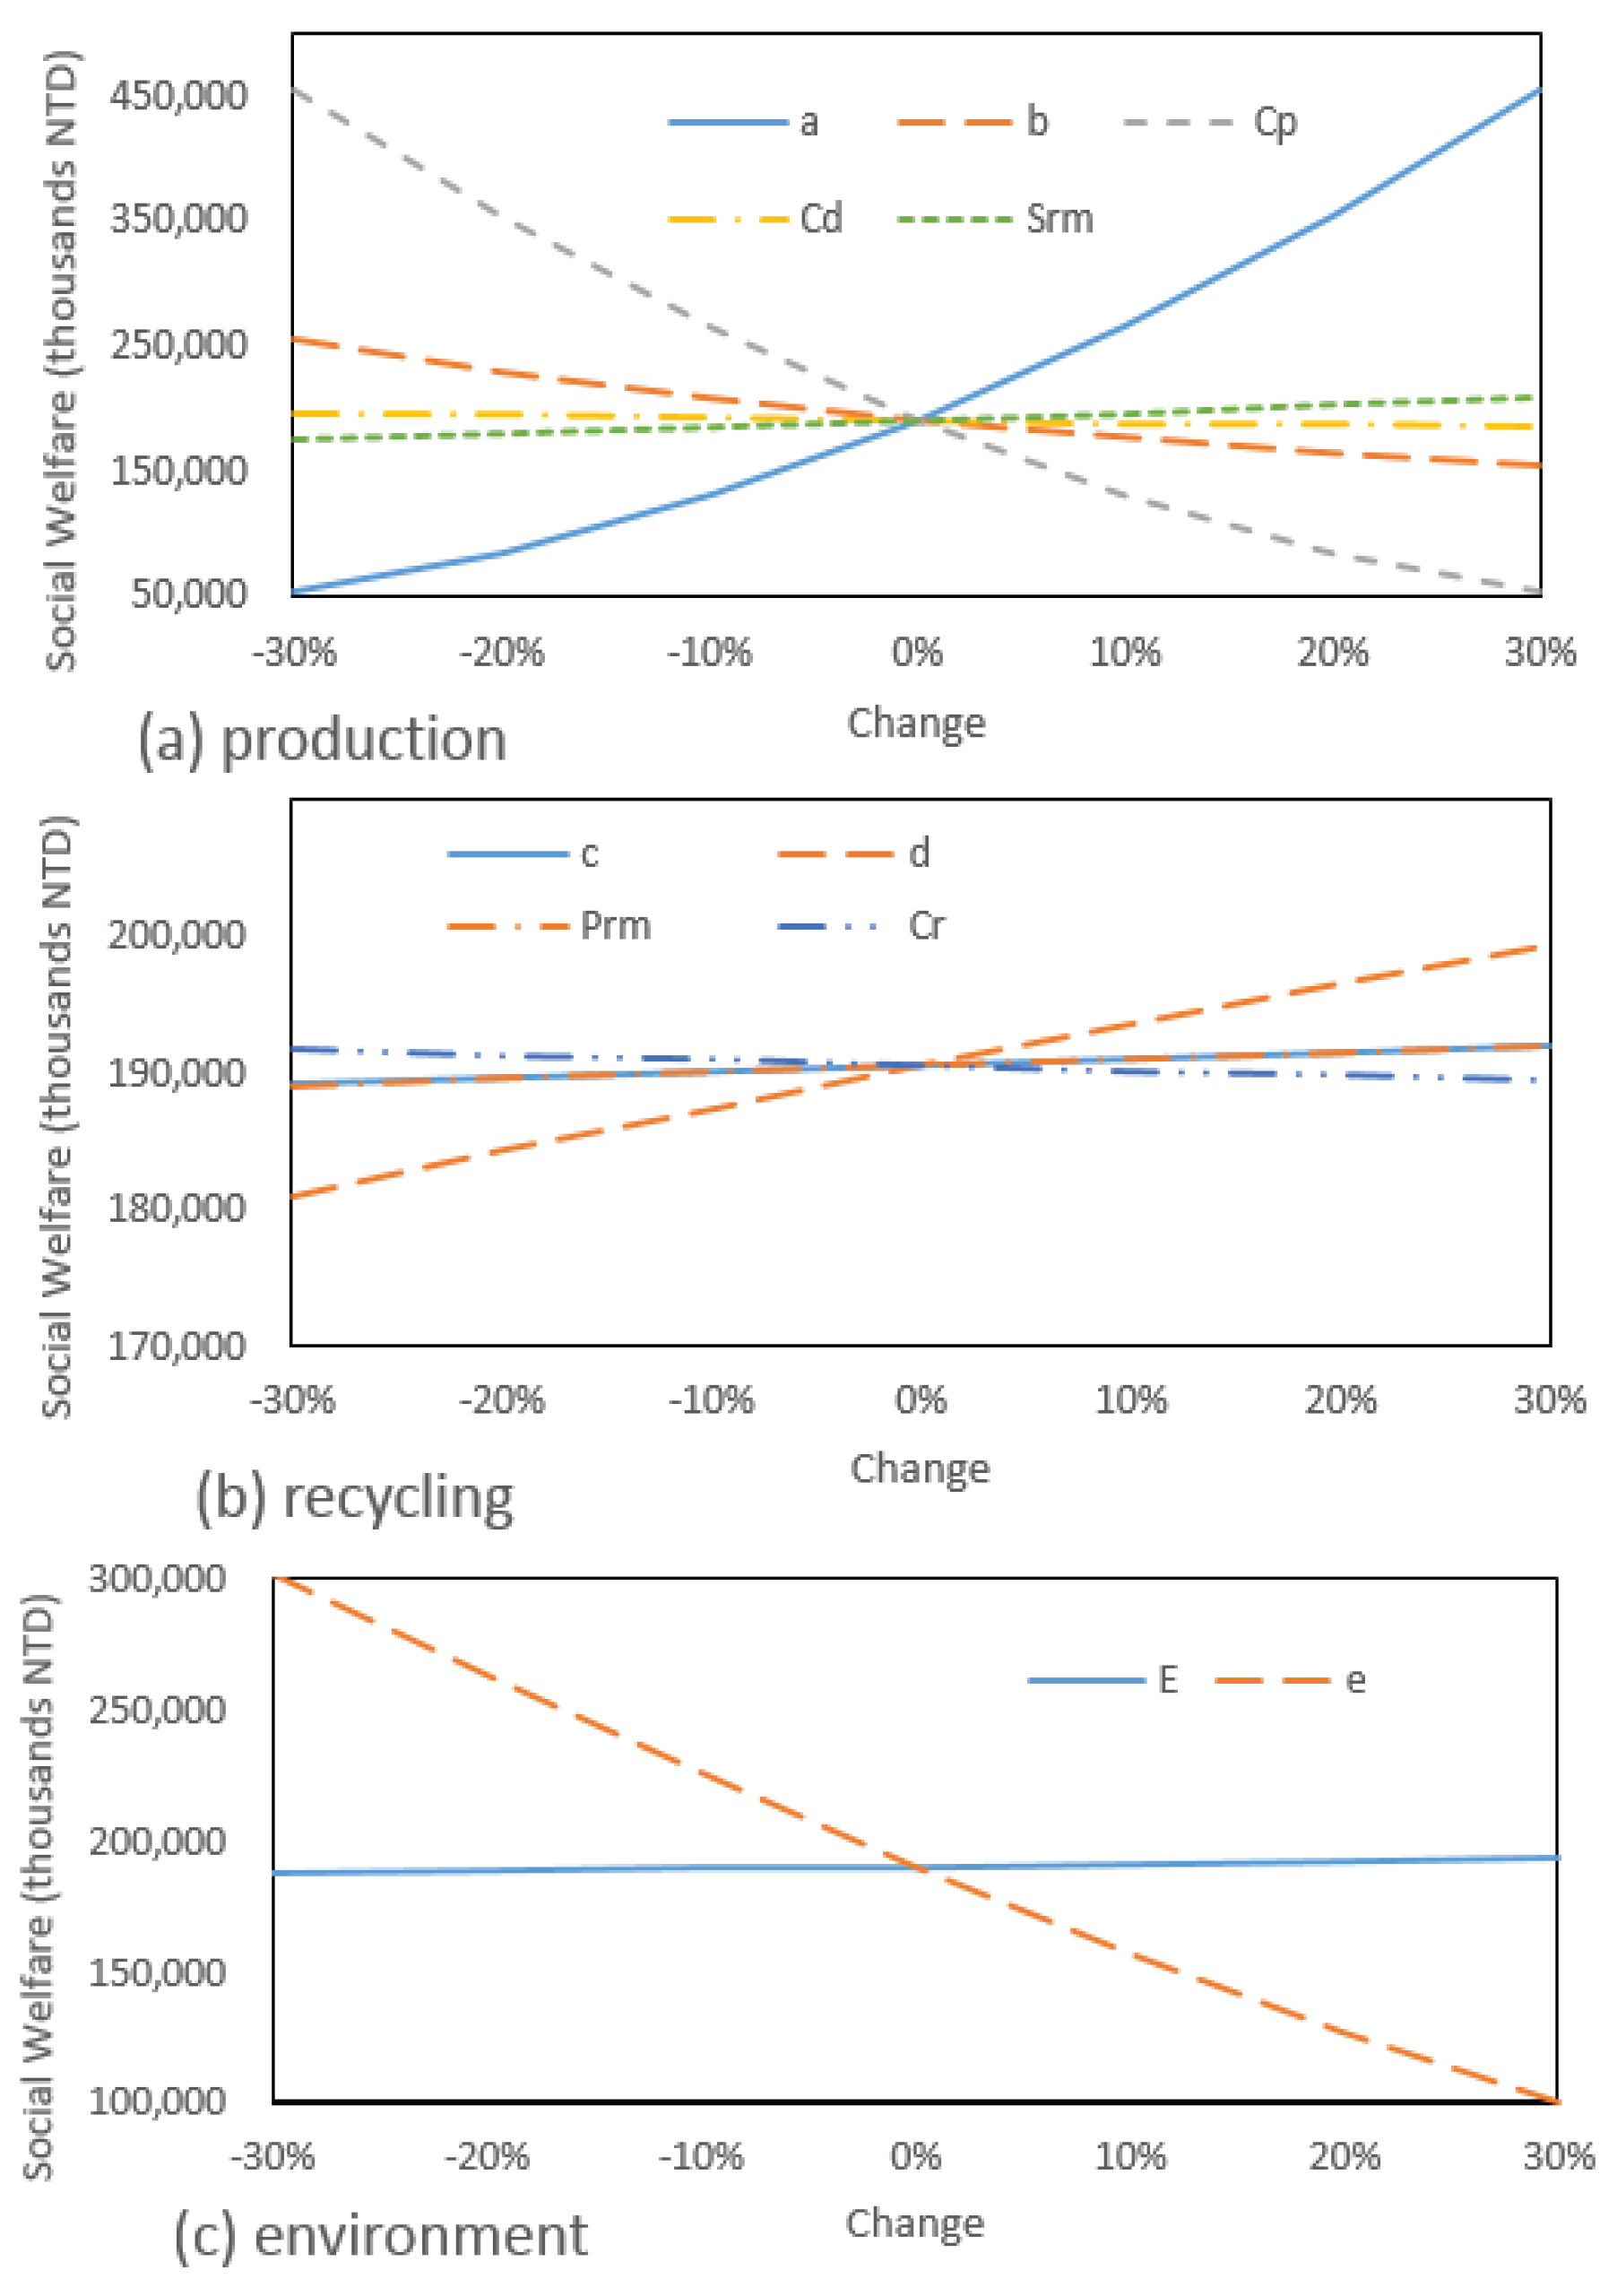
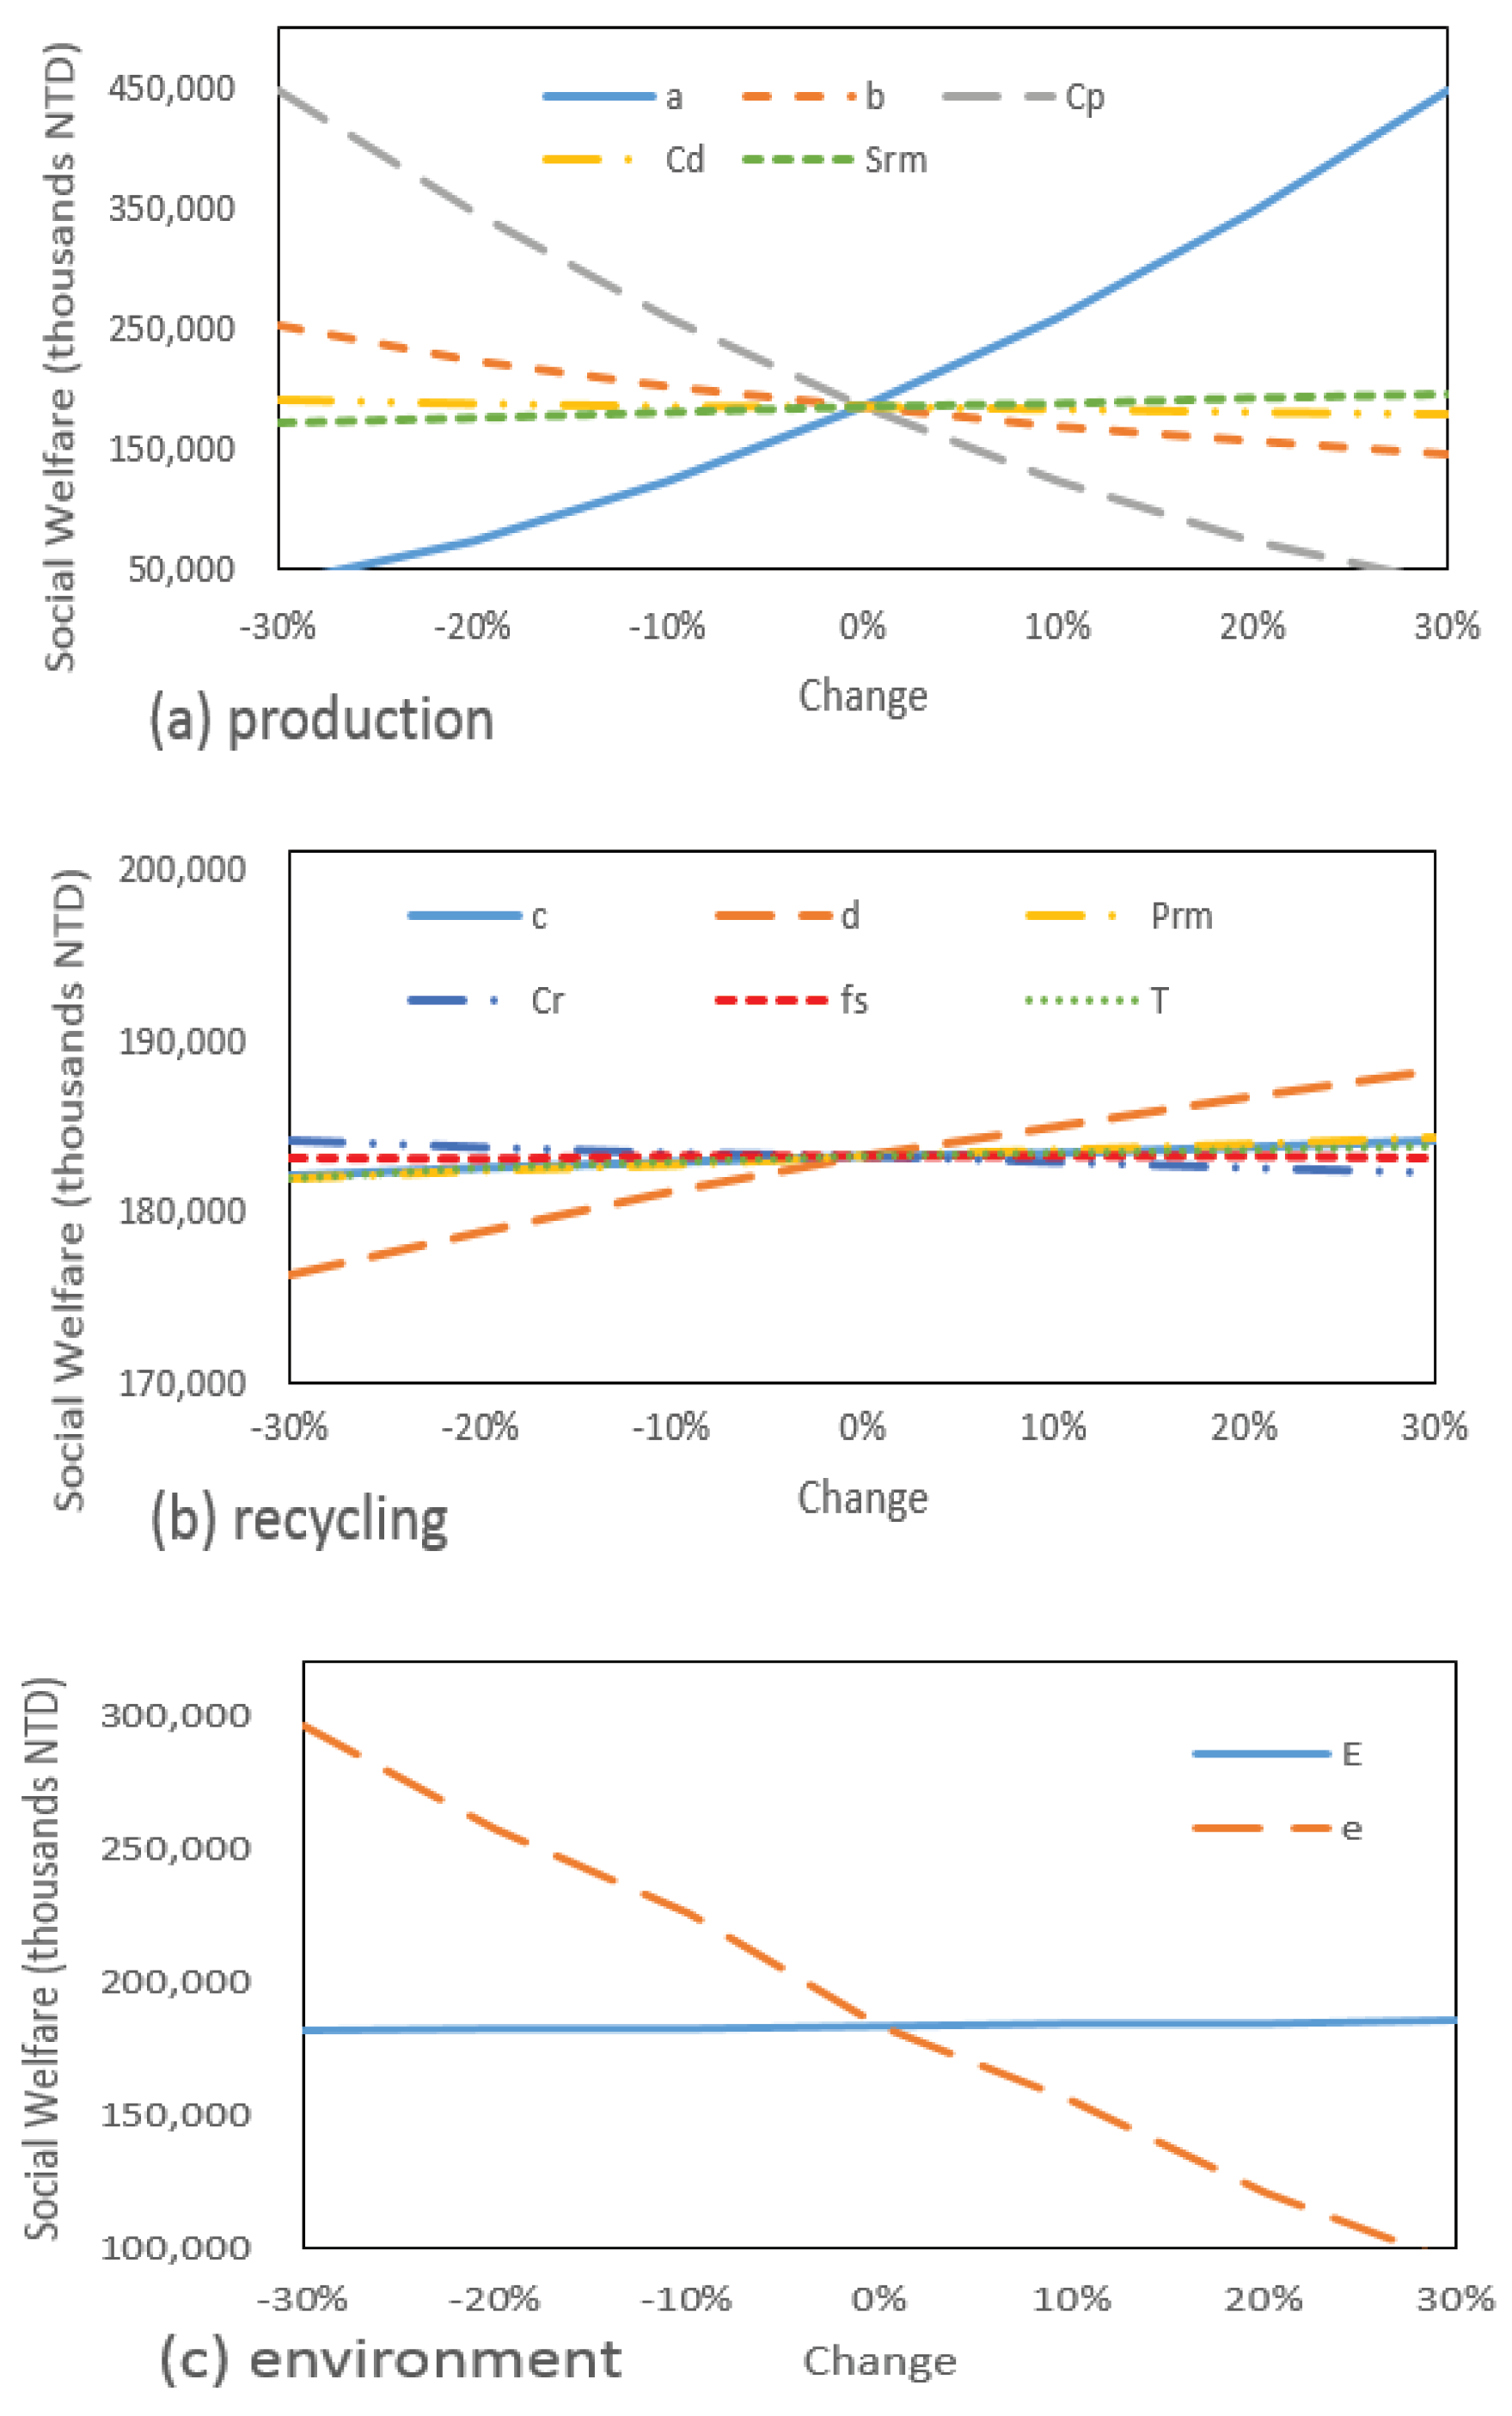
In order to cover more span for the data collected, besides the above analyses, we conducted a sensitivity analysis for other parameters used for developing the two EPR models to study their effect on the social welfare. By changing the reference data of each parameter ±10%, ±20%, and ±30%, their effects on the social welfare are shown in Figure 9 and Figure 10 for the FR and PR models, respectively. Their results are also summarized in Table 7 and Table 8. Parameters going with the same trend as the social welfare are: a, Srm, c, d, Prm, E, fs, and T; others change in the opposite direction. The effect of some parameters, such as a, b, Cp, and e, for both EPR models on the social welfare is significant, whereas the effect of parameters c, Prm, Cr, fs, and T on the social welfare is very minor, as shown in Table 7 and Table 8. In both Figure 9 and Figure 10, we also divide the parameters into three categories: production, recycling, and environment. Most parameters in the production category, such as a, b, Cp and Srm, have higher impact than those in the recycling category. Each parameter affects the social welfare similarly for both models, but almost all the parameters in the FR model have a higher effect on the social welfare than the PR model.
In order to study further for the above sensitivity analysis, in the following we examined which partner is affected more or contributes more to the social welfare change for some representative parameters in different categories (production, recycling, and environment) of the two models. Table 9, Table 10 and Table 11 are for the FR model. For the production parameters in the FR model, we chose two critical parameters: Cp and Srm. Table 9 shows that, when Cp changes, the impact order of the partner’s profits or costs is the producer, consumer, environment, and recycler. The reason is that when Cp (production cost) decreases, the direct effect is that the producer’s profit increases; in turn, it will increase sales volume, then this will cause the consumer surplus and environment cost to be increased, and finally the social welfare increases; and vice versa. Srm has a positive effect on the social welfare, and it has a big effect on the recycler, and the reason is that, saving more on using recycled materials, the recycler will be benefited more. For the recycling parameters, we chose main parameters Cr and Prm. Table 10 shows that they affect the recycler’s profit most. The recycling cost (Cr) is what the recycler pays for the recycling process, so it has a negative impact on the recycler profit and on the social welfare as well. The sale price of recycled material (Prm) has a positive impact on the recycler profit and the social welfare. Environment parameter e has a strong effect on the social welfare and other profits or costs compared to parameter E in the FR model. When parameter e increases, the ARF (Pr) and s increase, then the increased ARF will cause a decrease in the producer’s profit, but the increased s will cause an increase in the recycler’s profit. Basically, the higher e value causes an increase in the environment cost. Finally, parameter e has a negative effect on the social welfare.
Data shown in Table 12, Table 13 and Table 14 are for the PR model. Comparing with the FR model, they are similar. A comparison for the production parameters is shown in Table 12. When Cp (production cost) changes, the impact order on the partner’s profits or costs is consumer, producer, environment, and recycler; however, the producer’s profit change is still the largest. The reason is that, when Cp increases, the producer’s profit decreases in the direct way; in turn, it will decrease the sales volume, then this will cause the consumer surplus and environment cost to be decreased, and finally the welfare decreases; and vice versa. When Srm increases, we can save more on using recycled materials, and it will benefit the producer, recycler, and the environment; in turn, it has a positive effect on the social welfare. For the recycling parameters Cr and Prm, Table 13 shows similar results as in the FR model, and the only difference is that the impact on all partners is smaller. As shown in Table 14, environment parameter e still has a strong effect on the social welfare and other profits or costs compared to parameter E in the PR model. When parameter e decreases by 30%, the order of the contribution to the social welfare change is the environment, consumer, producer, and recycler. However, when parameter e increases by 30%, the order of the contribution to the social welfare change is the consumer, producer, environment, and recycler. In addition, in the PR model, when parameter e increases, the s increases (from Equation (25)), then the producer’s profit and consumer surplus decrease, but the recycler’s profit and environment cost increase. Finally, parameter e has a negative effect on the social welfare.
4. Conclusions
EPR is a legislative mandate that requires producers to be accountable for the whole life cycle of its products. Basically, EPR has two types: financial responsibility and physical responsibility. This study has developed a social welfare model for both types of EPR, namely, the FR model and the PR model, respectively. Both models considered the effect of repaired parts recycling and using recycled materials in production, which are more practical but not considered in the literature. Actually, the development of the PR model is new to the literature. In addition, when both FR and PR models consider the effect of repaired parts recycling and using recycled materials in production, they have the highest recycler’s profit and the lowest environment cost, which are good for our environment.
This study used notebook computers as an example and was based on the social welfare model to compare them, and we obtained significant insight for the government and producer when they are making related policies. When the return rate is low (less than 5% in our case), then the FR model is better; whereas, when the return rate is higher, then the PR model outperforms the FR model.
Besides the effect of return rate, repair rate and recycling were studied for supporting the above conclusions; a sensitivity analysis of each parameter used in the two models was also performed in order to cover the shortage of the data used in this study. Parameters a, Srm, c, d, Prm, E, fs, and T change the same trend as the social welfare, but others change in the opposite direction. The effect of parameters a, b, Cp, and e for both EPR models on the social welfare is very significant, whereas the effect of parameters c, Prm, Cr, fs, and T on the social welfare is very minor. Most parameters in the production category, such as a, b, Cp and Srm, have higher impact than those in the recycling category. Each parameter affects the social welfare similarly for both models, but almost all the parameters in the FR model have higher effect on the social welfare than the PR model.
This study can be extended through considering other factors that affect the fee and demand of the new product and recycling market, such as time and the marketing and advertising impact of the green movement. Moreover, knowing the benefits of recycling, similar studies for other e-scrap products such as TVs, refrigerators, and washing machines can result in a relative increase of WEEE recycled. Lastly, a similar study for other geographical areas can also be done; however, different nationalities might be a big issue for choosing a different EPR system, which might be different from our study systems, and needs to pay more attention to the effectiveness and cooperation between stakeholders. Meanwhile, besides the responsibility of producer, the awareness sharing for other partners can be studied further.
Author Contributions
All authors designed the research and wrote the manuscript. A.R.B. and J.P.V. collected and analyzed the data. H.R. controlled the quality assurance. All authors have read and agreed to the published version of the manuscript.
Funding
This research was funded by the Ministry of Science and Technology of the Republic of China, grant numbers MOST 107-2221-E-033-054-MY3 and MOST 108-2221-E-033-011 and The APC was funded by the grant of MOST 107-2221-E-033-054-MY3.
Acknowledgments
This work was supported in part by the Ministry of Science and Technology of the Republic of China under grants MOST 107-2221-E-033-054-MY3 and MOST 108-2221-E-033-011.
Conflicts of Interest
The authors declare no conflict of interest.
References
- Balde, C.P.; Kuehr, R.; Blumenthal, K.; Fondeur, G.S.; Kern, M.; Micheli, P.; Magpantay, E.; Huisman, J. E-Waste Statistics: Guidelines on Classifications, Reporting and Indicators; United Nations University, IAS-SCYCLE: Bonn, Germany, 2015. [Google Scholar]
- Semuels, A. The world has an e-waste problem. TIME, 23 May 2019. [Google Scholar]
- EU. WEEE-Directive 2002/96/EC. Available online: https://eur-lex.europa.eu/legal-content/EN/TXT/?uri=CELEX%3A32002L0096 (accessed on 18 November 2019).
- Zhang, L.; Krumdick, G.K. Recycling of Electronic Waste II: Proceedings of the Second Symposium; John Wiley & Sons, Inc.: San Diego, CA, USA, 2011. [Google Scholar]
- Shukla, V.; Kumar, N. Environmental Concerns and Sustainable Development: Volume 2: Biodiversity, Soil and Waste Management; Springer: Singapore, 2020. [Google Scholar]
- Sthiannopkao, S.; Wong, M. Handling e-waste in developed and developing countries: Initiatives, practices, and consequences. Sci. Total Environ. 2013, 463, 1147–1153. [Google Scholar] [CrossRef] [PubMed]
- Forti, V.; Baldé, C.P.; Kuehr, R. E-Waste Statistics: Guidelines on Classifications, Reporting and Indicators, 2nd ed.; United Nations University; ViE-SCYCLE: Bonn, Germany, 2018. [Google Scholar]
- Baldé, C.P.; Forti, V.; Gray, V.; Kuehr, R.; Stegmann, P. The Global E-Waste Monitor–2017; United Nations University (UNU); International Telecommunication Union (ITU) & International Solid Waste Association (ISWA): Bonn, Germany; Geneva, The Netherlands; Vienna, Austria, 2017. [Google Scholar]
- Leblanc, R. E-Waste Recycling Facts and Figures, the Balance Small Business. Available online: https://www.thebalancesmb.com/e-waste-recycling-facts-and-figures-2878189 (accessed on 20 January 2020).
- SDG. Sustainable Development Goals. 2015. Available online: https://www.un.org/sustainabledevelopment/sustainable-development-goals/ (accessed on 10 October 2019).
- OECD. Extended Producer Responsibility: Updated Guidance for Efficient Waste Management; OECD Publishing: Paris, France, 2016. [Google Scholar]
- Khan, A.; Inamuddin; Asiri, A.M. E-Waste Recycling and Management: Present Scenarios and Environmental Issues; Springer: Basel, Switzerland, 2020. [Google Scholar]
- Lindhqvist, T.; Lidgren, K. Models for Extended Producer Responsibility. In From the Cradle to the Grave—Six Studies of the Environmental Impact of Products; The Ministry of the Environment: Stockholm, Sweden, 1991. [Google Scholar]
- Organization for Economic Co-Operation and Development (OECD). Extended Producer Responsibility—A Guidance Manual for Governments; Organization for Economic Co-Operation and Development: Paris, France, 2001. [Google Scholar]
- OCED. Extended Producer Responsibility. Available online: http://www.oecd.org/environment/extended-producer-responsibility.htm (accessed on 24 August 2019).
- van Rossem, C.; Tojo, N.; Lindhqvist, T. Extended Producer Responsibility—An Examination of Its Impact on Innovation and Greening Products; International Institute for Industrial Environmental Economics (IIIEE): Lund, Sweden, 2006. [Google Scholar]
- Sander, K.; Schilling, S.; Tojo, N.; van Rossem, C.; Vernon, J.; George, C. The Producer Responsibility Principle of the WEEE Directive, Final Report to the European Commission. 19 August 2009. Available online: http://ec.europa.eu/environment/waste/weee/pdf/final_rep_okopol.pdf. (accessed on 24 September 2019).
- Chung, S.W.; Murakami-Suzuki, R. A Comparative Study of e-Waste Recycling Systems in Japan, South Korea and Taiwan from the EPR Perspective: Implications for Developing Countries. 2008. Available online: https://www.semanticscholar.org/paper/A-comparative-study-of-E-waste-recycling-systems-in-Chung-Rie/0450d8b3f2048688d6763019844c163b9daf0025 (accessed on 25 January 2014).
- Monier, V.; Hestin, M.; Cavé, J.; Laureysens, I.; Watkins, E.; Reisinger, H.; Porsch, L. Development of Guidance on Extended Producer Responsibility (EPR); European Commission—DG Environment: Brussels, Belgium, 2014. [Google Scholar]
- Smith, S. Analytical Framework for Evaluating the Costs and Benefits of Extended Producer Responsibility Programmes; OECD Papers; OECD: Paris, France, 2005. [Google Scholar]
- UNEP. Draft Practical Manuals on Extended Producer Responsibility and on Financing Systems for Environmentally Sound Management. 2017. Available online: http://www.basel.int/Implementation/CountryLedInitiative/EnvironmentallySoundManagement/ESMToolkit/Practicalmanuals/tabid/5847/Default.aspx (accessed on 28 February 2020).
- Lee, S.; Na, S. E-Waste Recycling systems and sound circulative economies in East Asia: A comparative analysis of systems in Japan, South Korea, China and Taiwan. Sustainability 2010, 2, 1632–1644. [Google Scholar] [CrossRef] [Green Version]
- Ng, T. Information Note: South Korea’s Waste Management Policies. Research Office of the Legislative Council Secretariat, HKSAR Legislative Council. Available online: http://www.legco.gov.hk/yr12-13/english/sec/library/1213inc04-e.pdf (accessed on 15 November 2019).
- Manomaivibool, P.; Hong, J.H. Two decades, three WEEE systems: How far did EPR evolve in Korea’s resource circulation policy? Res. Conserv. Recycl. 2014, 83, 202–212. [Google Scholar] [CrossRef]
- Heo, H.; Jung, M.-H. Case study for OECD project on extended producer responsibility, Republic of Korea. 2014. Available online: www.oecd.org/environment/waste/OECD_EPR_case_study_Korea_revised_140522.pdf (accessed on 24 September 2019).
- Cho, I.-H.; Kang, M. Comprehensive Study of Waste Management Policies & Practices in Korea and Recommendations for LDCs and MICs; UNDP Report; UNDP: Seoul, Korea, 2017. [Google Scholar]
- Hong, H.; Ke, J.-S. Determining Advanced recycling fees and subsidies in “E-scrap” reverse supply chains. J. Environ. Manag. 2011, 92, 1495–1502. [Google Scholar] [CrossRef] [PubMed]
- Hong, I.-H.; Chang, Y.-C.; Cheng, C.-S. Studies on subsidy and disposal fee determination in e-scrap reverse supply chains. In Proceedings of the 8th Asia Pacific Industrial Engineering & Management System, Kaohsiung, Taiwan, 9–12 December 2007. [Google Scholar]
- Sands, A.; Tseng, V. 1 in 3 Laptops Fail Over 3 Years: Netbooks Fail 20% more than Laptops; ASUS & Toshiba the Most Reliable; Square Trade, Inc.: San Francisco, CA, USA, 2009. [Google Scholar]
Figure 1.
Global e-waste generated [8] (2017–2021 are estimates).
Figure 1.
Global e-waste generated [8] (2017–2021 are estimates).

Figure 2.
Extended producer responsibility (EPR) system in Taiwan [18].
Figure 2.
Extended producer responsibility (EPR) system in Taiwan [18].

Figure 3.
EPR system in South Korea [25]. PRO: Producer Responsibility Organization.
Figure 3.
EPR system in South Korea [25]. PRO: Producer Responsibility Organization.

Figure 4.
Various flows in the financial responsibility model (FR model).

Figure 5.
Various flows in the physical responsibility model (PR model).

Figure 6.
Impact of parameter α on the social welfare value.

Figure 7.
Impact of parameter β on the social welfare value.

Figure 8.
Impact of parameter λ on the social welfare value.

Figure 9.
A sensitivity analysis for parameters of (a), (b) and (c) areas used in the FR model.

Figure 10.
A sensitivity analysis for parameters of (a), (b) and (c) areas used in the PR model.


Table 1.
Roles and responsibilities of each player under the EPR system in Taiwan.
| Players | Role and Responsibilities |
|---|---|
| Producers | Pay advanced recycling fee (ARF) to government |
| Consumers | Separate and dispose of recyclable goods |
| Government | Environment Protection Administration (EPA)
|
| Recyclers/Collectors |
|
Table 2.
Roles and responsibilities of each player under the EPR system in South Korea [26].
Table 2.
Roles and responsibilities of each player under the EPR system in South Korea [26].
| Players | Role and Responsibilities |
|---|---|
| Producers |
|
| Consumers | Separate and dispose of recyclable goods with a fee |
| Government | Local government:
|
| Korea Environment Corporation (K-eco) |
|
| Recyclers/Collector |
|
Table 3.
Parameters and decision variables used in the models.
| Parameter | |
|---|---|
| the price of a notebook computer if it has no demand | |
| the sensitivity of the price with respect to the product demand | |
| the base quantity of used products collected if there is no reward money | |
| expected repair cost per unit | |
| production cost per unit | |
| recycling processes cost | |
| the sensitivity of quantity collected with respect to the rate of reward money | |
| direct pollution cost per demand unit | |
| indirect pollution cost of uncollected e-scraps | |
| coefficient of additional recycling charge | |
| additional recycling charge | |
| collection fee | |
| selling price per unit | |
| price of the recycled materials sold per unit | |
| reward money per unit | |
| quantity of notebook computers collected | |
| the amount of used products collected by the producer through product replacement | |
| the expected number of used products collected by the recycler | |
| product demand | |
| savings from using recycled materials per unit | |
| target recycling rate | |
| expected return rate of end-of-life products | |
| repair proportion of the demand | |
| the percentage of collections used for production | |
| the percentage of collections used for material sales | |
| decision variable | |
| advanced recycling fee per unit | |
| subsidy | |
| penalty | |
Table 4.
A comparison among four FR models (unit: NTD).
| Model | FR1 Model | FR2 Model | FR3 Model | FR4 Model |
|---|---|---|---|---|
| Producer’s Profit | 332,584,704 | 293,629,062 | 335,026,431 | 308,839,249 |
| Recycler’s Profit | 1,922,000 | 3,267,305 | 57,757,730 | 63,377,764 |
| Government’s Profit | 60,710,792 | 73,844,519 | 0 | 0 |
| Environment Cost | 395,217,496 | 370,740,938 | 354,658,275 | 336,902,825 |
| Consumer Surplus | 167,057,352 | 147,579,531 | 168,428,240 | 155,219,588 |
| Social Welfare | 167,057,352 | 147,579,479 | 206,554,126 | 190,533,776 |
Table 5.
A comparison among four PR models (unit: NTD).
| Model | PR1 Model | PR2 Model | PR3 Model | PR4 Model |
|---|---|---|---|---|
| Producer’s Profit | 333,874,284 | 271,909,097 | 378,943,110 | 354,447,638 |
| Recycler’s Profit | 2,951,945 | 8,670,809 | 26,153,964 | 31,389,820 |
| Government’s Profit | 59,793,268 | 90,472,822 | 0 | 0 |
| Environment Cost | 396,027,497 | 353,146,057 | 366,077,029 | 339,420,188 |
| Consumer Surplus | 166,100,353 | 132,469,852 | 156,548,862 | 136,733,799 |
| Social Welfare | 166,692,352 | 150,376,523 | 195,568,905 | 183,151,068 |
Table 6.
A comparison between two EPR models with various .
| FR or PR Model/α | Producer’s Profit | Recycler’s Profit | Environment Cost | Consumer Surplus | Social Welfare |
|---|---|---|---|---|---|
| FR/1% | 308,834,163 | 63,380,277 | 336,904,795 | 155,217,682 | 190,527,327 |
| 2% | 308,664,276 | 63,464,166 | 336,970,039 | 155,154,021 | 190,312,424 |
| 4% | 308,324,051 | 63,631,905 | 337,099,585 | 155,026,514 | 189,882,885 |
| 8% | 307,639,091 | 63,968,549 | 337,352,500 | 154,769,738 | 189,024,878 |
| 16% | 306,252,586 | 64,645,676 | 337,834,734 | 154,249,669 | 187,313,197 |
| PR/1% | 354,484,702 | 31,399,205 | 339,443,014 | 136,752,675 | 183,193,570 |
| 2% | 355,736,268 | 32,358,715 | 341,934,747 | 137,397,715 | 184,628,434 |
| 4% | 358,361,189 | 32,359,199 | 341,932,088 | 138,819,332 | 187,607,722 |
| 8% | 364,100,748 | 33,712,327 | 345,968,878 | 142,201,476 | 194,045,669 |
| 16% | 377,582,069 | 36,886,945 | 356,493,525 | 151,287,260 | 209,262,746 |
Table 7.
The effect of parameters on social welfare in the FR model when the parameter increases from −30% to 30%.
Table 7.
The effect of parameters on social welfare in the FR model when the parameter increases from −30% to 30%.
| Parameter | a | b | Cp | Cd | Srm | |
| −30% | −71.7% | 34.8% | 137.9% | 2.99% | −8.71% | |
| +30% | 137.9% | −19.0% | −71.7% | −2.94% | 9.55% | |
| Parameter | c | d | Prm | Cr | E | e |
| −30% | −0.73% | −5.02% | −0.76% | 0.60% | −1.47% | 58.5% |
| +30% | 0.72% | 4.65% | 0.77% | −0.59% | 1.49% | −47.0% |
Table 8.
The effect of parameters on social welfare in the PR model when the parameter increases from −30% to 30%.
Table 8.
The effect of parameters on social welfare in the PR model when the parameter increases from −30% to 30%.
| Parameter | a | b | Cp | Cd | Srm | c | d |
| −30% | −79.5% | 37.2% | 144.3% | 3.15% | −6.68% | −0.55% | −3.76% |
| +30% | 144.3% | −20.8% | −79.5% | −3.10% | 6.74% | 0.54% | 2.75% |
| Parameter | Prm | Cr | fs | T | E | e | |
| -30% | −0.66% | 0.51% | −0.01% | −0.64% | −1.07% | 61.8% | |
| +30% | 0.66% | −0.51% | 0.01% | 0.31% | 1.07% | −49.0% |
Table 9.
Partner contribution to the social welfare for production parameters in the FR model.
| Parameter | Cp | Srm | Remark | |||
|---|---|---|---|---|---|---|
| Change | −30% | +30% | −30% | +30% | ||
| Producer’s Profit Change | 99.0% | −73.4% | 2.88% | −0.45% | Producer’s Profit | 308,839,249 |
| Recycler’s Profit Change | −27.4% | −24.0% | −20.7% | 15.0% | Recycler’s Profit | 63,377,764 |
| Environment Cost Change | 51.7% | −65.7% | 6.24% | −5.12% | Environment Cost | 336,902,825 |
| Consumer Surplus Change | 95.7% | −74.8% | 5.58% | −4.60% | Consumer Surplus | 155,219,588 |
| Social Welfare Change | 137.9% | −71.7% | −8.71% | 9.55% | Social Welfare | 190,533,776 |
Table 10.
Partner contribution to the social welfare for recycling parameters in the FR model.
| Parameter | Cr | Prm | ||
|---|---|---|---|---|
| Change | −30% | +30% | −30% | +30% |
| Producer’s Profit Change | −0.23% | 0.24% | 0.31% | −0.30% |
| Recycler’s Profit Change | 1.65% | −1.65% | −2.14% | 2.14% |
| Environment Cost Change | −0.27% | 0.27% | 0.35% | −0.35% |
| Consumer Surplus Change | −0.06% | 0.07% | 0.09% | −0.08% |
| Social Welfare Change | 0.60% | −0.59% | −0.76% | 0.77% |
Table 11.
Partner contribution to the social welfare for environment parameter in the FR model.
| Parameter | E | e | ||
|---|---|---|---|---|
| Change | −30% | +30% | −30% | + 30% |
| Producer’s Profit Change | 1.22% | −1.18% | 16.5% | −38.7% |
| Recycler’s Profit Change | −2.96% | 2.80% | −46.9% | 58.6% |
| Environment Cost Change | 1.81% | −1.80% | −21.1% | −12.4% |
| Consumer Surplus Change | 0.91% | −0.88% | 12.4% | −31.4% |
| Social Welfare Change | −1.47% | 1.49% | 58.5% | −47.0% |
Table 12.
Partner contribution to the social welfare for production parameters in the PR model.
| Parameter | Cp | Srm | Remark | |||
|---|---|---|---|---|---|---|
| Change | −30% | +30% | −30% | +30% | ||
| Producer’s Profit Change | 81.1% | −61.1% | −2.61% | 2.94% | Producer’s Profit | 354,447,638 |
| Recycler’s Profit Change | −24.4% | −31.9% | −4.00% | 2.58% | Recycler’s Profit | 31,389,820 |
| Environment Cost Change | 52.6% | −55.8% | 1.58% | −1.01% | Environment Cost | 339,420,188 |
| Consumer Surplus Change | 119.1% | −79.3% | 2.65% | −1.68% | Consumer Surplus | 36,733,799 |
| Social Welfare Change | 144.3% | −79.5% | −6.68% | 6.74% | Social Welfare | 183,151,068 |
Table 13.
Partner contribution to the social welfare for recycling parameters in the PR model.
| Parameter | Cr | Prm | ||
|---|---|---|---|---|
| Change | −30% | +30% | −30% | +30% |
| Producer’s Profit Change | 0.11% | −0.11% | −0.14% | 0.15% |
| Recycler’s Profit Change | 1.17% | −1.17% | −1.52% | 1.52% |
| Environment Cost Change | −0.04% | 0.04% | 0.05% | −0.05% |
| Consumer Surplus Change | 0.03% | −0.02% | −0.02% | 0.03% |
| Social Welfare Change | 0.51% | −0.51% | −0.66% | 0.66% |
Table 14.
Partner contribution to the social welfare for environment parameters in the PR model.
| Parameter | E | e | ||
|---|---|---|---|---|
| Change | −30% | +30% | −30% | +30% |
| Producer’s Profit Change | 0.11% | −0.11% | 7.68% | −16.0% |
| Recycler’s Profit Change | −0.49% | 0.46% | −51.7% | 24.6% |
| Environment Cost Change | 0.81% | −0.80% | −19.3% | −6.23% |
| Consumer Surplus Change | 0.40% | −0.37% | 27.0% | −45.3% |
| Social Welfare Change | −1.07% | 1.07% | 61.8% | −49.0% |
© 2020 by the authors. Licensee MDPI, Basel, Switzerland. This article is an open access article distributed under the terms and conditions of the Creative Commons Attribution (CC BY) license (http://creativecommons.org/licenses/by/4.0/).
Share and Cite
MDPI and ACS Style
Rau, H.; Bisnar, A.R.; Velasco, J.P. Physical Responsibility Versus Financial Responsibility of Producers for E-Wastes. Sustainability 2020, 12, 4037. https://doi.org/10.3390/su12104037
AMA Style
Rau H, Bisnar AR, Velasco JP. Physical Responsibility Versus Financial Responsibility of Producers for E-Wastes. Sustainability. 2020; 12(10):4037. https://doi.org/10.3390/su12104037
Chicago/Turabian StyleRau, Hsin, Athena Rhae Bisnar, and Jan Patrick Velasco. 2020. "Physical Responsibility Versus Financial Responsibility of Producers for E-Wastes" Sustainability 12, no. 10: 4037. https://doi.org/10.3390/su12104037
Note that from the first issue of 2016, this journal uses article numbers instead of page numbers. See further details here.