Managing a Sustainable and Resilient Perishable Food Supply Chain (PFSC) after an Outbreak


1
Sustainable International Business, International Business School Maastricht, Zuyd University of Applied Sciences, 6217 HB Maastricht, The Netherlands
2
Faculty of Management, Open University of the Netherlands, 6419 AT Heerlen, The Netherlands
*
Author to whom correspondence should be addressed.
Sustainability 2020, 12(12), 5004; https://doi.org/10.3390/su12125004
Submission received: 7 May 2020
/
Revised: 12 June 2020
/
Accepted: 16 June 2020
/
Published: 18 June 2020
(This article belongs to the Special Issue Supply Chain Risk Management)
Abstract
:It is a challenging task to manage a perishable food supply chain (PFSC), due to the product’s short lifetime and to demand uncertainty. Even worse is the fact that, because of the multitude of participating stakeholders in production, distribution, and retailing, the PFSC becomes complex and thus particularly vulnerable to crises. Product shortages that result from an outbreak like COVID-19 often cause customers to seek alternative sources of supply, possibly with a larger purchasing amount (i.e., hoarding), leading to even severer demand uncertainty after the shortage period. To manage a sustainable and resilient PFSC after an outbreak, supply chain partners need to share and use the right information to facilitate decision making. A system dynamics simulation was thus applied to study a cheese supply chain with three tiers. Three scenarios that cause product shortages were simulated. Seven balanced feedback loops and two reinforced feedback loops were identified from the simulation model. Through the feedback loop dominance analysis, we identified four dominant loops that facilitate the generation of endogenous demand. In order to alleviate the negative influence of endogenous demand, it is suggested that the information sharing that causes endogenous demand be stopped and a loosely coupled strategy to support decision making utilized.
1. Introduction
It is a challenging task to manage a perishable food supply chain (PFSC), due to the product’s short lifetime and demand uncertainty. The deterioration rate and demand uncertainty of perishable food result in a large portion of the items being unsalable and frequent shortages of products in retailers [1]. On the one hand, unsaleable products become waste. The further disposal of expired products to landfill causes pollution [2]. On the other hand, due to the multitude of participating stakeholders in production, distribution, and retailing, the PFSC becomes complex and thus particularly vulnerable to crises [3,4]. If the product is not delivered to customers in time, it does not have value anymore. The product shortage often further causes customers to seek alternative sources of supply [5], possibly with a larger purchasing amount (i.e., hoarding) [6], leading to even severer demand uncertainty after the shortage period. This is exactly what we have witnessed during and after the COVID-19 outbreak in China: during the outbreak, production and/or distribution capacity shrank and customers hoarded larger safety stocks; while after the outbreak, consumers’ overall confidence declined [7]. To better handle the situation after the outbreak, the access to reliable and timely information about looming risks and their consequences for consumer behavior is of high importance for the management of PFSC [8]. However, what information should (not) be shared along the supply chain? And what decision-making strategy should be applied?
To address these questions, we applied system dynamics modeling to analyze a cheese supply chain of three tiers (i.e., a producer, a logistics service provider (LSP), and a retailer). Three scenarios that cause product shortages were simulated: a producer capacity disruption, an LSP capacity disruption, and a hoarding disruption. We aimed to identify dominant feedback loops (i.e., during a time interval in a given structure and a set of system conditions, the loop determines the pattern of a variable’s behavior [9]) for each disruption recovery to guide information sharing and decision making.
The rest of this paper is arranged as follows: a literature review on the value of information and decision-making strategy in managing a sustainable and resilient PFSC is presented in section two. Section three describes our research methodology. The results of feedback loop dominance analysis are summarized in section four. The paper ends with discussions and conclusion in section five.
2. Literature Review
On the one hand, sustainable production and distribution is a pertinent and timely issue for the food industry, which is still the largest manufacturing sector in many developed and developing countries [10]. Especially for the management of PFSC, sustainability concerns are becoming an essential factor [11]. Products reaching the retail store shelf too late (i.e., speed of logistics) leads to a short remaining shelf life (i.e., product quality issues) [12]. Waste resulting from unsalable perishable food items and their implications for energy usage cause significant environmental impacts (i.e., environmental concerns) [1]. On the other hand, in recent years, firms have become more vulnerable to unexpected risks [13,14,15]. Accidents become inevitable or even normal in complex and tightly coupled systems, as they extend the focal firm’s context to its supply chain’s context [16]. Given this theory, it is not surprising that firms working in long and complex supply chains have become prone to unexpected disruptions [17]. When suppliers and/or distributors are unable to fulfill orders, delivery delays increase and customers receive less than they desire. Customers often respond by seeking larger safety stocks (i.e., hoarding) [6]. Even worse is the situation that increased customer demand can feed back to supply scarcity, leading to even more lost sales (i.e., the difference between real customer demand and fulfilled customer demand) [5]. Hence, there has been growing concern that the world’s food systems for producing and distributing food should be more resilient to a variety of shocks, be they economic, of natural making, accidental, malicious, or born out of ignorance [18]. To manage a sustainable and resilient PFSC after the crisis, supply chain partners need to share and use the right information to facilitate decision making. Therefore, we will review the value of information and decision-making strategy in managing a sustainable and resilient PFSC below.
2.1. Value of Information in Managing a Sustainable and Resilient PFSC
Kot [19] states that it is unusually essential to share information with all of the partners in a supply chain to improve the coordination and the absorbency of the chain. Information sharing on such matters as “demand forecast information” could improve the performance of the order fulfilment process [20]. However, the value of information is subject to contextual supply chain parameters, and varies in accordance with the characteristics of the information, such as accuracy, timeliness, and completeness [21]. When there is no crisis, supply chain models can treat customer demand as exogenous (e.g., [22,23]). However, when there is a crisis, supply chain instability and customer demand would interact through product availability [5], which can be found in the case of the semiconductor industry [24] as well as PFSC [25]. The interactions of supply chain instability and customer response generate a phenomenon of endogenous demand, where lower demand (after the outbreak) leads to reduced production, prolonging shortages that depress demand [5]. Information conveying endogenous demand will add no, if not negative, value to the decision making along the supply chain. Information quality has a significant effect on system inventory [26]. Therefore, when delivering the feedback loop dominance analysis, we expect to find dominant feedback loops that control the information sharing on endogenous demand. By deactivating such dominant feedback loops, the negative effect of endogenous demand would be largely eliminated. To this end, we hypothesize:
Hypothesis 1 (H1).
To manage a sustainable and resilient PFSC after an outbreak, supply chain partners should not share information that can trigger endogenous demand.
2.2. Value of Decision-Making Strategy in Managing a Sustainable and Resilient PFSC
Hong and Jeong [27] argue that companies, especially small and medium enterprises (SMEs), need a correctly integrated decision-making system in a coordinated strategic supply chain. And strategic supply chain management has a positive mediating effect on the sustainable operations [28]. The integrated decision-making system along the supply chain can be reflected by the practice of sales and operations planning (S&OP) to create a balance between the sales plan (which is based on forecasted demand) and the production plan (which affects inventory and/or order backlog) [29]. The decision options can thus be divided into two types: modifying demand to match the production constraints, and modifying supply to match the sales plan [30]. Such decision options can also help solve capacity management issues after the outbreak. According to Normal Accident Theory [31], there are two types of choices: tightly coupled and loosely coupled. Under a tightly coupled regime, there is a direct relation between the sales plan and the target capacity. Tightly coupled strategy is similar to the practice of modifying supply to match the sales plan, which focuses on capacity utilization. Under a loosely coupled regime, sales and operations planning retain their own, independent controls, but make the processes more responsive and agile. Loosely coupled strategy is similar to the practice of modifying demand to match the production constraints, which emphasizes capacity availability and flexibility. In system dynamics, feedback loops build such “coupling”. Whether they are tightly or loosely coupled is determined by whether we speed up (or facilitate) the loops, or delay (or deactivate) the loops. We argue that a loosely coupled strategy is more applicable to the situation after the outbreak, as capacity availability and flexibility, rather than capacity utilization, is more helpful to deal with endogenous demand [5]. Meanwhile, uncertainty that is caused by the outbreak would create causal indeterminacy between supply and demand, which is one of the reasons that lead to loose coupling [32]. Through simulation, we plan to prove that a loosely coupled strategy, via deactivating certain dominant feedback loops, is more suitable to maintain the sustainability and resilience of PFSC after the outbreak. Therefore, we put forward the hypothesis:
Hypothesis 2 (H2).
To manage a sustainable and resilient PFSC after an outbreak, supply chain partners should apply a loosely coupled strategy for their decision making.
3. Methodology
A system dynamics simulation is applied in this paper to study a cheese supply chain. System dynamics is a methodology that is capable of studying and modeling complex systems [33]. This methodology maps the system structure to capture and communicate an understanding of behavior driving processes, and the quantification of the relationships to produce a set of equations that form the basis for simulating possible system behaviors over time [34]. The underlying principle is that if process structure determines system behavior, and system behavior determines supply chain performance, then the key to information sharing and decision making is acknowledging the relationship between processes and phenomenon and managing the dominant feedback loops (on which we will elaborate later in this section). Although discrete event simulation can deal successfully with disruption events, agent-based simulation and system dynamics have the capability to resemble the interaction of different system agents to improve the understanding of the real system. Compared to agent-based simulation, system dynamics modeling takes less time to build and works better when the level of aggregation is high [35].
Our simulation model is derived from a business simulation game (www.bedrijfssimulaties.nl) that was developed in collaboration with a Dutch university and a consulting firm. The game was used by the second author for academic and executive teaching. The game uses data that were collected from the real-life practice of a large multinational dairy firm. Our simulation model resembles the gaming model, but focuses on disruption recovery. Therefore, our research used original parameter values from the game as well as adjusted inputs that are related to disruptions. The software that we use to build our simulation model is Stella®, version 9.1.3.
In our model, the cheese supply chain has three individual firms involved: a producer, an LSP, and a retailer. We assume that milk and other resources are infinite for the producer. The producer produces the cheese with a six weeks’ production delay (including curdling and ripening). When ready, the finished product has a shelf life of six weeks. The LSP keeps inventory, the content of which, however, is beyond its control. The ordering policy pulled by the retailer and the production volume pushed by the producer finally determine its inventory level. The retailer sells the cheese to consumers in one week. Table 1 shows our initial simulation inputs. We report all the values in E notation. For the assessment, sustainability for PFSC is reflected by speed of logistics, and the resulting product quality issues and environmental concerns [36]. In our research, we will focus on the root causes of sustainability problems, i.e., the speed of logistics, to guide information sharing and decision making. Therefore, throughput time becomes the first performance measurement in our simulation. To evaluate the level of resilience for PFSC, we propose that lost sales should be the other performance measurement in our simulation.
We simulate three scenarios: a producer capacity disruption, an LSP capacity disruption, and a hoarding disruption. For each scenario, we simulate a process of 48 weeks: all the variables are stable in the first nine weeks; at the end of Week 9, a disruption happened, causing a base capacity drop of 6.40 × 10⁵ kg/week for the first two scenarios or a demand increase of 6.40 × 10⁵ kg/week for the last scenario; at the end of Week 12, the base capacity recovers 3.20 × 10⁵ kg/week for the first two scenarios or the demand decreases 3.20 × 10⁵ kg/week for the last scenario; at the end of Week 15, the base capacity recovers another 3.20 × 10⁵ kg/week for the first two scenarios or the demand decreases another 3.20 × 10⁵ kg/week for the last scenario—back to the starting level, until the end of simulation. The simulation length is set as 48 weeks. All the performance measurements will stay stable at only one atomic behavior pattern (i.e., a negative logarithmic atomic behavior pattern) from Week 32 to Week 48, which serves as the reference time interval for the feedback loop dominance analysis (please refer to the following text on the feedback loop dominance analysis for more details). Since this period is after Week 15, our analysis results will mainly facilitate decision making after the outbreak.
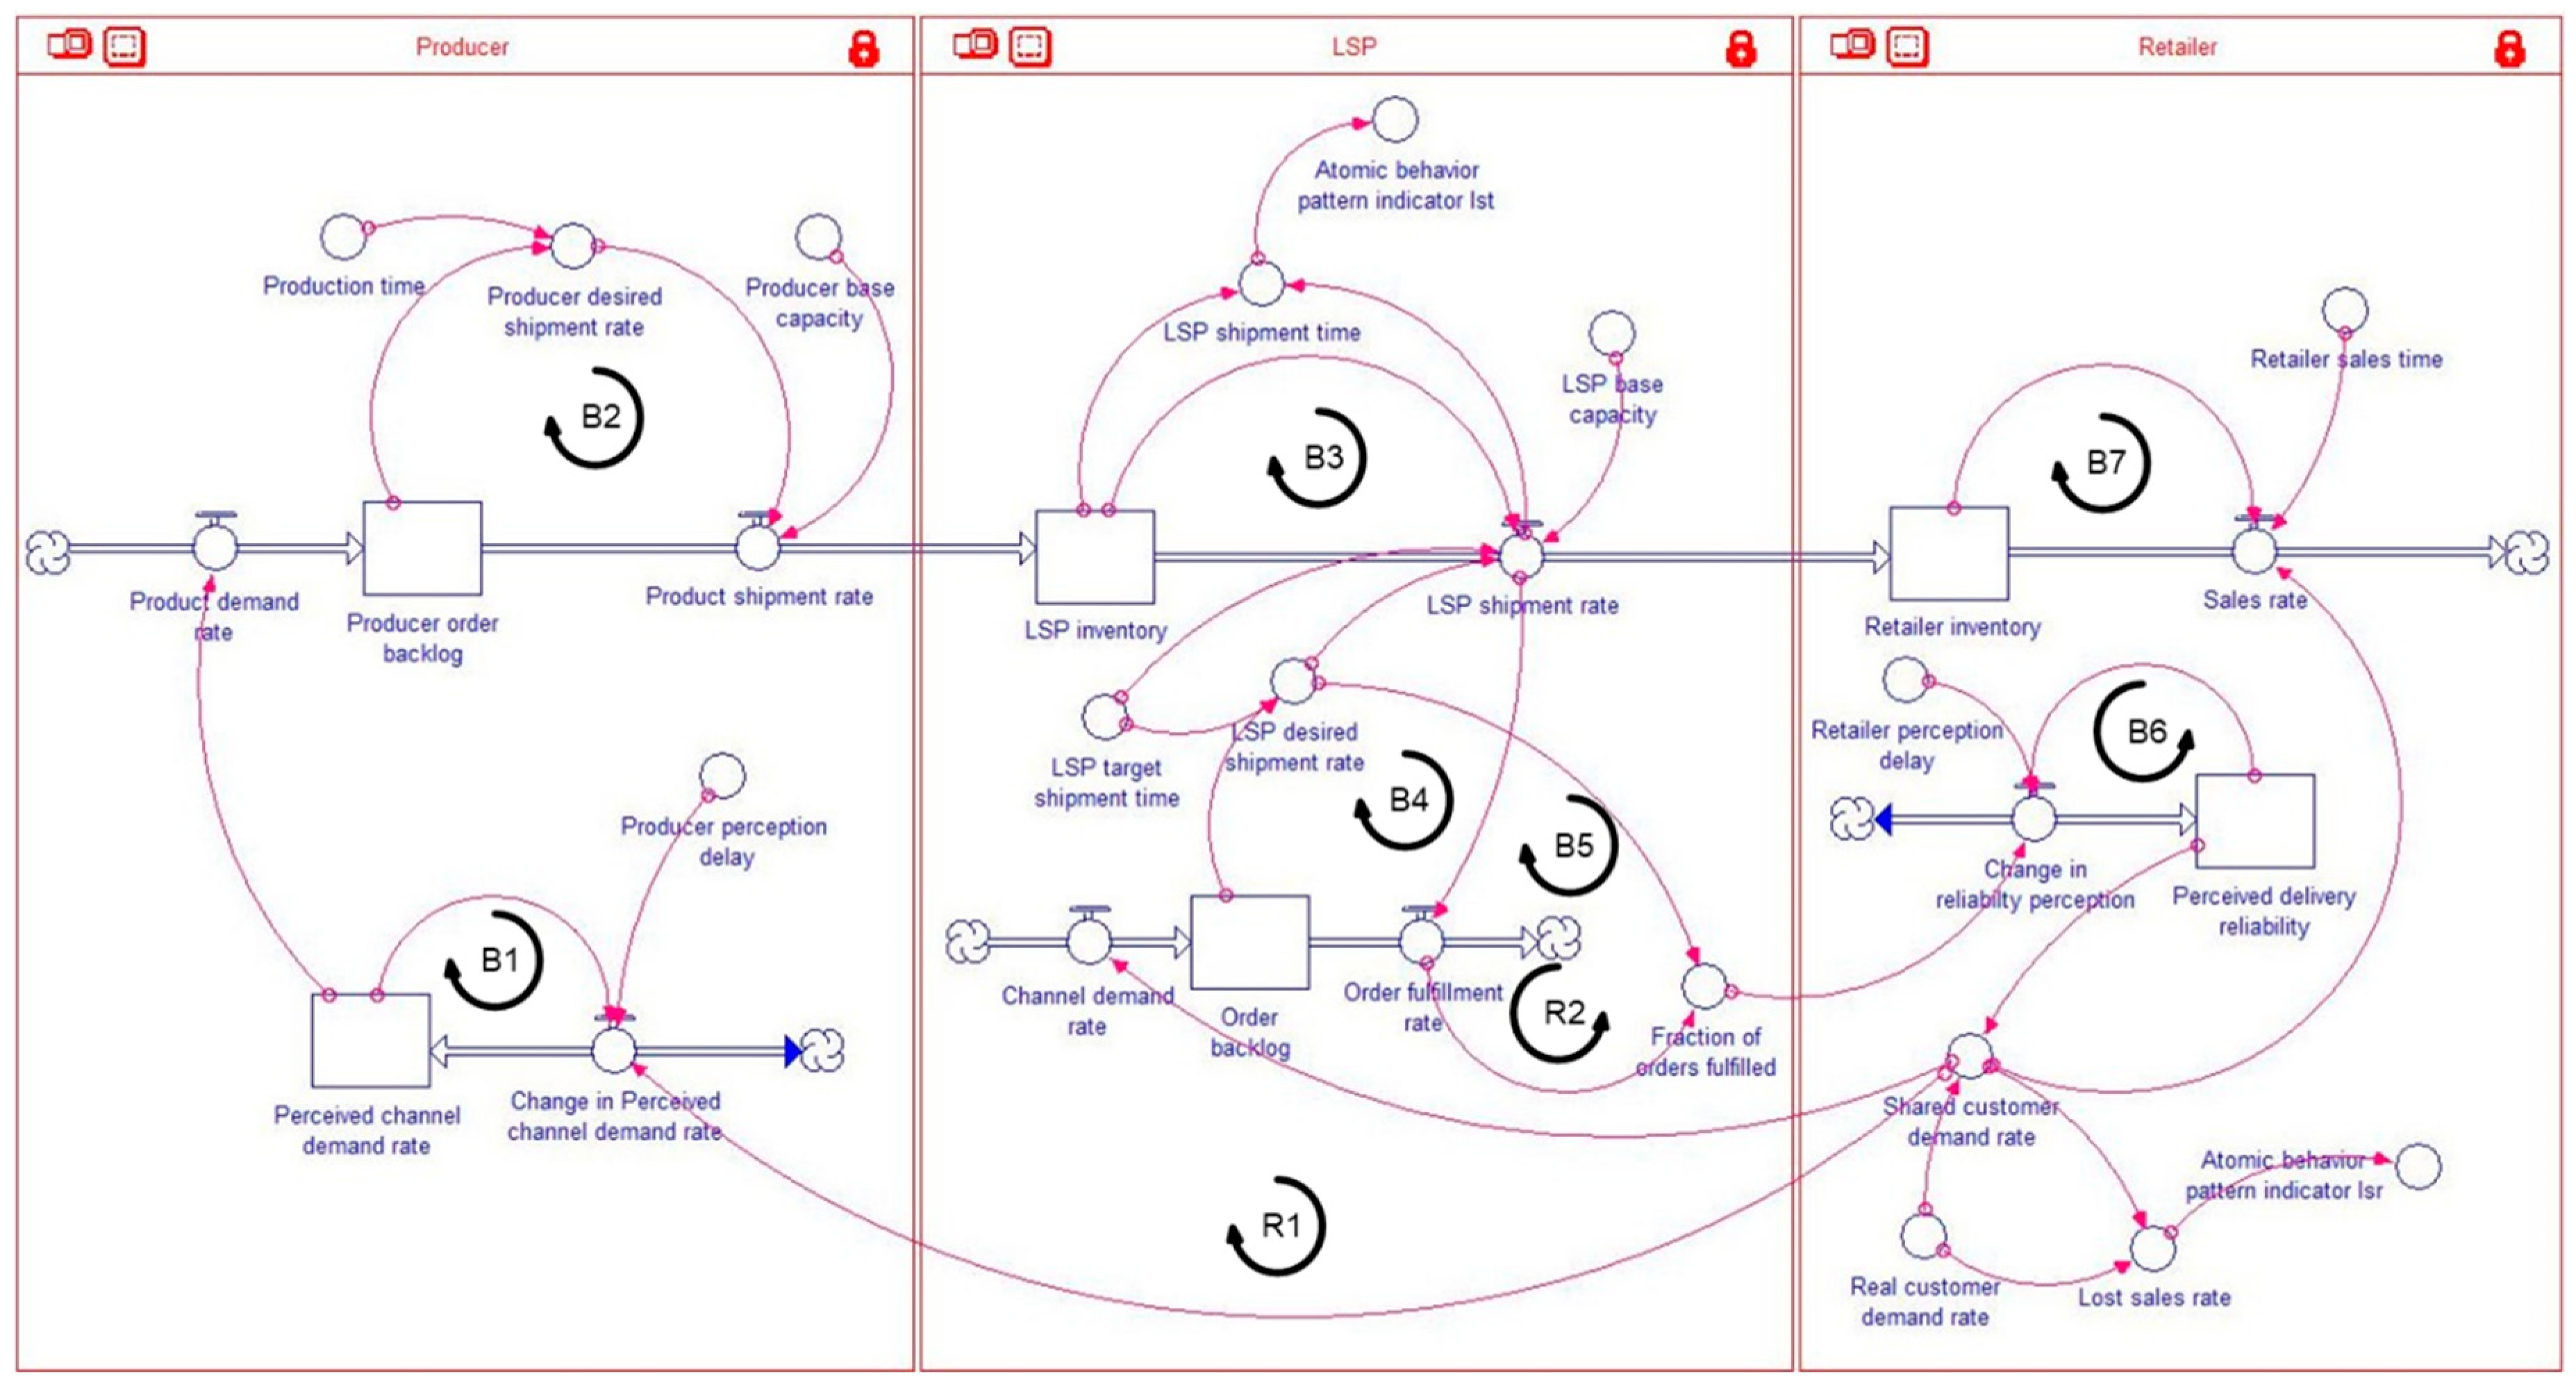
The structure of our simulation model is illustrated in Figure 1. According to the dynamic resource-based view, strategic assets are modeled as stocks (in rectangles) of available tangible or intangible factors in a given time. Their dynamics depend on the value of corresponding inflows and outflows [34]. Such flows are modeled as “valves” that directly change the rate of evolution of each strategic resource [37]. The source and sink of each strategic resource are represented by a cloud symbol. The source has an arrow coming out, while the sink has an arrow going into the cloud [38]. There are two typical processes in a system dynamics model [39]. One is known as a material delay, since it captures the physical flow of material through a delay process. In a material delay, the stock level accumulates at a rate equal to the difference between the inflow and outflow rates. The other kind of delay, which represents the gradual adjustment of a perception or belief, is called an information delay. Because information, unlike material, is not conserved, a bi-flow structure (i.e., that can be both increased and decreased) is needed to capture an information delay. The stock level adjusts to the actual information input in proportion to the size of the difference in one’s belief. An adjustment time/delay determines how rapidly one’s belief responds to the difference.
For the producer, there are one information delay (for “Shared customer demand rate”) and one material delay (for “Producer order backlog”). For the LSP, there are two material delays (for “Order backlog” and “LSP inventory”). And for the retailer, there is one material delay (for “Retailer inventory”) and one information delay (for “Perceived delivery reliability”). The main equations of the model are listed in Table 2. “LSP shipment time” and “Lost sales rate” are selected as the performance measurements, as the former evaluates throughput time and the latter is a reflection of lost sales.
There are two kinds of feedback loops: the balanced feedback loop (which is self-correcting) and the reinforced feedback loop (which is self-reinforcing) [39]. Seven balanced feedback loops and two reinforced feedback loops are identified from the simulation model (Figure 1). They are: B1: Producer information delay (“Perceived channel demand rate” → “Change in perceived channel demand rate” → “Perceived channel demand rate”); B2: Producer capacity availability (“Producer order backlog” → “Producer desired shipment rate” → “Producer shipment rate” → “Producer order backlog”); B3: LSP capacity availability (“LSP inventory” → “LSP shipment rate” → “LSP inventory”); B4: LSP order fulfillment (push) (“Order backlog” → “LSP desired shipment rate” → “LSP shipment rate” → “Order fulfillment rate” → “Order backlog”); B5: Lost sales (“Order backlog” → “LSP desired shipment rate” → “Fraction of orders fulfilled” → “Change in reliability perception” → “Perceived delivery reliability” → “Shared customer demand rate” → “Channel demand rate” → “Order backlog”); B6: Retailer information delay (“Perceived delivery reliability” → “Change in reliability perception” → “Perceived delivery reliability”); B7: Retailer sales availability (“Retailer inventory” → “Sales rate” → “Retailer inventory”); and R1: Producer order fulfillment (pull) (“Producer order backlog” → “Product shipment rate” → “LSP inventory” → “LSP shipment rate” → “Order fulfillment rate” → “Fraction of orders fulfilled” → “Change in reliability perception” → “Perceived delivery reliability” → “Shared customer demand rate” → “Change in perceived channel demand rate” → “Perceived channel demand rate” → “Product demand rate” → “Producer order backlog”); R2: Maintained sales (“Order backlog” → “Order fulfillment rate” → “Fraction of orders fulfilled” → “Change in reliability perception” → “Perceived delivery reliability” → “Shared customer demand rate” → “Channel demand rate” → “Order backlog”).
A behavioral approach to feedback loop dominance analysis [9] is applied to identify dominant feedback loops for each disruption recovery, because of its intuitive appeal and ease of implementation. A feedback loop is said to dominate the behavior of a variable during a time interval in a given structure and a set of system conditions when the loop determines the atomic pattern of variable’s behavior [40]. Atomic behavior pattern can be one of three types: (1) Linear atomic behavior pattern—when the rate of change remains constant over time and the variable (say x) moves away from its initial value at a constant state. In this case, equals zero. (2) Exponential atomic behavior pattern—the absolute value of the rate of change increases over time and the variable moves away from its initial value at a relatively fast rate over time. In this case, is positive. (3) Logarithmic atomic behavior pattern—the absolute value of the rate of change decreases over time and the variable moves away from its initial value at a relatively slow rate over time. In this case, is negative, asymptotically reaching a steady state value.
According to Ford [9], an iterative process to identify dominant loops in selected time intervals is summarized as follows. (1) Select the variable of interest (i.e., “LSP shipment time” and “Lost sales rate” in this research) that will determine feedback loop dominance and simulate its behavior over time. (2) Select a time interval (i.e., from Week 32 to Week 48 in this research) during which the variable of interest displays only one atomic behavior pattern (i.e., a negative logarithmic atomic behavior pattern for both “LSP shipment time” and “Lost sales rate” for all three scenarios in this research). This is the reference time interval and atomic behavior pattern. The system structure and parameter values during this time interval define the conditions in which dominance is specified. The equation for each atomic behavior pattern indicator is:
Atomic behavior pattern indicator = DERIVN(ABS(DERIVN(Variable of interest,1)),1)
Here, the DERIVN( ) is a built-in function of Stella® simulation software to achieve the derived function. (3) Use the feedback structure of the model to identify the feedback loops that influence the variable of interest. Select one of those feedback loops as the candidate feedback loop. (4) Select or create a control variable in the candidate feedback loop that is not a variable in other feedback loops and can vary the gain of the candidate loop. Use the control variable to deactivate the candidate loop. (5) Simulate the behavior of the variable of interest over the reference time interval with the candidate feedback loop deactivated, and identify the atomic behavior pattern or patterns of the variable of interest during the time interval. (6) If the atomic behavior pattern generated in step (5) is different from that identified in step (2), the candidate feedback loop dominates the behavior of the variable of interest under the system conditions during that time interval. (7) Repeat steps (3) through (6) with the candidate loop being activated to check for multiple dominant feedback loops during the time interval.
4. Results
All three scenarios have the same outputs from the feedback loop dominance analysis. Table 3 summarizes the results. B4, B5, B6, and R2 are identified as the dominant feedback loops to maintain a sustainable cheese supply chain by keeping a reasonable “LSP shipment time”. Meanwhile, the four loops are helpful to control “Lost sales rate”, hence building a resilient cheese supply chain after the outbreak.
5. Discussion and Conclusions
5.1. Discussion
Through the feedback loop dominance analysis, this paper has set the first step to manage a sustainable and resilient PFSC after an outbreak, especially when a product shortage has occurred (which is caused by a producer capacity disruption, an LSP capacity disruption, or a hoarding disruption). Efforts can thus be focused on the identified dominant feedback loops to guide information sharing and decision making. In this section, we will dig into the dominant feedback loops that we have identified to acknowledge the value of information and decision-making strategy in managing a sustainable and resilient PFSC, and provide suggestions on managing these loops.
In the light of cheese production, failure in the upstream supply chain (i.e., the producer and the LSP, for this paper) will produce a chain of reaction on the downstream side (i.e., the retailer, for this paper) [41]. Such chain of reaction starts with B4 (LSP order fulfillment (push)), when the LSP matches its inventory and delivery capacity with the order that is received from the retailer. The matching result is reflected by the calculation of the “LSP shipment rate”, which also determines the “LSP desired shipment rate”. Then “LSP desired shipment rate” from B5 (Lost sales) and “Order fulfillment rate” from R2 (Maintained sales) jointly decide the value of “Fraction of orders fulfilled”, which is the information requested by the retailer in B6 (Retailer information delay) to decide “Perceived delivery reliability”. This is then used to determine “Shared customer demand rate”, which is shared back as the new order for the next round. Due to supply chain instability during and after disruptions, “Fraction of orders fulfilled” will drop, which feeds back to customer demand, leading to the decrease in “Shared customer demand rate” and the further decline of “Fraction of orders fulfilled” in the next round. The interactions of supply chain instability and customer response generate the phenomenon of endogenous demand, where inventory availability affects customer demand [5].
We can categorize the four dominant feedback loops into two groups that correspond with our two hypotheses on the value of information and decision-making strategy, which are related to the phenomenon of endogenous demand. The first group is about the sharing of information that conveys endogenous demand, which includes B5 and R2. By deactivating B5 and/or R2, the LSP will prevent the information sharing of “Fraction of orders fulfilled”, so that the retailer has to use other information sources for its decision making. When the retailer focuses on the long-term collaboration with its supply chain partners, it will then rely on each other’s promises, especially when encountering unforeseen disruptions [42]. Such a strategy can help the supply chain recover quickly, because it stabilizes, if not fully eliminates, endogenous demand, therefore maintaining reasonable throughput time and lost sales. Our H1 is thus proved.
The first group passively stops the information sharing that causes endogenous demand, while the second group, including B4 and B6, proactively excludes such information from decision making. By deactivating B4, the LSP will not count on “Order backlog” (which has the input of “Shared customer demand rate”) in its decision making, so that “LSP shipment rate” will not be lowered by the shrinkage of “Shared customer demand rate”. Similarly, by deactivating B6, the retailer will not depend on “Perceived delivery reliability” (which has the input of “Fraction of orders fulfilled”) in its decision making, so that “Shared customer demand rate” will not be decreased by the drop of “Fraction of orders fulfilled”. The practices of deactivating B4 and b6 help create a loosely coupled system [32,43], in which individual firms keep information sharing along the supply chain (i.e., coupled) but have more autonomy to make decisions (i.e., loosely). When facing disruptions, companies should prepare for switching supply chain strategies [44]. Instead of a tightly coupled regime, a loosely coupled strategy can give individual firms the flexibility to maneuver after an outbreak, so that endogenous demand will not be repeatedly generated from the system. Throughput time and lost sales will therefore stay at the reasonable level. As a result, our H2 is validated.
Our suggestions derived from the feedback loop dominance analysis are not the same as those of Gonçalves et al. [5] and Kim et al. [24], which also focus on the phenomenon of endogenous demand. To alleviate the negative influence of endogenous demand, Gonçalves et al. [5] recommend a safety stock policy to hold larger inventory buffers. Kim et al. [24] further propose a strategy that incorporates additional stock points in a serial supply chain. Their proposed strategies can be applied to our loops B2 (Producer capacity availability), B3 (LSP capacity availability), and B7 (Retailer sales availability). However, none of them are among the dominant feedback loops that we found, which means they can only temporarily alleviate the impact of endogenous demand, but cannot change the system behavior. In contrast, our suggestions (i.e., cease the information sharing that causes endogenous demand and utilize a loosely coupled strategy for decision-making) cut the transmission of endogenous demand, which directly changes the system behavior. Our findings are in line with another recommendation of Gonçalves et al. [5] to apply an unresponsive capacity utilization policy, but we provide the detailed solutions on how to achieve such policy on the supply chain level.
In addition, we have applied the same feedback loop dominance analysis as a post hoc check for the situation before the outbreak (i.e., from Week 1 to Week 9). No feedback loop is found to be dominant, showing that no endogenous demand is generated in the base case setting. Therefore, endogenous demand is originated from the outbreak that causes product shortage. The four dominant feedback loops that we found and the corresponding suggestions are thus mainly contributing to the decision making after an outbreak. There is no sign that stopping information sharing or applying a loosely coupled strategy can benefit the supply chain operations in normal times.
5.2. Theoretical Contributions
Our first theoretical contribution is to apply system dynamics modeling to the research of PFSC management. Our research methodology focuses on the design of delays and feedback structures, specifically on the value of information and decision-making strategy. Furthermore, by using the feedback loop dominance analysis, we have identified four dominant loops that facilitate the generation of endogenous demand. On the one hand, for information that can trigger endogenous demand, its transparency has a negative impact on the sustainability and resilience of PFSC. Therefore, our findings challenge the assumption of some research that considered information integration as a single variable that positively influences supply chain performance [45,46]. On the other hand, we find that a loosely coupled strategy may benefit the whole supply chain by proactively excluding certain information from decision making. For these contributions, we would like to gain empirical supports in future research.
5.3. Managerial Implications
Our paper provides several managerial implications for the managers of PFSC, especially when facing an outbreak like COVID-19 that leads to a product shortage. Information that can trigger endogenous demand is harmful for the whole supply chain. Managers are encouraged to trust their supply chain partners on product delivery, and facilitate long-term relationships. Meanwhile, a loosely coupled strategy can benefit decision making after the outbreak. Managers are recommended to allow more autonomy along the supply chain to keep it running as normal.
5.4. Conclusions
In a production setting, one might aspire to translate a specific value for a sales plan into a specific value for a target capacity at a specific period in time later. This would result in a tightly coupled strategy. However, for the management of a sustainable and resilient PFSC, this may not always be feasible. In the presence of an outbreak like COVID-19, the correlation between a specific incoming order rate and a specific level of capacity requirement is highly tenuous. Thus, to manage a sustainable and resilient PFSC after an outbreak, the best policy is to stop the information sharing that causes endogenous demand and utilize “loosely coupled policy” [43] to support decision making.
Author Contributions
Conceptualization, Q.Z. and H.K.; methodology, Q.Z.; software, Q.Z.; validation, Q.Z.; formal analysis, Q.Z.; resources, H.K.; writing—original draft preparation, Q.Z.; writing—review and editing, Q.Z. and H.K. All authors have read and agreed to the published version of the manuscript.
Funding
This research received no external funding.
Conflicts of Interest
The authors declare no conflicts of interest.
References
- Yang, S.; Xiao, Y.; Kuo, Y.-H. The Supply Chain Design for Perishable Food with Stochastic Demand. Sustainability 2017, 9, 1195. [Google Scholar] [CrossRef] [Green Version]
- Griffin, M.; Sobal, J.; Lyson, T.A. An analysis of a community food waste stream. Agric. Hum. Values 2008, 26, 67–81. [Google Scholar] [CrossRef]
- Bottani, E.; Murino, T.; Schiavo, M.; Akkerman, R. Resilient food supply chain design: Modelling framework and metaheuristic solution approach. Comput. Ind. Eng. 2019, 135, 177–198. [Google Scholar] [CrossRef]
- Srivastava, S.K.; Chaudhuri, A.; Srivastava, R.K. Propagation of risks and their impact on performance in fresh food retail. Int. J. Logist. Manag. 2015, 26, 568–602. [Google Scholar] [CrossRef]
- Goncalves, P.; Hines, J.; Sterman, J. The impact of endogenous demand on push-pull production systems. Syst. Dyn. Rev. 2005, 21, 187–216. [Google Scholar] [CrossRef]
- Sterman, J.D.; Dogan, G. I’m not hoarding, I’m just stocking up before the hoarders get here. Behavioral causes of phantom ordering in supply chains. J. Oper. Manag. 2015, 39–40, 6–22. [Google Scholar] [CrossRef]
- Deloitte, C.C.F.A. The Financial and Operational Impact of COVID-19 Outbreak on the Chinese Retail Industry: Research Report and Industrial Trend Outlook, in Chinese; Deloitte China: Shanghai, China, 2020. [Google Scholar]
- Gobel, C.; Langen, N.; Blumenthal, A.; Teitscheid, P.; Ritter, G. Cutting Food Waste through Cooperation along the Food Supply Chain. Sustainability 2015, 7, 1429–1445. [Google Scholar] [CrossRef] [Green Version]
- Ford, D.N. A behavioral approach to feedback loop dominance analysis. Syst. Dyn. Rev. 1999, 15, 3–36. [Google Scholar] [CrossRef]
- Li, D.; Wang, X.; Chan, H.K.; Manzini, R. Sustainable food supply chain management. Int. J. Prod. Econ. 2014, 152, 1–8. [Google Scholar] [CrossRef]
- Kaipia, R.; Loikkanen, L.; Dukovska-Popovska, I. Creating sustainable fresh food supply chains through waste reduction. Int. J. Phys. Distrib. Logist. Manag. 2013, 43, 262–276. [Google Scholar] [CrossRef] [Green Version]
- Mena, C.; Adenso-Díaz, B.; Yurt, O. The causes of food waste in the supplier–retailer interface: Evidences from the UK and Spain. Resour. Conserv. Recycl. 2011, 55, 648–658. [Google Scholar] [CrossRef]
- Tse, Y.K.; Matthews, R.L.; Tan, K.; Sato, Y.; Pongpanich, C. Unlocking supply chain disruption risk within the Thai beverage industry. Ind. Manag. Data Syst. 2016, 116, 21–42. [Google Scholar] [CrossRef] [Green Version]
- Manuj, I.; Esper, T.L.; Stank, T.P. Supply Chain Risk Management Approaches Under Different Conditions of Risk. J. Bus. Logist. 2014, 35, 241–258. [Google Scholar] [CrossRef]
- Zsidisin, G.A.; Wagner, S.M. Do perceptions become reality? The moderating role of supply chain resiliency on disruption occurrence. J. Bus. Logist. 2010, 31, 1–20. [Google Scholar] [CrossRef]
- Zhu, Q.; Krikke, H.; Caniëls, M.C.; Wang, Y. Twin-objective supply chain collaboration to cope with rare but high impact disruptions whilst improving performance. Int. J. Logist. Manag. 2017, 28, 488–507. [Google Scholar] [CrossRef]
- Revilla, E.; Saenz, M.J. Supply chain disruption management: Global convergence vs. national specificity. J. Bus. Res. 2014, 67, 1123–1135. [Google Scholar] [CrossRef]
- Leat, P.; Revoredo-Giha, C. Risk and resilience in agri-food supply chains: The case of the ASDA PorkLink supply chain in Scotland. Supply Chain Manag. Int. J. 2013, 18, 219–231. [Google Scholar] [CrossRef]
- Kot, S. Sustainable Supply Chain Management in Small and Medium Enterprises. Sustainability 2018, 10, 1143. [Google Scholar] [CrossRef] [Green Version]
- Hung, W.-H.; Lin, C.-P.; Ho, C.-F. Sharing information in a high uncertainty environment: Lessons from the divergent differentiation supply chain. Int. J. Logist. Res. Appl. 2013, 17, 46–63. [Google Scholar] [CrossRef]
- Viet, N.; Behdani, B.; Bloemhof, J.M. The value of information in supply chain decisions: A review of the literature and research agenda. Comput. Ind. Eng. 2018, 120, 68–82. [Google Scholar] [CrossRef]
- Lee, H.L.; Padmanabhan, V.; Whang, S. Information Distortion in a Supply Chain: The Bullwhip Effect. Manag. Sci. 1997, 43, 546–558. [Google Scholar] [CrossRef]
- Chen, F.Y.; Drezner, Z.; Ryan, J.; Simchi-Levi, D. Quantifying the Bullwhip Effect in a Simple Supply Chain: The Impact of Forecasting, Lead Times, and Information. Manag. Sci. 2000, 46, 436–443. [Google Scholar] [CrossRef] [Green Version]
- Kim, S.-H.; Fowler, J.W.; Shunk, D.L.; Pfund, M.E. Improving the push–pull strategy in a serial supply chain by a hybrid push–pull control with multiple pulling points. Int. J. Prod. Res. 2012, 50, 5651–5668. [Google Scholar] [CrossRef]
- Castro, J.A.O.; Gamez, G.L.D.; Celemín, M.P.B. Model for Logistics Capacity in the Perishable Food Supply Chain. In Biomedical Engineering Systems and Technologies; Springer Science and Business Media LLC.: Cham, Switzerland, 2017; Volume 742, pp. 225–237. [Google Scholar]
- Rossin, D. Push-pull boundary location, information quality, and supply chain performance: An exploratory analysis. J. Glob. Bus. Issues 2012, 6, 7–14. [Google Scholar]
- Hong, P.; Jeong, J. Supply chain management practices of SMEs: From a business growth perspective. J. Enterp. Inf. Manag. 2006, 19, 292–302. [Google Scholar] [CrossRef]
- Kot, S.; Haque, A.U.; Kozlovski, E. Strategic SCM’s Mediating Effect on the Sustainable Operations: Multinational Perspective. Organizacija 2019, 52, 219–235. [Google Scholar] [CrossRef] [Green Version]
- Olhager, J.; Rudberg, M.; Wikner, J. Long-term capacity management: Linking the perspectives from manufacturing strategy and sales and operations planning. Int. J. Prod. Econ. 2001, 69, 215–225. [Google Scholar] [CrossRef]
- Tuomikangas, N.; Kaipia, R. A coordination framework for sales and operations planning (S&OP): Synthesis from the literature. Int. J. Prod. Econ. 2014, 154, 243–262. [Google Scholar] [CrossRef]
- Cummings, L.L.; Perrow, C. Normal Accidents: Living with High-Risk Technologies. Adm. Sci. Q. 1984, 29, 630. [Google Scholar] [CrossRef]
- Orton, J.D.; Weick, K.E. Loosely coupled systems: A reconceptualization. Acad. Manag. Rev. 1990, 15, 203–223. [Google Scholar] [CrossRef] [Green Version]
- Ozbayrak, M.; Papadopoulou, T.; Akgun, M. Systems dynamics modelling of a manufacturing supply chain system. Simul. Model. Pract. Theory 2007, 15, 1338–1355. [Google Scholar] [CrossRef]
- Bianchi, C.; Rivenbark, W.C. Performance Management in Local Government: The Application of System Dynamics to Promote Data Use. Int. J. Public Adm. 2014, 37, 945–954. [Google Scholar] [CrossRef] [Green Version]
- Hilletofth, P.; Lattila, L. Agent based decision support in the supply chain context. Ind. Manag. Data Syst. 2012, 112, 1217–1235. [Google Scholar] [CrossRef] [Green Version]
- Siddh, M.M.; Soni, G.; Jain, R.; Sharma, M.K. Structural model of perishable food supply chain quality (PFSCQ) to improve sustainable organizational performance. Benchmarking Int. J. 2018, 25, 2272–2317. [Google Scholar] [CrossRef]
- Zhang, Y.; Dilts, D.M. System dynamics of supply chain network organization structure. Inf. Syst. e-Bus. Manag. 2004, 2, 187–206. [Google Scholar] [CrossRef]
- Reddi, K.R.; Moon, Y. System dynamics modeling of engineering change management in a collaborative environment. Int. J. Adv. Manuf. Technol. 2011, 55, 1225–1239. [Google Scholar] [CrossRef]
- Sterman, J.D. Business Dynamics: Systems Thinking and Modeling for a Complex World; McGraw-Hill Education: New York, NY, USA, 2000; pp. 12–13. [Google Scholar]
- Kamath, N.B.; Roy, R. Capacity augmentation of a supply chain for a short lifecycle product: A system dynamics framework. Eur. J. Oper. Res. 2007, 179, 334–351. [Google Scholar] [CrossRef]
- Chen, J.; Sohal, A.S.; Prajogo, D. Supply chain operational risk mitigation: A collaborative approach. Int. J. Prod. Res. 2013, 51, 2186–2199. [Google Scholar] [CrossRef]
- Wei, H.-L.; Wong, C.W.; Lai, K.-H. Linking inter-organizational trust with logistics information integration and partner cooperation under environmental uncertainty. Int. J. Prod. Econ. 2012, 139, 642–653. [Google Scholar] [CrossRef]
- Weick, K.E. Educational Organizations as Loosely Coupled Systems. Adm. Sci. Q. 1976, 21, 1. [Google Scholar] [CrossRef]
- Zhu, Q.; Krikke, H.; Caniëls, M.C. Collaborate or not? A system dynamics study on disruption recovery. Ind. Manag. Data Syst. 2016, 116, 271–290. [Google Scholar] [CrossRef]
- Leuschner, R.; Rogers, D.; Charvet, F.F. A Meta-Analysis of Supply Chain Integration and Firm Performance. J. Supply Chain Manag. 2013, 49, 34–57. [Google Scholar] [CrossRef]
- Alfalla-Luque, R.; López, C.M.; Dey, P.K. Supply chain integration framework using literature review. Prod. Plan. Control 2012, 24, 800–817. [Google Scholar] [CrossRef] [Green Version]
Figure 1.
The simulation model of a cheese supply chain.


Table 1.
Initial simulation inputs with values.
| Simulation Input | Value |
|---|---|
| “Producer order backlog” | 7.68 × 10⁶ kg |
| “Production time” | 6 weeks |
| “Producer base capacity”, “LSP base capacity”, “Real customer demand rate” | 1.28 × 10⁶ kg/week |
| “Order backlog”, “LSP inventory”, “Cumulative demand” | 1 kg |
| “LSP target shipment time”, “Retailer sales time” | 1 week |
| “Retailer inventory” | 2.56 × 10⁶ kg |
| “Producer perception delay”, “Retailer perception delay” | 2 weeks |
Table 2.
Main equations of the model.
| Variable | Equation |
|---|---|
| “Shared customer demand rate” | = “Real customer demand rate” × “Perceived delivery reliability” |
| “Product shipment rate” | = MIN (“Producer desired shipment rate”, “Producer base capacity”) |
| “LSP desired shipment rate” | = “Order backlog”/“LSP target shipment time” |
| “LSP shipment rate” | = MIN (“LSP base capacity”, “LSP desired shipment rate”, “LSP inventory”/“LSP target shipment time”) |
| “Fraction of orders fulfilled” | = “Order fulfillment rate”/“LSP desired shipment rate” |
| “LSP shipment time” | = “LSP inventory”/“LSP shipment rate” |
| “Shared customer demand rate” | = “Real customer demand rate” × MIN (“Perceived delivery reliability”, 1) |
| “Sales rate” | = MIN (“Shared customer demand rate”, “Retailer inventory”/“Retailer sales time”) |
| “Lost sales rate” | = “Shared customer demand rate”/“Real customer demand rate” |
Note: The MIN() function returns the smallest value from the numbers provided.
Table 3.
The feedback loop dominance analysis results.
| B1 | B2 | B3 | B4 | B5 | B6 | B7 | R1 | R2 | |
|---|---|---|---|---|---|---|---|---|---|
| LSP shipment time | ✘ | ✘ | ✘ | ✔ | ✔ | ✔ | ✘ | ✘ | ✔ |
| Lost sales rate | ✘ | ✘ | ✘ | ✔ | ✔ | ✔ | ✘ | ✘ | ✔ |
Notes: B1: Producer information delay; B2: Producer capacity availability; B3: Logistics service provider (LSP) capacity availability; B4: LSP order fulfillment (push); B5: Lost sales; B6: Retailer information delay; B7: Retailer sales availability; R1: Producer order fulfillment (pull); R2: Maintained sales.
© 2020 by the authors. Licensee MDPI, Basel, Switzerland. This article is an open access article distributed under the terms and conditions of the Creative Commons Attribution (CC BY) license (http://creativecommons.org/licenses/by/4.0/).
Share and Cite
MDPI and ACS Style
Zhu, Q.; Krikke, H. Managing a Sustainable and Resilient Perishable Food Supply Chain (PFSC) after an Outbreak. Sustainability 2020, 12, 5004. https://doi.org/10.3390/su12125004
AMA Style
Zhu Q, Krikke H. Managing a Sustainable and Resilient Perishable Food Supply Chain (PFSC) after an Outbreak. Sustainability. 2020; 12(12):5004. https://doi.org/10.3390/su12125004
Chicago/Turabian StyleZhu, Quan, and Harold Krikke. 2020. "Managing a Sustainable and Resilient Perishable Food Supply Chain (PFSC) after an Outbreak" Sustainability 12, no. 12: 5004. https://doi.org/10.3390/su12125004
Note that from the first issue of 2016, this journal uses article numbers instead of page numbers. See further details here.