Article

Effects of Circular Economy Policies on the Environment and Sustainable Growth: Worldwide Research

by
Emilio Abad-Segura
1,
Ana Batlles de la Fuente
1,
Mariana-Daniela González-Zamar
2 and
Luis Jesús Belmonte-Ureña
1,3,*
1
Department of Economics and Business, University of Almeria, 04120 Almeria, Spain
2
Department of Education, University of Almeria, 04120 Almeria, Spain
3
Research Centre CIAIMBITAL, University of Almeria, 04120 Almeria, Spain
*
Author to whom correspondence should be addressed.
Sustainability 2020, 12(14), 5792; https://doi.org/10.3390/su12145792
Submission received: 24 June 2020 / Revised: 9 July 2020 / Accepted: 12 July 2020 / Published: 18 July 2020

Abstract

:
The challenge of transitioning from a linear to a circular economy model is still ongoing and requires the development and application of new knowledge, leading to innovative, technological, and sustainable processes, products, and services. The evolution of global research on this topic from 2004 to 2019 was studied in this work. For this purpose, a bibliometric analysis of 1366 articles was applied, producing results on the scientific productivity of the driving agents that most contribute to this theme. The findings show a growing interest, especially in the last four years, in the study of circular economy (CE) policies on the environment. The main subject area that articles address is environmental science. Five research lines have been identified, which mainly study the efficient management of energy resources and the economic factors that make the CE model possible: Environmental pollution and agricultural activity; waste management to avoid a negative environmental impact; improvement of the environmental impact through ecological products; the product life cycle, and the consequences of climate change. The implementation of CE policies will contribute to making economies less dependent and unprotected and more competitive. Global research has exhibited an upward trend during the period analyzed and has grown exponentially since 2015, coinciding with the publication of the Sustainable Development Goals (SDGs) of the 2030 Agenda.

1. Introduction

In recent years, sustainable economy policies and strategies have allowed for a reduction in the pressure on the environment [1,2]. Institutions have realized that the linear economic model is part of the past and have launched actions to reduce waste; promote eco-design; reduce greenhouse gas emissions; enable a safer supply of raw materials; and encourage competitiveness and innovation, growth, and employment, among others [3,4].
Prior to this scenario, the economy was based on an extraction–manufacturing–use–disposal process. The linear economy model, based on the principle of product waste after use, has proven to be ineffective and unsustainable over time [5]. This circumstance has motivated the emergence of an alternative model, known as the circular economy (CE) model, which places an emphasis on the sustainability of the use of natural resources [6]. This economic development system is based on the reduction, reuse, recovery, and recycling of materials and energy, transforming the linear flow into circular flows [7,8]. In this way, waste becomes a resource and is reintroduced into the production process. CE is key to breaking the link between economic growth and the increased consumption of natural resources [9,10,11].
Moreover, implementation of the CE principles entails a large number of benefits for the environment and society, such as a reduction in the use of resources, a reduction in waste production, and limitations of energy consumption, and directly enables the prospect of sustainable growth [12,13,14].
The motivation of this research was to examine the evolution of scientific knowledge based on CE policies on the environment and sustainability. Accordingly, this study provides a critical analysis of the research conducted so far and identifies CE actions focused on the environment.
The research in this study refers to the following issues: What has been the distribution of scientific production? Who are the main agents behind this issue and how are they associated with it? What are the main research lines? What is the nature of the relationship between the CE indicators and these lines? How do CE policies influence the environment?
The main objective of this study is to analyze the research trends on the effects of CE policies on the environment, from the perspective of sustainable growth at a global level, from 2004 to 2019. To obtain answers to the research questions, a sample of 1366 scientific articles selected from the Elsevier Scopus database was analyzed. This research work uses the bibliometric method to synthesize a knowledge base on the selected subject.
The research lines identified mainly study the efficient management of energy resources, environmental pollution, and agricultural activity; waste management to avoid a negative environmental impact; improvement of the environmental impact; the life cycle of a product; and the consequences of climate change.
The results show the contributions of this research line, which has allowed us to identify the main driving agents and their trends and to reveal certain gaps in the critical knowledge.

2. Background

A literature review provided the background for this topic, in addition to the theoretical and conceptual frameworks for the research. These include, on the one hand, the theoretical bases and, on the other, the basic aspects and considerations of the terms and concepts used in the context of this study.

2.1. Literature Review

The classical concept of economics as a social science refers to the study of how to manage the available resources to satisfy human needs. Since the planet’s resources are scarce, we are forced to manage these assets to achieve what we lack. In this way, economic science analyzes the decision-making of individuals, organizations, and states, in order to allocate these scarce resources [15,16]. It is also in charge of studying the production process of goods and services, from the extraction of raw materials to their use by the final consumer, and assigning limited resources [17,18].
The economic model that has been established since the Industrial Revolution is the linear economy, whose basic principle is the disposal of products after their use. According to this model, all products have a linear cycle, comprising the extraction of raw materials; processing and transformation into products; the distribution and sale; the use; and, finally, the disposal as waste [19,20,21]. In the linear model (extraction, manufacturing, use, and disposal), there is no recovery or reuse of products, so the materials that were previously products or merchandise become unusable waste [22].
Throughout history, this intensive use of natural resources has been carried out without analyzing or foreseeing the environmental impacts and without attempting to reuse resources that are reusable. This raw waste makes separation and reuse difficult and leads to sanitary landfills, incinerators, or even uncontrolled abandonment [23,24].
The linear economy model stands out for its inefficiency and unsustainability, since both natural resources and energy sources are limited, in addition to its negative consequences at the environmental level [25,26].
For the reasons stated, and as an alternative to the linear model, a new model has emerged, the CE, which places an emphasis on repair, recycling, reuse, and reduction, in order to make the economy and life on the planet more sustainable [27]. In this circular model, the residue becomes a resource [28].

2.2. Framework

After reviewing the literature, a theoretical and conceptual framework was produced in the context defined for this research. Table 1 shows the main documents examined to focus both frameworks. These documents allowed the problem, purpose, and objective of the research to be determined, in addition to providing the key terms required to apply the methodology.
The theoretical principles of the effects of CE policies on the environment are supported by a set of theoretical bases, so their introduction in both institutions and companies is well-founded. In this way, the theoretical approach of the stakeholders is established, initially developed by Freeman in 1984 [39,40]. It is necessary to clarify that, previously, there was a need to disclose the active contributions of corporate social responsibility. Subsequently, the interest in corporate economic, social, and environmental responsibility has increased with increasing social demands for organizations to commit to addressing their negative impacts [41]. In this manner, organizations tend to change their models to reflect the concepts of responsibility, including economic, environmental, and social objectives, and the interaction with each of the stakeholders [42,43]; that is, the environmental factor affects the attitude of the stakeholder as a political opportunity and a claim [44,45].
Next, the definitions of the basic concepts of this research that will be used in the development of the study are provided, with the aim of avoiding different interpretations.
The economic concept of the CE model is interrelated with sustainability, and its purpose is to ensure that the value of products, materials, and resources remains in the economy for as long as possible, and that the generation of electricity is minimized. This model is the antithesis of the linear model, and is the intersection of environmental, economic, and social aspects; that is, it is directly aligned with sustainable development [46,47,48]. The CE system, supported by the exhaustion of a series of natural resources and fossil fuels, proposes a society model that optimizes the stocks and flows of materials, energy, and waste, and its main objective is to ensure the efficient use of resources [49,50]. For this reason, in the context of scarcity and fluctuation in the costs of raw materials, the CE contributes to the security of supply and to the re-industrialization of the national territory. Therefore, it manages to convert waste into raw materials, as a paradigm of a future system [51,52].
This development model is based on the mechanisms that govern natural ecosystems, founded on a long-term management logic and a process of continuous recycling and the reintroduction of resources in the ecosystem for reuse. Among the requirements for the viability of the model are the technical and economic compatibility of products and productive activities, in addition to the existence of a social and institutional structure supported by incentives and including values related to the environment and sustainability [53,54].
An effective CE system covers the entire production cycle: (i) The search for more sustainable raw materials and energy sources; (ii) the redesign of more efficient production processes; (iii) the development of more durable and susceptible products for repair, reuse, and recycling; and (iv) the development of economically viable and environmentally sustainable business models [55,56,57].
Therefore, CE translates into an integrated systemic process of the reduction, reuse, recovery, and recycling of materials and energy. Its objective is to achieve closure of the cycle in all phases of the value chain; that is, product design and services; production; distribution; maximization of the useful life of the product; and revitalization of networks of resumption, reuse, remanufacturing, or recycling [58,59].
In this context, waste refers to any object, material, substance, or element resulting from the consumption or use of a good in domestic, industrial, commercial, institutional, or service activities, that is abandoned or rejected, but that is susceptible to the use or transformation of a new good, with economic value or final disposal [60,61]. Therefore, in a CE, waste enters the production cycle again as secondary raw material and its use is critical as the main source of reliable raw material [62,63].
This term is directly related to that of recycling, which consists of subjecting waste to a transformation process to take advantage of it as a resource, without having to resort to the use of new natural resources. In turn, recycling is a sustainable way of managing and involves reuse [64,65].
In relation to this term, waste management encompasses activities related to the life cycle of waste, which must receive appropriate treatment so as not to cause a negative environmental impact. The main phases of waste management include (i) the recovery and collection of waste at the source using containers; (ii) transportation from the origin to the classification or treatment plant; and (iii) recovery, elimination, or preparation treatment [66,67,68].
A key concept in this study is the environment, which, at the United Nations Conference on the Environment in Stockholm in 1972, was defined as “the set of physical, chemical, biological and social components capable of causing direct or indirect effects, in a short or long term, about living things and human activities” [69]. The importance of this term lies in the fact that it is conservation of the environment that leads to the sustained life of all generations in a given environment and allows future generations to enjoy the same or better characteristics [70,71]. In this way, the concepts of CE and the environment are linked.
On the other hand, it is estimated that the CE can reduce practically all of the waste from some sectors and from greenhouse gas emissions, thus allowing it to protect the environment and combat climate change [72,73]. CE policies offer a framework for measures to reduce waste production and use this material as resources [74,75]. The success of the CE lies in making the most of the value of biomass resources, and thus contributes towards economic growth, job creation, and environmental sustainability [76].

3. Data and Methodology

Scientometrics consists of the study and quantitative analysis of scientific production, in order to investigate the development, structure, dynamics, trends, and relationships of scientific practice. It is based on the work of D.J. Solla Price and E. Garfield, who created the Institute for Scientific Information (ISI) in 1960. Later, in 1998, they founded the journal Scientometrics, dedicated to the study and analysis of scientometrics [77,78].
On the other hand, bibliometrics is considered a part of scientometrics that applies mathematical and statistical methods to scientific literature to analyse its activity. Initially, it was introduced by E. Garfield in the middle of the 20th century and since then, it has become widespread in scientific research and has led to the revision of knowledge in various disciplines during the last decades [79,80]. Thereby, scientometrics and bibliometrics have evolved from reflections on scientific development and the availability of databases for the researcher. Likewise, the instruments used to measure aspects of scientific activity are bibliometric indicators, which refer to measures that provide information on the results of scientific activity in any of its manifestations [81].
In this study, a bibliometric analysis was carried out, which is a method that seeks to identify, organize, and analyze trends in the research topic. In recent decades, the bibliometric method has contributed to the revision of scientific knowledge and has been successfully used in various scientific fields [82,83,84].
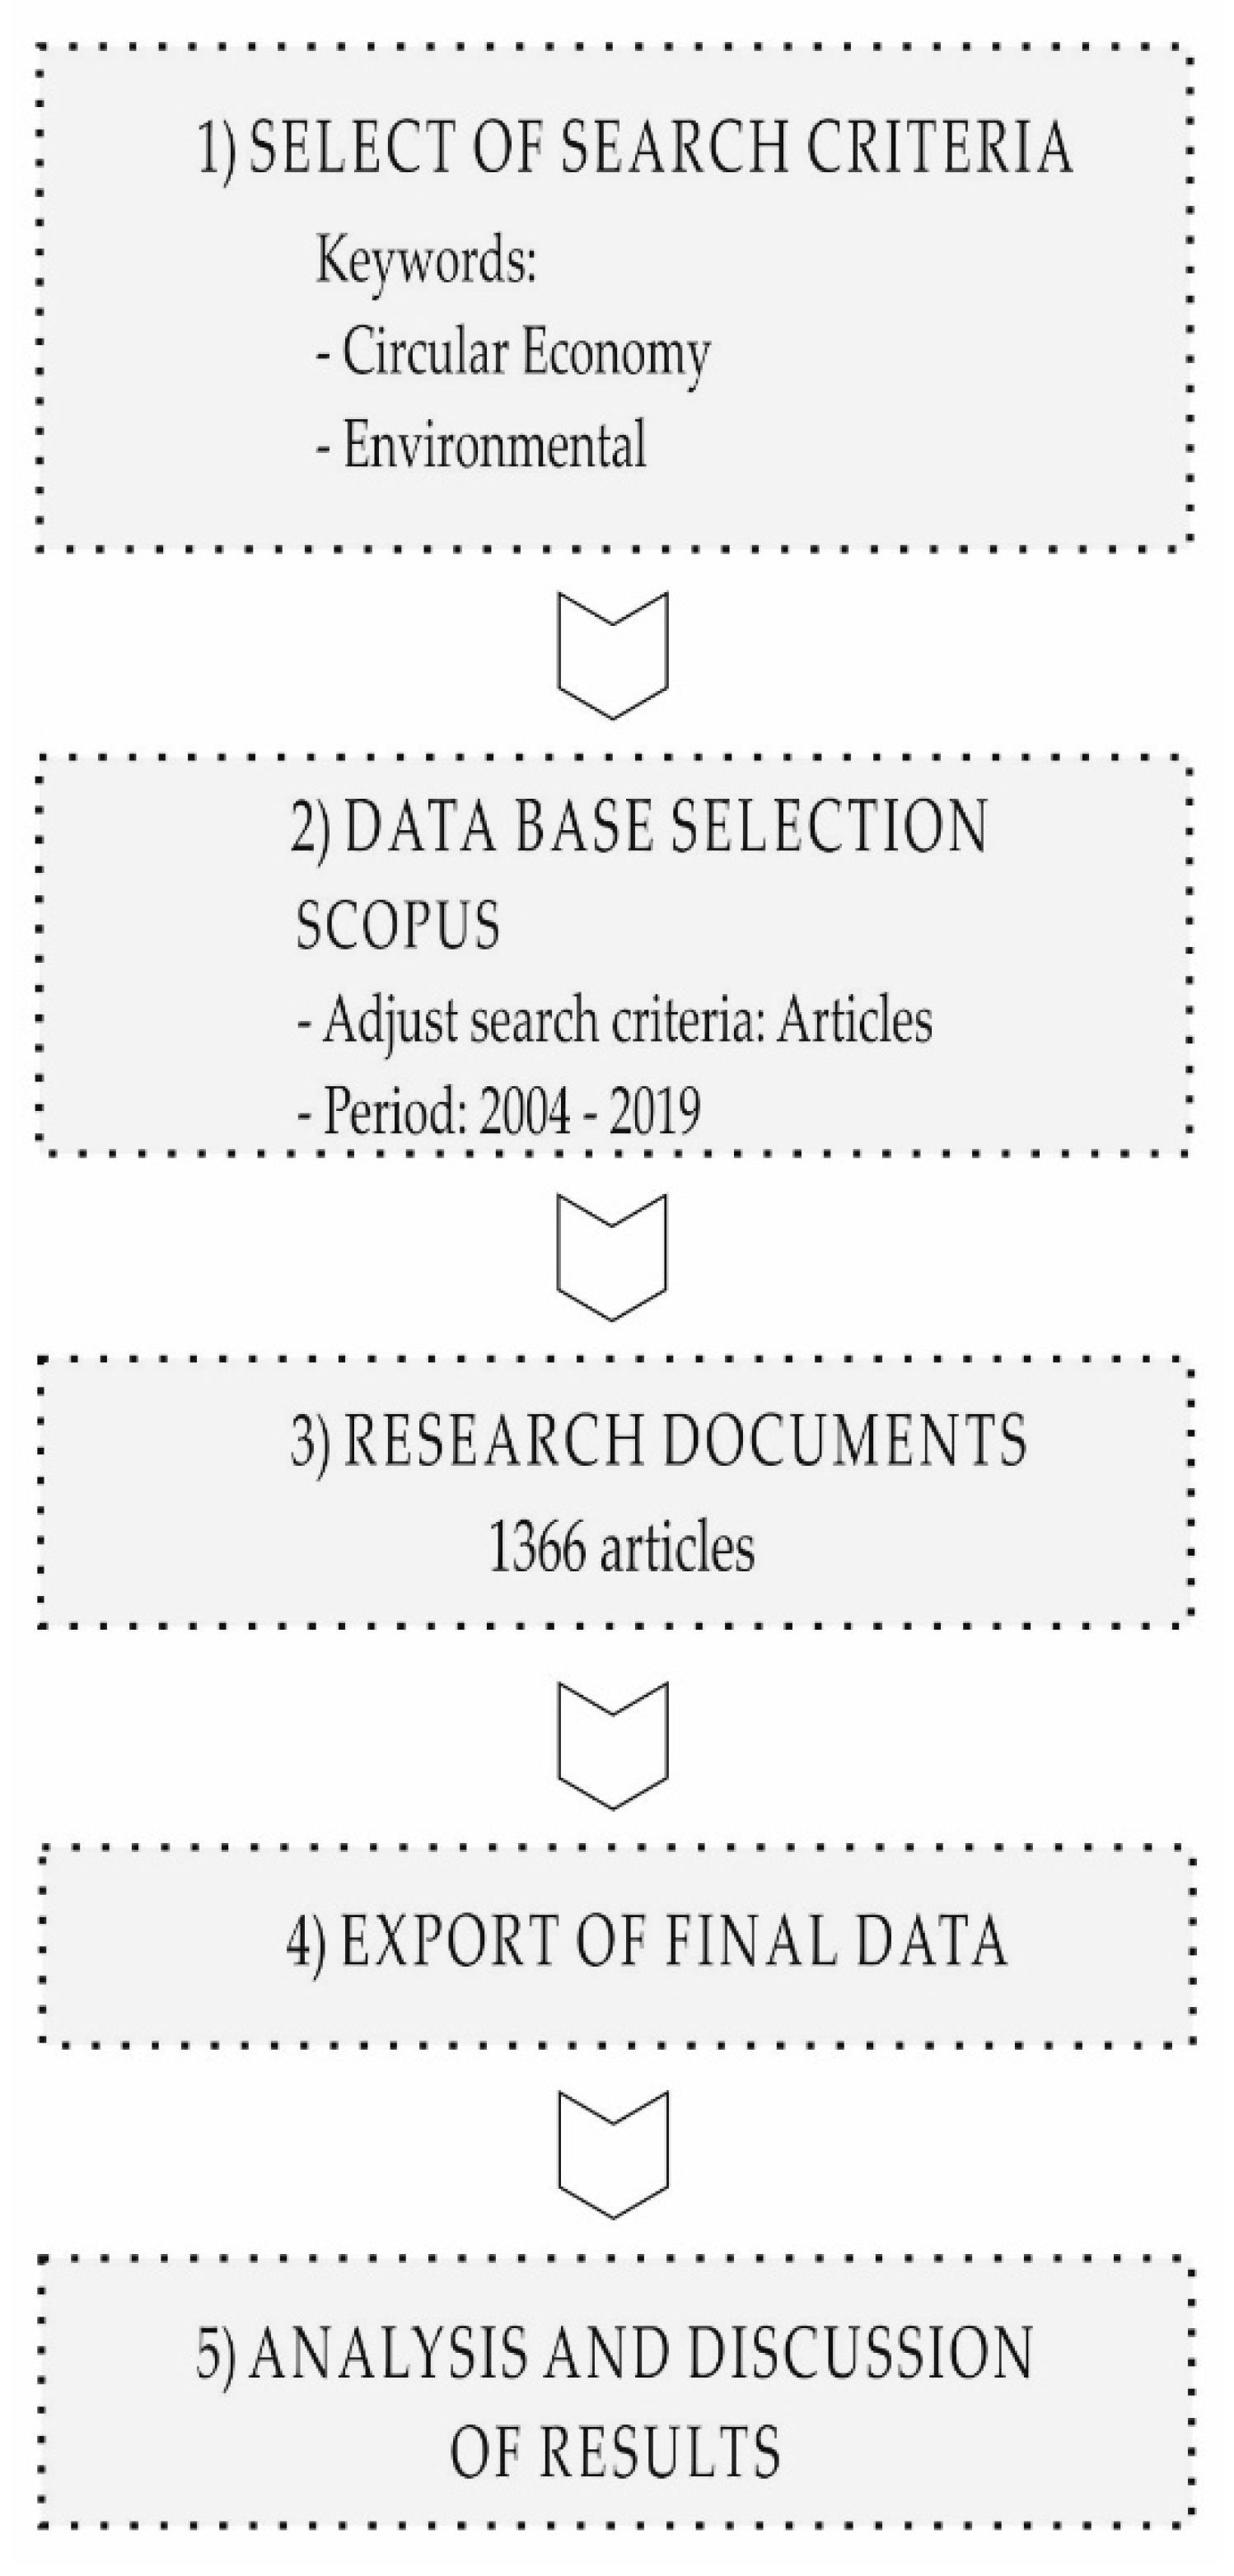
In this sense, the methodology was used to perform a complete search of the Scopus database, using a search string with the terms “circular economy” and “environment”, in order to examine the subfields of the title, abstract, and keywords during a period of 16 years, from 2004 to 2019. The sample of analyzed articles only included scientific articles, both open and non-open access. The final sample contained a total of 1366 documents. The variables analysed were the year of publication, the subject area, the journal, the author, the country of affiliation of the author, the institution where the author is affiliated, and the keywords that define the publication. Figure 1 shows the methodology applied in relation to the objective of the study.
In this study, the scientific production indicators analysed were the distribution of articles published during the period analysed and the productivity of authors, countries, and institutions.
The quality indicators used were the count of the number of citations, the Hirsch index (h-index), and the impact index of the SCImago Journal Rank (SJR), which measures the quality of the scientific journals included in the Scopus database [85]. In addition, the collaborative structure indicators, which measure the links between authors, institutions, and countries, were analysed through network mapping and processing tools for their reliability and suitability in bibliometric analysis [86,87].
In this way, the VOSviewer tool (version 1.6.10., Leiden University, Leiden, The Netherlands) allowed us to carry out the following [88]: (i) Co-authorship analysis, for investigating the social structure of this field of research and evaluating patterns of scientific collaboration [89], and (ii) co-occurrence analysis, to provide a graphical visualization of potential relationships between the key concepts represented within the sample articles [90].
The results obtained are useful for researchers, academics, analysts, managers, and other stakeholders, since scientific activity in this research field was evaluated for the period 2004–2019.

4. Results and Discussion

Section 4 develops an analysis of scientific production on the subject of study, that is, of the effects of CE policies on the environment in the time horizon of 2004 to 2019. In addition, it presents an analysis of the main agents that have developed this field of research, that is, the authors, research institutions, and countries. Subsequently, the keywords of the article sample that allow us to detect the research lines carried out are analyzed, and it is shown how they have evolved during the period. Lastly, this section detects which CE indicators evaluate the different aspects and dimensions of these research lines, in addition to allowing the identification of the necessary CE policies in different sectors of the economic spectrum to make CE a cross-cutting issue in the current and future economic model on a global scale.

4.1. Evolution of Scientific Production

The main characteristics of research examining the implications of CE policies for the environment, from 2004 to 2019, are shown in Table 2. The time horizon studied is 16 years, so each period analyzed comprises four years of scientific production.
Interest in this research field has exhibited a growing trend since the first contributions in 2004. Therefore, in the first period analyzed (2004–2007), 21 articles were published, representing 1.5% of the total production. In the last period analyzed (2016–2019), 1202 articles were registered (88%). This evolution in scientific production is reflected in the average number of published articles, since this value increases from five annual publications, in the first period, to 300, in the last period. The Sustainable Development Goals (SDGs) [91,92], in force since 1 January 2016, coincide with the first year of the last period analyzed (2016–2019). This is reflected in the number of articles that were published in these four years, causing a variation percentage of 1067% with respect to the previous period (2012–2015). This exponential increase in the number of articles in the last period analyzed is largely due to the need for research alternatives that improve the current and future situation of the environment. For this reason, in the sample obtained, there are numerous publications that focus on researching the proper management of resources in an effort to work towards a CE model [93,94,95].
The rest of the variables experience the same growth trend. The sample obtained included a total of 4152 authors. The first period (2004–2007) has a total of 47 authors, which is a value that increases in the following periods. In the 2016–2019 period, the number of authors amounts to 3825, so 92% of the total sample contributed to the scientific production of this last period. This increase is represented in the average number of authors per article, since this value increases from 2.2 in the first period, to 3.2 in the last period.
In the first period, seven countries were registered, while in the last period, 81 countries that make up the total sample collaborated in the scientific production of this four-year period. The period 2012–2015 stands out, due to having the highest percentage of variation (237.5%) when registering the collaboration of 27 countries.
On the other hand, in the first period studied (2004–2007), a total of five citations were counted, while in the last period (2016–2019), 13,095 citations were counted, representing 92.7% of the total. Therefore, the average number of citations per article has increased from five (2008–2011) to 11 citations per article (2016–2019).
The total number of journals in which the articles have been published is 431. The first period, with 16 journals, represents 3.7% of the total journals, compared to 85.8% representing the 370 journals of the last period studied. Finally, the average number of articles published per journal increased from 1.3 to 3.2.
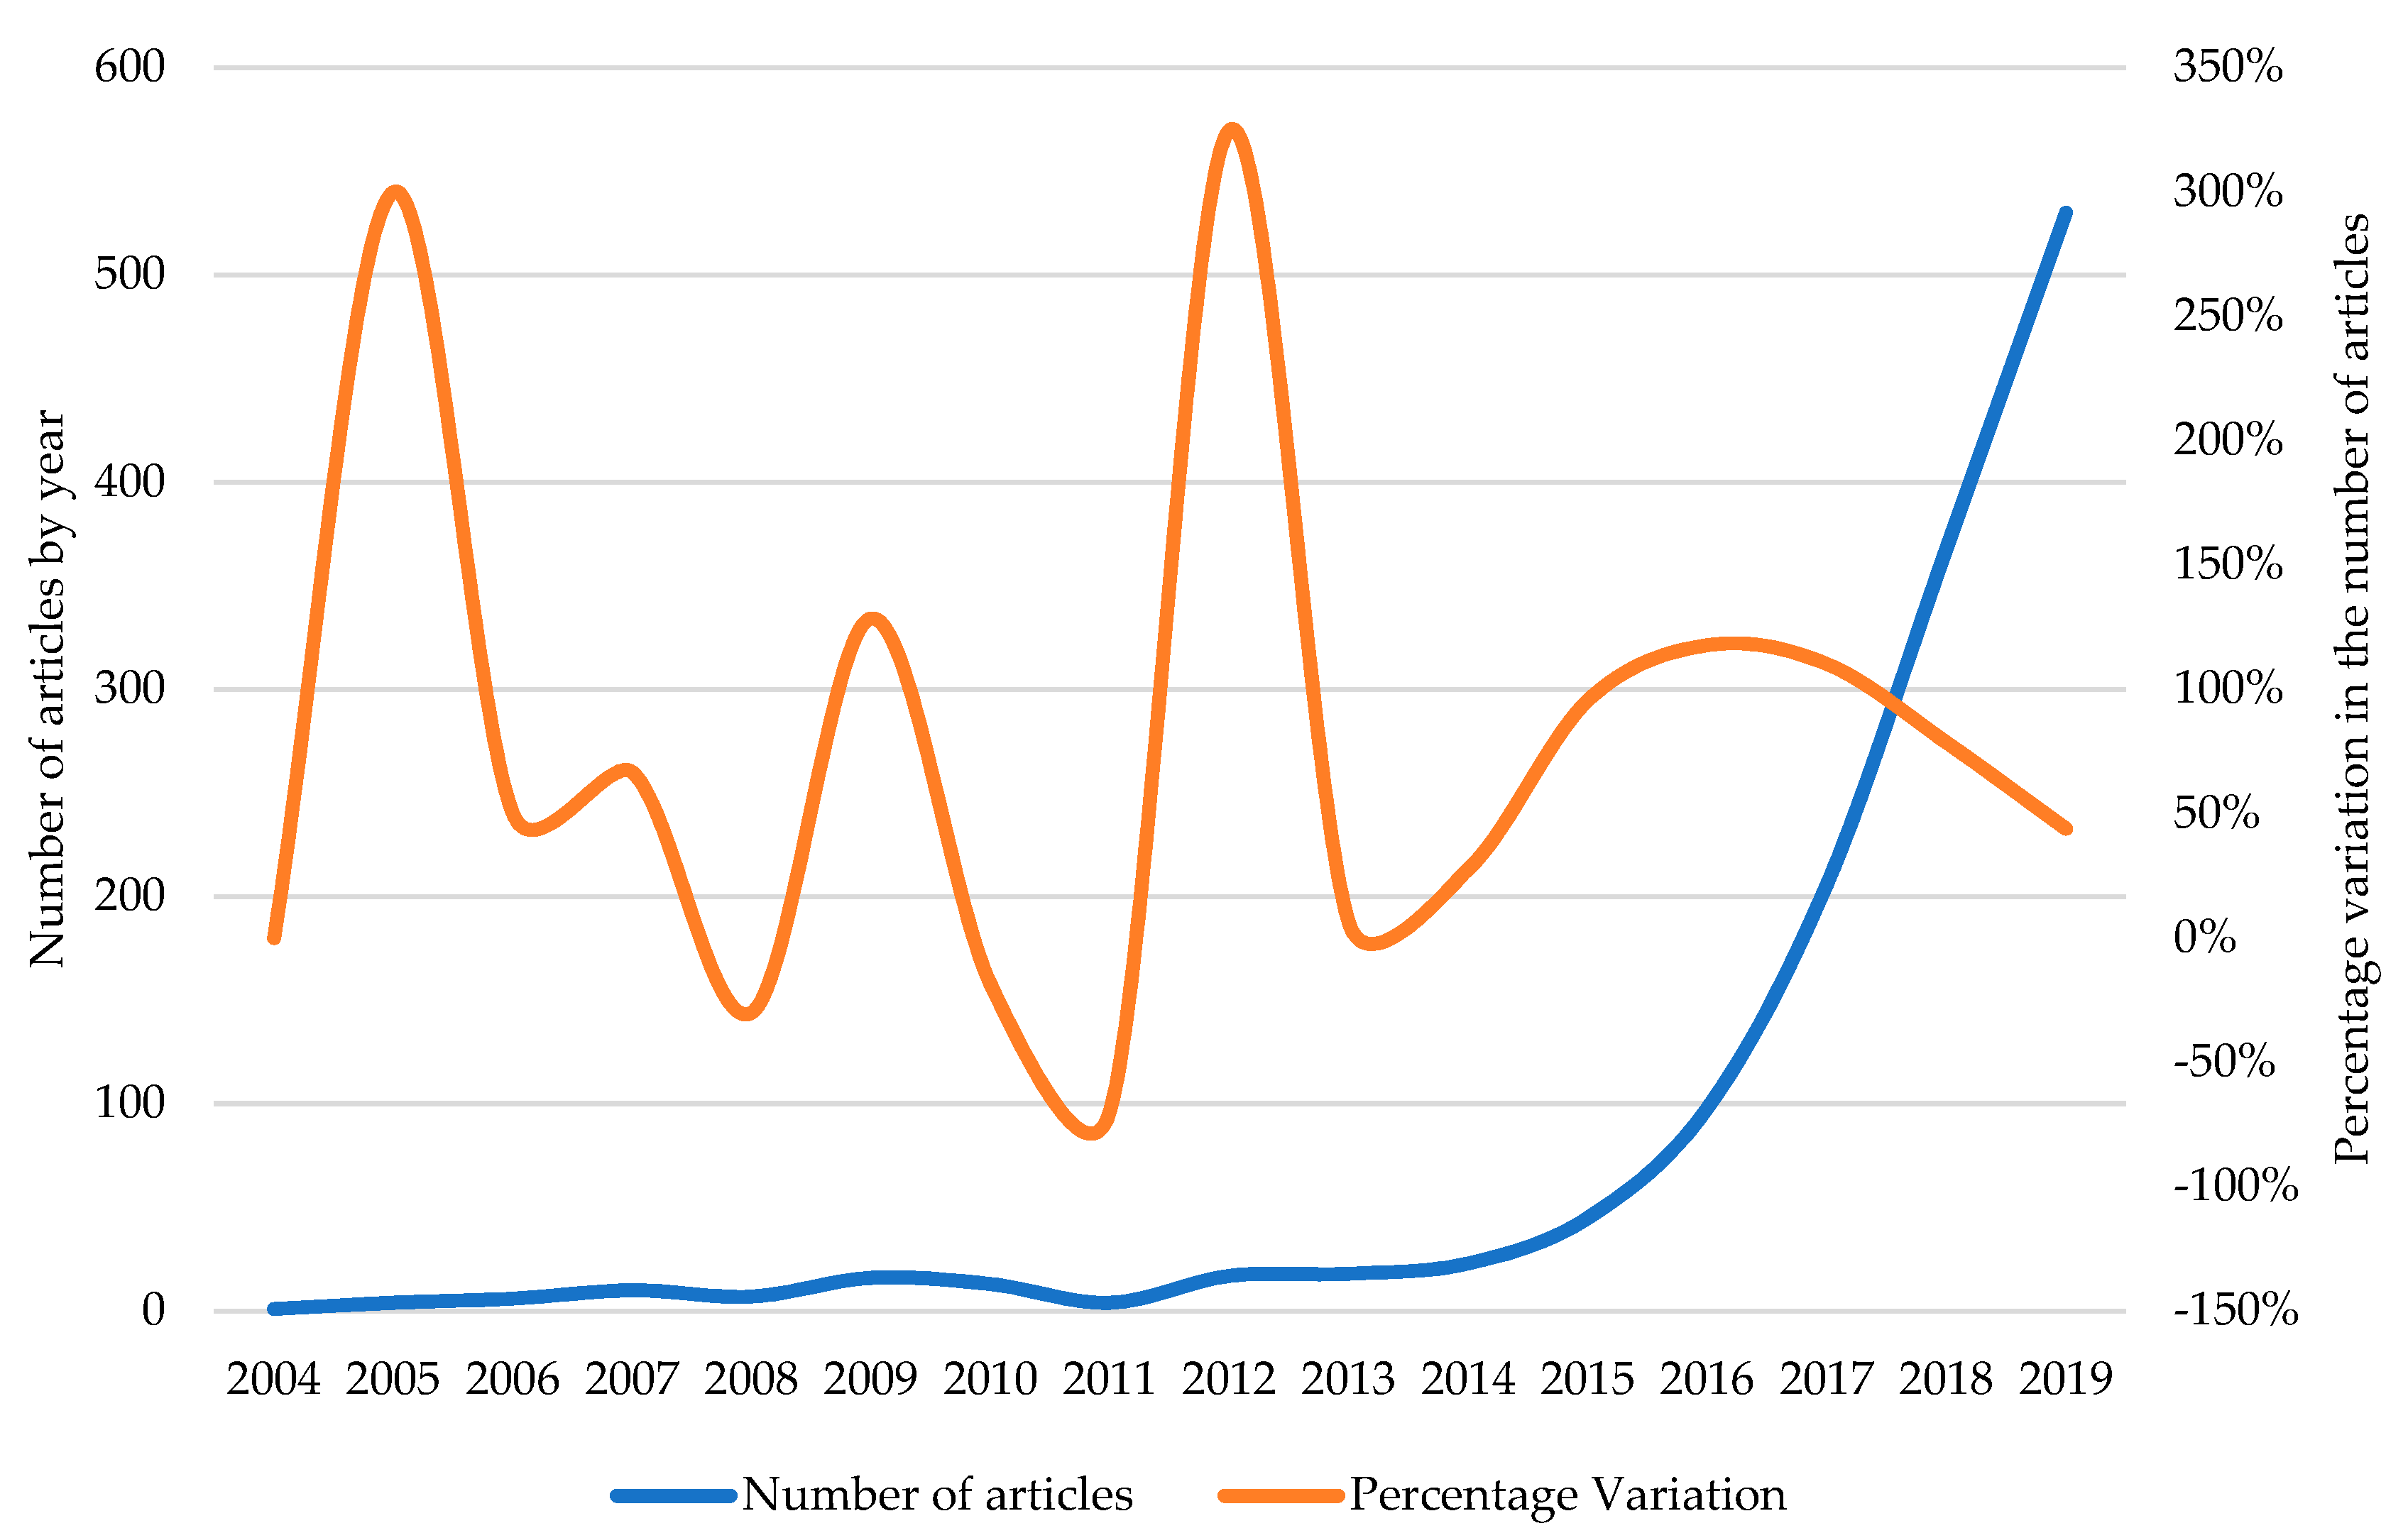
Figure 2 displays the annual number of articles and the percentage of variation along the studied time horizon. The blue line, which refers to the number of articles published, represents the increase in interest that has occurred in this research line. The first year in which the number of articles exceeded 100 was 2017, with 206 documents. Additionally, 2019 stands out, with 530 articles, as it is the year with the highest number of contributions. On the other hand, the orange line, which indicates the percentage of variation in the number of articles, shows the changes experienced in scientific production throughout the period studied. The highest percentage of growth was experienced in 2012, with a value of 325%, since the value increased from four items to 17. The second highest value, with a percentage of variation of 300%, was recorded in 2005, since the figure increased from one to four posts. Lastly, 2011 stands out for displaying the greatest percentage decrease in the analysed time horizon (−69%).

4.2. Analysis of Scientific Production by Subject Area

The Scopus database allows articles to be classified into different subject areas, according to the object of study and the perspectives of the analysis proposed. In this study, the sample obtained from 1366 articles was classified into a total of 25 thematic areas.
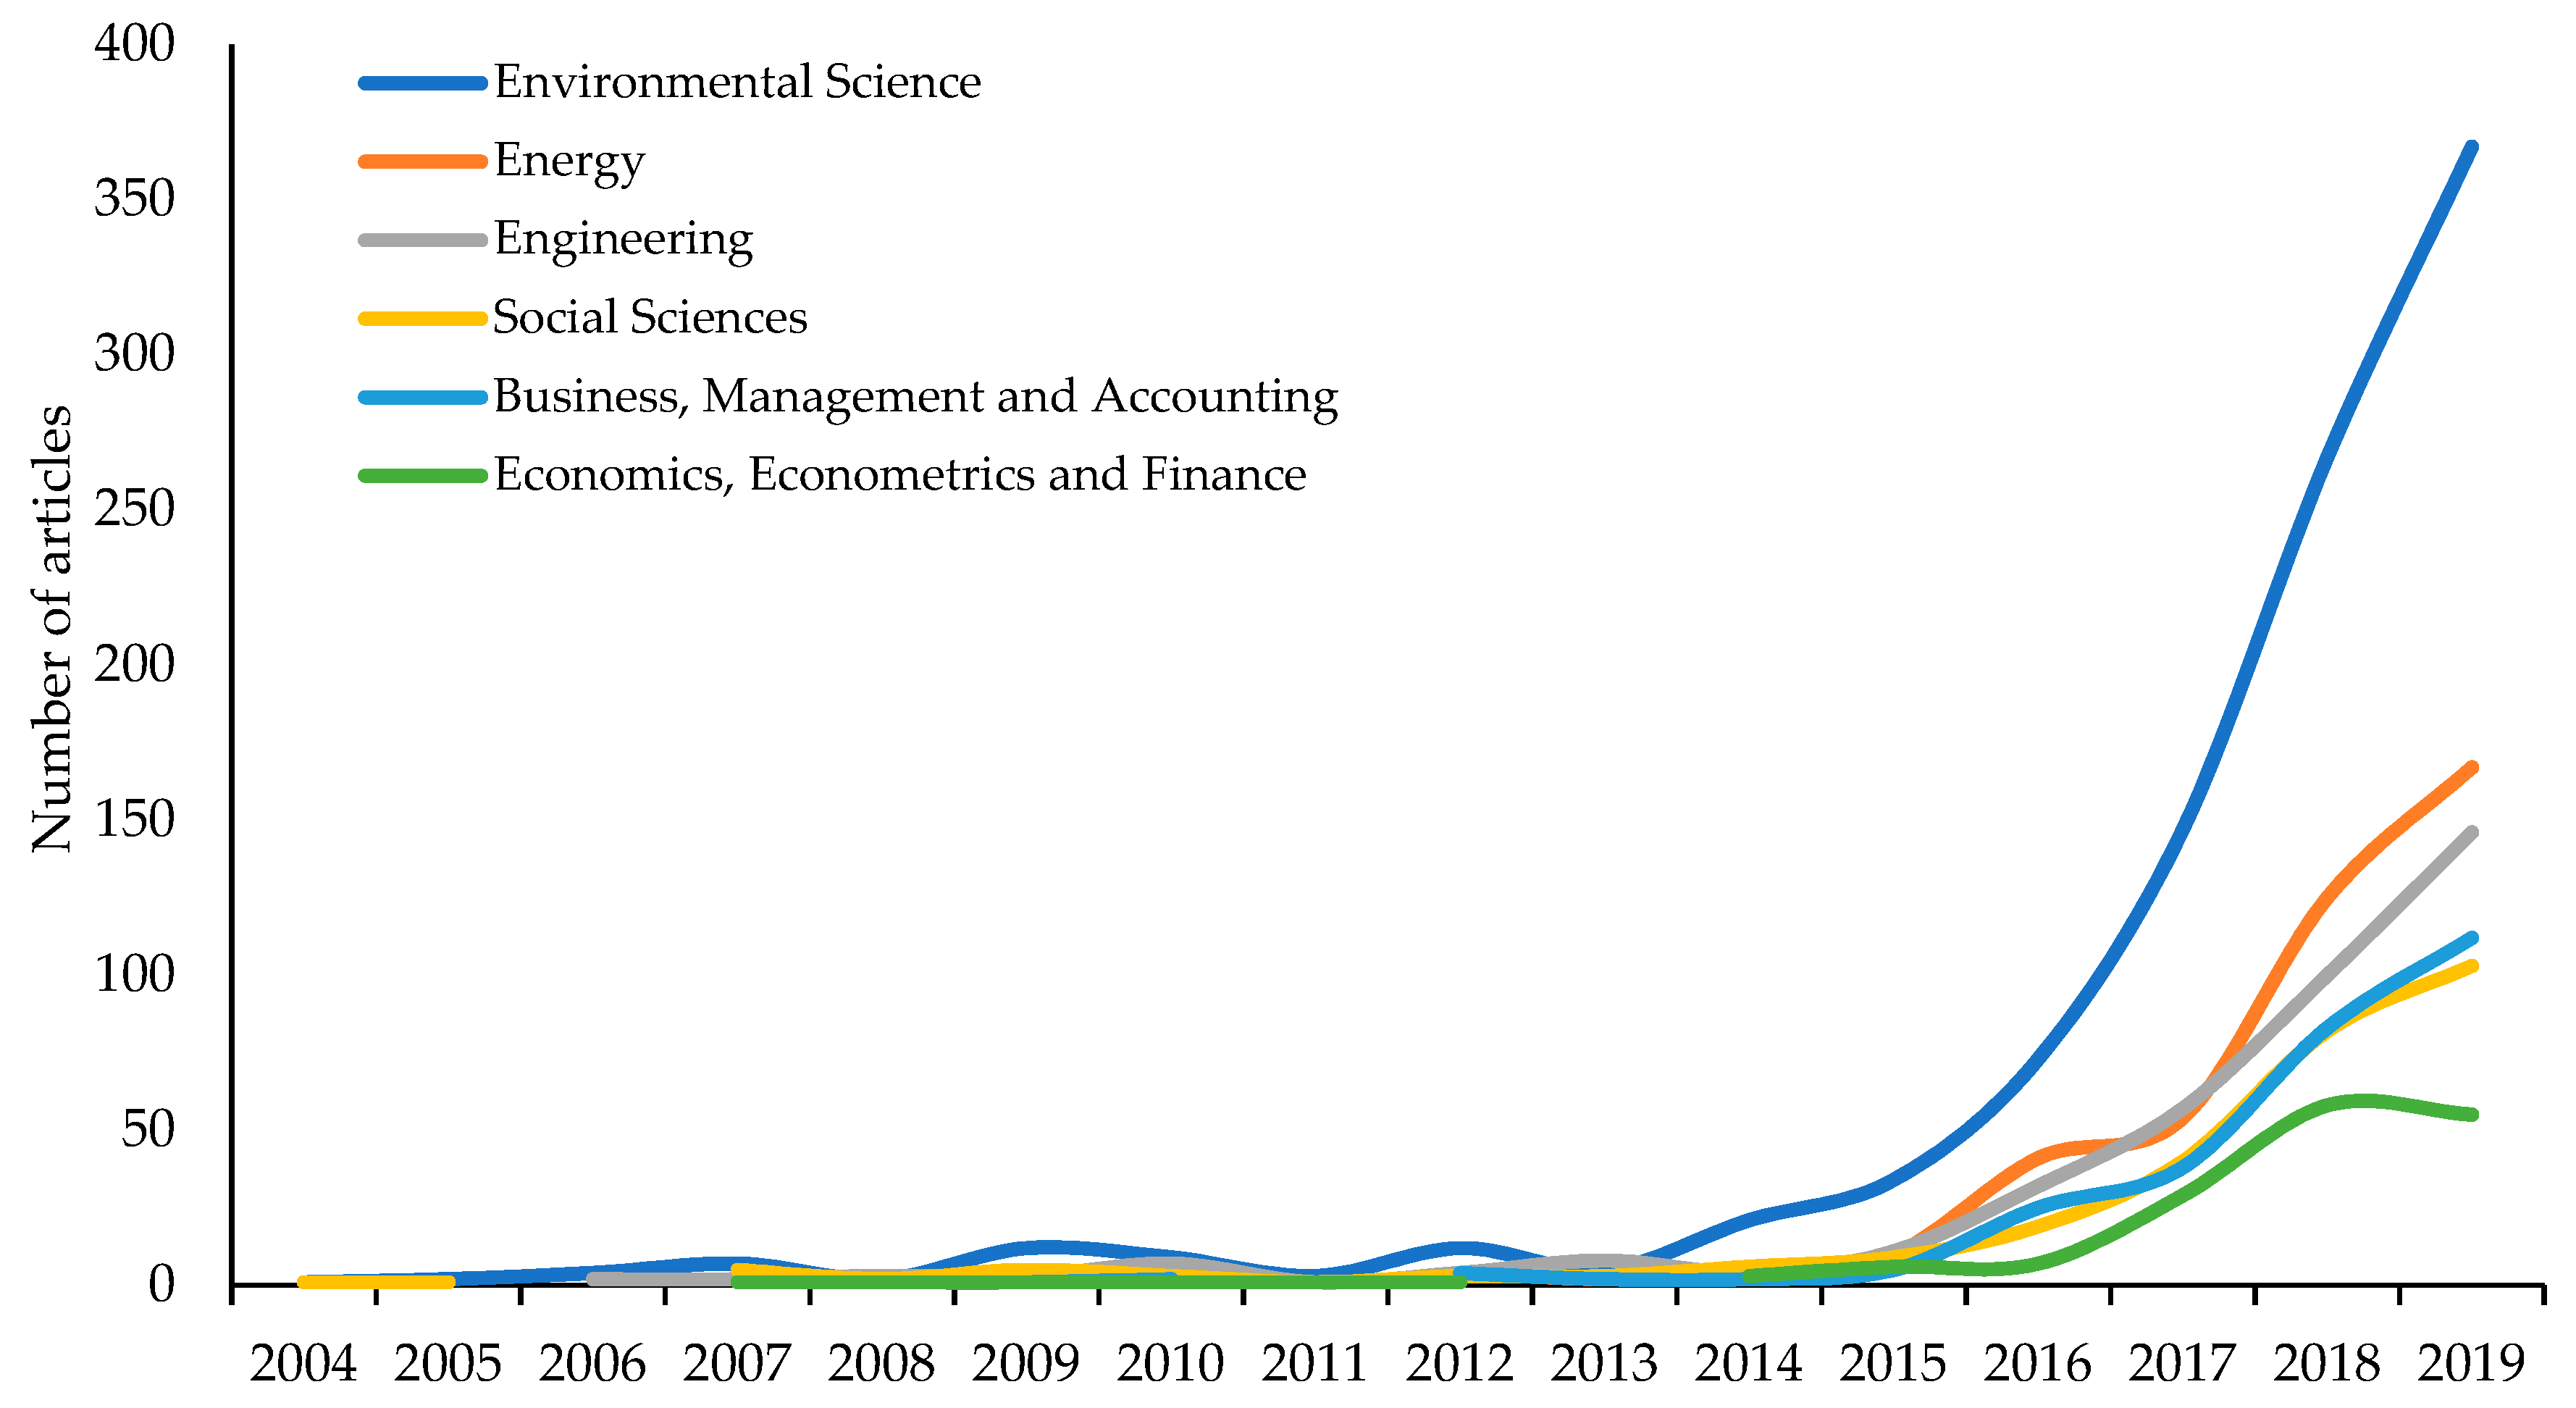
Figure 3 shows the evolution of the six main categories in which the articles on the effects of CE policies on the environment are framed. The most significant subject area is Environmental Sciences, which covers 966 articles and represents 32% of the total sample. In this category, more than half of the articles are classified, since there is a direct relationship between the field of study and the subject area. Energy occupies the second position, with 409 articles (14%). In 2012, it began to be considered annually as a category related to the topic of study, and from 2018, it managed to establish itself as the discipline in which the second most articles were framed. In third place, with 380 articles, is the Engineering subject area. This subject area represents 13% of the total sample, and since 2006, it has been considered annually.
The Social Sciences and Business, Management, and Accounting categories occupy the fourth and fifth position, respectively. These subject areas include 283 and 276 articles, respectively, and both represent 9% of total scientific production. Finally, in sixth position, is the thematic area of Economy, Econometrics, and Finance, which includes 165 articles (5%). These six categories account for 2479 articles (82%). It is usual that the number of articles that are grouped into the subject areas exceeds that of the analysed sample (1366), since each article can be classified into one or more disciplines, depending on the interest of the authors and the editor of the journal.

4.3. Identification of the Most Prolific Journals

The articles have been published by a total of 431 international journals. Table 3 shows the 20 most prolific journals, which comprise a total of 697 articles and represent 51% of the total sample. Likewise, the main characteristics of the journals are detailed, such as the articles published, the h-index of the journal [96], the quartile to which they belong in the SJR indicator [97], and the country. The main characteristics of the articles published are also mentioned, such as the total citations received [98], the average number of citations per article, the h-index, and the period of publication. The country of these journals varies, although those of European (12) and American (6) origin predominate. The high percentage of journals (65%) belonging to the first quartile of the SJR indicator stands out.
The Journal of Cleaner Production heads this ranking, and it has the highest number of articles (178), total citations (4097), and h-index in articles (34). It belongs to the first quartile and has an SJR indicator of 1.620. The first article published by this journal was “A survey and analysis on public awareness and performance for promoting circular economy in China: A case study from Tianjin” [99], in 2009.
The second most prolific journal, Sustainability, has a total of 557 citations and an average of 5.36 citations per article. This journal of Swiss origin, which belongs to the second quartile, has an h-index of 53 and an SJR indicator of 0.549. The first article was published in 2014, and since then, it has published 104 articles on this topic. In addition, Sustainability stands out for its great progress between the last two periods analyzed. Hence, while in the period 2012–2015, it was in position 13, with two published articles, in 2016–2019, it was in second place, with a total of 102 articles.
Resources Conservation and Recycling is the third journal. It stands out for having the second highest value in total citations and the highest h-index in articles, with values of 1566 and 26, respectively. It belongs to the first quartile, with an SJR indicator of 1.541 and an h-index of 103. “Towards a more Circular Economy: Proposing a framework linking sustainable public procurement and sustainable business models” [100] is the article in this journal that has received the most citations, with a total of 161. Position 12 is occupied by Environmental Science and Technology. This journal of American origin stands out for having the highest h-index (345), average citations per article (46.77), and SJR indicator (2.514). Furthermore, it is the only journal in the ranking, along with the German Journal of Material Cycles and Waste Management, that published an article in the first period analyzed (2007).
Likewise, Table 3 indicates whether the journal follows open access or non-open access policy. Journals with non-open access have also included those that follow a hybrid model; that is, these magazines offer the possibility of paying to enable open access to certain articles, along with others that do not, which in general terms is known as open choice. For journals that follow the open access policy, access to their content does not require a prior subscription; however, authors who decide to publish in them must pay an article processing charge. On the other hand, the magnitude of the increase in journal citations will depend on the characteristics of the journal, such as its field, range, and discipline, as well as trends in similar journals toward open access [101].

4.4. Productivity of the Most Prolific Authors

Table 4 shows the 10 most relevant authors in the scientific production of CE policies on the environment. The main characteristics, such as published articles, total citations, average citations, and the h-index, are shown. Authors of European origin, specifically from Spain, stand out for representing 60% of the total sample. In addition, all of the authors of this ranking have published articles in the last year analyzed (2019), which indicates that they continue to have great interest in this research line.
The author who heads Table 4 is Yong Geng and belongs to Tongji University (Shanghai, China). This Chinese author has the highest number of articles (21), h-index (16), and total citations (1285). He stands out for being the author with the longest research career, since his first article—“Implementing China’s circular economy concept at the regional level: A review of progress in Dalian, China” [102]—was published in 2009.
Pere Fullana, the author who is ranked third, has an h-index of 4 and belongs to the Universitat Pompeu Fabra Barcelona. This Spanish author, who began publishing on this field of study in the last period analysed (2016–2019), has managed to rank among the most prolific. In addition, it is interesting to mention that authors use many forms to sign articles, which is why Scopus does not manage to gather all of the publications by the same author.
The author Phil Purnell ranks eighth in the Table. This UK author belongs to the University of Leeds and has eight articles. They stand out for having the third highest value in total citations (141) and average citations (17.63). Additionally, they have the second-best h-index, with a value of 7.
Finally, it is necessary to highlight that the rest of the authors have similar characteristics. Six belong to Spain, one to the United Kingdom, and the other to Belgium. All of them have published between seven and nine articles, have total citations with values in the range of 40–80, and have an h-index of between 4 and 6.
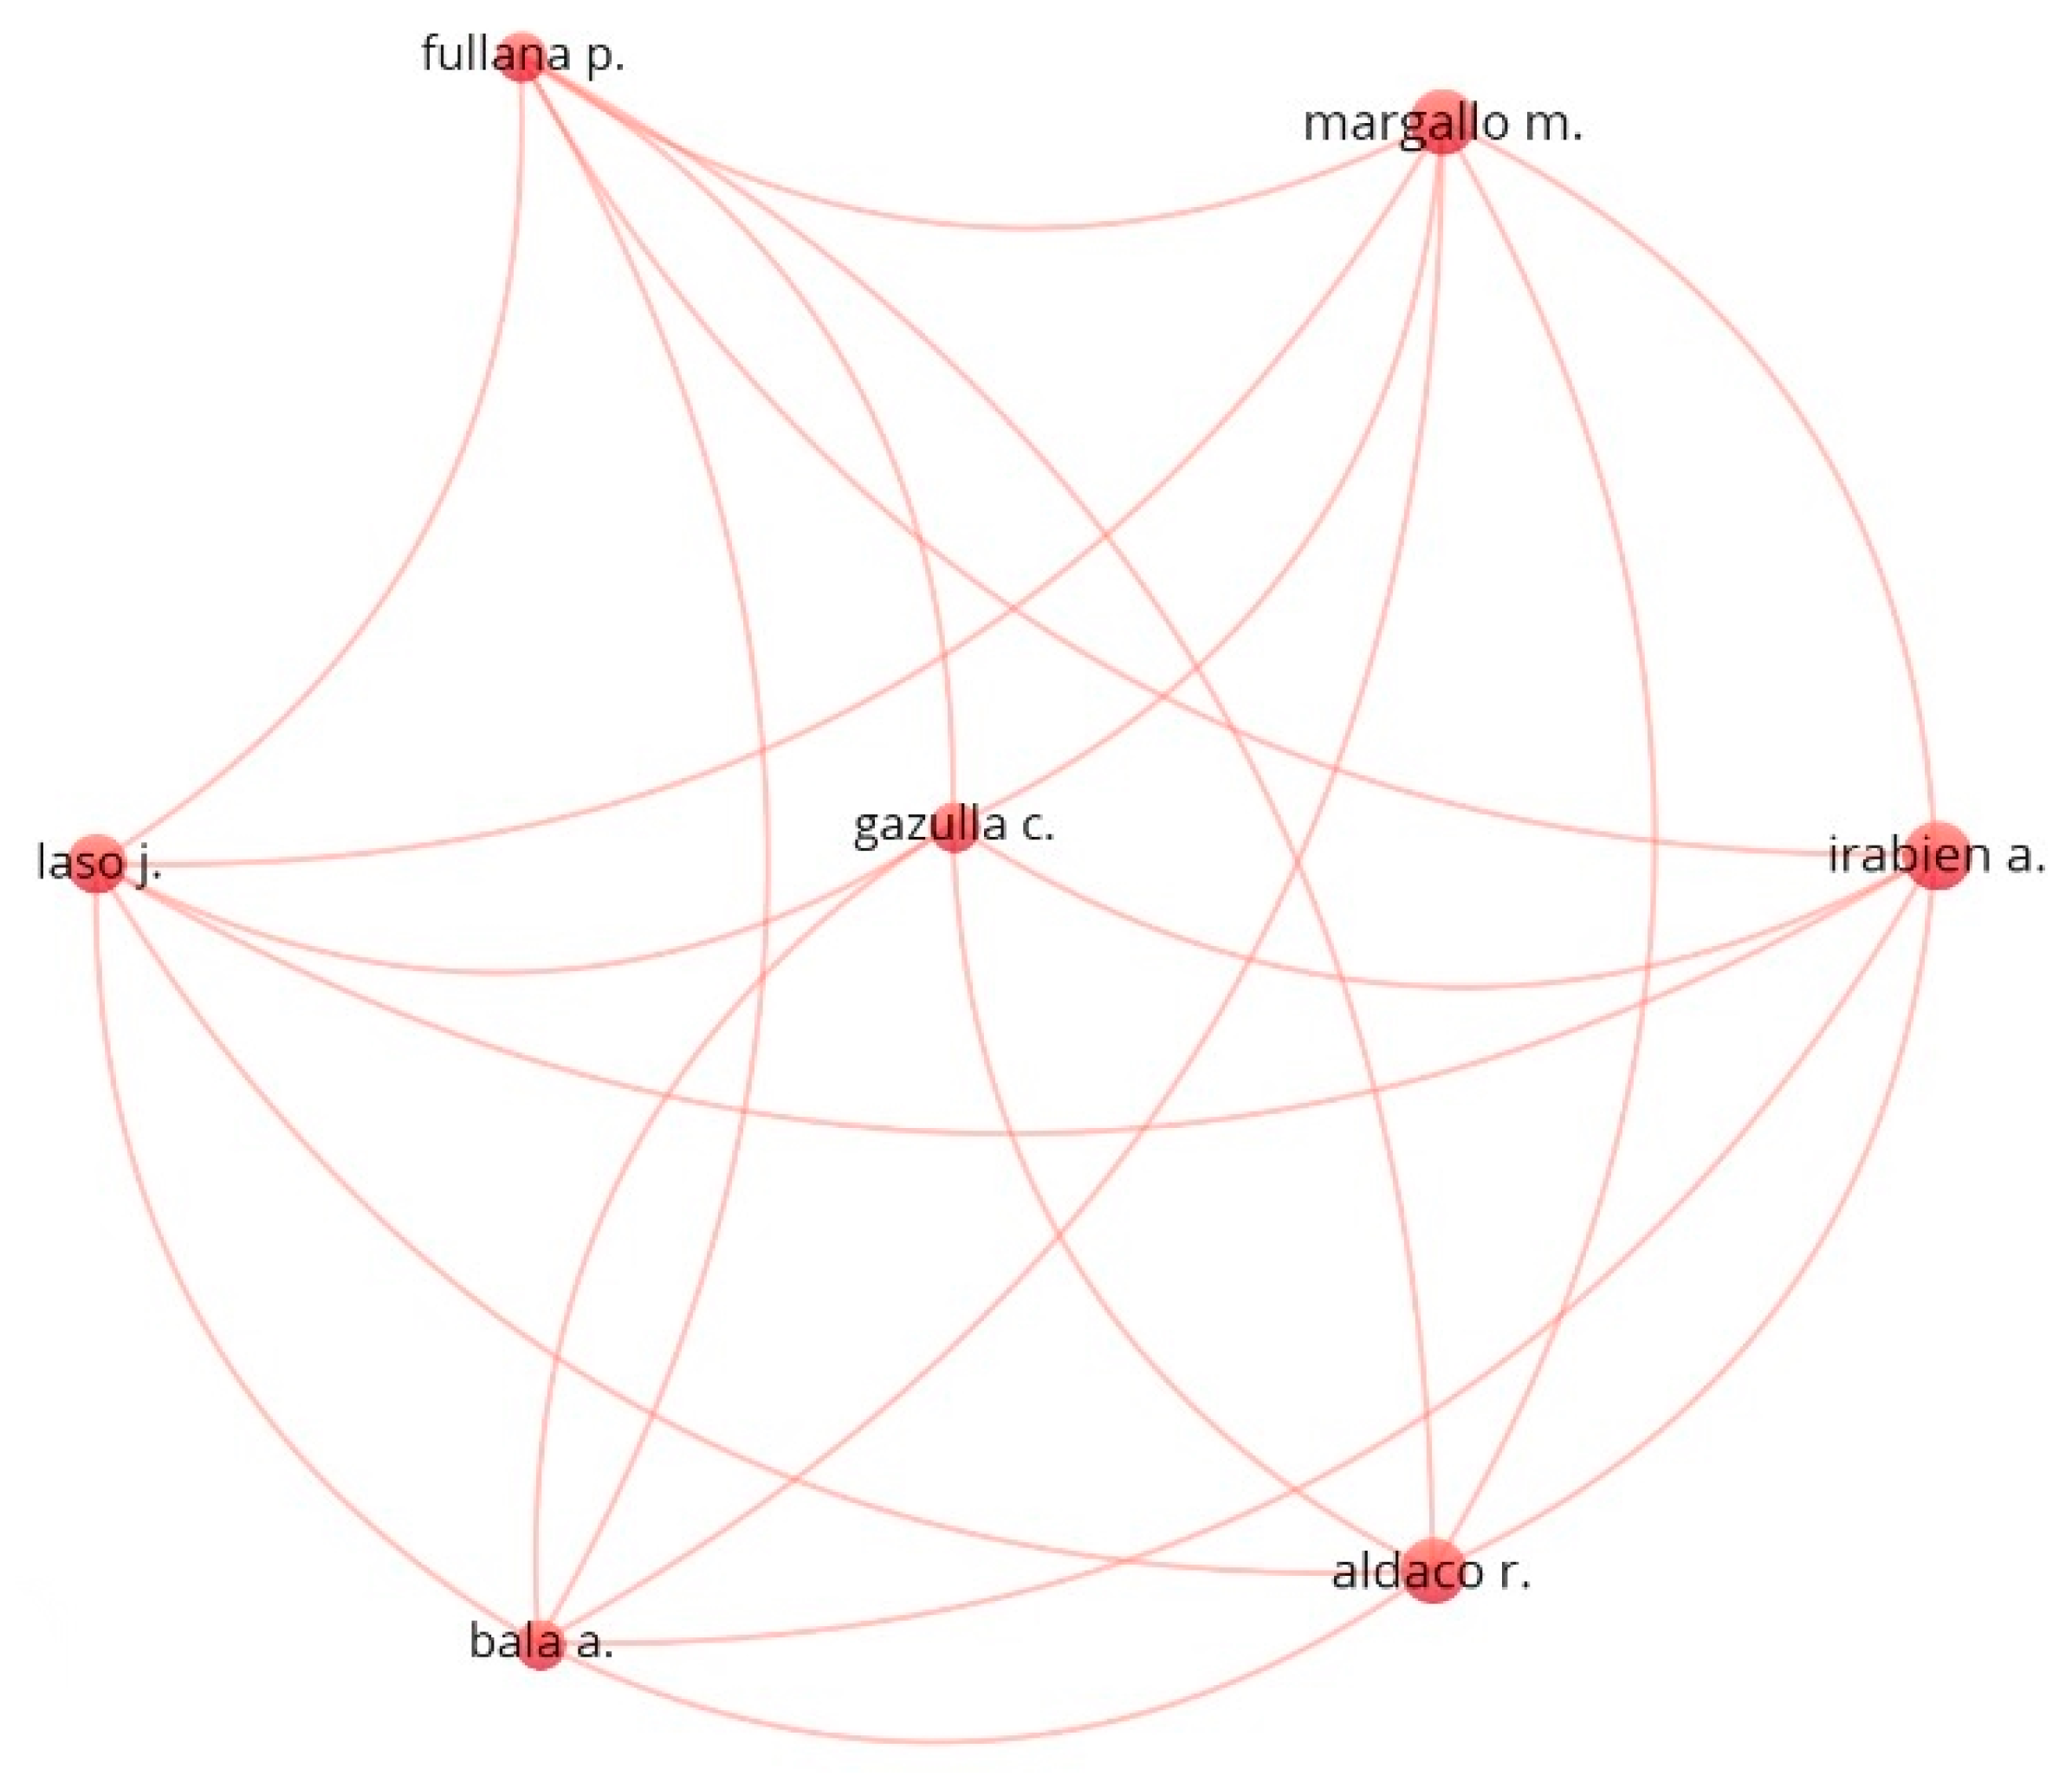
Figure 4, made with the VOS viewer tool, represents the collaboration network between the main authors. As can be seen, cooperation is scarce, since of the 150 main authors, only seven have collaborated for scientific production on this subject [103,104,105]. These authors share the same country of origin (Spain): Irabien, Aldaco, Margallo, and Laso from the University of Cantabria; Fullana and Bala, from the Universitat Pompeu Fabra Barcelona; and Gazulla, from Lavola Cosostenibilidad Rbla.

4.5. Identification of the Main Research Institutions

The 10 research institutions with the highest scientific production in this research field are presented in Table 5. All the institutions are of European origin, including Italy (1), The Netherlands (1), Sweden (3), Finland (1), and Denmark (2), except for two Chinese institutions.
The Chinese Academy of Sciences [106] is the institution that heads Table 5. This Chinese institution has the highest number of articles (40), total citations (1434), and average citations (35.85). Furthermore, it is the institution, together with Delft University of Technology, that has the highest h-index (16). On the other hand, the collaboration rate of this institution is 50%, so 20 articles have been published with the collaboration of other countries. The high value of total citations in articles with international collaboration (61.85) stands out, compared to the citations received in national articles (9.85).
The second position is occupied by Università degli Studi di Catania (Sicily, Italy), due to its high number of articles (29). This Italian institution has eight citations, an average of 0.28 citations per article, and an h-index of 2. In addition, it has a collaboration index of 0.07 and does not have any citations in international articles.
The third position is held by Delft University of Technology (Delft, The Netherlands). This institution from The Netherlands stands out for its high value in all of the characteristics related to dating. Furthermore, it is the institution with the second highest number of total citations (923) and average citations (35.50). It has an average of 39.67 citations in articles with international co-authorship and 29.82 in national articles.
On the other hand, Lunds Universitet and The International Institute for Industrial Environmental Economics are the two institutions with the highest index of international collaboration, displaying values of 77.8% and 81.3%, respectively. Finally, of the 10 institutions analyzed, six have the highest average number of citations in articles that have been prepared nationally.

4.6. Characteristics of the Most Relevant Countries

Table 6 shows the 10 most prolific countries in relation to published articles. The main characteristics that define the productivity of these countries are presented, such as the articles published, the total citations, the h-index, and the period of time in which the articles have been published. The scientific production of the 10 countries accumulates a total of 1209 articles and represents 88.5% of the total sample analyzed.
China is the country that tops the ranking, with a total of 258 articles. This Asian country has a total of 4073 citations, an average of 15.79 citations, and an h-index of 32. It is the country that carried out the most research in the first period analyzed (2004–2007), with a total of 16 articles, and stands out for having the articles with the highest number of citations for each period analyzed.
For 2004–2007, with the article “China’s growing CO2 emissions—A race between increasing consumption and efficiency gains” [107], a total of 408 citations were counted. In the second period analyzed (2008–2011), the article “Developing country experience with eco-industrial parks: a case study of the Tianjin Economic-Technological Development Area in China” [108] has 198 citations. In the third period (2012–2015), with the article “A review of the circular economy in China: Moving from rhetoric to implementation” [109], 337 total citations were recorded. Finally, in the period 2016–2019, with the article “A review on circular economy: The expected transition to a balanced interplay of environmental and economic systems” [110], the total number of citations reached 875.
Italy occupies the second position in Table 6. This country, which has 214 articles, stands out for its short research career, since the first article published was in 2014. Despite this, in the last period analyzed, it managed to occupy the first position, with a total of 208 posts.
The United Kingdom is the third most prolific country in this research field, with 168 articles and an average of 16.27 citations. This country has the second highest value in total citations and h-index, with values of 2734 and 27, respectively. Furthermore, in the last period analyzed, it is positioned as the second country with the highest scientific production (156).
On the other hand, The Netherlands, in seventh position, stands out for having the highest average number of citations in Table 6, with a value of 22.36. Finally, France, in last position, is the only country that does not have the most prolific institutions, journals, or authors.
These 10 countries have contributed to scientific production through articles with national and international co-authorship. Therefore, Table 7 shows the main data on collaborations between countries. France has the highest percentage of collaboration, with a value of 68.4%. This country is followed by countries with very similar values: Finland (64.4%), Germany (63.9%), and the United States (60.9%). All of the countries listed in Table 7 have the highest average number of citations in articles that were developed with international collaboration.
China tops the table, with 31 collaborators and a 32% collaboration rate. This country registers the greatest difference between the average number of citations in national articles (8.09) and international articles (31.45). The United States, the United Kingdom, Hong Kong, Australia, and The Netherlands are the main countries that cooperate with China in scientific production.
Italy, in second position, has 32 collaborating countries and a collaboration rate of 33.2%. The main countries with which it shares co-authorship are Spain, Germany, China, The Netherlands, and France.
On the other hand, the country in the table with the largest number of collaborators (43) is the United Kingdom. This country has a 48.8% collaboration rate, and its main collaborators are China, Germany, The Netherlands, Spain, and Australia.
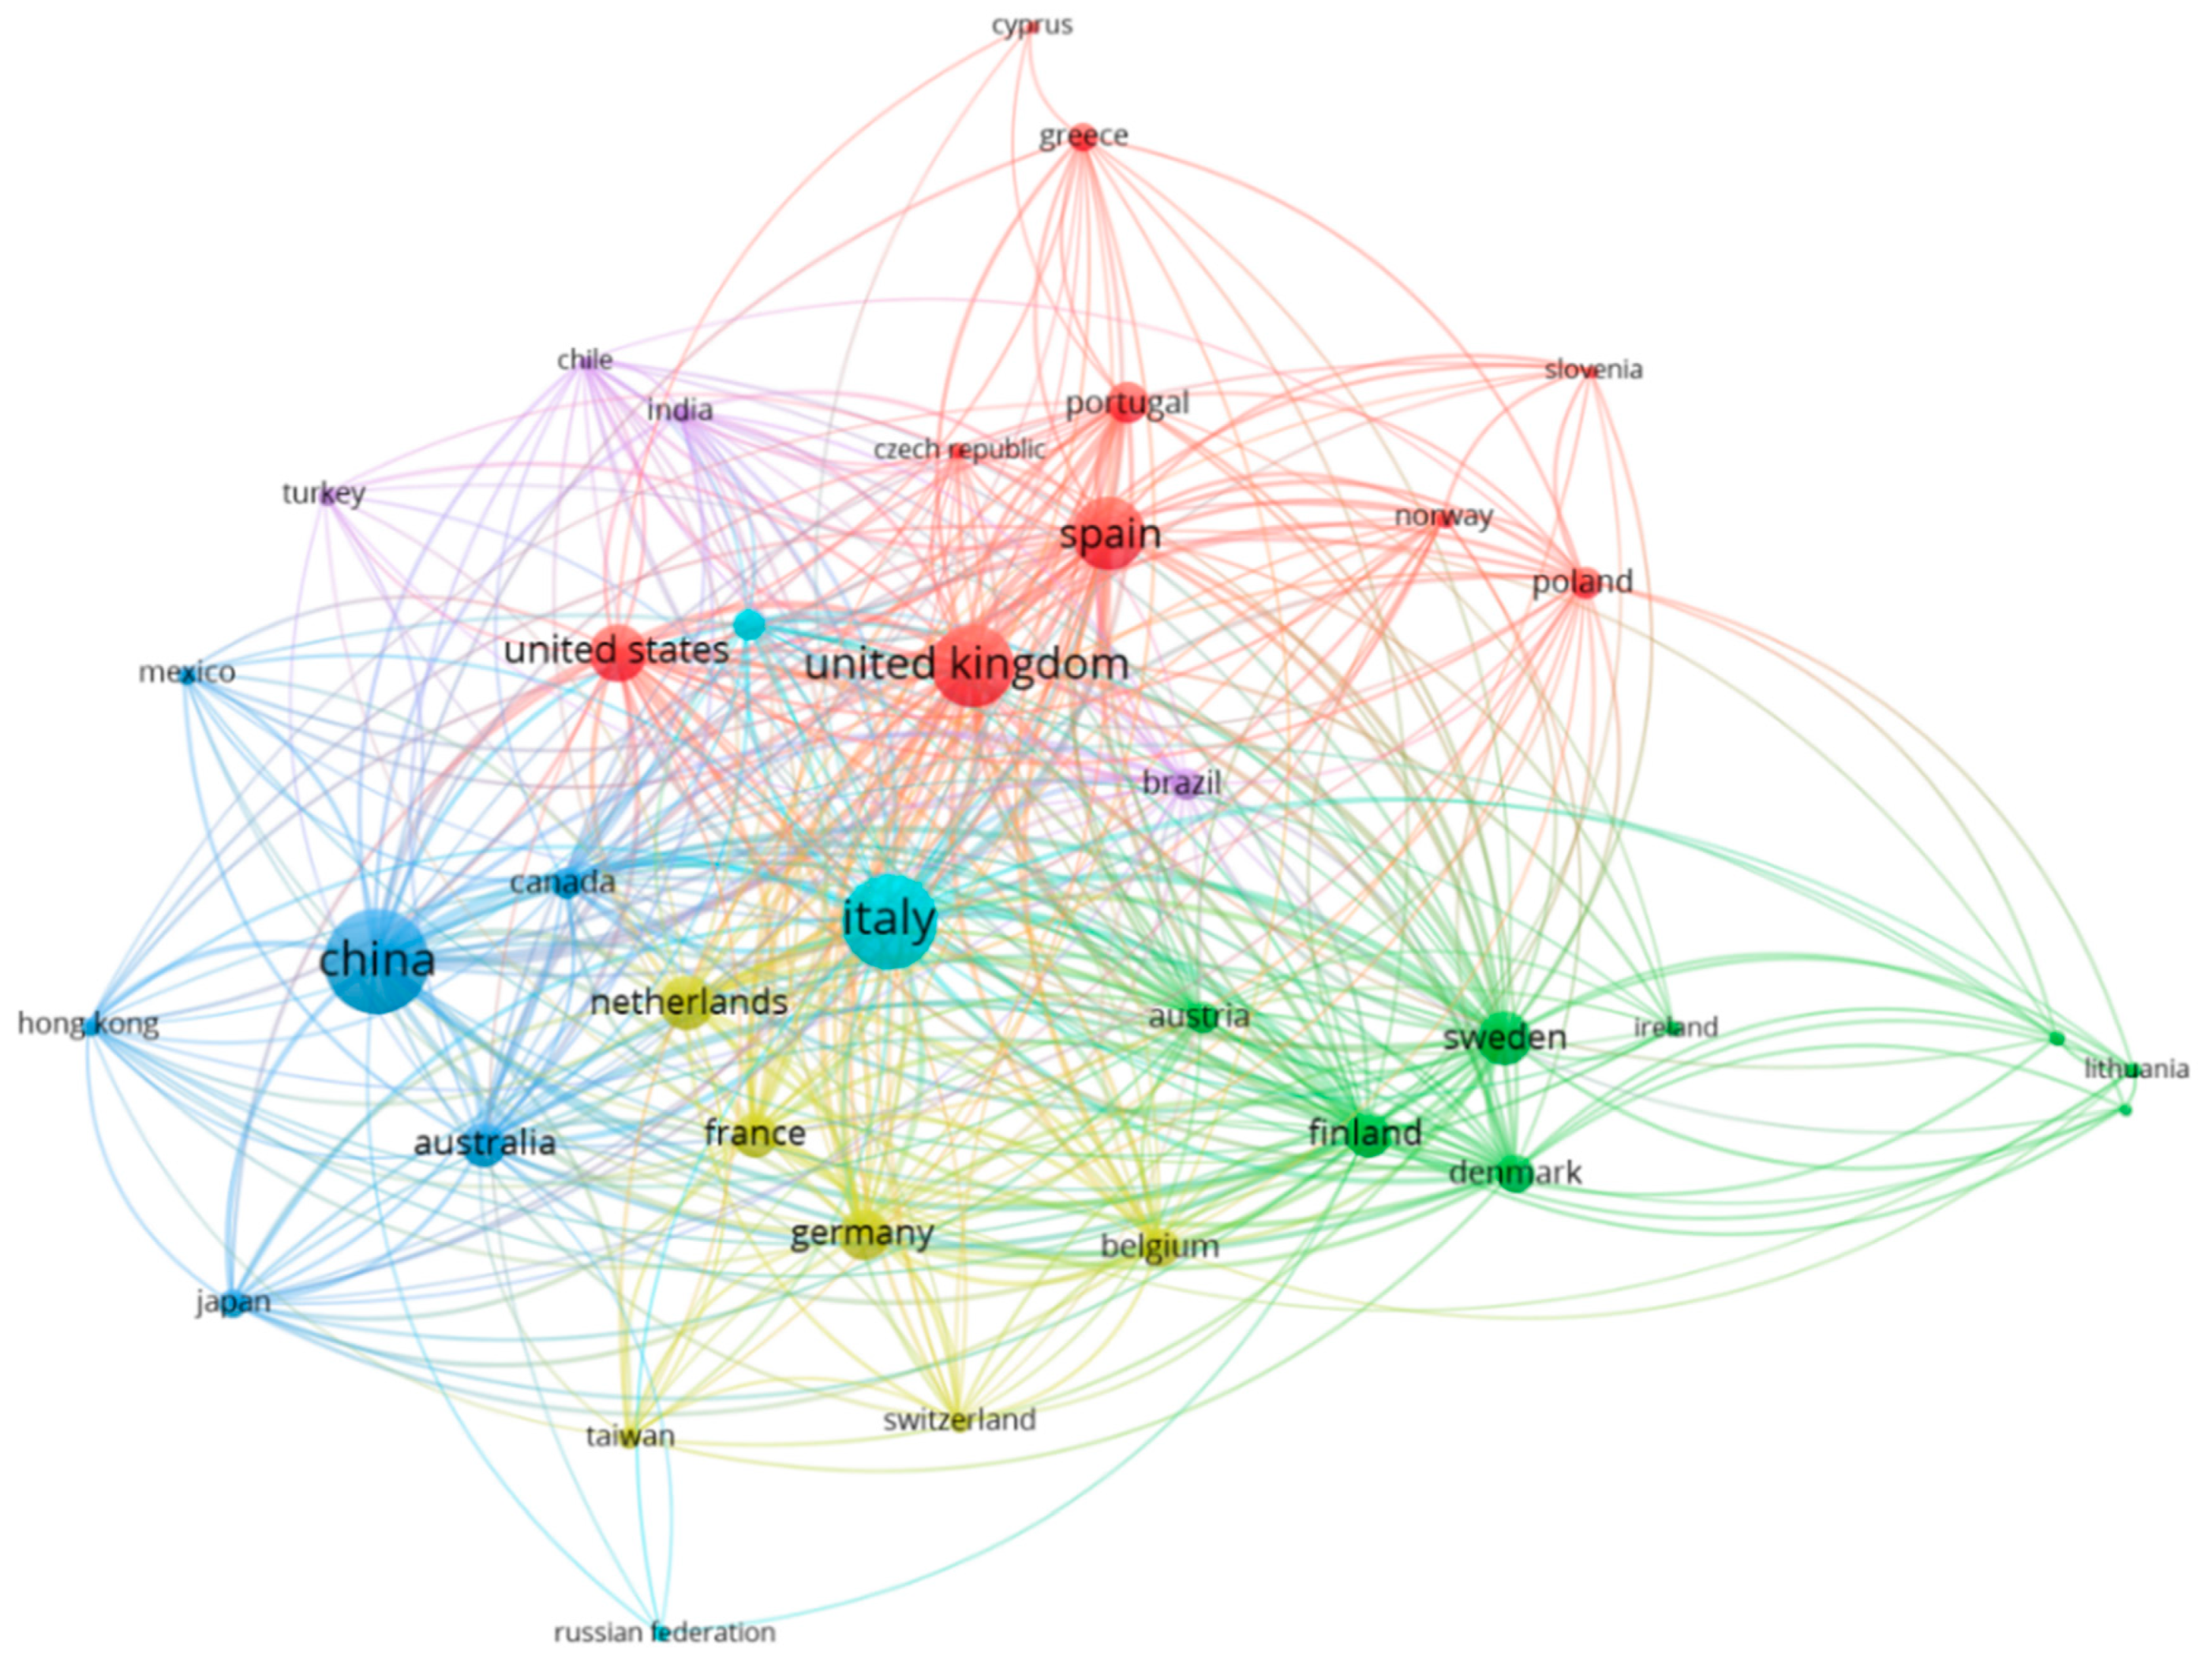
Figure 5 shows the international collaborations between the most prolific countries. The colors of the circles differentiate the different collaboration groups, the size, and the scientific production of each country. The total number of countries shown in the cooperation map based on the co-authorship of their authors is 37, and all of them have a minimum of seven publications on the subject of study. VOS viewer software grouped them into six clusters.
The first cluster (blue) is led by China. The scientific production that this collaboration group represents is 395 articles and it displays a percentage of 28.9% of the total sample analyzed. This cluster includes Canada, Australia, Mexico, Hong Kong, and Japan.
The second cluster (red) is led by the United Kingdom, along with the United States. This group, which is the most numerous, is made up of Cyprus, Portugal, the Czech Republic, Greece, Norway, Poland, Slovenia, and Spain. This group includes 10 countries and 533 articles and represents 39% of the total research activity.
On the other hand, Italy leads the smallest group 3 (cyan) of collaboration. This cluster is made up of Russia and Romania. The three countries exhibit a total of 253 articles, which represents 18.5% of the total sample analyzed.
The fourth cluster (purple) is made up of Brazil, Chile, India, and Turkey. These countries display 68 articles and represent 5% of the total sample.
Sweden, Finland, and Denmark lead the fifth cluster (green). This collaborative group includes Estonia, Ireland, Austria, Lithuania, and Ukraine. Among the eight countries, 257 articles are concentrated and represent 18.8% of the research activity.
Finally, the sixth cluster (yellow) is made up of Belgium, France, Germany, The Netherlands, Switzerland, and Taiwan. The total number of articles published by these six countries is 277, which represents 20.3% of the total scientific production.

4.7. Analysis of Keywords

The sample of 1366 articles contains a total of 8966 keywords. Table 8 shows the 20 most used keywords in this research. These terms express the object of study of the articles, so their analysis allows information about the interests that have been generated throughout this research line to be obtained.
In the first study period (2004–2008), the keywords Circular Economy and Sustainable Development were already used. However, the articles were focused on highlighting the problems derived from climate change, the waste generated, and pollution, among others. For this reason, the need to research processes that would improve the environmental situation of society led to the use of other keywords, such as Environmental Protection, Conservation of Natural Resources, and Ecosystem Management. Hence, in this first period, many of the 20 keywords collected in Table 8 (Decision Making, Life Cycle Assessment (LCA), Environmental Management, etc.) are not considered.
The keyword that leads the ranking is Circular Economy, and this is because the search carried out includes this term. For this reason, most of the research that has been carried out is framed in this field of study. Sustainable Development, in 406 articles, occupies the second position. This term has been considered throughout the analysis time horizon, and its high number of occurrences has placed it in the second position in all periods, except for 2008–2011, during which it occupied the third position. Recycling, the third keyword in the ranking, appears for the first time in the 2008–2011 period, is used in a total of 343 documents, and represents 25.1% of the total sample analyzed. The latest keyword was Waste Disposal, since it was used for the first time in the third period analyzed (2012–2015).
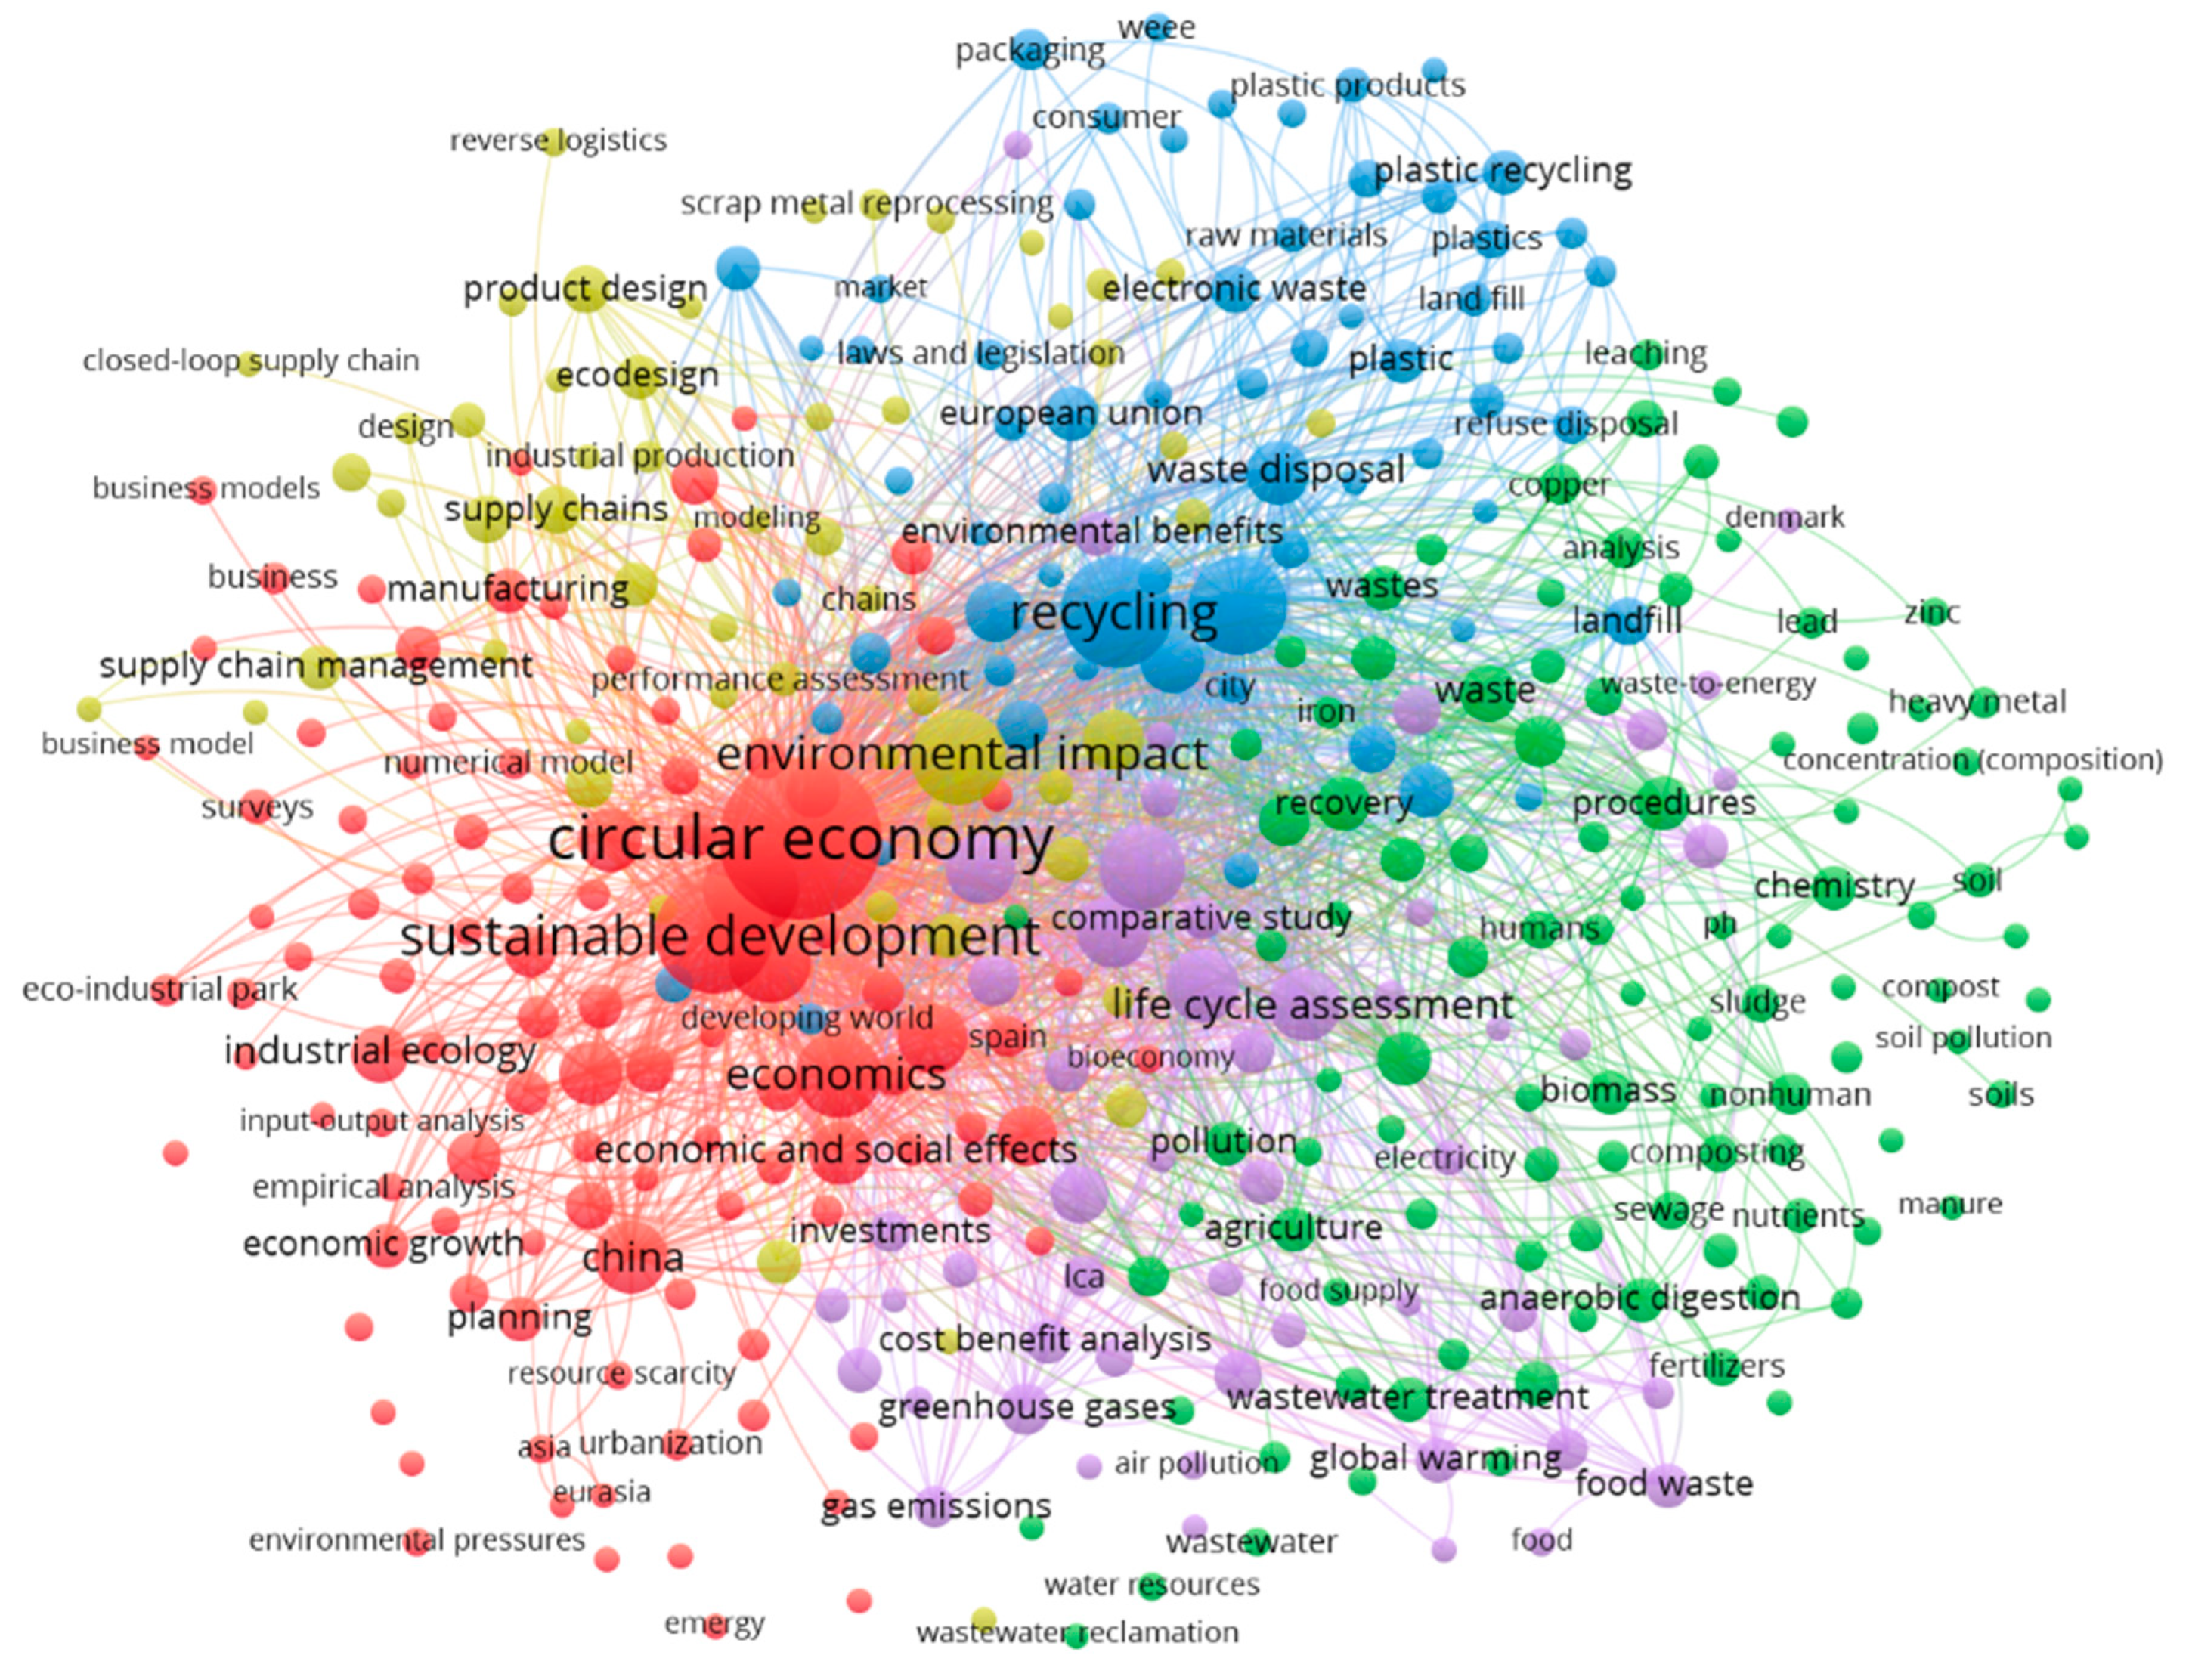
Figure 6 represents the main keywords used throughout the period studied (2004–2019). Five clusters that refer to different research lines are recognized.
The first cluster (red) is represented by the concepts of Circular Economy, Sustainable Development, and Economics. This line examines the efficient management of energy resources and economic conditions. Some of the most common terms in this group are Energy Utilization, Energy Efficiency, Eco-efficiency, Economic Analysis, and Economic and Social Effects. In addition, among the keywords, China, the United Kingdom, and Spain were spotted.
The second cluster (green) is directly related to pollution and agricultural activity. Among the terms used are Agricultural Waste, Biomass, Soil Pollution, and Water Treatment. In this case, the cluster is associated with Europe.
The third cluster (blue) is directed by the term Recycling, and brings together, among others, the concepts of Electronic Waste, Waste Disposal, Waste Management, Municipal Solid Waste, and Plastic, so it refers to the management of waste that is generated. Furthermore, it is associated with the European Union, Italy, and The Netherlands.
The fourth cluster (yellow) is led by the term Environmental Impact. This research line uses the terms Eco-design, Product Design, Remanufacturing, Reuse, etc., so it focuses on the research line that studies how to improve the environmental impact through respectful products.
Finally, the fifth cluster (purple) focuses on the life cycle and climate change. In this research line, Gas Emissions, Carbon Footprint, Carbon Dioxide, Emission Control, and Greenhouse Effect are the most widely used terms. The only country associated with this research line is Denmark.
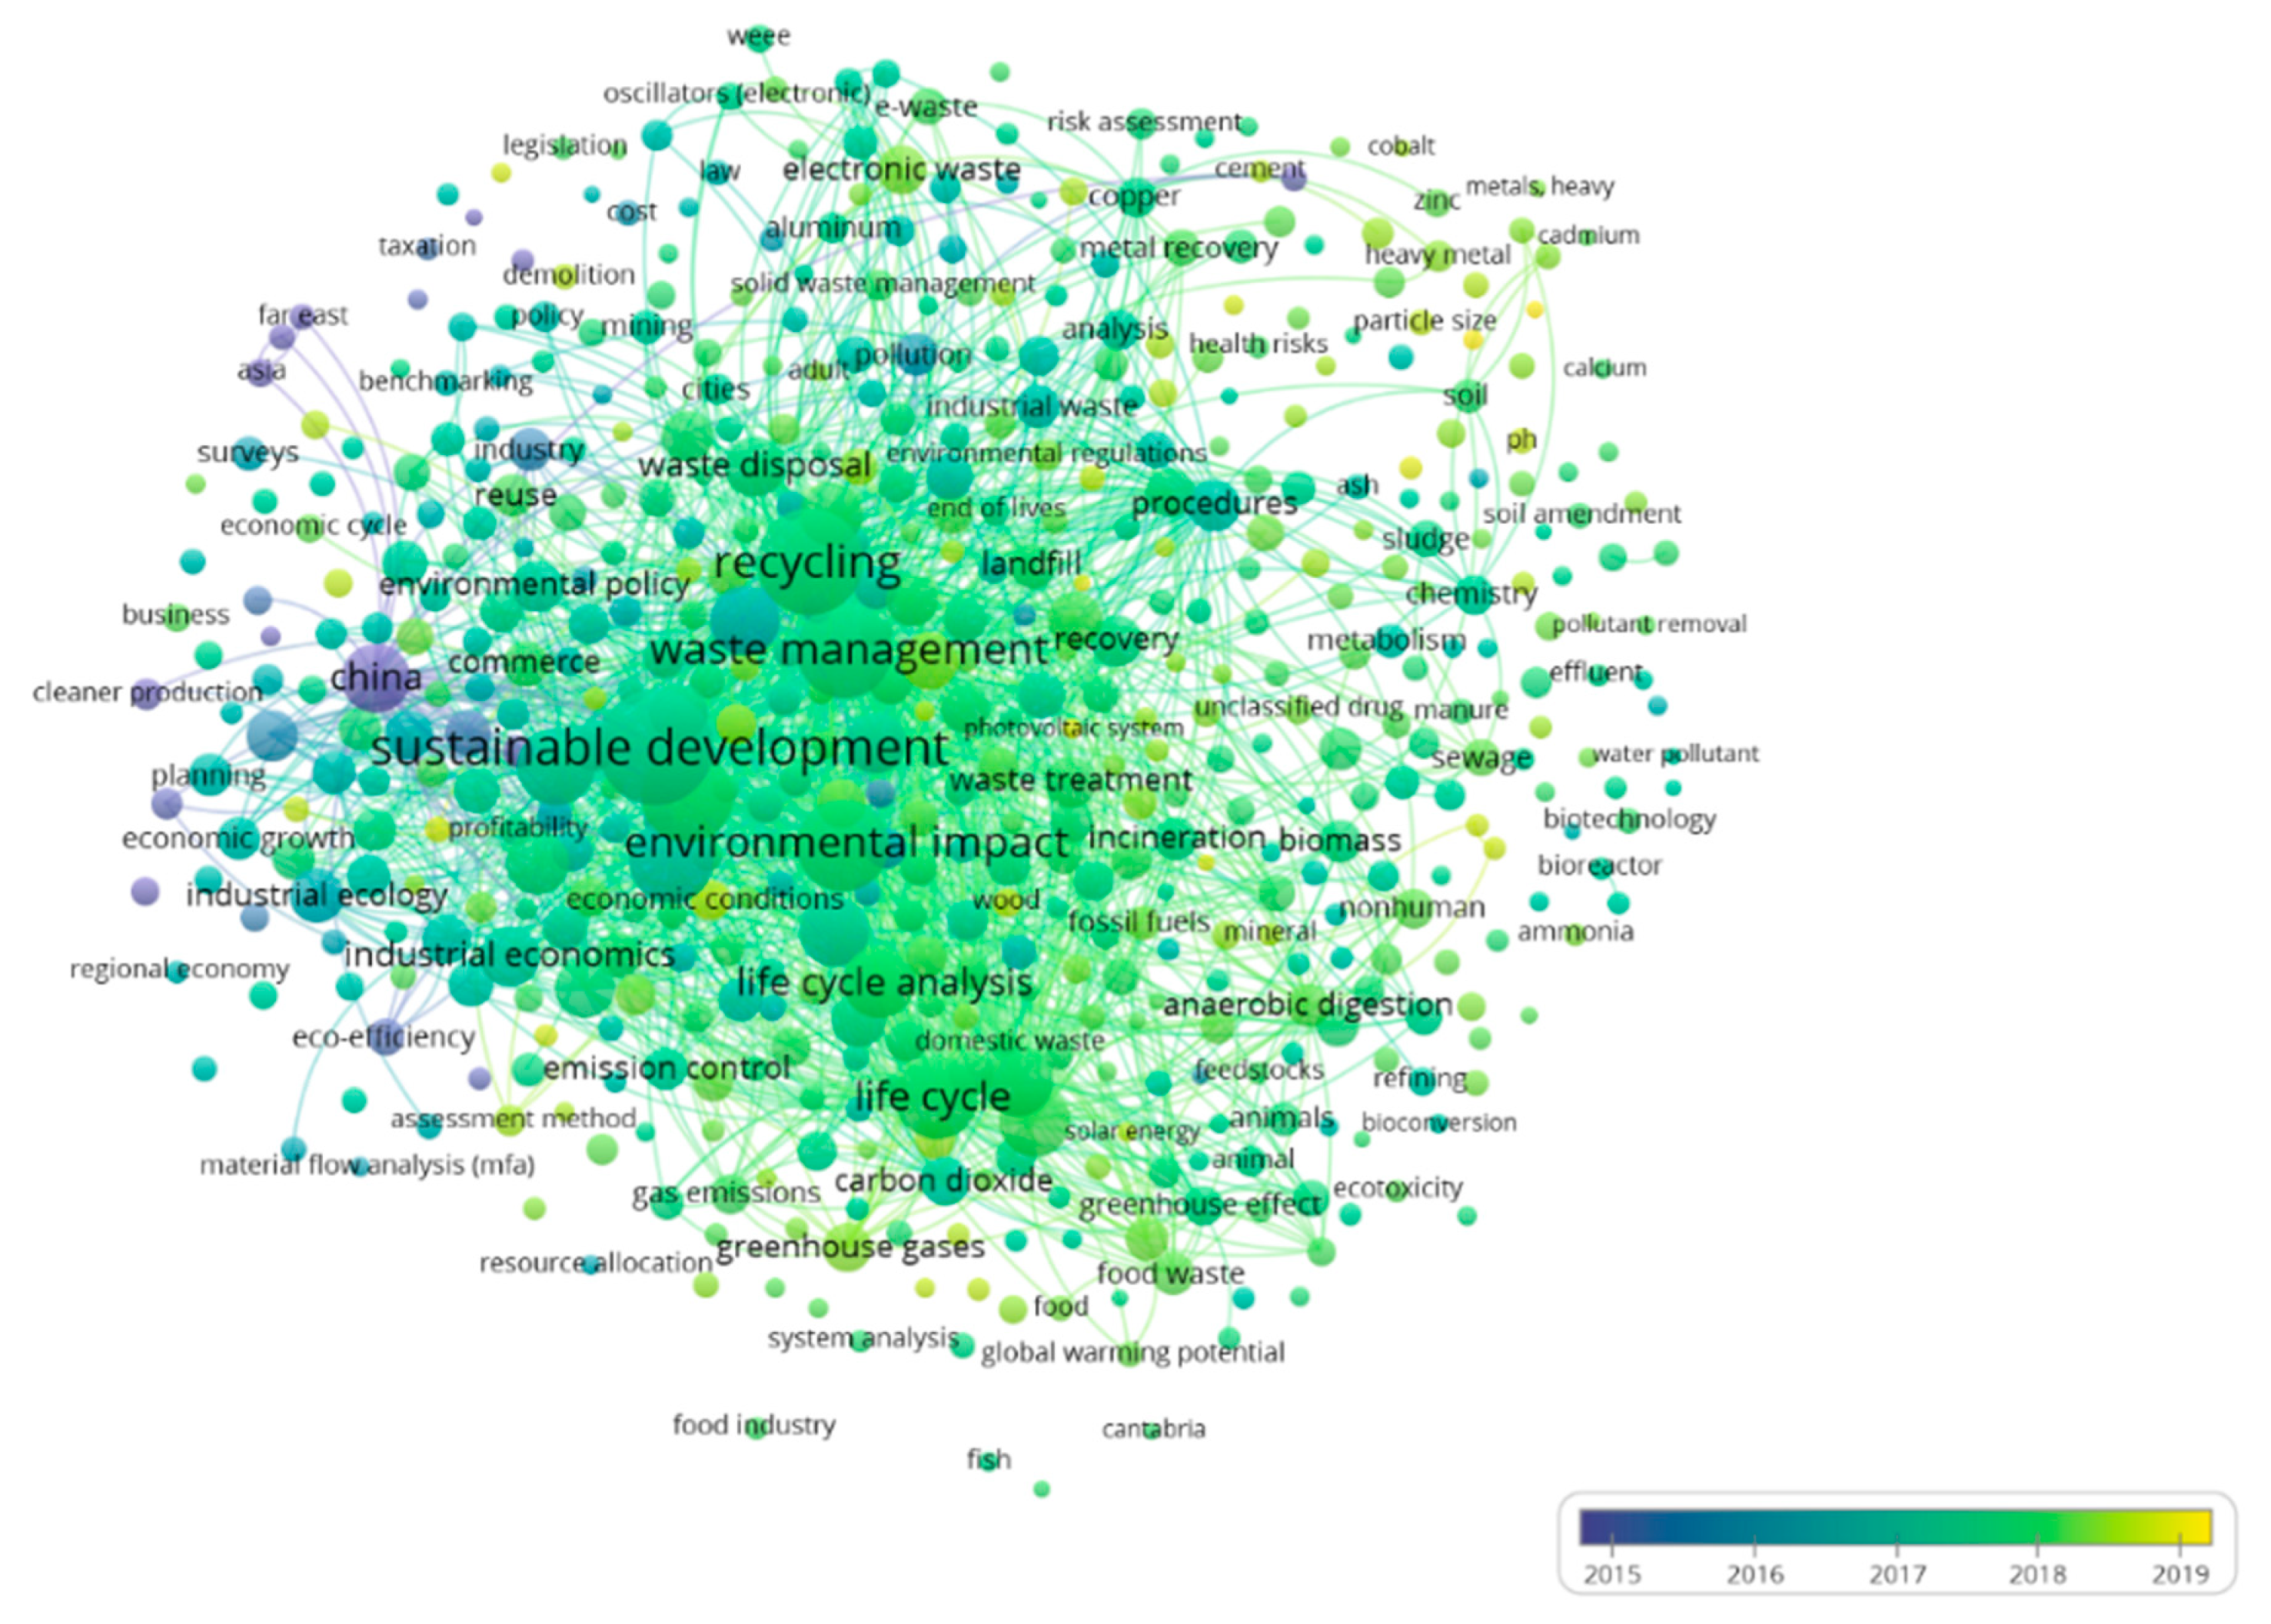
To obtain the first concepts used in this research field and analyze the maturity in the period 2004–2019, Figure 7 is presented. Mainly, three periods can be highlighted: 2004–2015, 2016–2018, and 2019. From 2004 to 2015, the research was focused on planning a sustainable economy and clean production that respects natural resources [111,112]. In this period, constant reference was made to the countries of the world and the possibility of improving the situation through efficient regional management.
In the 2016–2018 period, the articles focus on correct waste management, recycling, or sustainable development. In other words, the contributions focus on responding to environmental needs [113,114,115].
Finally, in 2019, which is the last year considered in the study, new areas are introduced, such as the economic conditions for the implementation of more sustainable processes or social responsibility, which are decisive variables for improving the current and future situation [116,117].

4.8. Analysis of the CE Indicators and Research Lines: Generation of CE Policies

Table 9 indicates the thematic areas and indicators used in the European Union to monitor progress towards a CE and its relationship with the clusters or research lines detected in Figure 6. New indicators are currently being developed, mainly related to green public procurement and food waste. All these indicators have been developed by Eurostat; the Joint Research Center (JRC); the General Directorate for the Internal Market, Industry, Entrepreneurship, and SMEs (DG GROW); and the European Patent Office [118]. The set of indicators that can be extrapolated to the rest of the world’s regions has been considered, in order to identify how each of the five research lines detected globally is linked to these indicators.
The monitoring of the thematic area “A. Production and consumption” includes four indicators related to the self-sufficiency of raw materials for production by region, green public procurement (financial indicator), waste generation (consumption indicator), and food waste. This phase includes the reduction of waste by both households and economic sectors. This circumstance must lead to a self-sufficiency of raw materials selected for production in the long term.
Increased recycling is essential for transformation to the CE. Hence, the “B. Waste management” thematic area is made up of indicators related to recycling rates and specific waste flows, such as packaging or biologicals. This area studies the waste that is recycled and returned to the economic cycle to continue adding value.
In relation to the third thematic area, “C. Secondary raw materials”, it includes indicators on the contribution of recycled materials to the demand for raw materials, and trade in recyclable raw materials between countries. In this sense, to close the cycle, the material and products must be reintroduced into the economy. In this way, these recycled materials replace the extracted natural resources, reduce the environmental footprint of production and consumption, and increase the security of the future supply of raw materials.
Finally, the thematic area “D. Competitiveness and innovation” groups together indicators that measure private investment, employment, and gross value added, in addition to patents related to recycling and secondary raw materials. In other words, this area understands that the CE contributes to employability and growth.
The literature review has allowed us to identify which indicator is monitored by each cluster. Thereby, cluster 1, which is dedicated to the analysis of the efficient management of energy resources and economic conditions, is measured by all of the indicators [119].
Likewise, cluster 2, which examines pollution and agricultural activity, is monitored by indicators A (1, 3, and 4), B (2 and 5), and C (1) [120].
On the other hand, cluster 3, which studies how waste is managed, is measured by indicators A (1), B (1 to 5), C (1 and 3), and D (1 and 2) [121].
As for cluster 4, which analyses how to improve the environmental impact through respectful products, it is monitored by indicators A (2, 3, and 4), B (1, 3, and 6), C (2), and D (1 and 2) [122].
Finally, cluster 5, which studies the life cycle and climate change, is measured by indicators A (1), B (1 to 6), and C (2 and 3) [123].
Likewise, Figure 7, which shows the evolution of keywords, that is, of research lines, is related to the indicators in Table 9. Hence, the period 2004–2015, dedicated to planning a sustainable economy and a clean production that respects natural resources, was monitored by the indicators of thematic area A (production and consumption) [124].
The second period, 2016–2018, added the monitoring of indicators of thematic areas B (waste management) and C (secondary raw materials), which begins with the initiative promoted by the United Nations of the SDGs and which is engaged in waste management, recycling, and sustainable development [125].
Finally, in 2019, the monitoring of indicators in thematic area D (competitiveness and innovation) is added, since in this period, the research tends to analyze the economic conditions required for the implementation of more sustainable processes or social responsibility [126].
For this, CE policies should contribute to making economies less dependent and vulnerable, and more competitive, thus contributing to the SDGs. It is necessary to work on (1) reducing the national consumption of materials in relation to GDP; (2) decreasing the generation of waste; (3) reducing the generation of food waste in any food chain; (4) increasing reuse and preparing for reuse; (5) improving efficiency in the use of water; (6) reducing the emission of greenhouse gases in the waste sector; (7) and promoting specific training in CE areas, adapting the skills and abilities of workers to new market demands, in addition to adapting the corporate culture to the principles of corporate social responsibility.
In other words, CE policies that include economic policy, taxation, employment, R&D, consumption, industrial policy, water, agriculture, and development in rural areas should be implemented. On the other hand, these actions must allow companies to be efficient without incurring excessive burdens, improving their productivity, ability to contract, research, and opportunities for internationalization.
Likewise, the study has identified, in the CE strategy of a transversal nature, a set of key sectors in which to apply these CE policies, such as the agriculture, construction, industrial, textile, and fishing and forestry industries. In short, the CE represents an opportunity to develop an industry aimed at recycling and reducing the extraction of materials and raw materials.
These actions are linked to the main international initiatives in the environmental field, such as the 2030 Agenda for sustainable development [127], the Paris Agreement on climate change [128], the postulates of the European Green Pact [129], and the Action Plans of the European Commission, on this matter [130,131].
Although the CE is global and should be applied to all economic sectors, the importance of the environmental sector is key, due to its transversality and ability to influence other sectors as a catalyst for economic activity.
Likewise, it is necessary to implement policies in the agriculture sector, which accounts for almost 70% of global water consumption [132]. It is estimated that in 2050, it will be necessary to increase the demand for this resource by more than 50%, in order to maintain the food needs of the world’s growing population [133,134]. Agricultural water needs could decrease by avoiding transportation losses, applying precision irrigation techniques, and reducing food waste, as CE actions. Drinking water is a limited resource that should be optimized for use. Governments must respond to this growing demand, for example, by implementing inexorable regulatory requirements in the food chain.
The CE must still overcome much reluctance, problems, and barriers of different kinds to become a widely adopted system. Some of the obstacles to overcome are (i) political and regulatory barriers: A lack of support and encouragement from governments through the possibility of financing, training, effective tax policies, etc.; (ii) cultural acceptance barriers: The lack of environmental awareness among suppliers and customers is a discouraging factor for rolling out the circular economy; (iii) access to finance and economic barriers: The cost of new green innovation and business models is one of the main barriers to adopting sustainability practices for small and medium-sized enterprises (SMEs); and (iv) technological and infrastructure barriers: The lack of competence, knowledge, and technical skills is another cause of the slow development and expansion of the CE [15,58,72,132].

5. Conclusions

The objective of this study was to analyze the research trends on CE policies on the environment and growth from the perspective of sustainable growth at a global level during the 2004–2019 period. For this, a bibliometric analysis of 1366 articles obtained from the Elsevier Scopus database was conducted. The main agents that contribute to the research theme have been identified, including the authors, institutions, countries, and journals, in addition to the subject areas that the articles are associated with.
The number of scientific articles during the period 2004–2019 increased, especially in the last four years, when 1202 articles were published, representing 88% of the total contributions on this research topic, linked to the appearance of the SDGs for the 2030 Agenda in 2015. Likewise, the main subject area has been Environmental Science, since it groups 32% of the articles, followed by Energy with 14% and Engineering with 13%. Moreover, the most productive journals on the research topic have been the Journal of Cleaner Production and Sustainability, with 178 and 104 articles published, respectively. Furthermore, 65% of the journals are positioned in the first quartile (Q1) of Scopus.
On other hand, the Chinese researcher Geng, Y., from Tongji University, is the author with the most articles published (21), the most citations (1285), the best average number of citations per article (61.19), and the highest h-index (16). The most prolific institution in this area of research is the Chinese Academy of Science, with 40 published articles, 1434 citations, and an average of 35.85 citations per article. As for the main countries that have made an effort in this research field, in order of importance, they are China, Italy, and the United Kingdom. In addition, China is the country with the most collaborations in scientific production on this research topic, with 31 collaborators and a 32% collaboration rate.
Five research lines developed from 2004 to 2019 have been identified, which mainly study the following: (1) The efficient management of energy resources and the economic factors that make the CE model possible; (2) environmental pollution and agricultural activity (as a fundamental basis for self-sufficient development and the wealth of regions); (3) waste management to avoid a negative environmental impact; (4) improvement of the environmental impact through ecological products; and (5) the product life cycle and the consequences of climate change.
Likewise, it has been detected that the implementation of CE policies that include economic policy, taxes, employment, R&D, consumption, industrial policy, water, agriculture, and development in rural areas will contribute to making economies less dependent and unprotected, and more competitive, thus contributing to the SDGs.
This study has presented an analysis of the scientific production and the main actors that stimulated the investigation of policies of the circular economy and sustainable growth, during the period 2004–2019, as well as the identification of lines of investigation and their transformation. The evolution in this field of research has been identified from the morphology of the groups of authors, institutions, countries, and keywords, as well as the intensity of the relationships within them. The results obtained are complementary to the knowledge on the circular economy and sustainable growth and can allow the relationship between science and technology to be established and inform the decision-making process.
This work has some limitations, which could be the basis for future research. Among these, the applied bibliometric analysis is a quantitative one, so this methodology could be extended with other quantitative or qualitative tools, in order to look for a different panorama of this research. Furthermore, this study only focuses on articles published in scientific journals, so future research should include other types of documents, in order to analyze the impact it has on the results. Moreover, in future bibliometric analyses, different areas of this discipline could be researched.
The study has shown that scientific activity on CE policies on the environment has captured the interest of the scientific and academic community, with a general interest in the global dissemination of the results of the articles, leading to technical progress.
Lastly, it is necessary to indicate that the solid social and economic motives that underlie the principles of the CE require that the debate be raised on a crucial aspect that, taking into account the reality of the current world scenario, acquires special relevance, such as defining the speed at which the transition to new paradigms, business models, and attitudes of social behavior should develop.
In turn, this reality requires defining not only the economic cost of said transition, but also its social cost. The cost of the transition may include investments in assets and new material and digital infrastructures, as well as in research, specialized training, assistance to promote the market penetration of new products, and transitional support to affected sectors.
Training and awareness are key factors in any process of change, and in the previous points, you can see two main areas in which such training is key—culture, and technology and infrastructure.
In both, with proper education, awareness, and training, people can help generate a change in the way of thinking of society and also train managers, technicians, and others to be aware of the opportunities, benefits, and advantages that the CE provides to both businesses and the sustainability of the planet. Clear changes in these two areas will surely bring about others at a political and legislative level, as well as those of economic powers, so that the circle will close and the CE will start to roll with force.

Author Contributions

Conceptualization, E.A.-S. and L.J.B.-U.; Data curation, E.A.-S., A.B.d.l.F., M.-D.G.-Z. and L.J.B.-U.; Formal analysis, E.A.-S., A.B.d.l.F., M.-D.G.-Z. and L.J.B.-U.; Funding acquisition, L.J.B.-U.; Investigation, E.A.-S., A.B.d.l.F., M.-D.G.-Z. and L.J.B.-U.; Methodology, E.A.-S., A.B.d.l.F., M.-D.G.-Z. and L.J.B.-U.; Project administration, E.A.-S. and L.J.B.-U.; Resources, E.A.-S., A.B.d.l.F., M.-D.G.-Z. and L.J.B.-U.; Software, E.A.-S., A.B.d.l.F., M.-D.G.-Z. and L.J.B.-U.; Supervision, E.A.-S., A.B.d.l.F., M.-D.G.-Z. and L.J.B.-U.; Validation, E.A.-S. and L.J.B.-U.; Visualization, E.A.-S., A.B.-d., M.-D.G.-Z. and L.J.B.-U.; Writing—original draft, E.A.-S., A.B.d.l.F., M.-D.G.-Z. and L.J.B.-U.; Writing—review and editing, E.A.-S., A.B.d.l.F. and M.-D.G.-Z. All authors have read and agreed to the published version of the manuscript.

Funding

This research received no external funding.

Conflicts of Interest

The authors declare no conflict of interest.

References

  1. Dolinsky, M.; Maier, S. Market-based approach in shift from linear economy towards circular economy supported by game theory analysis. Creat. Knowl. Soc. 2015, 5, 1–10. [Google Scholar] [CrossRef]
  2. Sørensen, P.B. From the linear economy to the circular economy: A basic model. FinanzArchiv 2018, 74, 71. [Google Scholar] [CrossRef]
  3. Stahel, W.R. The circular economy. Nature 2016, 531, 435–438. [Google Scholar] [CrossRef] [PubMed] [Green Version]
  4. Velte, C.J.; Scheller, K.; Steinhilper, R. Circular economy through objectives—Development of a proceeding to understand and shape a circular economy using value-focused thinking. Procedia CIRP 2018, 69, 775–780. [Google Scholar] [CrossRef]
  5. Sariatli, F. Linear economy versus circular economy: A comparative and analyzer study for optimization of economy for sustainability. Visegr. J. Bioeconomy Sustain. Dev. 2017, 6, 31–34. [Google Scholar] [CrossRef] [Green Version]
  6. Goulielmos, A.M. Linear and nonlinear strategic management: With applications to shipping. Mod. Econ. 2018, 9, 97–124. [Google Scholar] [CrossRef] [Green Version]
  7. Blomsma, F.; Brennan, G. The emergence of circular economy: A new framing around prolonging resource productivity. J. Ind. Ecol. 2017, 21, 603–614. [Google Scholar] [CrossRef]
  8. Zwiers, J.; Jaeger-Erben, M.; Hofmann, F. Circular literacy. A knowledge-based approach to the circular economy. Cult. Organ. 2020, 26, 121–141. [Google Scholar] [CrossRef]
  9. Molina-Moreno, V.; Leyva-Díaz, J.; Sánchez-Molina, J.; Peña-García, A. Proposal to foster sustainability through circular economy-based engineering: A profitable chain from waste management to tunnel lighting. Sustainability 2017, 9, 2229. [Google Scholar] [CrossRef] [Green Version]
  10. Geisendorf, S.; Pietrulla, F. The circular economy and circular economic concepts-a literature analysis and redefinition. Thunderbird Int. Bus. Rev. 2017, 60, 771–782. [Google Scholar] [CrossRef]
  11. Hazen, B.T.; Mollenkopf, D.A.; Wang, Y. Remanufacturing for the circular economy: An examination of consumer switching behavior. Bus. Strategy Environ. 2016, 26, 451–464. [Google Scholar] [CrossRef]
  12. Fellner, J.; Lederer, J.; Scharff, C.; Laner, D. Present potentials and limitations of a circular economy with respect to primary raw material demand. J. Ind. Ecol. 2015, 21, 494–496. [Google Scholar] [CrossRef]
  13. Gregson, N.; Crang, M.; Fuller, S.; Holmes, H. Interrogating the circular economy: The moral economy of resource recovery in the EU. Econ. Soc. 2015, 44, 218–243. [Google Scholar] [CrossRef]
  14. McDowall, W.; Geng, Y.; Huang, B.; Barteková, E.; Bleischwitz, R.; Türkeli, S.; Doménech, T. Circular economy policies in china and europe. J. Ind. Ecol. 2017, 21, 651–661. [Google Scholar] [CrossRef] [Green Version]
  15. Webster, D. Benefit sanctions, social citizenship and the economy. Local Econ. J. Local Econ. Policy Unit 2019, 34, 316–326. [Google Scholar] [CrossRef] [Green Version]
  16. Fleischmann, K. Design-Led innovation and circular economy practices in regional queensland. Local Econ. J. Local Econ. Policy Unit 2019, 34, 382–402. [Google Scholar] [CrossRef]
  17. Lang, M.; Marsden, T. Rethinking growth: Towards the well-being economy. Local Econ. J. Local Econ. Policy Unit 2018, 33, 496–514. [Google Scholar] [CrossRef]
  18. Thygesen, N. The gift economy and the development of sustainability. Local Econ. J. Local Econ. Policy Unit 2019, 34, 493–509. [Google Scholar] [CrossRef]
  19. Craig, M.P.A. Greening the state for a sustainable political economy. New Political Econ. 2018, 25, 1–4. [Google Scholar] [CrossRef]
  20. Haug, A.A.; Smith, C. Local linear impulse responses for a small open economy. Oxf. Bull. Econ. Stat. 2011, 74, 470–492. [Google Scholar] [CrossRef]
  21. Laumann, F.; Tambo, T. Enterprise architecture for a facilitated transformation from a linear to a circular economy. Sustainability 2018, 10, 3882. [Google Scholar] [CrossRef] [Green Version]
  22. Zvarych, I. Circular economy and globalized waste management. J. Eur. Econ. 2017, 16, 38–53. [Google Scholar] [CrossRef]
  23. Canh, P.N.; Dinh Thanh, S. Exports and the shadow economy: Non-Linear effects. J. Int. Trade Econ. Dev. 2020, 1–26. [Google Scholar] [CrossRef]
  24. Schumann, F.R. Circular economy principles and small island tourism. J. Glob. Tour. Res. 2020, 5, 13–20. [Google Scholar] [CrossRef]
  25. Veszelszki, Á. Like economy: What is the economic value of likes? Soc. Econ. 2018, 40, 417–429. [Google Scholar] [CrossRef]
  26. Wastling, T.; Charnley, F.; Moreno, M. Design for circular behaviour: Considering users in a circular economy. Sustainability 2018, 10, 1743. [Google Scholar] [CrossRef] [Green Version]
  27. Svensson, N.; Funck, E.K. Management control in circular economy. Exploring and theorizing the adaptation of management control to circular business models. J. Clean. Prod. 2019, 233, 390–398. [Google Scholar] [CrossRef]
  28. Agyeman, J. Local environment and the unsustainable development goals. Local Environ. 2020, 25, 336–337. [Google Scholar] [CrossRef] [Green Version]
  29. Chen, C.-W. Improving circular economy business models: Opportunities for business and innovation: A new framework for businesses to create a truly circular economy. Johns. Matthey Technol. Rev. 2020, 64, 48–58. [Google Scholar] [CrossRef]
  30. Pires, A.; Martinho, G. Waste hierarchy index for circular economy in waste management. Waste Manag. 2019, 95, 298–305. [Google Scholar] [CrossRef]
  31. Grubert, E. Relational values in environmental assessment: The social context of environmental impact. Curr. Opin. Environ. Sustain. 2018, 35, 100–107. [Google Scholar] [CrossRef]
  32. Joshi, C.; Seay, J.; Banadda, N. A perspective on a locally managed decentralized circular economy for waste plastic in developing countries. Environ. Prog. Sustain. Energy 2018, 38, 3–11. [Google Scholar] [CrossRef] [Green Version]
  33. Maina, S.; Kachrimanidou, V.; Koutinas, A. A roadmap towards a circular and sustainable bioeconomy through waste valorization. Curr. Opin. Green Sustain. Chem. 2017, 8, 18–23. [Google Scholar] [CrossRef]
  34. Rutkowska, M.; Popławski, Ł. Model of sustainable economy in circular economy. Studia i Prace WNEiZ 2017, 47, 119–128. [Google Scholar] [CrossRef]
  35. Lee, J.; Pedersen, A.B.; Thomsen, M. Are the resource strategies for sustainable development sustainable? Downside of a zero waste society with circular resource flows. Environ. Technol. Innov. 2014, 1-2, 46–54. [Google Scholar] [CrossRef] [Green Version]
  36. Gao, W.-S.; Chen, Y.-Q.; Dong, W. Circular agriculture as an important way to low-carbon economy. Chin. J. Eco-Agric. 2010, 18, 1106–1109. [Google Scholar] [CrossRef]
  37. Ashta, A. Sustainable growth rates: Refining a measure. Strateg. Chang. 2008, 17, 207–214. [Google Scholar] [CrossRef]
  38. Civera, C.; Freeman, R.E. Stakeholder relationships and responsibilities: A new perspective. Symph. Emerg. Issues Manag. 2020, 1, 40. [Google Scholar] [CrossRef] [Green Version]
  39. Freeman, R.E.; Phillips, R.; Sisodia, R. Tensions in stakeholder theory. Bus. Soc. 2018, 59, 213–231. [Google Scholar] [CrossRef]
  40. Ditlev-Simonsen, C.D.; Wenstøp, F. How stakeholders view stakeholders as CSR motivators. Soc. Responsib. J. 2013, 9, 137–147. [Google Scholar] [CrossRef] [Green Version]
  41. Plaza-Úbeda, J.A.; De Burgos Jiménez, J.; Belmonte-Ureña, L.J. Stakeholders, environmental management and performance: An integrated approach. Cuad. Econ. Dir. Empresa 2011, 14, 151–161. [Google Scholar] [CrossRef] [Green Version]
  42. Abad-Segura, E.; Cortés-García, F.J.; Belmonte-Ureña, L.J. The sustainable approach to corporate social responsibility: A global analysis and future trends. Sustainability 2019, 11, 5382. [Google Scholar] [CrossRef] [Green Version]
  43. Ricart, S. Challenges on european irrigation governance: From alternative water resources to key stakeholders’ involvement. J. Ecol. Nat. Resour. 2019, 3, 000161. [Google Scholar] [CrossRef]
  44. Fowler, A.; Biekart, K. Multi-Stakeholder initiatives for sustainable development goals: The importance of interlocutors. Public Adm. Dev. 2017, 37, 81–93. [Google Scholar] [CrossRef] [Green Version]
  45. Le Blanc, D. Towards integration at last? The sustainable development goals as a network of targets. Sustain. Dev. 2015, 23, 176–187. [Google Scholar] [CrossRef]
  46. Rabinovych, M. The law-sustainable development nexus in the agenda 2030 and european consensus for development: Substance, deficiencies and the future. J. Law Soc. Justice Glob. Dev. 2019, 23, 19–36. [Google Scholar] [CrossRef]
  47. Oprea, M. A knowledge modelling framework for intelligent environmental decision support systems and its application to some environmental problems. Environ. Model. Softw. 2018, 110, 72–94. [Google Scholar] [CrossRef]
  48. Lasithiotakis, M.; Zoumboulakis, L.; Soulis, S.; Simitzis, J. A preliminary experimental feasibility case study of energy upgrade of pellets of lignite and plastic waste mixtures. Environ. Qual. Manag. 2019, 29, 155–168. [Google Scholar] [CrossRef]
  49. Belmonte-Ureña, L.J.; Garrido-Cardenas, J.A.; Camacho-Ferre, F. Analysis of world research on grafting in horticultural plants. HortScience 2020, 55, 112–120. [Google Scholar] [CrossRef]
  50. Valera, D.L.; Belmonte-Ureña, L.J.; Molina-Aiz, F.D.; López, A.; Camacho, F. The greenhouses of almería, spain: Technological analysis and profitability. Acta Hortic. 2017, 1170, 219–226. [Google Scholar] [CrossRef]
  51. Reike, D.; Vermeulen, W.J.V.; Witjes, S. The circular economy: New or refurbished as CE 3.0?—Exploring controversies in the conceptualization of the circular economy through a focus on history and resource value retention options. Resour. Conserv. Recycl. 2018, 135, 246–264. [Google Scholar] [CrossRef]
  52. Abad-Segura, E.; Morales, M.E.; Cortés-García, F.J.; Belmonte-Ureña, L.J. Industrial processes management for a sustainable society: Global research analysis. Processes 2020, 8, 631. [Google Scholar] [CrossRef]
  53. Ross, D.E. Use of waste tyres in a circular economy. Waste Manag. Res. 2019, 38, 1–3. [Google Scholar] [CrossRef] [PubMed] [Green Version]
  54. Salguero-Puerta, L.; Leyva-Díaz, J.C.; Cortés-García, F.J.; Molina-Moreno, V. Sustainability indicators concerning waste management for implementation of the circular economy model on the university of lome (Togo) campus. Int. J. Environ. Res. Public Health 2019, 16, 2234. [Google Scholar] [CrossRef] [Green Version]
  55. Zink, T.; Geyer, R. Circular economy rebound. J. Ind. Ecol. 2017, 21, 593–602. [Google Scholar] [CrossRef]
  56. Hu, Y.; He, X.; Poustie, M. Can legislation promote a circular economy? A material flow-based evaluation of the circular degree of the chinese economy. Sustainability 2018, 10, 990. [Google Scholar] [CrossRef] [Green Version]
  57. Bolger, K.; Doyon, A. Circular cities: Exploring local government strategies to facilitate a circular economy. Eur. Plan. Stud. 2019, 27, 2184–2205. [Google Scholar] [CrossRef]
  58. Andrews, D. The circular economy, design thinking and education for sustainability. Local Econ. J. Local Econ. Policy Unit 2015, 30, 305–315. [Google Scholar] [CrossRef]
  59. Beydoun, K.M.; Klankermayer, J. Efficient plastic waste recycling to value-added products by integrated biomass processing. ChemSusChem 2020, 13, 488–492. [Google Scholar] [CrossRef]
  60. Duque-Acevedo, M.; Belmonte-Ureña, L.J.; Plaza-Úbeda, J.A.; Camacho-Ferre, F. The management of agricultural waste biomass in the framework of circular economy and bioeconomy: An opportunity for greenhouse agriculture in southeast Spain. Agronomy 2020, 10, 489. [Google Scholar] [CrossRef] [Green Version]
  61. Ferramosca, S. A worldwide empirical analysis of the accounting behaviour in the waste management sector. Waste Manag. 2019, 88, 211–225. [Google Scholar] [CrossRef] [PubMed]
  62. Bakchan, A.; Faust, K.M. Construction waste generation estimates of institutional building projects: Leveraging waste hauling tickets. Waste Manag. 2019, 87, 301–312. [Google Scholar] [CrossRef] [PubMed]
  63. Bartl, A. Withdrawal of the circular economy package: A wasted opportunity or a new challenge? Waste Manag. 2015, 44, 1–2. [Google Scholar] [CrossRef] [PubMed]
  64. Bahrami, A.; Schierning, G.; Nielsch, K. Waste recycling in thermoelectric materials. Adv. Energy Mater. 2020, 10, 1904159. [Google Scholar] [CrossRef] [Green Version]
  65. Haas, W.; Krausmann, F.; Wiedenhofer, D.; Heinz, M. How circular is the global economy? An assessment of material flows, waste production, and recycling in the European Union and the world in 2005. J. Ind. Ecol. 2015, 19, 765–777. [Google Scholar] [CrossRef]
  66. Haupt, M.; Vadenbo, C.; Hellweg, S. Do we have the right performance indicators for the circular economy? Insight into the swiss waste management system. J. Ind. Ecol. 2016, 21, 615–627. [Google Scholar] [CrossRef]
  67. Van Ewijk, S.; Stegemann, J.A. Recognising waste use potential to achieve a circular economy. Waste Manag. 2020, 105, 1–7. [Google Scholar] [CrossRef]
  68. Mugoni, C.; Rosa, R.; Remigio, V.A.; Ferrari, A.M.; Siligardi, C. Opportune inward waste materials toward a zero waste ceramic slabs production in a circular economy perspective. Int. J. Appl. Ceram. Technol. 2019, 17, 32–41. [Google Scholar] [CrossRef] [Green Version]
  69. United Nations Conference on the Human Environment, Stockholm, 1972. Mus. Int. 1973, 25, 117–119. [CrossRef]
  70. Batáry, P.; Dicks, L.V.; Kleijn, D.; Sutherland, W.J. The role of agri-environment schemes in conservation and environmental management. Conserv. Biol. 2015, 29, 1006–1016. [Google Scholar] [CrossRef] [Green Version]
  71. Pakeman, R.J.; McKeen, M. Within country targeting of agri-environment funding: A test of different methods. Glob. Ecol. Conserv. 2019, 17, e00574. [Google Scholar] [CrossRef]
  72. Careddu, N. Dimension stones in the circular economy world. Resour. Policy 2019, 60, 243–245. [Google Scholar] [CrossRef]
  73. Honoré, M.N.; Belmonte-Ureña, L.J.; Navarro-Velasco, A.; Camacho-Ferre, F. The production and quality of different varieties of papaya grown under greenhouse in short cycle in continental Europe. Int. J. Environ. Res. Public Health 2019, 16, 1789. [Google Scholar] [CrossRef] [PubMed] [Green Version]
  74. Bleischwitz, R.; Yong, G.; Walz, R.; Welfens, P.; Kemp, R. Euro-China green economy theme: SINCERE (Sino-European Circular Economy and Resource Efficiency)—ESRC. Impact 2018, 2018, 6–7. [Google Scholar] [CrossRef] [Green Version]
  75. Palafox-Alcantar, P.G.; Hunt, D.V.L.; Rogers, C.D.F. The complementary use of game theory for the circular economy: A review of waste management decision-making methods in civil engineering. Waste Manag. 2020, 102, 598–612. [Google Scholar] [CrossRef]
  76. Arora, N.K. Environmental sustainability—Necessary for survival. Environ. Sustain. 2018, 1, 1–2. [Google Scholar] [CrossRef] [Green Version]
  77. Pouris, A. Is fundamentalism a threat to science? Evidence from scientometrics. Scientometrics 2007, 71, 329–338. [Google Scholar] [CrossRef]
  78. Garfield, E. Derek price and the practical world of scientometrics. Sci. Technol. Hum. Values 1998, 13, 349–350. [Google Scholar] [CrossRef]
  79. Abad-Segura, E.; González-Zamar, M.-D. Global research trends in financial transactions. Mathematics 2020, 8, 614. [Google Scholar] [CrossRef]
  80. Duque-Acevedo, M.; Belmonte-Ureña, L.J.; Cortés-García, F.J.; Camacho-Ferre, F. Agricultural waste: Review of the evolution, approaches and perspectives on alternative uses. Glob. Ecol. Conserv. 2020, 22, e00902. [Google Scholar] [CrossRef]
  81. Bornmann, L.; Haunschild, R.; Hug, S.E. Visualizing the context of citations referencing papers published by Eugene Garfield: A new type of keyword co-occurrence analysis. Scientometrics 2017, 114, 427–437. [Google Scholar] [CrossRef] [PubMed] [Green Version]
  82. González-Zamar, M.D.; Ortiz Jiménez, L.; Sánchez Ayala, A.; Abad-Segura, E. The impact of the university classroom on managing the socio-educational well-being: A global study. Int. J. Environ. Res. Public Health 2020, 17, 931. [Google Scholar] [CrossRef] [Green Version]
  83. Neff, M.W.; Corley, E.A. 35 years and 160,000 articles: A bibliometric exploration of the evolution of ecology. Scientometrics 2009, 80, 657–682. [Google Scholar] [CrossRef]
  84. Abad-Segura, E.; González-Zamar, M.D. Effects of financial education and financial literacy on creative entrepreneurship: A worldwide research. Educ. Sci. 2019, 9, 238. [Google Scholar] [CrossRef] [Green Version]
  85. Khurshid, Z. Measuring the quality of contributions of saudi authors to lis journals using journal impact factor (JIF), SCImago journal rank (SJR), and google scholar metrics (GSM). Ser. Libr. 2014, 67, 81–98. [Google Scholar] [CrossRef]
  86. Wang, J.; Yang, N. Dynamics of collaboration network community and exploratory innovation: The moderation of knowledge networks. Scientometrics 2019, 121, 1067–1084. [Google Scholar] [CrossRef]
  87. Siegmeier, T.; Möller, D. Mapping research at the intersection of organic farming and bioenergy—A scientometric review. Renew. Sustain. Energy Rev. 2013, 25, 197–204. [Google Scholar] [CrossRef]
  88. Van Eck, N.J.; Waltman, L. Software survey: VOSviewer, a computer program for bibliometric mapping. Scientometrics 2009, 84, 523–538. [Google Scholar] [CrossRef] [PubMed] [Green Version]
  89. Cugmas, M.; Ferligoj, A.; Kronegger, L. The stability of co-authorship structures. Scientometrics 2015, 106, 163–186. [Google Scholar] [CrossRef] [Green Version]
  90. Blanchet, J.; Creutin, J.-D. Co-Occurrence of extreme daily rainfall in the French mediterranean region. Water Resour. Res. 2017, 53, 9330–9349. [Google Scholar] [CrossRef]
  91. Morton, S.; Pencheon, D.; Squires, N. Sustainable development goals (SDGs), and their implementation. Br. Med. Bull. 2017, 124, 81–90. [Google Scholar] [CrossRef] [PubMed]
  92. United Nations. Sustainable Development Goals. Available online: https://unstats.un.org/sdgs/ (accessed on 30 May 2020).
  93. Muñoz-Torres, M.J.; Fernández-Izquierdo, M.; Ángeles Rivera-Lirio, J.M.; Ferrero-Ferrero, I.; Escrig-Olmedo, E.; Gisbert-Navarro, J.V.; Marullo, M.C. An assessment tool to integrate sustainability principles into the global supply chain. Sustainability 2018, 10, 535. [Google Scholar] [CrossRef] [Green Version]
  94. Trica, C.L.; Banacu, C.S.; Busu, M. Environmental factors and sustainability of the circular economy model at the european union level. Sustainability 2019, 11, 1114. [Google Scholar] [CrossRef] [Green Version]
  95. Jurgilevich, A.; Birge, T.; Kentala-Lehtonen, J.; Korhonen-Kurki, K.; Pietikäinen, J.; Saikku, L.; Schösler, H. Transition towards circular economy in the food system. Sustainability 2016, 8, 69. [Google Scholar] [CrossRef] [Green Version]
  96. Hodge, D.R.; Lacasse, J.R. Evaluating journal quality: Is the H-index a better measure than impact factors? Res. Soc. Work Pract. 2011, 21, 222–230. [Google Scholar] [CrossRef] [Green Version]
  97. Scimago Journal & Country Rank (SJR) Journal Rankings. Available online: https://www.scimagojr.com/journalrank.php (accessed on 11 June 2020).
  98. Eysenbach, G. Citation advantage of open access articles. PLoS Biol. 2006, 4, 692–698. [Google Scholar] [CrossRef]
  99. Liu, Q.; Li, H.M.; Zuo, X.L.; Zhang, F.F.; Wang, L. A survey and analysis on public awareness and performance for promoting circular economy in China: A case study from Tianjin. J. Clean. Prod. 2009, 17, 265–270. [Google Scholar] [CrossRef]
  100. Witjes, S.; Lozano, R. Towards a more circular economy: Proposing a framework linking sustainable public procurement and sustainable business models. Resour. Conserv. Recycl. 2016, 112, 37–44. [Google Scholar] [CrossRef] [Green Version]
  101. Li, Y.; Wu, C.; Yan, E.; Li, K. Will open access increase journal citescores? An empirical investigation over multiple disciplines. PLoS ONE 2018, 13, e0201885. [Google Scholar] [CrossRef]
  102. Geng, Y.; Zhu, Q.; Doberstein, B.; Fujita, T. Implementing China’s circular economy concept at the regional level: A review of progress in Dalian, China. Waste Manag. 2009, 29, 996–1002. [Google Scholar] [CrossRef]
  103. Laso, J.; Margallo, M.; García-Herrero, I.; Fullana, P.; Bala, A.; Gazulla, C.; Polettini, A.; Kahhat, R.; Vázquez-Rowe, I.; Irabien, A.; et al. Combined application of life cycle assessment and linear programming to evaluate food waste-to-food strategies: Seeking for answers in the nexus approach. Waste Manag. 2018, 80, 186–197. [Google Scholar] [CrossRef] [PubMed]
  104. Laso, J.; Margallo, M.; Celaya, J.; Fullana, P.; Gazulla, C.; Aldaco, R.; Irabien, A. Finding the best available techniques for an environmental sustainable waste management in the fish canned industry. Chem. Eng. Trans. 2016, 52, 385–390. [Google Scholar] [CrossRef]
  105. Laso, J.; Margallo, M.; Serrano, M.; Vázquez-Rowe, I.; Avadí, A.; Fullana, P.; Bala, A.; Gazulla, C.; Irabien, Á.; Aldaco, R. Introducing the green protein footprint method as an understandable measure of the environmental cost of anchovy consumption. Sci. Total Environ. 2018, 621, 40–53. [Google Scholar] [CrossRef]
  106. Chinese Academy of Sciences. Available online: http://english.cas.cn/about_us/ (accessed on 28 May 2020).
  107. Peters, G.P.; Weber, C.L.; Guan, D.; Hubacek, K. China’s growing CO2 emissions—A race between increasing consumption and efficiency gains. Environ. Sci. Technol. 2007, 41, 5939–5944. [Google Scholar] [CrossRef] [PubMed] [Green Version]
  108. Shi, H.; Chertow, M.; Song, Y. Developing country experience with eco-industrial parks: A case study of the Tianjin economic-technological development area in China. J. Clean. Prod. 2010, 18, 191–199. [Google Scholar] [CrossRef]
  109. Su, B.; Heshmati, A.; Geng, Y.; Yu, X. A review of the circular economy in China: Moving from rhetoric to implementation. J. Clean. Prod. 2013, 42, 215–227. [Google Scholar] [CrossRef]
  110. Ghisellini, P.; Cialani, C.; Ulgiati, S. A review on circular economy: The expected transition to a balanced interplay of environmental and economic systems. J. Clean. Prod. 2016, 114, 11–32. [Google Scholar] [CrossRef]
  111. Moors, E.H.M.; Mulder, K.F.; Vergragt, P.J. Towards cleaner production: Barriers and strategies in the base metals producing industry. J. Clean. Prod. 2005, 13, 657–668. [Google Scholar] [CrossRef] [Green Version]
  112. Kjaerheim, G. Cleaner production and sustainability. J. Clean. Prod. 2005, 13, 329–339. [Google Scholar] [CrossRef]
  113. Ji, L.; Liu, C.; Huang, L.; Huang, G. The evolution of resources conservation and recycling over the past 30 years: A bibliometric overview. Resour. Conserv. Recycl. 2018, 134, 34–43. [Google Scholar] [CrossRef]
  114. Malinauskaite, J.; Jouhara, H.; Czajczyńska, D.; Stanchev, P.; Katsou, E.; Rostkowski, P.; Thorne, R.J.; Colón, J.; Ponsá, S.; Al-Mansour, F.; et al. Municipal solid waste management and waste-to-energy in the context of a circular economy and energy recycling in Europe. Energy 2017, 141, 2013–2044. [Google Scholar] [CrossRef]
  115. Dahlbo, H.; Poliakova, V.; Mylläri, V.; Sahimaa, O.; Anderson, R. Recycling potential of post-consumer plastic packaging waste in Finland. Waste Manag. 2018, 71, 52–61. [Google Scholar] [CrossRef] [PubMed]
  116. Gigli, S.; Landi, D.; Germani, M. Cost-Benefit analysis of a circular economy project: A study on a recycling system for end-of-life tyres. J. Clean. Prod. 2019, 229, 680–694. [Google Scholar] [CrossRef]
  117. Slorach, P.C.; Jeswani, H.K.; Cuéllar-Franca, R.; Azapagic, A. Environmental and economic implications of recovering resources from food waste in a circular economy. Sci. Total Environ. 2019, 693, 133516. [Google Scholar] [CrossRef] [PubMed]
  118. Eurostat. Circular Economy. Indicators. Available online: https://ec.europa.eu/eurostat/web/circular-economy/indicators (accessed on 11 June 2020).
  119. Triggs, A. Rebalancing a lopsided global economy. World Econ. 2019, 42, 3188–3234. [Google Scholar] [CrossRef]
  120. Robaina, M.; Villar, J.; Pereira, E.T. The determinants for a circular economy in Europe. Environ. Sci. Pollut. Res. 2020, 27, 12566–12578. [Google Scholar] [CrossRef] [PubMed]
  121. Agamuthu, P.; Ragossnig, A.M.; Velis, C. Publishing impactful interdisciplinary waste-related research on global challenges: Circular economy, climate change and plastics pollution. Waste Manag. Res. 2019, 37, 313–314. [Google Scholar] [CrossRef]
  122. Virtanen, M.; Manskinen, K.; Eerola, S. Circular material library. An innovative tool to design circular economy. Des. J. 2017, 20, S1611–S1619. [Google Scholar] [CrossRef]
  123. Watson, R. On climate change: Climate change: The science. Ecol. Econ. Soc. INSEE J. 2018, 1, 69–71. [Google Scholar] [CrossRef]
  124. De Angelis, R.; Howard, M.; Miemczyk, J. Supply chain management and the circular economy: Towards the circular supply chain. Prod. Plan. Control 2018, 29, 425–437. [Google Scholar] [CrossRef] [Green Version]
  125. Halisçelik, E.; Soytas, M.A. Sustainable development from millennium 2015 to sustainable development goals 2030. Sustain. Dev. 2019, 27, 545–572. [Google Scholar] [CrossRef]
  126. Helmer Pedersen, T.; Conti, F. Improving the circular economy via hydrothermal processing of high-density waste plastics. Waste Manag. 2017, 68, 24–31. [Google Scholar] [CrossRef] [PubMed]
  127. Jaremen, D.E.; Nawrocka, E.; Żemła, M. Sharing the economy in tourism and sustainable city development in the light of agenda 2030. Economies 2019, 7, 109. [Google Scholar] [CrossRef] [Green Version]
  128. The United Nations Framework Convention on Climate Change (UNFCCC). The Paris Agreement. Available online: https://unfccc.int/process-and-meetings#:a0659cbd-3b30-4c05-a4f9-268f16e5dd6b (accessed on 9 June 2020).
  129. European Commision. A European Green Deal. Available online: https://ec.europa.eu/info/strategy/priorities-2019-2024/european-green-deal_en (accessed on 8 June 2020).
  130. European Commision. Environment. EU Circular Economy Action Plan. A new Circular Economy Action Plan for a Cleaner and More Competitive Europe (2020). Available online: https://ec.europa.eu/environment/circular-economy/index_en.htm (accessed on 9 June 2020).
  131. European Union Law. EUR-Lex. Closing the Loop—An EU Action Plan for the Circular Economy (2015). Available online: https://eur-lex.europa.eu/legal-content/EN/TXT/?uri=CELEX:52015DC0614 (accessed on 9 June 2020).
  132. Marra, A.; Mazzocchitti, M.; Sarra, A. Knowledge sharing and scientific cooperation in the design of research-based policies: The case of the circular economy. J. Clean. Prod. 2018, 194, 800–812. [Google Scholar] [CrossRef]
  133. Hartley, K.; Van Santen, R.; Kirchherr, J. Policies for transitioning towards a circular economy: Expectations from the European Union (EU). Resour. Conserv. Recycl. 2020, 155, 104634. [Google Scholar] [CrossRef]
  134. Völker, T.; Kovacic, Z.; Strand, R. Indicator development as a site of collective imagination? The case of European Commission policies on the circular economy. Cult. Organ. 2020, 26, 103–120. [Google Scholar] [CrossRef]
Figure 1. Flowchart of the methodology applied.
Sustainability 12 05792 g001
Figure 2. Comparison between the number of articles published and their variation percentage.
Sustainability 12 05792 g002
Figure 3. Comparisons of growth trends in subject areas in research by period.
Sustainability 12 05792 g003
Figure 4. Network of cooperation based on co-authorship of the main authors.
Sustainability 12 05792 g004
Figure 5. International cooperation based on co-authorship between countries from 2004 to 2019.
Sustainability 12 05792 g005
Figure 6. Main keywords network based on co-occurrence from 2004 to 2019.
Sustainability 12 05792 g006
Figure 7. Evolution of main keywords network based on co-occurrence (2004–2019).
Sustainability 12 05792 g007
Table 1. Main documents reviewed in the context of the research.
YearArticle Title [Reference]Author (s)Journal
2020Local Environment and the UN Sustainable Development Goals [29]Agyeman, J.Local Environment
2020Improving Circular Economy Business Models: Opportunities for Business and Innovation: A new framework for businesses to create a truly circular economy [30]Chen, C.-W.Johnson Matthey Technology Review
2019Waste hierarchy index for circular economy in waste management [31]Pires, A.; Martinho, G.Waste Management
2018Relational values in environmental assessment: the social context of environmental impact [32]Grubert, E.Current Opinion in Environmental Sustainability
2018A perspective on a locally managed decentralized circular economy for waste plastic in developing countries [33]Joshi, C.; Seay, J.; Banadda, N.Environmental Progress and Sustainable Energy
2017A roadmap towards a circular and sustainable bioeconomy through waste valorization [34]Maina, S.; Kachrimanidou, V.; Koutinas, A.Current Opinion in Green and Sustainable Chemistry
2017Model of sustainable economy in circular economy [35]Rutkowska, M.; Popławski, Ł.Studia i Prace WNEiZ
2014Are the resource strategies for sustainable development sustainable? Downside of a zero-waste society with circular resource flows [36]Lee, J.; Pedersen, A. B.; Thomsen, M.Environmental Technology and Innovation
2010Circular agriculture as an important way to low-carbon economy [37]Gao, W.-S.; Chen, Y.-Q.; Dong, W.Chinese Journal of Eco-Agriculture
2008Sustainable growth rates: refining a measure [38]Ashta, A.Strategic Change
Table 2. Major characteristics of scientific production from 2004 to 2019.
PeriodAAUCTCTC/AJ
2004–2007214775016
2008–2011401218180530
2012–201510331327842867
2016–2019120238258113,09511370
A: number of articles; AU: number of authors; C: number of countries, TC: total citations in articles; TC/A: total citations per article; J: number of journals.
Table 3. The most active journals from 2004 to 2019.
JournalATCTC/AHaHjSJR (Q)AccessCountryR (A)
04–0708–1112–1516–19
Journal of Cleaner Production178409723.02341501.62 (Q1)NOAThe Netherlands01 (3)1 (9)1 (166)
Sustainability Switzerland1045575.3614530.549 (Q2)OASwitzerland0013 (2)2 (102)
Resources Conservation and Recycling91156617.21261031.541 (Q1)NOAThe Netherlands03 (3)3 (6)3 (82)
Waste Management4850410.50141271.523 (Q1)NOAUK027 (1)6 (3)4 (44)
Procedia Environmental Sc. Eng. and Manag. Management40340.85330.218 (Q3)OARomania0056(1)5 (39)
Journal of Industrial Ecology3582623.6019851.486 (Q1)NOAUSA02 (3)4 (4)6 (28)
Science of The Total Environment291966.76122051.536 (Q1)NOAThe Netherlands0058 (1)7 (28)
Journal of Environmental Management2435314.71111461.206 (Q1)NOAUSA023 (1)45 (1)8 (22)
Environmental Science and Pollution Research171116.537820.828 (Q1)NOAGermany0034 (1)9 (16)
Environmental Engineering and Management Journal15473.134310.345 (Q3)NOARomania0032 (1)10 (14)
Acta Ecologica Sinica14342.434370.197 (Q4)NOAChina04 (3)2 (8)67 (3)
Environmental Science and Technology Letters1360846.7763452.514 (Q1)NOAUSA7 (1)05 (3)19 (9)
Waste Management and Research13796.086660.527 (Q2)NOAUSA0014 (2)15 (11)
ACS Sustainable Chemistry & Engineering12383.175651.666 (Q1)NOAUSA00011 (12)
International Journal of Life Cycle Assessment12655.425891.538 (Q1)NOAGermany00012 (12)
Ecological Economics1126824.3671741.767 (Q1)NOAThe Netherlands00013 (11)
Journal of Material Cycles and Waste Management11958.644330.487 (Q2)NOAGermany10 (1)0017 (10)
Resources11514.645190.651 (Q2)OASwitzerland 00014 (11)
Energies10404.005640.612 (Q1)OASwitzerland 00016 (10)
Business Strategy and The Environment917419.336842.166 (Q1)NOAUSA00018 (9)
A: number of articles; TC: total citations for all articles; TC/A: number of citations per article; Ha: Hirsch-index in this topic; Hj: Hirsch-index in journal; SJR (Q): Scimago Journal Rank (Quartile); R: rank position by the number of articles published; OA: Open Access journal; NOA: Non-Open Access journal (include hybrid model).
Table 4. The most active journals from 2004 to 2019.
AuthorATCTC/AInstitutionCountry1st A *Last A *h-Index *
Geng, Y.21128561.19Tongji UniversityChina2009201916
Azapagic, A.9606.67Department of Chemical Engineering and Analytical ScienceUK201720195
Fullana, P.9434.78Universitat Pompeu Fabra BarcelonaSpain201620194
Irabien, A.9687.56Universidad de CantabriaSpain201620195
Aldaco, R.8536.63Universidad de CantabriaSpain201620195
Dewulf, J.8789.75Universiteit GentBelgium201720196
Margallo, M.8536.63Universidad de CantabriaSpain201620195
Purnell, P.814117.63University of LeedsUK201420197
Laso, J.7486.86Universidad de CantabriaSpain201620195
Prieto-Sandoval, V.7527.43Tecnun University of NavarraSpain201620194
A: number of articles; TC: number of citations; TC/A: number of citations per article; 1st A: first article; Last A: last article; h-index: Hirsch index; (*): in this research topic.
Table 5. Characteristics of the most outstanding institutions.
InstitutionCountryATCTC/Ah-IndexIC (%)TCICTCNIC
Chinese Academy of SciencesChina40143435.851650.0%61.859.85
Università degli Studi di CataniaItaly2980.2826.9%0.000.30
Delft University of TechnologyThe Netherlands2692335.501657.7%39.6729.82
Tsinghua UniversityChina242269.421020.8%11.408.89
Lunds UniversitetSweden1818810.441077.8%9.5013.75
Aalto UniversityFinland171498.76747.1%4.0013.00
Danmarks Tekniske UniversitetDenmark161137.06743.8%4.149.33
The International Institute for Industrial Environmental EconomicsSweden1617210.75881.3%9.5416.00
The Royal Institute of Technology KTHSweden1540226.801133.3%48.8015.80
Aalborg UniversitetDenmark15956.331033.3%4.607.20
A: number of articles; TC: total citations for all articles; TC/A: total citations per article; h-index: Hirsch index for this research topic; IC: percentage of articles developed with international collaboration; TCIC: number of citations in articles with international collaboration; TCNIC: number of citations in articles without international collaboration.
Table 6. The most relevant countries by number of articles (2004–2019).
CountryATCTC/Ah-IndexR (A)
2004–20072008–20112012–20152016–2019
China258407315.79321 (16)1 (32)1 (56)3 (154)
Italy21417298.0821004 (6)1 (208)
UK168273416.27273 (2)02 (10)2 (156)
Spain1348786.55170012 (3)4 (131)
USA87172019.77206 (1)3 (3)5 (6)6 (77)
Sweden83166820.101808 (1)13 (3)5 (79)
The Netherlands77172222.3624003 (9)8 (68)
Germany7298013.6120007 (4)7 (68)
Finland5986514.66160018 (1)9 (58)
France574467.82150019 (1)10 (56)
A: number of articles; TC: total citations for all articles; TC/A: number of citations by article; h-index: Hirsch index in this research topic; R: rank position by the number of articles published.
Table 7. The most prolific countries and international collaboration (2004–2019).
CountryNCMain CollaboratorsIC (%)TC/A
ICNIC
China31USA, UK, Hong Kong, Australia, The Netherlands32.9%31.458.09
Italy32Spain, Germany, China, The Netherlands, France33.2%16.074.11
UK43China, Germany, The Netherlands, Spain, Australia48.8%19.2313.45
Spain23Italy, Portugal, USA, Germany, UK44.0%8.085.35
USA33China, Spain, France, UK, Finland60.9%24.3012.71
Sweden30Finland, The Netherlands, UK, Denmark, Italy55.4%25.7213.11
The Netherlands27China, UK, Germany, Italy, Sweden59.7%26.6516.00
Germany27UK, Italy, Finland, The Netherlands, Spain63.9%16.917.77
Finland24Germany, Sweden, USA, China, Denmark64.4%17.1110.24
France32USA, Italy, The Netherlands, Canada, Germany68.4%8.217.00
NC: number of collaborators; IC (%): percentage of articles made with international collaboration; TC/A: number of citations by article; IC: number of citations by articles with international collaboration; NIC: number of citations by articles without international collaboration.
Table 8. Main keywords from 2004 to 2019.
Keyword2004–20192004–20072008–20112012–20152016–2019
A%R (A)%R (A)%R (A)%R (A)%
Circular Economy86163.0%1 (12)57.1%1 (25)62.5%1 (53)51.5%1 (771)64.1%
Sustainable Development40629.7%2 (7)33.3%3 (12)30.0%2 (32)31.1%2 (355)29.5%
Recycling34325.1%00.0%11 (6)15.0%5 (26)25.2%3 (311)25.9%
Life Cycle Assessment (LCA)28320.7%00.0%292 (1)2.5%9 (13)12.6%4 (269)22.4%
Waste Management25919.0%19 (2)9.5%78 (2)5.0%10 (13)12.6%5 (242)20.1%
Environmental Impact24517.9%71 (1)4.8%18 (4)10.0%12 (11)10.7%6 (229)19.1%
Sustainability23917.5%119 (1)4.8%74 (2)5.0%6 (15)14.6%7 (221)18.4%
Economics19013.9%12 (2)9.5%13 (5)12.5%4 (26)25.2%9 (157)13.1%
Life Cycle18713.7%00.0%291 (1)2.5%20 (8)7.8%8 (178)14.8%
Environmental Economics16311.9%14 (2)9.5%4 (8)20.0%8 (13)12.6%10 (140)11.6%
Life Cycle Analysis1289.4%00.0%00.0%21 (8)7.8%11 (120)10.0%
China1218.9%3 (6)28.6%2 (20)50.0%3 (31)30.1%23 (64)5.3%
Environmental Protection1168.5%9 (3)14.3%5 (8)20.0%7 (14)13.6%14 (91)7.6%
Human1168.5%16 (2)9.5%52 (2)5.0%28 (6)5.8%12 (106)8.8%
Environmental Management1138.3%00.0%14 (5)12.5%14 (10)9.7%13 (98)8.2%
Decision Making916.7%00.0%142 (1)2.5%31 (5)4.9%15 (85)7.1%
Waste Disposal876.4%00.0%00.0%61 (4)3.9%16 (83)6.9%
Industrial Economics866.3%00.0%28 (3)7.5%25 (7)6.8%18 (76)6.3%
Economic and Social Effects836.1%00.0%179 (1)2.5%33 (5)4.9%17 (77)6.4%
Economic Analysis826.0%56 (1)4.8%177 (1)2.5%13 (10)9.7%20 (70)5.8%
A: number of articles; R: rank position by the number of articles published; %: percentage of the total articles of the period.
Table 9. Circular economy (CE) indicators for the environment.
Thematic AreaIndicatorCluster *
A.Production and ConsumptionA.1Self-sufficiency for raw materials by region1—2—5
A.2Generation of municipal waste per capita 1—4
A.3Generation of waste excluding major mineral wastes per GDP unit 1—2—4
A.4Generation of waste excluding major mineral wastes per domestic material consumption 1—2—4
B.Waste ManagementB.1Recycling rate of municipal waste 1—3—4—5
B.2Recycling rate of all waste excluding major mineral waste 1—2—3—5
B.3Recycling rate of packaging waste by type of packaging 1—3—4—5
B.4Recycling rate of e-waste 1—3—5
B.5Recycling of biowaste 1—2—3—5
B.6Recovery rate of construction and demolition waste 1—3—4—5
C.Secondary Raw MaterialsC.1Contribution of recycled materials to raw materials demand end-of-life recycling input rates (EOL—RIR) 1—2—3
C.2Circular material use rate 1—4—5
C.3Trade in recyclable raw materials 1—3—5
D.Competitiveness and InnovationD.1Private investments—Jobs and gross value added related to CE sectors1—3—4
D.2Patents related to recycling and secondary raw materials 1—3—4
(*) see in Figure 6.

