Comparison of Carbon Dioxide (CO2) Fluxes between Conventional and Conserved Irrigated Rice Paddy Fields in Myanmar


Department of Ecology and Environmental Sciences, Faculty of Science, Palacký University Olomouc, CZ-78371 Olomouc, Czech Republic
*
Author to whom correspondence should be addressed.
Sustainability 2020, 12(14), 5798; https://doi.org/10.3390/su12145798
Submission received: 17 June 2020
/
Revised: 8 July 2020
/
Accepted: 11 July 2020
/
Published: 18 July 2020
(This article belongs to the Section Environmental Sustainability and Applications)
Abstract
:Rice (Oryza sativa. L.), a major food crop widely grown in Myanmar, is the most prominent cause of greenhouse gas (GHG) emissions in agriculture. Moreover, as a result of modification in agricultural management practices (such as soil tillage), the soil organic matter is exposed to more oxidizing conditions, releasing CO2 into the environment, contributing to global warming. Therefore, we studied the effects of both conventional and conservation soil tillage management practices on CO2 fluxes on an experimental rice paddy field in Myanmar. Total CO2 emissions during the night from paddies farmed under conventional practices were significantly higher than those from paddies farmed under conservation practices; however, no net CO2 flux differences were found between practices. Total net CO2 fluxes ranged from −59 to 1614 mg CO2 m−2 h−1 in conventional practices and from −282 to 1082 mg CO2 m−2 h−1 in conservation practices, respectively. Significantly higher rice biomass and grain yields were observed in conventional practices when compared to those in conservation practices, causing a significant rise in both CO2 uptake and emissions during the day and night, respectively. In addition, the results of this study revealed that CO2 emissions in rice fields could be much higher than expected, requiring further study to elucidate key factors driving the dynamics of CO2 in rice paddy systems.
1. Introduction
Global warming and increased emissions of anthropogenic greenhouse gases (GHGs) has become an international issue of great concern. Comprehending the dynamics of global climate change requires an understanding of the exchange of greenhouse gases between terrestrial ecosystems and the atmosphere [1]. Carbon dioxide (CO2) is considered to be the major contributor to anthropogenic GHGs, accounting for 76% of total emissions in 2010 [2]. Based on various population growth and energy use scenarios, the current CO2 concentration of 379 ppm is expected to rise to a concentration between 485 and 1000 ppm by 2100 [3]. The carbon cycle in cropland ecosystems is strongly affected by human activities. Emissions of CO2 from agricultural systems can occur via plant respiration, the oxidation of organic carbon in soil (soil respiration) and crop residues, the use of fossil fuels in agricultural machinery, and the use of fossil fuels in production of agricultural production inputs [4,5]. Organic carbon in soil is the largest of the terrestrial carbon pools [6]; therefore, despite relatively small changes in soil CO2, it can significantly affect both the atmospheric CO2 concentration and soil carbon sequestration processes [7]. Despite significant changes of CO2 between the atmosphere and agricultural land, net flux is considered to be approximately balanced, although there is limited evidence for this presumption [8]. Many studies investigated CO2 emissions from various terrestrial ecosystems [9,10], including natural grasslands [11,12] and croplands with various types of crop cultivation [13,14]. However, CO2 fluxes from agricultural soils depend on complex interactions between the climate and the physical, chemical, and biological properties of the soil [15]. Different kinds of land use practices on agricultural soil may also affect the properties of soil and thereby influence the CO2 dynamics [15,16].
Rice is a major food crop around the world, with a total harvested area of approximately 160 million hectares, producing more than 700 million tons annually [17]. The Food and Agriculture Organization (FAO) Rice Market Monitor (2018) reported that 681 million tons of rice were grown in Asia, representing 90% of the global rice production [18]. To keep pace with the increasing global population, rice production needs to increase approximately 40% by the end of 2030 [19]. The country of Myanmar, with 1.19 million hectares under summer rice paddies and an average yield of 4.19 Mt ha−1 from 2015 to 2016, is listed among the top 10 major rice producers in the world [20]. The actual sown area of paddies from 2015 to 2016 was 7.21 million hectares, producing 28.21 million metric tons of grain yield [21]. Summer rice grown under irrigated conditions can be very productive due to increased summertime day length [22]. Paddy fields are one of the major agricultural land uses, having substantial effects on the carbon cycle and contributing to global climate change [23]. According to the FAO database, rice cultivation contributed 10.1% of total agricultural GHG emissions worldwide [24]. Paddy ecosystems are considered to be a carbon (C) sink of atmospheric CO2 and sensitive to changes in the C pool [25]. The carbon cycle in these systems is easily affected by different management practices of tillage and application of nitrogen fertilizer [26]. Several studies have demonstrated that no or minimum tillage increases the carbon sequestration in soil [27]. No-till management is a practice that leaves the soil surface without disturbance from harvesting to planting, leaving 30% or more of the ground cover with crop residues.
Conservation agriculture (CA) involves minimum soil disturbance, providing soil cover with crop residues or cover crops and crop rotation to achieve higher yields [28]. Conservation tillage is the most sustainable form of agriculture and requires minimum input (fertilizer, pesticides, herbicides, etc.) [29]. Conventional tillage is the management of the soil surface with crop residues not exceeding 15% subsequent to planting [4]. Application of commercial fertilizer and chemicals used for crop protection in the conventional practice on paddy fields can undoubtedly affect soil CO2 flux by increasing the C input from increased crop biomass and crop residues returned to the soil [30]. The soil carbon balance can be altered by tilling the soil and exposing the soil organic matter to microbial decomposition, resulting in increased CO2 emissions [31].
Tillage can change physical, chemical, and biological soil properties, affecting the release of CO2 from soils [15]. Thus, shifting from conventional to conservation management practices could reduce CO2 emissions and increase the accumulation of soil organic carbon (SOC) [32,33]. However, some researchers reported similar soil CO2 flux from different tillage management practices [34,35]. Different agricultural practices also affect the resulting plant biomass and yield of rice. For instance, plant height is directly associated with plant biomass production, an essential morphological trait that affects the harvestable yield of rice [36]. Levels of night-time CO2 production by rice plants and soil respiration are expected to be higher than in the day, when photosynthesis of the rice plants and aquatic algae covering the paddy soil prevails. However the mechanism of CO2 exchange between rice paddies and the atmosphere has been explored in only a few studies and is not yet fully understood [37,38,39,40,41,42]. Hence, further evaluations of CO2 flux from rice crops are necessary for understanding the dynamics of agro-ecosystems and predicting future climate change [43].
The aims of our field experiment were to (1) investigate the effects of conventional and conservation management practices on CO2 emission fluxes during the summer rice growing season including the fallow period, (2) elucidate the effects of plant biomass on total CO2 fluxes, and (3) compare the effects of different soil tillage practices on grain yield and quality in a common Myanmar rice cultivar. Whereas previous studies focused on the measurement of CO2 fluxes only during a short portion of the paddy crop season, in this study, diurnal CO2 flux was measured during the entire summer rice paddy growing season and the fallow period. During the day, the quantity of CO2 produced by rice plants was expected to be very low due to photosynthetic activities by the plants, while respiration during the night was expected to be high due to respiration from rice plants and paddy soil.
2. Material and Methods
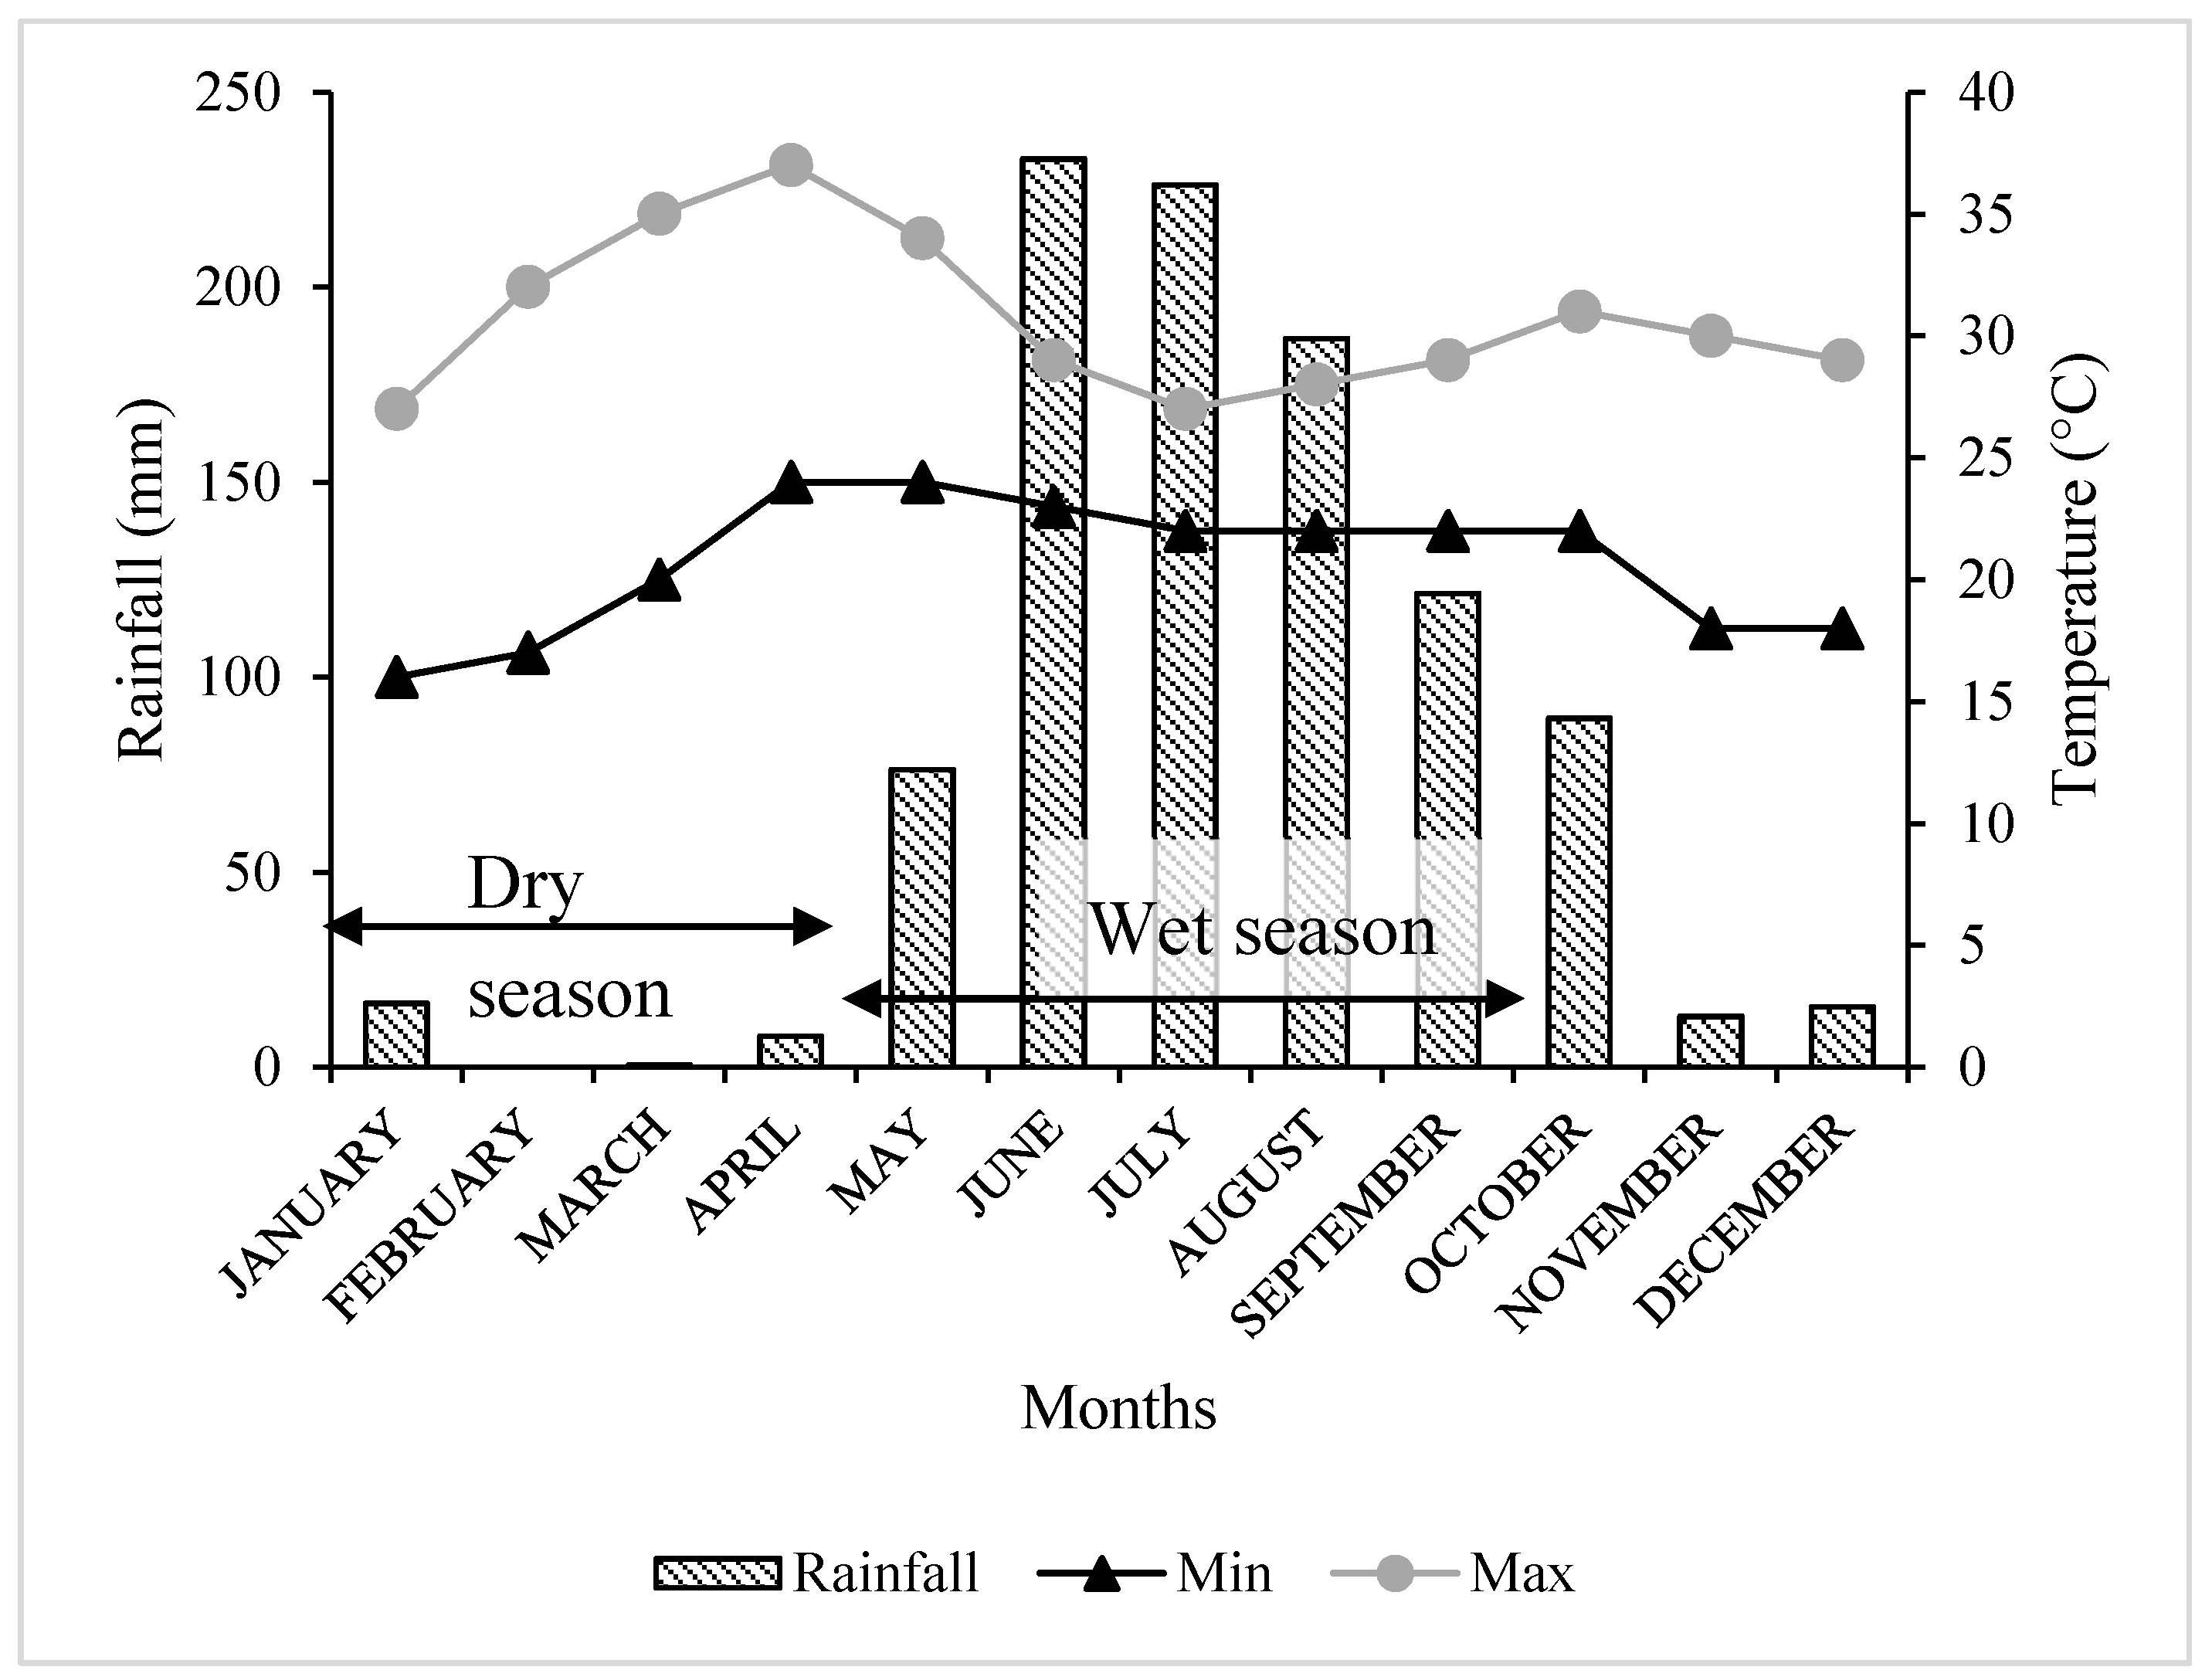
Trials were conducted from mid-January through June 2018 at the experimental paddy fields of the Department of Agronomy, Yezin Agricultural University, Myanmar. These fields are situated in the Yezin area, Pyinmana Township, Naypyitaw district (19°50′03″ N, 96°16′03″ E), and have been used for rice production for several years. The area is characterized by annual average temperature and rainfall of 21–33 °C and 1000 mm, respectively. The fields in our study were located in an area vulnerable to drought and, therefore, the vast majority of rice paddy fields in Myanmar are comparable to current experimental field conditions. In this region, summer rice cultivation uses irrigation water, which is normally initiated from January to May, depending on water availability and type of cultivars. Rice seeds of Oryza sativa. subsp. indica (Manawthukha, Masuri-M) (135 days), a commonly grown cultivar in Myanmar, were sown in the nursery during the second week of January 2018 and transplanted manually in the first week of February. Rice seedlings were prepared in the nursery before land preparation and transplanted as 25-day-old seedlings.
Six experimental plots, three under conventional and three under conservation practices, were constructed adjacent to one another. Plot size covered an area of 6 × 3 m, separated by bunds covered with plastic film serving as a barrier to prevent contamination of applied inorganic fertilizer from conventional plots to non-treated conservation plots. In a corner of every plot, a small area was left without rice plants for measuring bare soil respiration (Figure 1). The entire duration of the experiment lasted 155 days, including the fallow period. Carbon dioxide (CO2) gas sampling started one week after transplanting the rice plants and lasted throughout the fallow period.
Manual tillage was conducted using a spade, up to a maximum of 20 cm depth. The conventional practice (Conv) treatment was tilled three times and prior to transplanting, compound fertilizer (NPK 15:15:15) was added as a basal application at the rate of 61.75 kg ha−1. Urea fertilizer (46% N) was applied two times (Tillering and Panicle Initiation/Heading—see Table 1) as a split application at the rate of 50 kg N ha−1 [44]. Other standard practices such as application of pesticides and weed control were conducted using conventional concentrations and rates. By contrast, in conservation practice (Cons) treatment, tillage was carried out only once and without application of chemical fertilizer, pesticides or herbicides. Water was drained two weeks before harvesting, and the fallow paddy field was flooded for four weeks before the next planting season started.
Two airtight gas chambers with frosted acrylic sheets were constructed, one chamber for each treatment (Conv vs Cons) for the sampling of CO2 gas emitted from the paddy soil and rice plants. Acrylic sheet was used because it is non-reactive with the CO2 trapped inside the chambers. Each chamber (1 × 0.4 × 0.6 m) was equipped with a fan for mixing air inside the chamber, and the CO2 sensor was installed at the top of the chamber [29]. The fan was operated by a power bank device (2600 mAh), while carbon dioxide gas was measured immediately, using a SenseAir® CO2 sensor module K33 ELG, designed to measure and record data for environmental parameters such as temperature (T/°C), relative humidity (%) and carbon dioxide (CO2) concentration (up to 5000 ppm) [45].
CO2 flux was measured once a week during the entire summer paddy growing season (from transplanting to throughout the fallow period). Due to the high variability of CO2 fluxes by photosynthetic activities during the day [46], CO2 fluxes were consistently measured at a fixed time for all treated plots: between 9:00 and 12:00 for the day, and 21:00 and 24:00 for the night. CO2 values were recorded simultaneously for each replication under Conv and Cons management practices, with 2 min logging time for 30 min. To distinguish between respiration from the rice plants and paddy soils alone for the calculation of the CO2 gas balance, CO2 flux was measured separately with and without rice plants for each treatment. There were five rice growth periods (T-Tillering, PI/H-Panicle Initiation/Heading, FL-Flowering, GF-Grain Filling, and M-Maturity) analyzed for net CO2 emissions between Conv and Cons practices.
Daily mean ambient air temperature and relative humidity (%) were recorded by an automated weather station nearby the experimental fields. The meteorological data for this study year (2018) is presented in Figure 2 and daily data were downloaded from the server of the Agro-Meteorological Department of Yezin Agriculture University [47]. Soil temperature (°C) was recorded at three different depths of 0–5 cm, 0–10 cm, and 0–20 cm using a T&D TR-7wf/nw series soil temperature data logger. Soil samples for soil organic carbon (SOC%) analysis were taken before soil preparation and at the time of harvest. The sub-samples were analyzed at Palacký University Olomouc, Czech Republic. Redox potential (Eh) and soil water pH were measured using a Hanna Instruments HI83141 portable meter before and after rice harvest on the same date as CO2 flux measurements.
For vegetation analysis, plant characteristics such as plant height (cm) and leaf area (cm2) were recorded throughout the experiment, whereas characteristics such as fresh and dry biomass weight, yield and yield component characteristics were measured at harvest. Three randomly selected hills (plants) were used for plant height and five hills for leaf area measurements for each treatment. For leaf area measurements, a CI-203 handheld portable Laser Leaf Area Meter (CID Bioscience, Inc., USA) was used. Rice quality was evaluated based on measurements of the head rice, chalky rice, amylase content, gel consistency and protein content. After the rice harvest, 1000 grains were evaluated for each treatment. Grain quality analysis was conducted at the Department of Agricultural Research (DAR, Yezin) by using UV-Vis Spectrophotometer, Jenway-6305 with the KI solution method for Amylose (%), by the Kjedahl digestion and distillation method for protein %, and by the Gel Flow rate Method for Gel Consistency (mm) [48].
3. Flux Calculation
CO2 emission flux, namely the change of the gas quantity over the soil covered by a chamber per hour per unit area, was calculated using the following equation [49]:
where
F is the total flux density of gas (mg CO2 m−2 h−1);
is the slope of regression obtained by plotting concentration of CO2 vs time recorded during sampling;
V is the total volume of the chamber (m3);
A is the area of the chamber’s base (m2).
The CO2 flux produced by the rice plants only was calculated by using the equation:
where FTotal is total CO2 flux (which is the sum of CO2 respired by the rice plants and CO2 respired by the soil), Fsoil is CO2 respired by the bare soil only, and FRice is the CO2 emission flux from the rice plants only.
FRice = FTotal − FSoil
The net CO2 flux refers to a difference in total CO2 fluxes measured during the night and day, and annual flux was estimated by extrapolating each measurement based on this flux for rice paddy fields in Myanmar.
4. Statistical Analysis
Analysis of variance (ANOVA) was performed for total CO2 fluxes and soil respiration from bare paddy soil in each of the sampling dates separately, to evaluate the differences between land management practices and time on CO2 fluxes during day and night. Significance was tested at the p < 0.05 level. In addition, differences in mean values were calculated by using Tukey’s Honest Significance Test pair-wise comparisons at a significance level of p ≤ 0.05. Statistical software (R version 3.6.3) was used to perform ANOVA and plot graphs. Linear regression analysis was performed in Microsoft Excel to determine the relationship between plant height and CO2 fluxes influenced by the rice plants and paddy soil.
5. Results
5.1. Ambient Air Temperature, Relative Humidity and Soil Temperature
Mean ambient air temperature (°C) and relative humidity (%) showed only slight fluctuations during the day and night. The highest air temperature during the day of 33.13 °C was recorded on May 10, 2018 and the lowest temperature at night of 22.75 °C on February 8, 2018 (Figure 3). Air temperature (°C) and relative humidity (%) recorded inside the gas chambers containing rice plants and bare paddy soil closely matched the same patterns during day and night-time periods Air temperature ranged between 37.26 and 65 °C during the day in the chambers with rice plants, the maximal and minimal temperatures at night measurement showed 26.83 °C and 21.53 °C, respectively. Mean air temperature from bare paddy soil during the day ranged between 35.95 and 63.97 °C and 17.46 and 30.48 °C during the night. The relative humidity (%) with rice plants ranged between 22.14% and 47% during the day and 76.08% and 96.06% during the night. By contrast, relative humidity in the bare soil treatment ranged between 20.4% and 44.2% during the day and 79.3% and 97.6% during the night (Figure S1a–d; where “S1” denotes supplementary material).
There were no significant differences among mean soil temperatures measured at three different depths (5, 10, and 20 cm) during the day and night. As expected, the highest mean soil temperature during the day and night was observed at the 5 cm depth (30.97 °C and 31.17 °C, respectively), whereas the lowest temperature during the day and night was recorded at a depth of 20 cm (13.9 °C and 21.53 °C, respectively) (Figure 4a,b).
5.2. Patterns of CO2 Fluxes under Different Soil Management Practices
CO2 emission fluxes measured during the day were always negative for both soil management practices, except during the first 2 weeks after transplanting the rice seedlings and the period after harvesting (Figure 5a). As expected, CO2 emission flux at night was highly positive for both soil management practices during the entire rice growing season (Figure 5b). The highest fluxes were observed in Conv practice on April 26 and May 10, peaking at 1254 mg CO2 m−2 h−1.
Net CO2 fluxes from different crop growth periods are presented in Figure 6. Significant differences of net CO2 flux emissions were observed among the different growth periods; however, no significant difference was found between Conv and Cons tillage management practices. The highest net CO2 emission was observed in the Conv practice during the grain filling (GF) period, upwards of 925.40 mg CO2 m2 h−1 and followed by emissions during the flowering (FL) period at 890.72 mg CO2 m2 h−1. The lowest observed emission of net CO2 fluxes was found during the tillering (T) period under Conv and Cons practices as 329.08 and 370.04 mg CO2 m2 h−1, respectively.
Due to the absence of photosynthesis, CO2 fluxes from bare soil respiration under both Conv and Cons practices were always positive during the day and night (Figure 7a,b). Soil CO2 emission fluxes showed no significant differences between management practices except for the night measurements on February 8, April 19, May 3, and May 17 (Figure 7b).
Total CO2 emission fluxes from Conv practices were significantly higher than for Cons during night (Table 2). However, a non-significant difference between practices was observed during the day. In contrast, total CO2 flux from bare soil respiration showed significant differences between the two management practices for both the day and night measurements. The average contribution of soil respiration to the total CO2 emission fluxes during the night was 31.4% (ranging from 27% to 36%) in Conv, and 29.3% (range 28% to 33%) in Cons practice. Higher uptake of CO2 by rice plants during the day was observed in Conv practices compared to Cons practices, as well as higher net emissions of CO2 observed in Conv practices. During the fallow period, significantly higher CO2 flux was observed in the Conv versus Cons practices during the day, but non-significant differences of the CO2 fluxes were observed during the night between the practices (Table 2).
5.3. Effects of Different Agricultural Tillage Practices on Plant and Soil Characteristics
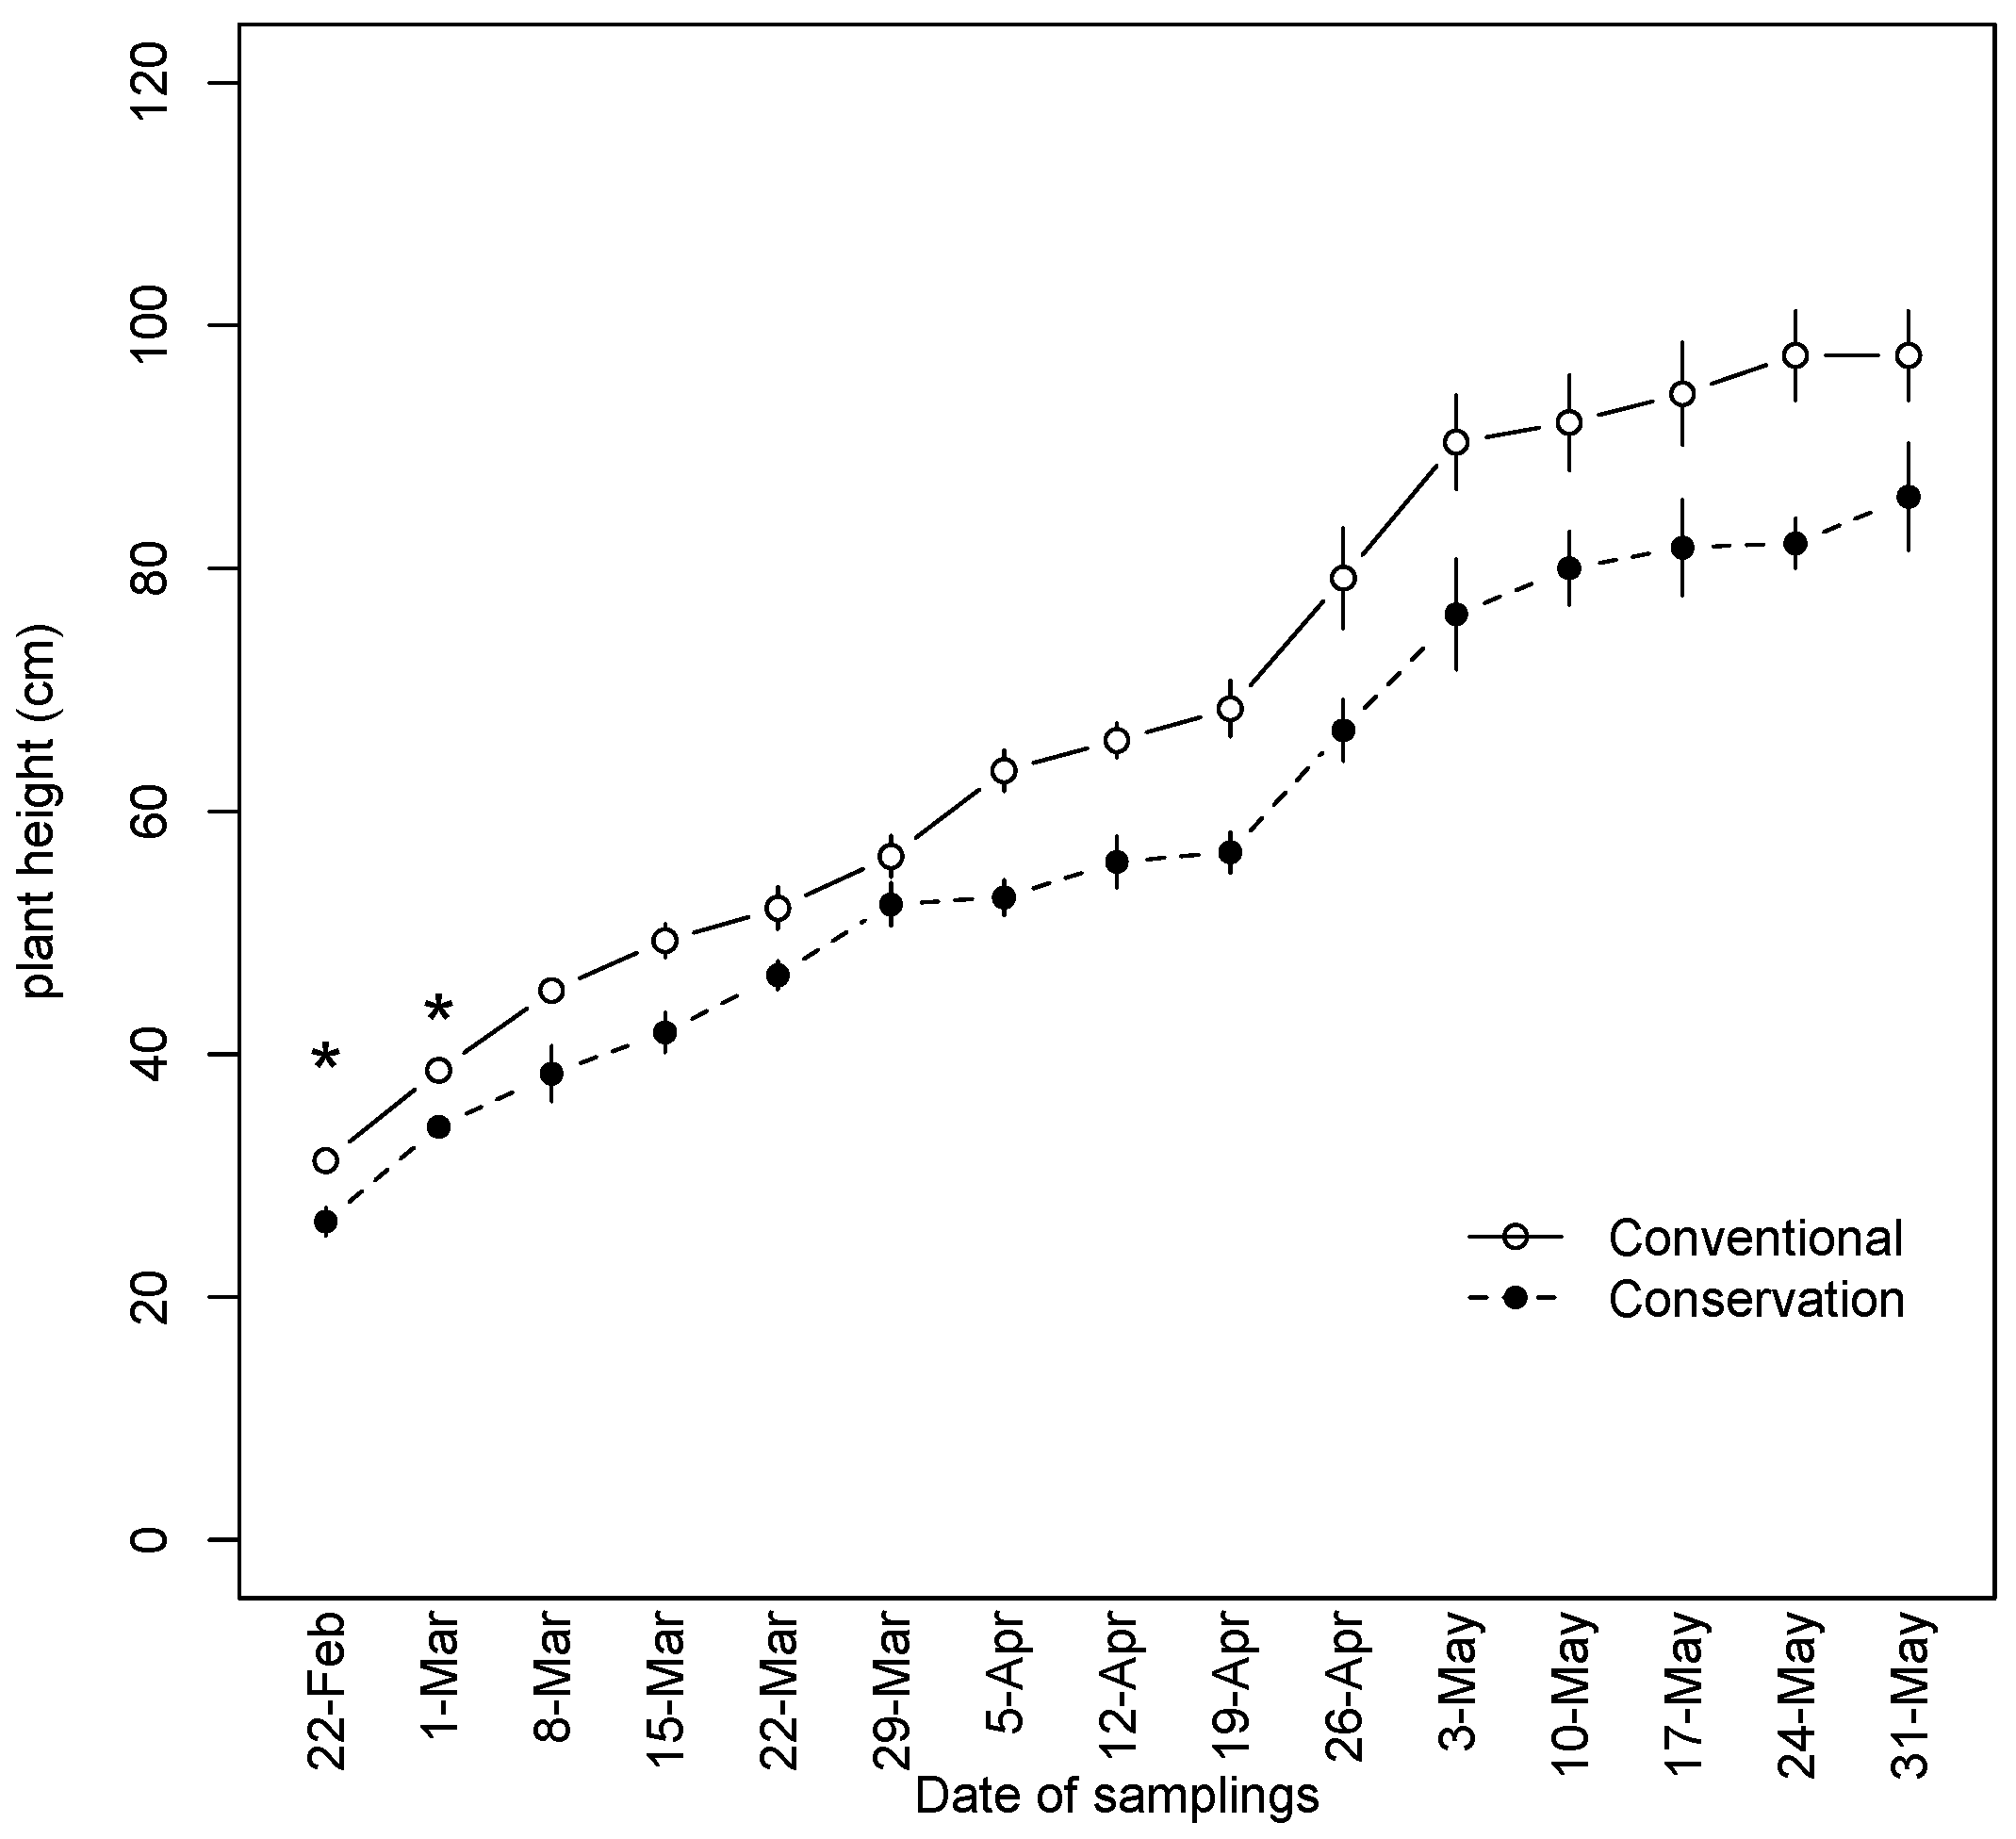
Plant height increased over time as the rice growing stage extended and peaked at maturity. A statistically significant difference was observed in plant height between Conv (range 31.2–97.5 cm) and Cons practices (range 26.2–82.9 cm at the early growth stages, Feb 22 and March 1) (Figure 8); however, no apparent difference was found during late growth stages. Maximum plant heights of 97.5 and 82.9 cm were observed in Conv and Cons practices, respectively.
Despite different management practices, we found no significant differences between soil organic carbon (SOC%), phosphorus, and nitrogen contents in the soil. Nevertheless, a slight decrease in SOC was observed during the harvest, as compared to before planting. Soil water pH and redox potential (mV) before and after harvesting of the paddy field showed no significant differences among Conv and Cons practices. However, soil water pH showed a slight increase after harvest (Table S1; S1 denotes supplementary appendix). Total CO2 fluxes from the Conv and Cons practices were positively correlated with plant height, while the coefficient of determination (R2) in Conv practices accounts for 69% which had more fitted values than Cons practices (43%) (Figure 9a,b). However, no significant difference was found when comparing the two different slopes.
Significant differences for the harvestable yield were observed between Conv and Cons practices, with 5.52 metric tons (Mt) ha−1 and 2.63 Mt ha−1, respectively (Table 3). However, the nutritional, edible and visual quality of rice such as amylose (%), protein (%), gel-consistency (mm), head rice rate (%), and chalky rice rate (%) was not affected by the different soil management practices as presented in Table 4. Plant height (cm) and other yield component characteristics of rice such as number of spikelets per panicle, filled grain (%), unfilled grain (%), and 1000 grain weight also showed no significant differences between the practices. However, we found the number of effective tillers per hill to be significantly higher than in Cons practices (Table 3). At harvest time, fresh and dry biomass weight (g hill−1) was significantly different between the different practices. According to the crop growth stages, leaf area during the tillering stage (43 DAT) showed significant differences between Conv (36.22 cm2 per hill) and Cons practices (28.82 cm2 per hill). Leaf area was significantly different between different practices during the flowering stage (88 DAT) (Table 3).
6. Discussion
Previous measurements of CO2 emission fluxes from paddy fields were reported in other studies in various Asian countries such as China, Japan, and Thailand. Rice fields in Myanmar occupied 34% of the total sown area [21]; however, relatively few studies have investigated the effects of land-use practices in rice paddy cultivation on CO2 fluxes. In the present study, we focused mainly on the effects of Conv and Cons agricultural tillage practices on CO2 emission fluxes from the paddy fields during the summer season in Myanmar. Whereas a broad range of paddy fields in Myanmar are farmed under similar conditions as our experimental field, the current CO2 emissions from Myanmar may be highly underestimated.
The CO2 concentration inside of the acrylic chamber was negative during the day, indicating prevalent uptake of CO2 via plant photosynthesis [5,50,51,52,53]. Variation of the CO2 gas exchange pattern can be influenced by leaf photosynthesis, which is strongly affected by high temperatures or light conditions [54]. Nevertheless, there is little temperature effect on leaf photosynthesis in rice from 20 to 40 °C [55]. High temperatures can reduce photosynthetic rate by 40%–60% at different growth stages. The photosynthetic rate of leaves under light dependence conditions is highly correlated with atmospheric CO2, and also varies with the growing temperature [56].
During the day, CO2 is consumed from the ambient atmosphere and CO2 is emitted by flooded soil. However, CO2 fluxes from respiration in bare paddy soil were positive during both the day and night, and lower during the day. This was likely due to CO2 uptake/release by aquatic weeds and algae present in the overlying paddy water [6]. Net soil CO2 flux throughout the growing season was generally positive, indicating the dominance of respiratory CO2 release by the soil microorganisms as well as by aquatic weeds and algae in paddy water. Generally, flooded bare paddy soil acted as a CO2 source throughout the day (Table 2). Similar results were reported by Nishimura et al., (2015) [5], who found the net soil CO2 flux was generally near zero during the submerged period, with paddy rice cultivation having a slight CO2 influx in the daytime and efflux at night-time.
Plant respiration in the absence of photosynthesis at night always resulted in a positive flux (efflux), suggesting that the field overgrown with rice plants was acting as a CO2 source during the night (Figure 5b). In this study, a peak of net CO2 emission fluxes from rice plants was observed in both the Conv and Cons practices during the grain filling period (Figure 6). On the contrary, Dutta and Gokhale (2017) [29] found the peak of net CO2 emission fluxes earlier, during the flowering period, probably due to higher ambient air temperature and development of root growth. On the other hand, a decrease in net CO2 emissions occurred during the maturity or ripening period. Due to the maturation of leaves such as leaf rolling, senescence, and yellowing, CO2 uptake rate gradually declined during the late growth stage or ripening/mature stage [57]. In addition, respiration of plants also decreased at night-time during this period (Figure 5b).
In the fallow period after removal of all aboveground biomass, CO2 flux was mediated only by the soil itself. Nevertheless, average values of CO2 emissions were higher compared to those from bare soil respiration (see Table 2). This could be associated with higher root residues and the decomposition of organic litter after removal of the aboveground biomass [49] and to intensive aerobic respiration initiated just after the drainage of water. Typically, higher CO2 emissions from Conv practices during the fallow period were observed when compared to the Cons practices. Similarly, lower CO2 emission in the non-tillage versus tillage treatment during the fallow period was noted by Wei et al. (2007) [58].
Greenhouse gas emissions, including CO2 from Conv tillage are usually reported as higher than emissions from Cons agricultural practices with minimal tillage [59,60,61,62,63,64,65]. Data from the present study were consistent with the observations from the previous findings mentioned above. Total CO2 emission fluxes from the Cons practice were significantly lower than those from the Conv practice at night (Table 2), but there was no significant difference during the day. Practitioners of Conv practices often apply nitrogen fertilizer (urea), resulting in increased plant biomass and subsequent stimulation of biological activity and increased CO2 emissions [66].
In the present study, higher biomass yields (Table 3) and net CO2 emissions (Table 2) were observed in Conv versus Cons practices, indicating that aboveground biomass was an important factor influencing CO2 fluxes in this field experiment. Similar findings were noted by Maraseni et al., (2009) [64] who found that higher GHG emissions were directly linked to increasing rice productivity by using higher farm inputs. The aboveground biomass also contributes organic matter to the soil [67,68]. A quantity of soil CO2 emission is often linked to the amount of aboveground biomass produced [69] because plant biomass is a primary source of the soil C pool. Moreover, Conv tillage practices also increase CO2 emissions by exposing organic matter to increased aerobic conditions, thus enhancing the soil organic matter decomposition process [70,71]. The results of our experiment revealed that fresh biomass from the Conv practice was higher than that from Cons practice, and the soil CO2 fluxes released by Conv practice were also always higher than those produced by Cons practice for both day and night measurements. The peak CO2 fluxes in soil from the Conv practice observed during flowering (FL) and grain filling (GF) stages (Figure 6) were likely due to increased substrates derived from root exudation and microbial decomposition of the remaining residues from previous crops [72] and photosynthates translocated from the aboveground biomass [73].
Plant height usually exhibits a highly significant relationship with leaf area, aboveground biomass, and yield [74]. In our study, the mean plant height from the Conv practice was greater in the Conv versus Cons practice. Consequently, higher biomass weight (g hill−1) and leaf area (cm2) was observed in the Conv versus Cons practice. These findings are similar to the results of Tilly et al., (2013) [75], indicating that increased plant height is followed by higher plant biomass. As expected, rice grain yield was also affected by the different soil management practices, with the Conv practice yielding twice as much as the Cons practice. Additionally, a significantly higher number of effective tillers per hill was observed in the Conv practice compared to the Cons practice. Wu et al., (2013) [76] pointed out that the Cons practice using minimum tillage significantly reduces the ratio of effective tillers to the total number of tillers. Lower grain yield might be also be affected by the decreased uptake of nitrogen by the rice plants due to weed infestation and high loss of nitrogen fertilizer [77,78]. On the other hand, some researchers suggested that no tillage practice improves both physical and chemical soil properties [79]; hence, the soil condition would favor germination and plant growth, consequently increasing rice grain yields [80].
Annual CO2 Flux from Various Rice Paddy Fields in Asian Countries
We estimated average emissions of CO2 from summer rice fields at 2347 g CO2 m−2 yr−1. Compared to CO2 fluxes from other rice fields under different water management, our findings are within the range of the previously found values presented in Table 5, despite the fact that most of the studies were focused mostly on CO2 emission from the soil only. It is also important to note that our findings are consistent with these measurements although they were carried out using different methodologies under flooded/irrigated conditions. Annual CO2 flux was extrapolated from the summer rice area based on Department of Agriculture (MoALI, 2016) [21] data, and resulted in 28.2 ± 3.97 Tg CO2 yr−1 (7.6 Tg C yr−1). This value is 21.3% higher than estimated CO2 emissions from Myanmar rice cultivation from both dry and wet seasons, as assessed from global emissions in the FAO Statistical Database [81].
7. Conclusions
Our field experiment demonstrated that the Conv practice of rice cultivation produced higher aboveground biomass and, also, grain yield, compared to the Cons practice (Table 3). However, this Conv management also emitted significantly higher CO2 fluxes than Cons management using minimum tillage and inputs of agrochemicals. Although a positive relationship between plant height and total CO2 emission was observed (Figure 9), fluxes indicated that the rice plant biomass is associated with CO2 production; we also found significantly higher production of CO2 from bare paddy soils managed under the Conv practice.
These findings suggest that management of soil is a primary factor with influence on resulting rice biomass as well as final CO2 flux. In comparison with methane, another greenhouse gas emission very often studied from rice paddies, the atmospheric CO2 concentration above a rice field shows a conspicuous diurnal pattern, with the lowest values during the day and highest during the night. Unsurprisingly, both plant photosynthesis and respiration are responsible for these diurnal changes in CO2 concentrations as contributions from soil to total CO2 emissions were generally less than 40%. Hence, CO2 flux was affected by the metabolic activity of rice plants rather than aerobic/anaerobic conditions of the soils, as is typically the case for methane.
In the context of global climate change and ongoing mitigating approaches aiming to reduce emissions of GHGs from rice fields focusing mostly on methane [86,87,88], it is worth noting that modification of current cultivation systems toward Cons practices that emit less CO2 requires farmers to be motivated, as this practice results in lower plant biomass as well as lower grain yields. Another noteworthy finding from our study was that the emissions of CO2 by rice fields may be much higher than previously expected [87], requiring verification from further studies. Therefore, additional studies are also needed to incorporate a range of multi-year/season assessments to determine seasonal variation of CO2 fluxes exchange from rice production in Myanmar.
Supplementary Materials
The following are available online at https://www.mdpi.com/2071-1050/12/14/5798/s1, Table S1. Effects of different agricultural tillage practices on soil characteristics of the experimental field, Figure S1. Relative humidity (%) and mean temperature (°C) inside the chamber with rice plants (a,b) and without rice plants (c,d) recorded day and night during the experimental period (February–May 2018).
Author Contributions
S.M. and M.R. conceived the study design, S.M. implemented the field research collected and analyzed the field data, S.M. wrote the paper with the help of M.R., M.R. commented on and edited the manuscript. All authors have read and agreed to the published version of the manuscript.
Funding
This research was funded by Palacký University Olomouc, Czech Republic, grant number IGA_PrF_2018_020. And the APC was funded by the Department of Ecological and Environmental Sciences, Palacký University Olomouc, grant number IGA_PrF_2020_020.
Acknowledgments
We thank the staff members from the Department of Agronomy, Yezin Agricultural University, Myanmar for continuous support during the field experiment. We highly appreciate Pascal Bodmer for technical advice. Dr. Seth M. White is gratefully acknowledged for editing a previous manuscript version. We finally acknowledge Matthew Sweney for English language editing services.
Conflicts of Interest
The authors declare that they have no conflict of interest.
References
- Smith, P.; Martino, D.; Cai, Z.; Gwary, D.; Janzen, H.; Kumar, P.; McCarl, B.; Ogle, S.; O’Mara, F.; Rice, C.; et al. Greenhouse gas mitigation in agriculture. Philos. Trans. R. Soc. B Biol. Sci. 2008, 363, 789–813. [Google Scholar] [CrossRef] [PubMed] [Green Version]
- IPCC. Climate Change 2014: Mitigation of Climate Change; Contribution of Working Group III to the Fifth Assessment Report of the Intergovernmental Panel on Climate Change; Cambridge University Press: Cambridge, UK; New York, NY, USA, 2014.
- Cheng, W.; Sakai, H.; Hartley, A.; Yagi, K.; Hasegawa, T. Increased night temperature reduces the stimulatory effect of elevated carbon dioxide concentration on methane emission from rice paddy soil. Glob. Chang. Biol. 2008, 14, 644–656. [Google Scholar] [CrossRef]
- Marland, G.; West, T.O.; Schlamadinger, B.; Canella, L. Managing soil organic carbon in agriculture: The net effect on greenhouse gas emissions. Tellus Ser. B Chem. Phys. Meteorol. 2003, 55, 613–621. [Google Scholar] [CrossRef]
- Nishimura, S.; Yonemura, S.; Minamikawa, K.; Yagi, K. Seasonal and diurnal variations in net CO2 flux throughout the year from soil in paddy field. J. Geophys. Res. Biogeosciences Res. 2015, 120, 661–675. [Google Scholar] [CrossRef]
- Bhattacharyya, P.; Neogi, S.; Roy, K.S.; Dash, P.K.; Nayak, A.K.; Mohapatra, T. Tropical low land rice ecosystem is a net carbon sink. Agric. Ecosyst. Environ. 2014, 189, 127–135. [Google Scholar] [CrossRef]
- Iqbal, J.; Ronggui, H.; Lin, S.; Hatano, R.; Feng, M.; Lu, L.; Ahamadou, B.; Du, L. CO2 emission in a subtropical red paddy soil (Ultisol) as affected by straw and N-fertilizer applications: A case study in Southern China. Agric. Ecosyst. Environ. 2009, 131, 292–302. [Google Scholar] [CrossRef]
- AR4. The Physical Science Basis, Contribution of Working Group I to the Fourth Assessment Report of the Intergovernmental Panel on Climate Change; Climate Change; Solomon, S., Qin, D., Manning, M., Chen, Z., Averyt, K.B., Miller, H.L., Eds.; IPCC: Geneva, Switzerland, 2007; Volume 59.
- Lee, M.; Nakane, K.; Nakatsubo, T.; Mo, W.H.; Koizumi, H. Effects of rainfall events on soil CO2 flux in a cool temperate deciduous broad-leaved forest. Ecol. Res 2002, 17, 401–409. [Google Scholar] [CrossRef]
- Ohkubo, S.; Kosugi, Y.; Takanashi, S.; Mitani, T.; Tani, M. Comparison of the eddy covariance and automated closed chamber methods for evaluating nocturnal CO2 exchange in a Japanese cypress forest. Agric. For. Meteorol. 2007, 142, 50–65. [Google Scholar] [CrossRef]
- Balogh, J.; Balogh, J.; Pintér, K.; Fóti, S.; Cserhalmi, D.; Papp, M.; Nagy, Z. Dependence of soil respiration on soil moisture, clay content, soil organic matter, and CO2 uptake in dry grasslands. Soil Biol. Biochem. 2011, 43, 1006–1013. [Google Scholar] [CrossRef]
- Caquet, B.; De Grandcourt, A.; M’bou, A.T.; Epron, D.; Kinana, A.; Saint André, L.; Nouvellon, Y. Soil carbon balance in a tropical grassland: Estimation of soil respiration and its partitioning using a semi-empirical model. Agric. For. Meteorol. 2012, 159, 71–79. [Google Scholar] [CrossRef]
- Ball, B.C.; Scott, A.; Parker, J.P. Field N2O, CO2 and CH4 fluxes in relation to tillage, compaction and soil quality in Scotland. Soil Tillage Res. 1999, 53, 29–39. [Google Scholar] [CrossRef]
- Buyanosvky, G.A.; Wagner, G.H.; Gantzer, C.J. Soil respiration in a winter wheat ecosystem. Soil Sci. Soc. Am. J. 1986, 50, 338–344. [Google Scholar]
- Oorts, K.; Merckx, R.; Gréhan, E.; Labreuche, J.; Nicolardot, B. Determinants of annual fluxes of CO2 and N2O in long-term no-tillage and conventional tillage systems in northern France. Soil Tillage Res. 2007, 95, 133–148. [Google Scholar] [CrossRef]
- Robertson, G.P.; Paul, E.A.; Harwood, R.R. Greenhouse gases in intensive agriculture: Contributions of individual gases to the radiative forcing of the atmosphere. Science 2000, 289, 1922–1925. [Google Scholar] [CrossRef] [Green Version]
- FAO, Food and Agriculture Organization of the United Nations. Production/Yield quantities of Rice, paddyin World+(Total).[StatisticalDatabase]. Available online: http://www.fao.org/faostat/en/#data/(2018) (accessed on 15 June 2020).
- FAO. FAO Rice Market Monitor. Food Agric. Organ. USA 2018, 21, 1–38. [Google Scholar]
- OECD-FAO. Agricultural Outlook 2009-2018 HIGHLIGHTS. Stat. Tables 2009, 10, 95. [Google Scholar]
- IRRI. World Rice Production Statistics; International Rice Research Institute: Los Baños, Philippines, 2018. [Google Scholar]
- Department of Planning (MoALI). Myanmar Agriculture in Brief, Ministry of Agriculture; Livestock and Irrigation: Naypyidaw, Myanmar; The Government of the Republic of the Union of Myanmar: Naypyidaw, Myanmar, 2016.
- Denning, G.; Baroang, K.; Sandar, T.M. Background Paper No. 2 Rice Productivity Improvement in Myanmar; Michigan State University: East Lansing, MI, USA, 2013; Volume 33, pp. 14–20. [Google Scholar]
- Ren, X.; Wang, Q.; Tong, C.; Wu, J.; Wang, K.; Zhu, Y.; Lin, Z.; Watanabe, M.; Tang, G. Estimation of soil respiration in a paddy ecosystem in the subtropical region of China. Chinese Sci. Bull. 2007, 52, 2722–2730. [Google Scholar] [CrossRef]
- FAO. Global Greenhouse Gas Emission from Agriculture, FAO Stat Data, 2005–2014. Food Agric. Organ. 2016, 66, 37–39. [Google Scholar]
- Kuzyakov, Y.; Cheng, W. Photosynthesis controls of CO2 efflux from maize rhizosphere. Plant Soil 2004, 263, 85–99. [Google Scholar] [CrossRef]
- Ding, W.; Cai, Y.; Cai, Z.; Zheng, X. Diel pattern of soil respiration in N-amended soil under maize cultivation. Atmos. Environ. 2006, 40, 3294–3305. [Google Scholar] [CrossRef]
- Dawson, J.J.C.; Smith, P. Carbon losses from soil and its consequences for land-use management. Sci. Total Environ. 2007, 382, 165–190. [Google Scholar] [CrossRef] [PubMed]
- Bhattacharyya, R.; Ghosh, B.N.; Mishra, P.K.; Mandal, B.; Rao, C.S.; Sarkar, D.; Das, K.; Anil, K.S.; Lalitha, M.; Hati, K.M.; et al. Soil Degradation in India: Challenges and Potential Solutions. Sustainability 2015, 7, 3528–3570. [Google Scholar] [CrossRef] [Green Version]
- Dutta, J.; Gokhale, S. Field investigation of carbon dioxide (CO2) fluxes and organic carbon from a conserved paddy field of North–East India. Int. Soil Water Conserv. Res. 2017, 5, 325–334. [Google Scholar] [CrossRef]
- Paustian, K.; Collins, H.P.; Paul, E.A. Management controls on soil carbon BT—Soil organic matter in temperate agroecosystems: Long-term experiments in North America. Soil Org. Matter Temp. Agroecosyst. Long-Term Exp. N. Am. 1997, 1, 15–49. [Google Scholar]
- Rastogi, M.; Singh, S.; Pathak, H. Emission of carbon dioxide from soil. Curr. Sci. 2002, 82, 510–517. [Google Scholar]
- Lal, R. Agricultural activities and the global carbon cycle. Nutr. Cycl. Agroecosyst. 2004, 70, 103–116. [Google Scholar] [CrossRef]
- Smith, K.A.; Conen, F. Impacts of land management on fluxes of trace greenhouse gases. Soil Use Manag. 2010, 20, 255–263. [Google Scholar] [CrossRef]
- Aslam, T.; Choudhary, M.A.; Saggar, S. Influence of land-use management on CO2 emissions from a silt loam soil in New Zealand. Agric. Ecosyst. Environ. 2000, 77, 257–262. [Google Scholar] [CrossRef]
- Elder, J.W.; Lal, R. Tillage effects on gaseous emissions from an intensively farmed organic soil in North Central Ohio. Soil Tillage Res. 2008, 98, 45–55. [Google Scholar] [CrossRef]
- Zhang, Y.; Yu, C.; Lin, J.; Liu, J.; Liu, B.; Wang, J.; Huang, A.; Li, H.; Zhao, T. OsMPH1 regulates plant height and improves grain yield in rice. PLoS ONE 2017, 12, e0180825. [Google Scholar] [CrossRef] [Green Version]
- Alberto, M.C.R.; Hirano, T.; Miyata, A.; Wassmann, R.; Kumar, A.; Padre, A.; Amante, M. Influence of climate variability on seasonal and interannual variations of ecosystem CO2 exchange in flooded and non-flooded rice fields in the Philippines. Field Crop. Res. 2012, 134, 80–94. [Google Scholar] [CrossRef]
- Alberto, M.C.R.; Wassmann, R.; Hirano, T.; Miyata, A.; Kumar, A.; Padre, A.; Amante, M. CO2/heat fluxes in rice fields: Comparative assessment of flooded and non-flooded fields in the Philippines. Agric. For. Meteorol. 2009, 149, 1737–1750. [Google Scholar] [CrossRef]
- Campbell, C.S.; Heilman, J.L.; McInnes, K.J.; Wilson, L.T.; Medley, J.C.; Wu, G.; Cobos, D.R. Diel and seasonal variation in CO2 flux of irrigated rice. Agric. For. Meteorol. 2001, 108, 15–27. [Google Scholar] [CrossRef]
- Miyata, A.; Leuning, R.; Denmead, O.T.; Kim, J.; Harazono, Y. Carbon dioxide and methane fluxes from an intermittently flooded paddy field. Agric. For. Meteorol. 2000, 102, 287–303. [Google Scholar] [CrossRef]
- Saito, M.; Miyata, A.; Nagai, H.; Yamada, T. Seasonal variation of carbon dioxide exchange in rice paddy field in Japan. Agric. For. Meteorol. 2005, 135, 93–109. [Google Scholar] [CrossRef]
- Komiya, S.; Noborio, K.; Katano, K.; Pakoktom, T.; Siangliw, M.; Toojinda, T. Contribution of Ebullition to Methane and Carbon Dioxide Emission from Water between Plant Rows in a Tropical Rice Paddy Field. Int. Sch. Res. Not. 2015, 2015, 623901. [Google Scholar] [CrossRef]
- Patel, N.R.; Dadhwal, V.K.; Saha, S.K. Measurement and Scaling of Carbon Dioxide (CO2) Exchanges in Wheat Using Flux-Tower and Remote Sensing. J. Indian Soc. Remote Sens. 2011, 39, 383–391. [Google Scholar] [CrossRef]
- Oo, A.Z.; Win, K.T.; Bellingrath-Kimura, S.D. Within field spatial variation in methane emissions from lowland rice in Myanmar. Springerplus 2015, 4, 145. [Google Scholar] [CrossRef] [Green Version]
- Bastviken, D.; Sundgren, I.; Natchimuthu, S.; Reyier, H.; Gälfalk, M. Technical Note: Cost-efficient approaches to measure carbon dioxide (CO2) fluxes and concentrations in terrestrial and aquatic environments using mini loggers. Biogeosciences 2015, 12, 3849–3859. [Google Scholar] [CrossRef] [Green Version]
- Takai, T.; Kondo, M.; Yano, M.; Yamamoto, T. A Quantitative Trait Locus for Chlorophyll Content and its Association with Leaf Photosynthesis in Rice. Rice 2010, 3, 172–180. [Google Scholar] [CrossRef] [Green Version]
- Yezin Agricultural University (YAU). Available online: http://www.yau.edu.mm (accessed on 7 June 2020).
- Juliano, B.O.; Villareal, C.P. Grain quality evaluation of world rices. Int. Rice Res. Inst. 1993, 1–99. [Google Scholar]
- Liu, X.; Liu, H.; Zhao, P.; Sun, G.; Lin, Y.; Rao, X.; Wang, Y. Characteristics of CO2, CH4 and N2O emissions from winter-fallowed paddy fields in hilly areas of South China. Front. Agric. China 2007, 1, 418–423. [Google Scholar] [CrossRef]
- Baker, J.T.; Allen, L.H.; Boote, K.J. Temperature effects on rice at elevated CO2 concentration. J. Exp. Bot. 1992, 43, 959–964. [Google Scholar] [CrossRef]
- Baten, M.; Hossen, M.; Islam, M.; Miyata, A.; Mano, M. Diurnal Variation of Carbon Dioxide Flux Over Rice Paddy. J. Environ. Sci. Nat. Resour. 2017, 9, 127–130. [Google Scholar]
- Manalo, P.A.; Ingran, K.T.; Pamplona, R.R.; Egeh, A.O. Atmospheric CO2 and temperature effects on development and growth of rice. Ecosyst. Environ. 1994, 51, 339–347. [Google Scholar] [CrossRef]
- Vu, J.C.V.; Allen, L.H., Jr.; Bowes, G. Effects of elevated CO2 and temperature on photosynthesis and Rubisco in rice and soybean. Plant Cell Environ. 1997, 20, 68–76. [Google Scholar] [CrossRef]
- Ohashi, K.; Makino, A.; Mae, T. Gas Exchange Characteristics in Rice Leaves Grown under the Conditions of Physiologically Low Temperature and Irradiance. Plant Cell Physiol. 1998, 39, 1384–1387. [Google Scholar] [CrossRef] [Green Version]
- Egeh, A.O.; Ingram, K.T.; Zamora, O.B. High temperature effects of leaf gas exchange of four rice cultivars. Philipp. J. Crop Sci. 1992, 17, 21–26. [Google Scholar]
- Oh-e, I.; Saitoh, K.; Kuroda, T. Effects of High Temperature on Growth, Yield and Dry-Matter Production of Rice Grown in the Paddy Field. Plant Prod. Sci. 2007, 10, 412–422. [Google Scholar] [CrossRef]
- Khatun, R. Diural variation of CO2 flux at various growth stages of rice. Bangladesh J. Environ. Sci. 2007, 13, 2. [Google Scholar]
- Liang, W.; Shi, Y.; Zhang, H.; Yue, J.; Huang, G.H. Greenhouse Gas Emissions from Northeast China Rice Fields in Fallow Season. Pedosphere 2007, 17, 630–638. [Google Scholar] [CrossRef]
- Abdalla, K.; Chivenge, P.; Ciais, P.; Chaplot, V. No-tillage lessens soil CO2 emissions the most under arid and sandy soil conditions: Results from a meta-analysis. Biogeosciences 2016, 13, 3619–3633. [Google Scholar] [CrossRef] [Green Version]
- Al–Kaisi, M.M.; Yin, X. Tillage and Crop Residue Effects on Soil Carbon and Carbon Dioxide Emission in Corn–Soybean Rotations. J. Environ. Qual. 2005, 34, 437–445. [Google Scholar] [CrossRef] [PubMed]
- Bauer, P.J.; Frederick, J.R.; Novak, J.M.; Hunt, P.G. Soil CO2 flux from a norfolk loamy sand after 25 years of conventional and conservation tillage. Soil Tillage Res. 2006, 90, 205–211. [Google Scholar] [CrossRef]
- Curtin, D.; Wang, H.; Selles, F.; Mcconkey, B.G.; Campbell, C.A. Tillage Effects on Carbon Fluxes in Continuous Wheat and Fallow–Wheat Rotations. Soil Sci. Soc. Am. J. 2000, 64, 2080–2086. [Google Scholar] [CrossRef]
- Jabro, J.D.; Sainju, U.; Stevens, W.B.; Evans, R.G. Carbon dioxide flux as affected by tillage and irrigation in soil converted from perennial forages to annual crops. J. Environ. Manag. 2008, 88, 1478–1484. [Google Scholar] [CrossRef]
- Maraseni, T.N.; Mushtaq, S.; Maroulis, J. Greenhouse gas emissions from rice farming inputs: A cross-country assessment. J. Agric. Sci. 2009, 147, 117–126. [Google Scholar] [CrossRef]
- Törő, Á.; Ragán, P.; Rátonyi, T.; Kith, K.; Harsányi, E. Daily soil carbon dioxide flux under different tillage conditions. Acta Agrar. Debreceniensis 2019, 141–144. [Google Scholar] [CrossRef]
- Kader, M.A.; Yeasmin, S.; Solaiman, Z.M.; De Neve, S.; Sleutel, S. Response of hydrolytic enzyme activities and nitrogen mineralization to fertilizer and organic matter application in subtropical paddy soils. Eur. J. Soil Biol. 2017, 80, 27–34. [Google Scholar] [CrossRef]
- Kara, O.; Bolat, I.; CaKıroglu, K.; Senturk, M. Litter decomposition and microbial biomass in temperate forests in northwestern Turkey. J. Soil Sci. Plant Nutr 2014, 14, 31–41. [Google Scholar]
- Raich, J.W.; Potter, C.S. Global patterns of carbon-dioxide emissions from soils. Glob. Biogeochem. Cy 1995, 9, 23–36. [Google Scholar] [CrossRef] [Green Version]
- Raich, J.W.; Tufekcioglu, A. Vegetation and soil respiration: Correlations and controls. Biogeochemistry 2000, 48, 71–90. [Google Scholar] [CrossRef]
- Hütsch, B.W. Tillage and land use effects on methane oxidation rates and their vertical profiles in soil. Biol. Fertil. Soils 1998, 27, 284–292. [Google Scholar] [CrossRef]
- Reicosky, D.C.; Dugas, W.A.; Torbert, H.A. Tillage-induced soil carbon dioxide loss from different cropping systems. Soil Tillage Res. 1997, 41, 105–118. [Google Scholar] [CrossRef]
- Li, C.F.; Kou, Z.K.; Yang, J.H.; Cai, M.L.; Wang, J.P.; Cao, C.G. Soil CO2 fluxes from direct seeding rice fields under two tillage practices in central China. Atmos. Environ. 2010, 44, 2696–2704. [Google Scholar] [CrossRef]
- Guo, L.J.; Zhang, R.D.; Zhang, Z.S.; Cao, C.G.; Li, C.F. Effects of different no-tillage modes on soil CO2 fluxes from paddy fields in central China. J. Soil Sci. Plant Nutr. 2015, 15, 737–750. [Google Scholar] [CrossRef] [Green Version]
- Ahmed, B.E.A.M.; Ahmed, F.E.; ElDessougi, H.I. Assessments of the Relationship between Effective leaf area, Yield Components and Protein Content in Wheat (Triticum aestivum L.) under Water Stress Conditions at Eastern Sudan. Sch. J. Agric. Vet. Sci. 2016, 3, 155–159. [Google Scholar]
- Tilly, N.; Hoffmeister, D.; Cao, Q.; Lenz-Wiedemann, V.; Miao, Y.; Bareth, G. Precise plant height monitoring and biomass estimation with Terrestrial Laser Scanning in paddy rice. ISPRS Ann. Photogramm. Remote Sens. Spat. Inf. Sci. 2013, 2, 295–300. [Google Scholar] [CrossRef] [Green Version]
- Wu, J.; Guo, X.S.; Zhang, X.M.; Wang, Y.Q. Effects of no-tillage on supply characteristics of soil inorganic nitrogen and rice yield. Sci. Agric. Sin. 2013, 46, 1172–1181. [Google Scholar]
- Chauhan, B.S. Effect of tillage systems, seeding rates, and herbicides on weed growth and grain yield in dry-seeded rice systems in the Philippines. Crop Prot. 2013, 54, 244–250. [Google Scholar] [CrossRef]
- Liebig, M.A.; Tanaka, D.L.; Wienhold, B.J. Tillage and cropping effects on soil quality indicators in the northern Great Plains. Soil Tillage Res. 2004, 78, 131–141. [Google Scholar] [CrossRef] [Green Version]
- Jiang, X.J.; Xie, D.T. Combining Ridge with No-Tillage in Lowland Rice-Based Cropping System: Long-Term Effect on Soil and Rice Yield. Pedosphere 2009, 19, 515–522. [Google Scholar] [CrossRef]
- Liu, J.; Huang, Q.; Fu, H.; Lu, X.M.; Liu, H.Z.; Li, K.H. Physiological mechanism of high and stable yield of no-tillage cast-trans-planted rice. Agric. Sci. China 2002, 1, 404–409. [Google Scholar]
- FAO Data Stat. Greenhouse Gas Emission from Agriculture, Myanmar (Food and Agriculture Organization). Glob. Emiss. 2017, 1–14. [Google Scholar]
- Chen, H.W.; Yen, J.H.; Chung, R.S.; Lai, C.M.; Yang, S.S.; Wang, Y.S. Carbon dioxide flux density in cultivated rice paddy field. Proc. Natl. Sci. Counc. Repub. China B 2001, 25, 239–247. [Google Scholar] [PubMed]
- Naser, H.M.; Nagata, O.; Sultana, S.; Hatano, R. Carbon Sequestration and Contribution of CO2, CH4 and N2O Fluxes to Global Warming Potential from Paddy-Fallow Fields on Mineral Soil Beneath Peat in Central Hokkaido, Japan Habib. Agriculture 2019, 359, 6. [Google Scholar] [CrossRef] [Green Version]
- Gandahi, R.; Yusop, M.K.; Gandahi, A.W. Field validation of DNDC model for simulating greenhouse gas emissions from rice soils of Kedah, Malaysia through DNDC Model. Int. J. Biosci. 2015, 7, 42–56. [Google Scholar]
- Pathak, H.; Li, C.; Wassmann, R. Greenhouse gas emissions from Indian rice fields: Calibration and upscaling using the DNDC model. Biogeosciences 2005, 2, 113–123. [Google Scholar] [CrossRef] [Green Version]
- Epule, E.T.; Peng, C.; Mafany, N.M. Methane Emissions from Paddy Rice Fields: Strategies towards Achieving a Win-Win Sustainability Scenario between Rice Production and Methane Emission Reduction. J. Sustain. Dev. 2011, 4, 188. [Google Scholar] [CrossRef]
- Hussain, S.; Peng, S.; Fahad, S.; Khaliq, A.; Huang, J.; Cui, K.; Nie, L. Rice management interventions to mitigate greenhouse gas emissions: A review. Environ. Sci. Pollut. Res. 2015, 22, 3342–3360. [Google Scholar] [CrossRef]
- Zschornack, T.; da Rosa, C.M.; Pedroso, G.M.; Marcolin, E.; da Silva PR, F.; Bayer, C. Mitigation of yield-scaled greenhouse gas emissions in subtropical paddy rice under alternative irrigation systems. Nutr. Cycl. Agroecosyst. 2016, 105, 61–73. [Google Scholar] [CrossRef]
Figure 1.
Experimental field layout at Yezin Agricultural University, Myanmar.

Figure 2.
Mean monthly rainfall and temperature in Yezin, Naypyitaw, 2018 (Source: Agrometeorology station, Department of Agronomy, Yezin Agricultural University).
Figure 2.
Mean monthly rainfall and temperature in Yezin, Naypyitaw, 2018 (Source: Agrometeorology station, Department of Agronomy, Yezin Agricultural University).

Figure 3.
Average weekly relative humidity (%) and ambient air temperature (°C) recorded day and night during the experimental period (February–May 2018).
Figure 3.
Average weekly relative humidity (%) and ambient air temperature (°C) recorded day and night during the experimental period (February–May 2018).

Figure 4.
Mean soil temperature (°C) recorded at three different soil depths (0–5 cm, 0–10 cm, and 0–20 cm) during (a) Day and (b) Night from irrigated summer rice paddy fields.
Figure 4.
Mean soil temperature (°C) recorded at three different soil depths (0–5 cm, 0–10 cm, and 0–20 cm) during (a) Day and (b) Night from irrigated summer rice paddy fields.

Figure 5.
Effects of different soil management practices on total CO2 fluxes from irrigated rice paddy fields during: (a) day and (b) night ± SE.
Figure 5.
Effects of different soil management practices on total CO2 fluxes from irrigated rice paddy fields during: (a) day and (b) night ± SE.

Figure 6.
Effects of different soil management practices on net CO2 fluxes (±SE) from various rice growth stages (see Table 1 for abbreviations of different growth stages).
Figure 6.
Effects of different soil management practices on net CO2 fluxes (±SE) from various rice growth stages (see Table 1 for abbreviations of different growth stages).

Figure 7.
Effects of different soil management practices on soil CO2 fluxes from irrigated rice paddy fields during: (a) day and (b) night ± SE.
Figure 7.
Effects of different soil management practices on soil CO2 fluxes from irrigated rice paddy fields during: (a) day and (b) night ± SE.

Figure 8.
Average plant height in cm (± SE) measured under different soil management practices from irrigated rice paddy fields.
Figure 8.
Average plant height in cm (± SE) measured under different soil management practices from irrigated rice paddy fields.

Figure 9.
Relationship between plant height and total CO2 fluxes from irrigated rice paddy under (a) Conventional and (b) Conservation practices.
Figure 9.
Relationship between plant height and total CO2 fluxes from irrigated rice paddy under (a) Conventional and (b) Conservation practices.


Table 1.
Description of different rice growth stages according to duration of each period as observed in the present study.
Table 1.
Description of different rice growth stages according to duration of each period as observed in the present study.
| Growth Stages | Abbreviation | Description | Duration | No. of Days |
|---|---|---|---|---|
| Seedling | - | Includes seedlings in the nursery and transplanting. | January 10–February 14 | 35 |
| Tillering Stage | T | Two weeks after transplanting, plants grow quickly, increasing number of tillers as well as plant height. | February 15–March 26 | 40 |
| Panicle Initiation/Heading | PI/H | In addition, also called the booting stage. Tip of developing panicle emerges from stem and continues to grow until panicle fully visible. | March 31–April 19 | 20 |
| Flowering | FL | Flowering can occur one day after heading, followed by pollination. | April 20–April 31 | 10 |
| Grain Filling | GF | Begins within 1–5 days after heading and grain filling is complete within 3 weeks. | May 1–May 15 | 15 |
| Mature | M | Starts after flowering and ends at harvesting, usually lasting 30–65 days depending on the variety. | May 16–June 1 | 17 |
Table 2.
Effects of soil management practices on the carbon dioxide (CO2) flux from irrigated rice paddy fields in Myanmar. Mean value ± standard deviation (SD).
Table 2.
Effects of soil management practices on the carbon dioxide (CO2) flux from irrigated rice paddy fields in Myanmar. Mean value ± standard deviation (SD).
| Periods (Day/Night) | Treatments (Practices) | Total CO2 Fluxes (mgCO2 m−2 h−1) | Soil Respiration (mgCO2 m−2 h−1) | Fallow (mgCO2 m−2 h−1) |
|---|---|---|---|---|
| Day | Conventional | −262.5 ± 98.5 | 151.6 ± 15.4 | 318.8 ± 71.6 |
| Conservation | −257.2 ± 73.2 | 95.7 ± 11.7 | 170 ± 38.0 | |
| ns | ** | ns | ||
| Night | Conventional | 846.5 ± 31.3 | 266.2 ± 16.1 | 592.1 ± 39.8 |
| Conservation | 749.9 ± 34.2 | 219.5 ± 19.2 | 450.8 ± 32.3 | |
| ** | * | * |
*, significant at the 0.05 probability level; **, significant at the 0.01 probability level; ns, not significant.
Table 3.
Effects of different soil management practices on yield and yield components, biomass, and leaf area from irrigated summer rice paddy.
Table 3.
Effects of different soil management practices on yield and yield components, biomass, and leaf area from irrigated summer rice paddy.
| Practices | Yield (t ha−1) | Plant Height at Harvest (cm) | Number of Tillers hill−1 | Effective Tillers/Hill (g hill−1) | Number of Spikelet/Panicle | Filled Grain (%) | 1000 Grain Weight (g) | Fresh Weight (g hill−1) (at Harvest) | Dry Weight (g hill−1) (at Harvest) | Leaf Area (cm2 hill−1) (43 DAT) | Leaf Area (cm2 hill−1) (88 DAT) |
|---|---|---|---|---|---|---|---|---|---|---|---|
| Conventional | 5.52 | 95.7 | 11.40 | 10.47 | 114.9 | 92.17 | 20.10 | 103.7 | 68.9 | 672 | 1402 |
| Conservation | 2.63 | 82.1 | 7.67 | 6.73 | 82.9 | 93.57 | 18.70 | 68.8 | 35.0 | 368 | 539 |
| Pr value | 0.018 | 0.086 | 0.013 | 0.019 | 0.181 | 0.472 | 0.205 | 0.052 | 0.046 | 0.01 | 0.006 |
| CV% | 40.3 | 9.4 | 23.5 | 24.9 | 24.1 | 2.8 | 7.3 | 23.7 | 37.6 | 5.7 | 13.3 |
| LSD 0.05 | 1.693 | 18.44 | 1.881 | 2.240 | 68.34 | 6.823 | 3.248 | 36.72 | 32.44 | 139.8 | 281.7 |
DAT = Days after transplanting.
Table 4.
Effects of different soil management practices on rice grain quality analysis.
| Practices | Amylose (%) | Protein (%) | Gel Consistency (mm) | Head Rice Rate (%) | Chalky Rice Rate (%) |
|---|---|---|---|---|---|
| Conventional | 22.33 | 7.10 | 32.50 | 33.5 | 6.33 |
| Conservation | 23.26 | 7.77 | 28.67 | 49.4 | 5.33 |
| Pr value | 0.475 | 0.149 | 0.063 | 0.112 | 0.580 |
| CV% | 4.5 | 9.9 | 8.5 | 28.8 | 27.5 |
| LSD0.05 | 4.616 | 1.250 | 4.362 | 25.04 | 6.572 |
Table 5.
Annual CO2 (C) emissions from various rice fields under different management practices in Asia.
Table 5.
Annual CO2 (C) emissions from various rice fields under different management practices in Asia.
| Type of Rice Field | Management Practices | CO2 Emissions (g CO2 m−2 yr−1) | Authors | |
|---|---|---|---|---|
| Soil Respiration | With Rice Plants | |||
| Flooded rice field | Conventional tillage | 381–572 | 1362–3816 | [82] (Taiwan) |
| Irrigated rice field | Non-tillage Conventional tillage | 770–831 (2008) 466–519 (2009) 772–793 (2008) 371–383 (2009) | [72] (China) | |
| Irrigated rice field | Ridge non-tillage Flat non-tillage | 1042–1489 724–1016 | [73] (China) | |
| Flooded rice field | Conventional tillage | 1563–1922 | [83] (Japan) | |
| Flooded rice field | Conventional tillage | 1731 | [84] (DNDC model, Malaysia) | |
| Tropical lowland rice field | Conventional tillage | 1693 | [85] (DNDC model, India) | |
| Summer Irrigated rice fields | Conservation tillage Conventional tillage | 1383 1830 | 2137 2558 | This study (2018) (Myanmar) |
© 2020 by the authors. Licensee MDPI, Basel, Switzerland. This article is an open access article distributed under the terms and conditions of the Creative Commons Attribution (CC BY) license (http://creativecommons.org/licenses/by/4.0/).
Share and Cite
MDPI and ACS Style
Min, S.; Rulík, M. Comparison of Carbon Dioxide (CO2) Fluxes between Conventional and Conserved Irrigated Rice Paddy Fields in Myanmar. Sustainability 2020, 12, 5798. https://doi.org/10.3390/su12145798
AMA Style
Min S, Rulík M. Comparison of Carbon Dioxide (CO2) Fluxes between Conventional and Conserved Irrigated Rice Paddy Fields in Myanmar. Sustainability. 2020; 12(14):5798. https://doi.org/10.3390/su12145798
Chicago/Turabian StyleMin, Saw, and Martin Rulík. 2020. "Comparison of Carbon Dioxide (CO2) Fluxes between Conventional and Conserved Irrigated Rice Paddy Fields in Myanmar" Sustainability 12, no. 14: 5798. https://doi.org/10.3390/su12145798
Note that from the first issue of 2016, this journal uses article numbers instead of page numbers. See further details here.