Evaluation of Family Houses in Slovakia Using a Building Environmental Assessment System
by
 , ,
, ,
Eva Krídlová Burdová
1 ,
,
Iveta Selecká
1, 
Silvia Vilčeková
1,* ,
,
Dušan Burák
2 and
Anna Sedláková
2 1
Institute of Environmental Engineering, Faculty of Civil Engineering, Technical University of Košice, 042 00 Košice, Slovakia
2
Institute of Architectural Engineering, Faculty of Civil Engineering, Technical University of Košice, 042 00 Košice, Slovakia
*
Author to whom correspondence should be addressed.
Sustainability 2020, 12(16), 6524; https://doi.org/10.3390/su12166524
Submission received: 9 July 2020
/
Revised: 3 August 2020
/
Accepted: 4 August 2020
/
Published: 12 August 2020
(This article belongs to the Special Issue Sustainable Building Materials and Life Cycle Assessment (LCA))
Abstract
:The presented study is focused on the verification of a Building Environmental Assessment System (BEAS). A total of 13 detached family houses representing typical construction sites in Slovakia were chosen for analysis, evaluation and certification by using a BEAS which contains several main fields: A—Site Selection and Project Planning; B—Building Construction; C—Indoor Environment; D—Energy Performance; E—Water Management; and F—Waste Management. The results of this study show that the current construction method for family houses does not respect the criteria of sustainable construction as much as it possibly can. The reason for this is that investment costs for construction are prioritized over environmental and social aspects. Therefore, one house with a score of 1.10 is certified as BEAS BRONZE, ten family houses with scores of 1.56–2.88 are certified as BEAS SILVER and only two family houses with total scores of 3.59 and 3.87, respectively, are certified as BEAS GOLD. The overall results show that the weakest fields of sustainability are Waste management, Energy performance and Building construction. The best-rated fields are Site Selection and Project Planning, Indoor Environment and Water Management. In the future, it is essential to pay attention to those areas where the sustainability criteria have not been reached, as well as to raise project teams’ awareness of sustainability issues and subsequently to transfer them to building practices.
1. Introduction
One of the first key definitions of sustainable development is that of the Report of the World Commission on Environment and Development: Our Common Future defines sustainable development as development that meets the needs of the present without compromising the ability of future generations to meet their own needs [1]. Interest in the topic of sustainable development quickly spread to the field of construction, and subsequently definitions of green and sustainable buildings emerged. A green building is defined as a building designed, constructed or operated in a way which reduces or eliminates negative impacts, and can have benefits on our climate and natural environment [2]. In another definition, green building is the practice of using building materials and processes that are environmentally responsible and resource-efficient throughout a whole life cycle, from siting to design, construction, operation, maintenance, renovation and deconstruction of the building [3]. However, the definition of a sustainable building is more complex. According to Berardi, a sustainable building is characterized as a healthy facility designed and built in a cradle-to-grave resource-efficient manner, respecting ecological principles, social equity and life cycle quality value, and promoting a sense of a sustainable community [4]. Three pillars of sustainability (the environment, society and economy) are incorporated into building sustainability assessment methods and systems in order to increase practicality and resiliency [5,6]. The building environmental assessment has been considered since it first came into prominence in the early 1990s [7]. As a result, many sustainable building rating systems and assessment tools have been conceived and are being put into practice around the world. However, with different regions producing their own different interpretations on how to measure sustainability in buildings, a fragmented market has been produced [8]. Well-known building sustainability assessment systems and methods include: BREEAM, LEED, CASBEE, SBTool, Miljöbyggnad, 3-Star, G-SEED, Green Star, Green Mark, ITACA, NABERS, CESBA, etc., and many others are currently in development [9,10,11,12,13,14,15,16,17,18,19]. In Slovakia, there is a building environmental assessment system (BEAS) that was developed at the Technical University of Kosice’s Faculty of Civil Engineering [20]. Authors in study [21] carried out a review of the development of several green evaluation systems (LEED, BREEAM, CASBEE and Green Star NZ). Their review showed that the indoor environment quality, energy and materials are core categories common to all these systems, although they were initiated in different contexts with different standards. The authors noted that BREEAM has been the only tool which focuses on the assessment of all four sustainability factors. In study [22], 20 dual certified projects are analyzed to determine if there is any correlation between the LEED and BREEAM methods. Statistical analysis confirmed a large positive linear correlation between the LEED and BREEAM scores. Study [23] presents interesting results in regard to the relationship between green building design factors and the identified green building criteria. As such, weather data and solar analysis score the highest and the second highest in the rankings, respectively, because of their significant impacts on the majority of the criteria (indoor environmental quality, energy, water, material, waste, land use and the energy criterion). In contrast, the low number of publications exploring the correlation between Heating, ventilation and air conditioning (HVAC) systems and three criteria (namely, material use, waste and land use) focuses on building envelope elements at the expense of HVAC systems. The importance and impact of building sustainability assessment systems is often discussed. For example, a study by Jang et al. showed that green building certification increased potential tenants’ willingness to rent space in a building [24]. Similarly, according to Wiley et al., certified buildings achieve superior rents and sustain significantly higher occupancy [25]. Research in study [26] revealed that houses with the Chinese Green Building Label have a sales price premium of 6.9% compared with non-labeled houses. Another study [27] analyzed the satisfaction levels of occupants with their buildings overall, building performance and indoor environmental quality factors in different seasons for non-certified and Three-Star certified office buildings. The results showed that users of Three-Star certified buildings were more satisfied than users of non-certified buildings. Altomonte and Schiavon analyzed the occupants’ satisfaction with indoor environmental quality in 79 non-LEED and 65 LEED buildings. The authors did not observe a significant influence of LEED certification on the occupant’s satisfaction with IEQ, although their analysis of the mean votes of satisfaction showed that occupants of LEED buildings were slightly more satisfied with their air quality and slightly more dissatisfied with the amount of light they obtained [28]. Another study [29] compared the perceptions of users in three green buildings certified as new constructions and three conventional buildings. In this case, the results showed that employees perceive green building spaces as being better than similar spaces in conventional buildings.
Ultimately, the environmental certification of buildings is significant for sustainability and therefore important to promote the latter in the Slovak market [20]. The concept of sustainable construction and certification of buildings is still gaining recognition in Slovakia. This paper seeks to highlight the current state of construction in terms of sustainability aspects. Therefore, the main contribution of the presented research work is the analysis of selected family houses through their evaluation by the building environmental assessment system (BEAS) used in the Slovak Republic.
2. Materials and Methods
2.1. Low-Rise Residential Family Houses
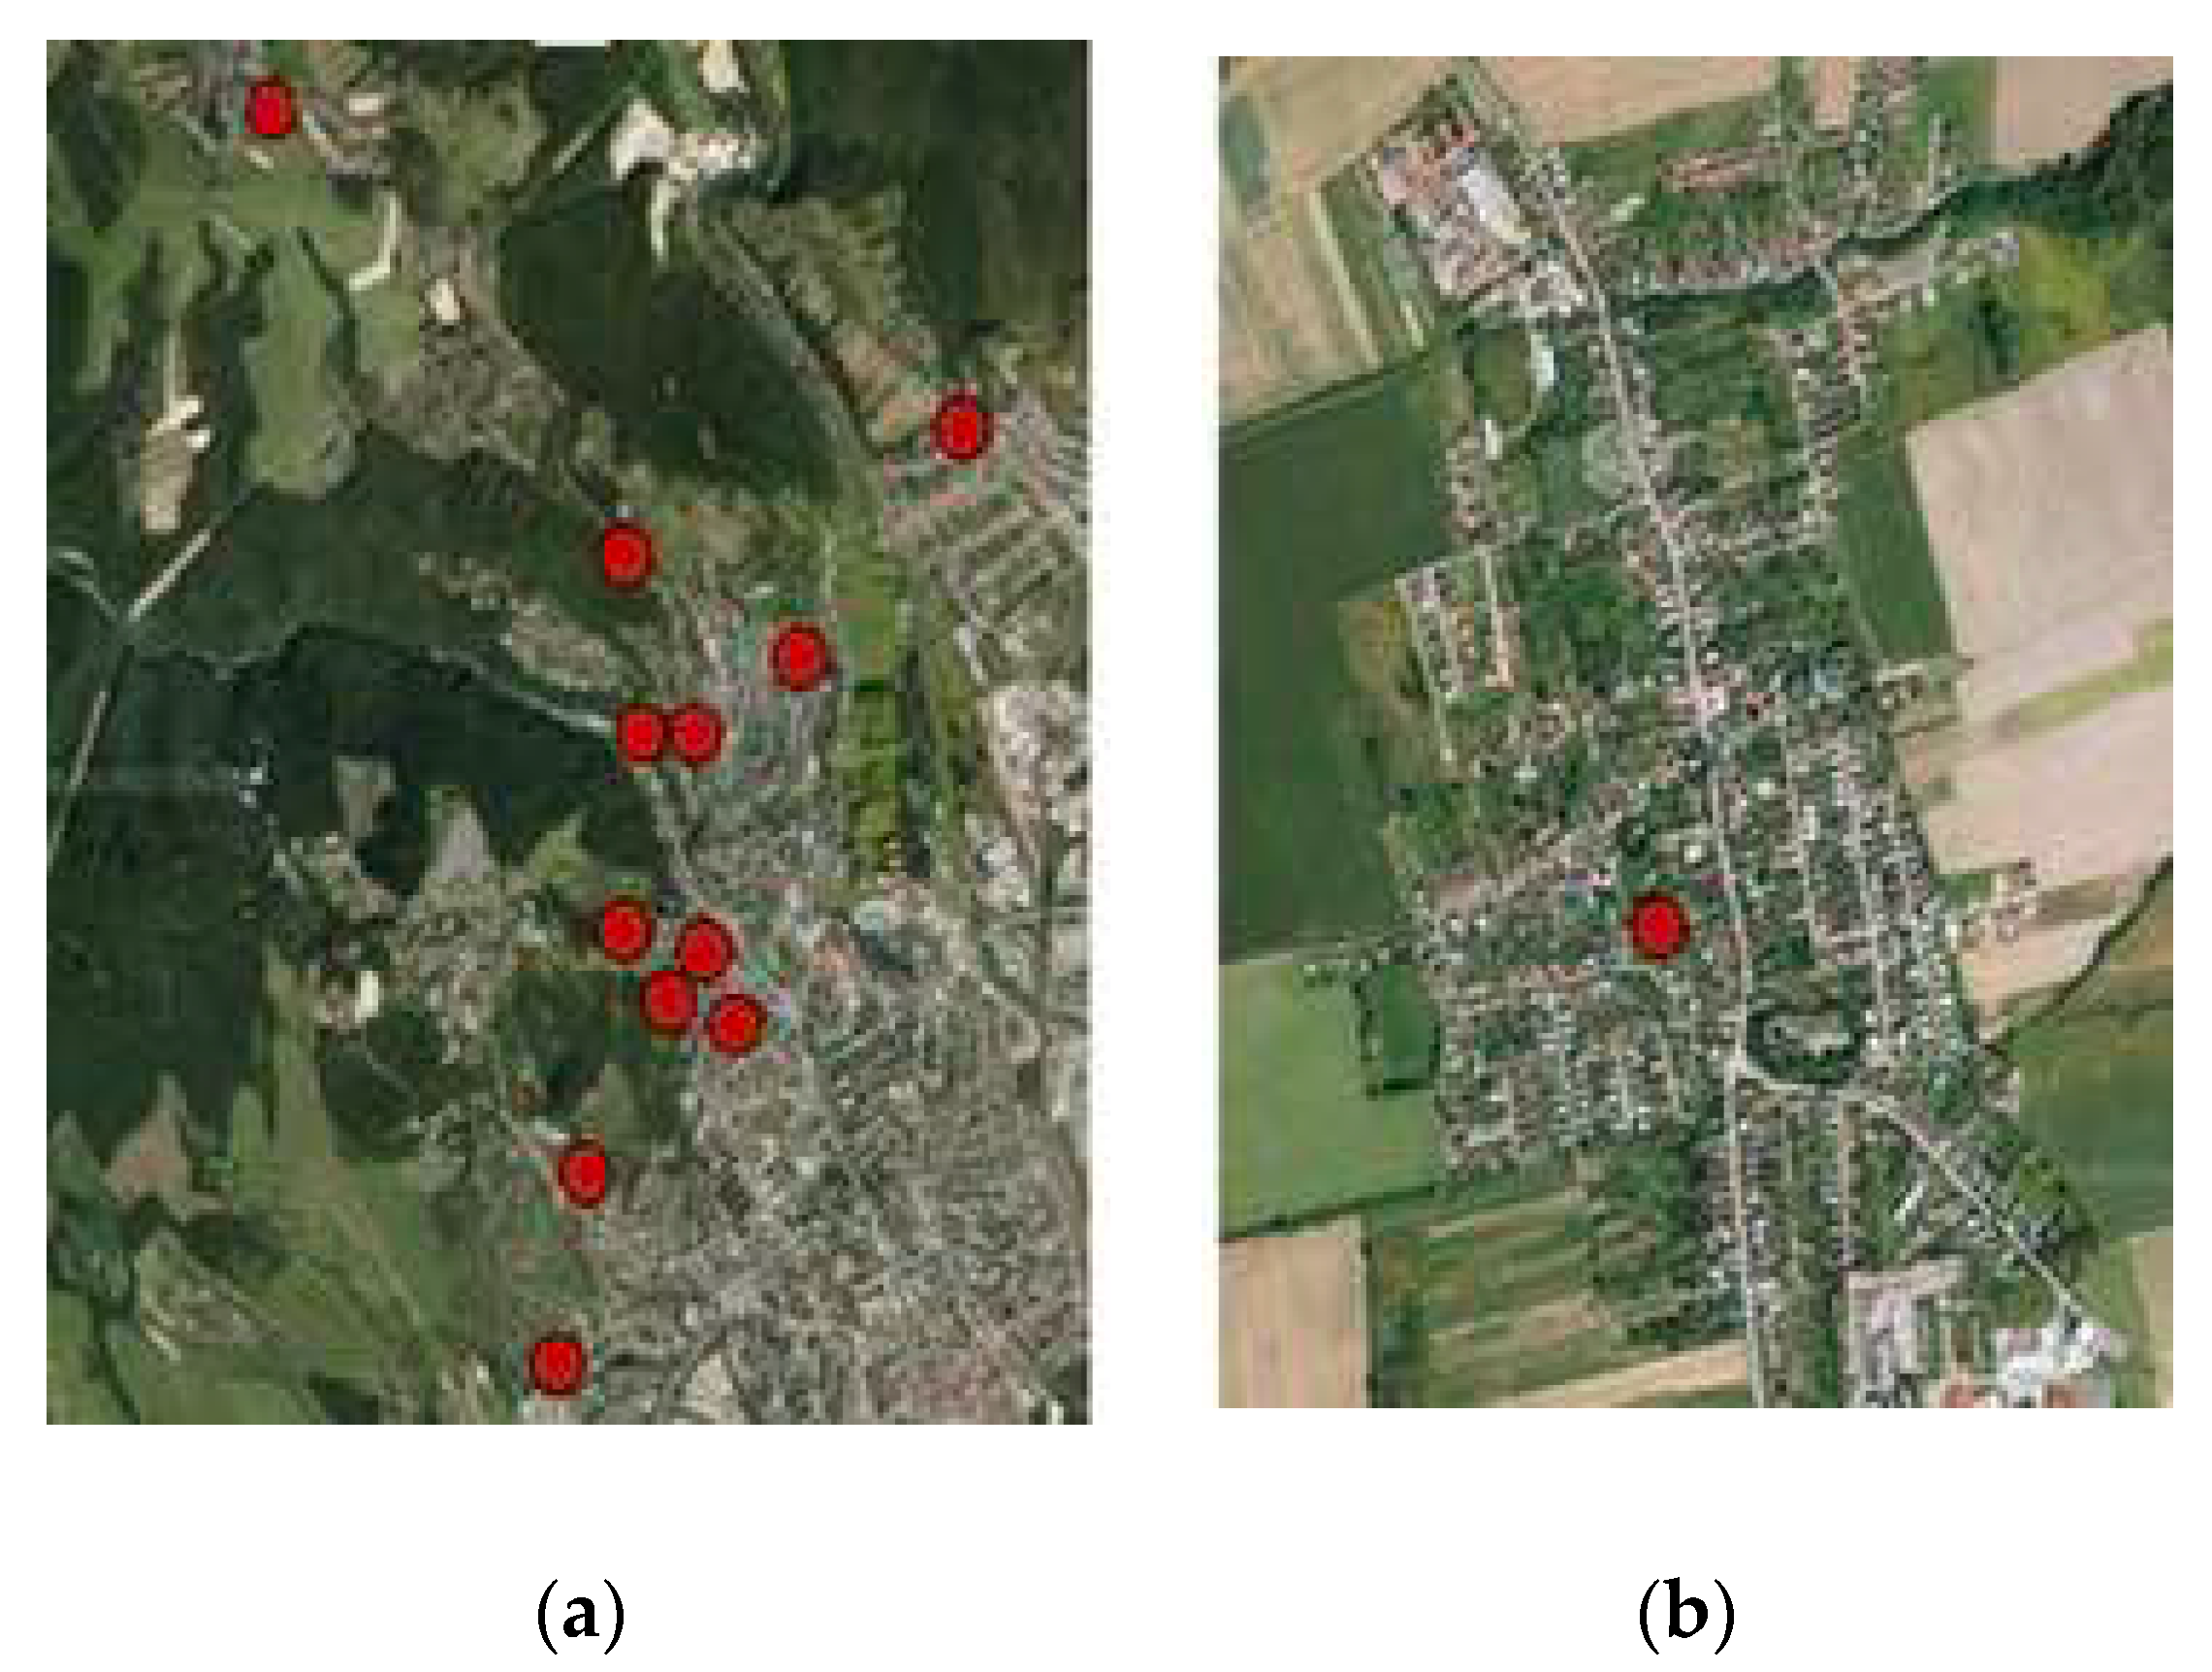
Thirteen low-rise residential family houses located in the eastern part of Slovakia, specifically in the northwestern part of Košice city and in the village of Rozhanovce, were selected for the investigation (Figure 1, Figure 2 and Figure 3).
The Košice region is one of the eight Slovak administrative regions. It consists of 11 districts and 440 municipalities, 17 of which have town status. About one third of the region’s population lives in the agglomeration of Košice due to its main economic and cultural center. The average population density in the region is 117.9 inhabitants per km2, which is very similar to the country’s average (110 per km2). The average price of real estate in the Košice region is 665 €/m2
2.2. Materials
The selection of family houses for the analysis was subject to certain criteria. Family houses occupied for approximately 3 years since the end of the construction were chosen. Simultaneously, the respect for the compatibility of the urban design with local cultural aspects was taken into account. As a basic requirement, the family houses to had to have been built in low-rise residential areas according to the urban zoning plan and not located in a floodplain [30]. The territory where the houses are situated has approximately the same environmental quality level. The houses are located in areas that are characterized by mild to severe territorial conditions for construction and mainly in the peripheral areas of the city and near the forests. The construction sites have different configurations of the terrain (flat land to sloping terrain). The houses needed to meet technical and functional requirements. The architecture of the family houses is typical for the location. For the evaluation, the houses using non-renewable and/or renewable energies were selected. Some of them use rain water for irrigation in the garden, separate the individual waste components and compost the organic waste. Before the assessment of the houses, it was necessary to obtain project documentation on their architecture, building construction, ventilation, heating and cooling, as well as hot water preparation, connection to engineering networks, etc. Further, it was necessary to collect information about the surrounding area, such as the level of the outdoor environment quality, flood territory, the scope for brown-field revitalization and significant transport infrastructure at the site. The obtained drawings, necessary information and technical reports and specifications, available documents, basic information about the characteristics of the houses, construction, HVAC systems, the use of renewable energy systems, amounts of built-in materials (for example from LCA study) and information about the site, etc., were processed. The basic characteristics and information about the evaluated houses are presented in Table 1.
2.3. Methodology
The investigated family houses were evaluated by the building environmental assessment system (BEAS) intended for low-rise residential family houses. BEAS was developed at the Institute of Environmental Engineering at the Technical University of Košice. The proposed fields and indicators of building environmental assessment were stated on the basis of the analysis of the knowledge about the building performance, the European and Slovak standards and the authors’ experience. The six main fields of BEAS are: A—Site Selection and Project Planning; B—Building Construction; C—Indoor Environment; D—Energy Performance; E—Water Management and F—Waste Management. They are divided into subfields and indicators. Each indicator was assigned a determined weight of significance and scales of evaluation (−1 negative, 0 acceptable, 3 good, and 5 best). Each indicator is defined by the purpose of evaluation and by a criterion according to which the assessment is performed. The criteria for the evaluated indicators in all fields are introduced in the study [20]. After the final assessment, the house is certified based on the scale presented in Table 2 [31].
After obtaining the required information, the analysis of the sites, building materials and structures, the energy performance of houses, indoor environmental quality, water consumption and wastes was carried out. A comprehensive analysis, determination of parameters and documentation of the information important for the assessment, as well as the assignment of scores according to the requirements and the methods of each indicator evaluation, were carried out. The assessment itself was performed using Microsoft Excel, in a separate sheet with a key for the rating and certification scale. For each field (A–F), the evaluation method of all the indicators, allocation of points and calculation based on the percentage significance weight of each and every indicator was processed in each sheet. The results are introduced in the final evaluative list through the column graphs and final tables.
3. Results and Discussion
3.1. Site Selection and Project Planning
Choosing a construction site has a major significance in terms of the integration of buildings into the natural environment, with the aim of ensuring the minimal impact on natural resources and ecosystems. The site affects the quality and comfort of the building users in the given environment. Field A—Site selection and project planning of the BEAS assessment system is divided into 14 indicators, each characterized by its purpose and the criterion for a specific assessment (Table 3). Table 4 shows the end results in field A for the evaluated family houses.
Indicator A1 had a negative score (−1) for all houses. The area where the houses are located is, according to the Environmental Regionalization of Slovakia, a strongly disturbed environment [32]. Indicators A2 and A3 had the best score (5) for all houses, because they are not located either in a floodplain or near the potential water body. The houses are not located in brown-field areas but mostly in a densely built-up area (3), and two houses are at green-field sites (0). Indicators which evaluated the distance from the building to the road-traffic infrastructure, to commercial and cultural facilities and to sport and active recreation depend on the location of houses within the town. Five houses are placed in the peripheral part of Košice city, and their distance is more than 1000 m. These houses scored from −1 to 0. Eight houses are placed in the central part of town, with distances between 500 m and 800 m, and had scores of good (3) to best (5). The distance from the houses to public or natural green spaces was evaluated as best (5) for eleven houses, but not for the two houses located in the central part of town, without access to public or natural green spaces. Indicator A9 had the best score (5) for all houses, because their locations had access to engineering network connections, such as water and sewage, electricity and gas. Two houses were evaluated with score (−1) and (3) because their sites had no sewage and gas connections. Indicator A10 had the best score (5) for all the houses because their sites had the possibility of using up to three systems of renewable energy sources (solar and/or photovoltaic panels, heat pumps). Indicator A11, which evaluates the possibility of maximizing passive solar gains by the appropriate orientation of the buildings, scored from (3) to (5) in most of the assessed family houses. The percentage area of the buildings’ glazed surfaces with southeast, south, southwest, and west orientation ranged from 51% to 81%, although two houses achieved a percentage of only 41%. The evaluated family houses are fully compatible with cultural values considering urban design and architecture in the given locality. The assessment of indicator A12 reached scores of 3 to 5 for the houses. The accessibility of transport in the given settlement structure achieved scores from 3 to 5 for indicator A13. The majority of the assessed houses are located near local or tertiary roads. Only one house scored 0 because of its location, near a second-class road. Indicator A14, aimed at ensuring a minimum percentage of green areas, achieved various scores for the houses. Three of them were not provided with the minimum percentage of green space in the total land area (less than 60%) and scored −1. These are houses with a bigger built-up area on a small parcel. Five houses had only the minimum percentage of green space (60% of the total land area) and scored 0. Five houses had more than the minimum percentage of green space (70% to 75%) and scored from 3 to 5. The overall assessment of field A for all family houses, with the results for each and every indicator A1–A14, is summarized in the following graph (Figure 4).
From the end evaluation results, we can acknowledge that the family houses reached levels ranging from 2.15 to 4.16, with an average value of 3.06 and a median value of 3.1. Five houses located in the peripheral part of Košice city reached the lowest credits (−1) for indicators A5, A6 and A7 because of their greater distance to road-traffic infrastructure, to commercial and cultural facilities and to sport and active recreation. Moreover, two houses located in the peripheral part of Košice city had low credits (0) for indicator A4 because the building site is located on a "green-field" site. For this reason, these houses were rated in the range from 2.15 to 2.5. The two houses with the highest scores (4.16 and 3.92) reached this level due to scoring 5 in almost all the indicators in this field. These houses are not in locations at risk of flooding, they are located in the center of town and near to road-traffic infrastructure, to commercial and cultural facilities, to sport and active recreation and public green space; their construction sites have access to engineering network connections (electricity, water and sewerage, gas distribution) and the possibility of exploiting renewable energy sources. These two houses allow the maximum use of passive solar gains because of their appropriate location and the orientation of the buildings, and because they have the biggest percentage of green area out of the total land area.
The overall evaluation shows that only four evaluated houses met the above-mentioned sustainability criteria and received the highest score compared to other buildings. The set requirements concern, in particular, the location of buildings in an urban environment in relation to the protection of natural ecosystems, the reduction of environmental pollution by using public transport, the possibility of connection to public utilities, the use of renewable energy potential and the use of passive solar gain by the appropriate orientation of the rated building.
3.2. Building Construction
Building materials, from resource extraction to manufacturing, use and disposal, have become a major factor in the total human effects on the global ecosystem and climate. Since all manufactured building materials industries are raw material and energy consumers, and produce some degree of waste, they are important targets worldwide for efficiency improvements and environmental pollution reduction. Field B—Building Construction in the BEAS assessment system is divided into two main subfields: B1—Materials and B2—Life cycle of materials. Each of these is characterized by its purpose and criterion for a specific assessment (Table 5). The end results in field B for the evaluated family houses are introduced in Table 6.
Only two family houses reached the highest credit (5) for indicator B1.1 because more than 50% of their built-in products had the marks awarded by the EPD, EU Flower, certified wood (FSC) and others. Other houses had built-in environmentally labeled construction products in the range of 25–50%, or none. This was the reason for achieving low credits, from −1 to 3. The indicator evaluating local materials (such as aggregates, sand, concrete, bricks, steels and glass) achieved score 5 for one house only. Score 3 was achieved by six of the assessed houses. The distance of manufactured materials from the construction site was in the range of 200–400 km. Five houses scored 0 due to distances in the range of 400–600 km. One house used no local materials. Construction products with a share of recyclable building materials above 50% were used in four of the houses, and with a share of 31% to 50% (for instance, materials used as intensive vegetation roofs, with recyclable HDPE and artificial fibers, wood floors, insulation materials) were used in other four houses These family houses achieved high scores (from 3 to 5). Four houses achieved the lowest score (−1) because they did not use recycled materials, and one house used only 25% of recyclables. Twelve houses did not use natural materials such as wood, clay, straw, sheep wool, flax, etc., and they achieved the lowest score (−1) for indicator B1.4. But one house was built as a wooden construction and had a percentage share of natural materials of more than 50%. This house hit the highest score (5) for this indicator. All the houses reached the highest score (5) for the indicator B1.5, evaluating the radioactivity of the building materials. The declared mass activity of 226Ra radionuclide in the construction products and materials built-in did not exceed 100 Bq/kg. The life cycle assessment of materials was found to be different for all the houses. The energy embodied in the building materials of all the assessed houses was more than 2500 MJ/m2, and indicator B2.1 was therefore assessed with a low score (−1) for all of them. The global warming potential was less than 300 kg/m2, and indicator B2.2 was therefore assessed with the highest score, (5) for eight family houses. The other five houses had global warming potential values in the range of 301–500 kg/m2 and scored 3 for this indicator. The acidification potential achieved values of 0.5–1.5 kg/m2 for nine houses, scoring 3 for indicator B2.3. Four houses had acidification potential values higher than 1.6 kg/m2 and were assessed as negative. Based on the end assessment of field B for the houses, Figure 5 shows a summary of results of each and every indicator (B1.1–B2.3).
From the overall results it can be stated that the houses reached levels ranging from 1.21 to 2.83, with an average value of 1.80 and a median value of 1.42.
Five houses with ratings from 2.05 to 2.83 achieved the highest credits (from 3 to 5) for most of the indicators assessed. These houses use environmentally friendly products from local sources and construction products with a lower content of natural radionuclides, and have the greatest share of built-in recycled building materials and products. In terms of life cycle assessment, these houses achieved the best ratings for the global warming potential. The other houses had low scores (from −1 to 0) for more indicators.
The overall assessment of this field shows that the quality of the materials used has a decisive influence in setting the level of sustainability of a given building. Buildings using environmentally friendly building materials, natural materials or recyclable products, or materials from local sources, are environmentally friendly and reduce energy and material flows throughout the life cycle of the building.
3.3. Indoor Environment
Indoor environments contribute significantly to the total human exposure to air pollutants. Indoor air quality is effected by introducing outdoor air indoors; specific indoor pollution sources; and interactions between building structures, building services and occupants. The conditions inside a building—air quality, lighting, thermal conditions, ventilation, sound level, odor, ergonomics and their effects on occupants are encompassed by indoor environmental quality. Strategies for determining indoor environmental quality include those that protect human health, improve the quality of life and reduce stress. Field C—Indoor Environment contains 10 indicators, each characterized by its purpose and criteria for a specific assessment (Table 7). Table 8 shows the results of field C for evaluated houses.
For the evaluation of indicator C1, the criterion is the design value of the operative temperature based on the requirements of EN 16798:2019. The operative temperature in five houses achieved values in the range of 20 °C to 21 °C, and one house achieved a value higher than 21 °C during the heating season. These houses achieved scores from 3 to 5. Seven houses achieved operative temperature values in the range of (θo < 18 °C to θo ≥ 21 °C) during the heating season, and they scored 0. For indicator C2, the design value of the operative temperature met the requirements based on EN 16798:2019 [33] during the cooling season, and the houses achieved scores from 0 to 5. One house met this requirement in all living rooms. Five houses exceeded the minimum requirements, and seven houses achieved the minimum requirements in some living rooms. Nine houses with natural ventilation had a total area of openings from at least 5% to 10% of the total floor area, and more than 75% to 90% of the space with ventilation from the top down. These houses scored from 3 to 5. Four houses with mechanical ventilation met and exceeded the minimum requirements of the STN EN 16798:2019 and scored 5. All the family houses were evaluated with the highest score (5) for indicator C4, meeting the requirement for noise attenuation through the exterior envelope in residential areas of cities based on Slovak standard STN 73 0532 (Quality class of sound insulation ≥ 4). Four family houses exceeded the minimum requirements according to Slovak standard STN 73 0532 for the evaluation of noise attenuation between all the rooms of the house, and therefore scored 5. Four houses exceeded the minimum requirements for noise attenuation and scored 3. Five houses fulfilled only the minimum requirements for noise attenuation between rooms and scored 0. The design of the glazed structures of all the houses complied with the daylight requirements defined by STN 73 0532. Eleven houses had scores from 3 to 5 because the total area of the windows was 2/10 to 3/10 of the floor area of the rooms in the assessed houses. Five houses were designed with the most appropriate shielding elements and were rated with scores of 5 for indicator C7. Eight houses were designed with minimum to adequate shielding elements and were rated with scores from 0 to 3. In all the evaluated houses the level and quality of illuminance was high for the occupancy and scored 5 for this indicator (C8). The majority of the houses had no or less than 75% of interior materials (including paint, sealants, adhesives, carpets and composite wood products) chosen for their low volatile organic compound (VOC) emissions, and wood products containing urea formaldehyde resins were not used. These houses scored 0. Only three houses had all interior materials chosen for having low or no VOC emissions and no wood products containing urea formaldehyde resins, and they scored from 3 to 5. The indicator C10, which rates isolated spaces or rooms with potential pollutants, reached the highest score (5) for five of the houses. These had garages outside the house, or a built-in garage ventilated with a CO2 sensor. Most of the houses achieved scores of 0 due to having a built-in garage ventilated and functionally connected with indoor spaces, with the required door panel but without a CO2 sensor. Based on the end assessment of the family houses in field C, Figure 6 summarizes the results for all the indicators C1–C10.
The overall results indicate that the houses reached levels ranging from 0.90 to 5.0, with an average value of 2.62 and a median value of 2.20. Only three houses with ratings ranging from 3.40 to 5.0 achieved the highest scores (from 3 to 5) in most of the indicators assessed. These houses fulfilled and exceeded the minimum requirements for the design value of the operative temperature based on EN 16798:2019. They were mechanically ventilated and had ensured that the required air exchange and the design requirements of EN 16798:2019 were met. Shielding measures to prevent glare in interior spaces, such as automatic horizontal aluminum exterior blinds or wooden exterior blinds as the most appropriate shielding elements, were designed. These houses had detached garages, ventilated and isolated from the users’ premises. The other houses achieved rates from 0.9 to 3.2 and were evaluated with low scores for more indicators. In study [34] the best practice Estonian buildings were assessed with Estonians standards, LEED and BREEAM. According to the results, thermal and visual comfort, ventilation flow rate and the acoustic performance were well met, as in our study. The failure to achieve the highest results was due to the indicator related to VOC emissions. As mentioned in our study, the majority of the houses had no or less than 75% of interior materials with low emissions of VOC.
The overall assessment of this field shows that indoor air quality is affected by physical and chemical factors in the indoor environment. By meeting the requirements of standards and legislation in the design of buildings, targeted selection of low-emission interior materials and prevention of the transfer of pollutants to the user’s premises, the criteria for ensuring the quality of the indoor environment are achieved.
3.4. Energy Performance
The energy efficiency of buildings begins with a focus on design that reduces overall energy needs, such as building orientation and glazing selection, as well as the selection of climate-appropriate building materials. Further strategies which reduce a building’s energy use include passive heating and cooling, natural ventilation and high-efficiency HVAC systems partnered with smart controls. Field D—Energy Performance is divided into three main subfields: D1—Operation energy, D2—Active systems using renewable energy sources and D3—Energy management. Each of these subfields is characterized by its purpose and criterion for a specific assessment (Table 9). The critical analysis in study [5] states that the Energy category, energy efficiency, carbon emissions reduction and renewable energy credits are taken into account in most green building rating systems. Moreover, BREEAM, LEEDv4, GSAS and Estidama highlight commissioning, measurement and verification, emphasizing the importance of performance monitoring and testing. The impact of lighting systems has been addressed in all the methods. However, demand-based control and the automation aspect are evaluated in LEED, Estidama and GSAS through different approaches.
The end results of field D for the evaluated family houses are presented in Table 10.
Six houses achieved the highest score (5) for indicator D1.1, having energy class A for heating according to the Law No. 555/2005 on the energy performance of buildings. Seven houses reached energy class B for heating and were evaluated with a score of 3. For indicator D1.2, which rates the class of energy for domestic hot water (Law No. 555/2005 on the energy performance of buildings), the highest score was achieved by eight family houses with energy class A. Four houses with energy class B were evaluated with a score of 3. One house scored 0, with energy class C. Eight of the houses did not use a mechanical ventilation system or cooling system and were evaluated with a score of −1 for indicator D1.3. Two houses used a cooling system but no mechanical ventilation, so they were evaluated with a score of 0. Three houses obtained the highest score (5) because they used a mechanical ventilation system with air treatment. For indicator D1.4, which evaluates light intensity control, high scores were achieved in eight houses. Light intensity control was ensured in 80–100% of the occupancy areas in these houses. Five houses did not have light intensity control. Indicator D1.5 evaluates electrical appliances which should have low energy consumption. The energy class of the appliances in the assessed houses was in energy class A, and 1/3 of the appliances were in energy class B. Indicators D2.1, D2.2 and D2.3, which evaluate active systems using renewable energy sources, achieved different scores. Four houses used a heat pump for heating and hot water preparation, which covers more than 75% of the energy consumption, while a solar system and heat recuperation uses more than 75% of the waste heat. These houses got the highest score (5). Other houses did not use active systems with renewable energy sources and had the lowest score (−1). Only four houses had energy management systems in the three components established and had the highest score (5) for indicator D3. The other houses had no energy management system and therefore achieved scores of −1. In pursuance of the overall assessment of the houses in field D, Figure 7 summarizes the results for the individual indicators D1.1–D3.1.
From the overall results, it can be stated that the houses scored from 0.41 to 4.25, with an average value of 2.07 and a median value of 1.64. Only four houses with ratings from 2.99 to 4.25 achieved the highest scores (from 3 to 5) for most of the indicators assessed. These houses had the best ratings for the energy class for heating, domestic hot water and for all appliances (Law No. 555/2005 on the energy performance of buildings), and they used a mechanical ventilation system with air treatment, a solar system, heat recuperation and an energy management system. Controlling the intensity of light in occupancy areas leads to a reduction of energy consumption. The other houses achieved rates from 0.41 to 1.97 and had low scores for many indicators.
The overall assessment shows that the criteria for achieving the principles of sustainability are compliance with the legislation on the energy performance of buildings, the use of active renewable energy systems and the introduction of an energy management system using highly efficient technical systems in conjunction with intelligent controls.
3.5. Water Management
The conservation and environmentally suitable reuse of water are important for the assessment of water efficiency in building assessment systems. This category supports sustainable water use in the operation of the building and its site. The evaluation of this field relates to water efficiency and reduction in potable water, conserving and reusing storm water, maintaining an appropriate level of water quality in the building, reduction of off-site treatment of wastewater and the use of a separated water system. Field E—Water Management is divided into four subfields and indicators, each characterized by its purpose and criterion for a specific assessment (Table 11). According to the mentioned study [5], BREEAM is more oriented to water monitoring, flooding and stormwater. LEED, Estidama and GSAS prioritize water use reduction in addition to waste water reuse. The flood risk aspect is only considered in BREEAM, but in BEAS it is considered in field A (Site selection and project planning). The end results of field E for the evaluated family houses are introduced in Table 12.
Considering the field of water management, the highest score (5) was hit by two houses for the indicator E1, that rates the reduction and regulation of water flow in water systems. These houses were designed with high quality equipment to reduce and control the water flow in the armatures and flush toilets. Six houses were designed with equipment to reduce and control the water flow and achieved scores of 3. The other houses did not have devices for reducing and regulating water flow nor were designed with equipment to reduce and control the water flow only in the armatures. For indicator E2, seven houses achieved the highest score (5), having quality management systems of water from surface runoff and capturing water from the surface runoff in a storage tank to be used for irrigation. Six houses did not capture water from surface runoff but discharged it into a single or rainwater sewerage, and therefore scored 0. They were all supplied with a needed amount of high quality fresh water. For this indicator (E3), all the houses were assessed with score 5. None of the evaluated family houses used a split potable and grey water system, so this indicator (E4) had the lowest score (−1) in all houses. In pursuance of the overall assessment of the houses in field E, Figure 8 summarizes the results of the individual indicators E1–E4.
From the overall results, we can acknowledge that the houses reached values in the range of 1.25 to 3.51, with an average value of 2.34 and a median value of 2.31.
Five houses with ratings from 3.11 to 3.51 achieved the highest credits (from 3 to 5). They had the best ratings due to using the reduction and regulation of water flow in water systems, the water management of surface runoff, and being supplied with a needed amount of high quality fresh water. The other houses were rated from 1.25 to 2.51 and were evaluated with low scores for more indicators.
The assessment of the water management of the assessed buildings shows that by meeting the criteria for reducing drinking water use, implementing rainwater drainage management and ensuring sufficient drinking water for the building, it is possible to achieve sustainability in river basin and groundwater protection and waste water. When evaluating a divided system of drinking water and gray water, it is not technically possible to meet the set criteria.
3.6. Waste Management
The reduction of the construction and demolition waste disposed of in landfills and incineration facilities by recovering, reusing and recycling materials is strongly considered in the field of waste management. Planning for construction waste management before construction gives time to identify the most efficient waste diversion strategies available. The evaluation of waste management must ensure that waste generated by building users is minimized and encourage better waste management. Field F—Waste Management is divided into three subfields, each characterized by its purpose and criterion for a specific assessment (Table 13). The end results of field F for the evaluated family houses are presented in Table 14.
Based on the assessment of the individual indicators, we can see that all the houses have plans for the disposal of the waste originated from the construction process. Indicator F1 was assessed with scores of 3 in eight houses because they had detailed waste management plans. Five houses had only a general waste disposal plan and had low scores (0). In the majority of the houses, the separate collection of the three to four types of municipal waste (paper, plastic, glass and metal) was ensured, and these houses scored from 0 to 3. Two houses did not have separate collection of waste components and scored −1. One house had separate collection of five components of municipal waste (paper, plastic, glass, metal and biodegradable waste) and scored 5. A score of −1 was also hit for the indicator F3, that evaluated measures to minimize emissions resulting from air pollution sources. All the houses had a small built-in source of air pollution (fireplace with solid fuel), and for this reason the lowest score. In pursuance of the overall assessment of field F for the houses, Figure 9 summarizes the results of the individual indicators F1–F3.
From the overall results, it can be stated that the houses reached levels from −0.69 to 2.34, with an average value of 0.79 and a median value of 0.71. Only four houses with ratings from 1.64 to 2.34 achieved higher credits (3 and 5) for most of the indicators assessed. These houses had a waste management plan for the construction phase and separate collection of four to five municipal waste components. The other houses achieved rates from −0.69 to 0.71 and were also evaluated with low scores for more indicators.
The assessment of waste management shows that sustainability criteria can be achieved by complying with the legislation on waste management and introducing measures to minimize the generation of waste during the operation of the building and to minimize emissions from air pollution sources.
3.7. Overall Results
According to the overall assessment, a total score was obtained for each house, and each was then classified by the aforementioned certification scale. The method for calculating the total score is explained below. When evaluating a specific indicator, the fulfillment of the set criteria needs to be assessed. The fulfillment of the criteria was divided into four levels. If the requirement of the criterion was not met, credit −1 is awarded. If the minimum requirements were met, it was an acceptable rating and credit 0 was awarded; if the minimum requirements of the set criterion were exceeded, the rating level was good and credit 3 was awarded; and for sustainability criterion, credit 5 was assigned. Based on the allocated credits, a calculation was performed in Microsoft Excel to obtain a given number of points according to the weight of significance of each indicator. In each field, which was processed in a separate sheet of Microsoft Excel, the total number of points was then assigned according to the significance weight of the field. The evaluation fields (A–F) had a determinate percentage of significance weight. Field A was determined by a significance weight of 14.71%, B of 20.59%, C of 23.56%, D of 26.47%, E of 8.88% and F of 5.88%. From the overall assessment, family houses were certified according to the following scale: if the evaluated house reached the total number of points in the range of −1 to 0, it was assessed as unacceptable (Unacceptable building); if a house reached point 0, it was assessed as acceptable (BEAS CERTFIED); when the number of points was reached in the range of 0.1 to 1.5, the house was considered acceptable (BEAS BRONZE); when the number of points was in the range of 1.5 to 3, the house was assessed as good (BEAS SILVER); for reaching points in the range of 3 to 4, the house was assessed as better (BEAS GOLD); and for the points from 4 to 5, the house was assessed as sustainable (BEAS PLATINUM). Table 15 presents the example of the evaluation of a selected indicator—allocation of points and calculation based on the percentage weight of significance of the indicator.
Detailed information about the final evaluation of the houses in the different fields is presented in Table 16, and a comparison of the total results for each house is shown in Figure 10.
From Table 16 and Figure 10, it can be seen that the family houses obtained a total score ranging from 1.10 to 3.87. The lowest overall score was for FH9, with a value of 1.10, which was certified as BEAS BRONZE. This house reached low ratings in several of the assessed fields compared with other houses, especially in the fields of C—Indoor environment (0.90), D—Energy performance (0.80) and the lowest rating for F–Waste management (−0.69).
Ten houses (FH 1,2,3,4,6,7,8,10,11,12) reached a total score ranging from 1.56 to 2.88 and were therefore certified as BEAS SILVER. These houses reached higher ratings than FH9 in all the assessed fields. In the fields B–Building construction and D—Energy performance, lower values or a wider range of values were achieved, from 1.21 to 2.80, and 0.41 to 4.25, respectively. Field F saw the lowest rating, with values ranging from −0.69 to 1.64. In fields A–Site selection and project planning, C—Indoor environment and E—Water management, these houses achieved higher ratings.
Two houses (FH5 and FH13) achieved a total score ranging from 3.59 to 3.87 and were thus certified as BEAS GOLD. They had the highest ratings for fields C—Indoor environment (4.2–5.0), D—Energy performance (4.10–4.25) and A–Site selection and project planning (3.65–4.16).
The limiting factor of this study is the lack of a statistically significant number of evaluated family houses as well as the location of the family houses (eastern part of Slovakia). Yet our study also confirms that sustainable building design is inevitable through the selection of highly durable and less energy-intensive materials, reducing environmental degradation in an economically and socially viable manner [35]. The quantification of the environmental impacts of a building can help decision makers to identify major environmental impacts. Therefore, it can be used since the early stages of design to support decision making processes which aim to promote sustainable buildings [36]. Study [37] states that to deliver an effective comprehensive assessment method, appropriate criteria for a region/country need to be identified and each criterion needs to be given proper weight. A new dimension of social sustainability in residential buildings is lacking, even though modern tools and systems of building sustainability assessment are being developed [38]. It has long been discussed whether the tools and their results can be compared. This seems to be difficult, on even impossible, for the tools are designed to assess individual phases of the life cycle as well as different types of buildings, and they are based on different databases, guidelines and questionnaires [39]. They all use different criteria in the environmental assessment of a building and different indicators corresponding to these criteria. Sometimes, criteria and indicators are not differentiated, but rather confusingly used as synonyms [40]. Strategies for sustainable and/or green buildings have been founded on two basic principles: energy efficiency and environmental responsibility [41]. In recent years, building health is becoming increasingly important, as the health of a building is directly related to the safety and health of the users. A scientific evaluation of building health can help to assess building health issues and to avoid the catastrophic consequences of building system failure [42]. Achieving sustainable buildings is a challenging task. Building sustainability involves “green building” design and construction, and paying attention to both environmental issues and economic benefits, along with social obligations toward the society we live in [43]. Sustainable housing has profound effects on human beings’ lives and well-being [44].
4. Conclusions
Sustainable construction is becoming a pressing topic in Slovakia. The design and construction of sustainable buildings is closely related to their sustainability certification. In this regard, attention has been paid mainly to office buildings. However, key sustainability criteria are also taken into account in the design and construction of family houses. The aim of this paper was to ascertain the extent to which these criteria are met. Based on the evaluation of 13 family houses, it was found that only two of them reached the best rating (BEAS GOLD), ten were at the BEAS SILVER level and one was at the lowest level (BEAS BRONZE). The results show that the weakest fields of sustainability are Waste management, Energy performance and Building construction, in that order. Slovak legislation related to waste management (Act No. 79/2015 Coll. on waste) is applied, but active support from governmental institutions is practically non-existent. This also applies to incentives for citizens regarding waste separation, recycling and other sustainable waste management methods. As for energy performance, Slovakia is at the beginning of the process of implementing the use of renewable energy sources in the construction of family houses. This support is currently only in the form of a financial subsidy for the purchase of technology using renewable energy sources. The evaluation of the field Building construction shows that only a few houses have built-in natural materials, recyclable products, materials from local sources or building products which reduce energy and material flows throughout the life cycle of the building. The indicators for those fields achieved the lowest ratings in all the houses assessed. The best-rated fields are Site Selection and Project Planning, Indoor Environment and Water Management, in that order. Therefore, it is essential to pay more attention to those areas where the sustainability principles have not been reached, and as early as the design and documentation stage. Therefore, it is necessary to raise project teams’ awareness of sustainability issues and subsequently to transfer them to building practice.
In the near future, we will evaluate other family houses, built in the last two or three years, but also older. Then, we will be happy to present and compare these houses, discuss how the situation in Slovakia has changed and what level of certification has been achieved (for a sufficient number of houses).
Author Contributions
Conceptualization, S.V.; investigation, I.S.; methodology, S.V.; formal analysis, A.S.; supervision, S.V.; validation, E.K.B.; writing—original draft, I.S.; writing—review & editing, D.B. All authors have read and agreed to the published version of the manuscript.
Funding
This research was funded by the Grant Agency of the Slovak Republic, grant number APVV-18-0360 ACHIEve.
Acknowledgments
This study was supported by the Grant Agency of the Slovak Republic for the support of projects no. 1/0512/20 and 1/0697/17, APVV-18-0360 ACHIEve.
Conflicts of Interest
The authors declare no conflicts of interest.
Nomenclature
| BEAS | Building Environmental Assessment System |
| BREEAM | Building Research Establishment Environmental Assessment Method |
| CWM | construction waste management |
| EE | embodied energy |
| ECO2 | global warming potential (GWP) |
| ESO2 | acidification potential (AP) |
| EF | ecological footprint |
| EMoC | environmental model of construction |
| FSC | Forest Stewardship Council |
| GHG | greenhouse gas |
| HDPE | high-density polyethylene |
| LCA | Life Cycle Assessment |
| LCIA | Life Cycle Impact Assessment |
| LEED | Leadership in Energy and Environmental Design |
| MFA | material flow analysis |
| NRE | non-renewable energy |
| STN | Slovak Technical Normalization |
| TVOC | total volatile organic compounds |
| Ug | heat transfer coefficient of glass [W/(m2.K)] |
| θo | operative temperature [°C] |
References
- Brundtland, G. Our Common Future: Report of the 1987 World Commission on Environment and Development; Oxford University Press: Oxford, UK, 1987; p. 59. [Google Scholar]
- WGBC. Available online: https://worldgbc.org/what-green-building (accessed on 20 February 2020).
- EPA. Available online: https://archive.epa.gov/greenbuilding/web/html/about.html (accessed on 20 February 2020).
- Berardi, U. Clarifying the new interpretations of the concept of sustainable building. Sustain. Cities Soc. 2013, 8, 72–78. [Google Scholar] [CrossRef]
- Awadh, O. Sustainability and green building rating systems: LEED, BREEAM, GSAS and Estidama critical analysis. J. Build. Eng. 2017, 11, 25–29. [Google Scholar] [CrossRef]
- Bragança, L.; Mateus, R.; Koukkari, H. Building sustainability assessment. Sustainability 2010, 2, 2010–2023. [Google Scholar] [CrossRef] [Green Version]
- Cole, R.J. Emerging trends in building environmental assessment methods. Build. Res. Inf. 1998, 26, 3–16. [Google Scholar] [CrossRef]
- Mattinzioli, T.; Sol-Sánchez, M.; Moreno, B.; Alegre, J.; Martínez, G. Sustainable building rating systems: A critical review for achieving a common consensus. Crit. Rev. Environ. Sci. Technol. 2020, 1–13. [Google Scholar] [CrossRef]
- BREEAM. Available online: https://www.breeam.com/ (accessed on 20 February 2020).
- USGBC. Available online: https://new.usgbc.org/leed (accessed on 20 February 2020).
- CASBEE. Available online: http://www.ibec.or.jp/CASBEE/english/ (accessed on 20 February 2020).
- IISBE. Available online: http://www.iisbe.org/sbmethod (accessed on 20 February 2020).
- Miljöbyggnad. Available online: https://www.sgbc.se/certifiering/miljobyggnad/ (accessed on 20 February 2020).
- GBIG. Available online: http://www.gbig.org/collections/14970 (accessed on 20 February 2020).
- Green Star. Available online: https://new.gbca.org.au/green-star/ (accessed on 20 February 2020).
- Building and Construction Authority. Available online: https://www.bca.gov.sg/greenmark/green_mark_buildings.html (accessed on 20 February 2020).
- Asdrubali, F.; Baldinelli, G.; Bianchi, F.; Sambuco, S. A comparison between environmental sustainability rating systems LEED and ITACA for residential buildings. Build. Environ. 2015, 86, 98–108. [Google Scholar] [CrossRef]
- NABERS. Available online: https://www.nabers.gov.au/ (accessed on 20 February 2020).
- Krajcsovics, L.; Pifko, H.; Jurenka, H. Building Sustainability Assessment Method CESBA in Slovak Conditions. In Proceedings of the 13th International Multidisciplinary Scientific Geoconference: Nano, bio and green–technologies for a sustainable future (SGEM2015), Albena, Bulgaria, 18–24 June 2015; Volume 2, pp. 385–389. [Google Scholar]
- Vilcekova, S.; Kridlova Burdova, E. Environmental Assessment of Building. Civil Engineering Faculty; Institute of Environmental Engineering: Kosice, Slovakia, 2010; ISBN 978-80-553-0361-1. [Google Scholar]
- Doan, D.T.; Ghaffarianhoseini, A.; Naismith, N.; Zhang, T.; Ghaffarianhoseini, A.; Tookey, J. A critical comparison of green building rating systems. Build. Environ. 2017, 123, 243–260. [Google Scholar] [CrossRef]
- Suzer, O. Analyzing the compliance and correlation of LEED and BREEAM by conducting a criteria-based comparative analysis and evaluating dual-certified projects. Build. Environ. 2019, 147, 158–170. [Google Scholar] [CrossRef]
- Alwisy, A.; BuHamdan, S.; Gül, M. Criteria-based ranking of green building design factors according to leading rating systems. Energy Build. 2018, 178, 347–359. [Google Scholar] [CrossRef]
- Jang, D.C.; Kim, B.; Kim, S.H. The effect of green building certification on potential tenants’ willingness to rent space in a building. J. Clean. Prod. 2018, 194, 645–655. [Google Scholar] [CrossRef]
- Wiley, J.A.; Benefield, J.D.; Johnson, K.H. Green design and the market for commercial office space. J. Real Estate Financ. Econ. 2010, 41, 228–243. [Google Scholar] [CrossRef]
- Zhang, L.; Liu, H.; Wu, J. The price premium for green-labelled housing: Evidence from China. Urban Stud. 2017, 54, 3524–3541. [Google Scholar] [CrossRef]
- Liu, Y.; Wang, Z.; Lin, B.; Hong, J.; Zhu, Y. Occupant satisfaction in Three-Star-certified office buildings based on comparative study using LEED and BREEAM. Build. Environ. 2018, 132, 1–10. [Google Scholar] [CrossRef]
- Altomonte, S.; Schiavon, S. Occupant satisfaction in LEED and non-LEED certified buildings. Build. Environ. 2013, 68, 66–76. [Google Scholar] [CrossRef]
- Sant’Anna, D.O.; Dos Santos, P.H.; Vianna, N.S.; Romero, M.A. Indoor environmental quality perception and users’ satisfaction of conventional and green buildings in Brazil. Sustain. Cities Soc. 2018, 43, 95–110. [Google Scholar] [CrossRef]
- Urban Zoning Plan City of Kosice. Available online: http://www.kosice.sk/static/up_2013_V-3.htm (accessed on 20 February 2020).
- Vilcekova, S.; Selecka, I.; Kridlova Burdova, E.; Meciarova, L. Interlinked sustainability aspects of low-rise residential family house development in Slovakia. Sustainability 2018, 10, 3966. [Google Scholar] [CrossRef] [Green Version]
- Environmental Regionalization of Slovakia. Report on the State of the Environment of the Slovak Republic in 2015. Available online: http://enviroportal.sk/spravy/detail/224 (accessed on 20 February 2020).
- EN 16798-1: 2019. Energy Performance of Buildings. Ventilation for Buildings. Part 1: Indoor Environmental Input Parameters for Design and Assessment of Energy Performance of Buildings Addressing Indoor Air Quality, Thermal Environment, Lighting and Acoustics. Module M1-6; BSI: London, UK, 2019. [Google Scholar]
- Seinrea, E.; Kurnitski, J.; Voll, H. Building sustainability objective assessment in Estonian context and a comparative evaluation with LEED and BREEAM. Build Environ. 2014, 82, 110–120. [Google Scholar] [CrossRef]
- Janjua, S.Y.; Sarker, P.K.; Biswas, W.K. Sustainability Assessment of a Residential Building using a Life Cycle Assessment Approach. Chem. Eng. Trans. 2019, 72, 19–24. [Google Scholar]
- Mateus, R.; Braganca, L. Life-Cycle Assessment of Residential Buildings. Available online: https://pdfs.semanticscholar.org/3910/090c3c525571961a2738cddd9c36c8f64cb4.pdf (accessed on 10 August 2020).
- Alyami, S.H.; Rezgui, Y. Sustainable building assessment tool development approach. Sustain. Cities Soc. 2012, 5, 52–62. [Google Scholar] [CrossRef]
- Ahmad, T.; Thaheem, M.J. Developing a residential building-related social sustainability assessment framework and its implications for BIM. Sustain. Cities Soc. 2016, 26, 1–15. [Google Scholar] [CrossRef]
- Haapio, A.; Viitaniemi, P. A critical review of building environmental assessment tools. Environ. Impact Assess. Rev. 2008, 28, 469–482. [Google Scholar] [CrossRef]
- Haapio, A. Environmental Assessment of Buildings. TKK Reports in Forest Products Technology, Series A2; Helsinki University of Technology: Helsinki, Finland, 2008; p. 41. [Google Scholar]
- Castellano, J.; Ribera, A.; Ciurana, J. Integrated system approach to evaluate social, environmental andeconomics impacts of buildings for users of housings. Energy Build. 2016, 123, 106–118. [Google Scholar] [CrossRef]
- Ding, Z.; Niu, J.; Liu, S.; Wu, H.; Zuo, J. An approach integrating geographic information system and building. J. Clean. Prod. 2020, 257, 120532. [Google Scholar] [CrossRef]
- Janjua, A.Y.; Sarker, P.K.; Biswas, W.K. A Review of Residential Buildings’ Sustainability Performance Using a Life Cycle Assessment Approach. J. Sustain. Res. 2019, 1, 190006. [Google Scholar]
- Ding, G.C. Environmental Assessment of Residential Buildings in China. In Proceedings of the 2008 World Sustainable Building Conference, Melbourne, Australia, 21–25 September 2008; pp. 494–501. [Google Scholar]
Figure 1.
Location of selected family houses in Slovakia (Google Maps 2020).

Figure 2.
Location of family houses in Košice and Rozhanovce (Google Maps 2020).

Figure 3.
Location of each family house in the northwestern part of the town of Košice (a) and in the center of Rozhanovce (b) (Google Maps 2020).
Figure 3.
Location of each family house in the northwestern part of the town of Košice (a) and in the center of Rozhanovce (b) (Google Maps 2020).

Figure 4.
Results of family houses assessment in field A.

Figure 5.
Results of family houses assessment in field B.

Figure 6.
Results of family houses assessment in field C.

Figure 7.
Results of family houses assessment in field D.

Figure 8.
Results of family houses assessment in field E.

Figure 9.
Results of family houses assessment in field F.

Figure 10.
Total results of evaluated family houses by BEAS.


Table 1.
Basic characteristics of family houses.
| Family Houses | Design and Construction of Evaluated Family Houses | |||||||
|---|---|---|---|---|---|---|---|---|
| Foundations | External Walls, Surface Finishes | Ceiling Structure | Roof Construction, Roof Covering | Interior Walls, Surface Finishes of Walls | Floor and Ceiling Surface Finishes | Insulation of Ground Floor, External Walls and Roof | Windows | |
FH1 Built-up area: 111.0 m2 Useful floor area: 211.5 m2 Built-up volume: 613.4 m3 Number of floors: two-story building without basement | reinforced concrete foundation strip | aerated concrete blocks (375 mm); external plaster | reinforced concrete slabs (200 mm) | saddle roof, wood structure, lightweight asphalt-board | gypsum plasterboard (150 mm), lime plaster and ceramic tiles | floors—wooden floor, ceramic tiles, linoleum, ceilings—gypsum plaster, plasterboard | ground floor—waterproofing PVC, polystyrene (100 mm), external walls—without insulation, roof—mineral wool (300 mm) | plastic windows, triple glazing, horizontal plastic interior blinds |
| Heating or cooling, ventilation—electric heating by low-temperature radiant ceiling panels, hot water fireplace, natural ventilation; Connection to engineering networks—electrical and water connection, cesspool. | ||||||||
FH 2 Built-up area: 296.0 m2 Useful floor area: 278.2 m2 Built-up volume: 1185.6 m3 Number of floors: single-story building with basement | reinforced concrete foundation strip | ceramic blocks, reinforced concrete walls (250–300 mm); silicate exterior plaster, stone cladding | reinforced concrete slabs (200 mm) | flat roof, reinforced concrete slabs, extensive and intensive vegetation roof | sandwich construction from plasterboard, mineral wool (150 mm), gypsum plaster and ceramic tiles | floors—wooden floor, ceramic tiles, linoleum, concrete paving, ceilings—plasterboard, architectural concrete | ground floor—2 × geotextile, waterproofing PVC, expanded polystyrene (350 mm) external walls—mineral wool (200 mm), roof—expanded polystyrene (200 mm), waterproofing PVC, protective fabrics of artificial fibers, drainage foil, filtration textile | aluminum windows, triple glazing, horizontal aluminum exterior blinds |
| Heating or cooling, ventilation—floor and ceiling heating by earth-water type heat pump, fireplace, ceiling cooling—dry system, natural ventilation; Connection to engineering networks—electrical, sewage and water connection. | ||||||||
FH 3 Built-up area: 248.5 m2 Useful floor area: 445.1 m2 Built-up volume: 1693.7 m3 Number of floors: two-story building with basement | reinforced concrete foundation strip | sheeting concrete blocks, bricks (300 mm); silicate exterior plaster, aluminum composite wall panels | reinforced concrete slabs (200 mm) | flat roof, reinforced concrete slabs, two-layer waterproofing modified belts | bricks (150 mm), gypsum plaster and ceramic tiles | floors—wooden floor, ceramic tiles, PVC, concrete floor, ceilings—gypsum plaster, plasterboard | ground floor 3 × geotextile, waterproofing PVC, extruded polystyrene (120 mm), external walls—mineral wool (250 mm), roof—extruded polystyrene (200 mm) | aluminum windows, triple glazing, horizontal aluminum exterior blinds |
| Heating or cooling, ventilation—floor heating and radiator by gas boiler with additional solar systems, fireplace, heat and ventilation recovery units; Connection to engineering networks—electrical, gas, sewage and water connection. | ||||||||
FH 4 Built-up area: 214.5 m2 Useful floor area: 339.9 m2 Built-up volume: 1569.2 m3 Number of floors: two-story building without basement | reinforced concrete foundation strip | bricks (300 mm), exterior silicate plaster, stone facing | reinforced concrete slabs (200 mm) | flat roof, gradient made of polystyrene concrete (60–200 mm), roof cladding—river gravel | bricks (250 mm), aerated concrete blocks (100–150 mm), lime-cement plaster and ceramic tiles | floors—wooden floor, ceramic tiles, cement screed, composite boards, ceilings—plasterboard | ground floor—2 × waterproofing PVC, separating PE foil, mineral wool (80 mm), external walls—mineral wool (100 mm), roof—extruded polystyrene (2 × 100 mm) | wood windows, triple glazing, horizontal aluminum exterior blinds |
| Heating or cooling, ventilation—floor and wall heating by gas condensing boiler, with an additional fireplace; Connection to engineering networks—electrical, gas, sewage and water connection | ||||||||
FH 5 Built-up area: 245 m2 Useful floor area: 399.5 m2 Built-up volume: 1345.2 m3 Number of floors: single-story building with basement | reinforced concrete foundation strip | reinforced concrete blocks (300 mm), bricks (300 mm), silicate exterior plaster, wood cladding | reinforced concrete slabs (200 mm) | flat roof with extensive and intensive vegetation roof | bricks (140 mm) with lime plaster and ceramic tiles | floors—wooden floor, ceramic tiles, ceilings—lime plaster, architectural concrete | ground floor—2 × geotextile, 2 × waterproofing PVC, extruded polystyrene (200 mm), external walls—expanded polystyrene (200 mm), roof—foam glass (500 mm) | wood windows, triple glazing, automatic horizontal aluminum exterior blinds |
| Heating or cooling, ventilation—floor and ceiling heating by earth-water type heat pump, with an additional electric boiler and solar system and fireplace, heat and ventilation recovery units; Connection to engineering networks—electrical, sewage and water connection. | ||||||||
FH 6 Built-up area: 169 m2 Useful floor area: 282.6 m2 Built-up volume: 1213.7 m3 Number of floors: two-story building with basement | reinforced concrete foundation strip and reinforced concrete bearing wall (400 mm) | sheeting concrete blocks (400 mm), bricks (380 mm); silicate exterior plaster, stone facing | reinforced concrete slabs (150 mm) | saddle roof, wood structure, slatted roofing | bricks and aerated concrete walls (100 mm), stucco double-layered plaster and ceramic tiles | floors—wooden floor, ceramic tiles, cement screed, ceilings—stucco double-layered plaster, gypsum plasterboard | ground floor—waterproofing PVC, extruded polystyrene (80 mm), external walls—mineral wool (100 mm), roof—glass wool (60–180 mm), PE foil, waterproofing foil | wooden windows, double glazing, horizontal aluminum interior blinds |
| Heating or cooling, ventilation—floor heating and radiator by gas boiler with additional fireplace; Connection to engineering networks—electrical, gas, sewage and water connection. | ||||||||
FH 7 Built-up area: 154 m2 Useful floor area: 234 m2 Built-up volume: 740 m3 Number of floors: two-story building without basement | reinforced concrete foundation strip | ceramic blocks (300 mm), exterior silicate plaster, stone facing | reinforced concrete slabs (150 mm) | flat roof, gradient made of perlite concrete (20–150 mm), roofing PVC with aggregate (50 mm) | ceramic bricks (175 mm), ceramic blocks (100 mm), thermal insulation (30 mm), ceramic tiles | floors—laminate floor, ceramic tiles, cement screed, ceilings—plasterboard | ground floor— 2 × waterproofing PVC, separating PE foil, expanded polystyrene (50 mm), extruded polystyrene (100 mm), external walls—all-surface thermal insulation plaster (40 mm), roof— expanded polystyrene (200 mm), separation geotextile | aluminum windows, triple glazing, horizontal aluminum interior blinds |
| Heating or cooling, ventilation—floor heating and radiator by gas condensing boiler, with an additional fireplace; Connection to engineering networks—electrical, gas, sewage and water connection. | ||||||||
FH 8 Built-up area: 173 m2 Useful floor area: 162 m2 Built-up volume: 843 m3 Number of floors: single-story building without basement | reinforced concrete foundation strip | aerated concrete blocks (450 mm), exterior lime-cement plaster, ceramic tiles | reinforced concrete slabs (230 mm), ceramic ceiling liners (230 mm) | saddle roof, wood structure, cement-bonded boards (20 mm), concrete covering | bricks (250 mm) and ceramic blocks (115 mm), lime-cement plaster and ceramic tiles | floors—wood-fiber parquet, ceramic tiles, ceilings—lime-cement plaster and plasterboard | ground floor—2 × waterproofing PVC, separating PE foil, extruded polystyrene (100 mm), external walls—without insulation, roof—PE foil, mineral wool (320 mm), foil | wooden windows, triple glazing, horizontal aluminum interior blinds |
| Heating or cooling, ventilation—floor heating by gas condensing boiler with an additional fireplace; Connection to engineering networks—electrical, gas, sewage and water connection. | ||||||||
FH 9 Built-up area: 88 m2 Useful floor area: 168 m2 Built-up volume: 512 m3 Number of floors: two-story building with basement | reinforced concrete foundation strip and reinforced concrete bearing wall (300 mm) | aerated concrete blocks (375 mm), silicate exterior plaster, stone facing | reinforced concrete slabs (160 mm), porothermic-ceramic ceiling (210 mm) | saddle roof, wood structure, sheet metal roofing | porous concrete blocks (250 mm) and bricks (150 mm), lime-cement plaster and ceramic tiles | floors—laminate floor, ceramic tiles, cement screed, ceilings—lime-cement plaster, gypsum plasterboard | ground floor— 2 × waterproofing PVC, expanded polystyrene (60 mm), external walls— expanded polystyrene (60 mm), roof—mineral wool (160 mm), PE foil, waterproofing foil | plastic windows, double glazing, horizontal aluminum interior blinds |
| Heating or cooling, ventilation—floor heating and radiator by gas boiler with additional fireplace; Connection to engineering networks—electrical, gas, sewage and water connection. | ||||||||
FH 10 Built-up area: 282 m2 Useful floor area: 449 m2 Built-up volume: 1218 m3 Number of floors: two-story building without basement | reinforced concrete foundation strip | aerated concrete blocks (375 mm), silicate exterior plaster | reinforced concrete slabs (230 mm) | saddle roof, wood structure, concrete covering | porous concrete blocks (250 mm) and bricks (150 mm), lime plaster and ceramic tiles | floors—wood parquet, ceramic tiles, concrete floor, ceilings—lime plaster and gypsum plasterboard | ground floor—2 × waterproofing, separating PE foil, expanded polystyrene (100 mm), external walls—expanded polystyrene (100 mm), roof—PE foil, mineral wool (180 mm) | wooden windows, triple glazing, horizontal aluminum interior blinds |
| Heating or cooling, ventilation—floor heating and radiator by gas condensing boiler with an additional fireplace; Connection to engineering networks—electrical, gas, sewage and water connection. | ||||||||
FH 11 Built-up area: 286.2 m2 Useful floor area: 837.5 m2 Built-up volume: 2512.4 m3 Number of floors: three-story building without basement | reinforced concrete foundation strip | bricks (300 mm); silicate exterior plaster, stone facing | reinforced concrete slabs (250 mm) | saddle roof, wood structure, concrete covering | bricks (125 mm), lime-stucco plaster and ceramic tiles | floors—laminate floor, ceramic tiles, concrete floor, ceilings—lime-stucco plaster, gypsum plasterboard | ground floor—2 × waterproofing PVC, mineral wool (100 mm), external walls—expanded polystyrene (100 mm), roof—mineral wool (200 mm); | plastic windows, triple glazing, horizontal aluminum interior blinds |
| Heating or cooling, ventilation—floor heating and radiator by gas boiler with additional fireplace; Connection to engineering networks—electrical, gas, sewage and water connection. | ||||||||
FH 12 Built-up area: 106.8 m2 Useful floor area: 202.6 m2 Built-up volume: 618.1 m3 Number of floors: two-story building without basement | reinforced concrete foundation strip and reinforced concrete bearing wall (400 mm) | reinforced concrete wall (400 mm); aerated concrete blocks (300 mm), exterior silicate plaster, stone facing | reinforced concrete slabs (200 mm) | flat roof, roofing foil | porous concrete blocks (250 mm) and blocks (150 mm), lime plaster and ceramic tiles | floors—laminate floor, ceramic tiles, ceilings—lime plaster, plasterboard | ground floor—2 × waterproofing PVC, separating PE foil, expanded polystyrene (100 mm), external walls—expanded polystyrene (100 mm), roof—expanded polystyrene (150 mm) | plastic windows, triple glazing, horizontal aluminum interior blinds |
| Heating or cooling, ventilation—floor heating and radiator by gas condensing boiler, with an additional fireplace; Connection to engineering networks—electrical, gas and water connection, cesspool | ||||||||
FH 13 Built-up area: 145 m2 Useful floor area: 127.9 m2 Built-up volume: 441.3 m3 Number of floors: two-story building without basement | reinforced concrete foundation strip | wooden construction (400 mm); chipboard (OSB boards) | reinforced concrete slabs (60 mm) and wooden beams (200 mm) | flat roof covered with soil (300 mm), counter roof—gravel (50 mm), OSB boards (25 mm) | reinforced concrete wall (200 mm), porous concrete walls (150 mm), plasterboard, ceramic tiles | floors—wooden floor, ceramic tiles, ceilings—plasterboard | ground floor—2 × waterproofing PVC, PE foil, expanded polystyrene (300 mm), sand (300 mm), external walls—mineral wool (400 mm), roof—stone wool (240 mm), expanded polystyrene (150 mm), mineral wool (400 mm) | wooden windows, triple glazing, horizontal aluminum and wooden exterior blinds |
| Heating or cooling, ventilation—floor heating and radiator by gas condensing boiler, with an additional fireplace; Connection to engineering networks—electrical, gas and water connection, cesspool. | ||||||||
Table 2.
Assessment scale.
| Key for Assessment | Certification Scale | |
|---|---|---|
| −1 | unacceptable building | Unacceptable building |
| 0 | acceptable building | BEAS CERTIFIED |
| 0–1.5 | acceptable building | BEAS BRONZE |
| 1.5–3 | good building | BEAS SILVER |
| 3–4 | better building | BEAS GOLD |
| 4–5 | best building | BEAS PLATINUM |
Table 3.
Indicators of field A [20].
Table 3.
Indicators of field A [20].
| Field | Indicator |
|---|---|
| A | A1—Selection of location for the construction; A2—Selection of location vulnerable to flooding; A3—Selection of location near to water body; A4—Selection of brown-field areas; A5—Distance from construction site to road-traffic infrastructure; A6—Distance to commercial and cultural facilities; A7—Distance to sport and active recreation; A8—Distance to public or natural green space; A9—Possibility of connection to engineering networks; A10—Possibility of exploitation of renewable energy sources; A11—Possibility to maximize passive solar gains by the orientation of the building; A12—Compatibility of the urban design with local cultural values; A13—Presence of transport infrastructure at the construction site; A14—Proportion of green spaces at the construction site. |
Table 4.
Results of field A for the investigated family houses.
| Family Houses | |||||||||||||
|---|---|---|---|---|---|---|---|---|---|---|---|---|---|
| 1 | 2 | 3 | 4 | 5 | 6 | 7 | 8 | 9 | 10 | 11 | 12 | 13 | |
| A1 | −1 | −1 | −1 | −1 | −1 | −1 | −1 | −1 | −1 | −1 | −1 | −1 | −1 |
| A2 | 5 | 5 | 5 | 5 | 5 | 5 | 5 | 5 | 5 | 3 | 5 | 5 | 3 |
| A3 | 3 | 5 | 5 | 5 | 5 | 5 | 5 | 5 | 5 | 5 | 5 | 5 | 5 |
| A4 | 3 | 3 | 3 | 3 | 3 | 3 | 3 | 3 | 0 | 0 | 3 | 3 | 3 |
| A5 | −1 | −1 | 0 | 3 | 5 | 5 | 5 | 3 | −1 | 3 | 5 | 0 | 5 |
| A6 | −1 | −1 | −1 | 5 | 3 | 3 | 5 | 5 | −1 | 5 | 5 | 3 | 5 |
| A7 | −1 | −1 | 0 | 5 | 5 | 5 | 5 | −1 | −1 | −1 | 5 | −1 | 5 |
| A8 | 5 | 5 | 5 | 5 | 5 | 5 | 5 | 5 | 5 | 5 | 0 | −1 | 5 |
| A9 | 0 | 5 | 5 | 5 | 3 | 5 | 5 | 5 | 5 | 5 | 5 | 5 | 5 |
| A10 | 5 | 5 | 5 | 5 | 5 | 5 | 5 | 5 | 5 | 5 | 5 | 5 | 5 |
| A11 | 3 | 5 | 3 | 3 | 5 | 3 | 3 | 3 | −1 | 3 | 3 | −1 | 5 |
| A12 | 3 | 3 | 3 | 5 | 5 | 5 | 3 | 5 | 5 | 3 | 3 | 0 | 5 |
| A13 | 5 | 5 | 5 | 5 | 5 | 0 | 5 | 3 | 5 | 5 | 3 | 5 | 5 |
| A14 | 5 | −1 | −1 | 0 | 0 | 0 | 3 | 0 | 0 | 5 | −1 | 3 | 5 |
Table 5.
Indicators of field B [20].
Table 5.
Indicators of field B [20].
| Field | Indicators |
|---|---|
| B | B1—Materials: B1.1—Product´s environmental labeling; B1.2—Use of local materials; B1.3—Use of recycled materials; B1.4—Use of natural materials; B1.5—Radioactivity of building materials; B2 Life cycle of materials: B2.1—Primary energy embodied in building materials; B2.2—Global warming potential; B2.3—Acidification potential |
Table 6.
Results of field B for the investigated family houses.
| Family Houses | |||||||||||||
|---|---|---|---|---|---|---|---|---|---|---|---|---|---|
| 1 | 2 | 3 | 4 | 5 | 6 | 7 | 8 | 9 | 10 | 11 | 12 | 13 | |
| B1.1 | −1 | 0 | 0 | 0 | 3 | 0 | −1 | 0 | −1 | 5 | −1 | 0 | 5 |
| B1.2 | 0 | 3 | 3 | 3 | 3 | −1 | 0 | 3 | 0 | 3 | 0 | 0 | 5 |
| B1.3 | −1 | 5 | 5 | 3 | 3 | 5 | −1 | 3 | −1 | 3 | −1 | 0 | 5 |
| B1.4 | −1 | −1 | −1 | −1 | −1 | −1 | −1 | −1 | −1 | −1 | −1 | −1 | 5 |
| B1.5 | 5 | 5 | 5 | 5 | 5 | 5 | 5 | 5 | 5 | 5 | 5 | 5 | 5 |
| B2.1 | 1 | −1 | −1 | −1 | −1 | −1 | −1 | −1 | −1 | −1 | −1 | −1 | −1 |
| B2.2 | 5 | 3 | 3 | 5 | 5 | 5 | 5 | 3 | 5 | 5 | 5 | 3 | 3 |
| B2.3 | 3 | −1 | 0 | 3 | 3 | 3 | 3 | −1 | 3 | 3 | 3 | 3 | 0 |
Table 7.
Indicators of field C [20].
Table 7.
Indicators of field C [20].
| Field | Indicators |
|---|---|
| C | C1—Thermal comfort during the heating season; C2—Thermal comfort during the cooling season; C3—Natural ventilation and mechanical ventilation; C4—Noise attenuation through the exterior envelope; C5—Noise isolation between primary occupancy areas; C6—Daylighting; C7—Shading and blinds; C8—Artificial lighting; C9—The materials used in the building; C10—Transfer of pollutants from the garage space into the user space of the house |
Table 8.
Results of field C for the investigated family houses.
| Family Houses | |||||||||||||
|---|---|---|---|---|---|---|---|---|---|---|---|---|---|
| 1 | 2 | 3 | 4 | 5 | 6 | 7 | 8 | 9 | 10 | 11 | 12 | 13 | |
| C1 | 0 | 0 | 3 | 0 | 3 | 0 | 3 | 0 | 0 | 3 | 3 | 0 | 5 |
| C2 | 0 | 0 | 3 | 0 | 3 | 0 | 3 | 0 | 0 | 3 | 3 | 0 | 5 |
| C3 | 3 | 5 | 5 | 3 | 3 | 5 | 5 | 5 | 3 | 5 | −1 | 0 | 5 |
| C4 | 5 | 5 | 5 | 5 | 5 | 5 | 5 | 5 | 5 | 5 | 5 | 5 | 5 |
| C5 | 0 | 3 | 3 | 0 | 5 | 0 | 3 | 0 | 0 | 5 | 5 | 3 | 5 |
| C6 | 3 | 5 | 5 | 3 | 5 | 3 | 0 | 3 | 0 | 5 | 3 | 3 | 5 |
| C7 | 3 | 5 | 5 | 5 | 5 | 3 | 3 | 3 | 0 | 3 | 3 | 0 | 5 |
| C8 | 5 | 5 | 5 | 5 | 5 | 5 | 5 | 5 | 5 | 5 | 5 | 5 | 5 |
| C9 | 0 | 0 | 0 | 0 | 3 | 0 | 0 | 0 | 0 | 3 | 0 | −1 | 5 |
| C10 | 5 | 0 | 0 | 0 | 3 | 0 | 0 | 5 | −1 | 0 | 5 | 5 | 5 |
Table 9.
Indicators of field D [20].
Table 9.
Indicators of field D [20].
| Field | Indicators |
|---|---|
| D | D1—Operation energy: D1.1—Energy for heating; D1.2—Energy for domestic hot water; D1.3—Mechanical ventilation and cooling; D1.4—Using economical artificial light sources; D1.5—Energy for appliances; D2—Active systems using renewable energy sources: D2.1—Solar system/heat pump; D2.2—Photovoltaic technology; D2.3—Heat recuperation; D3—Energy management: D3.1—System of energy management |
Table 10.
Results of field D for the investigated family houses.
| Family Houses | |||||||||||||
|---|---|---|---|---|---|---|---|---|---|---|---|---|---|
| 1 | 2 | 3 | 4 | 5 | 6 | 7 | 8 | 9 | 10 | 11 | 12 | 13 | |
| D1.1 | 5 | 5 | 5 | 3 | 5 | 3 | 3 | 3 | 3 | 3 | 5 | 3 | 5 |
| D1.2 | 3 | 5 | 5 | 3 | 5 | 0 | 5 | 3 | 3 | 5 | 5 | 5 | 5 |
| D1.3 | −1 | 0 | 5 | 0 | 5 | −1 | −1 | −1 | −1 | −1 | −1 | −1 | 5 |
| D1.4 | −1 | 5 | 5 | 3 | 5 | −1 | −1 | 5 | −1 | 5 | 3 | −1 | 5 |
| D1.5 | 3 | 5 | 5 | 3 | 5 | 5 | 5 | 5 | 3 | 5 | 3 | 3 | 5 |
| D2.1 | −1 | 5 | 5 | −1 | 5 | −1 | −1 | −1 | 0 | −1 | −1 | −1 | 5 |
| D2.2 | −1 | −1 | −1 | −1 | −1 | −1 | 0 | −1 | −1 | −1 | −1 | −1 | −1 |
| D2.3 | −1 | −1 | 5 | −1 | 5 | −1 | −1 | −1 | −1 | −1 | −1 | −1 | 3 |
| D3.1 | −1 | 5 | 5 | −1 | 5 | −1 | −1 | −1 | −1 | −1 | −1 | −1 | 5 |
Table 11.
Indicators of field E [20].
Table 11.
Indicators of field E [20].
| Field | Indicators |
|---|---|
| E | E1–Reduction and regulation of water flow in water systems; E2–Water management of surface runoff; E3–Drinking water supply; E4– Grey water system |
Table 12.
Results of field E for the investigated family houses.
| Family Houses | |||||||||||||
|---|---|---|---|---|---|---|---|---|---|---|---|---|---|
| 1 | 2 | 3 | 4 | 5 | 6 | 7 | 8 | 9 | 10 | 11 | 12 | 13 | |
| E1 | 0 | 3 | 3 | 5 | 5 | 0 | 3 | 3 | 0 | 3 | 0 | −1 | 3 |
| E2 | 5 | 0 | 0 | 5 | 5 | 0 | 0 | 5 | 0 | 5 | 0 | 5 | 5 |
| E3 | 5 | 5 | 5 | 5 | 5 | 5 | 5 | 5 | 5 | 5 | 5 | 5 | 5 |
| E4 | −1 | −1 | −1 | −1 | −1 | −1 | −1 | −1 | −1 | −1 | −1 | −1 | −1 |
Table 13.
Indicators of field F [20].
Table 13.
Indicators of field F [20].
| Field | Indicators |
|---|---|
| F | F1–Plan of waste disposal originating in the construction process; F2–Measures to minimize waste resulting from building operation; F3–Measures to minimize emissions resulting from air pollution sources |
Table 14.
Results of field F for the investigated family houses.
| Family House | |||||||||||||
|---|---|---|---|---|---|---|---|---|---|---|---|---|---|
| 1 | 2 | 3 | 4 | 5 | 6 | 7 | 8 | 9 | 10 | 11 | 12 | 13 | |
| F1 | 0 | 3 | 3 | 3 | 3 | 0 | 0 | 3 | 0 | 3 | 0 | 3 | 3 |
| F2 | −1 | 0 | 3 | 3 | 3 | 3 | 3 | 0 | −1 | 0 | 3 | 0 | 5 |
| F3 | −1 | −1 | −1 | −1 | −1 | −1 | −1 | −1 | −1 | −1 | −1 | −1 | −1 |
Table 15.
Example of the evaluation of the indicator Site selection.
| A | Site Selection and Project Planning | 2.44 | 14.71% | 0.359 |
| A1 | Site selection | 9.00 | 0.220 | |
| Purpose | To recommend the use of land for building with high quality of environment. | point | weight | |
| −1 | 0.09 | |||
| Indicator | The class of environment quality. | |||
| Negative practice | The use of land has the class of environment quality: | Disturbed environment | −1 | |
| Acceptable practice | Soft disturbed environment | 0 | ||
| Good practice | Suitable environment | 3 | ||
| Best practice | Environment high quality | 5 | ||
Table 16.
Overall evaluation of family houses in individual fields of BEAS.
| Field | FH1 | FH2 | FH3 | FH4 | FH5 | FH6 | FH7 | FH8 | FH9 | FH10 | FH11 | FH12 | FH13 |
|---|---|---|---|---|---|---|---|---|---|---|---|---|---|
| A | 2.42 | 2.48 | 2.50 | 3.67 | 3.65 | 3.40 | 3.92 | 3.03 | 2.15 | 3.10 | 3.16 | 2.23 | 4.16 |
| B | 1.39 | 1.42 | 1.58 | 2.21 | 2.56 | 2.05 | 1.39 | 1.21 | 1.39 | 2.80 | 1.39 | 1.28 | 2.83 |
| C | 2.10 | 2.30 | 3.40 | 1.80 | 4.20 | 1.60 | 2.20 | 2.10 | 0.90 | 3.20 | 3.20 | 2.00 | 5.00 |
| D | 1.02 | 2.99 | 4.25 | 1.38 | 4.25 | 0.41 | 1.29 | 1.64 | 0.80 | 1.97 | 1.86 | 1.03 | 4.10 |
| E | 2.51 | 1.85 | 1.85 | 3.51 | 3.51 | 1.25 | 1.85 | 3.11 | 1.25 | 3.11 | 1.25 | 2.31 | 3.11 |
| F | −0.69 | 0.59 | 1.64 | 1.64 | 1.64 | 0.71 | 0.71 | 0.59 | −0.69 | 0.59 | 0.71 | 0.59 | 2.34 |
| Total | 1.59 | 2.19 | 2.88 | 2.19 | 3.59 | 1.56 | 1.93 | 1.93 | 1.10 | 2.62 | 2.15 | 1.59 | 3.87 |
© 2020 by the authors. Licensee MDPI, Basel, Switzerland. This article is an open access article distributed under the terms and conditions of the Creative Commons Attribution (CC BY) license (http://creativecommons.org/licenses/by/4.0/).
Share and Cite
MDPI and ACS Style
Krídlová Burdová, E.; Selecká, I.; Vilčeková, S.; Burák, D.; Sedláková, A. Evaluation of Family Houses in Slovakia Using a Building Environmental Assessment System. Sustainability 2020, 12, 6524. https://doi.org/10.3390/su12166524
AMA Style
Krídlová Burdová E, Selecká I, Vilčeková S, Burák D, Sedláková A. Evaluation of Family Houses in Slovakia Using a Building Environmental Assessment System. Sustainability. 2020; 12(16):6524. https://doi.org/10.3390/su12166524
Chicago/Turabian StyleKrídlová Burdová, Eva, Iveta Selecká, Silvia Vilčeková, Dušan Burák, and Anna Sedláková. 2020. "Evaluation of Family Houses in Slovakia Using a Building Environmental Assessment System" Sustainability 12, no. 16: 6524. https://doi.org/10.3390/su12166524
Note that from the first issue of 2016, this journal uses article numbers instead of page numbers. See further details here.