Author Contributions
Conceptualization, E.C., L.G., A.M., M.R., R.R., G.V.; methodology, E.C., L.G., A.M., M.R., R.R., G.V.; software, E.C., L.G., A.M., M.R., R.R., G.V.; validation, E.C., L.G., A.M., M.R., R.R., G.V.; formal analysis, E.C., L.G., A.M., M.R., R.R., G.V.; data curation, E.C., L.G., A.M., M.R., R.R., G.V.; writing—original draft preparation, E.C., L.G., A.M., M.R., R.R., G.V.; writing—review and editing, E.C., L.G., A.M., M.R., R.R., G.V.; visualization, E.C., L.G., A.M., M.R., R.R., G.V.; supervision, E.C., L.G., A.M., M.R., R.R., G.V. All authors have read and agreed to the published version of the manuscript.
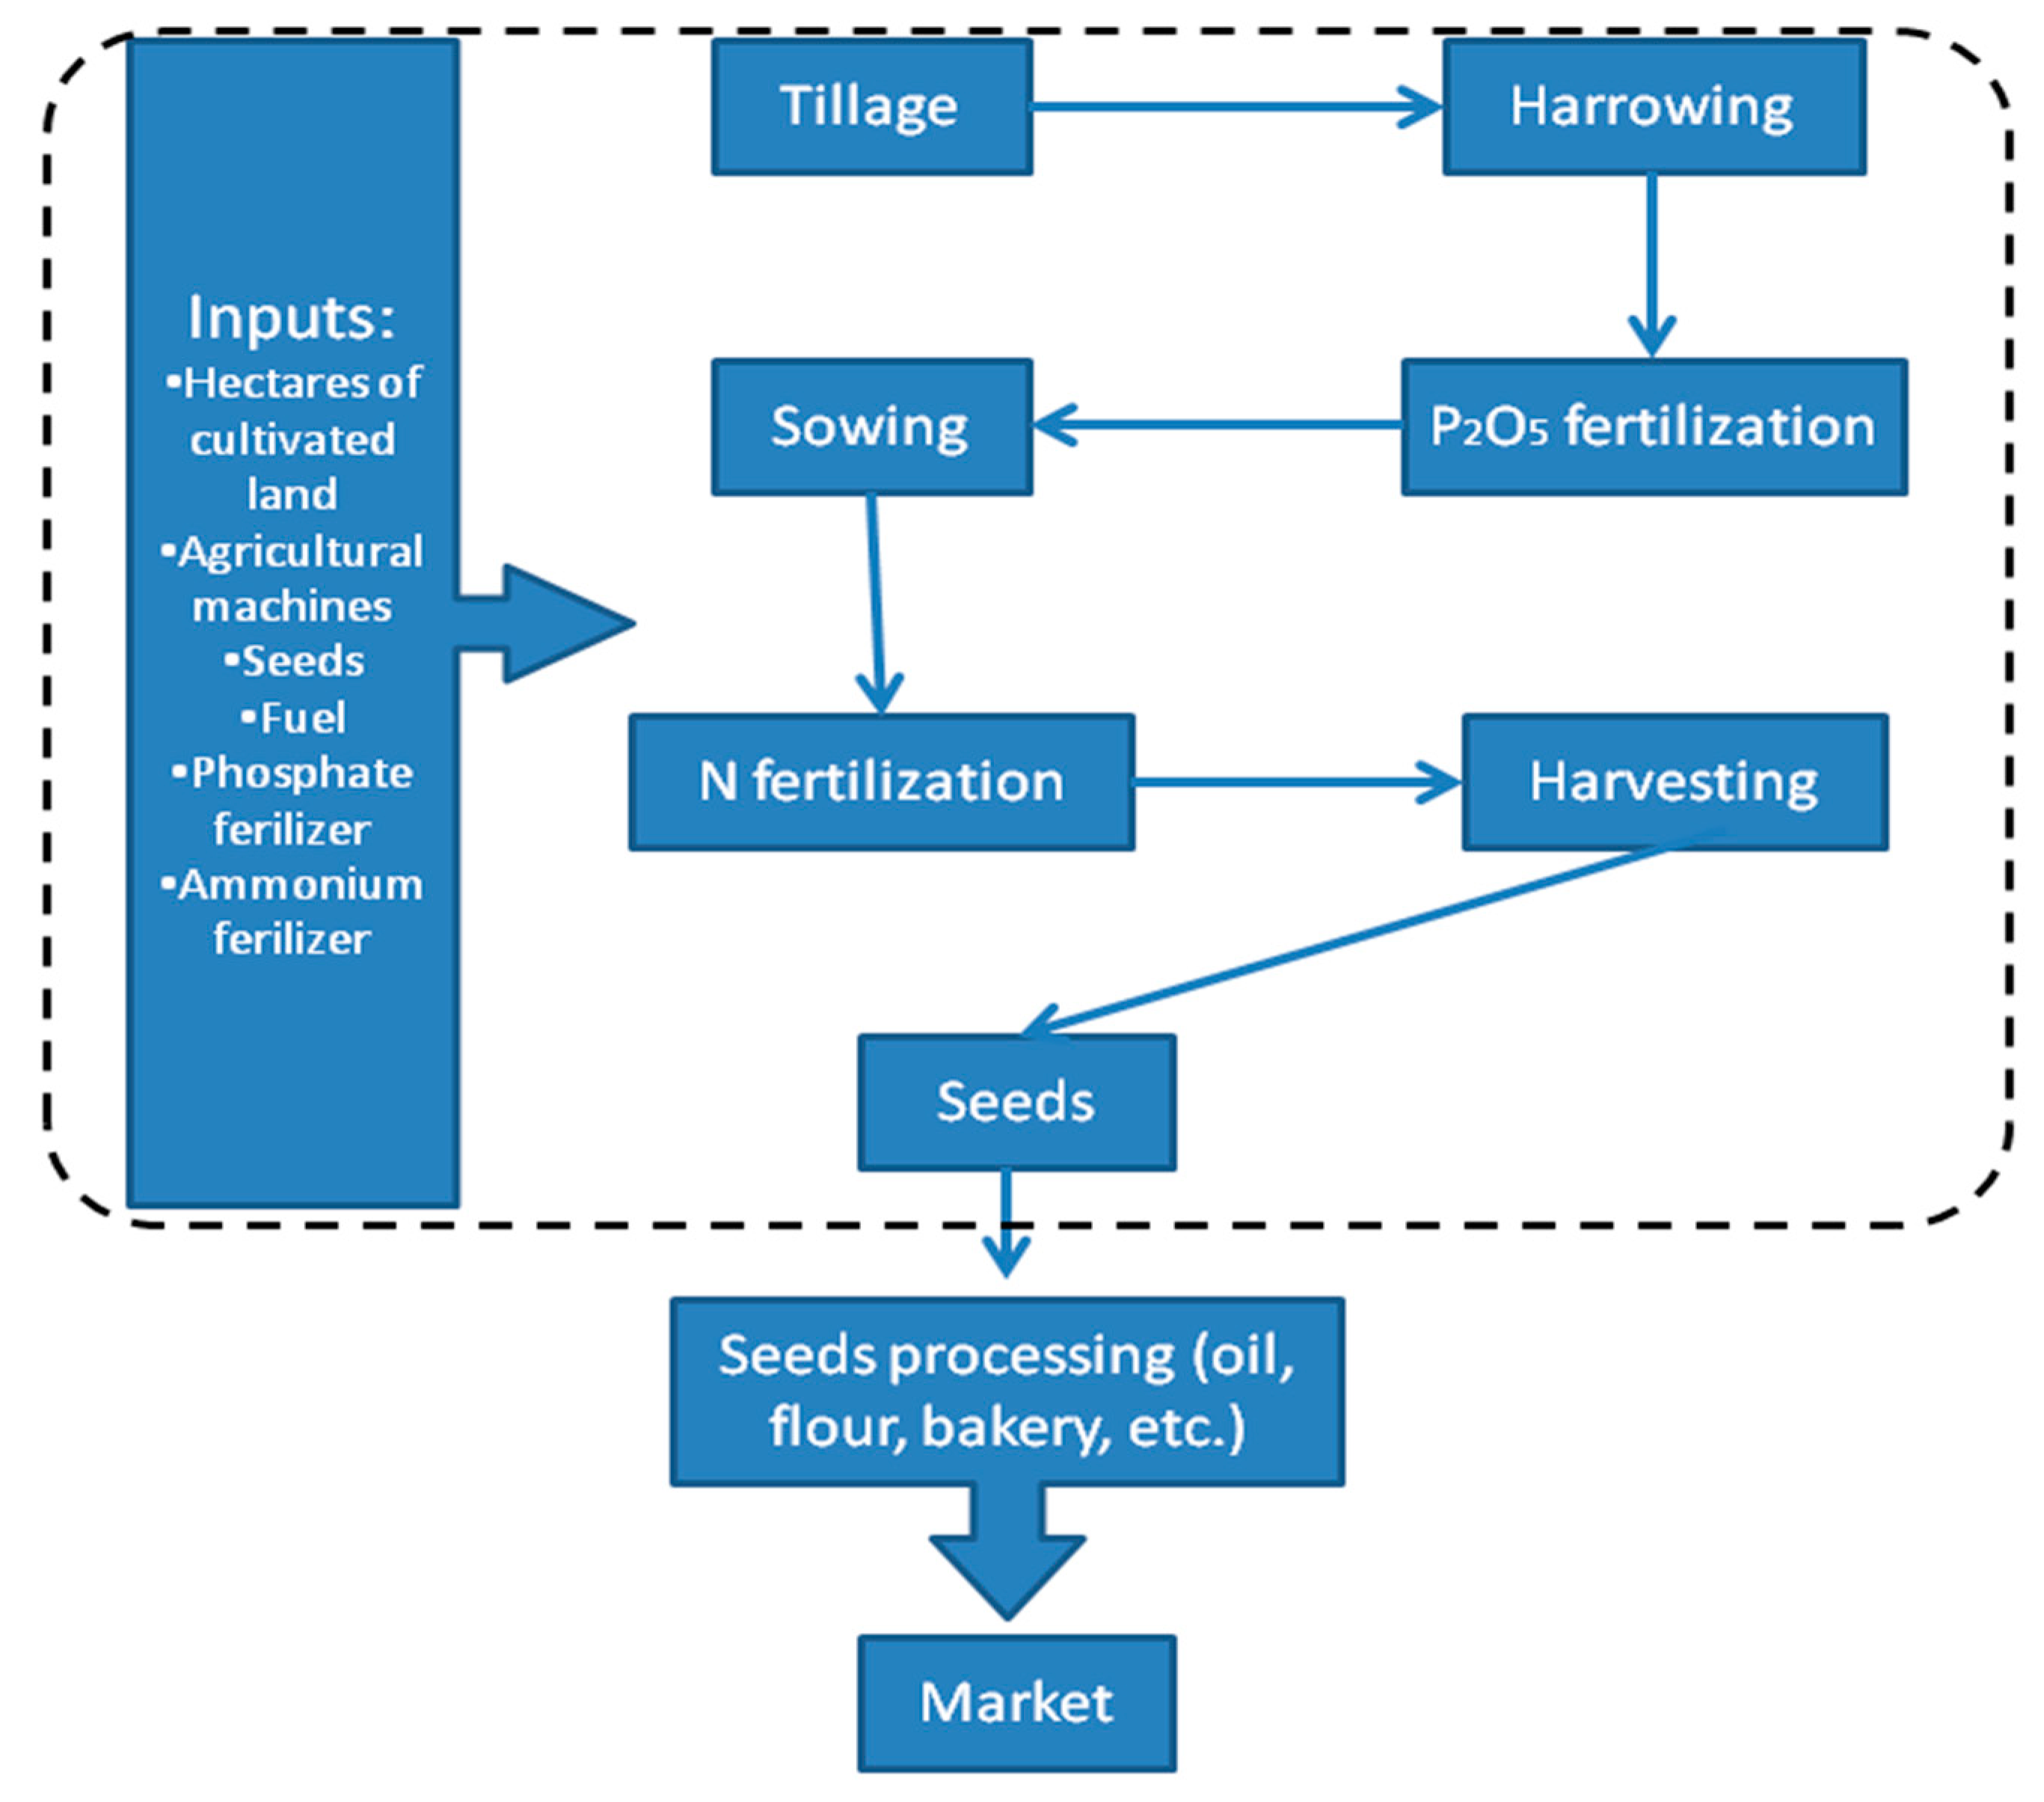
Figure 1.
System boundaries for Cannabis Sativa L. cultivation for hemp seed production.
Figure 1.
System boundaries for Cannabis Sativa L. cultivation for hemp seed production.
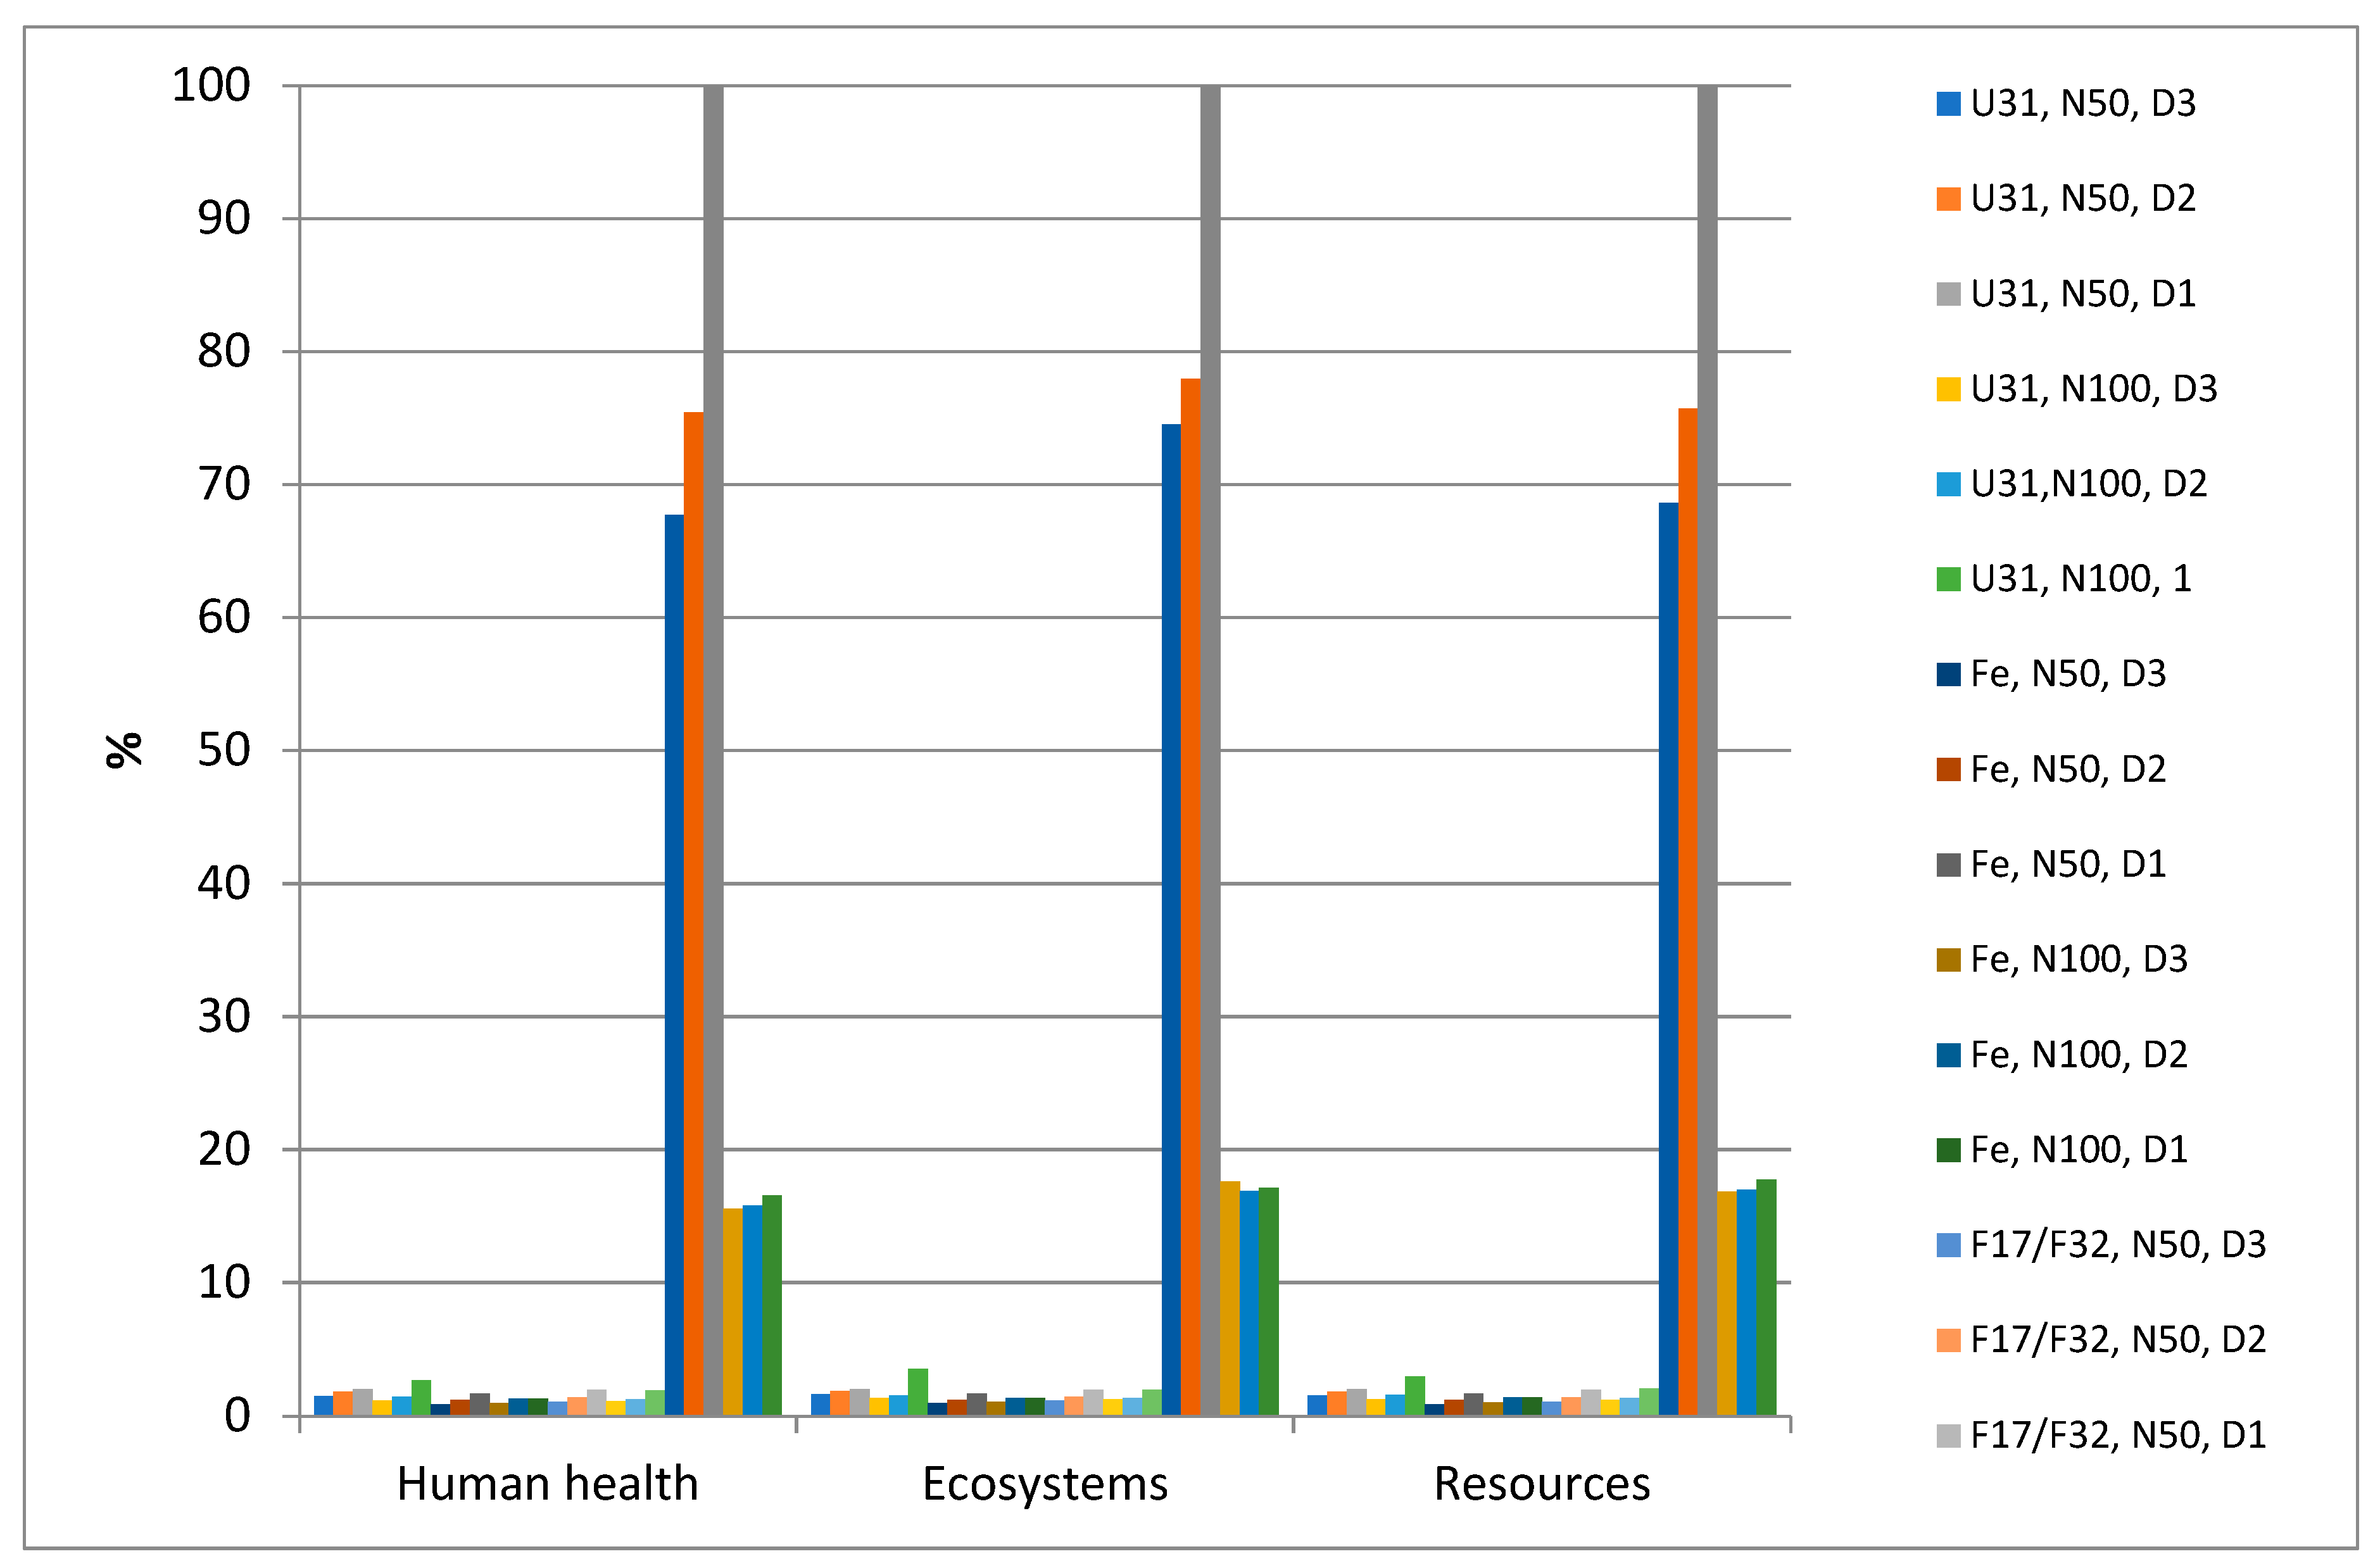
Figure 2.
Life cycle impact assessment (LCIA) of the 24 scenarios evaluated, reported in 3 endpoints (expressed as percentage of the highest impact. E68 = Epsilon 68; F17 = Fedora 17; F32 = Felina 32; F75 = Futura 75; Fe = Ferimon; S27 = Santhica 27; U31 = Uso 31; D1, D2, and D3 = 40, 80, and 120 plants m−2; N100 and N50 = 100 and 50 kg of N ha−1.
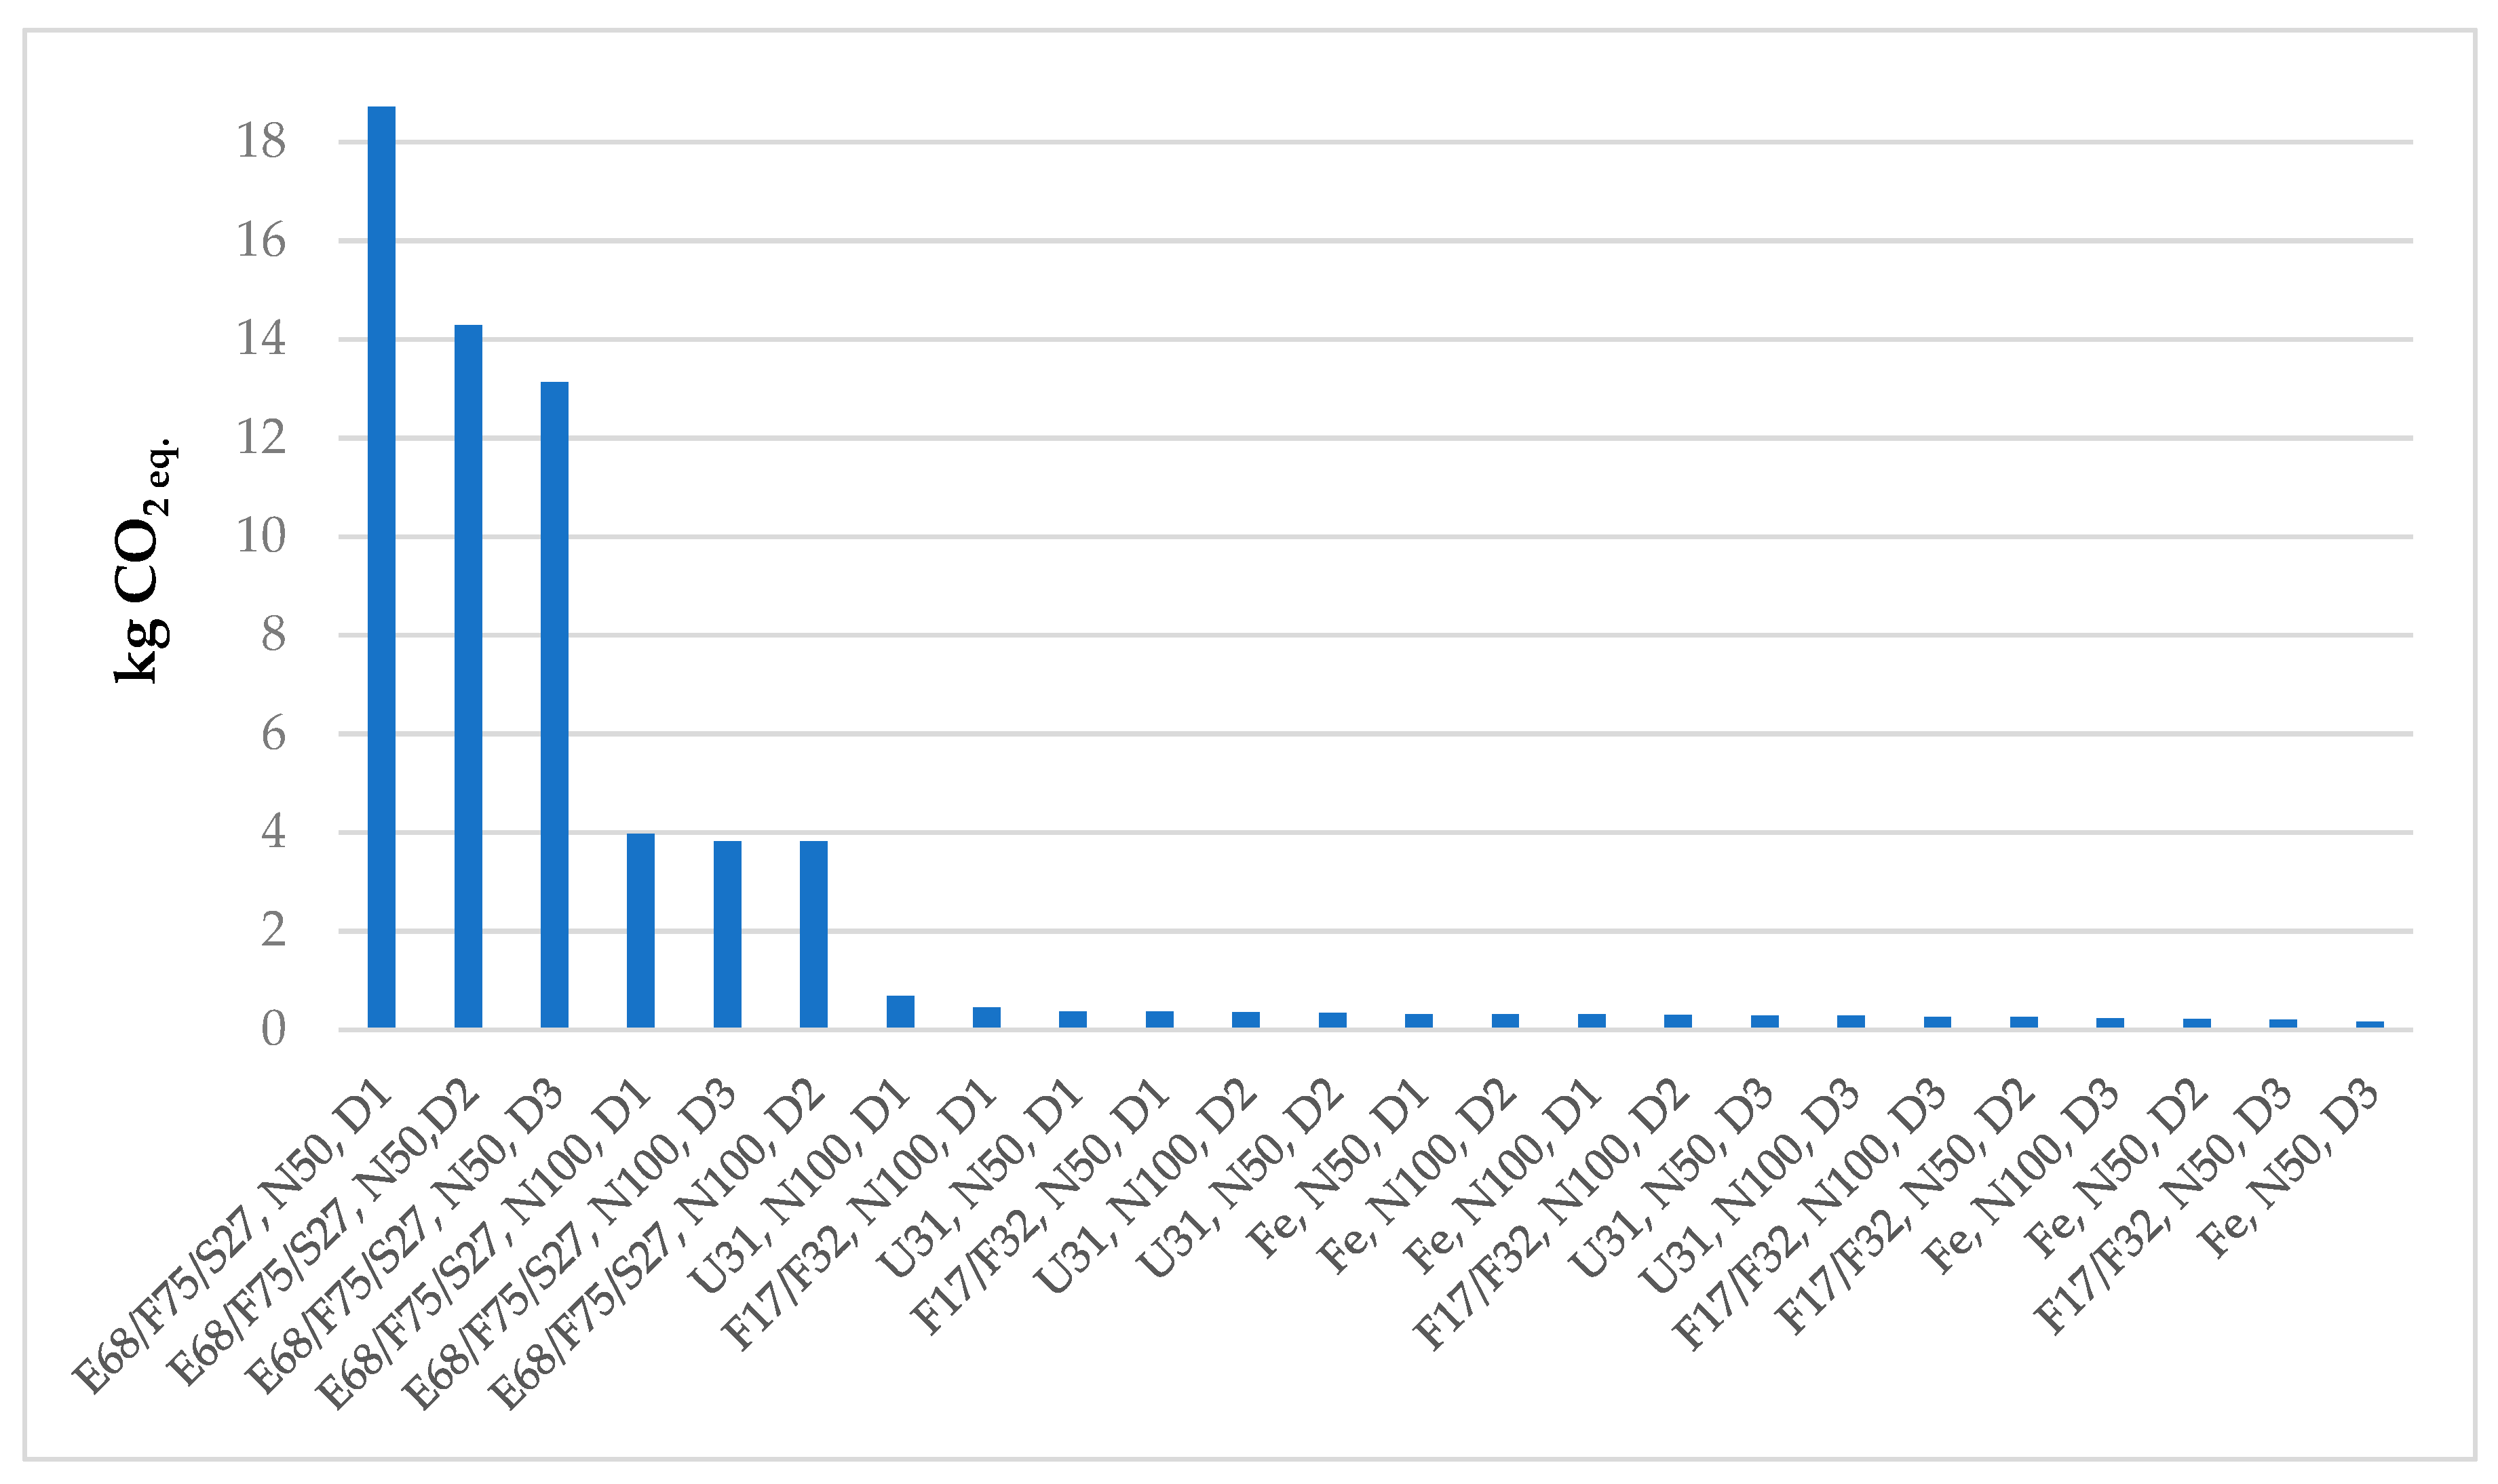
Figure 3.
Carbon footprint of the 24 scenarios evaluated, expressed as kg of CO2. E68 = Epsilon 68; F17 = Fedora 17; F32 = Felina 32; F75 = Futura 75; Fe = Ferimon; S27 = Santhica 27; U31 = Uso 31; D1, D2, and D3 = 40, 80, and 120 plants m−2; N100 and N50 = 100 and 50 kg of N ha−1.
Figure 3.
Carbon footprint of the 24 scenarios evaluated, expressed as kg of CO2. E68 = Epsilon 68; F17 = Fedora 17; F32 = Felina 32; F75 = Futura 75; Fe = Ferimon; S27 = Santhica 27; U31 = Uso 31; D1, D2, and D3 = 40, 80, and 120 plants m−2; N100 and N50 = 100 and 50 kg of N ha−1.
Table 1.
Hemp seed yield for the 42 impact scenarios. Values belonging to the same characteristic with different letters in rows for plant density (within N fertilization level) and in columns for hemp genotype (lower case letter) are statistically different according to LSD (0.05) (Source: Campiglia et al., 2017 [
13]). E68 = Epsilon 68; F17 = Fedora 17; F32 = Felina 32; F75 = Futura 75; Fe = Ferimon; S27 = Santhica 27; U31 = Uso 31; D1, D2, and D3 = 40, 80, and 120 plants m
−2; N100 and N50 = 100 and 50 kg of N ha
−1.
| | Seed Yield (t ha−1) |
|---|
| | N50 | N100 |
|---|
| Varieties | D1 | D2 | D3 | D1 | D2 | D3 |
|---|
| E68 | 0.02 | cA | 0.02 | cA | 0.03 | dA | 0.12 | cA | 0.11 | cA | 0.12 | cA |
| F17 | 1.06 | bC | 1.61 | aB | 2.02 | abA | 1.04 | bB | 1.68 | bA | 1.93 | abA |
| F32 | 1.01 | bC | 1.36 | abB | 1.92 | bA | 1.13 | bB | 1.69 | bA | 2.00 | abA |
| F75 | 0.03 | cA | 0.04 | cA | 0.04 | dA | 0.13 | cA | 0.15 | cA | 0.14 | cA |
| Fe | 1.20 | aC | 1.75 | aB | 2.44 | aA | 1.60 | aB | 2.26 | Aa | 2.27 | aA |
| S27 | 0.01 | cA | 0.02 | cA | 0.02 | dA | 0.12 | cA | 0.13 | cA | 0.12 | cA |
| U31 | 1.02 | bB | 1.14 | bAB | 1.39 | cA | 0.81 | bB | 1.44 | bA | 1.82 | bA |
Table 2.
Life cycle inventory for hemp seed cultivation. All data are expressed for 1 kg of seed produced. E68 = Epsilon 68; F17 = Fedora 17; F32 = Felina 32; F75 = Futura 75; Fe = Ferimon; S27 = Santhica 27; U31 = Uso 31; D1, D2, and D3 = 40, 80, and 120 plants m−2; N100 and N50 = 100 and 50 kg of N ha−1.
| | N50 | N100 |
|---|
| | D1 | D2 | D3 | D1 | D2 | D3 |
|---|
| Land (ha) |
| E68/F75/S27 | 0.05000 | 0.03750 | 0.03333 | 0.00811 | 0.00769 | 0.00750 |
| F17/F32 | 0.00097 | 0.00067 | 0.00051 | 0.00092 | 0.00059 | 0.00051 |
| Fe | 0.00083 | 0.00057 | 0.00041 | 0.00063 | 0.00044 | 0.00044 |
| U31 | 0.00098 | 0.00088 | 0.00072 | 0.00123 | 0.00069 | 0.00055 |
| N fertilizer (kg) |
| E68/F75/S27 | 2.50000 | 1.87500 | 1.66667 | 0.81081 | 0.76923 | 0.75000 |
| F17/F32 | 0.04831 | 0.03367 | 0.02538 | 0.09217 | 0.05935 | 0.05089 |
| Fe | 0.04167 | 0.02857 | 0.02049 | 0.06250 | 0.04425 | 0.04405 |
| U31 | 0.04902 | 0.04386 | 0.03597 | 0.12346 | 0.06944 | 0.05495 |
| P2O5 fertilizer (kg) |
| E68/F75/S27 | 5.00000 | 3.75000 | 3.33333 | 0.81081 | 0.76923 | 0.75000 |
| F17/F32 | 0.09662 | 0.06734 | 0.05076 | 0.09217 | 0.05935 | 0.05089 |
| Fe | 0.08333 | 0.05714 | 0.04098 | 0.06250 | 0.04425 | 0.04405 |
| U31 | 0.09804 | 0.08772 | 0.07194 | 0.12346 | 0.06944 | 0.05495 |
| Seed for sowing (kg) |
| E68/F75/S27 | 0.35000 | 0.52500 | 0.93333 | 0.05676 | 0.10769 | 0.21000 |
| F17/F32 | 0.00676 | 0.00943 | 0.01421 | 0.00645 | 0.00831 | 0.01425 |
| Fe | 0.00583 | 0.00800 | 0.01148 | 0.00438 | 0.00619 | 0.01233 |
| U31 | 0.00686 | 0.01228 | 0.02014 | 0.00864 | 0.00972 | 0.01538 |
| Diesel (kg) |
| E68/F75/S27 | 3.25000 | 2.43750 | 2.16667 | 0.52703 | 0.50000 | 0.48750 |
| F17/F32 | 0.06280 | 0.04377 | 0.03299 | 0.05991 | 0.03858 | 0.03308 |
| Fe | 0.05417 | 0.03714 | 0.02664 | 0.04063 | 0.02876 | 0.02863 |
| U31 | 0.06373 | 0.05702 | 0.04676 | 0.08025 | 0.04514 | 0.03571 |
| Agriculture machines (kg) |
| E68/F75/S27 | 0.82000 | 0.61500 | 0.54667 | 0.13297 | 0.12615 | 0.12300 |
| F17/F32 | 0.01585 | 0.01104 | 0.00832 | 0.01512 | 0.00973 | 0.00835 |
| Fe | 0.01367 | 0.00937 | 0.00672 | 0.01025 | 0.00726 | 0.00722 |
| U31 | 0.01608 | 0.01439 | 0.01180 | 0.02025 | 0.01139 | 0.00901 |
Table 3.
Impact assessment of Uso 31 genotype at different N fertilizer and plant density levels. D1, D2, and D3 = 40, 80, and 120 plants m−2; N100 and N50 = 100 and 50 kg of N ha−1. Global Warning Human Health (GWHH), Global Warming Terrestrial Ecosystems (GWTE), Global Warming Freshwater Ecosystems (GWFE), Stratospheric Ozone Depletion (SOD), Ionizing Radiation (IR), Ozone Formation Human Health (OFHH), Fine Particulate Matter Formation (FPMF), Ozone Formation Terrestrial Ecosystems (OFTE), Terrestrial Acidification (TA), Freshwater Eutrophication (FEU), Marine Eutrophication (MEU), Terrestrial Ecotixicity (TET), Freshwater Ecotoxicity (FET), Marine Ecotoxicity (MET), Human Carcinogenic Toxicity (HCT), Human Non Carcinogenic Toxicity (HNCT), Land Use (LU), Mineral Resource Scarcity (MRS), Fossil Resource Scarcity (FRS), Water Consumption Human Health (WCHH), Water Consumption Terrestrial Ecosystems (WCTE), and Water Consumption Aquatic Ecosystems (WCAE).
| Categories | Unit | N50, D1 | N50, D2 | N50, D3 | N100, D1 | N100, D2 | N100, D3 |
|---|
| GWHH | DALY | 3.48 × 10⁻⁶ | 3.17 × 10⁻⁶ | 2.70 × 10⁻⁶ | 5.99 × 10⁻⁶ | 2.99 × 10⁻⁶ | 2.44 × 10⁻⁶ |
| GWTE | species/yr | 6.96 × 10⁻⁹ | 6.34 × 10⁻⁹ | 5.40 × 10⁻⁹ | 1.20 × 10⁻⁸ | 5.99 × 10⁻⁹ | 4.88 × 10⁻⁹ |
| GWFE | species/yr | 1.90 × 10⁻¹³ | 1.73 × 10⁻¹³ | 1.47 × 10⁻¹³ | 3.27 × 10⁻¹³ | 1.63 × 10⁻¹³ | 1.33 × 10⁻¹³ |
| SOD | DALY | 6.57 × 10⁻⁹ | 5.96 × 10⁻⁹ | 5.02 × 10⁻⁹ | 1.66 × 10⁻⁸ | 8.83 × 10⁻⁹ | 7.09 × 10⁻⁹ |
| IR | DALY | 7.75 × 10⁻¹⁰ | 6.99 × 10⁻¹⁰ | 5.81 × 10⁻¹⁰ | 1.05 × 10⁻⁹ | 5.59 × 10⁻¹⁰ | 4.49 × 10⁻¹⁰ |
| OFHH | DALY | 6.71 × 10⁻¹⁰ | 6.03 × 10⁻¹⁰ | 4.99 × 10⁻¹⁰ | 8.82 × 10⁻¹⁰ | 4.78 × 10⁻¹⁰ | 3.82 × 10⁻¹⁰ |
| FPMF | DALY | 6.01 × 10⁻⁷ | 5.41 × 10⁻⁷ | 4.49 × 10⁻⁷ | 8.65 × 10⁻⁷ | 4.66 × 10⁻⁷ | 3.73 × 10⁻⁷ |
| OFTE | species/yr | 9.73 × 10⁻¹¹ | 8.75 × 10⁻¹¹ | 7.25 × 10⁻¹¹ | 1.28 × 10⁻¹⁰ | 6.94 × 10⁻¹¹ | 5.54 × 10⁻¹¹ |
| TA | species/yr | 5.89 × 10⁻¹⁰ | 5.31 × 10⁻¹⁰ | 4.42 × 10⁻¹⁰ | 9.68 × 10⁻¹⁰ | 5.19 × 10⁻¹⁰ | 4.15 × 10⁻¹⁰ |
| FEU | species/yr | 1.49 × 10⁻¹⁰ | 1.34 × 10⁻¹⁰ | 1.10 × 10⁻¹⁰ | 1.94 × 10⁻¹⁰ | 1.06 × 10⁻¹⁰ | 8.44 × 10⁻¹¹ |
| MEU | species/yr | 9.11 × 10⁻¹⁴ | 8.18 × 10⁻¹⁴ | 6.76 × 10⁻¹⁴ | 1.19 × 10⁻¹³ | 6.48 × 10⁻¹⁴ | 5.17 × 10⁻¹⁴ |
| TET | species/yr | 1.75 × 10⁻¹¹ | 1.58 × 10⁻¹¹ | 1.30 × 10⁻¹¹ | 2.29 × 10⁻¹¹ | 1.25 × 10⁻¹¹ | 9.95 × 10⁻¹² |
| FET | species/yr | 9.93 × 10⁻¹² | 8.92 × 10⁻¹² | 7.37 × 10⁻¹² | 1.29 × 10⁻¹¹ | 7.06 × 10⁻¹² | 5.63 × 10⁻¹² |
| MET | species/yr | 1.74 × 10⁻⁸ | 1.57 × 10⁻⁸ | 1.29 × 10⁻⁸ | 2.27 × 10⁻⁸ | 1.24 × 10⁻⁸ | 9.88 × 10⁻⁹ |
| HCT | DALY | 2.76 × 10⁻⁶ | 2.48 × 10⁻⁶ | 2.05 × 10⁻⁶ | 3.60 × 10⁻⁶ | 1.96 × 10⁻⁶ | 1.57 × 10⁻⁶ |
| HNCT | DALY | 3.16 × 10⁻⁵ | 2.84 × 10⁻⁵ | 2.35 × 10⁻⁵ | 4.12 × 10⁻⁵ | 2.25 × 10⁻⁵ | 1.79 × 10⁻⁵ |
| LU | species/yr | 1.22 × 10⁻⁹ | 1.84 × 10⁻⁹ | 2.73 × 10⁻⁹ | 1.10 × 10⁻⁸ | 1.45 × 10⁻⁹ | 2.09 × 10⁻⁹ |
| MRS | USD | 0.001435 | 0.001289 | 0.001065 | 0.001869 | 0.001021 | 0.000814 |
| FRS | USD | 0.057579 | 0.05202 | 0.043484 | 0.085886 | 0.045129 | 0.036336 |
| WCHH | DALY | 1.94 × 10⁻⁸ | 1.74 × 10⁻⁸ | 1.44 × 10⁻⁸ | 2.53 × 10⁻⁸ | 1.38 × 10⁻⁸ | 1.10 × 10⁻⁸ |
| WCTE | species/yr | 1.18 × 10⁻¹⁰ | 1.06 × 10⁻¹⁰ | 8.74 × 10⁻¹¹ | 1.54 × 10⁻¹⁰ | 8.39 × 10⁻¹¹ | 6.69 × 10⁻¹¹ |
| WCAE | species/yr | 5.27 × 10⁻¹⁵ | 4.73 × 10⁻¹⁵ | 3.91 × 10⁻¹⁵ | 6.89 × 10⁻¹⁵ | 3.75 × 10⁻¹⁵ | 2.99 × 10⁻¹⁵ |
Table 4.
Impact assessment of Ferimon genotype at different N fertilizer and plant density levels. D1, D2, and D3 = 40, 80, and 120 plants m−2; N100 and N50 = 100 and 50 kg of N ha−1. Global Warning Human Health (GWHH), Global Warming Terrestrial Ecosystems (GWTE), Global Warming Freshwater Ecosystems (GWFE), Stratospheric Ozone Depletion (SOD), Ionizing Radiation (IR), Ozone Formation Human Health (OFHH), Fine Particulate Matter Formation (FPMF), Ozone Formation Terrestrial Ecosystems (OFTE), Terrestrial Acidification (TA), Freshwater Eutrophication (FEU), Marine Eutrophication (MEU), Terrestrial Ecotixicity (TET), Freshwater Ecotoxicity (FET), Marine Ecotoxicity (MET), Human Carcinogenic Toxicity (HCT), Human Non Carcinogenic Toxicity (HNCT), Land Use (LU), Mineral Resource Scarcity (MRS), Fossil Resource Scarcity (FRS), Water Consumption Human Health (WCHH), Water Consumption Terrestrial Ecosystems (WCTE), and Water Consumption Aquatic Ecosystems (WCAE).
| Categories | Unit | N50, D1 | N50, D2 | N50, D3 | N100, D1 | N100, D2 | N100, D3 |
|---|
| GWHH | DALY | 2.96 × 10⁻⁶ | 2.07 × 10⁻⁶ | 1.54 × 10⁻⁶ | 2.65 × 10⁻⁶ | 2.65 × 10⁻⁶ | 1.96 × 10⁻⁶ |
| GWTE | species/yr | 5.91 × 10⁻⁹ | 4.13 × 10⁻⁹ | 3.07 × 10⁻⁹ | 5.30 × 10⁻⁹ | 5.30 × 10⁻⁹ | 3.92 × 10⁻⁹ |
| GWFE | species/yr | 1.61 × 10⁻¹³ | 1.13 × 10⁻¹³ | 8.39 × 10⁻¹⁴ | 1.45 × 10⁻¹³ | 1.45 × 10⁻¹³ | 1.07 × 10⁻¹³ |
| SOD | DALY | 5.58 × 10⁻⁹ | 3.88 × 10⁻⁹ | 2.86 × 10⁻⁹ | 7.89 × 10⁻⁹ | 7.89 × 10⁻⁹ | 5.68 × 10⁻⁹ |
| IR | DALY | 6.59 × 10⁻¹⁰ | 4.55 × 10⁻¹⁰ | 3.31 × 10⁻¹⁰ | 4.99 × 10⁻¹⁰ | 4.99 × 10⁻¹⁰ | 3.60 × 10⁻¹⁰ |
| OFHH | DALY | 5.70 × 10⁻¹⁰ | 3.93 × 10⁻¹⁰ | 2.84 × 10⁻¹⁰ | 4.28 × 10⁻¹⁰ | 4.28 × 10⁻¹⁰ | 3.06 × 10⁻¹⁰ |
| FPMF | DALY | 5.11 × 10⁻⁷ | 3.53 × 10⁻⁷ | 2.56 × 10⁻⁷ | 4.17 × 10⁻⁷ | 4.17 × 10⁻⁷ | 2.99 × 10⁻⁷ |
| OFTE | species/yr | 8.27 × 10⁻¹¹ | 5.70 × 10⁻¹¹ | 4.13 × 10⁻¹¹ | 6.21 × 10⁻¹¹ | 6.21 × 10⁻¹¹ | 4.44 × 10⁻¹¹ |
| TA | species/yr | 5.00 × 10⁻¹⁰ | 3.46 × 10⁻¹⁰ | 2.52 × 10⁻¹⁰ | 4.64 × 10⁻¹⁰ | 4.64 × 10⁻¹⁰ | 3.33 × 10⁻¹⁰ |
| FEU | species/yr | 1.27 × 10⁻¹⁰ | 8.71 × 10⁻¹¹ | 6.29 × 10⁻¹¹ | 9.49 × 10⁻¹¹ | 9.49 × 10⁻¹¹ | 6.77 × 10⁻¹¹ |
| MEU | species/yr | 7.74 × 10⁻¹⁴ | 5.33 × 10⁻¹⁴ | 3.85 × 10⁻¹⁴ | 5.81 × 10⁻¹⁴ | 5.81 × 10⁻¹⁴ | 4.14 × 10⁻¹⁴ |
| TET | species/yr | 1.49 × 10⁻¹¹ | 1.03 × 10⁻¹¹ | 7.42 × 10⁻¹² | 1.12 × 10⁻¹¹ | 1.12 × 10⁻¹¹ | 7.98 × 10⁻¹² |
| FET | species/yr | 8.44 × 10⁻¹² | 5.81 × 10⁻¹² | 4.20 × 10⁻¹² | 6.33 × 10⁻¹² | 6.33 × 10⁻¹² | 4.51 × 10⁻¹² |
| MET | species/yr | 1.48 × 10⁻⁸ | 1.02 × 10⁻⁸ | 7.37 × 10⁻⁹ | 1.11 × 10⁻⁸ | 1.11 × 10⁻⁸ | 7.92 × 10⁻⁹ |
| HCT | DALY | 2.35 × 10⁻⁶ | 1.62 × 10⁻⁶ | 1.17 × 10⁻⁶ | 1.76 × 10⁻⁶ | 1.76 × 10⁻⁶ | 1.26 × 10⁻⁶ |
| HNCT | DALY | 2.69 × 10⁻⁵ | 1.85 × 10⁻⁵ | 1.34 × 10⁻⁵ | 2.01 × 10⁻⁵ | 2.01 × 10⁻⁵ | 1.44 × 10⁻⁵ |
| LU | species/yr | 1.03 × 10⁻⁹ | 1.20 × 10⁻⁹ | 1.56 × 10⁻⁹ | 7.76 × 10⁻¹⁰ | 7.76 × 10⁻¹⁰ | 1.67 × 10⁻⁹ |
| MRS | USD | 0.00122 | 0.00084 | 0.000607 | 0.000915 | 0.000915 | 0.000652 |
| FRS | USD | 0.048942 | 0.033884 | 0.024773 | 0.040262 | 0.040262 | 0.02913 |
| WCHH | DALY | 1.65 × 10⁻⁸ | 1.13 × 10⁻⁸ | 8.19 × 10⁻⁹ | 1.24 × 10⁻⁸ | 1.24 × 10⁻⁸ | 8.82 × 10⁻⁹ |
| WCTE | species/yr | 1.00 × 10⁻¹⁰ | 6.89 × 10⁻¹¹ | 4.98 × 10⁻¹¹ | 7.52 × 10⁻¹¹ | 7.52 × 10⁻¹¹ | 5.36 × 10⁻¹¹ |
| WCAE | species/yr | 4.48 × 10⁻¹⁵ | 3.08 × 10⁻¹⁵ | 2.23 × 10⁻¹⁵ | 3.36 × 10⁻¹⁵ | 3.36 × 10⁻¹⁵ | 2.40 × 10⁻¹⁵ |
Table 5.
Impact assessment of Fedora 17 and Felina 32 genotypes at different N fertilizer and plant density levels. D1, D2, and D3 = 40, 80, and 120 plants m−2; N100 and N50 = 100 and 50 kg of N ha−1. Global Warning Human Health (GWHH), Global Warming Terrestrial Ecosystems (GWTE), Global Warming Freshwater Ecosystems (GWFE), Stratospheric Ozone Depletion (SOD), Ionizing Radiation (IR), Ozone Formation Human Health (OFHH), Fine Particulate Matter Formation (FPMF), Ozone Formation Terrestrial Ecosystems (OFTE), Terrestrial Acidification (TA), Freshwater Eutrophication (FEU), Marine Eutrophication (MEU), Terrestrial Ecotixicity (TET), Freshwater Ecotoxicity (FET), Marine Ecotoxicity (MET), Human Carcinogenic Toxicity (HCT), Human Non Carcinogenic Toxicity (HNCT), Land Use (LU), Mineral Resource Scarcity (MRS), Fossil Resource Scarcity (FRS), Water Consumption Human Health (WCHH), Water Consumption Terrestrial Ecosystems (WCTE), and Water Consumption Aquatic Ecosystems (WCAE).
| Categories | Unit | N50, D1 | N50, D2 | N50, D3 | N100, D1 | N100, D2 | N100, D3 |
|---|
| GWHH | DALY | 3.43 × 10⁻⁶ | 2.43 × 10⁻⁶ | 1.90 × 10⁻⁶ | 3.91 × 10⁻⁶ | 2.56 × 10⁻⁶ | 2.26 × 10⁻⁶ |
| GWTE | species/yr | 6.86 × 10⁻⁹ | 4.87 × 10⁻⁹ | 3.81 × 10⁻⁹ | 7.82 × 10⁻⁹ | 5.12 × 10⁻⁹ | 4.52 × 10⁻⁹ |
| GWFE | species/yr | 1.87 × 10⁻¹³ | 1.33 × 10⁻¹³ | 1.04 × 10⁻¹³ | 2.13 × 10⁻¹³ | 1.40 × 10⁻¹³ | 1.23 × 10⁻¹³ |
| SOD | DALY | 6.47 × 10⁻⁹ | 4.57 × 10⁻⁹ | 3.54 × 10⁻⁹ | 1.16 × 10⁻⁸ | 7.55 × 10⁻⁹ | 6.57 × 10⁻⁹ |
| IR | DALY | 7.64 × 10⁻¹⁰ | 5.36 × 10⁻¹⁰ | 4.10 × 10⁻¹⁰ | 7.36 × 10⁻¹⁰ | 4.78 × 10⁻¹⁰ | 4.16 × 10⁻¹⁰ |
| OFHH | DALY | 6.61 × 10⁻¹⁰ | 4.63 × 10⁻¹⁰ | 3.52 × 10⁻¹⁰ | 6.31 × 10⁻¹⁰ | 4.08 × 10⁻¹⁰ | 3.54 × 10⁻¹⁰ |
| FPMF | DALY | 5.93 × 10⁻⁷ | 4.15 × 10⁻⁷ | 3.17 × 10⁻⁷ | 6.15 × 10⁻⁷ | 3.98 × 10⁻⁷ | 3.45 × 10⁻⁷ |
| OFTE | species/yr | 9.59 × 10⁻¹¹ | 6.72 × 10⁻¹¹ | 5.11 × 10⁻¹¹ | 9.16 × 10⁻¹¹ | 5.93 × 10⁻¹¹ | 5.13 × 10⁻¹¹ |
| TA | species/yr | 5.80 × 10⁻¹⁰ | 4.08 × 10⁻¹⁰ | 3.12 × 10⁻¹⁰ | 6.84 × 10⁻¹⁰ | 4.43 × 10⁻¹⁰ | 3.85 × 10⁻¹⁰ |
| FEU | species/yr | 1.47 × 10⁻¹⁰ | 1.03 × 10⁻¹⁰ | 7.80 × 10⁻¹¹ | 1.40 × 10⁻¹⁰ | 9.05 × 10⁻¹¹ | 7.82 × 10⁻¹¹ |
| MEU | species/yr | 8.98 × 10⁻¹⁴ | 6.28 × 10⁻¹⁴ | 4.77 × 10⁻¹⁴ | 8.57 × 10⁻¹⁴ | 5.54 × 10⁻¹⁴ | 4.78 × 10⁻¹⁴ |
| TET | species/yr | 1.73 × 10⁻¹¹ | 1.21 × 10⁻¹¹ | 9.19 × 10⁻¹² | 1.65 × 10⁻¹¹ | 1.07 × 10⁻¹¹ | 9.22 × 10⁻¹² |
| FET | species/yr | 9.78 × 10⁻¹² | 6.84 × 10⁻¹² | 5.20 × 10⁻¹² | 9.33 × 10⁻¹² | 6.03 × 10⁻¹² | 5.21 × 10⁻¹² |
| MET | species/yr | 1.72 × 10⁻⁸ | 1.20 × 10⁻⁸ | 9.13 × 10⁻⁹ | 1.64 × 10⁻⁸ | 1.06 × 10⁻⁸ | 9.15 x 10⁻⁹ |
| HCT | DALY | 2.72 × 10⁻⁶ | 1.90 × 10⁻⁶ | 1.45 × 10⁻⁶ | 2.60 × 10⁻⁶ | 1.68 × 10⁻⁶ | 1.45 × 10⁻⁶ |
| HNCT | DALY | 3.11 × 10⁻⁵ | 2.18 × 10⁻⁵ | 1.65 × 10⁻⁵ | 2.97 × 10⁻⁵ | 1.92 × 10⁻⁵ | 1.66 × 10⁻⁵ |
| LU | species/yr | 1.20 × 10⁻⁹ | 1.41 × 10⁻⁹ | 1.93 × 10⁻⁹ | 1.14 × 10⁻⁹ | 1.24 × 10⁻⁹ | 1.93 × 10⁻⁹ |
| MRS | USD | 0.001415 | 0.00099 | 0.000751 | 0.00135 | 0.000873 | 0.000754 |
| FRS | USD | 0.056742 | 0.039933 | 0.03068 | 0.059371 | 0.038572 | 0.033656 |
| WCHH | DALY | 1.91 × 10⁻⁸ | 1.34 × 10⁻⁸ | 1.01 × 10⁻⁸ | 1.82 × 10⁻⁸ | 1.18 × 10⁻⁸ | 1.02 × 10⁻⁸ |
| WCTE | species/yr | 1.16 × 10⁻¹⁰ | 8.12 × 10⁻¹¹ | 6.17 × 10⁻¹¹ | 1.11 × 10⁻¹⁰ | 7.17 × 10⁻¹¹ | 6.20 × 10⁻¹¹ |
| WCAE | species/yr | 5.19 × 10⁻¹⁵ | 3.63 × 10⁻¹⁵ | 2.76 × 10⁻¹⁵ | 4.96 × 10⁻¹⁵ | 3.21 × 10⁻¹⁵ | 2.77 × 10⁻¹⁵ |
Table 6.
Impact assessment of Epsilon 68, Futura 75 and Santhica 27 genotypes at different N fertilizer and plant density levels. D1, D2, and D3 = 40, 80, and 120 plants m−2; N100 and N50 = 100 and 50 kg of N ha−1. Global Warning Human Health (GWHH), Global Warming Terrestrial Ecosystems (GWTE), Global Warming Freshwater Ecosystems (GWFE), Stratospheric Ozone Depletion (SOD), Ionizing Radiation (IR), Ozone Formation Human Health (OFHH), Fine Particulate Matter Formation (FPMF), Ozone Formation Terrestrial Ecosystems (OFTE), Terrestrial Acidification (TA), Freshwater Eutrophication (FEU), Marine Eutrophication (MEU), Terrestrial Ecotixicity (TET), Freshwater Ecotoxicity (FET), Marine Ecotoxicity (MET), Human Carcinogenic Toxicity (HCT), Human Non Carcinogenic Toxicity (HNCT), Land Use (LU), Mineral Resource Scarcity (MRS), Fossil Resource Scarcity (FRS), Water Consumption Human Health (WCHH), Water Consumption Terrestrial Ecosystems (WCTE), and Water Consumption Aquatic Ecosystems (WCAE).
| Categories | Unit | N50, D1 | N50, D2 | N50, D3 | N100, D3 | N100, D1 | N100, D2 | N100, D3 |
|---|
| GWHH | DALY | 0.000177 | 0.000136 | 0.000125 | 3.33 × 10⁻⁵ | 3.44 × 10⁻⁵ | 3.3 × 10⁻⁵ | 3.33 × 10⁻⁵ |
| GWTE | species/yr | 3.55 × 10⁻⁷ | 2.71 × 10⁻⁷ | 2.50 × 10⁻⁷ | 6.67 × 10⁻⁸ | 6.88 × 10⁻⁸ | 6.63 × 10⁻⁸ | 6.67 × 10⁻⁸ |
| GWFE | species/yr | 9.68 × 10⁻¹² | 7.40 × 10⁻¹² | 6.82 × 10⁻¹² | 1.82 × 10⁻¹² | 1.88 × 10⁻¹² | 1.81 × 10⁻¹² | 1.82 × 10⁻¹² |
| SOD | DALY | 3.35 × 10⁻⁷ | 2.55 × 10⁻⁷ | 2.32 × 10⁻⁷ | 9.68 × 10⁻⁸ | 1.02 × 10⁻⁷ | 9.78 × 10⁻⁸ | 9.68 × 10⁻⁸ |
| IR | DALY | 3.95 × 10⁻⁸ | 2.99 × 10⁻⁸ | 2.69 × 10⁻⁸ | 6.13 × 10⁻⁹ | 6.48 × 10⁻⁹ | 6.19 × 10⁻⁹ | 6.13 × 10⁻⁹ |
| OFHH | DALY | 3.42 × 10⁻⁸ | 2.58 × 10⁻⁸ | 2.31 × 10⁻⁸ | 5.21 × 10⁻⁹ | 5.55 × 10⁻⁹ | 5.29 × 10⁻⁹ | 5.21 × 10⁻⁹ |
| FPMF | DALY | 3.07 × 10⁻⁵ | 2.31 × 10⁻⁵ | 2.08 × 10⁻⁵ | 5.09 × 10⁻⁶ | 5.41 × 10⁻⁶ | 5.16 × 10⁻⁶ | 5.09 × 10⁻⁶ |
| OFTE | species/yr | 4.96 × 10⁻⁹ | 3.74 × 10⁻⁹ | 3.36 × 10⁻⁹ | 7.57 × 10⁻¹⁰ | 8.06 × 10⁻¹⁰ | 7.69 × 10⁻¹⁰ | 7.57 × 10⁻¹⁰ |
| TA | species/yr | 3.00 × 10⁻⁸ | 2.27 × 10⁻⁸ | 2.05 × 10⁻⁸ | 5.67 × 10⁻⁹ | 6.02 × 10⁻⁹ | 5.74 × 10⁻⁹ | 5.67 × 10⁻⁹ |
| FEU | species/yr | 7.59 × 10⁻⁹ | 5.72 × 10⁻⁹ | 5.12 × 10⁻⁹ | 1.15 × 10⁻⁹ | 1.23 × 10⁻⁹ | 1.17 × 10⁻⁹ | 1.15 × 10⁻⁹ |
| MEU | species/yr | 4.65 × 10⁻¹² | 3.50 × 10⁻¹² | 3.13 × 10⁻¹² | 77.05 × 10⁻¹³ | 7.54 × 10⁻¹³ | 7.18 × 10⁻¹³ | 7.05 × 10⁻¹³ |
| TET | species/yr | 8.94 × 10⁻¹⁰ | 6.74 × 10⁻¹⁰ | 6.04 × 10⁻¹⁰ | 1.36 × 10⁻¹⁰ | 1.45 × 10⁻¹⁰ | .1.38 × 10−10 | 1.36 × 10⁻¹⁰ |
| FET | species/yr | 5.06 × 10⁻¹⁰ | 3.81 × 10⁻¹⁰ | 3.41 × 10⁻¹⁰ | 7.68 × 10⁻¹¹ | 8.21 × 10⁻¹¹ | 7.82 × 10⁻¹¹ | 7.68 × 10⁻¹¹ |
| MET | species/yr | 8.89 × 10⁻⁷ | 6.69 × 10⁻⁷ | 5.99 × 10⁻⁷ | 1.35 × 10⁻⁷ | 1.44 × 10⁻⁷ | 1.37 × 10⁻⁷ | 1.35 × 10⁻⁷ |
| HCT | DALY | 0.000141 | 0.000106 | 9.50 × 10⁻⁵ | 2.14 × 10⁻⁵ | 2.28 × 10⁻⁵ | 2.18 × 10⁻⁵ | 2.14 × 10⁻⁵ |
| HNCT | DALY | 0.001612 | 0.001213 | 0.001087 | 0.000245 | 0.000261 | 0.000249 | 0.000245 |
| LU | species/yr | 6.20 × 10⁻⁸ | 7.85 × 10⁻⁸ | 1.27 × 10⁻⁷ | 2.85 × 10⁻⁸ | 1.01 × 10⁻⁸ | 1.61 × 10⁻⁸ | 2.85 × 10⁻⁸ |
| MRS | USD | 0.073199 | 0.055103 | 0.049343 | 0.011108 | 0.011876 | 0.011309 | 0.011108 |
| FRS | USD | 2.936431 | 2.223787 | 2.01486 | 0.495994 | 0.522288 | 0.499905 | 0.495994 |
| WCHH | DALY | 9.88 × 10⁻⁷ | 7.44 × 10⁻⁷ | 6.66 × 10⁻⁷ | 1.50 × 10⁻⁷ | 1.60 × 10⁻⁷ | 1.53 × 10⁻⁷ | 1.50 × 10⁻⁷ |
| WCTE | species/yr | 6.01 × 10⁻⁹ | 4.52 × 10⁻⁹ | 4.05 × 10⁻⁹ | 9.13 ×10⁻¹⁰ | 9.76 × 10⁻¹⁰ | 9.29 × 10⁻¹⁰ | 9.13 × 10⁻¹⁰ |
| WCAE | species/yr | 2.69 × 10⁻¹³ | 2.02 ×10⁻¹³ | 1.81 ×10⁻¹³ | 4.09 ×10⁻¹⁴ | 4.36 ×10⁻¹⁴ | 4.16 × 10⁻¹⁴ | 4.09 × 10⁻¹⁴ |

 ,
, 


