Intellectual Capital of a Trading Company: Comprehensive Analysis Based on Reporting


1
Graduate School of Service and Trade, Institute of Industrial Management, Economics and Trade, Peter the Great St. Petersburg Polytechnic University, 29 Polytechnicheskaya St., 195251 St. Petersburg, Russia
2
Department of General Economic Theory and History of Economic Thought, St. Petersburg State University of Economics, Sadovaya Str. 21, 191023 St. Petersburg, Russia
*
Author to whom correspondence should be addressed.
Sustainability 2020, 12(17), 7095; https://doi.org/10.3390/su12177095
Submission received: 31 July 2020
/
Revised: 24 August 2020
/
Accepted: 27 August 2020
/
Published: 31 August 2020
(This article belongs to the Section Economic and Business Aspects of Sustainability)
Abstract
:The study is devoted to the analysis of the efficiency of use and the effectiveness of disclosing the intellectual capital (IC) of a trading company operating in the market of the Russian Federation. The subject of the research is an assessment of the quality of disclosure of information about the IC company involved in the creation of financial results of activities and the growth of the company’s value. The study examines the assessment of IC and the search for links between the involvement of IC in the formation of the financial result of a trading company and the degree of its reflection in the company’s annual reports. Methods of using intellectual value-added coefficients (VAIC) such as the trademark logo (written as ™), Calculated Intangible Value (CIV) and content analysis of the company’s annual reports are used to assess the IC and its elements. The influence of IC and its components, on the financial results of a trading company are also investigated and calculated using various methods. It is shown that there are no statistically significant relationships between the assessments of IC and its elements obtained using financial ratios, and those obtained using content analysis. This indicates that the opinions and assessments of the heads of a trading company regarding IC are formed regardless of the size of IC involved in the formation of economic results and testifies to the absence of an effective investment management policy in the studied company. Some of the results obtained confirm the trends in IC structures previously observed for companies in other industries. The results also indicate that the existing system for preparing annual reports does not sufficiently consider the size, dynamics and efficiency of using the intangible assets of a trading company. The results of this study are likely to be useful to management and academics.
1. Introduction
Research on intellectual capital came to the fore in economic research at the end of the 20th century. Lev called the emergence of the concept of intellectual capital “the main economic event of the late XX and early XXI centuries” [1]. This attention by researchers towards the new economic categories of “intellectual assets” and “intellectual capital” was due to several factors.
First, at the end of the 20th century, annual investments in intangible assets in the corporate sector were at first equalized, and then began to exceed investments in tangible assets [1,2,3], while a significant part of the market value of companies is still not reflected in any way in the balance sheets of companies, i.e., remains unidentifiable, and, therefore, is difficult to use to predict value. All this leads to a situation of having insufficient information when making investment decisions.
Secondly, the concept of company management on the basis of value, actively developed and used since the end of the 20th century, made it possible to identify financial levers for successful management of the operation and development of companies [4,5,6,7]. At the same time, it became clear that the use of only financial leverage to manage a company is insufficient, and there are additional, non-financial management tools that often play a more significant role in shaping the success of a company. This led to the formation of a new direction in assessing the aspects of the activities and development of companies, and the emergence of such new tools as the Balanced Scorecard (BSC) [8], Skandia Navigator™ [9] and others. In them, an attempt to assess the intellectual company’s capital was made, based on the implementation of an indicators system that reflects the dynamics of individual components of intellectual capital. The analysis of the peculiarities of the companies functioning revealed that the basis of the company’s success and their competitive advantage is knowledge and the ability to use it effectively.
The third aspect is the development of the knowledge economy, as well as the infrastructure that contributes to their formation, accumulation and effective use in the process of activity. The development of technologies for informatization and networkization of activities has also made a significant contribution to the development of the concept of intellectual capital and marked the transition to a completely new paradigm of company management based on intellectual capital. Now every company, if it wants to succeed and ensure its sustainable existence and development, must be able to manage its IQ, using the widest arsenal of various metrics and management methods [10,11].
Another factor is the further development of the resource theory of the enterprise [12,13,14]. In accordance with this, the competitive advantages of an enterprise are formed due to its ability to combine available resources in such a way as to achieve superiority in the competition, providing a higher rate of return on invested capital. Thus, the ability of the organization, as codified knowledge, becomes the fundamental basis for the success of activities [15,16,17]. Currently, IC is becoming the most important factor in sustainable development both at the country and regional level, and at the enterprise level. The factor of intellectual capital becomes the leading one in the management of production and reproduction processes in the economic system [18,19].
Thus, it can be stated that the well-known concept of “land-labor-capital” at the end of the twentieth century was transformed into a new concept of “land-labor-capital-entrepreneurship-knowledge” [20]. Thus, among all factors of production, the greatest value added return was the knowledge that began to be generated. This knowledge, in the economic interpretation of the key factor that allows generating benefit over a long period of time by ensuring a company’s competitive edge, is the basis of intellectual capital. This knowledge, combined with the potential of human skills, competencies, ideas, intuition, professional experience, working methods and customer relationships, is called intellectual capital [20].
The main purpose of this study is to analyze the existing possibilities for assessing the intellectual capital of companies based on their reporting, which includes not only accounting and financial statements, but also annual statements. The use of the entire aggregate of available reports for the analysis makes it possible to form a unified approach to the study of the intellectual capital of companies without using internal management reporting, which is often inaccessible for external evaluation and is, in a sense, subjective. In this study, it is proposed to expand the analysis base by attracting information and annual reports of a company.
This approach will expand the basis for assessing the intellectual capital of an enterprise, obtain information for a balanced assessment of individual elements and assess the attention that the company’s management pays to the management of intellectual capital. Taken together, all this makes it possible to give a balanced assessment of intellectual capital and assess how much the company’s results coincide with the way the company organizes intellectual capital management.
2. Literature Review and Hypothesis Development
2.1. The Concept and Essence of IC
Intellectual capital (IC) is a complex economic concept consisting of two terms reflecting its features. The leading concept in this phrase is capital. Capital is a complex economic concept, the phenomenon of which is manifested in its constant movement and interaction with other factors of production [21]. Attempts to use a static approach for the concept of capital, as a rule, significantly narrow down its understanding and do not reveal all the features of capital as an economic category [22].
IC is a special type of capital, which, along with ordinary capital, has become one of the most important factors of production since the late 1970s. The reason for this was the development of a post-industrial society [23,24], which is characterized by the dominant role of theoretical knowledge and the expansion of the service sector relative to the industrial sector. According to D. Bell, knowledge is becoming the leading source of surplus value in post-industrial society, just as labor and capital were the leading sources of surplus value in industrial society [25].
In the modern sense, IC is an intangible asset involved in creating value together with other assets by transforming them into other intangible resources, or into material resources in order to maximize the current value of the company from the point of view of owners and stakeholders.
In our opinion, the definition proposed in [26] is deeper, where the intellectual capital of a company is understood as resources and abilities that are strategic in nature, difficult to imitate and affecting the formation of unique capabilities of a company.
IC, as a new factor in the development of the economy of companies, has several features that make it unique. These features include the following:
- intangible assets that form the basis of intellectual capital, unlike physical assets, do not have a material embodiment (it is important not to confuse tangible assets with their physical carriers, which allow them to be stored and used in activities), which means certain mechanisms are required for their effective use [3];
- the elements forming intellectual capital have “partial exclusion” [3], which means there is an absence of mechanisms for complete control as well as for ensuring certainty and the protection of the company’s intellectual capital property rights, which leads to the problem of accounting for these assets in corporate balance sheets;
- non-marketability of elements of intellectual capital, which is due to their practical lack of tradability in the markets, and, as a consequence, the lack of a basis for assessing these elements, incomplete rights to these intellectual assets as well as high market asymmetry (this factor also causes a higher vulnerability for companies with a high intellectual capital) [11].
In addition to the features discussed above, the authors would like to note several features that, as a rule, are not considered by researchers. In the modern concept of the resource approach, the resource advantage is ensured, first, in the advantage in intellectual resources (the importance of the advantage in material resources decreases due to the expansion of access to the most advanced equipment and technologies and the development of telecommunication technologies). Other notably features are:
- the duality of the nature of intellectual capital, which is due to the fact that, from the point of view of the resource concept, it acts on the one hand as a resource (factor), and on the other hand, as an “organizational ability” (how the IC is structured, ordered and involved in the company’s activities), which solves the problem of not only efficient production, but also the problem of effective reproduction (both conventional and extended) [27,28];
- high uncertainty in the lifespan of certain elements of intellectual capital, which, on the one hand, is due to the high information asymmetry between those who use intellectual capital and those who try to copy it, and on the other hand, the rapid obsolescence of elements of intellectual capital, that is, there are no clear criteria for determining the time during which an element of intellectual capital retains its advantages.
In this regard, it is obvious that the disclosure of information about a company’s intellectual capital reduces uncertainty and helps to increase investor confidence. This can explain the success of such a tool for working with IC as Edvinson’s “Scandia Navigator” [9], which, acting as an innovation, allows external agents to reduce the degree of uncertainty. At the same time, we would also like to note that in the future will be impossible to exclude manipulations with indicators and indicators of intellectual capital. The lack of standards for measuring and presenting information about intellectual capital to external users can lead to the temptation of manipulating data about it, as has already happened in the field of financial capital (Here it is appropriate to recall the examples of the firms Enron and Marconi).
The IC category is a generally recognized term for intangible and intangible assets involved in creating a company’s value together with other assets by transforming them into other intangible resources, or into tangible resources in order to maximize the company’s current value from the point of view of owners and stakeholders. It is the use of such assets in the process of value creation that transforms intangible and intangible assets into capital. This, during its circulation, leads to the creation of additional value in a company through the creation of value for owners and stakeholders.
The above features bring the task of managing IC to the fore in the company’s management system. However, in order to manage intellectual capital, it is necessary to solve a few fundamental problems, which include the following:
- Building a system for measuring IC and its elements in a company, consistent with its development strategy;
- Development of models of the relationship between the value of the IC and its elements and the performance of the company (in this case, it is necessary to consider the correlation between individual elements within the IC);
- Development of a system of factors and drivers (levers), impact on the value of IC;
- Development of specific mechanisms and technologies for managing the level of IC and its elements in the company;
- Development of IC management policies and programs, consistent with the company’s development strategy, representing the basic rules and principles, as well as coordinated activities such as research and development, linked in place, time and resources, which should lead to the achievement of certain goals in the company’s activities and development;
- Integration of the developed management policy and programs into the company’s management system, control of the implemented measures in the field of IC management;
- Development of effective and adequate methods of ensuring communication with stakeholders regarding the disclosure of the results and intentions of the company’s management in terms of management and development of IC.
From the problems listed above, it becomes clear that IC management in a company should be purposeful and systematic, i.e., represent regular management. At the same time, as practice shows, there is still a deep chasm between the recognition of intellectual capital as the most important category and object of management in modern company management and the development of specific methods, technologies, policies and management programs. In [29], the author compares the IC of a company with the underwater part of an iceberg. In addition, unfortunately, we have not yet fully explored this underwater part.
The current structure of intellectual capital usually includes three main elements: human capital (HC), structural capital (SC) and relational capital (RC).
There are other types of classification of IC elements, which in one direction or another expand the classification of IC. At the same time, if we compare the structure of the IC and the formal model of the value chain, it will become obvious that these structures are not fully correlated with each other. So, for example, human capital, as one of the most important elements of IC, is barely reflected in the value chain; moreover, value creation networks, as more complete models of the process of creating value in a company in their modern known form, do not contain value creation cycles for personnel of a company. We understand that personnel (employees)are one of the most important stakeholders, are suppliers of resources such as labor, which is one of the most fundamental factors for a company’s existence and its ability to create added value; finally, personnel are a bearer of knowledge and skills, an element of intellectual capital. Thus, using the example of human capital, we see that to evaluate it will obviously require a rather complex system of indicators that should evaluate it from various angles.
At the same time, within the framework of the approaches available, other stakeholders, such as suppliers, government authorities and public organizations, are included in the value chains or networks, and then it becomes necessary to use a value creation network, based on which a network of costs for the production of a specific type of value can be formed. The network or value chain provides insight into how elements of intellectual capital are incorporated. Thus, it becomes possible to evaluate IC [11].
It is important to note that the purpose of a company’s activities in relation to stakeholders is to create value, in relation to owners to ensure the growth of shareholder value is not lower than the required level and in relation to itself to ensure a safe state of operation, in which the growth in value plays a leading role. In this regard, quite extensive research is currently aimed at studying the impact of intellectual capital, as well as its components, on the value of companies [26,27,30].
In these studies, it is possible to find a stable positive multiplicative relationship between the elements of IC and the performance of companies. However, this result often depends on the chosen IC assessment model, the considered markets and regions in which the companies operate as well as their industry affiliation [31]. In addition, econometric studies have not yet fully answered the question of how investment in IC elements and returns are related. Often, in order to make a decision, we need to be confident that the returns must be increasing in nature, but there is not enough research on this yet.
2.2. Methods for Assessing the IC of Enterprises
Currently, several approaches have been formed to assess the level of a company’s intellectual capital. The systematization of methods for assessing a company’s IC is presented in the works of D. Luiti, M. Williams, M. Ruus [11,32,33]. Currently, there are five groups of methods for assessing IC at the micro level:
- Proper Measurement Systems, MS [11].
The application of most methods requires the use of accounting, financial statements, as well as confidential information about the company’s activities. In addition, some methods require different market metrics to be used to determine risk-free rates, industry average beta, industry average profitability levels, etc., which vary greatly by market type and current economic environment.
Currently, another method for assessing the company’s intellectual capital has been developed, which consists in conducting content analysis of the company’s annual or integrated reports. The same category includes methods for analyzing information from external sources—company websites, speeches of officials and top managers, analysis of the number of shares, etc.
2.2.1. VAIC Intellectual Capital Assessment Method
The Value Added Intellectual Coefficient (VAIC™) method is the most common method for assessing and measuring IC, which is widely used by many scientists and practitioners in IC research [48,49,50].
- VAIC is simple and straightforward for measuring IC value.
- The VAIC method is distinguished by the presence of detailed links between the company’s operations, the resources used and the financial result.
- The calculation of the VAIC™ indicator can be performed based on the information of the corporate financial report; in addition, it does not require the use of specific market indicators and significant transformations of indicators.
- The VAIC™ method is more objective than other assessment methods because the data and results used are easy to verify.
- VAIC™ allows cross-comparison because other measurement methods require both financial and non-financial estimates, which can sometimes be subjective.
- The VAIC™ method can be used to measure IC and organize activities in all types of industries.
These features have led to a widespread use of the VAIC method for measuring and evaluating IC. Using this method, the influence of IC on the value, sustainable growth, and the cost of equity capital of companies in various industries is studied [53,54,55,56,57,58,59,60].
The idea of the method is that, according to the author, the creation of benefit in a company is determined by two components: physical capital and IC [39]. Therefore, the efficiency of benefit creation will be determined by the efficiency of the use of physical (or involved) capital (CEE) and the efficiency of IC (ICE). ICE itself is composed of Human Capital Efficiency (HCE) and Structural Capital Efficiency (SCE). ICE is the simple sum of these three efficiencies.
At the same time, despite its widespread use, some authors point out that it is not always possible to find a relationship between IC indicators and the market value of a company [30,61].
In addition, the disadvantages of VAIC include the fact that it does not consider the traditional third component of IC—relational capital. Many researchers believe that the missing relational capital component in VAIC is the reason for the inconsistency of IC research results using this VAIC method [62].
The development of the VAIC methodology is currently a modified MVAIC model, in which the coefficient of efficiency of using relational capital RCE is added [51,63]. According to the MVAIC model, ICE will have three components: HCE, SCE and RCE. At the same time, the use of the MVAIC model requires the involvement of additional information about the company’s activities, which is not always adequately reflected in the financial statements; therefore, the MVAIC model is much less common than the VAIC. In this study, we also used the VAIC model.
2.2.2. Method for Assessing Intellectual Capital Using the CIV Indicator
Calculated Intangible Value (CIV) is a scheme developed by Thomas Stewart in 1997 to help investors and company management assess the value of knowledge-intensive companies and increase interest in intellectual capital [64]. This calculation method assumes that investments in physical assets can bring only the average industry income, and everything that the company receives in excess of it is due to the competent use of its intangible assets. An increase in the CIV indicator over time indicates a company’s ability to generate income in the future, and vice versa, a decrease in the indicator indicates that investments in intangible assets or structural changes in the company do not pay off [65]. Among the advantages of this method, researchers note the simplicity of calculations and the availability of data, which can be obtained directly from the annual reports of public companies on official websites. In addition, the indicator is suitable for both intra-industry and inter-industry comparisons [66].
The disadvantages of this method include the following [66]:
First, within the framework of this method, intangible assets are not disaggregated and not separated; for example, it does not separate the physical and financial assets of the company.
Secondly, the method is based on the return on assets indicator, which can be overestimated, underestimated or negative for some companies.
Third, the key idea of the method is that only companies with a profitability higher than the industry average have intellectual capital, but in some, especially knowledge-intensive, industries, even medium-sized companies have intellectual capital, so estimates can be significantly biased.
The method, in addition to the company’s financial statements, requires the use of specific market and economic indicators, which complicates the calculations.
To overcome these shortcomings, in [66], a modified model for assessing IC based on the return on net assets is proposed. In this model, the part of the cost that exceeds the industry average return on the company’s net assets and is capitalized over an infinite time interval at the weighted average rate of capital costs, which acts as an assessment of the IC.
2.2.3. Method for Assessing Intellectual Capital Using Content Analysis of Annual Reports
Expanding the range of approaches and methods used to analyze IC companies is important. This makes it possible to expand both the initial empirical base for assessment and to present a broader system of working with intellectual capital in a company for stakeholders.
One of the promising methods for changing the intellectual capital of companies is a method based on content analysis of annual reports and integrated reporting of companies [67,68,69]. This approach differs from the well-known approaches based on financial information because there is no unified methodology for presenting and disclosing information about the intellectual capital of companies and its elements in the annual reports and integrated reports of companies. In modern reports, there is no corresponding section dedicated to the management of intellectual capital. At the same time, it is obvious that management understands the importance of using annual reports as a communication channel with stakeholders and uses this channel to disclose information about their company’s IC.
The study of a company’s IC based on content analysis of annual and integrated reports of the company is based on the measurement of IC elements and its value as a whole based on the frequency of disclosure of certain components in the texts of the above documents.
From a methodological point of view, the types of content analysis that are currently used to study various socio-economic aspects are divided into two approaches depending on the methods for registering counting units.
The first approach is based on calculating the facts of disclosure of certain accounting units. When a unit is found in the text, the search stops. In this case, the information disclosure indices act as a quantitative assessment, as the ratio of disclosed counting units to the total number of counting units that are searched for in the text [70,71,72,73,74]. In this approach, information items are only used once. At the same time, this approach, called the “virginity principle” or “appearance approach” of counting information, does not allow us to assess the importance of a counting unit that is conveyed in the analyzed document.
The second approach is based on counting the number of mentions of certain accounting units. Many researchers point out that the amount of disclosure is important, as it shows the importance of a category [75,76,77,78]. In the opinion of these researchers, volumetric analysis is a completely acceptable research method, which allows you to reveal the importance of information.
In addition, in content analysis, approaches are distinguished based on the calculation of various transcoding units. These can be words, sentences or paragraphs. Obviously, the category of text, as a single element, cannot be used in the content analysis of annual and integrated reports due to the wide variety of topics covered, as well as its rather large volume. Regarding the use of different recoding units, each of the approaches has its own advantages and disadvantages [68,75]. Thus, the use of words (or phrases) as a transcoding unit does not always allow us to accurately determine whether it belongs to a particular category. On the other hand, the use of sentences or paragraphs requires considering the multiple forms of content, and, as a result, the use of special analytical procedures that would allow for separating these topics. This, in turn, can also lead to certain errors when calculating in an automatic way. In any case, the choice of the transcoding unit remains with the researcher, the fundamental point is that all the basic rules, conditions for transcoding, as well as dictionaries or categories and subcategories of transcoding are strictly disclosed in the study. All this will allow us in the future to increase the comparability and reliability of the results obtained, as well as to choose the most adequate options for the content analysis method.
It is believed that reflecting information about IC in annual reports, as well as in integrated reports, will help with the management and control of company knowledge, as it shows stakeholders how and with what efforts a company develops its intellectual capital [79,80]. Placing information about IC in the annual reports of companies is one of the key channels of voluntary disclosure for stakeholders [81,82,83]. However, in the total number of studies, the use of the content analysis method of annual reports for IC research is much less common than research using other methods, for example, methods based on the analysis of the financial statements of companies.
Several studies have found results showing that content analysis in annual reports is dominated by information from relational capital (RC), reflecting the prevailing value for shareholders [69,70,75,82,84,85,86]. Comparable RC disclosures in research are evident, showing that companies around the world agree that RC information is strategically more important than HC and SC. Some prominent IC categories that may reflect the importance of adding value to companies are information about customers, employees, community, director skills, distribution channels and business partners [87].
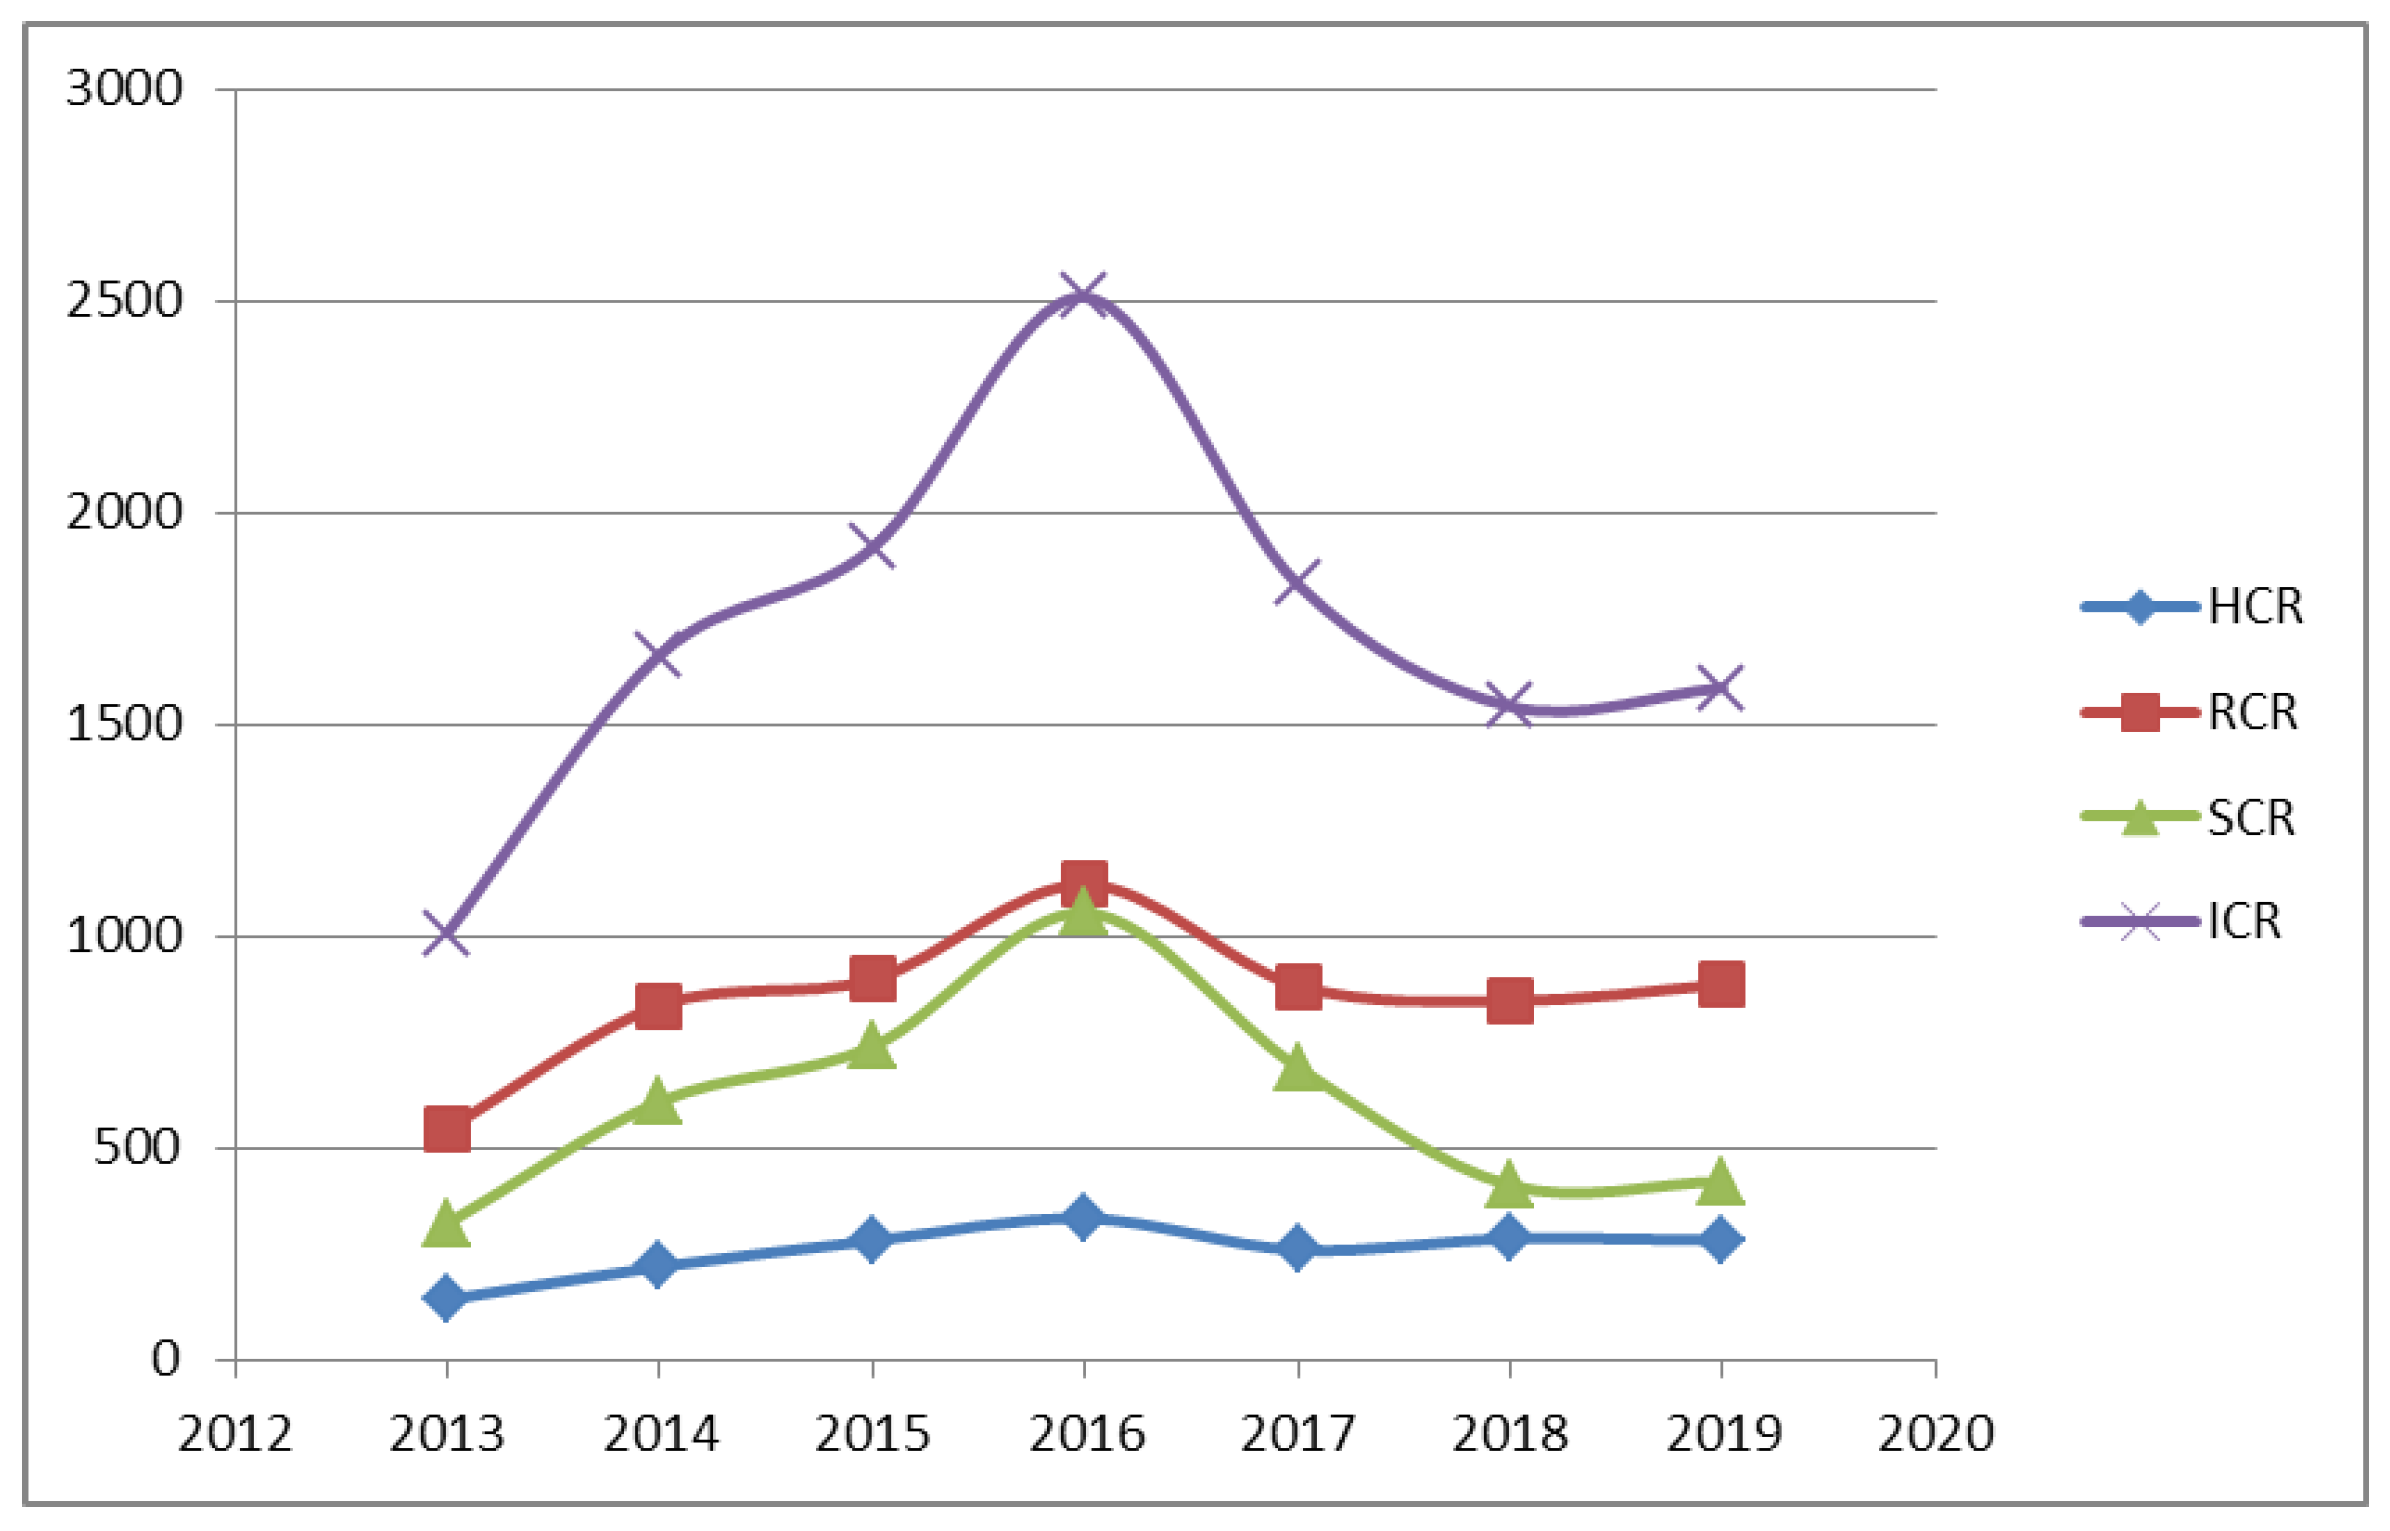
Using content analysis, quantitative estimates of the intellectual capital ICR and its structural elements—human capital resources (HCR), structural capital resources (SCR) and relational capital resources (RCR)—were obtained.
2.3. Intellectual Capital of Trading Companies
The trade sector in the Russian Federation belongs to a group of traditional sectors of the economy with a relatively low level of intangible assets and innovations. Currently, its share of national trading activity in GDP is 16.7%, the average annual number of employees is 18.5%, investments in fixed assets are 4.3% and the share of tax payments is 11.1%. The modern trade sector in Russia is one of the most stable sectors of its national economy. Comparative analysis of GDP growth rates and retail trade turnover over the past ten years allows us to conclude that the trade industry as a whole is characterized by relatively higher growth rates compared to GDP [88]. Moreover, trade is characterized by high levels of growth in gross added value compared to other sectors of the economy.
Retail trade is one of the branches of the economy that is highly dependent on knowledge [89]. Because retail trade is an element of the commodity-producing system, it does not create a product itself; therefore, there are practically no product innovations in retail trade. At the same time, such factors of success in retail trade as simplicity, level of personnel costs, overhead costs, supply chains, costs and online channels come to the fore [90].
These key success factors rely heavily on a good knowledge management system, human capital and customer relationships that are part of the IC components to help retailers effectively manage their assets and knowledge to achieve these factors. For this reason, IC is also important for retail businesses.
Another important aspect of the activities of modern companies is the expansion of external communication channels with stakeholders. One of these channels is a company’s annual reports, where management presents the results and future vision of its strategy. Since IC has a strategic importance in a company’s activities, considerable attention is paid in the annual reports to the disclosure of information on the results and prospects of managing IC for trading companies.
However, studies that would include a comprehensive analysis of IC trading companies based on financial and non-financial information are rare. As a rule, IC research is carried out based on financial statements [52,91], or based on non-financial information, for example, analysis of annual or integrated reports [67,70,87].
2.4. Key Research Hypotheses
The purpose of this study is to quantify the value of the intellectual capital of a trading company, as well as its components, and to identify the influence of the size and structure of intellectual capital on the results of a company’s business. Calculations were performed using alternative methods for assessing IC.
The research method is a combined one, which includes the use of three different measurement methods for assessing IC: VAIC, CIV and content analysis (CA).
The empirical base of the study is the financial and annual statements of a company operating in the retail sector in the Russian Federation, as well as information from the state statistics bodies of the Russian Federation and from the ratings and analytical agency Bloomberg.
Research hypothesis: it was assumed that there are positive relationships between the amount of a company’s intellectual capital used and the efficiency of its financial activities, the company’s value as well as the level of information disclosure about IC in the company’s annual reports.
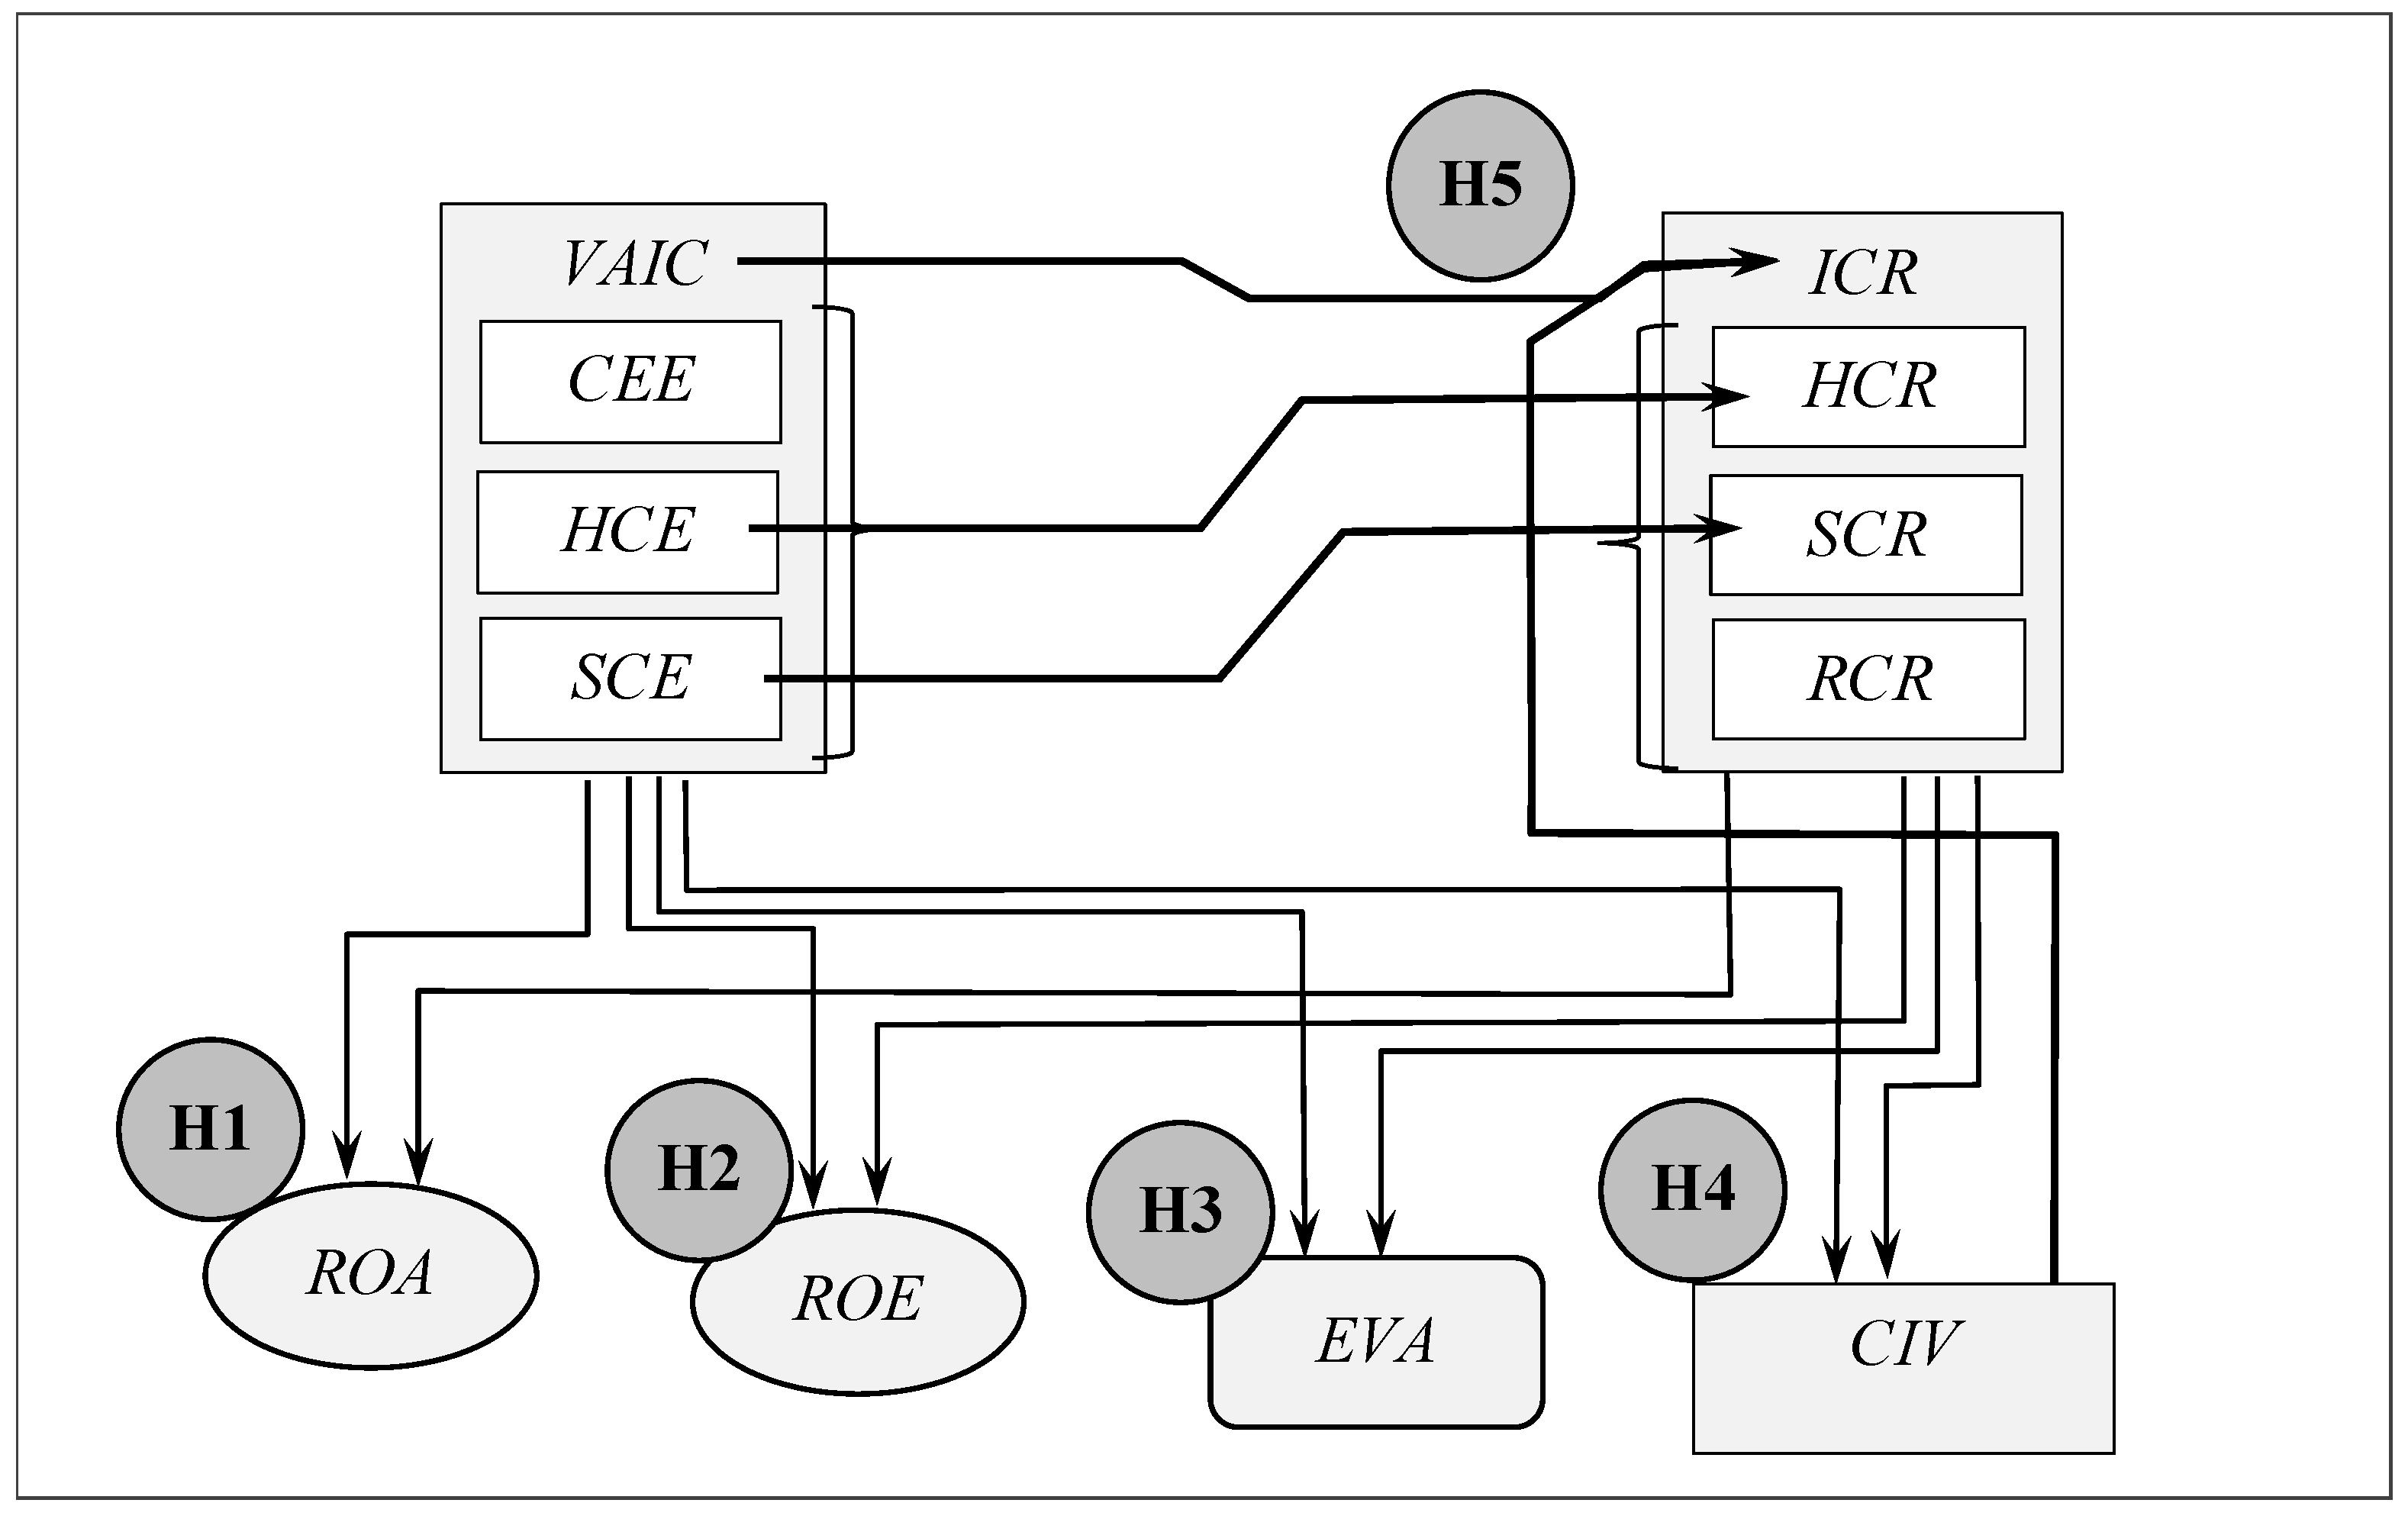
Several hypotheses were considered in the work. The general scheme of the research hypotheses proposed in the work is shown in Figure 1. All hypotheses were divided into 5 groups.
The first group of hypotheses consisted of assessing the impact of intellectual capital and its components, calculated using the VAIC and CA models, on the return on assets.
Hypothesis 1 (H1).
IC and its components have a significant positive impact on the return on assets.
Hypothesis H1 included four particular hypotheses:
Hypothesis 1.1 (H1.1).
The elements of intellectual capital calculated using the VAIC model have a significant positive impact on the return on assets.
Hypothesis 1.2 (H1.2).
VAIC has a significant positive impact on the return on assets.
Hypothesis 1.3 (H1.3).
The structural elements of intellectual capital HCR, SCR and RCR, calculated using CA, have a significant positive impact on the return on assets.
Hypothesis 1.4 (H1.4).
ICR, calculated using CA, has a significant positive impact on the return on assets.
The second group of hypotheses consisted of assessing the impact of intellectual capital and its components, calculated using the VAIC and CA models, on the return on equity.
Hypothesis 2 (H2).
IC and its components have a significant positive impact on the return on equity.
Hypothesis H2 included four particular hypotheses:
Hypothesis 2.1 (H2.1).
The elements of intellectual capital calculated using the VAIC model have a significant positive impact on the return on equity (ROE).
Hypothesis 2.2 (H2.2).
VAIC has a significant positive impact on the ROE.
Hypothesis 2.3 (H2.3).
Structural elements of intellectual capital HCR, SCR and RCR, calculated using CA, have a significant positive impact on the return on assets.
Hypothesis 2.4 (H2.4).
ICR calculated using CA has a significant positive impact on the return on assets.
The third group of hypotheses was to assess the relationship between intellectual capital and its components, calculated using the VAIC and CA models and the assessment of intellectual capital, performed using the CIV model.
Hypothesis 3 (H3).
IC and its components have a significant positive effect on CIV.
Hypothesis H3 included four particular hypotheses:
Hypothesis 3.1 (H3.1).
The elements of intellectual capital calculated using the VAIC model have a significant positive impact on CIV.
Hypothesis 3.2 (H3.2).
VAIC has a significant positive effect on CIV.
Hypothesis 3.3 (H3.3).
The structural elements of intellectual capital HCR, SCR and RCR, calculated using CA, have a significant positive impact on CIV.
Hypothesis 3.4 (H3.4).
ICR, calculated using CA, has a significant positive impact on CIV.
The fourth group of hypotheses was to assess the impact of intellectual capital and its components, calculated using the VAIC and CA models, on the growth of the company’s value (EVA).
Hypothesis 4 (H4).
IC and its components have a significant positive impact on the growth of a company’s value.
Hypothesis H4 included four particular hypotheses:
Hypothesis 4.1 (H4.1).
Elements of Intellectual Capital calculated using the VAIC model have a significant positive impact on the growth of company value.
Hypothesis 4.2 (H4.2).
VAIC has a significant positive impact on a company’s value growth.
Hypothesis 4.3 (H4.3).
The structural elements of intellectual capital HCR, SCR, RCR, calculated using CA, have a significant positive impact on the growth of a company’s value.
Hypothesis 4.4 (H4.4).
ICR, calculated using CA, has a significant positive impact on the growth of company value.
Additionally, the study formulated hypotheses designed to test the presence of a relationship between the structural elements of IC, determined by VAIC and CA methods, as well as between the indicators of intellectual capital, which were assessed using the VAIC, CIV and CA methods. These hypotheses were formulated in order to determine the presence of a relationship between the involved IC value and the level of its disclosure.
Hypothesis H5 included three particular hypotheses:
Hypothesis 5.1 (H5.1).
The level of disclosure of human capital in annual reports reflects the level of human capital involvement in creating benefit.
Hypothesis 5.2 (H5.2).
The level of disclosure of structural capital in the annual reports reflects the level of involvement of structural capital in the creation of benefit.
Hypothesis 5.3 (H5.3).
The level of IC disclosure in the annual reports reflects the level of IC involvement in creating benefit.
3. Methodology
3.1. Initial Data
The research used the annual and financial statements of a trading company operating on the Russian market as the initial data. Since historically the creation of companies in the form of joint stock companies, which obligatory submit annual reports, began not so long ago, systematic data for 7 years were available. In addition, we were able to calculate the CIV index for the previous 9 years.
3.2. Variables
3.2.1. Dependent Variables
Guided by various works [49,51,54], return on assets (ROA) and return on equity (ROE) are usually used to measure financial results.
ROA measures the efficiency of companies in using total assets and is calculated by dividing net income by average total assets.
ROE is the return to shareholders of ordinary shares and is calculated by dividing net income by the average share capital.
The CIV is the discounted weighted average cost of capital amount of the future residual operating income generated by the intangible assets of a company over an infinite period. In this context, CIV is an assessment of the IC generated by a company because of strategic development.
The method for calculating the CIV indicator includes the following steps:
- For a series of data over several years, smoothing is performed (with a moving average of over 3 years);
- The pre-tax income of the company (Earnings Before Interest and Taxes, EBIT) (smoothed data) is calculated;
- The moving average of tangible assets TA is calculated;
- The moving average of intangible assets IA is calculated;
- The return on assets of the company is calculated;
- The industry average return on assets is calculated;
- Excess income is calculated as the difference between the pre-tax income of the enterprise and the income of the assets of the enterprise, calculated according to the average industry profitability (6). The formula only works if the company’s return on assets is higher than the industry average return on assets.
If , then the CIV is calculated as:
In the case of an infinite period of capitalization of intellectual capital, it is simplified to the following form:
where: —weighted average rate of company capital costs; —income tax rate; A—depreciation.
Economic value added (EVA) is the amount of profit that remains at the disposal of the company for the reporting period, taking into account all economic and opportunity costs of capital employed. Traditionally EVA is an indicator of the growth of the company’s value. In this work, EVA was calculated using the expression:
3.2.2. Independent Variables
1. VAIC and its three components—CEE, HCE and SCE—are used as independent variables. VAIC calculation procedures are as follows:
where: HCEshows how effectively human capital is used (equal to the ratio of value added and labor costs); SCE shows how effectively organizational capital is used (equal to the ratio of value added minus human capital and value added); CEE shows how effectively used capital is used.
VAIC = HCE + SCE + CEE,
The individual components of the VAIC were calculated as follows:
where: VA—value added; HC—human capital, measured by the wages of all workers.
where: SC—structural capital measured by the difference between VA and HC.
where: CE—the capital employed book value of net tangible assets of the company.
HCE = VA/HC,
SCE = SC/VA.
CEE = VA/CE.
The value added in expressions (9)—(11) was calculated using the following expression:
where: C—company employee salary; D—depreciation; A—depreciation; OP—operating profit.
VA = C + D + A + OP,
2. Assessments of IC and its components were carried out using content analysis.
The content analysis of the annual reports was carried out by counting the number of words and phrases used in relation to three subcategories of intellectual capital—human capital HCR, structural capital SCR and relational capital RCR. As an indicator reflecting the level of disclosure of IC and its components, the number of mentions of words and phrases revealing subcategories of intellectual capital was considered in total for human capital—22 subcategories, for structural capital—18 subcategories, for relational capital—21 subcategories. The composition of the subcategories was taken from [70]. For each mention of a word or phrase, 1 point was assigned. The number of points was presented as the disclosure rating.
4. Empirical Results
Before proceeding to the description of the results of the constructed models and testing of hypotheses, let us consider the results of the assessment of the IC, performed by various methods.
On Figure 2, the results of the IR calculation by the VAIC method are presented.
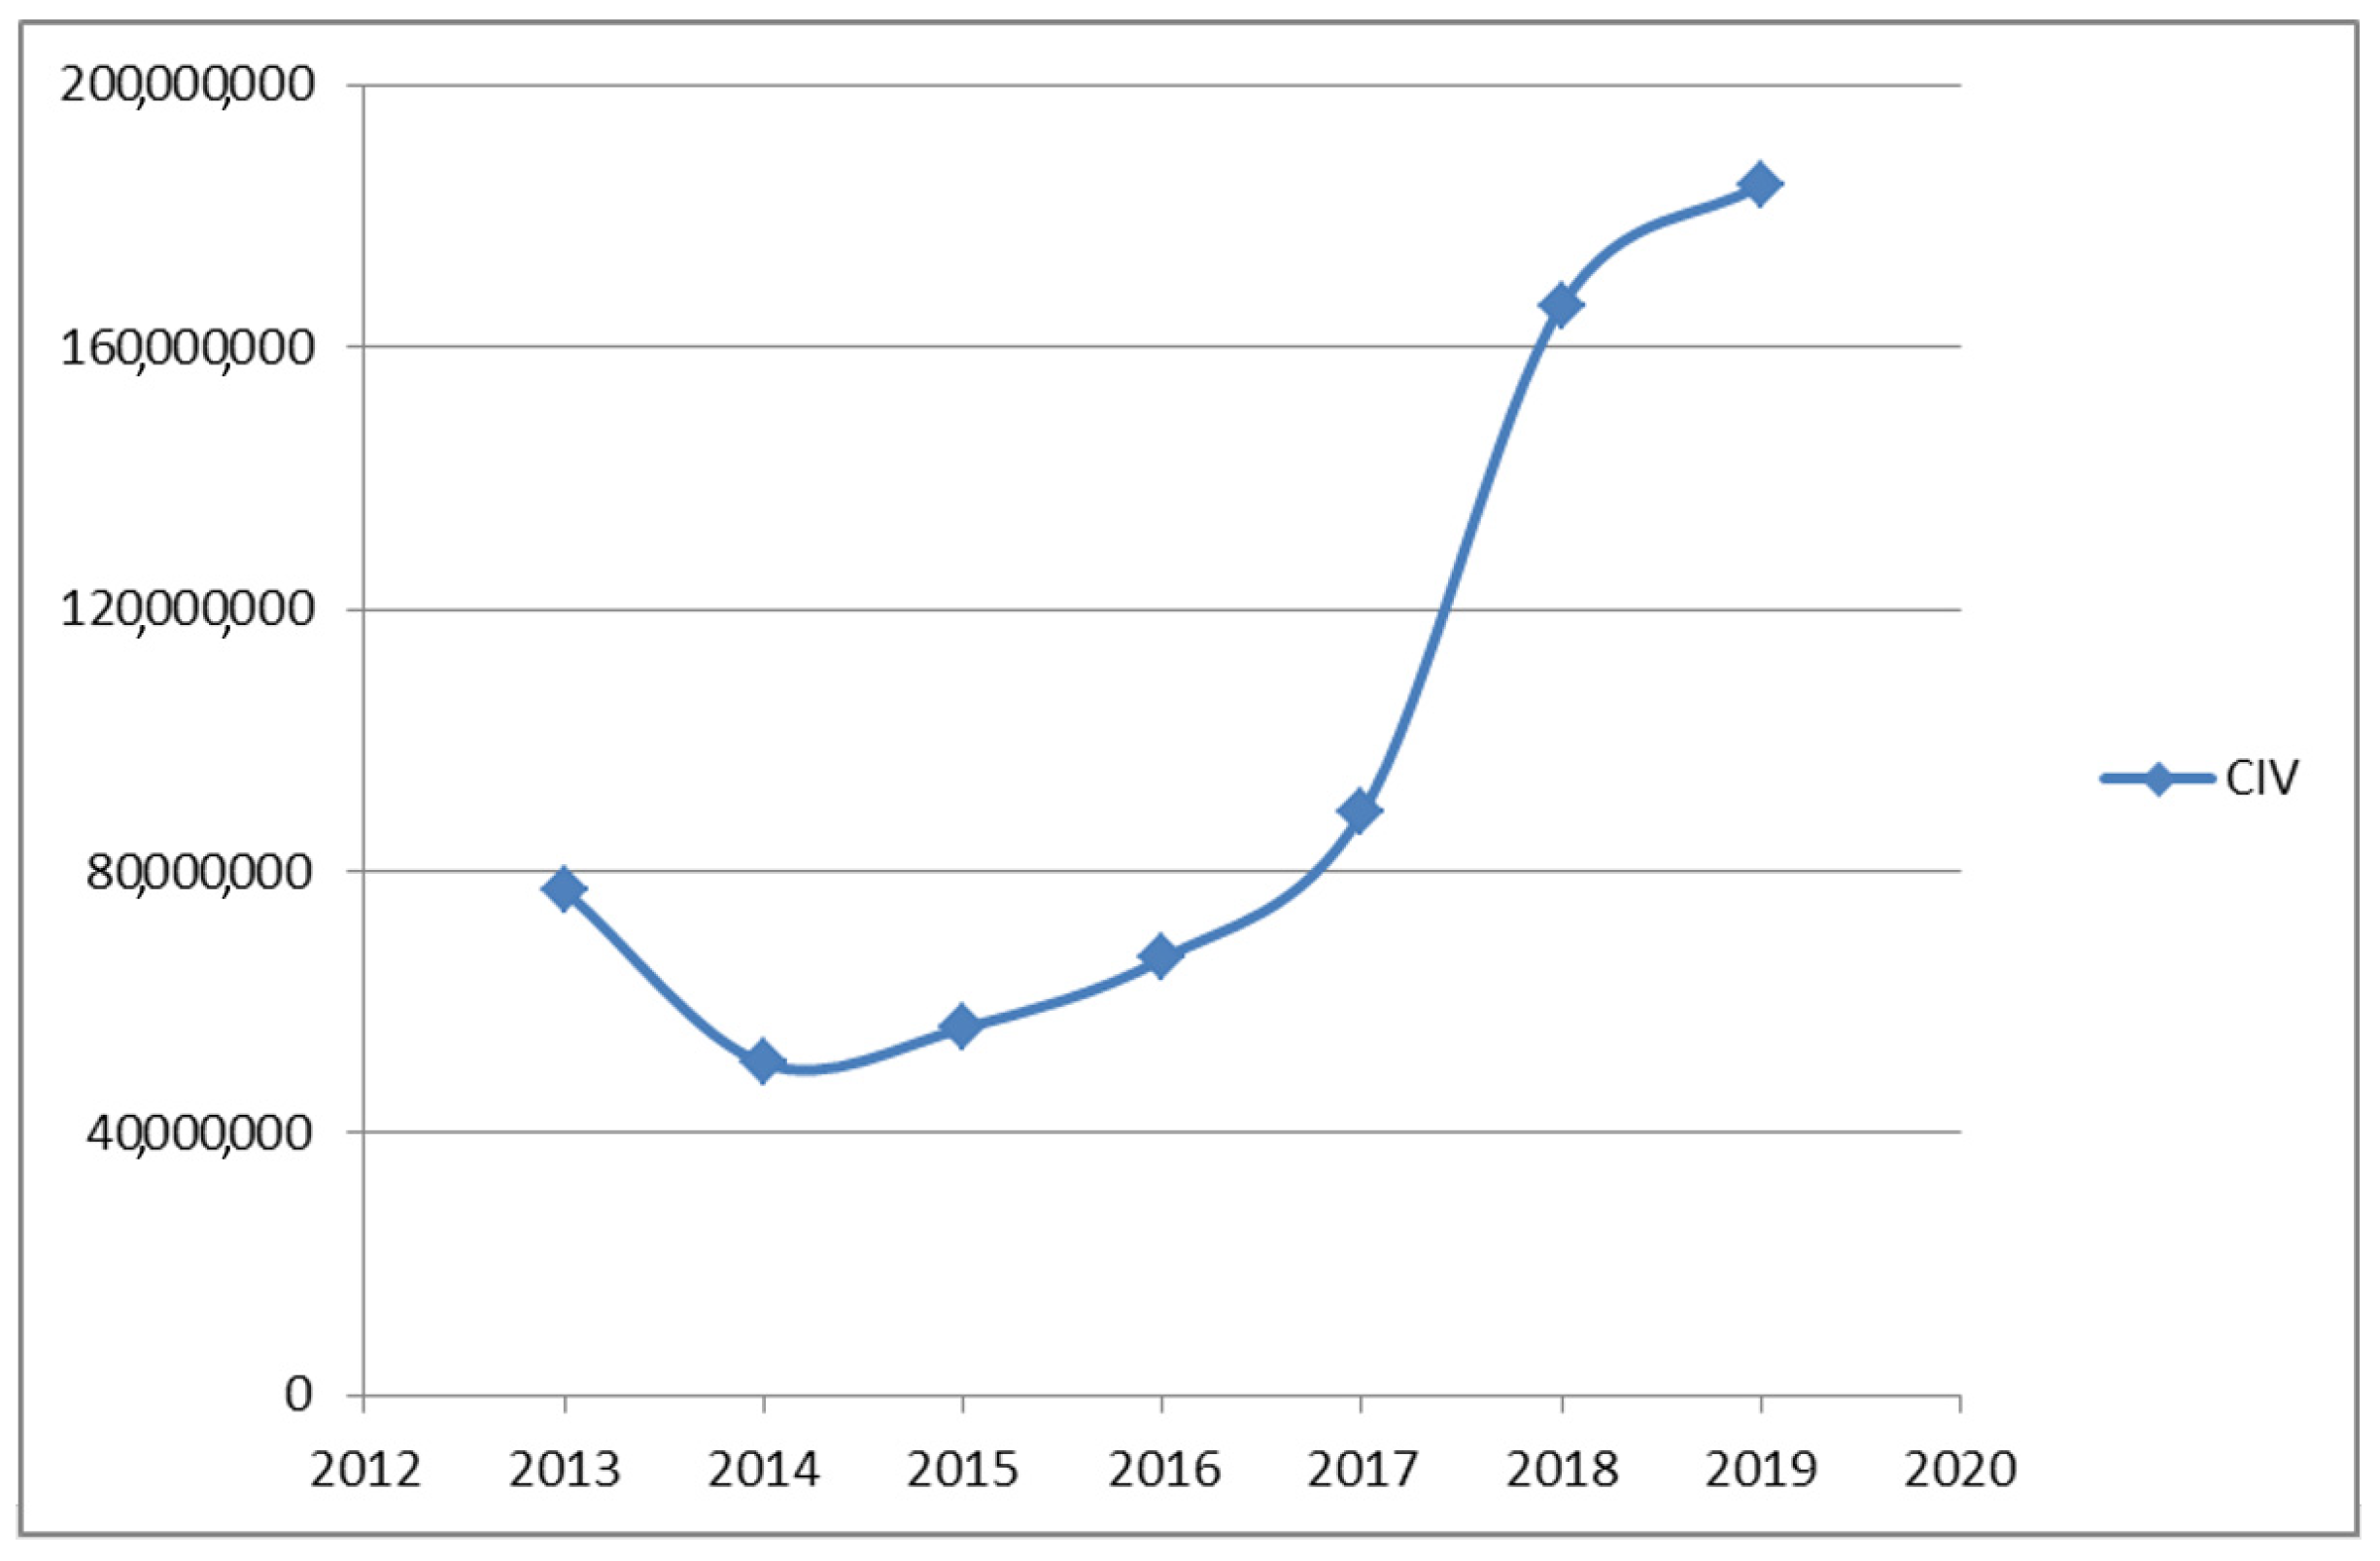
Figure 3 shows the results of calculating the IC by using the CIV method.
In Figure 4, the results of calculating the IC by the content analysis method are presented.
From the presented results, it can be seen that the VAIC and CA methods reflect the ratio of the IC elements in different ways. According to the VAIC, most of the IC is formed at the expense of the human capital efficiency indicator HCE, which gives about 75% of the contribution to VAIC.
For the CA model, a different picture is observed. Here, HCR human capital takes the smallest position for IC elements, and structural and relational capitals take the largest position. The use of content analysis in [5] showed that relational capital takes a significant position, then human capital and structural capital. According to the authors, the significant role of relational capital in annual reports is because a company uses this to demonstrate to investors its attitude towards various groups of stakeholders.
From Table 1, the average VAIC value is 2.908, which means that the trading company managed to create an added value of 2.908 rubles for every 1 ruble invested in the company. The descriptive statistics also show that HCE is the most influential component in creating added value for retailers, with an average of 2.2 rubles. In addition, this study also yields a result that is consistent with the proposed theory in the IC literature, which states that IC or intangible assets create greater added value for companies compared to tangible assets, which can be shown by the average CEE score (0.196) [49,51]. The contribution of the individual components is almost the same as the contribution of the individual elements of IC and physical capital in a study of retailers in Indonesia.
The results of the analysis of the obtained models are presented in Table 2. It presents the results of analysis of variance of models, as well as analysis based on criterion and linearity.
The analysis of the results presented in the table allowed us to conclude that from all the hypotheses of the study, the hypothesis of the relationship between VAIC and return on assets was statistically confirmed. This model is:
ROA = 0.055 + 0.026 × VAIC.
In addition, for the hypothesis of the third group, the presence of a statistical relationship between the indicator CIV and the structural capital, determined both by the VAIC model and by means of content analysis, was obtained: the form of these models is presented below:
CIV = −18,096,414 + 72,827,205 × HCE − 558,695,710 × SCE + 1,222,451,506 × CCE.
CIV = −15,289,541 + 573,821 × HCR − 306,027 × SCR + 177,195 × RCR.
Models for the hypotheses of the fourth group were not confirmed.
Among the models of group 5, a model was confirmed that reflects the relationship between the use of human capital in creating benefit and the level of disclosure of human capital in annual reports. Model view:
HCR = −104.55 − 157.88 × HCE.
5. The Discussion of the Results
Based on the results presented above, we will give a brief description of the presented results.
The first conclusion that can be drawn is the influence of IC on the profitability (profitability) of a trading company. A statistically significant relationship was found between return on assets and VAIC (model H1.2). This result agrees with the results obtained in [49,51]. At the same time, no statistically significant relationship was found for individual VAIC components, which may indicate the instability of the impact of human and structural capital on a company’s profitability. Thus, we can conclude that investment in intellectual capital can lead to an increase in the return on assets. The growth in return on assets per VAIC point is 0.026, i.e., about 2.6%, which is a high figure.
It should be noted that a sufficiently high relationship level was also found for the return on assets and elements of intellectual capital, which are reflected in the annual reports (a high R2 was obtained). In our opinion, this indicates that, overall, the company’s management adequately assesses the level of development and the effectiveness of the return on the elements of IC, although this is not statistically significant in nature.
The study of the relationship between the return on equity and IC elements, calculated both by the VAIC model and reflected in the reports, did not reveal a statistically significant relationship. Perhaps this is due to the fact that during the period under review, the company under study carried out a fairly intensive market expansion, which led to sharp fluctuations in the capital structure and, as a consequence, to significant fluctuations in the return on equity. Perhaps, observation on a wider sample and a wider time interval will provide more significant results on the return on equity.
Interesting results were obtained for the third group of hypotheses. A stable statistical relationship was revealed between the coefficient of intellectual value CIV and the value of structural capital. Moreover, this relationship is an inverse one, i.e., an increase in structural capital (SCE and SCR) leads to a decrease in CIV, i.e., to its destruction of the company’s intellectual value. At the same time, human capital (HCE and HCR) in the H3.1 and H3.3 models and the RCR relational capital in the H3.3 model have a more significant positive impact on CIV. This influence of structural capital on the formation of the company’s intellectual value may be due to the fact that currently, institutional investors and asset managers are focused on obtaining short-term profits (faster earnings per share), rather than long-term profits. It also shows that they place more emphasis on innovation and growth than on investment. This result is to some extent consistent with the results obtained in [52], where a statistically significant inverse relationship between structural capital and company value was also revealed.
The study of the influence of the IC and its elements on the market value did not reveal any connection between them. This result is consistent with research [91,92,93]. The reasons for this result may be due, on the one hand, to the closeness of data on IC, which is confirmed by the results of this study (the absence of relationships in the hypotheses of the fifth group). On the other hand, market value is highly influenced by market sentiment and external factors such as risk aversion by investors that make them ignore a company’s financial reality, even if it has improved its financial results.
The study of the hypotheses of the fifth group allows us to make a stable conclusion that the degree of reflection of IC and its elements in annual reports is in no way connected with the use of IC in creating profit and value for a company. This means that the researched company does not have a systematic IC management policy, one of the aspects of which is the disclosure and communication of information about the IC to stakeholders.
6. Conclusions
For companies in the modern economy, IC is one of the most important drivers of profit and value creation based on sustainable, hard-to-copy competitive advantages.
The presented study confirms the hypothesis about the influence of IC, considered in the form of the VAIC model, on the profitability of a trading company operating in the Russian market. Also, statistically significant relationships were found between the company’s structural capital and the intellectual capital ratio according to the CIV model.
In this study, it was found that IC and its elements do not affect the value of the company. Therefore, for investors, IR is not yet a fundamental indicator which they could use to make the right investment decisions.
The second important conclusion that this study allowed us to make is that at present, even successfully developing companies in the process of their functioning and development do not pay enough attention to adequate reflection of the results of using IC. On the one hand, this is due to the youthfulness of the IC concept, and on the other hand is due to the lack of generally accepted methods and technologies for adequate disclosure of information about IC in the annual reporting of companies.
The peculiarity of this is that the trading industry belongs to the group of traditional industries for which the share of intellectual capital and intangible assets is not the leading one, despite the fact that with the development of networkization and digitalization, the share of intellectual assets is steadily increasing across the board.
The presented study has several limitations. The object of the study was a trading company, whose shares are listed on the stock exchange, and which systematically submitted ready-made reports. Finding empirical material that allows conducting similar studies for Russian trading companies seems to be rather difficult. However, studies of trading companies in other emerging economies may be of interest.
It is necessary to consider a wider range of industries for which innovation and intangible assets play a more important role, for example, telecommunications companies, companies operating in the information and consulting industries, banking and finance. However, the problem lies in the fact that the market of the Russian Federation has existed for a fairly short time, belongs to the group of emerging markets and only quite recently began to move to generally accepted forms and technologies of corporate governance. The lives of most successful companies do not exceed 10–15 years, and they submit annual reports only for the last 5–10 years. At the same time, when studying intellectual capital based on annual reports, as a rule, rather long observation intervals are considered, often spanning 15–20 years.
It should also be noted that most IC studies use the VAIC model as a base model, while the results of IC studies using the CIV model and its modifications, as well as studies based on the analysis of annual and integrated reporting, are still quite rare.
The research results show the ways to improve the quality of presentation of information about the intellectual capital involved in the creation of financial results and company value.
From the point of view of further research, it is of considerable interest to study the industry specifics in the use of IC and its presentation in annual reports. It is possible that for companies in knowledge-based industries and traditional companies that rely mainly on physical assets to create profit and value, the results of IC research will be completely different.
Author Contributions
All authors contributed equally to the conceptualization, methodology, software, validation, data analysis and execution, writing—review and editing, visualization and supervision of this paper at all stages. All authors have read and agreed to the published version of the manuscript.
Funding
This research received no external funding.
Acknowledgments
This research work was supported by the Academic Excellence Project 5-100 proposed by the Peter the Great St. Petersburg Polytechnic University.
Conflicts of Interest
The authors declare no conflict of interest.
References
- Lev, B. Intangible Assets: Concepts and Measurements. In Encyclopedia of Social Measurement; Kempf-Leonard, K., Ed.; Elsevier: New York, NY, USA, 2005; pp. 299–305. [Google Scholar]
- Dewhurst, F.W.; Cegarra Navarro, J.G. External communities of practice and relational capital. Learn. Organ. 2004, 11, 322–331. [Google Scholar] [CrossRef]
- Lev, B.; Radhakrishnan, S. The Measurement of Firm-Specific Organization Capital. NBER Work. Pap. 2003, 9581. [Google Scholar] [CrossRef]
- Copeland, T.; Koller, T.; Murrin, J. Valuation: Measuring and Managing the Value of Companies. J. Financ. 1991, 46. [Google Scholar] [CrossRef]
- Stern, J.; Stewart, B.; Chew, D. The EVA Financial Management System. J. Appl. Corp. Financ. 1998, 8. [Google Scholar] [CrossRef]
- Rappaport, A. Creating Shareholder Value: The New Standard for Business Performance; Free Press: New York, NY, USA, 1986. [Google Scholar]
- Young, S.D.; O’Byrne, S. EVA and Value Based Management: A Practical Guide to Implementation; McGraw-Hill: Blacklick, OH, USA, 2001. [Google Scholar]
- Kaplan, R.; Norton, D. The Balanced Scorecard: Translating Strategy into Action; Harvard Business School Press: Boston, MA, USA, 1996. [Google Scholar]
- Edvinsson, L.; Malone, M. Intellectual Capital: Realizing Your Company’s True Value by Finding Its Hidden Brainpower; HarperCollins Publishers: New York, NY, USA, 1997. [Google Scholar]
- Stewart, T.A. The Wealth of Knowledge: Intellectual Capital and the Twenty-First Century Organization; Crown Business: New York, NY, USA, 2003; ISBN 978-0-385-50072-2. [Google Scholar]
- Roos, G.; Pike, S.; Fernström, L. Managing Intellectual Capital in Practice; Routledge: London, UK, 2012. [Google Scholar]
- Penrose, E.; Pitelis, C. The Theory of the Growth of the Firm, 4th ed.; Oxford University Press: Oxford, UK; New York, NY, USA, 2009; ISBN 978-0-19-957384-4. [Google Scholar]
- Dzinkowski, R. The Measurement and Management of Intellectual Capital: An Introduction. Manag. Account. 2000, 78, 32–36. [Google Scholar]
- Lentjushenkova, O.; Lapiņa, I. The transformation of the organization’s intellectual capital: From resource to capital. J. Intellect. Cap. 2016, 17, 610–631. [Google Scholar] [CrossRef]
- Prahalad, C.; Hamel, G. The Core Competence of Corporation. Harv. Bus. Rev. 2006, 69, 275–292. [Google Scholar]
- Teece, D.J.; Pisano, G.; Shuen, A. Dynamic capabilities and strategic management. Strateg. Manag. J. 1997, 18, 509–533. [Google Scholar] [CrossRef]
- Kogut, B.; Zander, U. Knowledge of the Firm, Combinative Capabilities, and the Replication of Technology. Organ. Sci. 1992, 3. [Google Scholar] [CrossRef]
- Awano, G.; Franklin, M.; Kastrinaki, Z. Measuring Investment in Intangible Assets in the UK: Results from a New Survey. Econ. Labour Mark. Rev. 2010, 4, 66–71. [Google Scholar] [CrossRef] [Green Version]
- Platonov, V.; Pavlova, O. Formirovanie logicheskoj modeli resursno-orientirovannogo issledovaniya innovacionnogo razvitiya predpriyatij. Finans. Ekon. 2015, 11, 5–11. [Google Scholar]
- Nikolova, I. Manifestation of Intellectual Capital in Trade During Period 2008—2018. Econ. Altern. 2019, 3, 370–384. [Google Scholar]
- Galeitzke, M.; Scheumann, R.; Orth, R.; Wolf, K.; Finkbeiner, M.; Kohl, H. Sustainable Corporate Development Measured by Intangible and Tangible Resources as Well as Targeted by Safeguard Subjects. Procedia CIRP 2015, 26, 185–189. [Google Scholar] [CrossRef]
- Kazakov, A. Essence, Forms of Functioning and Accumulation of Capital. In Foundations of Business Theory, Economy; Economy: Sofia, Bulgaria, 2008. [Google Scholar]
- Toffler, A. The Third Wave; William Morrow & Company: New York, NY, USA, 1980. [Google Scholar]
- Drucker, P.F. Toward the Next Economics: And Other Essays; Harvard Business Press: Boston, MA, USA, 2010; ISBN 978-1-4221-3155-8. [Google Scholar]
- Bell, D. The Coming of Post-Industrial Society: A Venture in Social Forecasting; Basic Books: New York, NY, USA, 1973; ISBN 978-0-14-055115-0. [Google Scholar]
- Allee, V. Value network analysis and value conversion of tangible and intangible assets. J. Intellect. Cap. 2008, 9, 5–24. [Google Scholar] [CrossRef] [Green Version]
- Pirogova, O.; Makarevich, M. The mechanism for value formation in a trading enterprise. MATEC Web Conf. 2018, 193, 05070. [Google Scholar] [CrossRef]
- Karlik, A.; Platonov, V.; Jakovleva, E.; Pavlova, O. Intellectual capital augmented navigator for decision making in the information and networked economy. MIR (Modernization. Innov. Res.) 2018, 9, 338–350. [Google Scholar] [CrossRef]
- Akpinar, A.; Akdemir, A. Intellectual Capital. In Proceedings of the First International Joint Symposium on Business Administration “Challenges for business administrators in the new millennium”, Gökçeada-Çanakkale, Turkey, 1–3 June 2000. [Google Scholar]
- Naidenova, I.; Oskolkova, M. Interaction Effects of Intellectual Capital in Company’s Value Creation Process. In Proceedings of the 4th European Conference on Intellectual Capital, Helsinki, Finland, 23–24 April 2012. [Google Scholar]
- Kianto, A.; Garanina, T.; Andreeva, T. Does intellectual capital matter for organizational performance in emerging markets? Evidence from Chinese and Russian contexts. In The Routledge Companion to Intellectual Capital; Routledge: London, UK, 2018; pp. 463–480. [Google Scholar]
- Williams, M. Is Intellectual Capital Performance and Disclosure Practice Related? J. Intellect. Cap. 2001, 2. [Google Scholar] [CrossRef]
- Luthy, D.H. Intellectual Capital and Its Measurement. Available online: http://citeseerx.ist.psu.edu/viewdoc/download?doi=10.1.1.200.5655&rep=rep1&type=pdf (accessed on 30 June 2020).
- Stewart, T.A. Intellectual Capital: The New Wealth of Organizations, 1st ed.; Doubleday/Currency: New York, NY, USA, 1997. [Google Scholar]
- Balasundaram, N. Value Added Accounting and Performance Evaluations; LAP LAMBERT Academic Publishing: Saarbrücken, Germany, 2011; ISBN 978-3-8465-9820-7. [Google Scholar]
- Lev, B.; Baruch, L. Intangibles: Management, Measurement and Reporting; Brookings Institution Press: Washington, DC, USA, 2001. [Google Scholar]
- Gröjer, J. Employee Artefacts on the Balance Sheet: Model Illustration and Implications. J. Hum. Resour. Costing Account. 1997, 2, 27–53. [Google Scholar] [CrossRef]
- Marr, B.; Gray, D.; & Neely, A. Why do firms measure their intellectual capital? J. Intellect. Cap. 2003, 4, 441–464. [Google Scholar] [CrossRef]
- Pulic, A. VAIC™ an accounting tool for IC management. Int. J. Technol. Manag. 2000, 20. [Google Scholar] [CrossRef]
- Brooking, A. Intellectual Capital: Core Asset for the Third Millennium Enterprise; Thomson Business Press: London, UK, 1996. [Google Scholar]
- Bontis, N. Assessing Knowledge Assets: A Review of the Models Used to Measure Intellectual Capital. Int. J. Manag. Rev. 2001, 3, 41–60. [Google Scholar] [CrossRef]
- Andriessen, D.; Tissen, R. Weightless Weight—Find Your Real Value in a Future of Intangible Assets; Pearson Education: London, UK, 2020. [Google Scholar]
- Sullivan, P. Value Driven Intellectual Capital: How to Convert Intangible Corporate Assets into Market Value; Wiley: New York, NY, USA, 2000. [Google Scholar]
- Roos, J.; Edvinsson, L.; Roos, G. Intellectual Capital: Navigating in the New Business Landscape; Macmillan: New York, NY, USA, 1997. [Google Scholar]
- Fitzenz, J. How to Measure Human Resources Management; McGraw-Hill: New York, NY, USA, 1995. [Google Scholar]
- Atkeson, A.; Kehoe, P.J. Measuring organizational capital. NBER Work. Pap. 2002, 8722. [Google Scholar] [CrossRef]
- Sveiby, K.E. The New Organizational Wealth: Managing & Measuring Knowledge-Based Assets; Berrett-Koehler Publishers: San Francisco, CA, USA, 1997; ISBN 978-1-57675-014-8. [Google Scholar]
- Firer, S.; Williams, M. Intellectual Capital and Traditional Measures of Corporate Performance. J. Intellect. Cap. 2003, 4, 348–360. [Google Scholar] [CrossRef]
- Chen, M.-C.; Cheng, S.-J.; Hwang, Y. An Empirical Investigation of the Relationship between Intellectual Capital and Firms’ Market Value and Financial Performance. J. Intellect. Cap. 2005, 6. [Google Scholar] [CrossRef]
- Lipunga, A. Intellectual Capital Performance of the Commercial Banking Sector of Malawi. Int. J. Bus. Manag. 2014, 10, 210–222. [Google Scholar] [CrossRef] [Green Version]
- Nimtrakoon, S. The relationship between intellectual capital, firms’ market value and financial performance: Empirical evidence from the ASEAN. J. Intellect. Cap. 2015, 16, 587–618. [Google Scholar] [CrossRef]
- Suherman, R. The Impact of Intellectual Capital Toward Firms Profitability and Market Value of Retail Companies Listed in Indonesia Stock Exchange (IDX) From 2013–2016. iBuss Manag. 2017, 5, 183610. [Google Scholar]
- Haris, M.; Yao, H.; Tariq, G.; Malik, A.; Javaid, H.M. Intellectual Capital Performance and Profitability of Banks: Evidence from Pakistan. J. Risk Financ. Manag. 2019, 12, 56. [Google Scholar] [CrossRef] [Green Version]
- Smriti, N.; Das, N. The impact of intellectual capital on firm performance: A study of Indian firms listed in COSPI. J. Intellect. Cap. 2018, 19. [Google Scholar] [CrossRef]
- Nuryaman, N. The Influence of Intellectual Capital on the Firm’s Value with the Financial Performance as Intervening Variable. Procedia Soc. Behav. Sci. 2015, 211, 292–298. [Google Scholar] [CrossRef]
- Iancu, E. Intellectual Capital, Business Cyclical and Market Value of Firms. In Proceedings of the 25th IBIMA conference “Innovation Vision 2020: From Regional Development Sustainability to Global Economic Growth”, Amsterdam, The Netherlands, 7–8 May 2015. [Google Scholar]
- Xu, J.; Wang, B. Intellectual Capital, Financial Performance and Companies’ Sustainable Growth: Evidence from the Korean Manufacturing Industry. Sustainability 2018, 10, 4651. [Google Scholar] [CrossRef] [Green Version]
- Yao, H.; Haris, M.; Tariq, G.; Javaid, H.M.; Khan, M. Intellectual Capital, Profitability, and Productivity: Evidence from Pakistani Financial Institutions. Sustainability 2019, 11, 3842. [Google Scholar] [CrossRef] [Green Version]
- Xu, X.L.; Chen, H.; Zhang, R. The Impact of Intellectual Capital Efficiency on Corporate Sustainable Growth-Evidence from Smart Agriculture in China. Agriculture 2020, 10, 199. [Google Scholar] [CrossRef]
- Boujelbene, M.; Affes, H. The Impact of Intellectual Capital Disclosure on Cost of Equity Capital: A Case of French Firms. J. Econ. Financ. Adm. Sci. 2013, 18, 45–53. [Google Scholar] [CrossRef]
- Ståhle, P.; Ståhle, S.; Aho, S. Value Added Intellectual Coefficient (VAIC): A critical analysis. J. Intellect. Cap. 2011, 12, 247–268. [Google Scholar] [CrossRef]
- Chang, S.-L.; Hsieh, J. Intellectual Capital and Value Creation-Is Innovation Capital a Missing Link? Int. J. Bus. Manag. 2011, 6. [Google Scholar] [CrossRef] [Green Version]
- Ulum, I.; Ghozali, I.; Agus, P. Intellectual Capital Performance of Indonesian Banking Sector: A Modified VAIC (M-VAIC) Perspective. Asian J. Financ. Account. 2014, 6, 103. [Google Scholar] [CrossRef] [Green Version]
- Stewart, T. Trying to Grasp the Intangible. Available online: https://archive.fortune.com/magazines/fortune/fortune_archive/1995/10/02/206535/index.htm (accessed on 30 June 2020).
- Volkov, D.; Garanina, T. Intellectial Capital Valuation: Case of Russian Companies; Working Papers; Graduate School of Management, St. Petersburg State University: St. Petersburg, Russia, 2007. [Google Scholar]
- Starovic, D.; Marr, B. Understanding Corporate Value: Managing and Reporting Intellectual Capital; CIMA: London, UK, 2003. [Google Scholar]
- Yıldız, S.; Meydan, C.; Güner, M. Measurement of Intellectual Capital Components through Activity Reports of Companies. Procedia Soc. Behav. Sci. 2014, 109, 614–621. [Google Scholar] [CrossRef] [Green Version]
- Campbell, D.; Ridhuan, M. A longitudinal examination of intellectual capital reporting in Marks & Spencer annual reports, 1978–2008. Br. Account. Rev. 2010, 42, 56–70. [Google Scholar] [CrossRef]
- Striukova, L.; Unerman, J.; Guthrie, J. Corporate Reporting of Intellectual Capital: Evidence from UK Companies. Br. Account. Rev. 2007, 40, 297–313. [Google Scholar] [CrossRef]
- Li, J.; Pike, R.; Haniffa, R. Intellectual capital and corporate governance structure in UK firms. Account. Bus. Res. 2008, 38, 137–159. [Google Scholar] [CrossRef]
- Ridhuan, M. Practical Challenge of Content Analysis: An Illustrative Example from Recoding IC Information in the UK’s Companies Annual Reports. Asian J. Account. Res. 2016, 1, 71–82. [Google Scholar] [CrossRef]
- Riffe, D.; Lacy, S.; Watson, B.; Fico, F. Analyzing Media Messages: Using Quantitative Content Analysis in Research; Lawrence Erlbaum Associates: Mahwah, NJ, USA, 2019; ISBN 978-0-429-46428-7. [Google Scholar]
- Coy, D.; Tower, G.; Dixon, K. Quantifying the Quality of Tertiary Education Annual Reports|Request PDF. Account. Financ. 1993, 33, 121–129. [Google Scholar] [CrossRef]
- Boesso, G.; Kumar, K. Drivers of corporate voluntary disclosure: A framework and empirical evidence from Italy and the United States. Account. Audit. Account. J. 2007, 20, 269–296. [Google Scholar] [CrossRef]
- Hackston, D.; Milne, M.J. Some determinants of social and environmental disclosures in New Zealand companies. Account. Audit. Account. J. 1996, 9, 77–108. [Google Scholar] [CrossRef]
- Beattie, V.; Smith, S. Lifting the Lid on the Use of Content Analysis to Investigate Intellectual Capital Disclosures. Account. Forum 2007, 31, 129–163. [Google Scholar] [CrossRef]
- Krippendorff, K. Content Analysis: An Introduction To Its Methodology; SAGE Publication: Thousand Oaks, CA, USA, 2004. [Google Scholar]
- Abhayawansa, S.; Abeysekera, I. Intellectual capital disclosure from sell-side analyst perspective. Fac. Commer. Pap. 2009, 10. [Google Scholar] [CrossRef]
- Mouritsen, J.; Bukh, P.; Marr, B. Reporting on intellectual capital: Why, what and how? Meas. Bus. Excell. 2004, 8, 46–54. [Google Scholar] [CrossRef]
- Guimon, J. Intellectual capital reporting and credit risk analysis. J. Intellect. Cap. 2005, 6, 28–42. [Google Scholar] [CrossRef] [Green Version]
- Guthrie, J.; Petty, R. Intellectual Capital: Australian Annual Reporting Practices. J. Intellect. Cap. 2000, 1, 241–251. [Google Scholar] [CrossRef]
- Bozzolan, S.; Favotto, F.; Ricceri, F. Italian Annual Intellectual Capital Disclosure: An Empirical Analysis. J. Intellect. Cap. 2003, 4, 543–558. [Google Scholar] [CrossRef]
- Abeysekera, I. Intellectual Capital Reporting Differences Between a Developed and Developing Nation. Fac. Commer. Pap. 2007, 8. [Google Scholar] [CrossRef] [Green Version]
- An, Y.; Davey, H. Intellectual capital disclosure in Chinese (mainland) companies. J. Intellect. Cap. 2010, 11. [Google Scholar] [CrossRef]
- Whiting, R.; Miller, J. Voluntary disclosure of intellectual capital in New Zealand annual reports and the “hidden value”. J. Hum. Resour. Costing Account. 2008, 12, 26–50. [Google Scholar] [CrossRef]
- Oliveras, E.; Gowthorpe, C.; Kasperskaya, Y.; Perramon, J. Reporting intellectual capital in Spain. Corp. Commun. 2008, 13, 168–181. [Google Scholar] [CrossRef] [Green Version]
- Santis, S.; Bianchi, M.; Incollingo, A.; Bisogno, M. Disclosure of Intellectual Capital Components in Integrated Reporting: An Empirical Analysis. Sustainability 2018, 11, 62. [Google Scholar] [CrossRef] [Green Version]
- Official site of the State Statistics Service of the Russian Federation. Available online: http//www.gks.ru/wps/wcm/connect/rosstat_main/rosstat/ru/statistics/enterprise/retail (accessed on 30 June 2020).
- Mukherji, S. A framework for managing customer knowledge in retail industry. IIMB Manag. Rev. 2012, 24, 95–103. [Google Scholar] [CrossRef] [Green Version]
- Plotnikov, V.; Pirogova, O. Key Competencies as an Enterprise Value Management Tool. In Proceedings of the 31st International Business Information Management Association Conference (IBIMA) «Innovation Management and Education Excellence through Vision», Milan, Italy, 25–26 April 2018. [Google Scholar]
- Nassar, S.T. The Influence of Intellectual Capital on Corporate Performance of the Turkish Wholesale and Retail Trade Companies. IUG J. Econ. Bus. 2019, 27, 1–14. [Google Scholar]
- Westhuizen, C.; Kok, A. Intellectual capital management in a South African retail company. SA J. Inf. Manag. 2006, 8. [Google Scholar] [CrossRef]
- Amin, S.; Aslam, S. Intellectual Capital, Innovation and Firm Performance of Pharmaceuticals: A Study of the London Stock Exchange. J. Inf. Knowl. Manag. 2017, 16. [Google Scholar] [CrossRef]
Figure 1.
General scheme of research hypotheses.

Figure 2.
Dynamics of intellectual capital (IC) indicators calculated by the Value Added Intellectual Coefficient (VAIC) method.
Figure 2.
Dynamics of intellectual capital (IC) indicators calculated by the Value Added Intellectual Coefficient (VAIC) method.

Figure 3.
Dynamics of the IC indicator calculated using the Calculated Intangible Value (CIV) model.
Figure 3.
Dynamics of the IC indicator calculated using the Calculated Intangible Value (CIV) model.

Figure 4.
Dynamics of IC indicators calculated by the method of content analysis.


Table 1.
Descriptive statistics of models.
| Index | N | Minimum | Maximum | Mean | Std. Deviation |
|---|---|---|---|---|---|
| VAIC | 7 | 1.6073 | 3.4108 | 2.9087 | 0.6313 |
| HCE | 7 | 1.7582 | 2.5512 | 2.2882 | 0.3164 |
| SCE | 7 | 0.2110 | 0.6080 | 0.5189 | 0.1423 |
| CEE | 7 | 0.1289 | 0.2516 | 0.1964 | 0.0370 |
| HCR | 7 | 141 | 333 | 256.7143 | 61.3262 |
| RCR | 7 | 545 | 1121 | 858.8571 | 168.6154 |
| SCR | 7 | 321 | 1054 | 606.2857 | 251.4304 |
| ICR | 7 | 1007 | 2508 | 1721.8571 | 453.2440 |
| ROA | 7 | 0.105 | 0.154 | 0.131 | 0.019 |
| ROE | 7 | −0.025 | 1.497 | 0.687 | 0.501 |
| CIV | 7 | 5.069 × 10⁷ | 1.848 × 10⁸ | 9.866 × 10⁷ | 5.432 × 10⁷ |
| EVA | 7 | −4.127 × 10⁶ | 7.173 × 10⁶ | 7.968 × 10⁵ | 4.440 × 10⁶ |
Table 2.
Results of analysis of models for testing hypotheses of the study.
| Model | F-Test | R Sqare | Multiple R | Result |
|---|---|---|---|---|
| H1.1 | 0.08257016 | 0.862869427 | 0.928907653 | Not statistically significant |
| H1.2 | 0.013151988 | 0.738776204 | 0.859520915 | Accepted |
| H1.3 | 0.226404486 | 0.722455417 | 0.849973774 | Not statistically significant |
| H1.4 | 0.873152053 | 0.005614471 | 0.074929776 | No model |
| H2.1 | 0.33829048 | 0.628433017 | 0.792737672 | Rejected |
| H2.2 | 0.192143743 | 0.312369316 | 0.558900095 | No model |
| H2.3 | 0.597868841 | 0.42282647 | 0.650251082 | Not statistically significant |
| H2.4 | 0.463326439 | 0.111907883 | 0.334526356 | No model |
| H3.1 | 0.038988383 | 0.917827065 | 0.958032914 | Only SCE is statistically significant |
| H3.2 | 0.005584544 | 0.812157392 | 0.901197754 | Temporary clustering is observed |
| H3.3 | 0.045263268 | 0.909062438 | 0.953447659 | Only SCE is statistically significant |
| H3.4 | 0.555059769 | 0.07400878 | 0.272045548 | No model |
| H4.1 | 0.334685493 | 0.631365049 | 0.794584828 | Not statistically significant |
| H4.2 | 0.47846453 | 0.104933627 | 0.323934603 | No model |
| H4.3 | 0.332485385 | 0.633156835 | 0.795711528 | Not statistically significant |
| H4.4 | 0.052521476 | 0.561463952 | 0.749308983 | Not statistically significant |
| H5.1 | 0.025669632 | 0.663501091 | 0.814555763 | The free term is not statistically significant |
| H5.2 | 0.417061329 | 0.135225035 | 0.367729568 | No model |
| H5.3 | 0.555941249 | 0.254385321 | 0.504366257 | No model |
© 2020 by the authors. Licensee MDPI, Basel, Switzerland. This article is an open access article distributed under the terms and conditions of the Creative Commons Attribution (CC BY) license (http://creativecommons.org/licenses/by/4.0/).
Share and Cite
MDPI and ACS Style
Pirogova, O.; Voronova, O.; Khnykina, T.; Plotnikov, V. Intellectual Capital of a Trading Company: Comprehensive Analysis Based on Reporting. Sustainability 2020, 12, 7095. https://doi.org/10.3390/su12177095
AMA Style
Pirogova O, Voronova O, Khnykina T, Plotnikov V. Intellectual Capital of a Trading Company: Comprehensive Analysis Based on Reporting. Sustainability. 2020; 12(17):7095. https://doi.org/10.3390/su12177095
Chicago/Turabian StylePirogova, Oksana, Olga Voronova, Tatyana Khnykina, and Vladimir Plotnikov. 2020. "Intellectual Capital of a Trading Company: Comprehensive Analysis Based on Reporting" Sustainability 12, no. 17: 7095. https://doi.org/10.3390/su12177095
Note that from the first issue of 2016, this journal uses article numbers instead of page numbers. See further details here.