Country Brand Equity: The Decision Making of Corporate Brand Architecture in Cross-Border Mergers and Acquisitions


1
Faculty of Business, South-Eastern Finland University of Applied Sciences, 50101 Mikkeli, Finland
2
Department of Entrepreneurship and Management, Faculty of Entrepreneurship, Business Engineering and Management, University Politehnica of Bucharest, 060042 Bucharest, Romania
*
Author to whom correspondence should be addressed.
Sustainability 2020, 12(18), 7373; https://doi.org/10.3390/su12187373
Submission received: 28 July 2020
/
Revised: 29 August 2020
/
Accepted: 1 September 2020
/
Published: 8 September 2020
(This article belongs to the Section Economic and Business Aspects of Sustainability)
Abstract
:Cross-border merger and acquisition (CBM&A) is a dominant and sustainable antagonistic strategy, but a relevant concern like a country has inadequately been emphasized over the five decades of acquisition studies. Therefore, this article attempts to examine the impact of country brand equity (CBE) on corporate brand architecture (CBA) in post-CBM&A. It first originates a hypothetical model esteeming Resource-Based View (RBV) and Industrial Organization (IO) theory following the Structure-Conduct-Performance (SCP) paradigm. Then, it tests the model conducting a web survey on 124 acquiring corporates from 29 countries that accomplished CBM&A transactions between 1990 and 2014. The empirical findings clarify that the market aspect, such as the acquirer’s more substantial country brand equity, indirectly leads to the high degree of CBA standardization in the host market through prioritized intangible and strategic resources—corporate reputation and corporate brand management system. Individually, the acquirer’s corporate reputation cumulatively yields a high degree of CBA standardization with corporate brand power, which has only a direct effect. On the other hand, the corporate brand management system leads to a high degree of CBA standardization cumulatively with corporate reputation. It is deemed that the research findings as a whole reveal a framework for the application of country brand equity and corporate brand architecture in post-CBM&A.
1. Introduction
Cross-border merger and acquisition (CBM&A) is a central approach in Foreign Direct Investment (FDI) [1] as the estimated value was USD 1.2 trillion in 2019, according to Reuters. Generally, it is about 40% of the entire M&As in the world [2,3]. The Wall Street Journal revealed that the global M&As value was USD 3.8 trillion in 2019 [4]. Though CBM&A is an intense practice, to some extent, it is a complicated system since the significant proportion (i.e., more than 50%) was hopeless and unable to reach the expected returns [5,6]. Thus, acquisition analysts have endeavored to portrait the means of worth formation in several learning stages. Nevertheless, there is an insufficient reflection on corporate brand architecture, even if corporate branding is necessary for value creation in post-acquisition [5,7,8]. Scholars also observed that reconfiguring, leveraging, and utilizing the brand resources can enhance the acquisition gain [5,9]. For example, 70% of the total earnings are subject to brand assets [8].
On the other hand, Aaker [10], Basu [11], Richard Ettenson [12], Hsiang Ming and Ching Chi [13] claimed that brand name, logo, and symbolic value are reliable indicators for acquisition success. In this way, a brand ought to be admitted performing the central part of a corporate strategy. However, Johne [14], Kumar and Hansted Blomqvist [15], Rosson and Brooks [16] argued that a brand does not indicate only the name, logo, and symbolic worth. It is fundamental and central governance of the association, organizational system, operation, customer service, stakeholders’ benefits, set of affiliations, and desires regarding a corporate, product, or services evoked in consumers’ minds. Gussoni and Mangani [17], Rao, Agarwal [18] specified that corporate branding is a governing issue for stakeholders’ value creation, confirming an acquisition success.
The corporate brand architecture (CBA) is a substantial component of the corporate branding that should be looked at before, during, and after the acquisition dealings [14,15,19] because the nonverbal communication of a corporate is about 85% [20]. It is corporate brand management that contemplates the branding objects such as typography, symbol, logo, design, color, and name [21,22] to keep up a communication with stakeholders maintaining the relationships [23].
However, there are limited studies on various aspects which might impact the corporate decision in post-CBM&A [8,24], such as industry structure [25], currency, stock price, GDP, tax rate, governance, geographic differences, [26], legal environment [27] and cultural variances [7,28]. However, scholars observed that market aspect as country brand equity (CBE) was considered to a limited extent for corporate branding in acquisition settings due to several complications [17,29,30].
Earlier studies also claimed that there is no existence of country brand equity. The notion of country brand equity is a story [31,32], while other studies claimed that it is just a toddler in the international business [33,34]. The above studies indicate that there are no adequate empirical investigations on country brand equity in the setting of cross-border M&A.
Therefore, this article attempts to scrutinize, “how does acquirer’s country brand equity influence the degree of CBA standardization in post-CBM&A?” It is indispensable to answer the question that would immensely support the acquiring corporates in post-acquisition. In doing so, this article contributes and advances the concept of country brand equity in the CBM&A context and shows how it works behind the corporate evolving strategic and intangible resources. Porter also recommended examining the national characteristics and factor conditions in cross-border settings [35,36,37]. Likewise, a country is an essential factor that impacts consumers’ purchase intention, preferences, and loyalty [13,38] and indicates the relationship of an acquirer’s country with the consumers of a target nation through industry, product, and services [39].
It evidences that a country helps a corporation indirectly to succeed in the foreign market like a mother who takes care of their children in the cross-border M&A. The principal reason is that there is no physical existence of a market. Customers’ aggregate minds create a market. Moreover, the experiment advances RBV and IO theory in two ways. It first confirms that RBV and IO theory are subject to corporate’s internal and external structures according to the SCP model, although the performance has not been considered. Second, both theories complement each other for an effective strategy. In the analytical part, this article claims that all the resources and market factors do not create an equivalent value. Therefore, to yield a significant decision on CBA strategy, a corporate should prioritize all the resources and market factors based on their optimal values generated from various relationships among the constructs. This research clearly explains that every construct, fact, and reality create their unique value. Therefore, optimum performance is only possible when decision-makers can notice the value of each economic construct through a prioritization technique that economists did not consider effectively in scientific research.
This article illustrates the manuscript as follows: it first establishes a conceptual model based on how a country brand equity (CBE) influences the acquirer’s CBA strategy along with corporate band management system (BMS), corporate reputation, and corporate brand power. It then explains the research methodology and empirical analysis. The last section describes the summary, conclusion, and limitations.
2. Literature
2.1. Corporate Brand Architecture (CBA)
Corporate brand architecture (CBA) states that how an acquiring corporation appoints the acquired targets (i.e., corporate brand, product brand, division, company, and business unit) in post-CBM&A like a football coach who places the players in a team to win the game in the market [40,41,42]. On the other hand, Aaker [43], Uggla and Filipsson [44] claimed that the CBA strategy could be the placement of corporate branding since the corporate brand identity, vision, and values, and brand architecture, are the keystone of corporate branding. Abraham and Taylor [45] argued that a CBA system goes beyond the visual and graphical relationship to satisfy the business purposes of brands and stakeholders. However, it can be employed with the corporate slogan, logo, symbol, color, and name autonomously or linking the acquired targets according to the order of importance [21,46,47].
The study reflects the CBA strategy in the context of CBM&A based on traditional corporate branding and brand architectural literature that admitted the company and product brand only [21,41,48]. Nonetheless, it is a branding system that explains and organizes the planned relationships among the brands. It also specifies the nature of association and brand utilities with the identities, reputation, image, profitability, leveraging, and positioning equity in post-acquisition [15,49]. However, Ravasi and Schultz [50] claimed that the CBA system reforms and replaces a corporate culture while and Wheeler [51], Jaju, Joiner [52] argued that it restructures the corporate identity and name in post-acquisition. Examples comprise P&G (e.g., Gillette Corporation in the USA), Lenovo (e.g., IBM PC division in the USA), Nestle Group (e.g., Pfizer Nutrition co. in the USA), the Telenor Group (e.g., Telenor Servia, Telenor Denmark, Telenor Bulgaria, Uninor in India, Grameenphone in Bangladesh, DiGi in Malaysia, and Dtac in Thailand) [18,53,54,55].
However, there is a massive debate about whether CBA strategy can be standardized or adapted due to different types of CBA strategy [56,57]. Some researchers argued that standardization is better to fulfill the homogenous needs, demands, and preferences considering the cost savings, global mindset, standard marketing program across countries and regions through social media, internet, and television [35,57,58].
From another standpoint, it is claimed that adaptation is better to adjust the local languages, preferences, consumer tastes, national identity, consumer behavior, competitiveness, specific marketing approach, local environment, and values [59,60]. The reality is that corporates can be successful not only by applying the standardization technique (e.g., Cisco, IKEA, and Virgin) but also using the adaptation approach (e.g., P&G, Unilever) [61].
Alashban, Hayes [35], O’Donnell and Jeong [56] suggested that a corporation should look at domestic and overseas market attributes to detect an appropriate degree of standardization or adaptation tactic instead of only standardization/adaptation approach since those are not separate. As another point of view, the various level of standard or adjustment strategy is more suitable when the corporation has a diverse marketing mix to fulfill the needs, wants and demand of investors, shareholders, and customers [62,63,64]. In post-CBM&A; Most of the acquirers incline towards the standardized corporate branding; for instance, 80% of acquirers keep their corporate brand while 20% utilize the acquired entities at the critical brand or subsidiary level [16,65]. In this way, this examination contemplates the degree of CBA standardization strategy in post-CBM&A due to brand expansion through marketing efficiency [66,67]. Now the question arises whether a country brand equity influences the CBA standardization.
2.2. The Country Brand Equity
Country brand equity has been an exciting and complex issue in the business world because of globalization and competitiveness among nations. A country acts as an organization that manufactures different kinds of products, goods, and services [33,38,68]. On the other hand, Stuart Roper and I. Rojas-Méndez [31] claimed that a country is a corporation since it has a flag, culture, citizens like the logo, culture, and employees of a company. Thus, many nations—such as the USA, UK, China, Poland, New Zealand, and South Africa—are promoting their country as a brand. In contrast, Japan promoted Mitsubishi, Toyota, and Honda to strengthen the perception of Japanese brand excellence [39]. The Finnish foreign ministry launched an exciting project in 2008 to yield country brand equity and, in that way, enhanced global competitiveness and attractiveness [69].
Nevertheless, Stuart Roper and I. Rojas-Méndez [31], Fan [32] criticized the concept of country brand equity as it does not have reality since it is a myth with an unassuming, unproductive, thoughtless, and problematic concept. Similarly, Papadopoulos and Heslop [33], Olins [34] claimed that it is an infant in the development of global business ideas and applications. However, it is a practice of perceived quality, image, loyalty, awareness, trustworthiness, commitment, and affiliation of a nation among the clients, customers, and stakeholders from the target countries [43,68]. Generally, the brand equity concept accelerates the country’s brand equity, which links to the memory construction in cognitive psychology and neuroscience [38,39].
However, Papadopoulos and Heslop [33], Zeugner-Roth, Diamantopoulos [38], Kotler and Gertner [68] emphasized, especially on country equity, country of origin, country brand, country image instead of country brand equity. The notion of country brand equity is a set of benefits and liabilities connected to a country name and symbolic value. It implies the different levels of negative or positive mental connections with a purchase decision, product evaluation, and investment choice [10,39]. Kotler and Gertner [68] argued that it could identify the profit and risk in the foreign investment while Sun and Paswan [70] claimed that it influences a foreign government, agencies, citizens, investors, and customers. However, Fan [32] simply explained that it is a wide-ranging international stakeholders’ perception about a national culture considering the elements of celebrities, fashion, food, history, and language, while Dinnie, Melewar [71] exposed the tourism, investment, and immigration for national sustainable development.
Nevertheless, particular industries also yield the country brand equity, for instance, Japanese technology, German engineering, Greek mythology, Hollywood movies, British rock, Brussels lace, Russian roulette, Brazilian soccer, and France panache [33]. Zeugner-Roth, Diamantopoulos [38] argued that product brands also generate the country brand equity; for example, the label of “Made in Germany,” “Made in Japan,” and “Made in the USA” are regarded positively and happily by the customers, stakeholders, and investors compared to “Made in China,” “Made in Bangladesh” and “Made in Hungary.” Generally, buyers evaluate the reputation of those nations during the purchasing decisions and placing product orders. Pappu and Quester [39] argued that this is the reason why the assembler, designer, manufacturer, and producer of certain products and goods patent the national reputation and image.
Fan [32] emphasized on the macro level image of a country rather than any branding because promoting an actual picture can generate country brand equity. He likewise suggested that the national brand relies on the entire national image, which is assessable and manageable. On the contrary, Zeugner-Roth, Diamantopoulos [38], Pappu and Quester [39], Hakala, Lemmetyinen [69] noticed that national awareness is the central part of a country brand equity since association and image (i.e., micro and macro) both are important for country brand equity instead of a macro image only. For instance, a customer considers macro and micro images before buying the product and services because a macro image indicates the association and belief about a nation, while the micro image illustrates the product categories. Hakala, Lemmetyinen [69] especially claimed that product valuation subjects to a perceived match between the country name and product category.
It implies that country brand equity firmly associates with corporate’s Brand Management System (BMS). The principal reason is that a brand positioning is not thinkable without any BMS because customers create corporate reputation favoring the brands in a competitive market [72,73,74]. On the other hand, Aaker [10], Corkindale and Belder [73] claimed that BMS drives corporate reputation in the case of a powerful brand. Sun and Paswan [70] stated that robust national brand equity relates to the firm’s strategic and economic benefits through the visibility, recognition, and reputation of a brand. In contrast, it specifies that CBE safeguards the firm’s bargaining power with channel members, suppliers, and buyers since strong BMS controls the corporate and product brand [39,75]. For instance, P&G, Nike, and Sony ensure corporate’s governance practicing the stronger BMS [76].
Douglas, Craig [29], Papadopoulos and Heslop [33] endorsed that a corporation should consider the country brand equity for an effective CBA strategy in post-CBM&A since an acquirer can leverage the countrywide value in a CBA system. Similarly, Uggla [77] exposed a relationship between country brand equity and CBA strategy. In post-CBM&A, if an acquiring nation has less brand equity in the target market, a low standard level of CBA strategy can carry out a better performance. On the flip side, the acquirer’s robust country brand equity indicates a higher standard CBA tactic employing product or service preferences. The principal reason is that trustworthy countrywide information generates signals for stakeholders and customers about product quality, origination, and manufacturing status. It turns to a corporation as a global brand using BMS, considering stability, intentionality, leadership, and protection [69,78,79].
From another standpoint, Kotler and Gertner [68] confirm that a country of origin influences brand equity, while a country of manufacturing impacts brand quality. In this way, a county brand equity differentiates the corporates applying high-quality BMS through product, administration, services, quality, and reliability. For example, Häubl [78] denoted that a buyer evaluates brand name and country of origin during a car purchasing. However, Hsiang Ming and Ching Chi [13] explained that customers buy a product or service from a politically free and economically developed nation since an entire country image inclines and promotes the country brand equity. In the same way, Feito-Ruiz and Menéndez-Requejo [27] claimed that in post-CBM&A, stakeholders’ value depends on the legal condition of an acquirer country rather than target one. Consequently, this article predicts that:
Hypothesis 1.
The acquirer’s substantial country brand equity indicates the CBA strategy by the high degree of standardization in post-CBM&A.
Hypothesis 2.
The acquirer’s substantial country brand equity leads to a robust brand management system in post-CBM&A.
Hypothesis 3.
The acquirer’s substantial country brand equity leads to a robust corporate reputation in post-CBM&A.
2.3. Acquirer’s Brand Management System
Proctor & Gamble (P&G) first develops an idea of the brand management system (BMS) during the 1930s [76]. After that, it has been leading attention in the marketing literature [80], as a tool of brand creation [81], and an originator of value creation [82]. Urde, Baumgarth [83] defined that BMS is a brand-oriented business, trustworthiness, brand mindset, corporate religion, brand manners, whereas Park and Kim [84] indicated a strategic route. Ho Yin and Merrilees [80] supposed that it is a combination of perception, image, brand loyalty, and equity even though Lee, Seong Yong [76] highlighted the brand identity and brand architecture.
Nevertheless, BMS can be classified into three magnitudes, such as hierarchic types, implementation, brand identity, and value [82]. In contrast, Santos-Vijande, del Río-Lanza [74] explained that BMS belongs to internal branding, strategic branding, and brand orientation. Generally, it is a corporate’s dynamic capability to generate rare and unique resources [74,76].
Ho Yin and Merrilees [80], Ni and Wan [85] claimed that BMS is a valid strategic resource achieving corporate objectives and maintaining a corporate relationship with stakeholders even though it can be anything associated with branding objects such as brand name, trademark, logo, and slogan [86,87]. Nevertheless, Townsend, Cavusgil [88] revealed that BMS relates to a CBA strategy. It is also argued that BMS influences a high degree of CBA standardization to extend the acquirer’s corporate brand [42,83]. From a service perspective, efficient corporate brand architecture generates corporate reputation confirming customer satisfaction and brand positioning. Aaker [72], Corkindale and Belder [73], Santos-Vijande, del Río-Lanza [74] claimed that BMS is flawless when the stakeholders’ judgment authenticate the corporate reputation, but Aaker [10], Corkindale and Belder [73] appealed that corporate brand and corporate reputation are substituted each other when the product and services are subject to the same corporate name. Hence, it is projected that:
Hypothesis 4.
The acquirer’s robust brand management system indicates the CBA strategy by the high degree of standardization in post-CBM&A.
Hypothesis 5.
The acquirer’s healthy brand management system leads to a robust corporate reputation in post-CBM&A.
2.4. Acquirer’s Corporate Reputation
Corporate reputation is a rewarding intangible resource [89,90,91]. It has been a leading branch of branding and marketing literature considering the corporate’s vision and prior activities [90,92]. Sur and Sirsly [89], Carter and Ruefli [93] clarified that corporate reputation is the reaction of people, employees, investors, and customers to a corporate brand. At the same time, Helm and Salminen [92], Abratt and Kleyn [94], Kitchen, Tourky [95] stated that the overtime images generate a more substantial corporate reputation through visibility, transparency, distinctiveness, authenticity, and consistency. Nevertheless, Sur and Sirsly [89], Carter and Ruefli [93] claimed that only favorable, durable, and high-quality corporate reputation is a precious resource offering cost-effectiveness and price premium even though a suitable reputation might not be durable always.
In observation, Van den Bosch, de Jong [96] found that there is a relationship between CBA strategy and corporate reputation, although Varadarajan, DeFanti [97] demonstrated the positive and adverse effect between them. On the contrary, Zyglidopoulos, Alessandri [91] claimed that there is no relationship between CBA strategy and corporate reputation when the CBA strategy relates to a symbolic value. The main reason for various outcomes is that CBA strategy is a multi-dimensional concept considering stakeholders’ confidence, corporate brand identity, the flow of communication, and marketing efficiency [94,98]. Nevertheless, Hasanbegovic [98] explicitly confirmed that an acquiring firm could expect a satisfactory result from corporate reputation when the CBA strategy is standardized in post-CBM&A.
Although a corporate reputation is a lucrative resource for an acquirer, it has not been adequate yet to gain market share and control. In that situation, Corkindale and Belder [73], Tostao [99] suggests that an acquiring firm needs a corporate brand power to gain price premium, promotional efficiency, supply chain network, product, and service excellence. Crosno, Freling [100] clarified that a high corporate reputation is a source of corporate brand power, but Santos-Vijande, del Río-Lanza [74] specified that brand power and brand value are the two elements of the same brand resource. In general, corporate brand power enhances profitability, sales growth, and market share [76,101]. Moreover, Woon Bong Na, Roger Marshall [102], Persson [103] noticed that the price premium is subject to corporate brand power, shaped by a strong corporate reputation. In contrast, Corkindale and Belder [73] identified that a strong corporate reputation and corporate brand power are synonyms. Henceforth, it is projected that:
Hypothesis 6.
The acquirer’s strong corporate reputation indicates the CBA strategy by the high degree of standardization in post-CBM&A.
Hypothesis 7.
The acquirer’s strong corporate reputation leads to a strong corporate brand power in post-CBM&A.
2.5. Acquirer’s Corporate Brand Power
Corporate brand power is a valuable elusive marketing resource in the corporation [40,100]. Van Rij [20] explained that it is unique brand integrity, appeal, and personality consisting of progress, identity, and communication consistency, which safeguard the loyalty of current and next-generation customers. From a consumer and marketer perspective, Campbell [104] claimed that corporate brand power reduces customers’ search cost enhancing the trust of a corporate. It likewise ensures a competitive benefit for traders, suppliers, and marketers. On the contrary, brand social power changes customers’ behavior and makes them “promotional agents.”
In the same way, corporate brand power depends on brand identity, reputation, stock price, net sales, profitability, and CBA strategy to control market behavior [77,100]. However, Tostao [99] claimed that industrial economists emphasize the market power instead of brand power in the industry-battle. Market power can increase the price premium even though some efficient corporations charge a lower price to control the market. Nevertheless, efficient companies can also get profit from higher prices [105]. Generally, the actual battle is for market share; for example, Na and Marshall [106] argued that corporate brand supremacy enhances market share, which is a reflector of market power [105].
However, CBA strategy is one of the essential tools to leverage brand power in post-CBM&A since it confirms the future cash flow [107]. A principal reason is that brand power and CBA strategy both work for strategic resources, corporate vision, and competitiveness [44,48]. Brand power is not only employed for the competitive market but also practiced in post-CBM&A. Theodosiou and Leonidou [63] stated that the acquirer’s corporate and target generally have organizational and national cultural discrepancies that might have power inequality between them. In contrast, a valuable resource and ownership ratio can also generate power differences in M&A [108]. Subsequently, power differences frame a bargaining capacity, whether the branding approach should be standardized or adapted. If an acquirer corporate has more ownership control, it standardizes the CBA strategy in post-CBM&A [109]. That said, both companies or entities utilize the same assets; they might have power discrepancies as power is not equally balanced [108]. Even though an acquired target has similar resources, the acquirer might face the challenges of controlling the target [110].
Nevertheless, acquirers are generally healthier than targets in post-CBM&A [111]. Therefore, they deliver standardized assets such as technology, services, and products and put tremendous pressure on the acquired target to follow the standardized CBA approach in post-CBM&A [108,110]. Therefore, it is supposed that:
Hypothesis 8.
The acquirer’s more substantial corporate brand power leads to a CBA strategy in post-CBM&A by the high degree of standardization.
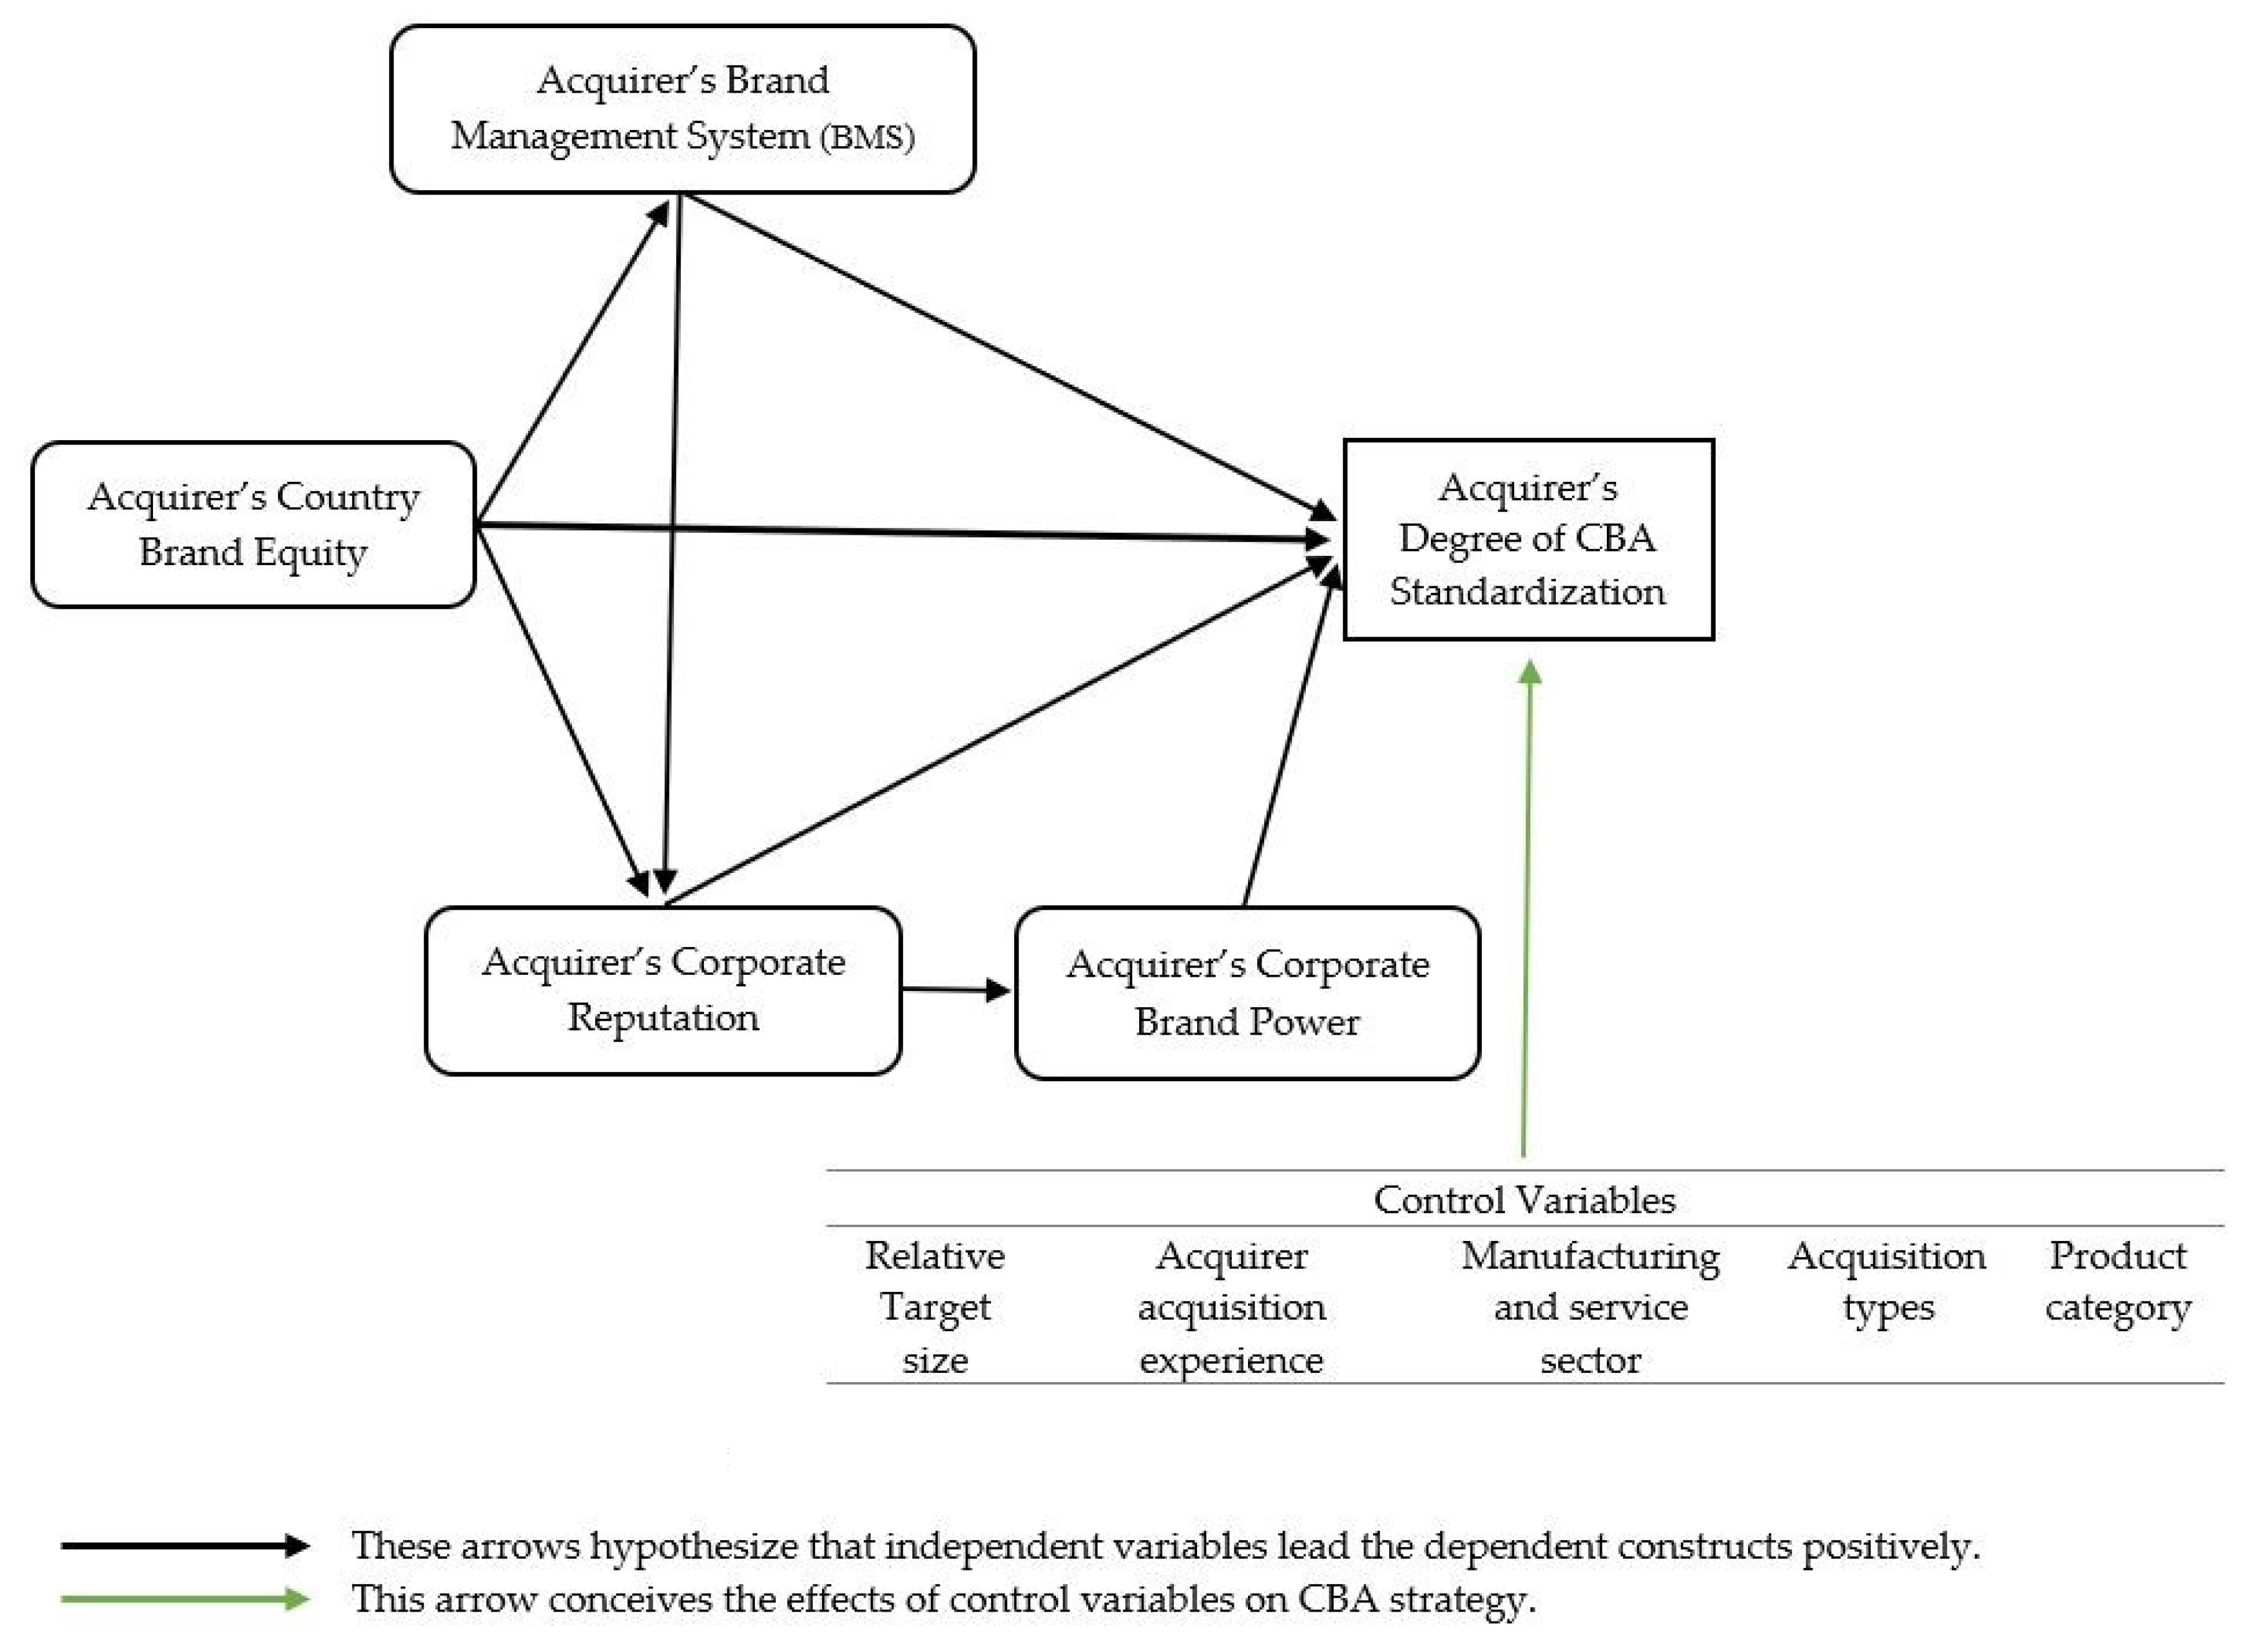
Figure 1 presents the theoretical framework mentioned above.
3. Methodology
Sample, Descriptive Data and Research Approach
This study designed the retrospective web survey following the prior studies of Dillman [112] and Slattery, Voelker [113]. Sequentially, the questionnaire was pretested in January 2016 on seven executives and IB professionals to confirm the content, construct, and face validity [28]. Then, the study conducted a six-round web survey in 2016. It preferred the acquiring firms that conducted CBM&As between 1990 and 2014. The principal reason is that acquiring firms make most of the strategic decision obtaining equity stakes [5,111]. In this study, 85 acquirers took over more than 95 percent equity stakes while 12 transactions accomplished the partial acquisitions (i.e., 51–94 percent). The equal share was below the five dealings, along with some missing values.
Furthermore, CBM&A is a complex phenomenon rather than a domestic one due to substantial global development [114,115], and the 1990s was a significant decade for CBM&A growth [25]. In this study, twenty-five acquisitions were accomplished between 1990 to 2005, while ninety-eight dealings were between 2006–2014, with one missing transaction. Furthermore, ninety-three corporates acquired the whole company. The following takeovers were business units (i.e., ten transactions) and division (i.e., twelve transactions). Also, there are less than five takeovers of corporate and product brands. It shows that the trend of CBM&As is to buy a whole company. Although the related acquisition is a significant focus in the EU and USA comparing the unrelated acquisition, this study considers both due to multidisciplinary research on branding and acquisition [116,117].
However, this study adopted the acquiring firms based on deal value (i.e., about 50 million to 10 billion) and yearly turnover (i.e., about 49 million to 50 billion) [5,118,119]. It then chose industrial and consumer products, both of which are equally important in the manufacturing and service sectors [120,121]. In this study, industrial products belonged to seventy-one corporates, while twenty-seven corporates had a consumer product, but 23 firms only had both along with three missing values. Furthermore, the industries were pharmaceutical, mineral processing, media and publishing, mining, gas & oil, construction materials, sales & marketing, credit management services, insurance, marketing & advertising, financial, retail & production, ICT, trade & retail, and software industries. Few more industries were construction, engineering, life science tools, energy, biotech/diagnostics, production, document technology, and exhibitions.
For CBM&As’ information, this study primarily considered the “Thomson One Banker” database along with “the Orbis,” “Talouselama,” “Fortune 1000 in 2015”, “Financial Times 500 in 2015,” and the “Forbes Global 2000 in 2015” [122,123]. Only 800 corporations communicated the author out of 10,000 companies that received the invitations. Finally, this study collected the data from 124 acquirers’ headquarters from 29 countries such as Austria, Australia, Belgium, Bulgaria, Brazil, China, Croatia, Canada, Finland, France, Germany, Hong Kong, Italy, Ireland, Japan, Luxembourg, Mexico, Netherland, New Zealand, Norway, Russia, Singapore, Spain, Switzerland, Sweden, Thailand, UAE, UK, and the USA. There are ten missing values. On the contrary, there were 30 target countries, along with 16 missing values. There are more missing data in acquiring and target countries because respondents wanted to protect the complete deal information. However, respondents were considered in the statistical analysis instead of any country. Otherwise, all the missing values were kept counting the mean value with SmartPLS software according to the instruction of Hair et al. [28,124].
In the respondent setting, there were 37 Chief Executives (i.e., 29.8%), 35 senior executives such as president, VP, chairman, and director (i.e., 28.2%) and 33 (i.e., 26.6%) other high officials. According to AAPOR, the response rate is about 15.5% (i.e., 124 out of 800), which is quite well because the investigation is multidisciplinary considering the branding and acquisition issues [125]. Besides, the previous response rate in acquisition studies was 20.23% [28] and 14.47% [7]. Lastly, the study transferred the collected data into SmartPLS professional version 3 for statistical analysis instead of CB-SEM due to five reasons: (1) the high predictive power of dependent variable; (2) suitability of complex model; (3) the result accuracy in the reflective measurement (4) low sample size (ideal from 100 to 200); (5) Analysis of limited but valuable data [28,125]. Following prior acquisition studies, this study used Harman’s single factor test and confirmed that there is no common method bias since variance is 33.202% only (Appendix C) [7,28,126]. On the other hand, there is no evidence for nonresponse biases (Appendix C) [28]
4. Measurement Development
Corporate reputation is an essential economic construct for a couple of decades, but the measurement was not progressed in the related stream. Earlier measurements had a deficiency in the standard criteria of corporate reputation index, respondents, and specifications [90,127]. On the other hand, most of the studies were consumer context [128]. However, this study looked at Carter and Ruefli [93], who conducted the industry level research considering the measurements of Fortune’s reputation survey. Consequently, it inquired about the attributes of the acquirer’s corporate (1 = very low, 7 = very high) compared to competitors during the acquisition.
After pretesting the questionnaire, four items were remained, such as management quality, innovation quality, financial soundness, acquirer’s product, and service quality, but only one item as product and service quality was omitted by the statistical measurement [93]. Lastly, this study followed a seven-point Likert scale following the prior acquisition studies [7,28]. Furthermore, corporate brand power can be used by the various concepts such as brand image power [102], cyber brand power [106], brand social power [100], and brand strength [79]. The valuation of corporate brand power is difficult because brand power arises from various internal and external sources of a corporate [100,103]. However, this study used the corporate brand power concept in the acquisition context and inquired about the acquirer’s corporate strength in post-acquisition. Moreover, the attributes were a barrier to competition, an introduction of new products, price premium, and purchase intention of product and services (1 = strongly disagree, 7 = strongly agree). The measurements were extracted from earlier studies which have been redrafted and reworded by the acquisition specialists [79,103,129].
Country brand equity is a complex issue to measure in the context of an acquisition. It is still in the thematic and abstract levels [38,69]. Generally, the measurement is one of two types: micro and macro-level phenomena. Micro-measurement indicates the specific product, industry, and services, while the macro-level dimension clarifies the national economy, market economy, industrialization, and democracy [39]. Nevertheless, this study reflects the micro-level measurement due to corporate research. Moreover, it inquired the customers’ perception from the target country about the products and brands of the acquirer’s home country by the following items; innovation, high quality, trustworthy, well-known, and prestigious (1 = strongly disagree, 7 = strongly agree) [38,39,69].
Moreover, this study applied the Brand Management System (BMS) in an acquisition context. Earlier firm-level studies such as Santos-Vijande, del Río-Lanza [74] considered fourteen items in three stages, such as brand orientation, internal branding, and strategic management, while Lee, Seong Yong [76] considered eleven items together. However, this study took seventeen items from the above studies, but it only found seven items after pretesting the questionnaire and statistical assessment.
The final items were brand objective, branding importance, employees’ concerning and understandability about a brand, brand management team, marketing action for brand image, medium- and long-term acquirer’s corporate brand goal (1 = strongly disagree, 1 = strongly agree) [74,76]. Moreover, this study first time measured the corporate brand architecture (CBA) in the CBM&A context considering the company, product, business unit, division, corporate, and product brand. Earlier studies considered branding elements in different branding studies in numerous contexts such as brand architecture [42], corporate brand redeployment [52], brand architecture and brand portfolio [130], and corporate visual identity [46,131]. The foremost cause is that a brand is an intangible resource [9]. On the flip side, branding objects are tangible resources that support branding issues to measure. Finally, this study inquired how acquiring corporate applied their branding elements on the target in the post-acquisition (1 = not all used, 7 = fully used). In the statistical assessment, four items finally have been extracted as a brand name, symbol/logotype, typography/typing format/typeface, and slogan [46]. (Appendix A).
Control Variables
The control variables are necessary to examine the external effects on the research model. Earlier acquisition studies specified various control variables such as relative size, acquisition experience, transaction types, institutional distance, industry growth, and combined sales [7,28]. On the other hand, Buckley, Elia [116] verified the ownership, target size, acquisition types, host and home country differences while Ambrosini, Bowman [5] identified the relative size, prior acquisition experience, the relatedness of the entities, geographical scope, manufacturing, and service industry.
This study extracted the control variables such as relative target size, acquirer’s acquisition experience, manufacturing and service sector, acquisition types, and product category from prior branding and acquisition studies. In contrast, it evaded the industry growth, geographic scope, ownership, host and home country differences, institutional distance, and combined sales because those are technically and conceptually not related to this model [7]. Nevertheless, the relative size is the leading substance because the acquirer can manage a smaller target rather than an equal or larger one [7,116].
Consequently, this study inquired the number of employees of target relating to the acquirer (1 = very small, 7 = very large) [108,119] and proportionate annual sales of the target compared to the acquiring firm (Less than 15% = coded by 1, 76–100% = coded by 7) to measure the relative size [5,119,132]. Buckley, Elia [116] considered the acquisition experience as an intangible factor, although it is frequently considered as a control variable as it is a routine for acquisition development. Acquisition experience was measured by how many acquisitions, acquiring firm conducted before the real deal (1 = none, 7 = less than 100) [5,116,133]. Moreover, the study investigated the acquirer’s business sector (1 = manufacturing sector, 2 = service sector, 3 = both), and acquisition type (1 = related, 2 = unrelated, 3 = partial) [5,116,117,119]. Finally, the study queried the best matching product category between the acquirer and target (1 = industry product, 2 = consumer product, and 3 = both) [84] (Appendix B).
5. The Results
5.1. Assessment of the Measurement and Structural Models
Before evaluating the structural model, there are two reliability tests, such as indicator reliability (i.e., outer loadings and inner VIF) for measurement model and internal consistency reliability (i.e., outer VIF, composite reliability, AVE, and discriminate validity) for a structural model. Discriminate validity is subject to cross-loading, HTMT, and Fornell-Larcker criterion [125,134]. In the measurement model, the assessment exemplified that indicator reliability is established since all the reflective indicators of first-order latent variables met the 0.70 threshold level except one (0.69), which fulfills the threshold level of 0.60. Generally, 0.70 is frequently used as a threshold level [7,125,135], but Capron, Mitchell [136] noted that loading estimation could be between 0.60 and 0.70 in exploratory research (Appendix C). This study also confirms that there is no multicollinearity problem since outer VIF values are less than 5 (Appendix C) [125,137].
In the assessment of the structural model, construct reliability is assessed by composite reliability that confirmed the values are above 0.70 (Appendix C), and inner VIF values are less than 5 (Appendix D). This study confirms the convergent validity (AVE), maintaining the threshold level of 0.50 criterion (Appendix C). Finally, after testing the discriminant validity by the Fornell–Larcker criterion, HTMT, and cross-loadings, this study concludes that the items and constructs are unique (Appendix D and Appendix E) [28,125,137]. Furthermore, R2 value of the latent constructs are BMS (0.101), CBA (0.189), CBP (0.92), and RPT (0.245) respectively. Accordingly, f2 and Q2 have been explained in the hypothesis section. The SRMR (i.e., global goodness of fit measure) value is 0.084 in the saturated model of this study. The value is adjacent to a threshold level of 0.08, which indicates that model fitness is quite acceptable because the threshold level (0.08) of SRMR is too low in PLS-SEM for model fitness criteria [125,135].
5.2. Hypothesis Testing
This study used a one-tailed test in the directional hypotheses following the recent M&A studies, e.g., Brown, Davis-Friday [138], and Chen, Thomas [139]. In the hypothesis test, H1 indicates that acquirer’s country brand equity (CBE) has no direct relationship with the degree of CBA standardization. However, CBE has a high positive direct effect on BMS in H2, whereas the coefficient is 0.318 ** at the medium level effect size f2 = 0.112 and predictive relevance Q2 = 0.060. Subsequently, the corporate reputation is positively influenced by the CBE in hypothesis H3, whereas the path coefficient is 0.416 *** along with f2 = 0.206 and Q2 = 0.123.
Hypothesis H4 shows that a brand management system (BMS) has a positive direct effect on the degree of CBA standardization at 0.245 ** along with f2 (0.062) and Q2 (0.119). Moreover, the positive influence of BMS (H5) on corporate reputation is verified by the path coefficient (0.167 *) at low effect f2 = 0.033 and Q2 = 0.123. Remarkably, the acquirer’s corporate reputation has no direct effect on CBA strategy (i.e., H6), but it has a high positive direct effect on CBP in H7 (0.303 ***) at f2 (0.101) and Q2 (0.045). In hypothesis H8, this study finds that there is a positive effect of corporate brand power (CBP) on the degree of CBA standardization based on the path coefficient (0.2017 *) by the minor effect of f2 (0.055) at Q2 = 0.119. Furthermore, the model has no external influences by the control variables.
The results of the hypothesis testing are presented below in Figure 2.
Henseler, Hubona [135] proposed that after testing the direct effects, researchers should consider the indirect and cumulative effects because the direct effect does not explain the effect of mediation (i.e., indirect effect) [140]. On the other hand, the cumulative or total effects are also important for the analysis of success factors [141]. In Table 1, there is an indirect effect established between CBE and CBA by the complete mediation (0.181 **) through BMS and RPT. Correspondingly, there are no other indirect relationships. On the other hand, accumulating direct and indirect effects, the cumulative effects are (CBE -> RPT; 469 ***), (BMS -> CBA; 282 ***), (RPT -> CBA; 220 *), and (CBE -> CBA; 166 *) [137]. Previous studies also considered the direct, indirect and total (i.e., cumulative) effects in the model assessment [119,142]. However, testing the various effects do not provide the actual managerial decision, because that experiment does not conclude which effects are stronger to explain the dependent variable better. For example, indirect, direct, and cumulative effects are diverse based on various relationship strengths [125].
5.3. Prioritization
This study uses a prioritization technique to prioritize the various effects since there is as yet no method available on how to optimize the dependent variable. Hair, Hult [125] also claimed that additional investigations are necessary on the construct relationships for corporate decision-making since only the hypothesis testing and significant level do not provide any managerial attention. They recommended that scholars should examine how two-path coefficients fluctuate in the same structural model and apply statistical analysis according to study objectives. However, R2, f2, and Q2 provide a general statistical assessment and numerous effects. This study uses a prioritization method, testing the relationship strength of numerous effects in the inner (i.e., in the cell) and outer (i.e., among the cells) models based on a significant level of 5% (i.e., predictive validity) and coefficients (i.e., relationship predictability) [125,143,144]. In Table 1, each row indicates an independent variable, while each column shows the dependent variable. Also, under each independent variable, there are hypotheses/direct effects, indirect and cumulative effects. The bold font specifies the prioritized relationships/effects.
In the inner model, this study computes the prioritized effects comparing the various effects such as direct, indirect, and cumulative in each cell. For example, the path (BMS -> CBA) has three different effects with multiple significant levels, for example, 0.245 ** (i.e., direct effect by 1%), (0.037) (i.e., indirect by insignificant) and 0.282 *** (i.e., cumulative effect by 0.01%). The study compares the coefficients of 0.245 ** and 0.282 *** since the indirect effect is insignificant. Both values fulfill the 5% significant level. Then, the study considers the cumulative effect (0.282 ***) as a prioritized effect due to high coefficients. Since the cumulative effect is the sum of direct and indirect effects, the direct effect will be considered if there are no possible indirect effects [125]. Similar rules are useful to each cell in Table 1 for the rest of the prioritized effects. This study drives to the outer model after examining the prioritized effects in the inner model.
In the outer model, the study compares the prioritized effects among the cells. For example, there are prioritized effects such as (BMS -> CBA; 0.282 ***) and (RPT -> CBA; 0.220 *) at 5% significant level. This study confirms that the cumulative effect of (BMS -> CBA; 0.282 ***) is stronger than the cumulative effect of (RPT -> CBA; 0.220 *). Then, the same rules are applicable in the outer model.
In the prioritized effects, country brand equity (CBE -> CBA; 0.181 ***) has a strong absolute indirect effect on the degree of CBA standardization through the cumulative effect of CBE -> RPT; 0.469 *** and direct effect of CBE -> BMS; 0.318 ** respectively which answer the research question of this study. However, independently, BMS impacts the high degree of CBA standardization (BMS -> CBA; 0.282 ***) based on cumulative effects along with the corporate reputation. Then, the corporate reputation (RPT -> CBA; 0.220 *) influences CBA standardization based on cumulative relationships with corporate brand power (CBP -> CBA; 0.201 *). Corporate brand power only has a direct effect on CBA standardization.
In decision making, this study proclaims that as a market factor, the acquirer’s country brand equity indirectly influences the degree of CBA standardization through prioritized resources such as the acquirer’s corporate reputation, BMS and CBP. However, the relationships among the constructs are more complicated than anticipation because all the constructs are interconnected. For example, CBE does not have a more substantial effect on corporate reputation without BMS. On the other hand, corporate reputation has no influence on CBA strategy without corporate brand power. Nevertheless, the study advances the RBV and IO theory illustrating the effect of a market factor on the prioritized firm resources for an adequate degree of CBA standardization in post-CBM&A. Finally, it also confirms that prioritized firm- and market-level factors are the sources of a compelling corporate strategy.
6. Conclusions
6.1. Theoretical Contributions
This study first conceptually develops the notion of corporate brand architecture (CBA) in post-CBM&A based on acquiring corporation and target (i.e., the entire company, business unit, division, corporate and product brand). It then empirically confirms that by the effects of one market factor and three firm-level resources considering the 124 acquisition dealings across the world. It is rigid to relate the empirical findings with earlier inconclusive branding studies in acquisitions. For example, some studies stated brand architecture and brand hierarchy in acquisition setting along with corporate and product brands or between the two entities [11,44]. Accordingly, Jaju, Joiner [52] observed that different brand deployments influence the response of customers in post-acquisition while Hsiang Ming and Ching Chi [13] recognized that brand deployment enhances market share. Nevertheless, this study authenticates the new idea of corporate brand architecture in post-CBM&A.
Moreover, a country is a wide-ranging issue in cross-border M&A since it is like a parent corporation and makes relationships with customers of a target country through its name, flag, citizens, culture, and value along with firms, products, and brands [31]. Therefore, prior studies developed some concepts such as country equity, country branding, country image, and country of origin. For example, Sun and Paswan [70] found that country branding and brand image influence the consumers’ buying behavior, while Sun and Paswan [145] claimed that country of origin impacts product quality. Kotler and Gertner [68] originated that a country image is essential for product evaluation and purchasing decisions since it offers a positive reputation to the entire product category such as French wines and perfumes or even a brand like a Café de Colombia. In the non-acquisition and consumer context study, Zeugner-Roth, Diamantopoulos [38] first developed the country brand equity based on country image and the effects of product preferences. In contrast, this study advances and authenticates the concept of country brand equity in a cross-border M&A standpoint, considering corporate and micro-level phenomena.
Empirically, country brand equity impacts the high degree of CBA standardization indirectly through prioritized resources such as corporate reputation (1st) and BMS (2nd). However, corporate brand power should be considered as a 3rd prioritized resource since corporate reputation does not impact the CBA strategy directly. That said, corporate reputation needs the support of corporate brand power for cumulative effect. There are very few studies on the country-related issue, as Hsiang Ming and Ching Chi [13] stated in the consumer context that country characteristics influence the market share in post-acquisition.
So, Papadopoulos and Heslop [33] suggested advancing country branding and equity concept for corporate strategy. Moreover, corporate reputation has been less intensified in the acquisition context, which is indeed overtime images of corporate and product brands. However, Hsiang Ming et al. (2011) confirmed that the brand image of a target influences the value formation of an acquirer. This study first time examines the concept of brand management system (BMS) in the post-CBM&A setting that illustrates a positive cumulative effect on the high degree of CBA standardization along with corporate reputation. A few non-acquisition studies found a direct relationship between BMS and a firm’s performance [74,76]. At last, prior studies emphasized brand power based on some concepts such as brand strength, brand social power, cyber brand power, brand awareness, and image power, but those were either extension [100,102,106] or part of brand equity considering the consumer context [79,103].
In contrast, this study advances the concept of corporate brand power in post-CBM&A, considering the corporate phenomena. It empirically found that it has a positive direct effect on the high degree of CBA standardization, but CBP originates from corporate reputation. Though it is difficult to compare with prior studies, there are some non-acquisition studies such as Nath Sanyal and Datta [79] found that country of origin impact the brand strength, which consecutively influences the brand equity. From another standpoint, Persson [103] claimed that brand strength, which impacts the brand equity, originated from brand image. Similarly, cyber brand power influences customers’ visit intention and satisfaction [106].
6.2. Managerial Contributions
In practice, acquirer’s officials should examine their country brand equity in the host market during the CBA strategy in post-acquisition. The examination should consider the acquirer’s industry and product brands. Besides, executives should evaluate whether an acquired target belongs to the developing or developed country. The principal reason is that developed nations someway established the relationships (i.e., equity) with customers from developing nations based on a specific industry, corporate and product brands, for example, German engineering, Japanese technology, and French wines. Consecutively, acquirers from developed nations such as the USA, UK, Germany, Japan, Finland, Sweden, Norway, and France can easily standardize the CBA strategy in developing countries, e.g., Brazil, Russia, India, China, and South Africa. Hsiang Ming and Ching Chi [13] also found that consumers tend to purchase product brands from politically free and economically developed countries.
However, the logic will be slightly different when both are developed countries; for example, an acquirer can standardize their branding strategy when the acquirer’s industry, corporate, and product brand are relatively better than the host country. For instance, German corporations can easily standardize the CBA strategy if they acquire any companies from the EU, USA, and Japan in the automobile industry. The principal reason is that the German automobile industry has already established its reputation across the world. Policymakers should also concentrate that more substantial country brand equity that relates to corporate reputation, BMS, and corporate brand power, escalates market power charging a higher price premium. This development generates not only acquisition success but also potential cash flows for acquiring nations. Therefore, the possible acquirers from that nation quickly get a competitive advantage to shape a corporate brand, gaining market power, price premium, equity procurement, a fence of new entrants, innovative product brand, substantial and elusive resources. Therefore, many countries develop their nations, such as the UK, USA, China, South Africa, Poland, Finland, and New Zealand. On the flip side, Japan is promoting Toyota, Mitsubishi, and Honda to enhance the country brand equity of Japan [39,69,147].
Policymakers in developed nations should focus on CBA strategy in post-CBM&A because successful corporate brand expansion safeguards future earnings. After all, the robust economic development lifts the BRICS nations to be acquirer instead of targets and to take part in future cash flows [26]. On the contrary, policymakers in developing nations are recommended to follow this study model to transform their corporations into brands through cross-border M&A.
However, executives should consider the various resources and market factors during the acquisition deal. They should also check whether both factors are directly, indirectly, or cumulatively affecting the CBA strategy to standardize. Afterward, they should prioritize the various factors for a successful deal. Also, executives should realize that a market is a combination of human psychology, and competitors fight each other to get a portion from that aggregate customers’ minds. Therefore, corporate brand architecture is more significant in post-acquisition to communicate with the customers in the target country.
6.3. Limitations and Suggestions for Future Research
This study admits several limitations to validate the investigation. It collected primary data applying a retrospective survey. The problem is that acquisition experts provide a positive assessment in the retrospective survey since strategic assessment belongs to 1 to 7 years or sometimes even longer in post-CBM&A [28]. The following limitation is that during the survey, the term of corporate branding had been used instead of corporate brand architecture, which was not familiar by the professionals. A further complication is that corporate branding has not been concerned well in the acquisitions. Also, the branding and acquisition departments are separate in most of the corporations. Hence, this study used PLS-SEM rather than CB-SEM to sustain the statistical power by the limited observations (i.e., less than 300) [7,125].
Furthermore, this study highlighted the degree of standardization rather than adaptation one since both are correlated, and the acquirer tends to make a standardization strategy for marketing efficiency. It also used micro-level measurements for country brand equity, even if there are micro- and macro-level phenomena [39,148]. Furthermore, corporate brand power has been considered by this study, avoiding prior traditional constructs. Regarding the SCP model, this study considers only structure and conduct and evades the performance phenomenon.
However, the potential investigators can consider the additional firm-level resources and market factors that might influence the acquisition strategy following the “prioritization technique” in finance and economics. Future scholars likewise can investigate similar constructs in various acquisition contexts such as domestic and post-CBM&A based on objective measurements. Lastly, the country brand equity needs to be developed further in post-CBM&A for an effective corporate strategy based on micro and macro-level phenomena.
Author Contributions
Conceptualization, A.B.; methodology, A.B. and A.I.; software, A.B. and A.I.; validation, A.B. and A.I.; formal analysis, A.B. and A.I.; investigation, A.B.; resources, A.B. and A.I.; data curation, A.B. and A.I.; writing—original draft preparation, A.B. and A.I.; writing—review and editing, A.B. and A.I. All authors have read and agreed to the published version of the manuscript.
Funding
This research received no external funding.
Conflicts of Interest
The authors declare no conflict of interest.
Appendix A

Table A1.
The operationalization of the constructs.
| Constructs | Research Items |
|---|---|
| Acquirer’s brand management system (BMS) | How was the Brand Management System of your company at the time of acquisition? (Strongly Disagree 1–7 Strongly Agree). |
| |
| |
| |
| |
| |
| |
| |
| Acquirer’s corporate reputation | Indicate the degree of your company’s following attributes related to principal competitors at the time of acquisition? (Very low 1–7 Very high). |
| |
| |
| |
| Acquirer’s corporate brand power (CBP) | How was your company’s corporate brand strength in the target market after the acquisition? (Strongly Disagree 1–7 Strongly Agree) |
| |
| |
| |
| |
| Acquirer’s country brand equity (CBE) | How were products and brands from your company’s home country perceived by customers in the target market at the time of acquisition? (Strongly Disagree 1–7 Strongly Agree). |
| |
| |
| |
| |
| |
| Standardization of corporate brand architecture (CBA) | Which of the following own branding elements your company used after the acquisition in the acquired target? (Not at all used 1–7 Fully Used) |
| |
| |
| |
|
Appendix B
Table A2.
The measurement of the control variables.
| Control Variables | Research Items |
|---|---|
| Relative Target Size | At the time of the acquisition, what was the proportion of annual sales of the acquired target compared to your company? |
| |
| Considering the number of employees, what was the size of the target compared to your company at the time of acquisition? | |
| |
| Acquirer’s Acquisition Experience | How many international acquisitions had been made by your company before this acquisition? |
| |
| Manufacturing and Service Sector | Which of the following industries does your company belong to? |
| |
| Acquisition Types | Did your company and target belong to the same industry? |
Yes, No, Partly
| |
| Product Category | Which of the following best matches the product category of your company? |
|
Note 1: **** indicates inside the scale.
Appendix C
Table A3.
Composite reliability, AVE, outer loadings, and VIF, Common method and Nonresponse bias.
| Composite Reliability, AVE, Outer Loadings, and Outer VIF Values. | ||||||||||
|---|---|---|---|---|---|---|---|---|---|---|
| BMS | CBA | CBE | CBP | RPT | ||||||
| Composite Reliability | 0.937 | 0.930 | 0.900 | 0.871 | 0.822 | |||||
| Average Variance Extracted (AVE) | 0.680 | 0.768 | 0.644 | 0.629 | 0.607 | |||||
| Items | Outer loading | Outer VIF | Outer loading | Outer VIF | Outer loading | Outer VIF | Outer loading | Outer VIF | Outer loading | Outer VIF |
| 1 | 0.840 | 3.517 | 0.862 | 3.072 | 0.731 | 1.421 | 0.713 | 1.625 | 0.812 | 1.715 |
| 2 | 0.793 | 2.926 | 0.898 | 4.044 | 0.770 | 2.083 | 0.862 | 2.113 | 0.697 | 1.549 |
| 3 | 0.796 | 3.080 | 0.860 | 2.589 | 0.856 | 3.366 | 0.796 | 1.749 | 0.822 | 1.212 |
| 4 | 0.807 | 2.960 | 0.886 | 3.289 | 0.833 | 2.791 | 0.795 | 1.756 | ||
| 5 | 0.850 | 3.627 | 0.815 | 2.015 | ||||||
| 6 | 0.865 | 3.242 | ||||||||
| 7 | 0.816 | 2.356 | ||||||||
| Common method bias (Total Variance Explained) | ||||||||||
| Component | Initial Eigenvalues | Extraction Sums of Squared Loadings | ||||||||
| Total | % Variance | Cumulative | Total | % of variance | Cumulative% | |||||
| 1 | 7.636 | 33.202 | 33.202 | 7.636 | 33.202 | 33.202 | ||||
| … 23 | … 0.101 | … 0.438 | … 100.000 | |||||||
| Extraction method: Principal Component Analysis | ||||||||||
| Nonresponse Bias | ||||||||||
| A. Group statistics | ||||||||||
| Respondents | N | Mean | Std. Deviation | Std. Error Mean | ||||||
| Manufacturing and service sectors | Early | 72 | 1.86 | 0.827 | 0.098 | |||||
| Late | 52 | 1.90 | 0.748 | 0.104 | ||||||
| Acquiring a firm’s size | Early | 61 | 3.20 | 1.787 | 0.229 | |||||
| Late | 47 | 3.04 | 1.681 | 0.245 | ||||||
| B. The independent samples test | ||||||||||
| Levene’s Test for Equality of Variances | t-test for Equality of Means | |||||||||
| Equal variances | F | Sig. | t | df | Sig. (2-tailed) | Sig. (1-tailed) | ||||
| Manufacturing and service sectors | Assumed | 2.697 | 0.103 | −0.295 | 122 | 0.768 | 0.384 | |||
| Not assumed | −0.300 | 115.949 | 0.765 | 0.3825 | ||||||
| Acquiring firm’s size | Assumed | 0.790 | 0.376 | 0.456 | 106 | 0.649 | 0.3245 | |||
| Not assumed | 0.460 | 101.821 | 0.647 | 0.3235 | ||||||
Note 1: All the values are more than 0.70 in composite reliability. Note 2: AVE values are more than threshold level 0.50. Note 3: Outer VIF value is less than threshold level 5. Note 4: Values are above the 0.60 threshold level in the outer loadings. Note 5: Variance should be less than the threshold level 50% in common method bias test. Note 6: Insignificances of Levene- and t-test are mandatory for nonresponse bias remedy.
Appendix D
Table A4.
FLC, HTMT, and Inner -VIF.
| BMS | CBA | CBE | CBP | RPT | |||||||||||
|---|---|---|---|---|---|---|---|---|---|---|---|---|---|---|---|
| FLC | HTMT | VIF | FLC | HTMT | VIF | FLC | HTMT | VIF | FLC | HTMT | VIF | FLC | HTMT | VIF | |
| BMS | 0.824 | 1.246 | 1.111 | ||||||||||||
| CBA | 0.343 | 0.371 | 0.876 | ||||||||||||
| CBE | 0.318 | 0.338 | 1.042 | 0.193 | 0.208 | 1.483 | 0.802 | 1.111 | |||||||
| CBP | 0.275 | 0.311 | 0.312 | 0.364 | 1.172 | 0.281 | 0.327 | 0.793 | |||||||
| RPT | 0.299 | 0.339 | 0.286 | 0.345 | 1.451 | 0.469 | 0.545 | 0.303 | 0.362 | 0.779 | 1.000 | ||||
Note 1: -Each construct value is higher than co-relation with other constructs in Fornell–Larcker Criterion (FLC). Note 2: -HTMT values are below the threshold level 0.85. Note 3: -Inner VIF values are below the threshold level 5.
Appendix E
Table A5.
Cross Loadings.
| BMS | CBA | CBE | CBP | RPT | |
|---|---|---|---|---|---|
| CBA_A | 0.227 | 0.862 | 0.222 | 0.375 | 0.329 |
| CBA_B | 0.180 | 0.898 | 0.152 | 0.263 | 0.280 |
| CBA_C | 0.423 | 0.860 | 0.182 | 0.230 | 0.207 |
| CBA_D | 0.348 | 0.886 | 0.109 | 0.212 | 0.181 |
| BMS_A | 0.840 | 0.238 | 0.360 | 0.202 | 0.287 |
| BMS_B | 0.793 | 0.273 | 0.177 | 0.218 | 0.199 |
| BMS_C | 0.796 | 0.278 | 0.172 | 0.222 | 0.193 |
| BMS_D | 0.807 | 0.312 | 0.203 | 0.197 | 0.214 |
| BMS_E | 0.850 | 0.349 | 0.208 | 0.290 | 0.208 |
| BMS_F | 0.865 | 0.304 | 0.299 | 0.244 | 0.314 |
| BMS_G | 0.816 | 0.235 | 0.358 | 0.214 | 0.277 |
| CBP_A | 0.089 | 0.224 | 0.166 | 0.713 | 0.199 |
| CBP_B | 0.254 | 0.250 | 0.238 | 0.862 | 0.269 |
| CBP_C | 0.276 | 0.243 | 0.241 | 0.796 | 0.321 |
| CBP_D | 0.228 | 0.278 | 0.240 | 0.795 | 0.142 |
| RPT_A | 0.215 | 0.168 | 0.378 | 0.168 | 0.812 |
| RPT_B | 0.143 | 0.200 | 0.235 | 0.122 | 0.697 |
| RPT_C | 0.299 | 0.280 | 0.435 | 0.350 | 0.822 |
| CBE_A | 0.219 | 0.132 | 0.731 | 0.233 | 0.526 |
| CBE_B | 0.262 | 0.117 | 0.770 | 0.219 | 0.238 |
| CBE_C | 0.172 | 0.112 | 0.856 | 0.162 | 0.283 |
| CBE_D | 0.274 | 0.173 | 0.833 | 0.254 | 0.400 |
| CBE_E | 0.323 | 0.217 | 0.815 | 0.229 | 0.336 |
Note 1: Each construct indicator is higher than the cross-loadings of other constructs’ items.
References
- Kling, G.; Ghobadian, A.; Hitt, M.A.; Weitzel, U.; O’Regan, N. The effects of cross-border and cross-industry mergers and acquisitions on home-region and global multinational enterprises. Br. J. Manag. 2014, 25, S116–S132. [Google Scholar] [CrossRef] [Green Version]
- Shimizu, K.; A Hitt, M.; Vaidyanath, D.; Pisano, V. Theoretical foundations of cross-border mergers and acquisitions: A review of current research and recommendations for the future. J. Int. Manag. 2004, 10, 307–353. [Google Scholar] [CrossRef]
- Roumeliotis, G.; Barbaglia, P. Dealmakers Eye Cross-Border M&A Recovery as Mega-Mergers Roll on. 2019. Available online: https://www.reuters.com/article/us-global-deals/dealmakers-eye-cross-border-ma-recovery-as-mega-mergers-roll-on-idUSKBN1YZ0YZ (accessed on 8 August 2020).
- Lombardo, C.; Cimilluca, D. The Deals and Deal Markers That Made the Year in M&A. 2019. Available online: https://www.wsj.com/articles/the-deals-and-dealmakers-that-made-the-year-in-m-a-11577701801 (accessed on 7 August 2020).
- Ambrosini, V.; Bowman, C.; Schoenberg, R. Should acquiring firms pursue more than one value creation strategy? An empirical test of acquisition performance. Br. J. Manag. 2011, 22, 173–185. [Google Scholar] [CrossRef]
- Chatterjee, S.; Banerjee, S. Merger and acquisition–A myth? (From an Indian Acquirer’s Perspective). Globsyn Manag. J. 2013, 7, 17–33. [Google Scholar]
- Bauer, F.; Matzler, K.; Wolf, S. M&A, and innovation: The role of integration and cultural differences—A central European target perspective. Int. Bus. Rev. 2016, 25, 76–86. [Google Scholar]
- Vu, D.A.; Shi, Y.; Hanby, T. Strategic framework for brand integration in horizontal mergers and acquisitions. J. Technol. Manag. China 2009, 4, 26–52. [Google Scholar]
- Barney, J.B.; Ketchen, D.J.; Wright, M. The future of resource-based theory: Revitalization or decline? J. Manag. 2011, 37, 1299–1315. [Google Scholar] [CrossRef]
- Aaker, D. Managing Brand Equity; Free Press: New York, NY, USA, 1991. [Google Scholar]
- Basu, K. Merging brands after mergers. Calif. Manag. Rev. 2006, 48, 28–40. [Google Scholar] [CrossRef]
- Ettenson, J.K.R. Merging the brands and branding the merger. MIT Sloan Manag. Rev. 2006, 47, 39–49. [Google Scholar]
- Ming, L.H.; Chi, L.C. Country-of-origin, and brand redeployment impact after the brand acquisition. J. Consum. Mark. 2011, 28, 412–420. [Google Scholar]
- Johne, M. Brand building after the merge. CMA Manag. 2003, 77, 32. [Google Scholar]
- Kumar, S.; Blomqvist, K.H. Making brand equity a critical factor in M&A decision-making. Strategy Leadersh. 2004, 32, 20–27. [Google Scholar]
- Rosson, P.; Brooks, M.R. M&As, and Corporate Visual Identity: An Exploratory Study. Corp. Reput. Rev. 2004, 7, 181–194. [Google Scholar]
- Gussoni, M.; Mangani, A. Corporate branding strategies in mergers and acquisitions. J. Brand Manag. 2012, 19, 772–787. [Google Scholar] [CrossRef]
- Rao, V.R.; Agarwal, M.K.; Dahlhoff, D. How is manifest branding strategy related to the intangible value of a corporation? J. Mark. 2004, 68, 126–141. [Google Scholar] [CrossRef]
- Štrach, P.; Everett, A.M. Brand corrosion: Mass marketing’s threat to luxury automobile brands after merger and acquisition. J. Prod. Brand Manag. 2006, 15, 106–120. [Google Scholar] [CrossRef]
- Rij, J.B.V. Trends, symbols, and brand power in global markets: The business anthropology approach. Strategy Leadersh. 1996, 24, 19–24. [Google Scholar]
- Aspara, J.; Tikkanen, H. Adoption of corporate branding by managers: Case of a Nordic business-to-business company. J. Brand Manag. 2008, 16, 80–91. [Google Scholar] [CrossRef]
- Petromilli, M.; Morrison, D.; Million, M. Brand architecture: Building brand portfolio value. Strategy Leadersh. 2002, 30, 22. [Google Scholar] [CrossRef]
- Alamro, A.; Rowley, J. Brand strategies of Jordanian telecommunications service providers. J. Brand Manag. 2011, 18, 329–348. [Google Scholar] [CrossRef]
- Uggla, H.; Lashgari, M. Brand Portfolio prerogative: Five challenges and research themes within brand portfolio management. Iup. J. Brand Manag. 2012, 9, 7–20. [Google Scholar]
- Bertrand, O.; Betschinger, M.-A. The performance of domestic and cross-border acquisitions: Empirical evidence from Russian acquirers. J. Comp. Econ. 2012, 40, 413–437. [Google Scholar] [CrossRef]
- Erel, I.; Liao, R.C.; Weisbach, M.S. Determinants of Cross-Border Mergers and Acquisitions. J. Financ. 2012, 67, 1045–1082. [Google Scholar] [CrossRef]
- Feito-Ruiz, I.; Menéndez-Requejo, S. Cross-border Mergers, and Acquisitions in different legal environments. Int. Rev. Law Econ. 2011, 31, 169–187. [Google Scholar] [CrossRef]
- Bauer, F.; Matzler, K. Antecedents of M&A success: The role of strategic complementarity, cultural fit, and degree and speed of integration. Strateg Manag. J. 2014, 35, 269–291. [Google Scholar]
- Douglas, S.P.; Craig, C.S.; Nijssen, E.J. Executive insights: Integrating branding strategy across markets: Building international brand architecture. J. Int. Mark. 2001, 9, 97–114. [Google Scholar] [CrossRef]
- Stahl, G.K.; Angwin, D.; Very, P.; Gomes, E.; Weber, Y.; Tarba, S.Y.; Noorderhaven, N.G.; Benyamini, H.; Bouckenooghe, D.; Chreim, S.; et al. Sociocultural Integration in Mergers and Acquisitions: Unresolved Paradoxes and Directions for Future Research. Thunderbird Int. Bus. Rev. 2013, 55, 333–356. [Google Scholar] [CrossRef]
- Roper, D.L.V.d.C.; Guzman, D.D.F.; Rojas-Méndez, J.I. The nation brand molecule. J. Prod. Brand Manag. 2013, 22, 462–472. [Google Scholar]
- Fan, Y. Branding the nation: Towards a better understanding. Place Branding Public Dipl. 2010, 6, 97–103. [Google Scholar] [CrossRef]
- Papadopoulos, N.; Heslop, L. Country equity, and country branding: Problems and prospects. J. Brand Manag. 2002, 9, 294–314. [Google Scholar] [CrossRef]
- Olins, W. Branding the nation-the historical context. J. Brand Manag. 2002, 9, 241–248. [Google Scholar] [CrossRef]
- Alashban, A.A.; Hayes, L.A.; Zinkhan, G.M.; Balazs, A.L. International Brand-Name Standardization/Adaptation: Antecedents and Consequences. J. Int. Mark. 2002, 10, 22–48. [Google Scholar] [CrossRef]
- Cater, T. The Relevance of the Industrial Organization School of Thought on the Sources of a Firm’s Competitive Advantage; Faculty of Economics and Business the University of Zagreb: Zagreb, Croatia, 2004. [Google Scholar]
- Porter, M. The competitive advantage of nations. Harv. Bus. Rev. 1990, 90, 73–93. [Google Scholar]
- Zeugner-Roth, K.; Diamantopoulos, A.; Montesinos, M. Home Country Image, Country Brand Equity, and Consumers’ Product Preferences: An empirical Study. Manag. Int. Rev. 2008, 48, 577–602. [Google Scholar] [CrossRef]
- Pappu, R.; Quester, P. Country equity: Conceptualization and empirical evidence. Int. Bus. Rev. 2010, 19, 276–291. [Google Scholar] [CrossRef] [Green Version]
- Aaker, D.; Joachimsthaler, E. Brand leadership. Brandweek 2000, 41, 30–38. [Google Scholar]
- Aaker, D.; Joachimsthaler, E. The Brand Relationship Spectrum: The Key to the brand architectural challenges. Calif. Manag. Rev. 2000, 42, 8–23. [Google Scholar] [CrossRef]
- Muylle, S.; Dawar, N.; Rangarajan, D. B2B Brand Architecture. Calif. Manag. Rev. 2012, 54, 58–71. [Google Scholar] [CrossRef]
- Aaker, D. Measuring brand equity across products and markets. Calif. Manag. Rev. 1996, 38, 102–120. [Google Scholar] [CrossRef]
- Uggla, H.; Filipsson, D. Business and Brand Strategy: A Framework for Integration. Icfai J. Bus. Strategy 2009, 6, 27–42. [Google Scholar]
- Abraham, M.; Taylor, A. Brand Housing: Best Practice for Brand Architecture 2020. Available online: https://www.warc.cn/content/paywall/article/A93190_Brand_housing_Best_practice_for_brand_architecture/93190 (accessed on 7 June 2020).
- Melewar, T.C.; Saunders, J. Global corporate visual identity systems Standardization, control, and benefits. Int. Mark. Rev. 1998, 15, 291–308. [Google Scholar] [CrossRef]
- Laforet, S.; Saunders, J. Managing brand portfolios: Why leaders do what they do. J. Advert. Res. 1999, 39, 51–66. [Google Scholar]
- Aaker, D. Leveraging the Corporate Brand. (cover story). Calif. Manag. Rev. 2004, 46, 6–18. [Google Scholar] [CrossRef]
- Rajagopal; Sanchez, R. Conceptual analysis of brand architecture and relationships within product categories. J. Brand Manag. 2004, 11, 233–247. [Google Scholar] [CrossRef]
- Ravasi, D.; Schultz, M. Responding to organizational identity threats: Exploring the role of organizational culture. Acad. Manag. J. 2006, 49, 433–458. [Google Scholar] [CrossRef] [Green Version]
- Wheeler, A. Designing Brand Identity: A Complete Guide to Creating, Building, and Maintaining a Strong Brand, 2nd ed.; John Wiley & Sons, Inc.: Hoboken, NJ, USA, 2006. [Google Scholar]
- Jaju, A.; Joiner, C.; Reddy, S.K. Consumer evaluations of corporate brand redeployments. Acad. Mark. Sci. J. 2006, 34, 206–215. [Google Scholar] [CrossRef]
- Nestle, M. Nestlé, Completes the Acquisition of Pfizer Nutrition, Enhancing Its Position in Global Infant Nutrition 2012. Available online: https://www.nestle.com/media/pressreleases/allpressreleases/pfizer-nutrition-closing (accessed on 8 June 2020).
- Telenor. Global Presence. Available online: http://www.telenor.com/about-us/global-presence/ (accessed on 21 October 2014).
- Deng, P. Why do Chinese firms tend to acquire strategic assets in international expansion? J. World Bus. 2009, 44, 74–84. [Google Scholar] [CrossRef]
- O’Donnell, S.; Jeong, I. Marketing standardization within global industries An empirical study of performance implications. Int. Mark. Rev. 2000, 17, 19–33. [Google Scholar] [CrossRef]
- Ryans, J.K.; Griffith, J.D.; White, D.S. Standardized/adaptation of international marketing strategy: Necessary conditions for the advancement of knowledge. Int. Mark. Rev. 2003, 20, 588–603. [Google Scholar] [CrossRef]
- Theodosiou, M.; Katsikeas, C.S. Factors influencing the degree of international pricing strategy standardization of multinational corporations. J. Int. Mark. 2001, 9, 1–18. [Google Scholar] [CrossRef]
- Ang, Z.; Massingham, P. National culture and the standardization versus adaptation of knowledge management. J. Knowl. Manag. 2007, 11, 5–21. [Google Scholar] [CrossRef]
- Leonidou, L.C.; Katsikeas, C.S.; Samiee, S. Marketing strategy determinants of export performance: A meta-analysis. J. Bus. Res. 2002, 55, 51–67. [Google Scholar] [CrossRef] [Green Version]
- Bahadir, S.C.; Bharadwaj, S.G.; Srivastava, R.K. Financial value of brands in mergers and acquisitions: Is value in the eye of the beholder? J. Mark. 2008, 72, 49–64. [Google Scholar] [CrossRef]
- Vrontis, D.; Kitchen, P.J. Entry methods and international marketing decision making: An empirical investigation. Int. J. Bus. Stud. 2005, 13, 87–110. [Google Scholar]
- Theodosiou, M.; Leonidou, L.C. Standardization versus adaptation of international marketing strategy: An integrative assessment of the empirical research. Int. Bus. Rev. 2003, 12, 141–171. [Google Scholar] [CrossRef]
- Vrontis, D.; Thrassou, A. Adaptation vs. standardization in international marketing-the country-of-origin effect. Innov. Mark. 2007, 3, 7–20. [Google Scholar]
- Lee, Y.D. Brand Solutions for An M&A World. Brandweek 2005, 46, 16–17. [Google Scholar]
- Schmid, S.; Kotulla, T. 50 years of research on international standardization and adaptation—From a systematic literature analysis to a theoretical framework. Int. Bus. Rev. 2011, 20, 491–507. [Google Scholar] [CrossRef]
- Geiger, S.W.; Ritchie, W.J.; Marlin, D. Strategy/structure fit and firm performance. Organ. Dev. J. 2006, 24, 10–22. [Google Scholar]
- Kotler, P.; Gertner, D. Country as a brand, product, and beyond: A place marketing and brand management perspective. J. Brand Manag. 2002, 9, 249–261. [Google Scholar] [CrossRef]
- Hakala, U.; Lemmetyinen, A.; Kantola, S.-P. Country image as a nation-branding tool. Mark. Intell. Plan. 2013, 31, 538–556. [Google Scholar] [CrossRef]
- Sun, Q.; Paswan, A. Country branding through the Olympic Games. J. Brand Manag. 2012, 19, 641–654. [Google Scholar] [CrossRef]
- Dinnie, K.; Melewar, T.C.; Fetscherin, M. The determinants, and measurement of a country brand: The country brand strength index. Int. Mark. Rev. 2010, 27, 466–479. [Google Scholar]
- Aaker, D. Innovation: Brand it or lose it. Calif. Manag. Rev. 2007, 50, 8–24. [Google Scholar] [CrossRef]
- Corkindale, D.; Belder, M. Corporate brand reputation and the adoption of innovations. J. Prod. Brand Manag. 2009, 18, 242–250. [Google Scholar] [CrossRef]
- Santos-Vijande, M.L.; Del Río-Lanza, A.B.; Suárez-Álvarez, L.; Díaz-Martín, A.M. The brand management system and service firm competitiveness. J. Bus. Res. 2013, 66, 148–157. [Google Scholar] [CrossRef]
- Harrison, D.J.L. Determining the Existence and Extent of Oligopsonistic Market Power in the Canadian Beef-Packing Industry; University of Manitoba: Winnipeg, MB, Canada, 2005; p. 89. [Google Scholar]
- Lee, J.; Park, S.Y.; Baek, I.; Lee, C.-S. The impact of the brand management system on brand performance in B–B and B–C environments. Ind. Mark. Manag. 2008, 37, 848–855. [Google Scholar] [CrossRef]
- Uggla, H. The corporate brand association base. Eur. J. Mark. 2006, 40, 785–802. [Google Scholar] [CrossRef]
- Häubl, G. A cross-national investigation of the effects of country of origin and brand name on the evaluation of a new car. Int. Mark. Rev. 1996, 13, 76–97. [Google Scholar] [CrossRef]
- Sanyal, S.N.; Datta, S.K. The effect of country of origin on brand equity: An empirical study on generic drugs. J. Prod. Brand Manag. 2011, 20, 130–140. [Google Scholar] [CrossRef]
- Yin, W.H.; Merrilees, B. A brand orientation typology for SMEs: A case research approach. J. Prod. Brand Manag. 2005, 14, 155–162. [Google Scholar]
- Noble, C.H.; Sinha, R.K.; Kumar, A. Market orientation and alternative strategic orientations: A longitudinal assessment of performance implications. J. Mark. 2002, 66, 25–39. [Google Scholar] [CrossRef]
- Dunes, M.; Pras, B. Practices in the brand management system: Identification and considerations for five business sectors. J. Prod. Brand Manag. 2013, 22, 444–461. [Google Scholar] [CrossRef]
- Urde, M.; Baumgarth, C.; Merrilees, B. Brand orientation and market orientation—From alternatives to synergy. J. Bus. Res. 2013, 66, 13–20. [Google Scholar] [CrossRef]
- Park, S.I.; Kim, M.J. Does brand orientation matter? An empirical study of korean SMEs. Asia Mark. J. 2013, 14, 117–142. [Google Scholar]
- Ni, N.; Wan, F. A configurational perspective of branding capabilities development in emerging economies: The case of the Chinese cellular phone industry. J. Brand Manag. 2008, 15, 433–451. [Google Scholar] [CrossRef]
- Lee, M.Y.; Knight, D.; Kim, Y.K. Brand analysis of a US global brand in comparison with domestic brands in Mexico, Korea, and Japan. J. Prod. Brand Manag. 2008, 17, 163–174. [Google Scholar] [CrossRef] [Green Version]
- Alsop, R.J.; Alsop, R. The 18 Immutable Laws of Corporate Reputation: Creating, Protecting, and Repairing Your Most Valuable Asset; Free Press: New York, NY, USA, 2004. [Google Scholar]
- Townsend, J.D.; Cavusgil, S.T.; Baba, M.L. Global Integration of Brands and New Product Development at General Motors. J. Prod. Innov. Manag. 2010, 27, 49–65. [Google Scholar] [CrossRef]
- Sur, S.; Sirsly, C.-A.T. What’s in a name? Decomposing corporate reputation for assessing the relative impact of temporal, firm, and industry-level factors. J. Manag. Gov. 2012, 17, 1047–1072. [Google Scholar] [CrossRef]
- Walker, K. A Systematic Review of the Corporate Reputation Literature: Definition, Measurement, and Theory. Corp. Reput. Rev. 2010, 12, 357–387. [Google Scholar] [CrossRef]
- Zyglidopoulos, S.; Alessandri, S.W.; Alessandri, T.M. Reputation, Image, Identity, and Competitiveness; Reputation Institute: New York, NY, USA, 2006. [Google Scholar]
- Helm, S.; Salminen, R.T. Basking in reflected glory: Using customer reference relationships to build a reputation in industrial markets. Ind. Mark. Manag. 2010, 39, 737–743. [Google Scholar] [CrossRef]
- Carter, S.M.; Ruefli, T.W. Intra-Industry Reputation Dynamics Under a Resource-Based Framework: Assessing the Durability Factor. Corp. Reput. Rev. 2006, 9, 3–25. [Google Scholar] [CrossRef]
- Abratt, R.; Kleyn, N. Corporate identity, corporate branding, and corporate reputations: Reconciliation and integration. Eur. J. Mark. 2012, 46, 1048–1063. [Google Scholar] [CrossRef] [Green Version]
- Kitchen, P.J.; E Tourky, M.; Dean, D.; Shaalan, A. Corporate Identity Antecedents and Components: Toward a Theoretical Framework. Corp. Reput. Rev. 2013, 16, 263–284. [Google Scholar] [CrossRef]
- Van den Bosch, A.L.; De Jong, M.D.; Elving, W.J. How corporate visual identity supports reputation. Corp. Commun. Int. J. 2005, 10, 108–116. [Google Scholar] [CrossRef]
- Varadarajan, R.; DeFanti, M.P.; Busch, P.S. Brand Portfolio, Corporate Image, and Reputation: Managing Brand Deletions. Acad. Mark. Sci. J. 2006, 34, 195–205. [Google Scholar] [CrossRef]
- Hasanbegovic, D. Corporate Reputation, and Brand Architecture: The Debate. Southeast Eur. J. Econ. Bus. 2011, 6, 37–43. [Google Scholar] [CrossRef] [Green Version]
- Tostao, E. Consolidation, and Market Power in the United States Beef Processing Industry; Oklahoma State University: Ann Arbor, OK, USA, 2006; p. 89. [Google Scholar]
- Crosno, J.L.; Freling, T.H.; Skinner, S.J. Does brand social power mean market might? Exploring the influence of brand social power on brand evaluations. Psychol. Mark. 2009, 26, 91–121. [Google Scholar] [CrossRef]
- O’Cass, A.; Ngo, L.V. Balancing external adaptation and internal effectiveness: Achieving better brand performance. J. Bus. Res. 2007, 60, 11–20. [Google Scholar] [CrossRef]
- Na, W.B.; Marshall, R.; Keller, K.L. Measuring brand power: Validating a model for optimizing brand equity. J. Prod. Brand Manag. 1999, 8, 170–184. [Google Scholar]
- Persson, N. An exploratory investigation of the elements of B2B brand image and its relationship to price premium. Ind. Mark. Manag. 2010, 39, 1269–1277. [Google Scholar] [CrossRef]
- Campbell, M.C. Building brand equity. J. Med. Mark. 2002, 2, 208–218. [Google Scholar] [CrossRef]
- Paul, C.B.; Weiss, M.A. An Empirical Investigation of Market Structure, Efficiency, and Performance in Property-Liability Insurance. J. Risk Insur. 2005, 72, 635–673. [Google Scholar]
- Na, W.; Marshall, R. Brand power revisited: Measuring brand equity in cyber-space. J. Prod. Brand Manag. 2005, 14, 49–56. [Google Scholar] [CrossRef]
- Anisimova, T. Evaluating the impact of a corporate brand on consumer satisfaction. Asia Pac. J. Mark. Logist. 2013, 25, 561–589. [Google Scholar] [CrossRef]
- Jun, X.; Jiang, M.S.; Li, S.; Aulakh, P.S. Practice Standardization in Cross-Border Activities of Multinational Corporations: A Resource Dependence Perspective. Manag. Int. Rev. 2014, 54, 707–734. [Google Scholar] [CrossRef]
- Dunning, J.H. Internationalizing Porter’s diamond. Manag. Int. Rev. 1993, 33, 7–15. [Google Scholar]
- Geppert, M.; Dörrenbächer, C. Politics and power within multinational corporations: Mainstream studies, emerging critical approaches, and suggestions for future research. Int. J. Manag. Rev. 2014, 16, 226–244. [Google Scholar] [CrossRef]
- Hongjiu, L.; Yanrong, H.; Weimin, M. An empirical analysis of performance in acquisitions based on different motives. In Proceedings of the Management of Innovation and Technology (ICMIT) 2010 IEEE International Conference, Singapore, 2–5 June 2010. [Google Scholar]
- Dillman, D. Mail, and Internet Surveys: The Tailored Design Method; Wiley: New York, NY, USA, 2000. [Google Scholar]
- Slattery, E.L.; Voelker, C.C.J.; Nussenbaum, B.; Rich, J.T.; Paniello, R.C.; Neely, J.G. A practical guide to surveys and questionnaires. Otolaryngol. Head Neck Surg. 2011, 144, 831–837. [Google Scholar] [CrossRef]
- Bertrand, O.; Zuniga, P. R&D and M&A: Are cross-border M&A different? An investigation of OECD countries. Int. J. Ind. Organ. 2006, 24, 401–423. [Google Scholar]
- Very, P.; Schweiger, D.M. The acquisition process as a learning process: Evidence from a study of critical problems and solutions in domestic and cross-border deals. J. World Bus. 2001, 36, 11–31. [Google Scholar] [CrossRef]
- Buckley, P.J.; Elia, S.; Kafouros, M. Acquisitions by emerging market multinationals: Implications for firm performance. J. World Bus. 2014, 49, 611–632. [Google Scholar] [CrossRef]
- Capron, L. The long-term performance of horizontal acquisitions. Strateg. Manag. J. 1999, 20, 987–1018. [Google Scholar] [CrossRef]
- Homburg, C.; Bucerius, M. Is the speed of integration a success factor of mergers and acquisitions? An analysis of the role of internal and external relatedness. Strateg. Manag. J. 2006, 27, 347–367. [Google Scholar] [CrossRef]
- Homburg, C.; Bucerius, M. A marketing perspective on mergers and acquisitions: How marketing integration affects postmerger performance. J. Mark. 2005, 69, 95–113. [Google Scholar] [CrossRef]
- Glynn, M.S. Primer in B2B brand-building strategies with a reader practicum. J. Bus. Res. 2012, 65, 666–675. [Google Scholar] [CrossRef] [Green Version]
- Gubbi, S.R.; Aulakh, P.S.; Ray, S.; Sarkar, M.B.; Chittoor, R. Make international acquisitions by emerging-economy firms create shareholder value? The case of Indian firms. J. Int. Bus. Stud. 2010, 41, 397–418. [Google Scholar] [CrossRef]
- Yang, M.; Hyland, M. Similarity in Cross-border Mergers and Acquisitions: Imitation, Uncertainty, and Experience among Chinese Firms, 1985–2006. J. Int. Manag. 2012, 18, 352–365. [Google Scholar] [CrossRef]
- Nguyen, H.T.; Yung, K.; Sun, Q. Motives for Mergers and Acquisitions: Ex-Post Market Evidence from the US. J. Bus. Financ. Account. 2012, 39, 1357–1375. [Google Scholar] [CrossRef]
- Hair, J.F. A Primer on Partial Least Squares Structural Equation Modeling (PLS-SEM), 2nd ed.; Sage: Thousand Oaks, CA, USA, 2017; Volume 3. [Google Scholar]
- Fan, W.; Yan, Z. Factors affecting response rates of the web survey: A systematic review. Comput. Hum. Behav. 2010, 26, 132–139. [Google Scholar] [CrossRef]
- Podsakoff, P.M.; MacKenzie, S.B.; Lee, J.Y.; Podsakoff, N.P. Common method biases in behavioral research: A critical review of the literature and recommended remedies. J. Appl. Psychol. 2003, 88, 879–903. [Google Scholar] [CrossRef] [PubMed]
- Feldman, P.M.; Bahamonde, R.A.; Bellido, I.V. A new approach for measuring corporate reputation. Rev. Adm. Empresas 2014, 54, 53–66. [Google Scholar] [CrossRef]
- Miremadi, A.; Yousefian, M.; Babakhani, N.; Fotoohi, H. Importance of the Corporate Reputation in the B2B Context in Iran: An Empirical Study. Int. J. Mark. Stud. 2011, 3, 146–157. [Google Scholar] [CrossRef]
- Déniz, A.Q. Modelization and moderating factors of brand contribution to business performance. Res. Gate 2014, 1, 1–24. [Google Scholar]
- Chailan, C. Brand architecture and brand portfolio: A clarification. EuroMed J. Bus. 2009, 4, 173–184. [Google Scholar] [CrossRef]
- Melewar, T.C.; Saunders, J. International corporate visual identity: Standardization or localization? J. Int. Bus. Stud. 1999, 30, 583–598. [Google Scholar] [CrossRef]
- Capron, L.; Hulland, J. Redeployment of brands, sales forces, and general marketing management expertise following horizontal acquisitions: A resource-based view. J. Mark. 1999, 63, 41–54. [Google Scholar] [CrossRef]
- Drogendijk, R.; Slangen, A. Hofstede, Schwartz, or managerial perceptions? The effects of different cultural distance measures on establishment mode choices by multinational enterprises. Int. Bus. Rev. 2006, 15, 361–380. [Google Scholar] [CrossRef] [Green Version]
- Wong, K. Partial least squares structural equation modelling (PLS-SEM) Techniques using smartPLS. Mark. Bull. 2013, 24, 1–32. [Google Scholar]
- Henseler, J.; Hubona, G.; Ray, P.A. Using PLS path modeling in new technology research: Updated guidelines. Ind. Manag. Data Syst. 2016, 116, 2–20. [Google Scholar] [CrossRef]
- Capron, L.; Mitchell, W.; Swaminathan, A. Asset divestiture following horizontal acquisitions: A dynamic view. Strateg Manag. J. 2001, 22, 817–844. [Google Scholar] [CrossRef]
- Ringle, C.M.; Wende, S.; Becker, J.-M. SmartPLS 3. from SmartPLS GmbH 2015. Available online: http://www.smartpls.com (accessed on 6 July 2018).
- Brown, A.B.; Guler, L.; Marquardt, C.; Davis-Friday, P.Y. M&A decisions and US firms’ voluntary adoption of clawback provisions in executive compensation contracts. J. Bus. Financ. Account. 2015, 42, 237–271. [Google Scholar]
- Chen, S.; Thomas, J.; Zhang, F. Spring-loading future performance when no one is looking? Earnings and cash flow management around acquisitions. Rev. Account. Stud. 2016, 21, 1081–1115. [Google Scholar] [CrossRef]
- Zhao, X.; Lynch, J.G.; Chen, Q. Reconsidering baron and kenny: Myths and truths about mediation analysis. J. Consum. Res. 2010, 37, 197–206. [Google Scholar] [CrossRef]
- Albers, S. PLS and success factor studies in marketing. In Handbook of Partial Least Squares; Vinzi, V.E., Chin, W.W., Henseler, J., Wang, H., Eds.; Springer: Berlin, Germany, 2010. [Google Scholar]
- Matear, S.; Osborne, P.; Garrett, T.; Gray, B.J. How does market orientation contribute to service firm performance? An examination of alternative mechanisms. Eur. J. Mark. 2002, 36, 1058–1075. [Google Scholar] [CrossRef]
- Vinzi, V.E. Handbook of Partial Least Squares: Concepts, Methods, and Applications; Springer: Berlin, Germany, 2010. [Google Scholar]
- Fenton, N.; Neil, M. Risk Assessment and Decision Analysis with Bayesian Networks, 2nd ed.; CRC Press: Boca Raton, FL, USA, 2012. [Google Scholar]
- Sun, Q.; Paswan, A. Country branding using product quality. J. Brand Manag. 2011, 19, 143–157. [Google Scholar] [CrossRef]
- Porter, M. Competitive Strategy: Techniques for Analyzing Industries and Competitors; New Press: New York, NY, USA, 1980. [Google Scholar]
- Speece, M.; Phung, N.D. Countering negative country-of-origin with low prices: A conjoint study in Vietnam. J. Prod. Brand Manag. 2005, 14, 39–48. [Google Scholar] [CrossRef]
- Pappu, R.; Quester, P.G.; Cooksey, R.W. Country image and consumer-based brand equity: Relationships and implications for international marketing. J. Int. Bus. Stud. 2007, 38, 726–745. [Google Scholar] [CrossRef]
Figure 1.
A theoretical framework.

Figure 2.
The results of SmartPLS analysis.

Table 1.
The prioritized effects/relationships.
| BMS | CBA | CBP | RPT | ||
|---|---|---|---|---|---|
| BMS | Hypothesis/Direct effect | H4 | H5 | ||
| 0.245 ** | 0.167 * | ||||
| Indirect effect | (0.037) | -------- | |||
| Cumulative effect | 0.282 *** | 0.167 * | |||
| RPT | Hypothesis/Direct effect | (H6) | H7 | ||
| (0.159) | 0.303 *** | ||||
| Indirect effect | (0.061) | ----------- | |||
| Cumulative effect | 0.220 * | 0.303 *** | |||
| CBE | Hypothesis/Direct effect | H2 | (H1) | H3 | |
| 0.318 ** | (−0.015) | 0.416 *** | |||
| Indirect effect | -------- | 0.181 *** | (0.053) | ||
| Cumulative effect | 0.318 ** | 0.166 * | 0.469 *** | ||
| CBP | Hypothesis/Direct effect | H8 | |||
| 0.201 * | |||||
| Indirect effect | -------- | ||||
| Cumulative effect | 0.201 * |
Note 1: Direct effect, Indirect effect, Total/Cumulative effect. Note 2: Prioritized effects (Bold). Note 3: * p < 0.05; ** p < 0.01; *** p < 0.001; (Nonsignificant), (Hypothesis-rejection)—no-effect. Note 4: Hypotheses H1 (Rejected), H2 (Accepted), H3 (Accepted), H4 (Accepted), H5 (Accepted), H6 (Rejected), H7 (Accepted), and H8 (Accepted).
© 2020 by the authors. Licensee MDPI, Basel, Switzerland. This article is an open access article distributed under the terms and conditions of the Creative Commons Attribution (CC BY) license (http://creativecommons.org/licenses/by/4.0/).
Share and Cite
MDPI and ACS Style
Barua, A.; Ioanid, A. Country Brand Equity: The Decision Making of Corporate Brand Architecture in Cross-Border Mergers and Acquisitions. Sustainability 2020, 12, 7373. https://doi.org/10.3390/su12187373
AMA Style
Barua A, Ioanid A. Country Brand Equity: The Decision Making of Corporate Brand Architecture in Cross-Border Mergers and Acquisitions. Sustainability. 2020; 12(18):7373. https://doi.org/10.3390/su12187373
Chicago/Turabian StyleBarua, Arup, and Alexandra Ioanid. 2020. "Country Brand Equity: The Decision Making of Corporate Brand Architecture in Cross-Border Mergers and Acquisitions" Sustainability 12, no. 18: 7373. https://doi.org/10.3390/su12187373
Note that from the first issue of 2016, this journal uses article numbers instead of page numbers. See further details here.