Strategies to Manage the Impacts of the COVID-19 Pandemic in the Supply Chain: Implications for Improving Economic and Social Sustainability

 ,
, 

 ,
,  and
and 
Abstract
:1. Introduction
- What are the impacts on the supply chain due to the COVID-19 pandemic in the RMG sector?
- What are the strategies to manage the impacts of the COVID-19 pandemic for the supply chains of the RMG industry?
- Which strategies have more positive influences to deal with the impacts?
- Can the effects of the strategies over the different impacts be quantified?
- (a)
- To identify the possible strategies to manage the impacts of the COVID-19 pandemic in the RMG supply chain context.
- (b)
- To effectively rank the strategies using an integrated method of grey theory and digraph-matrix.
2. Literature Review and Theoretical Development
2.1. RMG Supply Chain and the COVID-19 Pandemic
2.2. Existing Multicriteria Decision-Making (MCDM) Approaches
2.3. Grey Theory and Digraph-Matrix Methods
2.4. Research Gaps and Contributions
- Identifying a comprehensive list of strategies to manage or recover from the impacts of COVID-19 outbreak on supply chains for the RMG industry from the literature review.
- Proposing a combination of grey theory and digraph-matrix methods for efficiently recognizing and prioritizing strategies to manage the impacts.
- Guiding decision-makers to make strategic and premeditated decisions to implement strategies in the context of the RMG successfully.
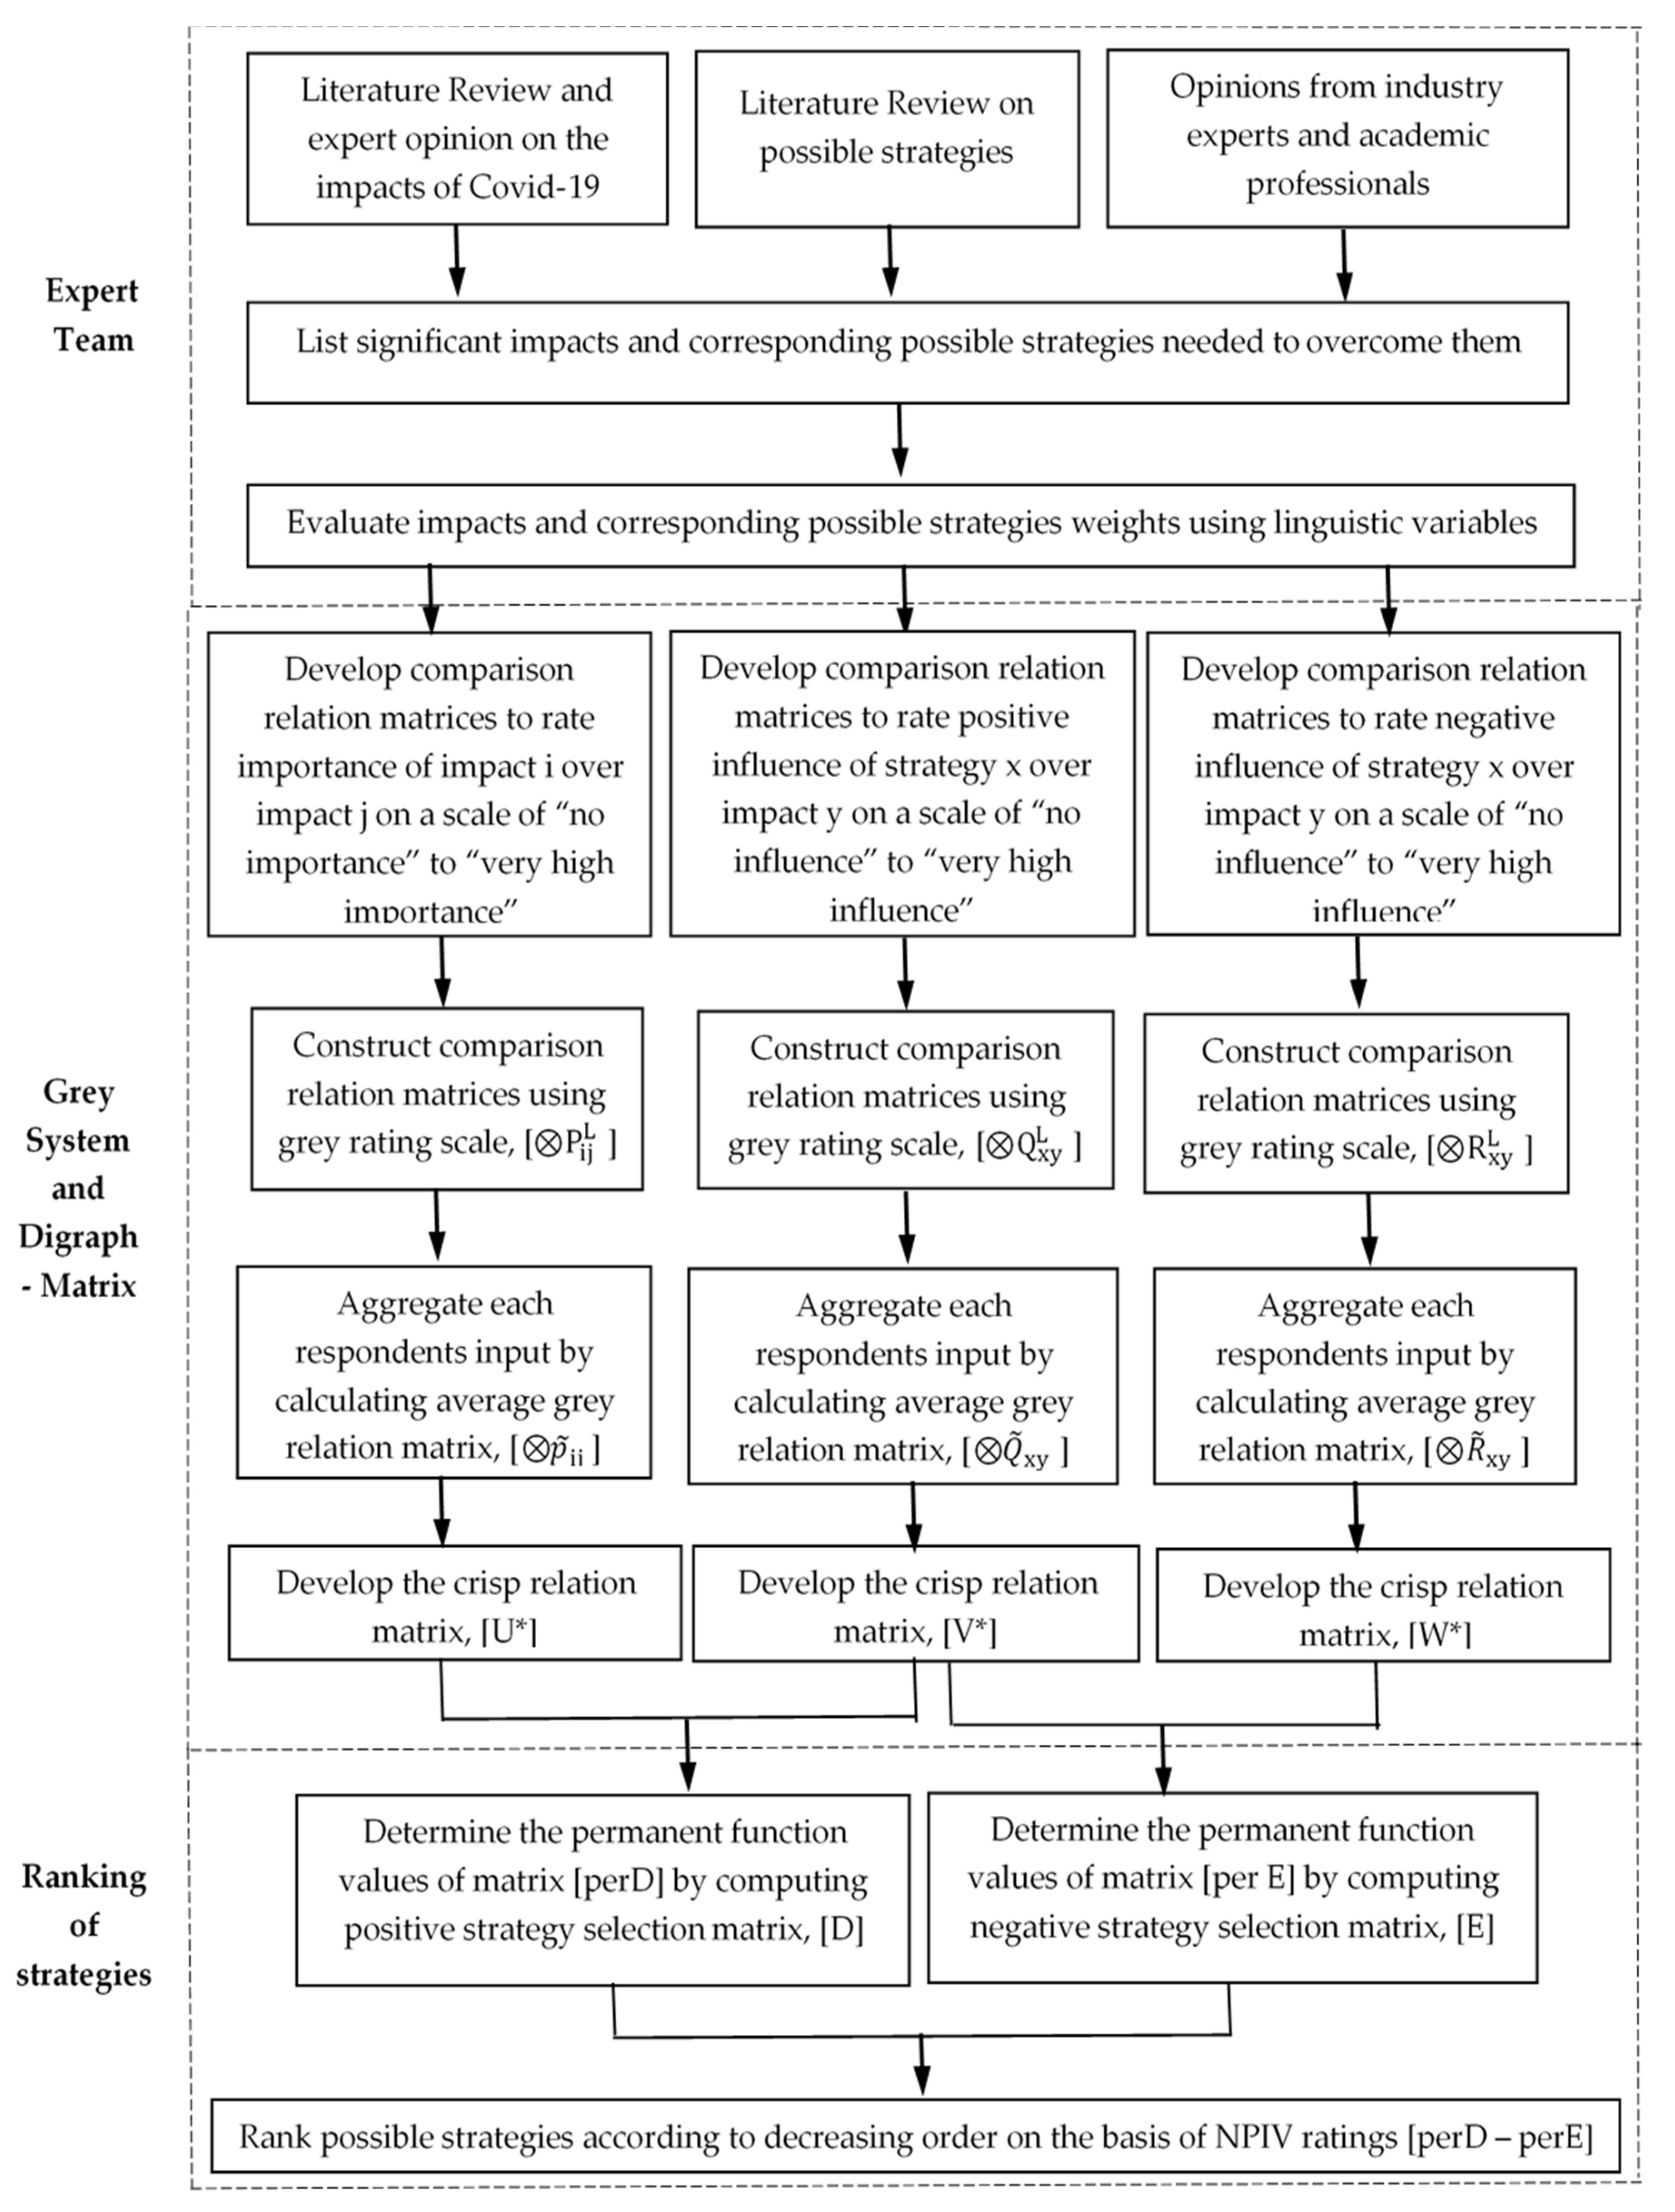
3. Research Methodology
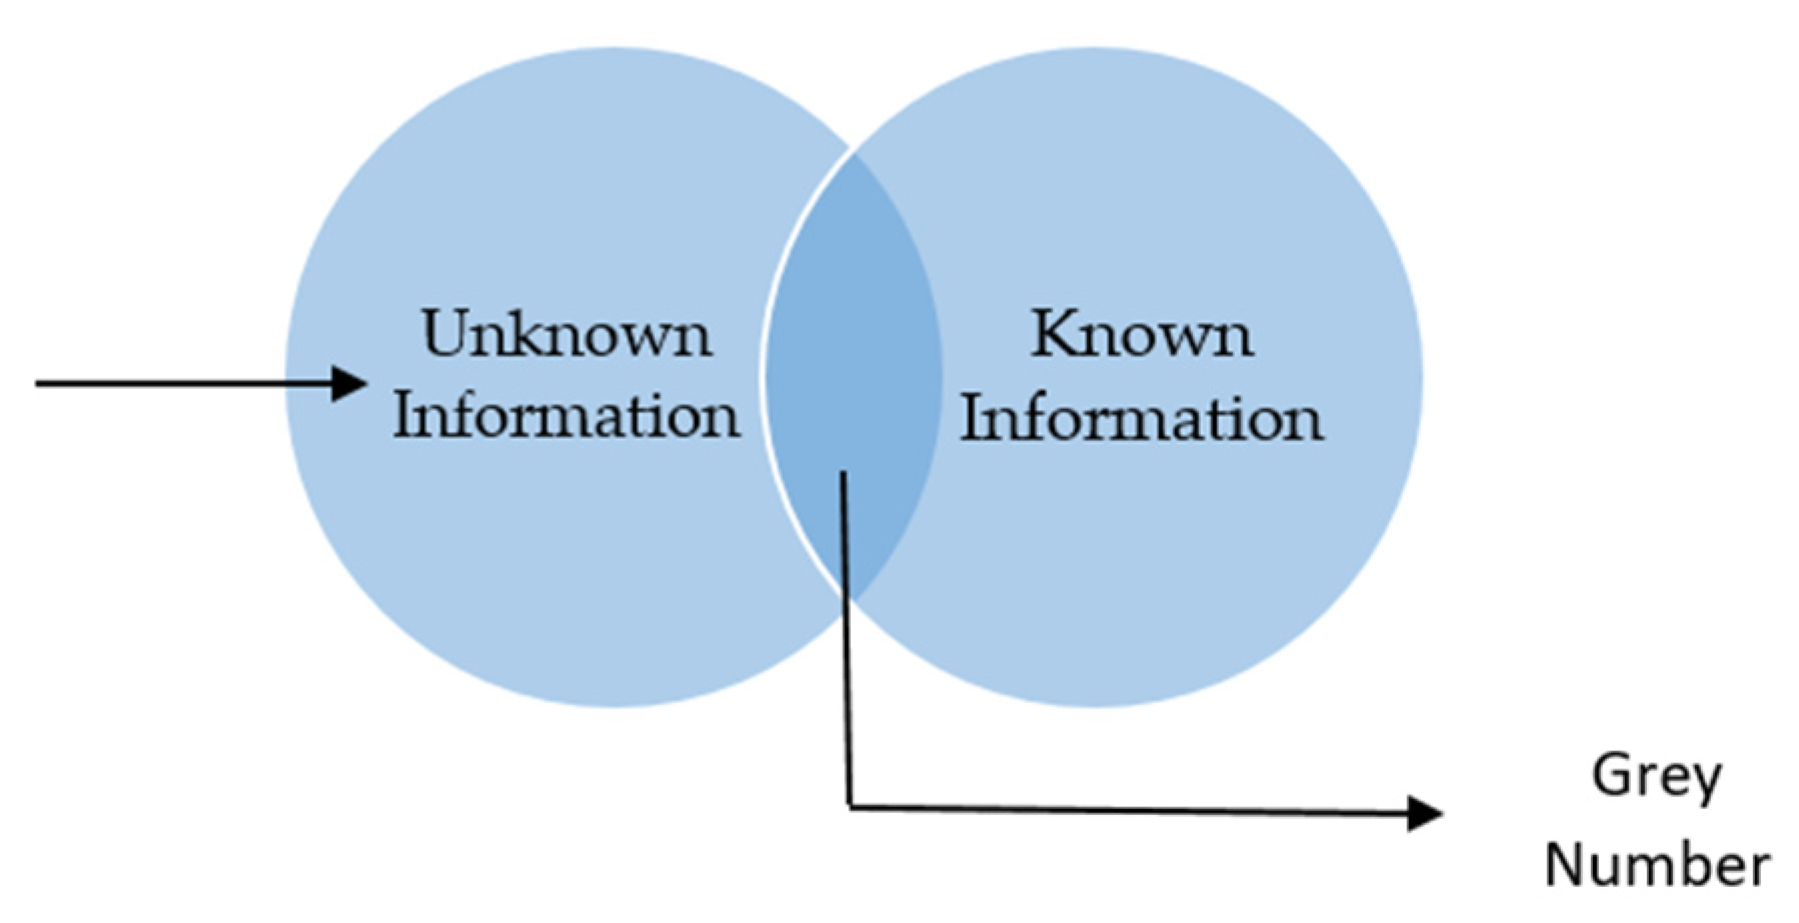
3.1. Grey System Theory
3.2. Digraph-Matrix Theory
3.3. Proposed Model
- (a)
- Normalization of the grey value
- (b)
- Computing total normalized crisp values
- (c)
- Calculating the final crisp value
4. Data Collection and Analysis
4.1. Company Profile
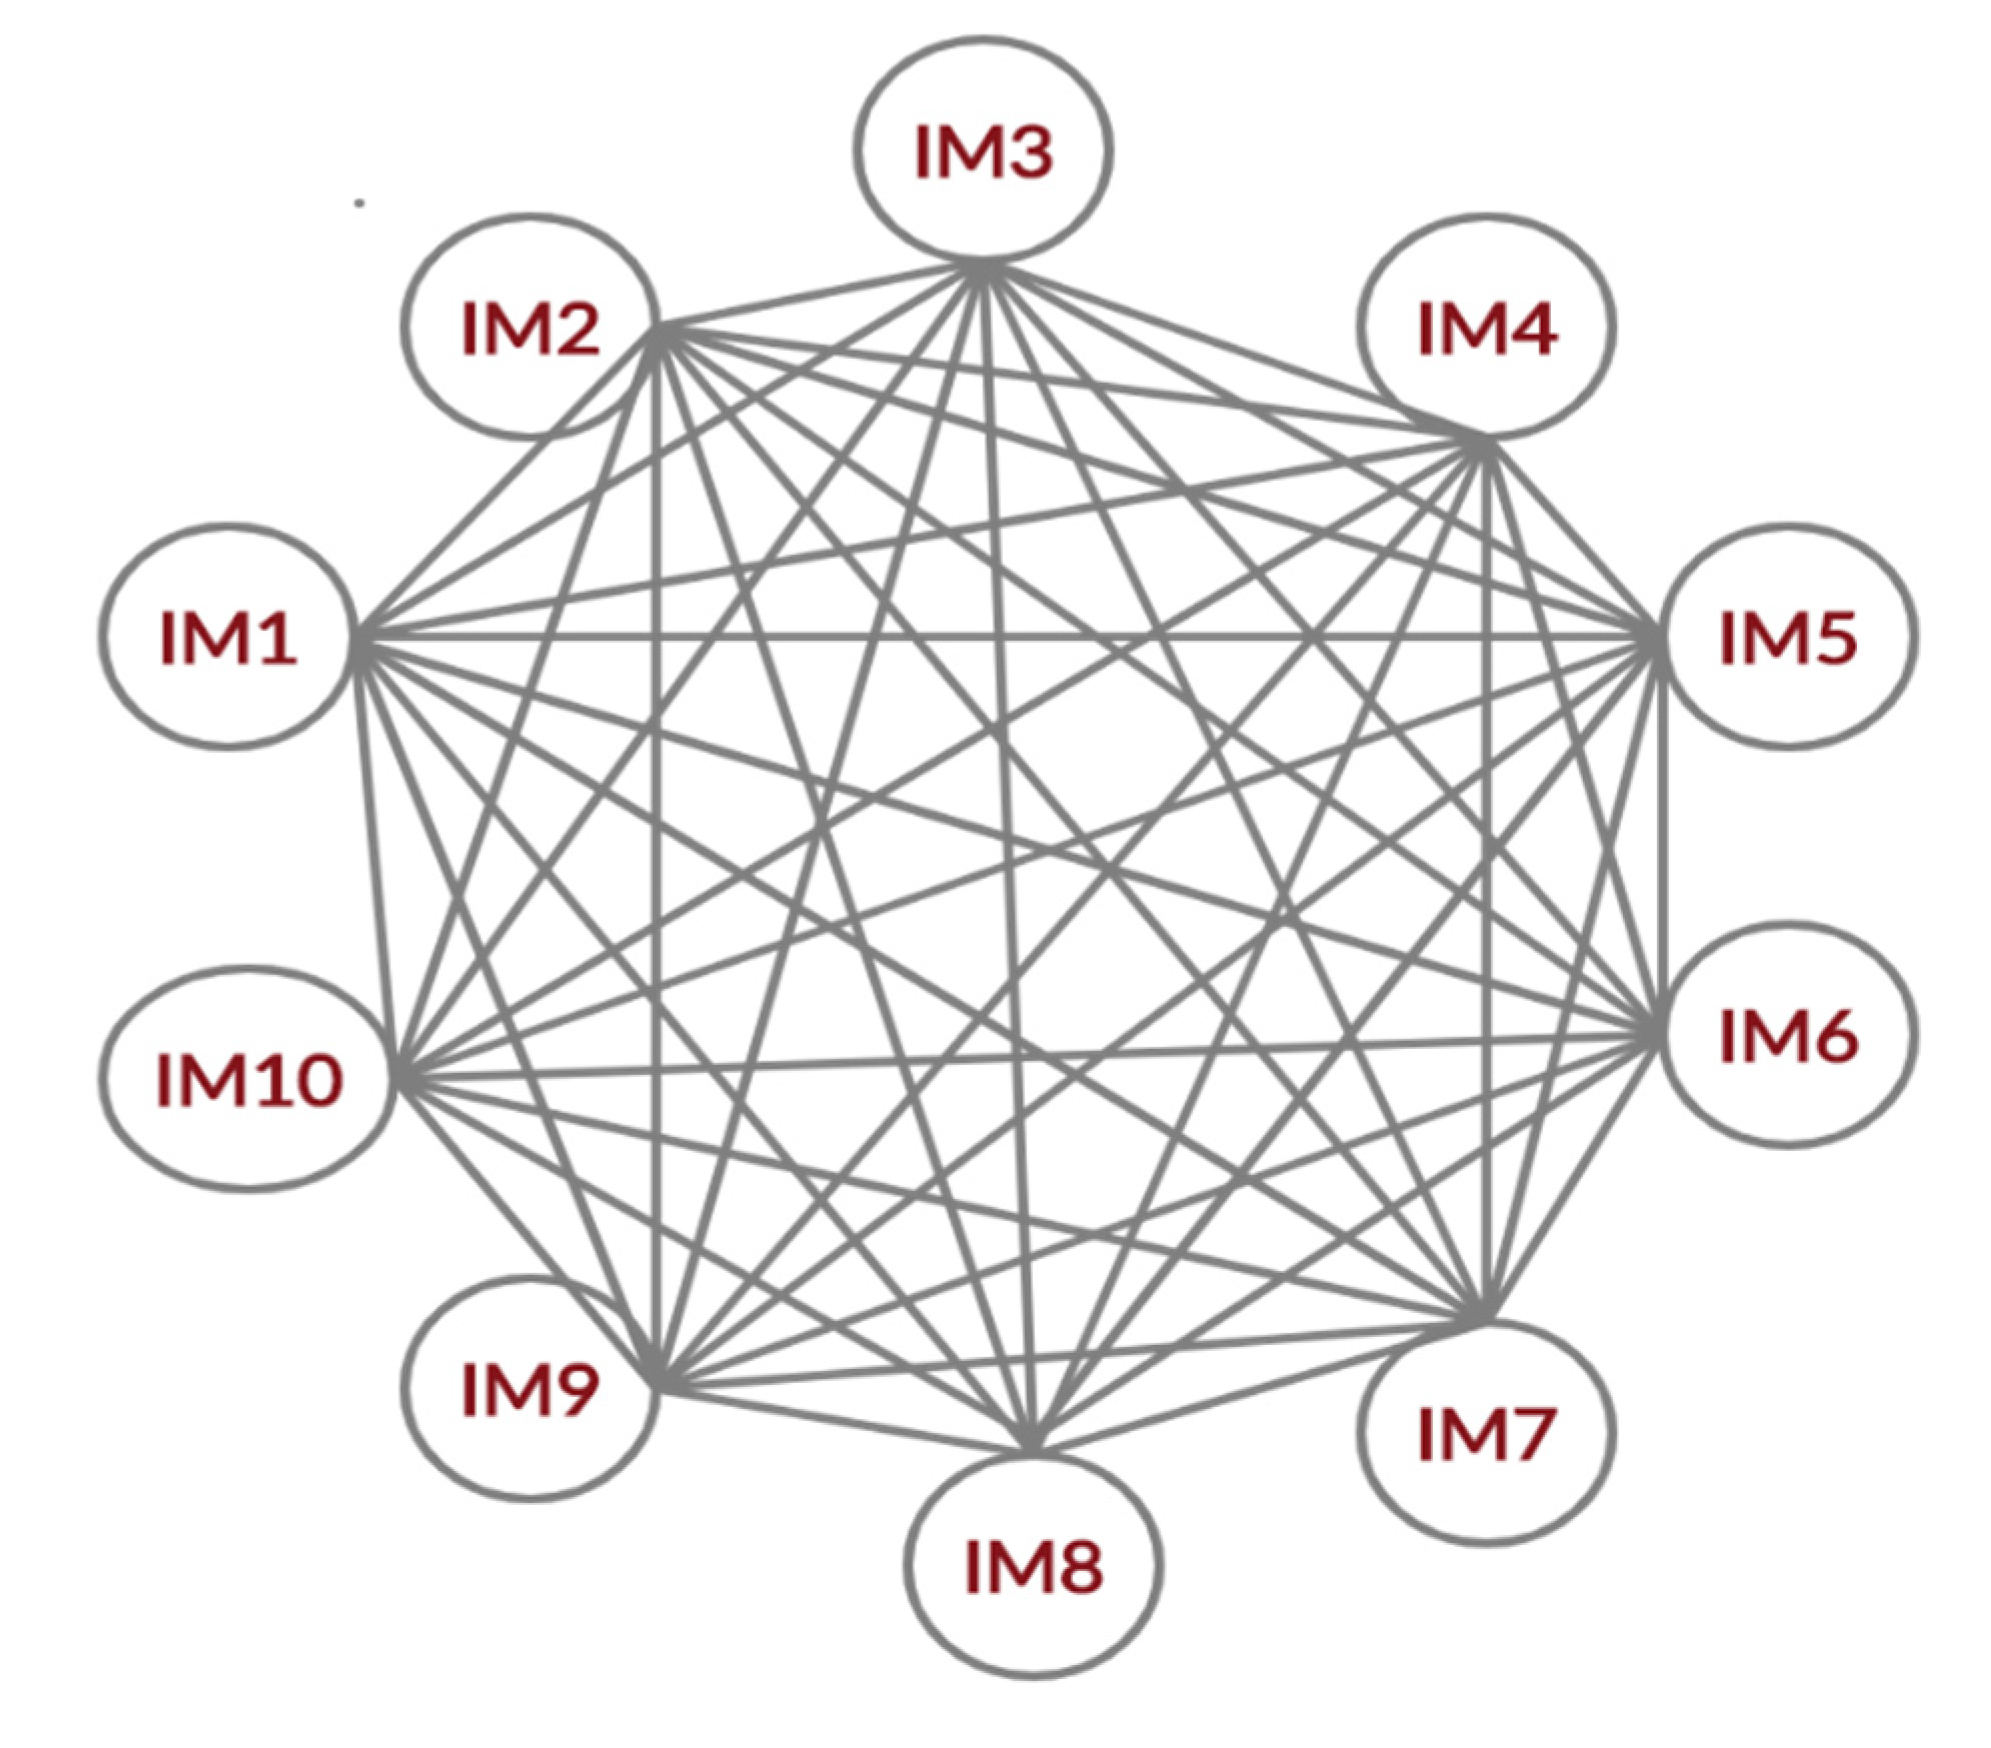
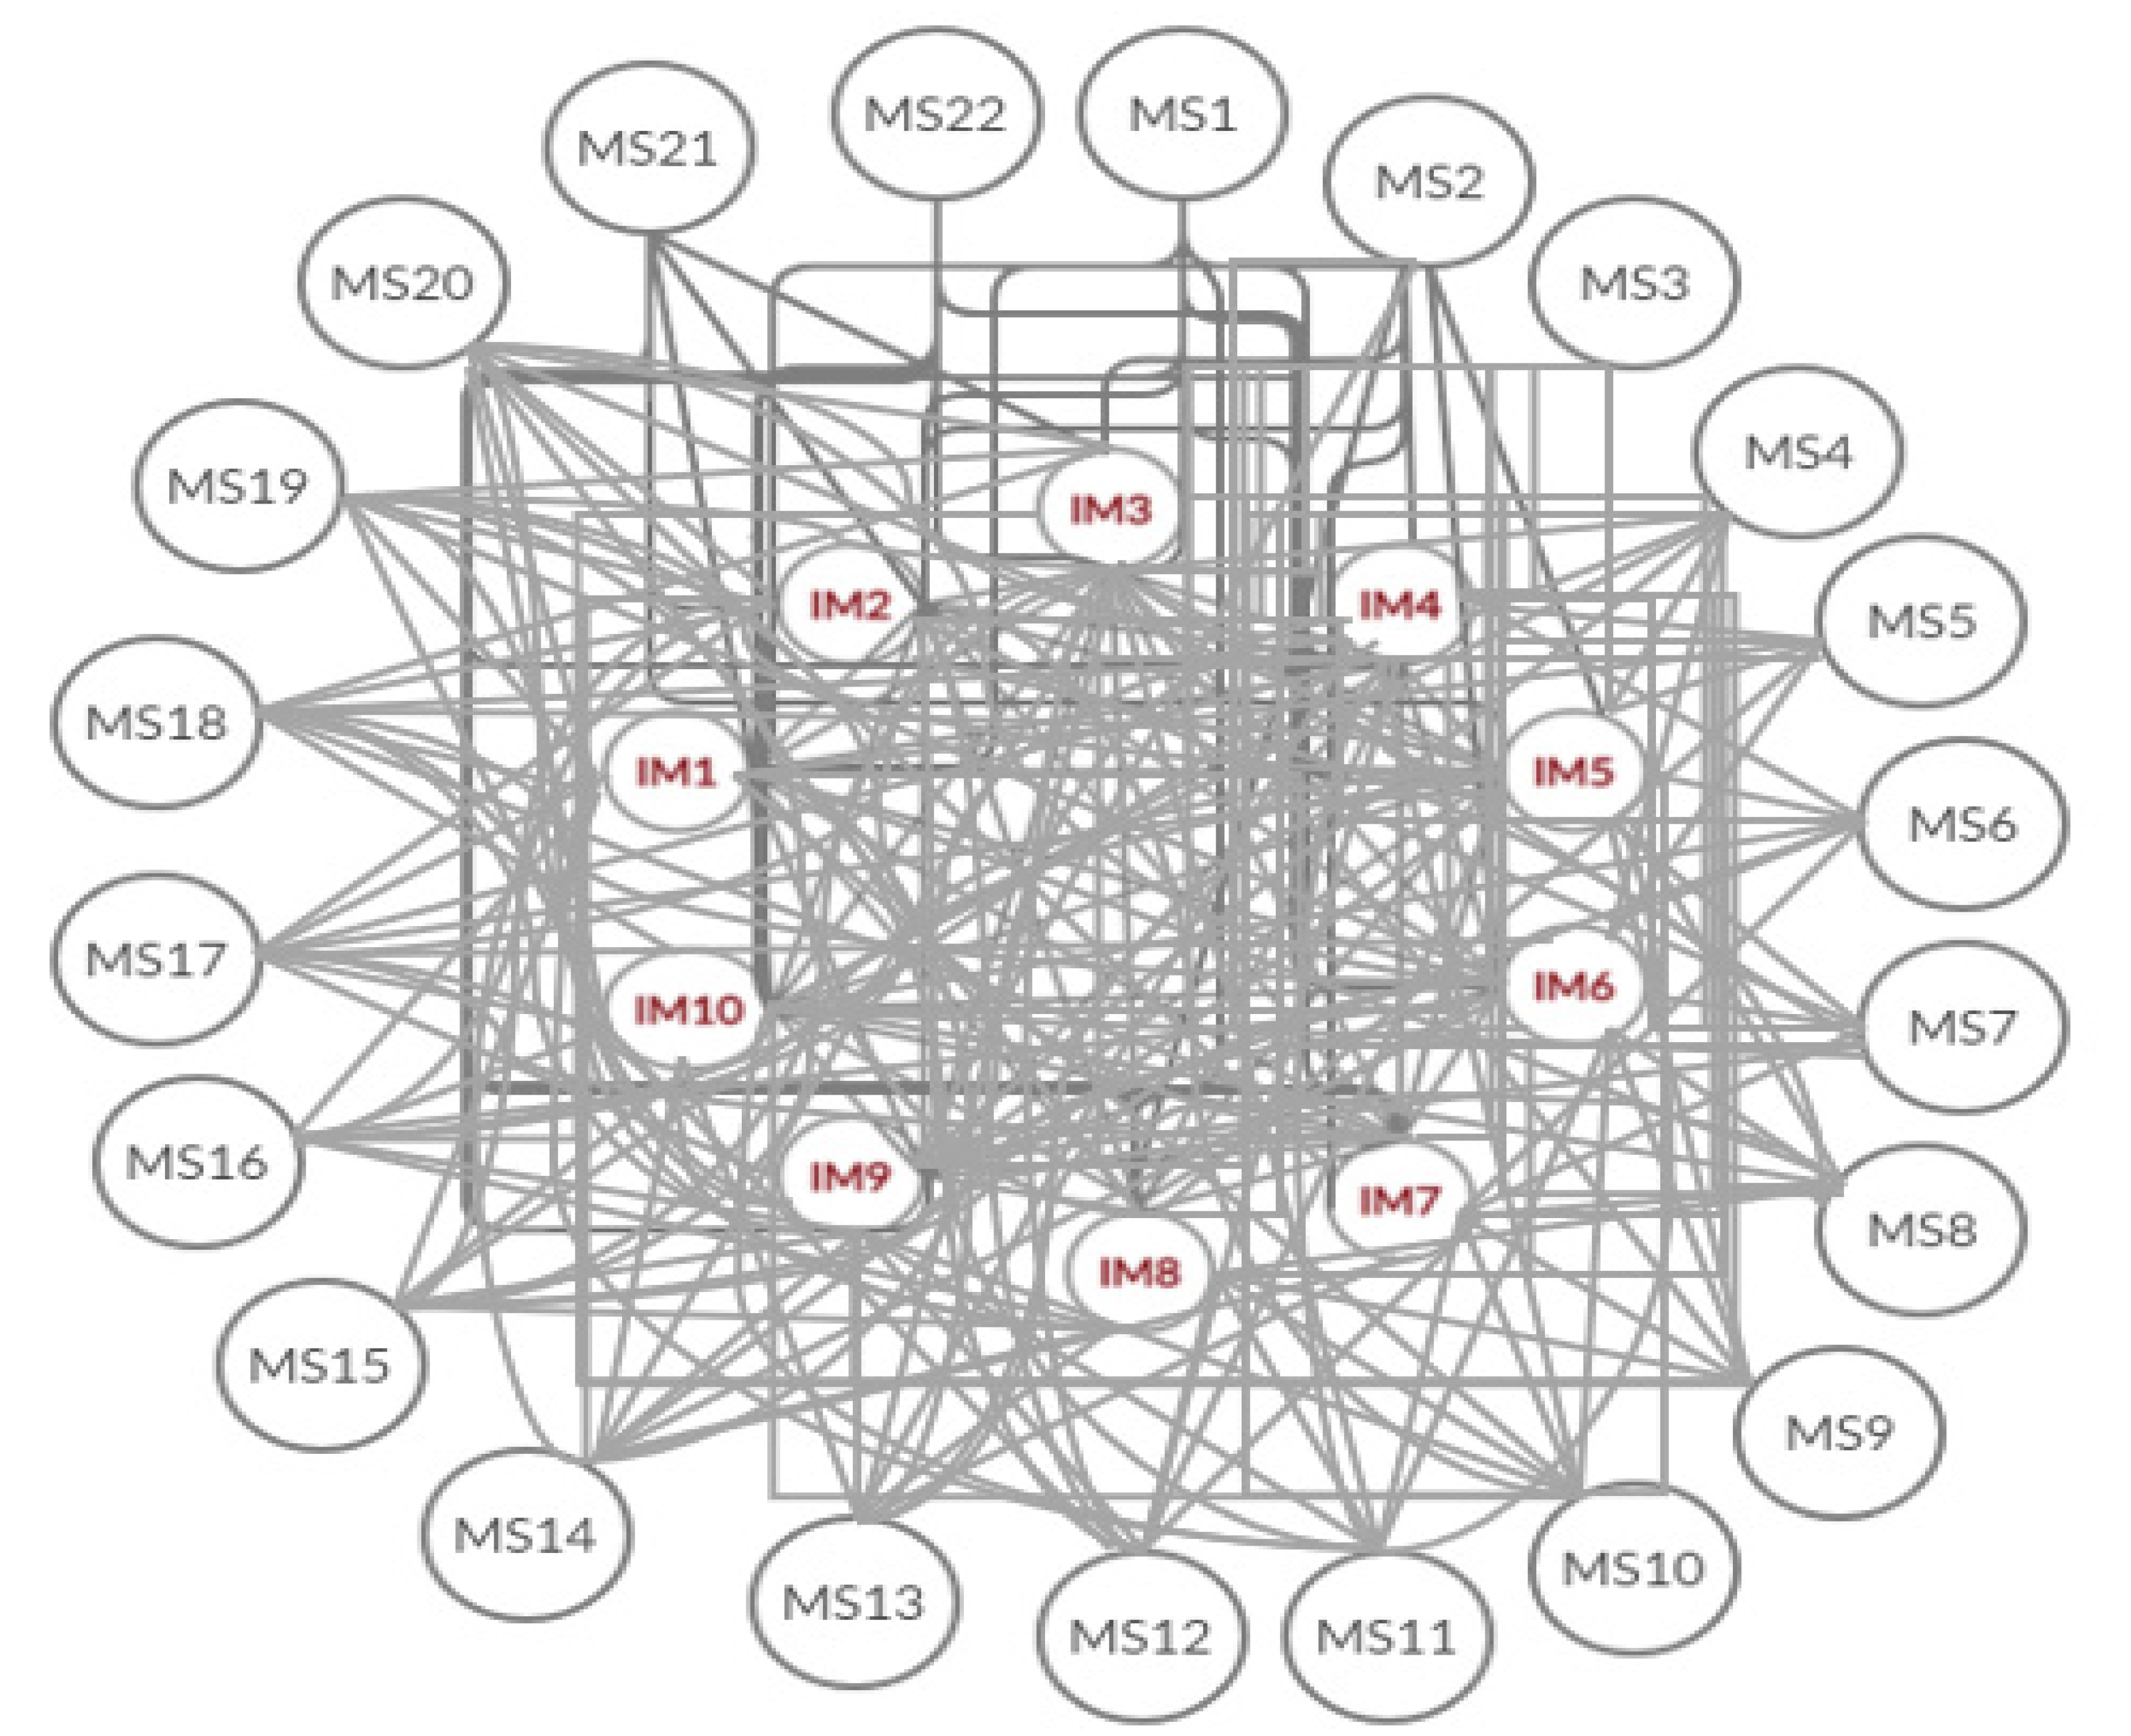
4.2. Selection of Possible Impacts and Mitigation Strategies of COVID-19 Outbreak on the RMG Industry
4.3. Data Collection and Implication of Grey-Digraph-Matrix Method
5. Results and Discussions
5.1. Discussion on the Findings
5.2. Significance of Key Findings
6. Implications of This Study
6.1. Implications to Theory
6.2. Implications for Practice
7. Conclusions, Limitations and Future Research Directions
Supplementary Materials
Author Contributions
Funding
Acknowledgments
Conflicts of Interest
List of Notations Along with Abbreviations
| SC | Supply Chain |
| GST | Grey System Theory |
| IM1-IM10 | Listed Impact |
| MS1-MS22 | Listed Possible Managing Strategies |
| CFCS | Converting the Fuzzy data into Crisp Scores |
| NPIV | Net Positive Influence Value |
| , , | Impacts |
| Strategies | |
| Each respondent | |
| Total number of respondents | |
| Total number of impacts | |
| Total number of strategies | |
| Matrix | |
| ⊗, ⊗, ⊗ | Grey Numbers for a respondent L |
| , , | Lower values of grey numbers for a respondent L |
| , , | Upper values of grey numbers for a respondent L |
| [⊗ ], [⊗ ], [⊗ ] | Average grey relation matrices |
| , | Normalized lower limit value |
| Normalized upper limit value | |
| , , | Normalized crisp value |
| , , | Final crisp value |
| , , | Difference between maximum normalized upper grey values and minimum normalized lower grey values |
| U*, V*, W* | Crisp relation matrices |
| D | Strategy selection matrix for the positive influence of strategies over impacts |
| E | Strategy selection matrix for the negative influence of strategies over impacts |
| I | Permanent function matrix |
Appendix A

| Expert Name | Designation | Experience (Years) |
|---|---|---|
| Expert 1 | General Manager, Human Resource, Hameem Group | 25 |
| Expert 2 | Manager, SC Department, Beximco Textile Mills Ltd. | 22 |
| Expert 3 | Managing Director, Dulal Brothers Limited | 30 |
| Expert 4 | Senior Manager, SC Department, Epyllion Group | 24 |
| Expert 5 | Deputy general manager, Ananta Group | 35 |
References
- Ivanov, D.; Dolgui, A. A Digital Supply Chain Twin for Managing the Disruption Risks and Resilience in the Era of Industry 4.0. Prod. Plan. Control 2020, 1–14. [Google Scholar] [CrossRef]
- Wang, P.; Zheng, X.; Li, J.; Zhu, B. Prediction of Epidemic Trends in COVID-19 with Logistic Model and Machine Learning Technics. Chaos Solitons Fractals 2020, 139, 110058. [Google Scholar] [CrossRef]
- WHO. WHO Coronavirus Disease (COVID-19) Dashboard | WHO Coronavirus Disease (COVID-19) Dashboard. Available online: https://covid19.who.int/?gclid=Cj0KCQjwtsv7BRCmARIsANu-CQflCfofaf9y8JIGS31c5vZCgBtKRNCJswQWiVPYypnbio5h8dvEWI4aAr5IEALw_wcB (accessed on 29 September 2020).
- Iyengar, K.; Mabrouk, A.; Jain, V.K.; Venkatesan, A.; Vaishya, R. Learning Opportunities from COVID-19 and Future Effects on Health Care System. Diabetes Metab. Syndr. Clin. Res. Rev. 2020, 14, 943–946. [Google Scholar] [CrossRef]
- Rothan, H.A.; Byrareddy, S.N. The Epidemiology and Pathogenesis of Coronavirus Disease (COVID-19) Outbreak. J. Autoimmun. 2020, 109, 102433. [Google Scholar] [CrossRef]
- Amankwah-Amoah, J.; Khan, Z.; Wood, G. COVID-19 and Business Failures: The Paradoxes of Experience, Scale, and Scope for Theory and Practice. Eur. Manag. J. 2020. [Google Scholar] [CrossRef]
- Fortune. Coronavirus Impact: 94% of the Fortune 1000 Are Seeing Supply Chain Disruptions. Fortune. Available online: https://fortune.com/2020/02/21/fortune-1000-coronavirus-china-supply-chain-impact/ (accessed on 22 August 2020).
- Ivanov, D. Predicting the Impacts of Epidemic Outbreaks on Global Supply Chains: A Simulation-Based Analysis on the Coronavirus Outbreak (COVID-19/SARS-CoV-2) Case. Transp. Res. Part E Logist. Transp. Rev. 2020, 136, 101922. [Google Scholar] [CrossRef]
- Li, W.-Y.; Chow, P.-S.; Choi, T.-M.; Chan, H.-L. Supplier Integration, Green Sustainability Programs, and Financial Performance of Fashion Enterprises under Global Financial Crisis. J. Clean. Prod. 2016, 135, 57–70. [Google Scholar] [CrossRef]
- Mustafid, N.; Karimariza, S.A.; Jie, F. Supply Chain Agility Information Systems with Key Factors for Fashion Industry Competitiveness. Int. J. Agil. Syst. Manag. 2018, 11, 1–22. [Google Scholar] [CrossRef]
- da Silva, P.C.; de Oliveira Neto, G.C.; Correia, J.M.F.; Tucci, H.N.P. Evaluation of Economic, Environmental and Operational Performance of the Adoption of Cleaner Production: Survey in Large Textile Industries. J. Clean. Prod. 2021, 278, 123855. [Google Scholar] [CrossRef]
- Patel, R.; Babady, E.; Theel, E.S.; Storch, G.A.; Pinsky, B.A.; George, K.S.; Smith, T.C.; Bertuzzi, S. Report from the American Society for Microbiology Covid-19 International Summit, 23 March 2020: Value of Diagnostic Testing for Sars–Cov-2/Covid-19. mBio. 2020, 11. [Google Scholar] [CrossRef] [PubMed] [Green Version]
- Donthu, N.; Gustafsson, A. Effects of COVID-19 on Business and Research. J. Bus. Res. 2020, 117, 284–289. [Google Scholar] [CrossRef] [PubMed]
- Majumdar, A.; Shaw, M.; Sinha, S.K. COVID-19 Debunks the Myth of Socially Sustainable Supply Chain: A Case of the Clothing Industry in South Asian Countries. Sustain. Prod. Consum. 2020, 24, 150–155. [Google Scholar] [CrossRef]
- Paul, S.; Venkateswaran, J. Impact of Drug Supply Chain on the Dynamics of Infectious Diseases. Syst. Dyn. Rev. 2017, 33, 280–310. [Google Scholar] [CrossRef]
- Rizou, M.; Galanakis, I.M.; Aldawoud, T.M.S.; Galanakis, C.M. Safety of Foods, Food Supply Chain and Environment within the COVID-19 Pandemic. Trends Food Sci. Technol. 2020, 102, 293–299. [Google Scholar] [CrossRef]
- Fan, V.Y.; Jamison, D.T.; Summers, L.H. Pandemic Risk: How Large Are the Expected Losses? Bull. World Health Organ. 2018, 96, 129–134. [Google Scholar] [CrossRef]
- Barua, S. Understanding Coronanomics: The Economic Implications of the Coronavirus (COVID-19) Pandemic. SSRN Electron. J. 2020. [Google Scholar] [CrossRef]
- Hobbs, J.E. Food Supply Chains during the COVID-19 Pandemic. Can. J. Agric. Econ. Can. D’agroeconomie 2020, 68, 171–176. [Google Scholar] [CrossRef] [Green Version]
- Joshi, P.; Kulkarni, U.; Munje, S.; Kulkarni, S. Impact of Covid-19 Pandemic on Indian Fruits and Vegetables Export, Postharvest Management Supply Chain and Future Strategies. AgricINTERNATIONAL 2019, 6, 4. [Google Scholar] [CrossRef]
- He, P.; Niu, H.; Sun, Z.; Li, T. Accounting Index of COVID-19 Impact on Chinese Industries: A Case Study Using Big Data Portrait Analysis. Emerg. Mark. Financ. Trade 2020, 56, 2332–2349. [Google Scholar] [CrossRef]
- Guan, D.; Wang, D.; Hallegatte, S.; Davis, S.J.; Huo, J.; Li, S.; Bai, Y.; Lei, T.; Xue, Q.; Coffman, D.M.; et al. Global Supply-Chain Effects of COVID-19 Control Measures. Nat. Hum. Behav. 2020, 4, 577–587. [Google Scholar] [CrossRef]
- Nicola, M.; Alsafi, Z.; Sohrabi, C.; Kerwan, A.; Al-Jabir, A.; Iosifidis, C.; Agha, M.; Agha, R. The Socio-Economic Implications of the Coronavirus Pandemic (COVID-19): A Review. Int. J. Surg. 2020, 78, 185–193. [Google Scholar] [CrossRef] [PubMed]
- Elleby, C.; Domínguez, I.P.; Adenauer, M.; Genovese, G. Impacts of the COVID-19 Pandemic on the Global Agricultural Markets. Environ. Resour. Econ. 2020, 76, 1067–1079. [Google Scholar] [CrossRef] [PubMed]
- Benítez, C.Y.; Güemes, A.; Aranda, J.; Ribeiro, M.; Ottolino, P.; Di Saverio, S.; Alexandrino, H.; Ponchietti, L.; Blas, J.L.; Ramos, J.P.; et al. Impact of Personal Protective Equipment on Surgical Performance during the COVID-19 Pandemic. World J. Surg. 2020, 44, 2842–2847. [Google Scholar] [CrossRef]
- Yu, K.D.S.; Aviso, K.B. Modelling the Economic Impact and Ripple Effects of Disease Outbreaks. Process Integr. Optim. Sustain. 2020, 4, 183–186. [Google Scholar] [CrossRef] [Green Version]
- Baldwin, R.; di Mauro, B.W. Economics in the Time of COVID-19; Centre for Economic Policy Research: London, UK, 2020; Volume 26, A VoxEU. org Book. [Google Scholar]
- Marsh, K. TACCP and VACCP Demystified! International Food Safety & Quality Network: Lancashire, UK, 2015. [Google Scholar]
- Jawed, I.; Tareen, F.R.; Cauhan, K.; Nayeem, M. Food Safety and COVID-19: Limitations of HACCP and the Way Forward. Pharma Innov. 2020, 9, 1–4. [Google Scholar] [CrossRef]
- Iivari, N.; Sharma, S.; Ventä-Olkkonen, L. Digital Transformation of Everyday Life—How COVID-19 Pandemic Transformed the Basic Education of the Young Generation and Why Information Management Research Should Care? Int. J. Inf. Manag. 2020, 55, 102183. [Google Scholar] [CrossRef]
- Ivanov, D.; Dolgui, A. Low-Certainty-Need (LCN) Supply Chains: A New Perspective in Managing Disruption Risks and Resilience. Int. J. Prod. Res. 2019, 57, 5119–5136. [Google Scholar] [CrossRef] [Green Version]
- Son, J.; Kang, J.H.; Jang, S. The Effects of Out-of-Stock, Return, and Cancellation Amounts on the Order Amounts of an Online Retailer. J. Retail. Consum. Serv. 2019, 51, 421–427. [Google Scholar] [CrossRef]
- Zhang, Y.; Diao, X.; Chen, K.Z.; Robinson, S.; Fan, S. Impact of COVID-19 on China’s Macroeconomy and Agri-Food System—An Economy-Wide Multiplier Model Analysis. China Agric. Econ. Rev. 2020, 12, 387–407. [Google Scholar] [CrossRef]
- Sánchez-Ramírez, C.; Ramos-Hernández, R.; Fong, J.R.M.; Alor-Hernández, G.; García-Alcaraz, J.L. A System Dynamics Model to Evaluate the Impact of Production Process Disruption on Order Shipping. Appl. Sci. 2019, 10, 208. [Google Scholar] [CrossRef] [Green Version]
- Altig, D.; Baker, S.; Barrero, J.M.; Bloom, N.; Bunn, P.; Chen, S.; Davis, S.J.; Leather, J.; Meyer, B.; Mihaylov, E.; et al. Economic Uncertainty before and during the COVID-19 Pandemic. J. Public Econ. 2020, 191, 104274. [Google Scholar] [CrossRef]
- Gereffi, G. What Does the COVID-19 Pandemic Teach Us about Global Value Chains? The Case of Medical Supplies. J. Int. Bus. Policy 2020, 3, 287–301. [Google Scholar] [CrossRef]
- Pradhan, S.; Ghose, D. Present and Future Impact of COVID-19 in the Renewable Energy Sector: A Case Study on India. Energy Sources Part A Recover. Util. Environ. Eff. 2020, 1–11. [Google Scholar] [CrossRef]
- Publicis Sapient. COVID-19: Preparing Your Supply Chain in Times of Crisis | Publicis Sapient. Available online: https://www.publicissapient.com/insights/coronavirus_and_managing_the_supply_chain_amid_a_crisis (accessed on 19 July 2020).
- Tang, C.S.; Zimmerman, J. Information and Communication Technology for Managing Supply Chain Risks. Commun. ACM 2013, 56, 27–29. [Google Scholar] [CrossRef]
- Vidya, C.T.; Prabheesh, K.P. Implications of COVID-19 Pandemic on the Global Trade Networks. Emerg. Mark. Financ. Trade 2020, 56, 2408–2421. [Google Scholar] [CrossRef]
- Ansari, Z.N.; Kant, R.; Shankar, R. Evaluation and Ranking of Solutions to Mitigate Sustainable Remanufacturing Supply Chain Risks: A Hybrid Fuzzy SWARA-Fuzzy COPRAS Framework Approach. Int. J. Sustain. Eng. 2020, 1–22. [Google Scholar] [CrossRef]
- Khan, S.; Haleem, A.; Khan, M.I. Assessment of Risk in the Management of Halal Supply Chain Using Fuzzy BWM Method. Supply Chain Forum Int. J. 2020, 1–17. [Google Scholar] [CrossRef]
- Ali, S.M.; Moktadir, M.A.; Kabir, G.; Chakma, J.; Rumi, M.J.U.; Islam, M.T. Framework for Evaluating Risks in Food Supply Chain: Implications in Food Wastage Reduction. J. Clean. Prod. 2019, 228, 786–800. [Google Scholar] [CrossRef]
- Surya, P.; Gunjan, S.; Singh, R.A.P.; Shubhender, S. Risk Analysis and Mitigation for Perishable Food Supply Chain: A Case of Dairy Industry. Benchmarking Int. J. 2017, 24, 2–23. [Google Scholar] [CrossRef]
- Shahbaz, K.; Imran, K.M.; Abid, H.; Rahman, J.A. Prioritising the Risks in Halal Food Supply Chain: An MCDM Approach. J. Islamic Mark. 2019. [Google Scholar] [CrossRef]
- Mzougui, I.; Carpitella, S.; Certa, A.; El Felsoufi, Z.; Izquierdo, J. Assessing Supply Chain Risks in the Automotive Industry through a Modified MCDM-Based FMECA. Processes 2020, 8, 579. [Google Scholar] [CrossRef]
- Pourjavad, E.; Shahin, A. A Hybrid Model for Analyzing the Risks of Green Supply Chain in a Fuzzy Environment. J. Ind. Prod. Eng. 2020, 37, 422–433. [Google Scholar] [CrossRef]
- Moktadir, M.A.; Dwivedi, A.; Khan, N.S.; Paul, S.K.; Khan, S.A.; Ahmed, S.; Sultana, R. Analysis of Risk Factors in Sustainable Supply Chain Management in an Emerging Economy of Leather Industry. J. Clean. Prod. 2020, 124641. [Google Scholar] [CrossRef]
- Mahesh, C.; Tilak, R.; Ravi, S.; Aashish, A. Select the Best Supply Chain by Risk Analysis for Indian Industries Environment Using MCDM Approaches. Benchmarking Int. J. 2017, 24, 1400–1413. [Google Scholar] [CrossRef]
- Golinska, P.; Kosacka, M.; Mierzwiak, R.; Werner-Lewandowska, K. Grey Decision Making as a Tool for the Classification of the Sustainability Level of Remanufacturing Companies. J. Clean. Prod. 2015, 105, 28–40. [Google Scholar] [CrossRef]
- Rajesh, R.; Ravi, V. Supplier Selection in Resilient Supply Chains: A Grey Relational Analysis Approach. J. Clean. Prod. 2015, 86, 343–359. [Google Scholar] [CrossRef]
- Chen, L.; Zhou, Y.; Zhou, D.; Xue, L. Clustering Enterprises into Eco-Industrial Parks: Can Interfirm Alliances Help Small and Medium-Sized Enterprises? J. Clean. Prod. 2017, 168, 1070–1079. [Google Scholar] [CrossRef]
- Mathivathanan, D.; Govindan, K.; Haq, A.N. Exploring the Impact of Dynamic Capabilities on Sustainable Supply Chain Firm’s Performance Using Grey-Analytical Hierarchy Process. J. Clean. Prod. 2017, 147, 637–653. [Google Scholar] [CrossRef]
- Xue, J.; Van Gelder, P.H.A.J.M.; Reniers, G.; Papadimitriou, E.; Wu, C. Multi-Attribute Decision-Making Method for Prioritizing Maritime Traffic Safety Influencing Factors of Autonomous Ships’ Maneuvering Decisions Using Grey and Fuzzy Theories. Saf. Sci. 2019, 120, 323–340. [Google Scholar] [CrossRef]
- Wang, H.; Zhang, Y.-M.; Yang, Z. A Risk Evaluation Method to Prioritize Failure Modes Based on Failure Data and a Combination of Fuzzy Sets Theory and Grey Theory. Eng. Appl. Artif. Intell. 2019, 82, 216–225. [Google Scholar] [CrossRef]
- Liu, H.-C.; Chen, Y.-Z.; You, J.-X.; Li, H. Risk Evaluation in Failure Mode and Effects Analysis Using Fuzzy Digraph and Matrix Approach. J. Intell. Manuf. 2016, 27, 805–816. [Google Scholar] [CrossRef]
- Geetha, N.K.; Sekar, P. Graph Theory Matrix Approach—A Qualitative Decision Making Tool. Mater. Today Proc. 2017, 4, 7741–7749. [Google Scholar] [CrossRef]
- Rajesh, R.; Ravi, V.; Rao, R.V. Selection of Risk Mitigation Strategy in Electronic Supply Chains Using Grey Theory and Digraph-Matrix Approaches. Int. J. Prod. Res. 2014, 53, 238–257. [Google Scholar] [CrossRef]
- Yue, X.; Xu, W.; Zhang, Y.; Du, L. Analysis of Global Properties for Dynamical Systems by a Modified Digraph Cell Mapping Method. Chaos Solitons Fractals 2018, 111, 206–212. [Google Scholar] [CrossRef]
- Srivastava, P.; Khanduja, D.; Ganesan, S.; Agarwal, M.; Tulsiyan, M.; Tandon, M.; Gupta, S. Risk Analysis of CNG Dispensing Unit by Fuzzy Digraph Matrix and Dempster-Shafer Approach. Int. J. Product. Qual. Manag. 2019, 28, 227–255. [Google Scholar] [CrossRef]
- Dias, G.C.; Hernandez, C.T.; de Oliveira, U.R. Supply Chain Risk Management and Risk Ranking in the Automotive Industry. Gest. Prod. 2020, 27, 2020. [Google Scholar] [CrossRef]
- Rajesh, R.; Ravi, V. Modeling Enablers of Supply Chain Risk Mitigation in Electronic Supply Chains: A Grey–DEMATEL Approach. Comput. Ind. Eng. 2015, 87, 126–139. [Google Scholar] [CrossRef]
- Chowdhury, M.T.; Sarkar, A.; Paul, S.K.; Moktadir, A. A Case Study on Strategies to Deal with the Impacts of COVID-19 Pandemic in the Food and Beverage Industry. Oper. Manag. Res. 2020, 1–13. [Google Scholar] [CrossRef]
- Paul, S.K.; Chowdhury, P. Strategies for Managing the Impacts of Disruptions During COVID-19: An Example of Toilet Paper. Glob. J. Flex. Syst. Manag. 2020, 21, 283–293. [Google Scholar] [CrossRef]
- Rajesh, R. A Grey-Layered ANP Based Decision Support Model for Analyzing Strategies of Resilience in Electronic Supply Chains. Eng. Appl. Artif. Intell. 2020, 87, 103338. [Google Scholar] [CrossRef]
- Brown, E.E.; Kumar, S.; Rajji, T.K.; Pollock, B.G.; Mulsant, B.H. Anticipating and Mitigating the Impact of the COVID-19 Pandemic on Alzheimer’s Disease and Related Dementias. Am. J. Geriatr. Psychiatry 2020, 28, 712–721. [Google Scholar] [CrossRef]
- de Bruin, Y.B.; Lequarre, A.-S.; McCourt, J.; Clevestig, P.; Pigazzani, F.; Jeddi, M.Z.; Colosio, C.; Goulart, M. Initial Impacts of Global Risk Mitigation Measures Taken during the Combatting of the COVID-19 Pandemic. Saf. Sci. 2020, 128, 104773. [Google Scholar] [CrossRef]
- Ma, J.; Hou, S.; Bao, B. Short-Term and Long-Term Impacts of a Quick Response Strategy on a Dual Channel Apparel Supply Chain. Int. J. Bifurc. Chaos 2019, 29, 1950190. [Google Scholar] [CrossRef]
- Bain, M. (2020). Coronavirus threatens the livelihoods of garment workers around the world. Qz.Com. Available online: https://qz.com/1821511/coronavirus-threatens-jobs-of-garmentworkers-in-southeast-asia/ (accessed on 19 July 2020).
- Ju-Long, D. Control Problems of Grey Systems. Syst. Control Lett. 1982, 1, 288–294. [Google Scholar] [CrossRef]
- Kabir, G.; Sumi, R.S. Integrating fuzzy Delphi with graph theory and matrix methods for evaluation of hazardous industrial waste transportation firm. Int. J. Logist. Econ. Glob. 2012, 4, 221–237. [Google Scholar] [CrossRef]
- Singh, R.K.; Kumar, P. Measuring the Flexibility Index for a Supply Chain Using Graph Theory Matrix Approach. J. Glob. Oper. Strateg. Sourc. 2019, 13, 56–69. [Google Scholar] [CrossRef]
- Opricovic, S.; Tzeng, G.H. Defuzzification within a Multicriteria Decision Model. Int. J. Uncertain. Fuzziness Knowl. Based Syst. 2003, 11, 635–652. [Google Scholar] [CrossRef]
- Fu, X.; Zhu, Q.; Sarkis, J. Evaluating Green Supplier Development Programs at a Telecommunications Systems Provider. Int. J. Prod. Econ. 2012, 140, 357–367. [Google Scholar] [CrossRef]
- Rajesh, R.; Ravi, V. Analyzing Drivers of Risks in Electronic Supply Chains: A Grey–DEMATEL Approach. Int. J. Adv. Manuf. Technol. 2017, 92, 1127–1145. [Google Scholar] [CrossRef]
- Wang, Y.; Yu, Y. Flexible Strategies under Supply Disruption: The Interplay between Contingent Sourcing and Responsive Pricing. Int. J. Prod. Res. 2020, 58, 1–22. [Google Scholar] [CrossRef]
- Hou, J.; Sun, L. Backup Sourcing Decisions for Coping with Supply Disruptions under Long-Term Horizons. Discret. Dyn. Nat. Soc. 2016, 2016, 6716058. [Google Scholar] [CrossRef] [Green Version]
- Sharif, S. Impact of COVID-19 Pandemic: Government Relief Package and the Likely Mis-Allocation of Loans in Pakistan. SSRN Electron. J. 2020. [Google Scholar] [CrossRef]
- Kumar, P.S.; Priyabrata, C. A Production Recovery Plan in Manufacturing Supply Chains for a High-Demand Item during COVID-19. Int. J. Phys. Distrib. Logist. Manag. 2020. [Google Scholar] [CrossRef]
- Sen, S.; Antara, N.; Sen, S.; Chowdhury, S. The Unprecedented Pandemic “COVID-19” Effect on the Bangladesh Apparel Workers by Shivering the Apparel Supply Chain. SSRN Electron. J. 2020. [Google Scholar] [CrossRef]
- WHO. Q&A: Tips for Health and Safety at the Workplace in the Context of COVID-19. Available online: https://www.who.int/news-room/q-a-detail/q-a-tips-for-health-and-safety-at-the-workplace-in-the-context-of-covid-19?gclid=Cj0KCQjw3s_4BRDPARIsAJsyoLMiMKfepPADnBPUjAnCBn-zDaIIZbdoV4VXwnTeLfdzOl8p39gMFHEaAjkxEALw_wcB (accessed on 20 July 2020).
- Kramer, A.; Kramer, K.Z. The Potential Impact of the Covid-19 Pandemic on Occupational Status, Work from Home, and Occupational Mobility. J. Vocat. Behav. 2020, 119, 103442. [Google Scholar] [CrossRef]
- Novak, J.I.; Loy, J. A Critical Review of Initial 3D Printed Products Responding to COVID-19 Health and Supply Chain Challenges. Emerald Open Res. 2020, 2, 24. [Google Scholar] [CrossRef]
- Parast, M.M. The Impact of R&D Investment on Mitigating Supply Chain Disruptions: Empirical Evidence from U.S. Firms. Int. J. Prod. Econ. 2020, 227, 107671. [Google Scholar] [CrossRef]
- Huo, B.; Haq, M.Z.U.; Gu, M. The Impact of Information Sharing on Supply Chain Learning and Flexibility Performance. Int. J. Prod. Res. 2020, 1–24. [Google Scholar] [CrossRef]
- Govindan, K.; Roohollah, K.; Amin, V. A Grey DEMATEL Approach to Develop Third-Party Logistics Provider Selection Criteria. Ind. Manag. Data Syst. 2018, 116, 690–722. [Google Scholar] [CrossRef]
- Mishra, R. Empirical Analysis of Enablers and Performance Outcome of Manufacturing Flexibility in an Emerging Economy. J. Manuf. Technol. Manag. 2020. [Google Scholar] [CrossRef]
- Golmohammadi, A.; Hassini, E. Review of Supplier Diversification and Pricing Strategies under Random Supply and Demand. Int. J. Prod. Res. 2020, 58, 3455–3487. [Google Scholar] [CrossRef]
- Inman, R.R.; Jordan, W.C.; Blumenfeld, D.E. Chained Cross-Training of Assembly Line Workers. Int. J. Prod. Res. 2004, 42, 1899–1910. [Google Scholar] [CrossRef]
- Park, C.-Y.; Kim, K.; Roth, S.; Beck, S.; Kang, J.W.; Tayag, M.C.; Griffin, M. Global Shortage of Personal Protective Equipment amid COVID-19: Supply Chains, Bottlenecks, and Policy Implications. ADB Briefs 2019, 108, 1–8. [Google Scholar] [CrossRef] [Green Version]
- Fildes, R.; Goodwin, P.; Lawrence, M.; Nikolopoulos, K. Effective Forecasting and Judgmental Adjustments: An Empirical Evaluation and Strategies for Improvement in Supply-Chain Planning. Int. J. Forecast. 2009, 25, 3–23. [Google Scholar] [CrossRef]
- Hsu, C.-I.; Li, H.-C. Reliability Evaluation and Adjustment of Supply Chain Network Design with Demand Fluctuations. Int. J. Prod. Econ. 2011, 132, 131–145. [Google Scholar] [CrossRef]


| Impact Code | Impact Name | Description | Reference |
|---|---|---|---|
| IM 1 | Orders cancellations from brands and retailers | Less customer arrival, unable to reach their respective customers due to lack of delivery options | Son, Kang, and Jang [32] |
| IM 2 | Reduced production and unfulfilled orders | Decreased raw material supply and reduced production lead to unfulfilled orders | Sánchez-Ramírezet et al. [34]; Altig et al. [35] |
| IM 3 | Slow shipments and inconsistency in delivery | Ports are closed due to lockdown, Lower capacity for distributors to send goods, inflated delivery costs, and delayed delivery | Gereffi [36] |
| IM 4 | Stalled production | Lack of raw materials, lack of workers, Factory shutdown | Pradhan, Ghose, and Shabbiruddin [37] |
| IM 5 | Unavailability of the operator due to sickness | The operator may be COVID-19 affected | Proposed by experts |
| IM 6 | Shortage of operation, maintenance, and surveillance (OMS) workers | OMS may be COVID-19 affected; they may be at the lockdown area. | Proposed by experts |
| IM 7 | Change of delivery and order cycle | Because of COVID-19, delivery time may be delayed as well as affect the order cycle. | Publicis Sapient’s [38] |
| IM 8 | Excess amount of Inventory | Excess inventory due to order cancellation or reduced order | Tang and Zimmerman [36] |
| IM 9 | Increased level of job cuts | Due to reduced production, there are many job cuts | Proposed by experts |
| IM 10 | Impact on international trade | The foreign investors have pulled out as well as Slow credit flow from banks and non-banking financial companies | Vidya and Prabheesh [40] |
| Strategy Code | Strategies | Description | Reference |
|---|---|---|---|
| MS 1 | Pricing flexibility | Price reduction by offering a discount. | Y. Wang and Yu [76] |
| MS 2 | Looking for alternative buyers/markets | Decreasing effect of canceled orders due to COVID-19 outbreak | Proposed by experts |
| MS 3 | Diversify the source of supply and develop backup suppliers | Dividing up sourcing activities between multiple suppliers serves to protect a business against the impacts on supply chain | Hou and Sun [77] |
| MS 4 | Government incentives | Government incentives are required for the organizations when business is stranded | Sharif [78] |
| MS 5 | AI and big data-based supply chain transparency | Integrate all the supply chain information to avoid possible disruptions | Proposed by experts |
| MS 6 | E-commerce enablement | Launching applications, tracking system | Proposed by experts |
| MS 7 | Manufacturing flexibility | Production and volume flexibility, varied products at varied volume | P. S. Kumar and Priyabrata [79] |
| MS 8 | Using analytics to predict net requirements | Using advanced analytics and experience to understand how production or supply chain changes affect inventory and operating capital. | Proposed by experts |
| MS 9 | Keeping buffer inventory | Decrease the effect of factory shutdown keeping buffer inventory | Sen, Antara, Sen, and Chowdhury [80] |
| MS 10 | Introducing a generalized system of preferences | Decreases capacity risks | Rajesh, Ravi, and Venkata Rao [58] |
| MS 11 | Health and safety training facilities for the staff | Train all the staff on COVID-19 outbreak transmission systems, methods, and implication | WHO [81] |
| MS 12 | Train backup operators | Make backup operators readily available | Proposed by experts |
| MS 13 | Develop and adopt social and behavioral change materials | The habit of using PPE, ensuring social distance, use of soap, and hand sanitizer in the garments. | Proposed by experts |
| MS 14 | Flexible work shift or overtime | Government restriction for in-house gathering to prevent transmission of COVID-19 outbreak | Kramer & Kramer, [82] |
| MS 15 | A campaign of “social distancing” measures such as isolation, work from home, quarantine, etc. | Improved security system | Proposed by experts |
| MS 16 | Make backup operators readily available | Basic OMS Training of staffs | Proposed by experts |
| MS 17 | Supply chain design adjustment | Adjusting strategies for COVID-19 outbreak | Novak and Loy, [83], Rajesh, Ravi, and Venkata Rao [58] |
| MS 18 | Increase agility | Prioritizing cost over responsiveness for slow-moving product and vice versa for fast-moving products, making payment method flexible | Parast, [84], Rajesh, Ravi, and Venkata Rao [58] |
| MS 19 | Flexible payment method | ||
| MS 20 | Attracting more buyers offering products at lower price | ||
| MS 21 | Increase the number of contractual workers | Decreases liability and reduces the probability of firing permanent workers | Proposed by experts |
| MS 22 | Globally coordinated policy for effective control | ● Sharing information with supply chain partners located globally ● Provide funding by government/ banks with less or no interest ● Multi-layered international and Intra- and inter-organizational coordination | Baofeng Huo, Muhammad Zia Ul Haq & Minhao Gu, [85] |
| Expert Code | Designation | Experience |
|---|---|---|
| Exp 1 | Head of Operations | 25 years |
| Exp 2 | Head of Sales and Marketing | 20 years |
| Exp 3 | Head of Supply Chains | 18 years |
| Linguistic Variable | Score | Grey Number |
|---|---|---|
| No Importance/Influence | 0 | [0, 0] |
| Very Low Importance /Influence | 1 | [0, 0.25] |
| Low Importance/Influence | 2 | [0.25, 0.5] |
| High Importance/Influence | 3 | [0.5, 0.75] |
| Very High Importance/Influence | 4 | [0.75, 1] |
| Final Crisp Value | ||||||||||
|---|---|---|---|---|---|---|---|---|---|---|
| IM 1 | IM 2 | IM 3 | IM 4 | IM 5 | IM 6 | IM 7 | IM 8 | IM 9 | IM 10 | |
| IM 1 | 0 | 0 | 0 | 0 | 0.35 | 0 | 0.56 | 0.28 | 0.59 | 0.44 |
| IM2 | 0 | 0 | 0.07 | 0 | 0 | 0.21 | 0 | 0 | 0 | 0 |
| IM 3 | 0 | 0.42 | 0 | 0 | 0 | 0 | 0 | 0 | 0 | 0 |
| IM 4 | 0 | 0 | 0 | 0 | 1.55 | 1.55 | 0.63 | 2.38 | −32.61 | 0 |
| IM 5 | 0 | 0 | 9.95 | 0 | 0 | 0 | 0.63 | 0.63 | 0 | 0.74 |
| IM 6 | 0 | 0 | 0 | 0 | 0 | 0 | 1.11 | 0.63 | 0 | 0 |
| IM 7 | 0 | 0 | 0 | 0 | 0.30 | 0.21 | 0 | 0 | 0 | 0 |
| IM 8 | 0 | 0 | 0.42 | 0.21 | 0.75 | 0 | 0.21 | 0 | 0.42 | 0 |
| IM 9 | 0.75 | 0.75 | 0.56 | 0.49 | 0.49 | 0.49 | 0.42 | 0.63 | 0 | 0.21 |
| IM 10 | 0.21 | 0.63 | 0 | 0.58 | 0.42 | 0.42 | 0.42 | 0.56 | 0.63 | 0 |
| Final Crisp Value | ||||||||||
|---|---|---|---|---|---|---|---|---|---|---|
| IM 1 | IM 2 | IM 3 | IM 4 | IM 5 | IM 6 | IM 7 | IM 8 | IM 9 | IM 10 | |
| MS 1 | 0 | 0.0395 | 0 | 0 | 0.5221 | 0.0049 | 0.8117 | 0.4256 | 0.7594 | 0.5742 |
| MS 2 | 0 | 0.2037 | 0.093 | 0.0185 | 0.0185 | 0.3291 | 0 | 0 | 0 | 0 |
| MS 3 | 0.1366 | 0.6186 | 0 | 0 | 0 | 0 | 0 | 0 | 0 | 0 |
| MS 4 | 0 | 0 | 0 | 0 | 0.8879 | 0.8879 | 0.9082 | 0.7473 | 14.426 | 0 |
| MS 5 | 0 | 0 | −1.4605 | 0 | 0 | 0 | 0.9082 | 0.9082 | 0 | 0.9446 |
| MS 6 | 0 | 0 | 0 | 0 | 0 | 0 | 0.6661 | 0.9082 | 0 | 0.0395 |
| MS 7 | 0 | 0 | 0.0395 | 0 | 1.0136 | 0.3291 | 0 | 0 | 0 | 0 |
| MS 8 | 0 | 0.2704 | 0.6186 | 0.3291 | 0.75 | 0 | 0.3291 | 0 | 0.6186 | 0 |
| MS 9 | 0.75 | 0.75 | 0.8117 | 0.7151 | 0.7151 | 0.7151 | 0.6186 | 0.9082 | 0 | 0.3291 |
| MS 10 | 0.3291 | 0.9082 | 0.1366 | 0.5833 | 0.6186 | 0.6186 | 0.6186 | 0.8117 | 0.9082 | 0 |
| MS 11 | 0 | 0.0395 | 0 | 0 | 0.5221 | 0.0049 | 0.8117 | 0.4256 | 0.7594 | 0.5742 |
| MS 12 | 0 | 0.2037 | 0.09316 | 0.0185 | 0.0185 | 0.3291 | 0 | 0 | 0 | 0 |
| MS 13 | 0.1366 | 0.6186 | 0 | 0 | 0 | 0 | 0 | 0 | 0 | 0 |
| MS 14 | 0 | 0 | 0 | 0 | 0.8879 | 0.887 | 0.9082 | 0.7473 | 14.426 | 0 |
| MS 15 | 0 | 0 | −1.460 | 0 | 0 | 0 | 0.9082 | 0.9082 | 0 | 0.9446 |
| MS 16 | 0 | 0 | 0 | 0 | 0 | 0 | 0.6661 | 0.9082 | 0 | 0.0395 |
| MS 17 | 0 | 0 | 0.0395 | 0 | 1.0136 | 0.3291 | 0 | 0 | 0 | 0 |
| MS 18 | 0 | 0.2704 | 0.6186 | 0.3291 | 0.75 | 0 | 0.3291 | 0 | 0.6186 | 0 |
| MS 19 | 0.75 | 0.75 | 0.8117 | 0.7151 | 0.7151 | 0.7151 | 0.6186 | 0.9082 | 0 | 0.3291 |
| MS 20 | 0.3291 | 0.9082 | 0.1366 | 0.5833 | 0.6186 | 0.6186 | 0.6186 | 0.8117 | 0.9082 | 0 |
| MS 21 | 0 | 0.0395 | 0 | 0 | 0.5221 | 0.0049 | 0.8117 | 0.4256 | 0.7594 | 0.5742 |
| MS 22 | 0 | 0.0395 | 0 | 0 | 0.5221 | 0.0049 | 0.8117 | 0.4256 | 0.7594 | 0.5742 |
| Final Crisp Value | ||||||||||
|---|---|---|---|---|---|---|---|---|---|---|
| IM 1 | IM 2 | IM 3 | IM 4 | IM 5 | IM 6 | IM 7 | IM 8 | IM 9 | IM 10 | |
| MS 1 | 0 | 0.0238 | 0.0238 | 0.0064 | 0.1225 | 0 | 0.0833 | 0.0064 | 0.1225 | 0.0238 |
| MS 2 | 0.05 | 0.0833 | 0.05 | 0.0238 | 0.1225 | 0.1666 | 0.1225 | 0.6944 | 0.5 | 0.0064 |
| MS 3 | 0.0064 | 0.1225 | 0.05 | 0.05 | 0.05 | 0.05 | 0.1666 | 0.1666 | 0.05 | 0.0064 |
| MS 4 | 0 | 0 | 0.0238 | 0.0064 | 0.4384 | 0.2666 | 0.1225 | 0.1225 | 0.6282 | 0 |
| MS 5 | 0.05 | 0.05 | 0.9704 | 0.0238 | 0.0833 | 0.05 | 0.1225 | 0.1666 | 0 | 0.3214 |
| MS 6 | 0.0064 | 0.05 | 0.0238 | 0.0833 | 0.1666 | 0.05 | 0.5 | 0.1666 | 0.1225 | 0 |
| MS 7 | 0.05 | 0.05 | 0.1225 | 0.05 | 0.2149 | 0.05 | 0.05 | 0.05 | 0.0238 | 0.0064 |
| MS 8 | 0.0833 | 0.1666 | 0.1225 | 0.1666 | 0.2149 | 0.0833 | 0.1225 | 0.1225 | 0.1225 | 0.0064 |
| MS 9 | 0.0833 | 0.2666 | 0.02381 | 0.1666 | 0.1666 | 0.1666 | 0.1225 | 0.1666 | 0.05 | 0.0064 |
| MS 10 | 0.0064 | 0.05 | 0.02381 | 0.0238 | 0.2149 | 0.0833 | 0.1225 | 0.6944 | 0.8304 | 0 |
| MS 11 | 0.05 | 0.05 | 0.1666 | 0.0238 | 0.0833 | 0.0238 | 0.2666 | 0.2149 | 0.05 | 0.0833 |
| MS 12 | 0.0064 | 0.0833 | 0 | 0.05 | 0.05 | 0.08333 | 0.0833 | 0.1666 | 0.05 | 0 |
| MS 13 | 0 | 0.0238 | 0.0238 | 0.0064 | 0.1225 | 0.0064 | 0.0064 | 0 | 0.0238 | 0 |
| MS 14 | 0.05 | 0.05 | 0.1225 | 0.05 | 0.5633 | 0.3787 | 0.1666 | 0.1225 | 0.6282 | 0.0064 |
| MS 15 | 0.0833 | 0.1666 | 0.9704 | 0.1225 | 0.1225 | 0.1225 | 0.2666 | 0.3214 | 0.05 | 0.3214 |
| MS 16 | 0.0064 | 0.05 | 0.0238 | 0.0833 | 0.1225 | 0.0238 | 0.4384 | 0.1225 | 0.1225 | 0 |
| MS 17 | 0.05 | 0.1225 | 0.05 | 0.0238 | 0.0833 | 0.05 | 0.0238 | 0.05 | 0 | 0.0064 |
| MS 18 | 0.0064 | 0.05 | 0.0238 | 0.0833 | 0.3214 | 0.1666 | 0.2149 | 0.6944 | 0.8304 | 0 |
| MS 19 | 0.05 | 0.05 | 0.2149 | 0.0833 | 0.1666 | 0.05 | 0.1666 | 0.1666 | 0.0238 | 0.0238 |
| MS 20 | 0.0833 | 0.1666 | 0.05 | 0.05 | 0.05 | 0.05 | 0.0833 | 0.3214 | 0.05 | 0.0064 |
| MS 21 | 0.0064 | 0.05 | 0 | 0.05 | 0.2149 | 0.0833 | 0.1666 | 0.0833 | 0.1666 | 0.0238 |
| MS 22 | 0 | 0.0064 | 0.0833 | 0.0238 | 0.1666 | 0.0064 | 0.0238 | 0 | 0.0833 | 0 |
| V1 | 0 | 0 | 0 | 0.3510 | 0 | 0.5619 | 0.2808 | 0.5931 | 0.4447 |
| 0 | V2 | 0.0784 | 0 | 0 | 0.2105 | 0 | 0 | 0 | 0 |
| 0 | 0.4213 | V3 | 0 | 0 | 0 | 0 | 0 | 0 | 0 |
| 0 | 0 | 0 | V4 | 1.5597 | 1.5597 | 0.632 | 2.3803 | −32.6148 | 0 |
| 0 | 0 | 9.9532 | 0 | V5 | 0 | 0.6322 | 0.63232 | 0 | 0.7416 |
| 0 | 0 | 0 | 0 | 0 | V6 | 1.1132 | 0.6322 | 0 | 0 |
| 0 | 0 | 0 | 0 | 0.3078 | 0.2105 | V7 | 0 | 0 | 0 |
| 0 | 0 | 0.4213 | 0.2105 | 0.7509 | 0 | 0.2105 | V8 | 0.42133 | 0 |
| 0.7509 | 0.7509 | 0.5619 | 0.4916 | 0.4916 | 0.4916 | 0.4213 | 0.6322 | V9 | 0.2105 |
| 0.2105 | 0.632 | 0 | 0.5839 | 0.4213 | 0.4213 | 0.4213 | 0.56191 | 0.6322 | V10 |
| W1 | 0 | 0 | 0 | 0.3510 | 0 | 0.5619 | 0.2808 | 0.5931 | 0.4447 |
| 0 | W2 | 0.0784 | 0 | 0 | 0.2105 | 0 | 0 | 0 | 0 |
| 0 | 0.4213 | W3 | 0 | 0 | 0 | 0 | 0 | 0 | 0 |
| 0 | 0 | 0 | W4 | 1.5597 | 1.5597 | 0.6322 | 2.3803 | −32.6148 | 0 |
| 0 | 0 | 9.9532 | 0 | W5 | 0 | 0.6322 | 0.6322 | 0 | 0.7416 |
| 0 | 0 | 0 | 0 | 0 | W6 | 1.1132 | 0.6322 | 0 | 0 |
| 0 | 0 | 0 | 0 | 0.3078 | 0.2105 | W7 | 0 | 0 | 0 |
| 0 | 0 | 0.4213 | 0.2105 | 0.7509 | 0 | 0.2105 | W8 | 0.4213 | 0 |
| 0.7509 | 0.7509 | 0.5619 | 0.4916 | 0.4916 | 0.4916 | 0.4213 | 0.6322 | W9 | 0.2105 |
| 0.2105 | 0.6322 | 0 | 0.5839 | 0.4213 | 0.4213 | 0.4213 | 0.5619 | 0.6322 | W10 |
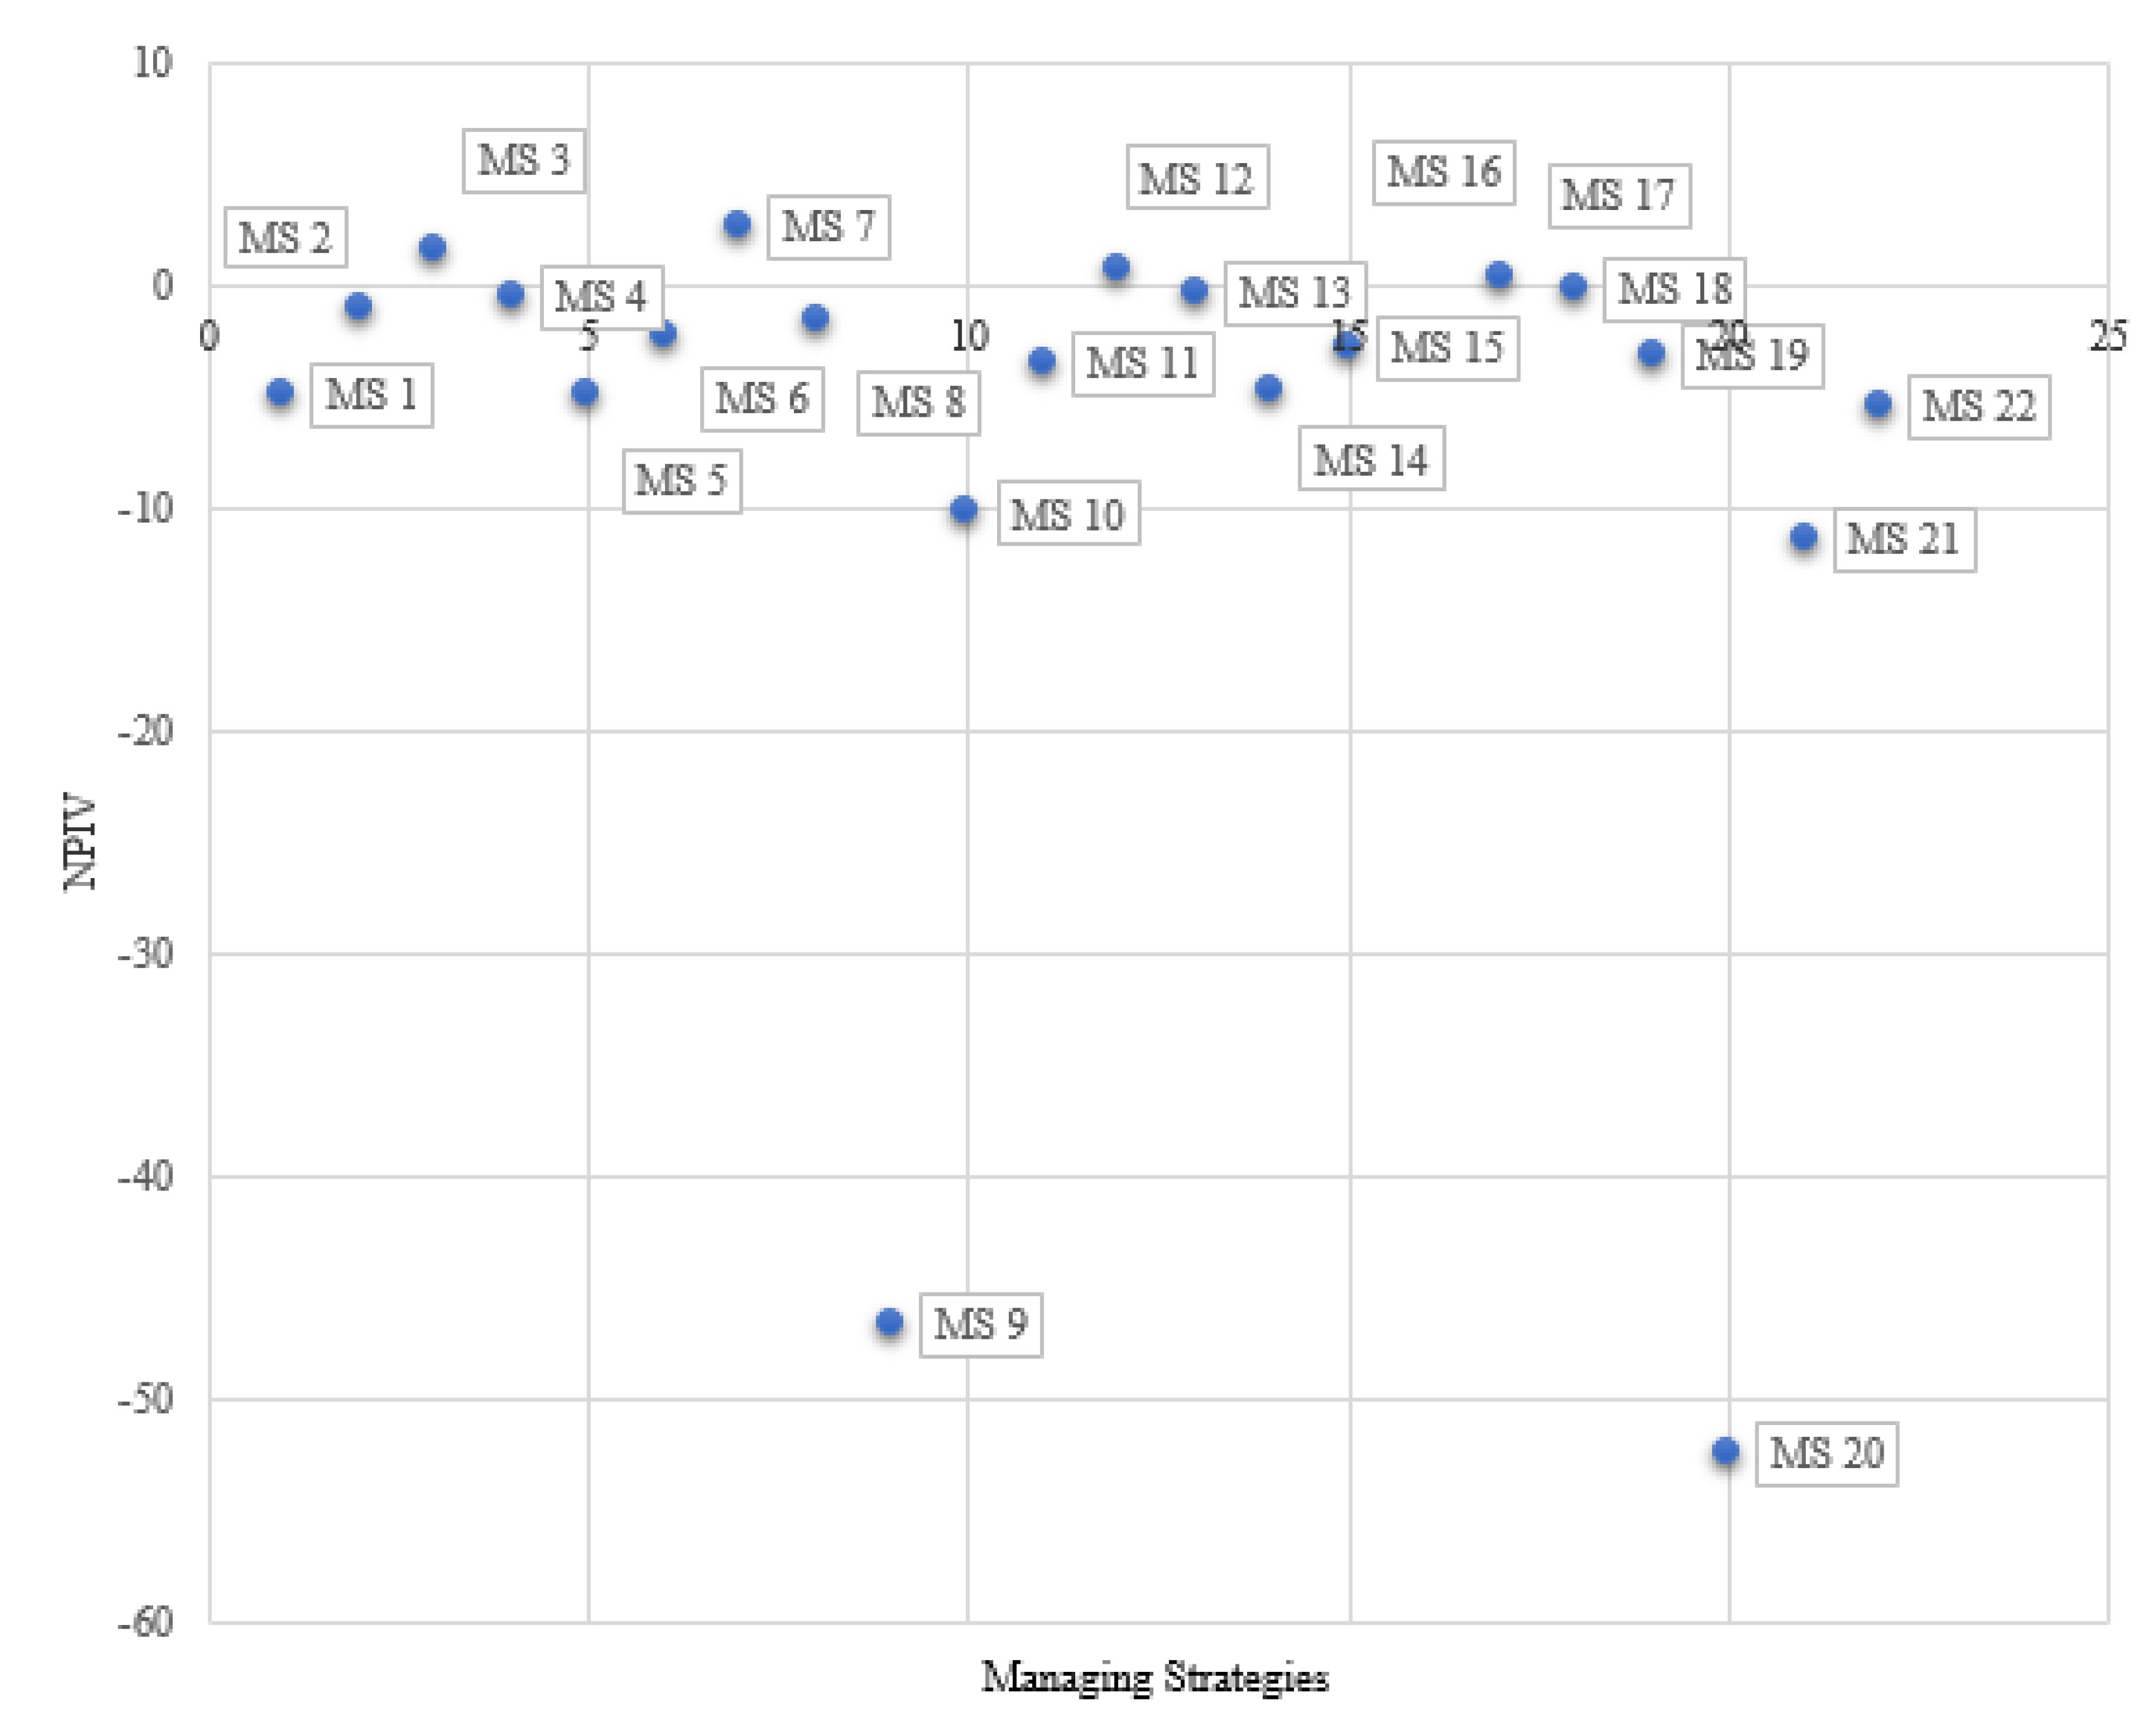
| Strategy | Per (D) | Per (E) | NPIV | Rank |
|---|---|---|---|---|
| MS 7 | −1.2802 | −3.8688 | 2.5886 | 1 |
| MS 3 | −0.9208 | −2.4776 | 1.5568 | 2 |
| MS 12 | −1.469 | −2.0219 | 0.5529 | 3 |
| MS 17 | −1.2802 | −1.623 | 0.3428 | 4 |
| MS 18 | −4.1754 | −3.9085 | −0.2669 | 5 |
| MS 13 | −1.6747 | −1.281 | −0.3937 | 6 |
| MS 4 | −2.6059 | −2.0845 | −0.5214 | 7 |
| MS 2 | −4.6474 | −3.5555 | −1.0919 | 8 |
| MS 8 | −4.1754 | −2.4619 | −1.7135 | 9 |
| MS 6 | −6.178 | −3.8988 | −2.2792 | 10 |
| MS 16 | −6.178 | −3.3972 | −2.7808 | 11 |
| MS 15 | −8.2864 | −5.3848 | −2.9016 | 12 |
| MS 19 | −5.8082 | −2.6276 | −3.1806 | 13 |
| MS 11 | −6.843 | −3.2602 | −3.5828 | 14 |
| MS 14 | −7.3064 | −2.5106 | −4.7958 | 15 |
| MS 1 | −6.6461 | −1.6591 | −4.987 | 16 |
| MS 5 | −8.2864 | −3.2741 | −5.0123 | 17 |
| MS 22 | −6.843 | −1.4129 | −5.4301 | 18 |
| MS 10 | −13.6541 | −3.3514 | −10.3027 | 19 |
| MS 21 | −13.6541 | −2.2169 | −11.4372 | 20 |
| MS 9 | −49.1749 | −2.5281 | −46.6468 | 21 |
| MS 20 | −55.1254 | −2.6315 | −52.4939 | 22 |
Publisher’s Note: MDPI stays neutral with regard to jurisdictional claims in published maps and institutional affiliations. |
© 2020 by the authors. Licensee MDPI, Basel, Switzerland. This article is an open access article distributed under the terms and conditions of the Creative Commons Attribution (CC BY) license (http://creativecommons.org/licenses/by/4.0/).
Share and Cite
Taqi, H.M.M.; Ahmed, H.N.; Paul, S.; Garshasbi, M.; Ali, S.M.; Kabir, G.; Paul, S.K. Strategies to Manage the Impacts of the COVID-19 Pandemic in the Supply Chain: Implications for Improving Economic and Social Sustainability. Sustainability 2020, 12, 9483. https://doi.org/10.3390/su12229483
Taqi HMM, Ahmed HN, Paul S, Garshasbi M, Ali SM, Kabir G, Paul SK. Strategies to Manage the Impacts of the COVID-19 Pandemic in the Supply Chain: Implications for Improving Economic and Social Sustainability. Sustainability. 2020; 12(22):9483. https://doi.org/10.3390/su12229483
Chicago/Turabian StyleTaqi, Hasin Md. Muhtasim, Humaira Nafisa Ahmed, Sumit Paul, Maryam Garshasbi, Syed Mithun Ali, Golam Kabir, and Sanjoy Kumar Paul. 2020. "Strategies to Manage the Impacts of the COVID-19 Pandemic in the Supply Chain: Implications for Improving Economic and Social Sustainability" Sustainability 12, no. 22: 9483. https://doi.org/10.3390/su12229483