
Species Richness and Carbon Footprints of Vegetable Oils: Can High Yields Outweigh Palm Oil’s Environmental Impact?


1
Department of Zoology, University of Cambridge, Downing Street, Cambridge CB2 3EJ, UK
2
Harvard Forest, Harvard University, 324 Main Street, Petersham, MA 01366, USA
3
Center for Ecosystem Science and Society and School of Informatics, Computing and Cyber Systems, Northern Arizona University, 1295 Knoles Drive, Flagstaff, AZ 86011, USA
*
Author to whom correspondence should be addressed.
Sustainability 2021, 13(4), 1813; https://doi.org/10.3390/su13041813
Submission received: 10 November 2020
/
Revised: 19 January 2021
/
Accepted: 23 January 2021
/
Published: 8 February 2021
(This article belongs to the Special Issue Food and Agricultural Security)
Abstract
:Palm oil has been widely criticised for its high environmental impacts, leading to calls to replace it with alternative vegetable oils in food and cosmetic products. However, substituting palm oil would be environmentally beneficial only if the environmental footprint per litre oil were lower than those of alternative vegetable oils. Whether this is the case is not obvious, given the high oil yields of oil palm of up to 10 times those of alternative crops. Here, we combine global agricultural and environmental datasets to show that, among the world’s seven major vegetable oil crops (oil palm, soybean, rapeseed, sunflower, groundnut, coconut, olive), oil palm has the lowest average species richness and carbon footprint associated with an annual production of one litre of vegetable oil. For each crop, these yield-adjusted footprints differ substantially between major producer countries, which we find to be largely the result of differences in crop management. Closing agricultural yield gaps of oil crops through improved management practices would significantly reduce the environmental footprints per oil yield. This would minimise the need for further land conversion to oil cropland and indeed could increase production to such an extent that a significant area of oil croplands could be ecologically restored.
1. Introduction
Over the last two decades, oil palm has likely been more strongly associated with environmental destruction than any other crop [1,2]. The conversion of tropical forests to oil palm plantations in Southeast Asia, and, to a lesser but increasing extent, in Sub-Sahara Africa and South America [3], has had major impacts on a wide range of ecosystem functions [4]. Deforestation for palm oil production has caused substantial greenhouse gas emissions, particularly from the loss of carbon stored in the natural vegetation and soil, especially on peatland [5,6,7,8]. Oil palm cropping has also been strongly associated with biodiversity loss [9,10,11,12,13]. Across many taxonomic groups, species richness in oil palm plantations is often significantly reduced compared to that of natural forests [4,9,12,13,14] as the result of the simpler and more open canopy structure and the lack of leaf litter, understory vegetation, and wood debris [14]. In addition, species present in plantations, in particular those benefiting from the conversion of natural habitat, are often generalists, while forest-dependent specialists are less common [9,14]. Concerns about these environmental impacts of oil palm cultivation are amplified by a significant increase in the global demand for vegetable oil projected for the coming decades [15,16].
In an effort to reduce environmental damage, a number of public campaigns have led to consumer pressure on food companies, resulting in the substitution of palm oil with alternative vegetable oils and the labelling of palm oil-free products [17,18]. Notwithstanding the technical challenges of substituting palm oil [19], it has recently been suggested that this strategy may potentially have adverse effects, given that lower-yielding oil crops require up to 10 times more land than oil palm to produce a given quantity of vegetable oil [14,20,21]. Whilst alternative oil crops may have a smaller environmental footprint per hectare than oil palm, their larger area requirements could imply that the total environmental impact associated with the production of one litre of vegetable oil is actually higher than for oil palm. Minimising the environmental footprint of the global production of vegetable oil will therefore likely not be achieved by selecting crops with the lowest per-hectare footprint, but those with the lowest per-litre-oil footprint (i.e., the ratio of per-hectare footprint to per-hectare oil yield). In this context, it is important to consider not only actual yields, but also potential yields that could be achieved in the future by optimising crop management practices [22,23,24]. Closing yield gaps (i.e., the difference between observed and theoretically achievable yields) can reduce the environmental footprint of the production of a unit of crop produce, and has been advocated as a key strategy for minimising the need for additional land conversion and associated environmental impacts [25,26,27,28,29].
Previous research has greatly advanced our understanding of the environmental impacts of oil palm cultivation [4]; however, analysis of such data in relation to current and potential oil yields, and comparison against those of other oil crops, have been limited [20,21,30]. Here, we compare the species richness and carbon footprints associated with an annual production of one litre of vegetable oil for the world’s seven largest oil crops: oil palm, soybean, rapeseed, sunflower, groundnut, coconut, and olive. We estimate yield-adjusted footprints across oil cropping areas globally and—motivated by the high spatial variability of yields and environmental impacts [20,31,32]—at the national scale. We go on to estimate how optimising crop management across the growing areas of the five largest oil crops, and closing agricultural yield gaps, could reduce the environmental footprint associated with an annual production of one litre of vegetable oil. Our analysis allows us to rank crops and major producer countries according to how environmentally efficiently they produce vegetable oil based on observed and potential yields and thus assess the desirability of substituting vegetable oil types as a means to reduce species and carbon footprints.
2. Methods
We used 0.083° resolution global maps of the harvested areas and yields of oil palm, soybean, rapeseed, sunflower, groundnut, coconut and olive for the year 2000 [33], the most recent spatial dataset containing these seven crops (Figure S1A). In addition to these observed yields, we used global maps of potential yields, i.e., theoretically achievable yields assuming optimal irrigation and fertiliser use, of oil palm, soybean, rapeseed, sunflower, groundnut [23]. Fresh weight observed and potential crop yields (Mg ha−1) were converted to vegetable oil yields (litres ha−1) using crop-specific oil extraction coefficients (Mg vegetable oil per Mg fresh-weight crop) [34] and relative oil densities (litres Mg−1) [35].
Species richness and carbon footprints were derived similar to [20]. Following [31], we estimated the carbon footprint associated with the cultivation of each oil crop in a cell of 0.083° global grid as the difference between the local potential natural carbon stocks, on the one hand, and the crop-specific carbon stocks, on the other hand. Potential natural carbon stocks were computed as the sum of the carbon stocks in the potential natural vegetation [31] and natural soil organic carbon stocks [36], while crop-specific carbon stocks were estimated as the sum of the carbon content of the crop [31] and 75% of the natural soil organic carbon, i.e., assuming a 25% loss of soil organic carbon from the conversion of natural conditions to cropland, supported by empirical findings [37,38,39,40,41]. On peatland [42], we assumed a loss of 100% of natural soil organic carbon. This conservative approach implies disproportionally higher carbon footprint estimates for oil palm, as the degree to which other oil crops are grown on peatland is very small. It also does not account for management practices that can significantly reduce the degree of peat oxidation [43].
Analogous to our approach for carbon, the species richness footprint associated with the cultivation of an oil crop in a cell of a 0.083° global grid was estimated as the difference between the local species richness under natural vegetation, on the one hand, and that under the relevant crop land cover, on the other hand. Here, we used global maps of these variables derived for mammal, bird, and amphibian species [44]. These maps were created based on the method described by [45,46], which combines species-specific data of the geographic extents of occurrence and habitat requirements of mammals, birds and amphibians [47,48]. Specifically, a species was estimated as present in a 0.083° grid cell under natural vegetation if its extent of occurrence overlaid the grid cell and if its habitat preferences included the local potential natural vegetation type [49]. The potential natural species richness in a grid cell is then given by the number of species that satisfy these conditions. Species richness in an olive grove or a soybean, rapeseed, sunflower or groundnut field was calculated in the same way but includes only species whose habitat requirements contain the category ‘arable land’, while species richness in an oil palm or coconut plantation includes only species whose habitat requirements contain the category ‘plantation’, in accordance with the classifications of these habitat types [50]. The available species data do not allow us to account for measures aiming at increasing biodiversity on oil croplands, however, the effectiveness of such strategies has been subject to debate [51,52,53].
For each crop, we divided the derived global maps of species richness and carbon footprint by the maps of observed and potential oil yields [20] to obtain 0.083° (~10 km) global maps of the carbon and species richness footprint associated with an annual production of one litre of oil—hereafter denoted ‘footprint p.y.’ (per oil yield)—across the growing areas of the crop (Figure S1B,C). For each crop, the average species richness and carbon footprint p.y. across its growing areas was computed as the weighted median of the set of footprints p.y. from all grid cells in which the crop is grown, with weights given by the set of harvested areas (in hectares) from the same grid cells. Weighted upper and lower quartiles of footprints p.y. were calculated analogously. A Wilcoxon rank sum test was used to test whether the differences between the global average footprints p.y. of the seven crops considered were statistically significant. Country-specific distributions were derived in the same way, but weights corresponding to grid cells outside the relevant country were set to zero. Analyses were conducted using Matlab R2020a [54].
3. Results
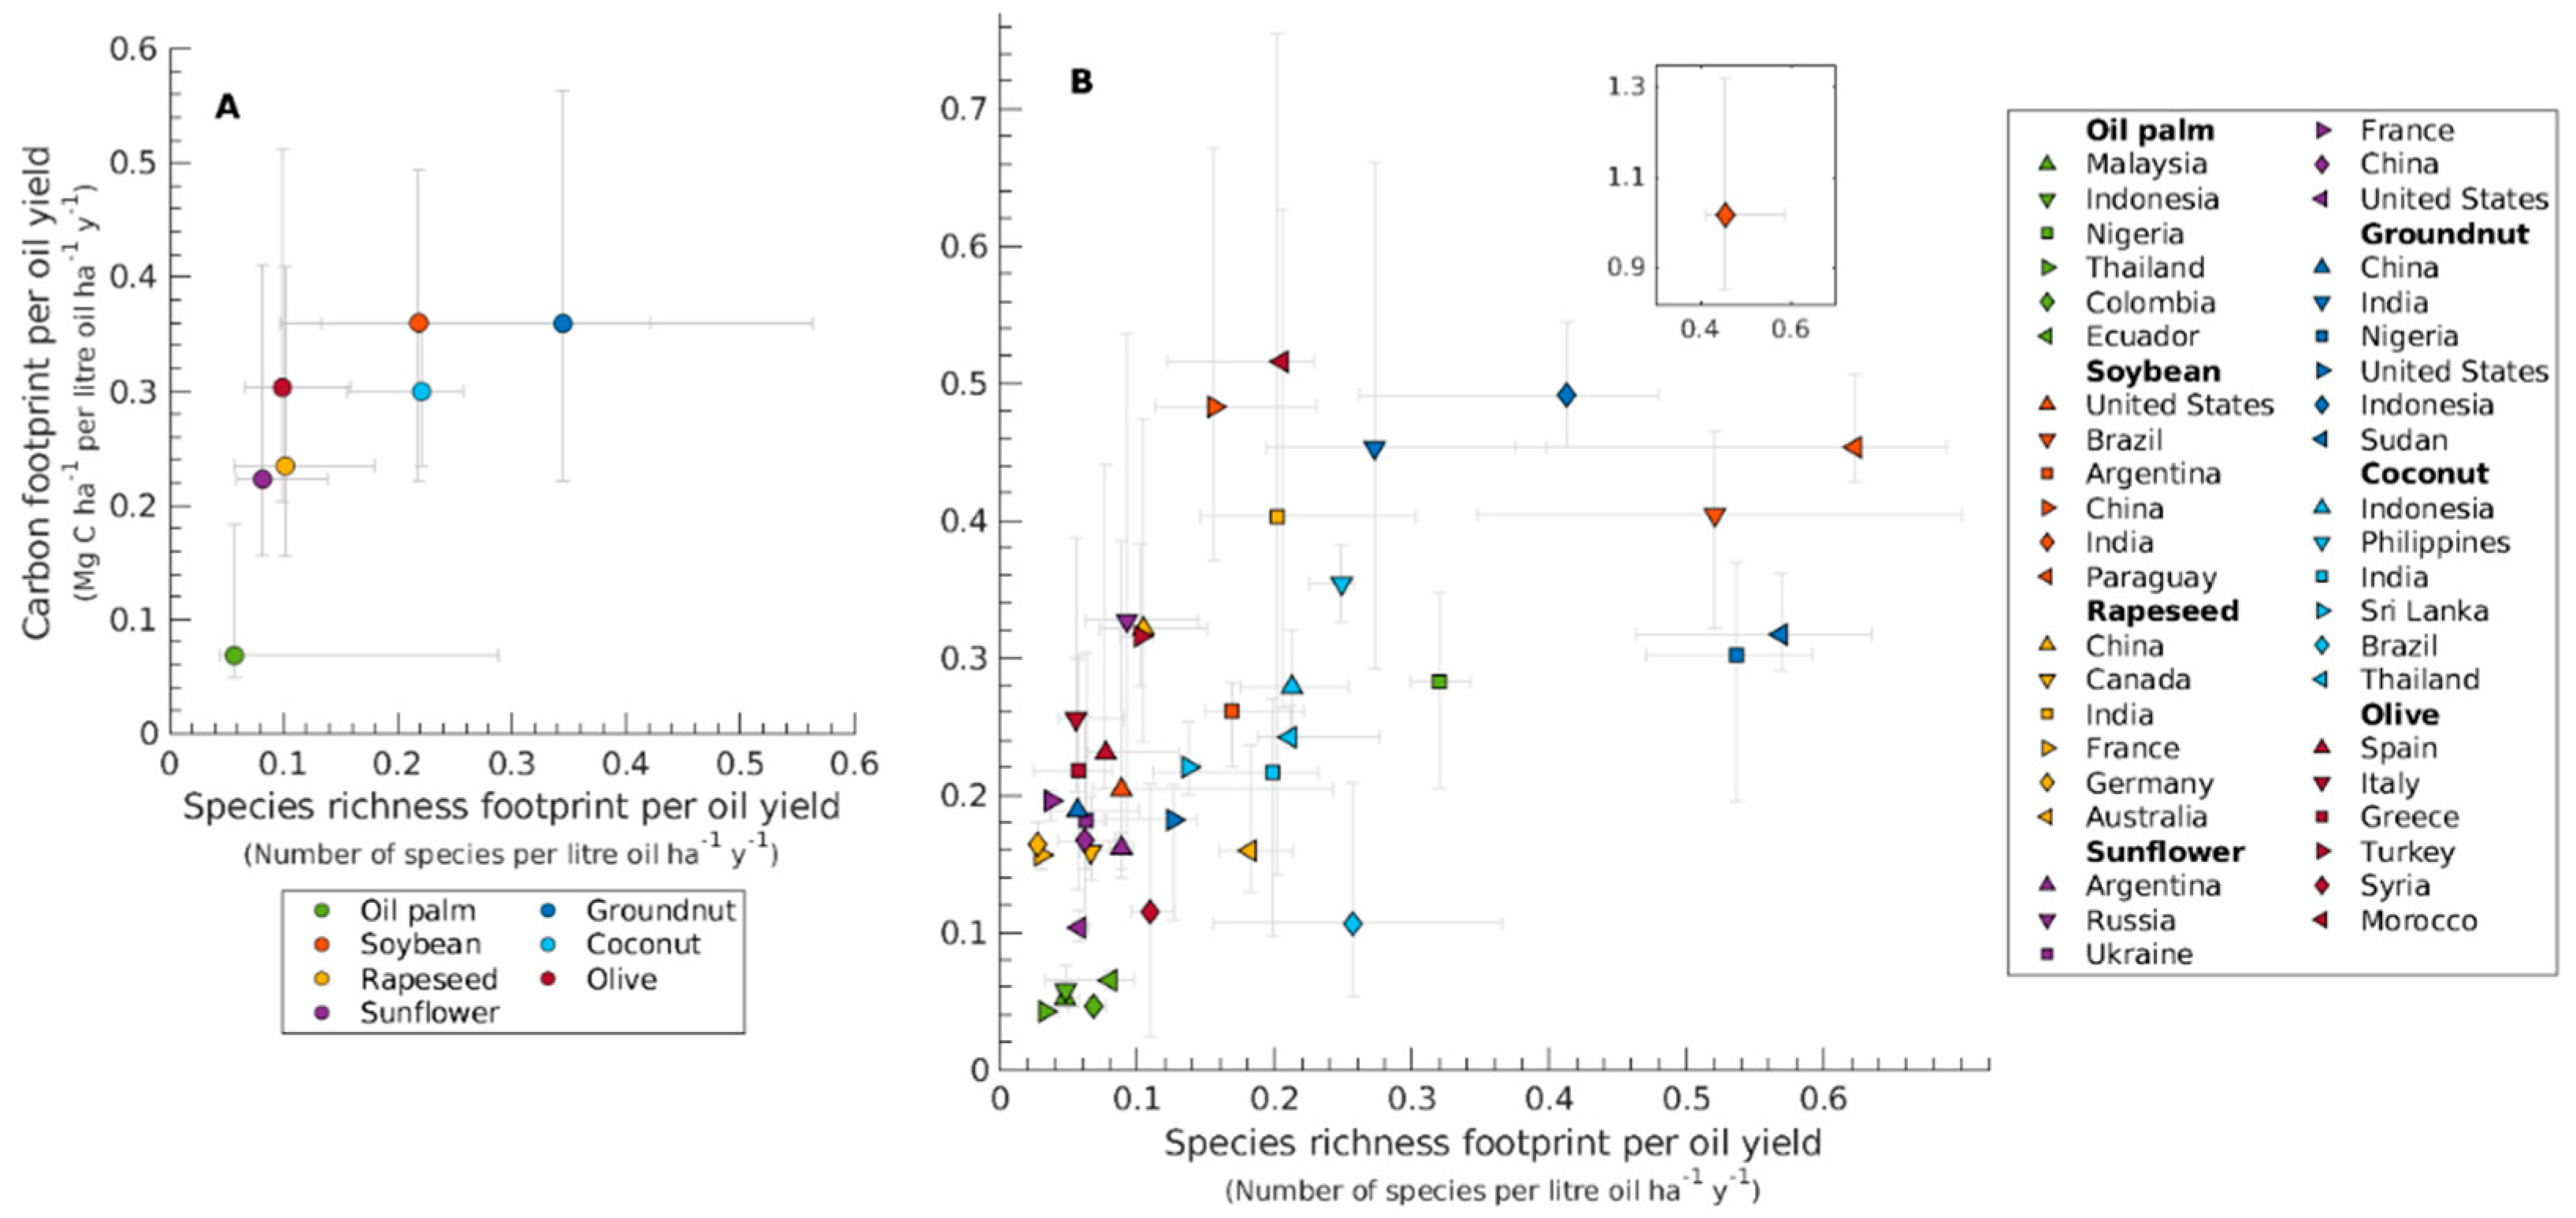
We estimate that, globally, oil palm has both the lowest average species richness and carbon footprint p.y. among the seven oil crops considered (Figure 1A). Compared to oil palm, average species richness and carbon footprints p.y., respectively, are estimated to be 284% and 425% higher for soybean, 79% and 242% higher for rapeseed, 44% and 225% higher for sunflower, 506% and 424% higher for groundnut, 288% and 337% higher for coconut, and 74% and 342% higher for olive. Thus, the differences between average species richness footprints p.y. between the four best-performing crops—oil palm, sunflower, rapeseed, and olive—are comparatively small, whilst the carbon footprint p.y. of oil palm is substantially lower than that of other oil crops. Despite a high variability in footprints p.y. across global growing areas (Figure 1A and Figure S2B,C), the differences in average footprints p.y. between crops are statistically significant in all cases (p < 0.001 for all crop pairs and both impact measures).
For each crop, differences in average environmental footprints p.y. between major producer countries are considerable (Figure 1B). For example, in the case of oil palm, both average species richness and carbon footprints p.y. are much lower in Southeast Asian producer countries than in Nigeria; similar differences between producing countries exist for other crops. Notably, the performance of different crops relative to each other, in terms of their footprints p.y., can differ from the global ranking in Figure 1A, depending on where they are grown. Whilst oil palm planted in five out of the six major palm oil-producing countries is associated with the lowest average carbon footprint p.y. out of all countries and crops considered in Figure 1B, species richness footprints p.y. of rapeseed grown in France and Germany and of sunflower grown in France are slightly lower than that of oil palm grown in Thailand, Malaysia, and Indonesia.
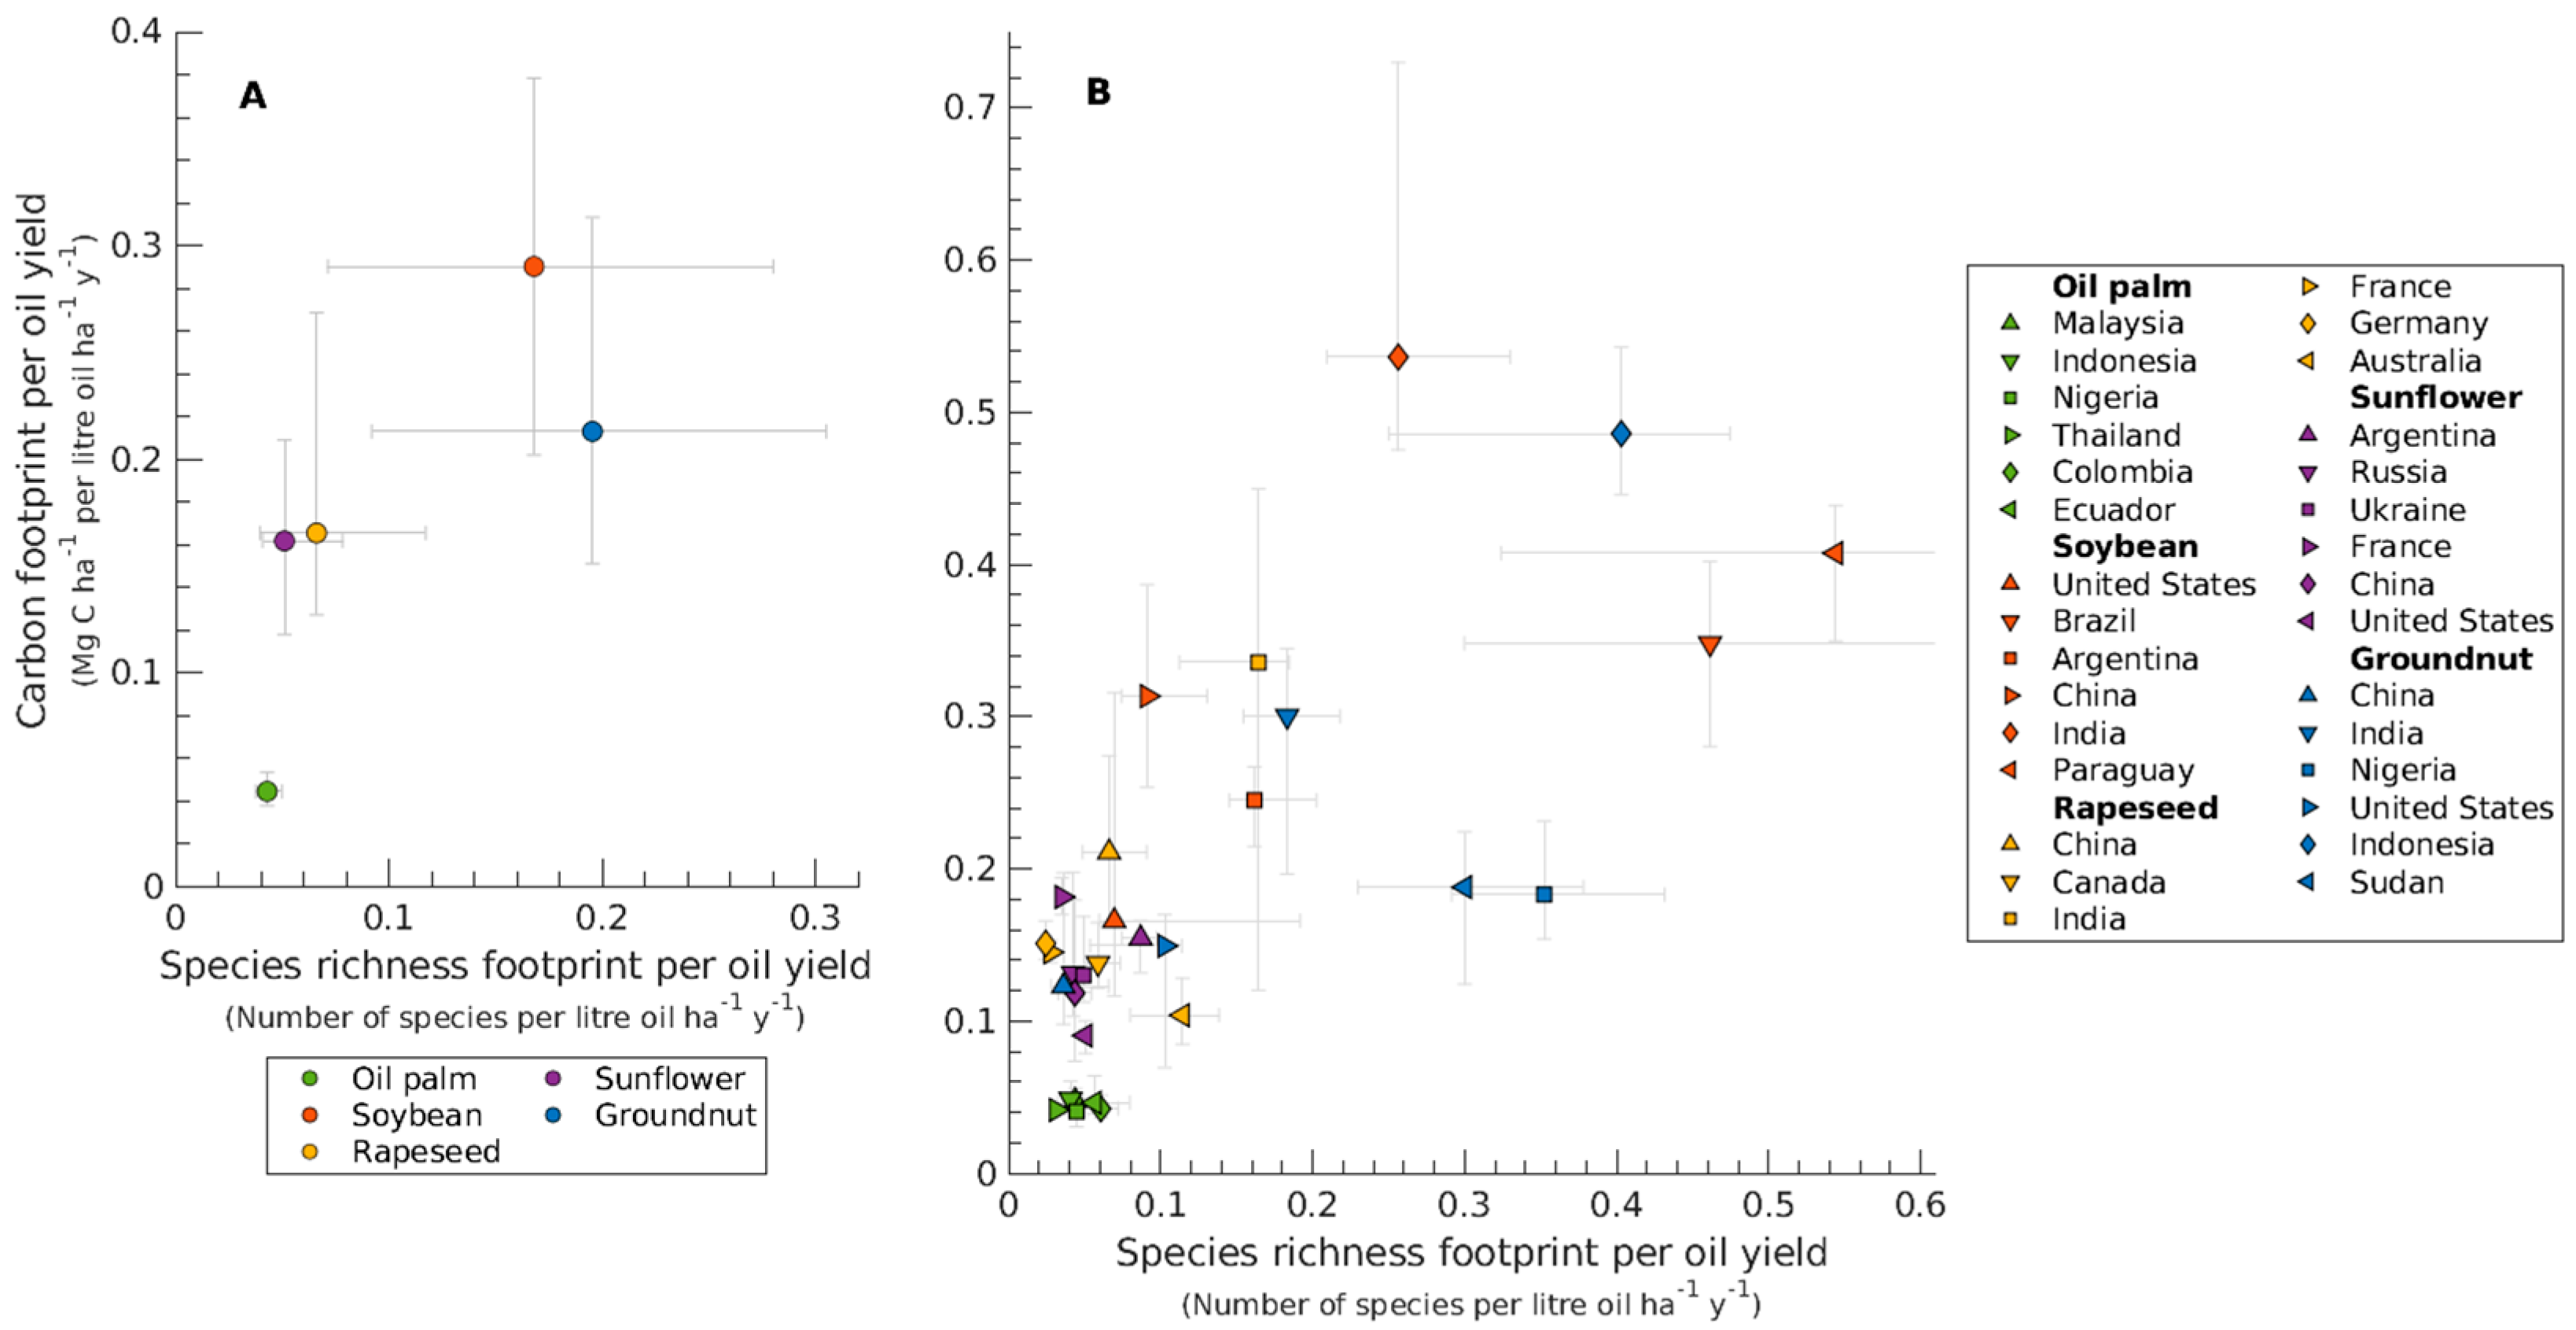
Closing agricultural yield gaps (i.e., the difference between observed and theoretically achievable yields) in oil crops could substantially reduce footprints p.y., both at the global scale and for most producer countries (Figure 2 and Figure S2). Estimated reductions in global average species richness and carbon footprints p.y., respectively, are 24% and 35% for oil palm, 23% and 19% for soybean, 35% and 30% for rapeseed, 37% and 28% for sunflower, and 43% and 41% for groundnut. Closing yield gaps would also decrease the variability of environmental footprints p.y. across global growing areas (Figure 2A), which is mirrored by average footprints p.y. of major producer countries of a given oil crop clustering more densely than in the case of observed yields. Notably, closing oil palm yield gaps in Nigeria would result in very similar species richness and carbon footprints p.y. as those of oil palm grown in Southeast Asia and South America, where yield gaps are comparatively small (Figure 2B).
4. Discussion
Our estimate that oil palm has the lowest average species richness and carbon footprint in relation to oil yield among the world’s seven major vegetable oil crops challenges suggestions that replacing palm oil in consumer products will necessarily reduce these impacts; indeed, such a strategy may have the opposite outcome. Our analysis highlights the importance of incorporating yields when comparing the environmental impacts of alternative oil crops, as per-hectare footprints can paint an incomplete picture.
The country-level estimates in Figure 1B and the differences between these and the global patterns in Figure 1A underline the crucial role of the growing location in determining the environmental footprints p.y. of oil crops [15,20,21]. Whilst average species richness and carbon footprints p.y. associated with oil palm produced in Southeast Asia and South America are among the lowest values estimated for the respective major producing countries of the seven crops considered, other oil crops grown in a number of countries currently outperform oil palm grown in Nigeria for both footprint metrics. These estimates of crop- and country-specific footprints p.y. provide important quantitative information for companies using vegetable oils in their products and for consumers aiming to reduce environmental impacts, while at the same time providing incentives for producer countries to optimise agricultural practices.
Our analysis reveals that the differences in average footprints p.y. between the major producer countries of each oil crop can to a large extent be explained by differences in crop management. This is notably the case for oil palm: based on observed yields, the average species richness and carbon footprints p.y. in Nigeria are an estimated order of magnitude higher than for oil palm grown in the Southeast Asian and South American producer countries considered here; however, closing oil palm yield gaps in Nigeria could decrease footprints p.y. to about the same level as that in the other major producer countries. Improved fertiliser use, in particular, has been shown to have high potential for increasing oil palm yields in West Africa [55]. Suboptimal fertliser application can also be limiting oil palm yields in other parts of the world, as can inefficient irrigation and pest control [56,57].
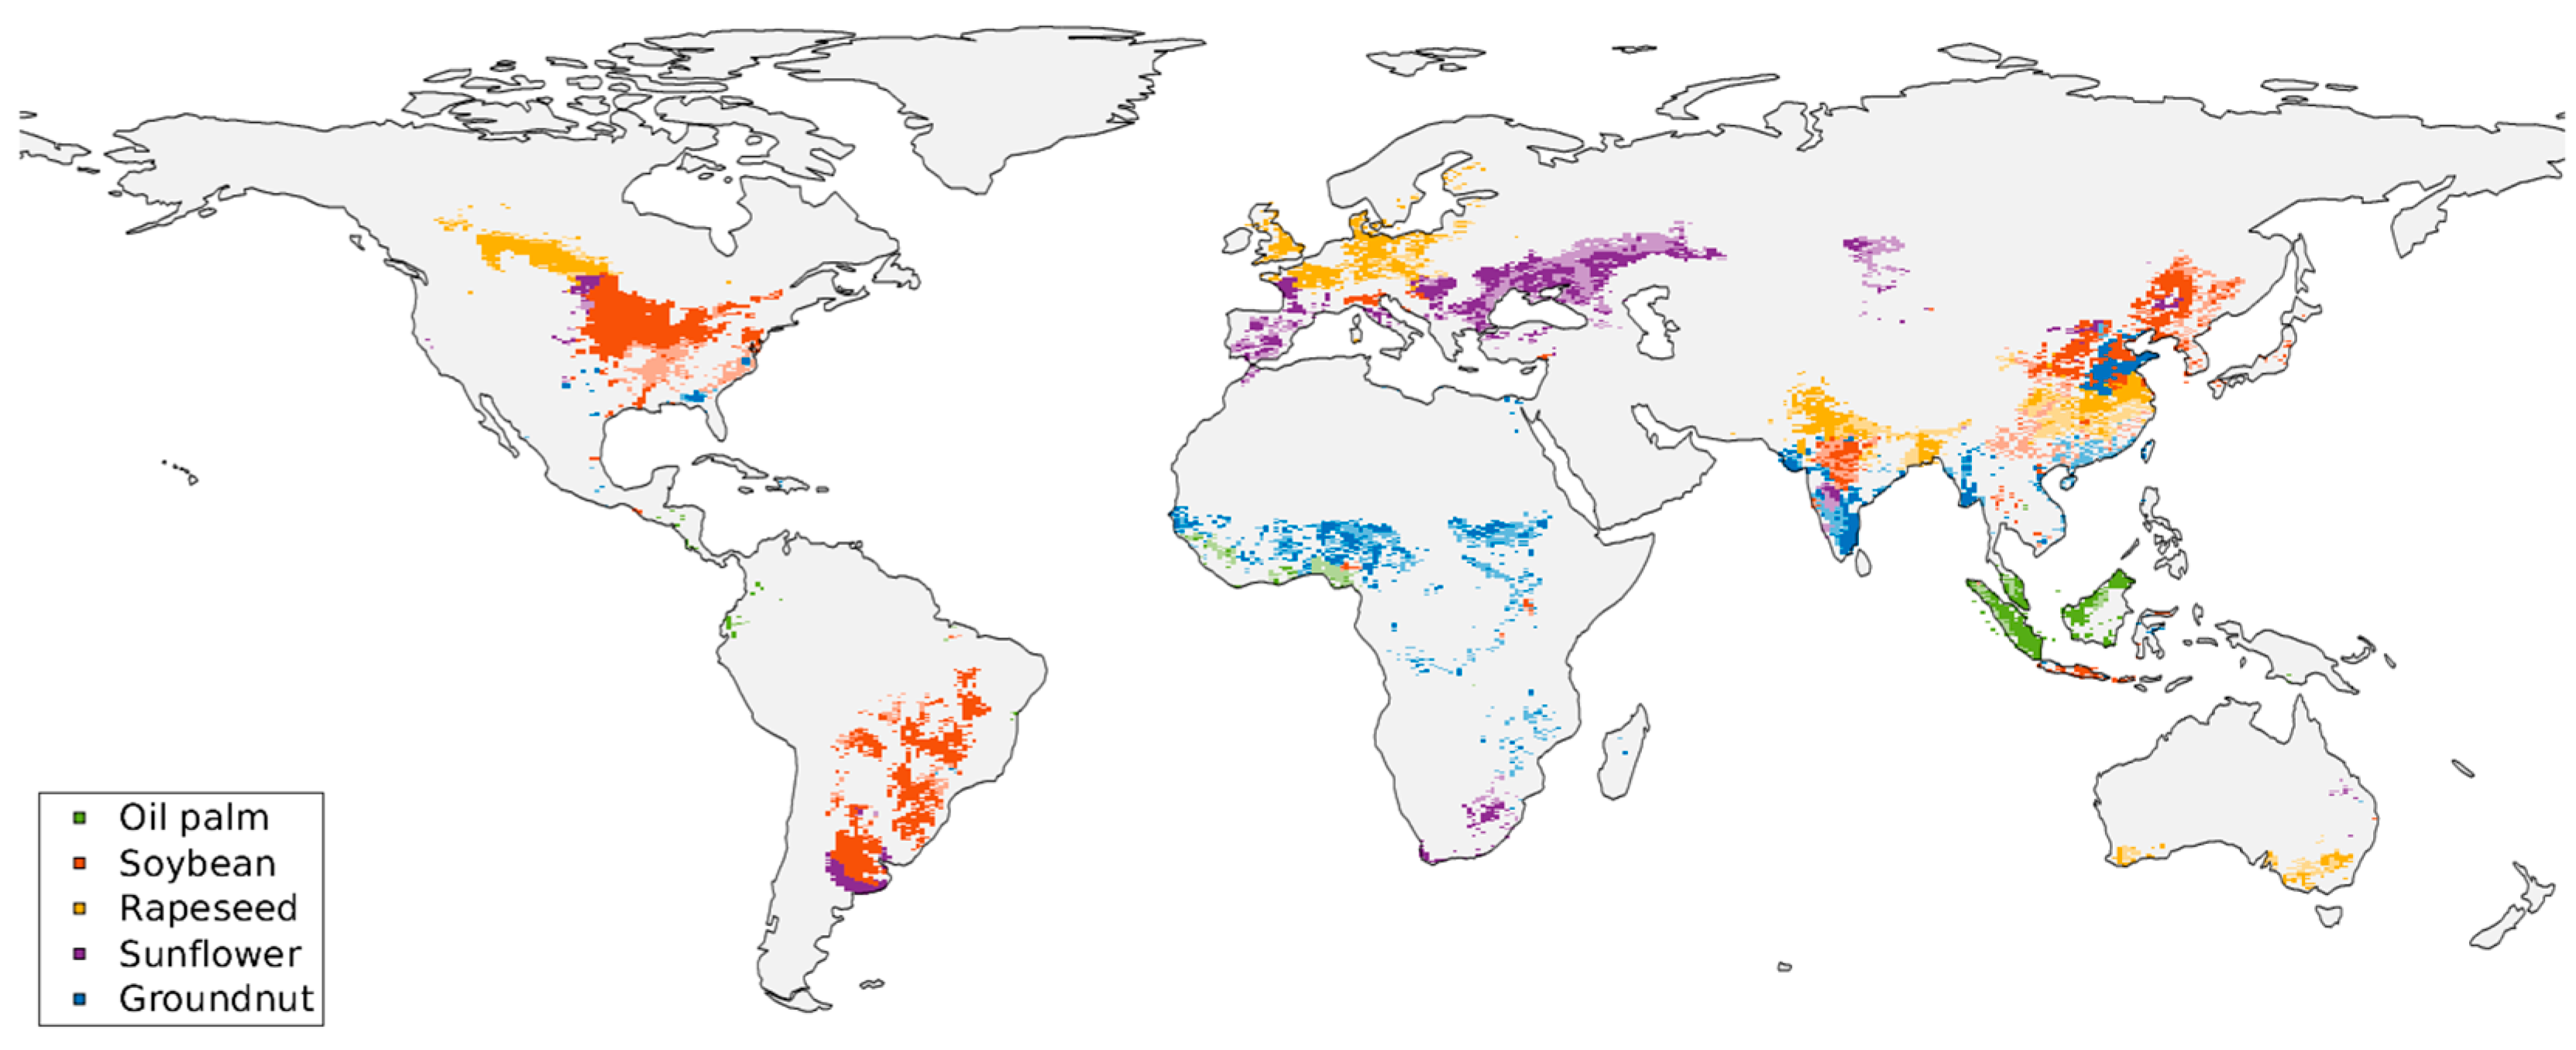
Closing yield gaps on existing oil cropping areas would increase the global production of oil palm by an estimated 54%, of soybean by 24%, of rapeseed by 37%, of sunflower by 48%, and of groundnut by 55%, according to the datasets of observed and potential yields used here [23,33]. At these levels of increase (and assuming similar levels for other oil crops for which potential yield estimates are not available), a fully optimised production could exceed the global demand for vegetable oil projected for the coming years, potentially even decades [15,16]. Substantial environmental benefits could be achieved while avoiding a scenario of overproduction if marginal growing areas, where footprints p.y. are particularly high (even for optimised yields), were abandoned and allowed to naturally regenerate—a key mechanism for reducing pressures on biodiversity [58,59] and increasing carbon sequestration [60]. Indeed, both species richness [61,62,63,64,65,66] and carbon stocks [63,64,67,68,69,70] on abandoned cropland can often approach pre-disturbance levels within several decades. Figure 3 shows areas where current oil cropland could be ecologically restored if the production on the remaining areas were increased to the theoretical maximum while each country’s total production of each oil crop remains unchanged. In this scenario, an estimated 30% of global oil cropping areas could be returned to nature. A range of policy instruments have proven successful at supporting farmers in closing yield gaps [23,27,28,71] and at encouraging strategic land abandonment for conservation in appropriate areas [28,72,73,74,75].
Whilst more recent global maps of harvested areas and yields than the ones used here are have been generated [76,77], these are available only for a smaller number of oil crops than those considered in our analysis. Uncertainty estimates do not exist either for crop maps or for the spatial datasets of carbon and species richness impacts used in our analysis; however, the large number of individual grid cells based on which the median footprints p.y. were computed (>105 data points for each crop) leads us to expect a high degree of robustness for our statistical estimates against potential uncertainties in the datasets.
Similar to [21], our assessment of environmental footprints, comparing crop-specific against natural conditions, is indifferent to land use history. Across crops, lower footprint estimates could, depending on location, be obtained if these were instead calculated in relation to the previous land cover type (though suitable global data on this are scarce). For example, species richness loss is significantly lower when oil palm replaces rubber plantations or logged forest as opposed to natural habitat [10]; however, this can provide a misleading picture of the true losses incurred in an area. This, of course, does not mean that future expansion of oil crops should not be prioritised on agriculturally degraded land rather than in natural habitats [10,14,78,79], given the importance of primary forests for preserving terrestrial biodiversity and carbon stocks [80,81].
Carbon and species richness losses are only two measures of the environmental impact of vegetable oil production; others can be relevant in political and consumer decision-making. Species richness loss, in particular, can be a useful measure of the loss of ecosystem functioning, but tends to poorly capture species extinction risks [82,83]. Indeed, the impact per unit oil produced annually on threatened species has recently been shown to be higher for oil palm than for the other crops considered here except for coconut and olive [21]. The compilation and analysis of additional measures of the environmental impacts of alternative oil crops are important to enable stakeholders to make informed decisions.
Consistent maps of the distribution of oil crops over time, to our knowledge currently available only for oil palm grown in Indonesia and Malaysia [84], would be a valuable resource to be combined with datasets of environmental footprints. Such data would allow identifying temporal trends in the impacts of different crops, monitoring progress in reducing them, and holding producer countries to commitments.
Further research is needed also to produce robust predictions of the socio-economic effects of shifts in the global demand for different vegetable oil types, notably in terms of how these would affect total oil production and land use [85] and the livelihoods of farmers, a very important dimension often neglected in the environmental debate [2].
In addition, a quantification of the costs and benefits of decreasing the consumption of vegetable oils altogether is needed to assess this strategy as a means to lower environmental impacts. Whilst reducing the global demand for vegetable oils would slow down the expansion of oil cropping areas, it is important to consider that oil crops and vegetable oils are often important ingredients in plant-based alternatives to meat or dairy products, which tend to have significantly lower environmental impacts than their animal-based analogues [86,87,88].
5. Conclusions
Our results emphasise the need for a more nuanced debate around the environmental footprint of global vegetable oil production. They provide quantitative evidence demonstrating that a simple substitution of palm oil with alternative vegetable oils in consumer products with the intention of reducing impacts may have unintended outcomes. Encouraging the sourcing of vegetable oils from producer countries where environmental footprints per oil yield are low, whilst improving agricultural practices to close yield gaps in oil crops as a means to minimise further land conversion and enable the restoration of marginal cropland, and restricting further crop expansion to long-term degraded areas are likely to achieve greater benefits.
Supplementary Materials
The following are available online at https://www.mdpi.com/2071-1050/13/4/1813/s1: Figure S1. Global oil cropping areas and footprints per oil yield in 2000. (A) Growing areas of the world’s seven largest oil crops (showing only the locally dominant crop and only areas where harvested areas are equal to at least 0.1% of the local area). (B) Carbon and (C) species richness footprint p.y. of the locally dominant oil crop. Figure S2. Differences between (A) global and (B) national average footprints per oil yield based on observed (transparent markers) and potential yields (opaque markers). For visual clarity, upper and lower quartile bars (shown in Figure 1 and Figure 2) are not displayed here.
Author Contributions
Conceptualisation, R.B. and T.R.; Formal analysis, R.B.; Investigation, R.B. and T.R.; Writing—original draft, R.B.; Writing—review & editing, R.B. and T.R. All authors have read and agreed to the published version of the manuscript.
Funding
Publication of this work was supported by the Tropical Forest Alliance. The funder had no role in the design, execution, interpretation, or writing of the study.
Conflicts of Interest
The authors declare no conflict of interest.
References
- Yan, W. A makeover for the world’s most hated crop. Nature 2017, 543, 306. [Google Scholar] [CrossRef] [Green Version]
- Meijaard, E.; Sheil, D. The Moral Minefield of Ethical Oil Palm and Sustainable Development. Front. For. Glob. Chang. 2019, 2. [Google Scholar] [CrossRef] [Green Version]
- Carrasco, L.; Larrosa, C.; Milner-Gulland, E.; Edwards, D.P. A double-edged sword for tropical forests. Science 2014, 346, 38–40. [Google Scholar] [CrossRef] [PubMed]
- Dislich, C.; Keyel, A.C.; Salecker, J.; Kisel, Y.; Meyer, K.M.; Auliya, M.; Barnes, A.D.; Corre, M.D.; Darras, K.; Faust, H.; et al. A review of the ecosystem functions in oil palm plantations, using forests as a reference system. Biol. Rev. 2017, 92, 1539–1569. [Google Scholar] [CrossRef] [PubMed]
- Germer, J.; Sauerborn, J. Estimation of the impact of oil palm plantation establishment on greenhouse gas balance. Environ. Dev. Sustain. 2007, 10, 697–716. [Google Scholar] [CrossRef]
- Reijnders, L.; Huijbregts, M. Palm oil and the emission of carbon-based greenhouse gases. J. Clean. Prod. 2008, 16, 477–482. [Google Scholar] [CrossRef]
- Chase, L.D.C.; Henson, I.E. A detailed greenhouse gas budget for palm oil production. Int. J. Agric. Sustain. 2010, 8, 199–214. [Google Scholar] [CrossRef]
- Carlson, K.M.; Curran, L.M.; Asner, G.P.; Pittman, A.M.; Trigg, S.N.; Adeney, J.M. Carbon emissions from forest conversion by Kalimantan oil palm plantations. Nat. Clim. Chang. 2013, 3, 283–287. [Google Scholar] [CrossRef]
- Fitzherbert, E.B.; Struebig, M.J.; Morel, A.; Danielsen, F.; A Brühl, C.; Donald, P.F.; Phalan, B. How will oil palm expansion affect biodiversity? Trends Ecol. Evol. 2008, 23, 538–545. [Google Scholar] [CrossRef] [PubMed]
- Koh, L.P.; Wilcove, D.S. Is oil palm agriculture really destroying tropical biodiversity? Conserv. Lett. 2008, 1, 60–64. [Google Scholar] [CrossRef]
- Danielsen, F.; Beukema, H.; Burgess, N.D.; Parish, F.; Brühl, C.A.; Donald, P.F.; Murdiyarso, D.; Phalan, B.; Reijnders, L.; Struebig, M.; et al. Biofuel Plantations on Forested Lands: Double Jeopardy for Biodiversity and Climate. Conserv. Biol. 2009, 23, 348–358. [Google Scholar] [CrossRef] [PubMed]
- Foster, W.A.; Snaddon, J.L.; Turner, E.C.; Fayle, T.M.; Cockerill, T.D.; Ellwood, M.D.F.; Broad, G.R.; Chung, A.Y.C.; Eggleton, P.; Khen, C.V.; et al. Establishing the evidence base for maintaining biodiversity and ecosystem function in the oil palm landscapes of South East Asia. Philos. Trans. R. Soc. B: Biol. Sci. 2011, 366, 3277–3291. [Google Scholar] [CrossRef] [Green Version]
- Savilaakso, S.; Garcia, C.; Garcia-Ulloa, J.; Ghazoul, J.; Groom, M.; Guariguata, M.R.; Laumonier, Y.; Nasi, R.; Petrokofsky, G.; Snaddon, J.; et al. Systematic review of effects on biodiversity from oil palm production. Environ. Evid. 2014, 3, 1–21. [Google Scholar] [CrossRef] [Green Version]
- Meijaard, E.; Garcia-Ulloa, J.; Sheil, D.; Wich, S.; Carlson, K.; Juffe-Bignoli, D.; Brooks, T. Oil palm and Biodiversity: A Situation Analysis by the IUCN Oil Palm Task Force; International Union for Conservation of Nature and Natural Resources (IUCN): Gland, Switzerland, 2018. [Google Scholar]
- Byerlee, D.; Falcon, W.P.; Naylor, R.L. The Tropical Oil Crop Revolution: Food, Feed, Fuel, and Forests; OUP USA: New York, NY, USA, 2016. [Google Scholar]
- Corley, R. How much palm oil do we need? Environ. Sci. Policy 2008, 12, 134–139. [Google Scholar] [CrossRef]
- Disdier, A.-C.; Marette, S.; Millet, G. Are consumers concerned about palm oil? Evidence from a lab experiment. Food Policy 2013, 43, 180–189. [Google Scholar] [CrossRef]
- Vergura, D.T.; Zerbini, C.; Luceri, B. “Palm oil free” vs “sustainable palm oil”: The impact of claims on consumer perception. Br. Food J. 2019, 121, 2027–2035. [Google Scholar] [CrossRef]
- Parsons, S.; Raikova, S.; Chuck, C.J. The viability and desirability of replacing palm oil. Nat. Sustain. 2020, 3, 412–418. [Google Scholar] [CrossRef]
- Beyer, R.M.; Durán, A.P.; Rademacher, T.T.; Martin, P.; Tayleur, C.; Brooks, S.E.; Coomes, D.; Donald, P.F.; Sanderson, F.J. The Environmental Impacts of Palm Oil and Its Alternatives. bioRxiv 2020. [Google Scholar] [CrossRef]
- Meijaard, E.; Abrams, J.F.; Juffe-Bignoli, D.; Voigt, M.; Sheil, D. Coconut oil, conservation and the conscientious consumer. Curr. Biol. 2020, 30, R757–R758. [Google Scholar] [CrossRef]
- Lobell, D.B.; Cassman, K.G.; Field, C.B. Crop Yield Gaps: Their Importance, Magnitudes, and Causes. Annu. Rev. Environ. Resour. 2009, 34, 179–204. [Google Scholar] [CrossRef] [Green Version]
- Mueller, N.D.; Gerber, J.S.; Johnston, M.; Ray, D.K.; Ramankutty, N.; Foley, J.A. Closing yield gaps through nutrient and water management. Nat. Cell Biol. 2012, 490, 254–257. [Google Scholar] [CrossRef] [PubMed]
- Van Ittersum, M.K.; Cassman, K.G.; Grassini, P.; Wolf, J.; Tittonell, P.; Hochman, Z. Yield gap analysis with local to global relevance—A review. Field Crop. Res. 2013, 143, 4–17. [Google Scholar] [CrossRef] [Green Version]
- Clay, J. Freeze the footprint of food. Nature 2011, 475, 287–289. [Google Scholar] [CrossRef]
- Tilman, D.; Balzer, C.; Hill, J.; Befort, B.L. Global food demand and the sustainable intensification of agriculture. Proc. Natl. Acad. Sci. USA 2011, 108, 20260–20264. [Google Scholar] [CrossRef] [PubMed] [Green Version]
- Phalan, B.; Green, R.; Balmford, A. Closing yield gaps: Perils and possibilities for biodiversity conservation. Philos. Trans. R. Soc. B: Biol. Sci. 2014, 369, 20120285. [Google Scholar] [CrossRef] [Green Version]
- Phalan, B.; Green, R.E.; Dicks, L.V.; Dotta, G.; Feniuk, C.; Lamb, A.; Strassburg, B.B.; Williams, D.R.; Zu Ermgassen, E.K.H.J.; Balmford, A. How can higher-yield farming help to spare nature? Science 2016, 351, 450–451. [Google Scholar] [CrossRef] [Green Version]
- Suh, S.; Johnson, J.A.; Tambjerg, L.; Sim, S.; Broeckx-Smith, S.; Reyes, W.; Chaplin-Kramer, R. Closing yield gap is crucial to avoid potential surge in global carbon emissions. Glob. Environ. Chang. 2020, 63, 102100. [Google Scholar] [CrossRef]
- Schmidt, J.H. Life cycle assessment of five vegetable oils. J. Clean. Prod. 2015, 87, 130–138. [Google Scholar] [CrossRef]
- West, P.C.; Gibbs, H.K.; Monfreda, C.; Wagner, J.; Barford, C.C.; Carpenter, S.R.; Foley, J.A. Trading carbon for food: Global comparison of carbon stocks vs. crop yields on agricultural land. Proc. Natl. Acad. Sci. USA 2010, 107, 19645–19648. [Google Scholar] [CrossRef] [Green Version]
- Chaplin-Kramer, R.; Sharp, R.P.; Mandle, L.; Sim, S.; Johnson, J.; Butnar, I.; Canals, L.M.I.; Eichelberger, B.A.; Ramler, I.; Mueller, C.; et al. Spatial patterns of agricultural expansion determine impacts on biodiversity and carbon storage. Proc. Natl. Acad. Sci. USA 2015, 112, 7402–7407. [Google Scholar] [CrossRef] [Green Version]
- Monfreda, C.; Ramankutty, N.; Foley, J.A. Farming the planet: Geographic distribution of crop areas, yields, physiological types, and net primary production in the year 2000. Glob. Biogeochem. Cycles 2008, 22. [Google Scholar] [CrossRef]
- Food and Agriculture Organization of the United Nations. Statistical Division, Technical Conversion Factors for Agricultural Commodities; Food and Agriculture Organization of the United Nations: Rome, Italy, 2000.
- Charrondiere, U.; Haytowitz, D.; Stadlmayr, B. FAO/INFOODS Density Database, version 2.0; Technical Workshop Report; Food and Agriculture Organization of the United Nations: Rome, Italy, 2012. [Google Scholar]
- Sanderman, J.; Hengl, T.; Fiske, G.J. Soil carbon debt of 12,000 years of human land use. Proc. Natl. Acad. Sci. USA 2017, 114, 9575–9580. [Google Scholar] [CrossRef] [Green Version]
- Houghton, R.A. The annual net flux of carbon to the atmosphere from changes in land use 1850–1990. Tellus B: Chem. Phys. Meteorol. 1999, 51, 298–313. [Google Scholar] [CrossRef] [Green Version]
- Guo, L.B.; Gifford, R.M. Soil carbon stocks and land use change: A meta analysis. Glob. Chang. Biol. 2002, 8, 345–360. [Google Scholar] [CrossRef]
- Murty, D.; Kirschbaum, M.U.; McMurtrie, R.E.; McGilvray, H. Does conversion of forest to agricultural land change soil carbon and nitrogen? A review of the literature. Glob. Chang. Biol. 2002, 8, 105–123. [Google Scholar] [CrossRef]
- Don, A.; Schumacher, J.; Freibauer, A. Impact of tropical land-use change on soil organic carbon stocks—A meta-analysis. Glob. Chang. Biol. 2010, 17, 1658–1670. [Google Scholar] [CrossRef] [Green Version]
- Laganière, J.; Angers, D.A.; Paré, D. Carbon accumulation in agricultural soils after afforestation: A meta-analysis. Glob. Chang. Biol. 2010, 16, 439–453. [Google Scholar] [CrossRef]
- Carlson, K.M.; Gerber, J.S.; Mueller, N.D.; Herrero, M.; Macdonald, G.K.; Brauman, K.A.; Havlik, P.; O’Connell, C.S.; Johnson, J.A.; Saatchi, S.; et al. Greenhouse gas emissions intensity of global croplands. Nat. Clim. Chang. 2017, 7, 63–68. [Google Scholar] [CrossRef]
- Lim, K.H.; Kim, S.S.; Parish, F.; Suharto, R. RSPO Manual on Best Management (BMPs) for Existing Oil Palm Cultivation on Peat; Round Table on Sustainable Palm Oil: Kuala Lumpur, Malaysia, 2013. [Google Scholar]
- Beyer, R.; Manica, A. Biodiversity Footprint Data of 175 Crops and Pasture at Country Level. Preprints 2021. Available online: https://www.preprints.org/manuscript/202101.0367/v1 (accessed on 8 February 2021).
- Jetz, W.; Wilcove, D.S.; Dobson, A.P. Projected Impacts of Climate and Land-Use Change on the Global Diversity of Birds. PLoS Biol. 2007, 5, e157. [Google Scholar] [CrossRef] [Green Version]
- Beyer, R.M.; Manica, A. Historical and projected future range sizes of the world’s mammals, birds, and amphibians. Nat. Commun. 2020, 11, 1–8. [Google Scholar] [CrossRef]
- BirdLife International, Handbook of the Birds of the World, Bird Species Distribution Maps of the World. 2016. Available online: http://datazone.birdlife.org/species/requestdis (accessed on 8 February 2021).
- IUCN. NatureServe, The IUCN Red List of Threatened Species. 2016. Available online: https://www.iucnredlist.org (accessed on 8 February 2021).
- Ramankutty, N.; Foley, J.A. Estimating historical changes in global land cover: Croplands from 1700 to 1992. Glob. Biogeochem. Cycles 1999, 13, 997–1027. [Google Scholar] [CrossRef]
- IUCN. IUCN Habitats Classification Scheme. 2014. Available online: https://www.iucnredlist.org/resources/habitat-classification-scheme (accessed on 8 February 2021).
- Phalan, B.; Fitzherbert, E.B.; Rafflegeau, S.; Struebig, M.J.; Verwilghen, A. Conservation in oil-palm landscapes. Conserv. Biol. 2009, 23, 244–245. [Google Scholar]
- Edwards, D.P.; Hodgson, J.A.; Hamer, K.C.; Mitchell, S.L.; Ahmad, A.H.; Cornell, S.J.; Wilcove, D.S. Wildlife-friendly oil palm plantations fail to protect biodiversity effectively. Conserv. Lett. 2010, 3, 236–242. [Google Scholar] [CrossRef]
- Struebig, M.J.; Paoli, G.; Meijaard, E. A reality check for designer biofuel landscapes. Trends Ecol. Evol. 2010, 25, 7–8. [Google Scholar] [CrossRef]
- MATLAB. Matlab R2020a; The MathWorks Inc.: Natick, MA, USA, 2020. [Google Scholar]
- Rhebergen, T.; Zingore, S.; Giller, K.E.; Frimpong, C.A.; Acheampong, K.; Ohipeni, F.T.; Panyin, E.K.; Zutah, V.; Fairhurst, T. Closing yield gaps in oil palm production systems in Ghana through Best Management Practices. Eur. J. Agron. 2020, 115, 126011. [Google Scholar] [CrossRef]
- Soliman, T.; Lim, F.K.S.; Lee, J.S.H.; Carrasco, L.R. Closing oil palm yield gaps among Indonesian smallholders through industry schemes, pruning, weeding and improved seeds. R. Soc. Open Sci. 2016, 3, 160292. [Google Scholar] [CrossRef] [PubMed]
- Woittiez, L.S.; Van Wijk, M.T.; Slingerland, M.; Van Noordwijk, M.; Giller, K.E. Yield gaps in oil palm: A quantitative review of contributing factors. Eur. J. Agron. 2017, 83, 57–77. [Google Scholar] [CrossRef]
- Strassburg, B.; Beyer, H.L.; Crouzeilles, R.; Iribarrem, A.; Barros, F.; De Siqueira, M.F.; Sánchez-Tapia, A.; Balmford, A.; Sansevero, J.B.B.; Brancalion, P.H.S.; et al. Strategic approaches to restoring ecosystems can triple conservation gains and halve costs. Nat. Ecol. Evol. 2019, 3, 62–70. [Google Scholar] [CrossRef]
- Strassburg, B.; Iribarrem, A.; Beyer, H.L.; Cordeiro, C.L.; Crouzeilles, R.; Jakovac, C.C.; Junqueira, A.B.; Lacerda, E.; Latawiec, A.E.; Balmford, A.; et al. Global priority areas for ecosystem restoration. Nat. Cell Biol. 2020, 586, 724–729. [Google Scholar] [CrossRef]
- Bastin, J.-F.; Finegold, Y.; Garcia, C.; Mollicone, D.; Rezende, M.; Routh, D.; Zohner, C.M.; Crowther, T.W. The global tree restoration potential. Science 2019, 365, 76–79. [Google Scholar] [CrossRef] [PubMed]
- Dunn, R.R. Recovery of Faunal Communities during Tropical Forest Regeneration. Conserv. Biol. 2004, 18, 302–309. [Google Scholar] [CrossRef]
- Jones, H.P.; Schmitz, O.J. Rapid Recovery of Damaged Ecosystems. PLoS ONE 2009, 4, e5653. [Google Scholar] [CrossRef] [PubMed]
- Gilroy, J.J.; Woodcock, P.; Edwards, F.A.; Wheeler, C.; Baptiste, B.L.G.; Uribe, C.A.M.; Haugaasen, T.; Edwards, D.P. Cheap carbon and biodiversity co-benefits from forest regeneration in a hotspot of endemism. Nat. Clim. Chang. 2014, 4, 503–507. [Google Scholar] [CrossRef]
- Meli, P.; Holl, K.D.; Benayas, J.M.R.; Jones, H.P.; Jones, P.C.; Montoya, D.; Mateos, D.M. A global review of past land use, climate, and active vs. passive restoration effects on forest recovery. PLoS ONE 2017, 12, e0171368. [Google Scholar] [CrossRef]
- Moreno-Mateos, D.; Barbier, E.B.; Jones, P.C.; Jones, H.P.; Aronson, J.; López-López, J.A.; McCrackin, M.L.; Meli, P.; Montoya, J.D.; Benayas, J.M.R. Anthropogenic ecosystem disturbance and the recovery debt. Nat. Commun. 2017, 8, 14163. [Google Scholar] [CrossRef] [PubMed]
- Rozendaal, D.M.A.; Bongers, F.; Aide, T.M.; Alvarez-Dávila, E.; Ascarrunz, N.; Balvanera, P.; Becknell, J.M.; Bentos, T.V.; Brancalion, P.H.S.; Cabral, G.A.L.; et al. Biodiversity recovery of Neotropical secondary forests. Sci. Adv. 2019, 5, eaau3114. [Google Scholar] [CrossRef] [PubMed] [Green Version]
- Silver, W.L.; Ostertag, R.; Lugo, A.E. The Potential for Carbon Sequestration through Reforestation of Abandoned Tropical Agricultural and Pasture Lands. Restor. Ecol. 2000, 8, 394–407. [Google Scholar] [CrossRef]
- Yang, Y.; Luo, Y.; Finzi, A.C. Carbon and nitrogen dynamics during forest stand development: A global synthesis. New Phytol. 2011, 190, 977–989. [Google Scholar] [CrossRef]
- Poorter, L.; Bongers, F.; Aide, T.M.; Zambrano, A.M.A.; Balvanera, P.; Becknell, J.M.; Boukili, V.; Brancalion, P.H.S.; Broadbent, E.N.; Chazdon, R.L.; et al. Biomass resilience of Neotropical secondary forests. Nature 2016, 530, 211–214. [Google Scholar] [CrossRef] [PubMed]
- Fu, Z.; Li, D.; Hararuk, O.; Schwalm, C.; Luo, Y.; Yan, L.; Niu, S. Recovery time and state change of terrestrial carbon cycle after disturbance. Environ. Res. Lett. 2017, 12, 104004. [Google Scholar] [CrossRef]
- Zhang, W.; Cao, G.; Li, X.; Zhang, H.; Wang, C.; Liu, Q.; Chen, X.; Cui, Z.; Shen, J.; Jiang, R.; et al. Closing yield gaps in China by empowering smallholder farmers. Nature 2016, 537, 671–674. [Google Scholar] [CrossRef]
- Van Buskirk, J.; Willi, Y. Enhancement of Farmland Biodiversity within Set-Aside Land. Conserv. Biol. 2004, 18, 987–994. [Google Scholar] [CrossRef]
- Lamb, D.; Erskine, P.D.; Parrotta, J.A. Restoration of Degraded Tropical Forest Landscapes. Science 2005, 310, 1628–1632. [Google Scholar] [CrossRef] [Green Version]
- Chazdon, R.L. Beyond Deforestation: Restoring Forests and Ecosystem Services on Degraded Lands. Science 2008, 320, 1458–1460. [Google Scholar] [CrossRef] [PubMed] [Green Version]
- Hua, F.; Wang, X.; Zheng, X.; Fisher, B.; Wang, L.; Zhu, J.; Tang, Y.; Yu, D.W.; Wilcove, D.S. Opportunities for biodiversity gains under the world’s largest reforestation programme. Nat. Commun. 2016, 7, 12717. [Google Scholar] [CrossRef] [PubMed] [Green Version]
- International Food Policy Research Institute. Global Spatially-Disaggregated Crop Production Statistics Data for 2010 Version 2. Harvard Dataverse V4. Available online: https://dataverse.harvard.edu/dataset.xhtml?persistentId=doi:10.7910/DVN/PRFF8V (accessed on 8 February 2021).
- Frolking, S.; Wisser, D.; Grogan, D.; Proussevitch, A.; Glidden, S. GAEZ+_2015 Crop Production. Harvard Dataverse V2. 2020. Available online: https://dataverse.harvard.edu/dataverse/GAEZ_plus_2015;jsessionid=8e89bcad5b094e99ede8ba1ff760 (accessed on 8 February 2021).
- Gibbs, H.K.; Johnston, M.; Foley, J.A.; Holloway, T.; Monfreda, C.; Ramankutty, N.; Zaks, D. Carbon payback times for crop-based biofuel expansion in the tropics: The effects of changing yield and technology. Environ. Res. Lett. 2008, 3, 034001. [Google Scholar] [CrossRef]
- Gibbs, H.K.; Salmon, J. Mapping the world’s degraded lands. Appl. Geogr. 2015, 57, 12–21. [Google Scholar] [CrossRef]
- Luyssaert, S.; Schulze, E.-D.; Börner, A.; Knohl, A.; Hessenmöller, D.; Law, B.E.; Ciais, P.; Grace, J.D. Old-growth forests as global carbon sinks. Nat. Cell Biol. 2008, 455, 213–215. [Google Scholar] [CrossRef]
- Gibson, L.; Lee, T.M.; Koh, L.P.; Brook, B.W.; Gardner, T.A.; Barlow, J.; Peres, C.A.; Bradshaw, C.J.A.; Laurance, W.F.; Lovejoy, T.E.; et al. Primary forests are irreplaceable for sustaining tropical biodiversity. Nat. Cell Biol. 2011, 478, 378–381. [Google Scholar] [CrossRef]
- Cardinale, B.J.; Duffy, J.E.; Gonzalez, A.; Hooper, D.U.; Perrings, C.; Venail, P.; Narwani, A.; Mace, G.M.; Tilman, D.; Wardle, D.A.; et al. Biodiversity loss and its impact on humanity. Nat. Cell Biol. 2012, 486, 59–67. [Google Scholar] [CrossRef] [PubMed]
- Dornelas, M.; Gotelli, N.J.; McGill, B.; Shimadzu, H.; Moyes, F.; Sievers, C.; Magurran, A.E. Assemblage Time Series Reveal Biodiversity Change but Not Systematic Loss. Science 2014, 344, 296–299. [Google Scholar] [CrossRef] [Green Version]
- Xu, Y.; Yu, L.; Li, W.; Ciais, P.; Cheng, Y.; Gong, P. Annual oil palm plantation maps in Malaysia and Indonesia from 2001 to 2016. Earth Syst. Sci. Data 2020, 12, 847–867. [Google Scholar] [CrossRef] [Green Version]
- Villoria, N.; Golub, A.; Byerlee, D.; Stevenson, J. Will Yield Improvements on the Forest Frontier Reduce Greenhouse Gas Emissions? A Global Analysis of Oil Palm. Am. J. Agric. Econ. 2013, 95, 1301–1308. [Google Scholar] [CrossRef]
- Nilsson, K.; Flysjö, A.; Davis, J.; Sim, S.; Unger, N.; Bell, S. Comparative life cycle assessment of margarine and butter consumed in the UK, Germany and France. Int. J. Life Cycle Assess. 2010, 15, 916–926. [Google Scholar] [CrossRef]
- Joshi, V.; Kumar, S. Meat Analogues: Plant based alternatives to meat products- A review. Int. J. Food Ferment. Technol. 2015, 5, 107. [Google Scholar] [CrossRef]
- Kumar, P.; Chatli, M.K.; Mehta, N.; Singh, P.; Malav, O.P.; Verma, A.K. Meat analogues: Health promising sustainable meat substitutes. Crit. Rev. Food Sci. Nutr. 2017, 57, 923–932. [Google Scholar] [CrossRef]
Figure 1.
Species richness and carbon footprints per oil yield of the world’s seven major oil crops. Each coloured marker represents the median of the distribution of footprints p.y. across (A) global and (B) national growing areas of the relevant crop in 2000. Grey uncertainty bars represent the upper and lower quartiles of these distributions. Country-specific estimates in (B) are shown for the six largest producer countries of each oil crop.

Figure 2.
Species richness and carbon footprints per oil yield assuming theoretically achievable crop yields. Coloured markers and grey uncertainty bars represent medians and upper and lower quartiles, respectively, of the distributions of footprints p.y. across (A) global and (B) national growing areas in 2000. Estimates for coconut and olive are not included, as potential yield data for these crops are not included in the dataset used here. The changes between average footprints p.y. in this figure and Figure 1 are shown in Figure S2.

Figure 3.
Potential for landscape restoration of closing yield gaps on oil croplands. Coloured areas represent global oil cropping areas of the five largest crops in 2000 (cf. Figure S1A). Each country’s total production of each oil crop would remain unchanged if yields on opaque areas were increased to the local theoretically achievable level while transparent areas were abandoned and allowed to regenerate. The latter areas are the ones for which footprints p.y. (defined here using a combined impact measure that weights carbon and species richness equally), based on potential yields, are highest.

Publisher’s Note: MDPI stays neutral with regard to jurisdictional claims in published maps and institutional affiliations. |
© 2021 by the authors. Licensee MDPI, Basel, Switzerland. This article is an open access article distributed under the terms and conditions of the Creative Commons Attribution (CC BY) license (http://creativecommons.org/licenses/by/4.0/).
Share and Cite
MDPI and ACS Style
Beyer, R.; Rademacher, T. Species Richness and Carbon Footprints of Vegetable Oils: Can High Yields Outweigh Palm Oil’s Environmental Impact? Sustainability 2021, 13, 1813. https://doi.org/10.3390/su13041813
AMA Style
Beyer R, Rademacher T. Species Richness and Carbon Footprints of Vegetable Oils: Can High Yields Outweigh Palm Oil’s Environmental Impact? Sustainability. 2021; 13(4):1813. https://doi.org/10.3390/su13041813
Chicago/Turabian StyleBeyer, Robert, and Tim Rademacher. 2021. "Species Richness and Carbon Footprints of Vegetable Oils: Can High Yields Outweigh Palm Oil’s Environmental Impact?" Sustainability 13, no. 4: 1813. https://doi.org/10.3390/su13041813
Note that from the first issue of 2016, this journal uses article numbers instead of page numbers. See further details here.