
Rethinking Corporate Responsibility and Sustainability in Light of Economic Performance


1
Department of Economics, Accounting and International Business, University of Craiova, 200585 Craiova, Romania
2
Department of Management, Marketing and Business Administration, University of Craiova, 200585 Craiova, Romania
3
Synario–PFM, Philadelphia, PA 19103, USA
4
Doctoral School, University of Craiova, 200585 Craiova, Romania
*
Author to whom correspondence should be addressed.
Sustainability 2021, 13(5), 2660; https://doi.org/10.3390/su13052660
Submission received: 31 January 2021
/
Revised: 15 February 2021
/
Accepted: 18 February 2021
/
Published: 2 March 2021
(This article belongs to the Special Issue Sustainable Development Goals through Corporate Social Responsibility)
Abstract
:Concepts of ethical behavior and corporate social responsibility have emerged in recent years due to organizations’ increasing ethical problems. Business ethics, social responsibility, and corporate governance are significant drivers for organizational performance, growth, and sustainable development (SD). In this paper, we propose an original tool, at a macroeconomic level, for the integration of concepts such as business ethics (BE), corporate social responsibility (CSR), and corporate governance (CG). The paper also seeks to establish the relationships among corporate responsibility dimensions (CR), sustainability, and economic performance. This research used the Sustainable Development Report 2020, Candriam’s ESG Country Report, World Bank Doing Business 2020 Report, World Bank national accounts data, and Eurostat as data sources. As part of the research, we selected the European Union states (27) plus the United Kingdom. The main results reveal the positive direct and indirect influences of corporate responsibility on economic performance, ultimately leading to sustainable development.
1. Introduction
Humanity is facing a global crisis involving multiple dimensions, threatening human society and the natural environment. The evolution of the global economy and society is unsustainable in the long term if current trends are maintained. Therefore, it is necessary to identify those trends that can transform the economy and society in general and put them on a sustainable path. Meanwhile, society’s demands on organizations aim for good coherent governance; solid business ethics; and proactive, socially responsible policies. Ethics, by its very nature, is part of each individual’s and group’s behavior, generating a hierarchy of values and ways in which individuals and groups can respect generally accepted principles and values. The values of organizations must be instilled in all employees and reflected in ethical business conduct. Likewise, employees should be aware of the impact and consequences of unethical behavior.
In the modern economy, a gap between an organization’s ethical and socially responsible policies and the practical integration of these policies underlying values in everyday operations is evident. However, the general public perceives an ethical organization differently, enabling a strategic competitive advantage to be gained in the market, revealing and communicating its values to stakeholders. Good governance, (CSR) programs, and ethics policies represent parts of an organization’s corporate responsibility. They can only really be implemented in the organization’s DNA if management can develop a clear sustainability idea. The results of good corporate governance (CG) and the organization’s ethical and responsible behavior ensure its sustainability in its three vectors: the economic vector, the social vector, and the environmental vector.
Employees should define themselves as key stakeholders involved in CSR initiatives, as they can serve as social change agents when they pressure their employers to adopt responsible social behavior [1]. In any case, selecting key employees is crucial when the organization seeks to ensure effective operational programs and CSR policies. Therefore, CSR, ethical principles, and good business governance must permeate an organization’s life from the highest management levels and be a fundamental component of its strategic plans.
CSR, business ethics (BE), and good CG must also penetrate organizational structures at all employee levels to ensure a high degree of corporate responsibility (CR) and sustainable development (SD). Both managers and subordinates must be responsible for their ethical conduct in the workplace. A standard set of values must be incorporated at the employee level and introduced through codes of conduct and ethics programs with strong CSR links. The principles must be formalized and intelligibly written if management hopes to achieve employee compliance [2]. When consumers, employees, and other stakeholders receive inaccurate information about a company’s operation and neglect its ethics and CSR, this negatively reflects image, reputation, and sustainability.
In this paper, we will look at how to integrate BE concepts, CSR, and CG into a common construct (corporate responsibility); the relationships established among these corporate responsibility dimensions, both separately and combined; sustainability; and economic performance.
This paper contains five sections. Following the introduction, Section 2 presents a literature review. Section 3 includes information on the variables, research methodology, and hypothesis. Section 4 presents the main findings and discussions. Section 5 proposes an integrative corporate responsibility approach to ensure organizations’ SD, and Section 6 aggregates the research conclusions.
2. Literature Review
2.1. Sustainable Development
Sustainability has been formally recognized as a concept only in the last half century, with scientific contributions on this subject emerging in the late 1970s. Over time, many fundamental principles, theories, and definitions have been set out in models, methodologies, and tools. Their use allows a better understanding of what sustainability means in practice by translating scientific concepts and definitions into practical models for the application and assessment of economic sustainability [3]. Within modern society, the main factors of production essential to the sustainable functioning of the economy are labor (human capital), the environment (natural capital providing the resources necessary to carry out any productive economic activity), and financial capital (the instrument that allows the combination of the other two inputs in optimal proportions to obtain finished products). The three fundamental factors of production correspond to three vectors or forces acting in the economy: social vectors, environmental vectors, and economic vectors (business environment), also known as the “triple bottom line” [4]. In recent years, many global and regional sustainability initiatives have emerged that have coagulated professionals from different disciplines (Sardain et al., 2016). Although sustainability research has made significant progress in many areas and integrates knowledge from various sciences—social, economic, and social—it must continue to take interdisciplinary steps [5]. Ramos [6] pointed out that SD should be based on non-traditional aspects, such as objectives and uncertainties, ethics, cultural dimensions, aesthetics, and general non-material values (e.g., solidarity, compassion, mutual aid).
Since its inception, SD has been at the heart of the European project, with the EU Treaties treating economic, social, and environmental dimensions as interconnected. The EU’s first sustainability strategy was launched in 2001 and revised in 2006 and 2009. Since 2010, SD has been integrated into the Europe 2020 strategy. The adoption of the 2030 Agenda for Sustainable Development at the 70th UN General Assembly on 25 September 2015, marked a critical moment for global SD. The EU has played a vital role in shaping the 2030 Global Agenda, which is entirely in line with Europe’s vision and has become the global SD model. The 2030 Agenda integrates the three dimensions of—economic, social, and environmental—SD in a balanced way. The 17 Sustainable Development Goals (SDGs) of the 2030 Agenda contain qualitative and quantitative targets that direct the Member States’ convergence process [7]. Under the 2030 Agenda, sustainability is detailed by the many objectives deriving from the three pillars (vectors or dimensions) of sustainability. Through the framework of indicators accompanying the 17 goals, the 2030 Agenda focuses on implementing measures, also representing a significant increase in the degree of complexity in possible interactions between the factors in the three vectors.
Josephsen [8] believes that global sustainability is a vision of a better world in terms of eradicating poverty. People’s levels and quality of life are continuously increasing, and the planet is protected. The 2030 Agenda for Sustainable Development (SD), adopted in 2015, addresses global issues crucial to global SD. The 17 SDGs represent a leap forward in the evolution towards global sustainability [9]. The SDG implementation framework provides an indispensable platform for achieving the central objective: global sustainability. Lehtonen, M. [10] also considers that integrating the three dimensions of sustainability is more comfortable and more ‘natural’ at a local level, in concrete contexts, and on a scale enabling the necessary resources to be identified. However, the challenge is to develop frameworks to increase communication and the assignment of responsibilities between local and national levels, between the public and private sectors. International organizations play a crucial role in setting the framework at a national level, and national institutions play an essential role in establishing the local framework of action. Still, it is the organizations that are the basis for achieving the SDG.
Stable interconnection between objectives and targets fosters a large number of possible intervention interactions [5]. If an intervention is directed to a specific target or goal, its effects may result in several other targets and goals. As a result of the significant interconnection, any changes can, in turn, cause changes in other marks. Therefore, we believe that it is necessary to establish intricate patterns of interactions that optimally facilitate implementation. The complexity of interaction models requires applying a systemic approach to implementing SDGs, ensuring that implementation must address all SDGs and targets in an integrated way [11]. Coopman et al. [12], on the other hand, considers it more important to analyze the implications of the indivisibility of SDGs by identifying their interconnections and assessing their power. In this paper, we propose a third model of interactions: between CR (integrating CSR, CG, BE), sustainability (the totality of SDGs and targets seen as a system), and economic performance.
2.2. Interconnecting Corporate Responsibility and Sustainability Development
Relationships among CSR, CG, BE, and sustainability are complex, requiring several integrated models to be better understood [13,14,15,16,17,18,19,20,21]. Management literature has tried to explain the relationship among CSR, CG, and BE using policy and strategy as moderators. It provided definitions and typologies of strategic behaviors in CSR, CG, and BE. Managerial researchers have demonstrated how management practices and organizational strategy depend on how organizations to focus on sustainability.
Concerning good CG, corporations are formed based on the principle of the division of ownership and control [13]. The investor or owner relies on the manager to conduct the business on his behalf, implying a principal–agent relationship between the investor and the manager. There is always a gap between the manager and the investors’ knowledge. This situation requires good governance on the part of managers, which means that CG involves transparency in the first place. Shareholders must receive complete and accurate information from managers [15]. There should be transparency in processes so that the agent (manager) cannot mismanage or take advantage of asymmetric information.
Good governance’s objective is to have such an effective control and management system to protect the owner’s interest. For this to be successful, any obstacle in the processes must disappear. Procedures are necessary to forbid the manager from promoting his agenda or self-interest—i.e., the manager working as an agent may have his own goals, which are not in line with the organizational goals. These processes that protect the owner’s interest must be institutionalized to maximize investors’ profit and capital. Therefore, managers’ ethics concerning owners leads to good governance, which means better profits. It is essential to make profits within an ethical framework. In recent decades, there has been a change in investors’ psychology. They are curious to know how much profit the organization has made and how it made it—i.e., in an ethical or unethical manner [16].
CSR fulfills the organization’s responsibility to all of its stakeholders. The concept of social responsibility is ethical [21]. It involves integrating human well-being notions into the business model and underlines a concern for its social dimension. CSR provided a way for businesses to be concerned with these social dimensions and pay some attention to its social impact on its environment [14].
Business ethics is an essential philosophical construct in the business sector. It needs to be strengthened, as the organization’s stakeholders, especially employees, pay special attention to ethical values and ethical behaviors [20].
CSR, CG, and BE are closely related concepts [20,21,22,23,24,25,26,27,28,29,30,31,32]. There are two schools of thought about the relationship between these concepts and how they should be applied [18]. The first proposes to limit the scope of BE (Anglo-Saxon view), which contrasts with socially responsible approaches (European perspective). The second model suggests a mix of CSR, CG, and BE, resulting in long-term sustainability [19]. From a practical point of view, there are connections between two schools of thought because a socially responsible company with a CSR policy and fair governance should be an ethical company. A right company should be socially accountable [33]. To sum up, the literature suggests that well-governed companies have ethical principles that are transposed into codes of ethics and conduct and are more likely to adopt practices in the area of CSR [34,35,36].
Sustainability is the final result of corporate responsibility (a concept we grouped into CSR, CG, and BE). With the publication of the Sustainable Development Goals (SDGs) as part of the UN 2030 Agenda for Sustainable Development, the sustainability vision has progressed to the point where the organization’s role in ensuring sustainability is inseparable [37]. Creating shared value has become an integral part of organizational responsibility and strategies that modifies corporate responsibility outcomes and how corporate responsibility is put into practice [38]. By aligning business strategies and models with the SDGs, organizational leaders rethink investment policies to maximize their value for the organization and society to ensure SD [39]. Implementing sustainable procedures can also help organizations reduce risks, identify opportunities, and drive innovative long-term solutions. Until now, studies have not been able to demonstrate unequivocally whether SD drivers could negatively or positively affect corporate outcomes [37,38,39]. Still, relevant studies have shown indirect influences of CSR, ethics, and CG on economic performance [40,41,42,43,44,45,46,47,48,49].
In the paper, we propose corporate responsibility to expand the concept of business ethics as a term that integrates three dimensions: good CG, CSR, and BE. Business ethics has become a determining factor in business governance. We will analyze the relationships between the three individual dimensions and integrate them into a common construct: corporate responsibility The analysis of these relations is performed at the macroeconomic level. In this sense, we chose the variables that illustrate the corporate responsibility synthetic indices calculated at the country level. For the economic performance variable, we used a usual synthetic indicator calculated at the level of each country: GDP.
3. Research Methodology
3.1. Sample Selection and Variables
To assess the relationships established between the dimensions of corporate responsibility (BE, CSR, CG) and the economic performance of organizations, we used data collected from the following sources: Sustainable Development Report 2020, Candriam’s ESG Country Report, World Bank Doing Business 2020 Report, World Bank national accounts data, and Eurostat.
Sustainable Development Report 2020 [50] includes the SDG Index and Dashboards, which is the best-known tool to assess the country level in achieving the SDGs proposed by the 2030 Agenda. The SDG Index is an unofficial tool based on data from official sources (World Bank, WHO, ILO) and other non-governmental organizations. The SDG Index is used in the research context to illustrate the sustainability variable (S).
Candriam’s ESG Country Report [51] supplies an ESG country score calculated using a weighted average model. Candriam assesses the Environmental, Social, and Governance (ESG) factors report, ensuring organizations’ and countries’ ethical business behavior. The four components of ESG policies considered by the ESG Country Report are Human Capital, Natural Capital, Social Capital, and Economic Capital. The ESG country score is used in research to illustrate the Corporate Social Responsibility (CSR) variable.
To illustrate Business Ethics and Corporate Governance, we will use two indicators calculated by the World Bank in the Doing Business 2020 report. There are no indices calculated at the macroeconomic level for each country.
The World Bank Doing Business 2020 Report [52] provides a valuable tool to assess the ease with which business is conducted in different countries while being a tool that can determine the level of ethics in dealing in other states. The EDB (ease of doing business score) scores benchmark economies concerning regulatory best practices, showing the proximity to the best ethics principles, relating to business initiation and complying with ethical norms, rules, and values. EDB scores are used in the context of research to illustrate the Business Ethics (BE) variable.
A partial score calculated under the World Bank Doing Business 2020 Report [52] aims to protect minority investors, representing a tool that can assess various states’ corporate governance levels. Within the PMI (protecting minority investors), the following components are included: disclosure, directory liability, shareholder suits, shareholder rights index, ownership and control, and corporate transparency index. PMI (protecting minority investors) scores are used in research to illustrate the variable Corporate Governance (CG).
To illustrate the economic performance, we used two indicators describing the gross domestic product (GDP)—namely, the average growth rate (GDPg) from 2010 to 2019 (obtained as an average of the annual growth rates during this period) and the share of GDP per capita per country (GDPw) in the EU-27 average of 2019 (EU-27_2019 = 100 pps). For the average growth rate of GDP, we used the World Bank national accounts data [53], and for the share of GDP per capita of each country in the European average we used Eurostat [54].
We have included in the sample the 27 European Union states plus the United Kingdom. The analysis was cross-sectional, and the data were processed using descriptive and inferential statistical methods. We have also used cluster analysis based on research variables to identify countries as a good practice model through benchmarking.
The descriptive statistical data for the variables used in the research collected from the sources, as mentioned above, are shown in Table 1.
3.2. Hypothesis and Methods
We analyzed how the BE, CSR, and CG concepts integrated into one concept and the relationships established between these corporate responsibility dimensions and their economic performance. Based on the literature study [13,14,15,16,17,37,38,39,47,48,49] and using rational-inducive methods, we formulated four hypotheses to test in the research.
Hypothesis (H1).
The variables BE, CSR, and CG correlates with variable S, positively influencing sustainability at the statistical population surveyed.
Hypothesis (H2).
The influence of the variables BE, CSR, and CG on the variables GDPg, and GDPw, exercised by a common construct (corporate responsibility), is direct and positive. The BE variable is the most important in influencing the output variables.
Hypothesis (H3).
BE, CSR, and CG significantly mediate variable S’s influence on GDPg and GDPw.
Hypothesis (H4).
According to the variables of CSR and sustainability (BE, CSR, CG, and S), the grouping of European Union states into homogeneous clusters is significantly influenced by the economic performance variables (growth and economic strength).
The results of the process of validating research hypotheses are the basis for building an integrative model of BE, CSR, and CG to achieve the goal of sustainability in conditions of superior economic performance.
For the H1 hypothesis’s research, we will use the automatic linear modeling function, which involves establishing a linear regression to determine influences.
with
- α1, α2,…, αp, ε—parameters of linear regression;
- x1, x2,…, xp—dependent variables;
- y—independent variable.
For triangulation, we will calculate the correlations between the variables selected for research. For data that does not have a Gaussian distribution but can be ranked, without having a large number of equal values between them, we can use the coefficient ρ (rho) Spearman, obtained by the non-parametric test of rank correlation. The Nonparametric Spearman Rank Correlation Test confirms the results obtained by automatic linear modeling regression, showing the close links between S, BE, and CG. The calculation relation for Spearman coefficient ρ (rho) is:
where:
- ρ—Spearman rank correlation value;
- d—margin of each pair value;
- n—Spearman rank pair values.
For the research of H2 hypothesis, we will use a multilayer perceptron (MLP) from the Artificial Neural Network analysis. A perceptron involves obtaining an output from inputs with multiple values by forming a linear combination depending on the input values, which are then processed by a nonlinear activation function. The mathematical formula of MLP is:
where:
- w, x—vectors of weights and inputs;
- b—bias;
- φ—activation function.
For MLP, the most commonly used activation functions are the sigmoid function and the hyperbolic tangent function, as follows:
where:
- n—input variable;
- f(n)—output variable.
These functions are used because they are relatively close to linear functions and allow nonlinear modeling by the backpropagation algorithm until the perceptron reaches near saturation.
For the research of the H3 hypothesis, we will use the structural equation model, which consists of two components: the structural part linking latent variables to each other and the measurement part, which connects latent variables to observed variables. The model of structural equations is as follows [55]:
where:
- η, ξ—endogenous and exogenous latent variables;
- B—matrix of regression coefficients relating the latent endogenous variables to each other;
- Γ—matrix of regression coefficients relating the endogenous variables to exogenous variables;
- ζ—disturbance.
The latent variables are linked to observable variables as follows:
where:
Λy, Λx—matrices of factor loadings;
ε, δ—vectors of uniqueness.
Modeling structural equations is used to test substantive theories, which assume observable and latent variables. Latent variables cannot be directly measured by a visible variable, making it necessary to take them into account by shaping structural equations.
For the H3 hypothesis’s research, we will use cluster analysis to assume the grouping of cases of a series of variables according to the values recorded by those variables [46]. In the research, we tested several methods of cluster analysis. The optimal approach was the medium link method, which avoids extreme large clusters or compact clusters for the data collected. For the distance between clusters, we chose the following Pearson correlation coefficient:
where:
- —mean of the variables x and y;
- σx, σy—standard deviation of the variables x and y.
The Pearson distance is dP ≡ 1 − r.
Following the cluster analysis process will result in a tree structure of the grouping process. Hierarchical clustering techniques are carried out through a series of successive agglomerations. The method result is a dendrogram that describes mergers completed successively.
4. Empirical Results and Discussion
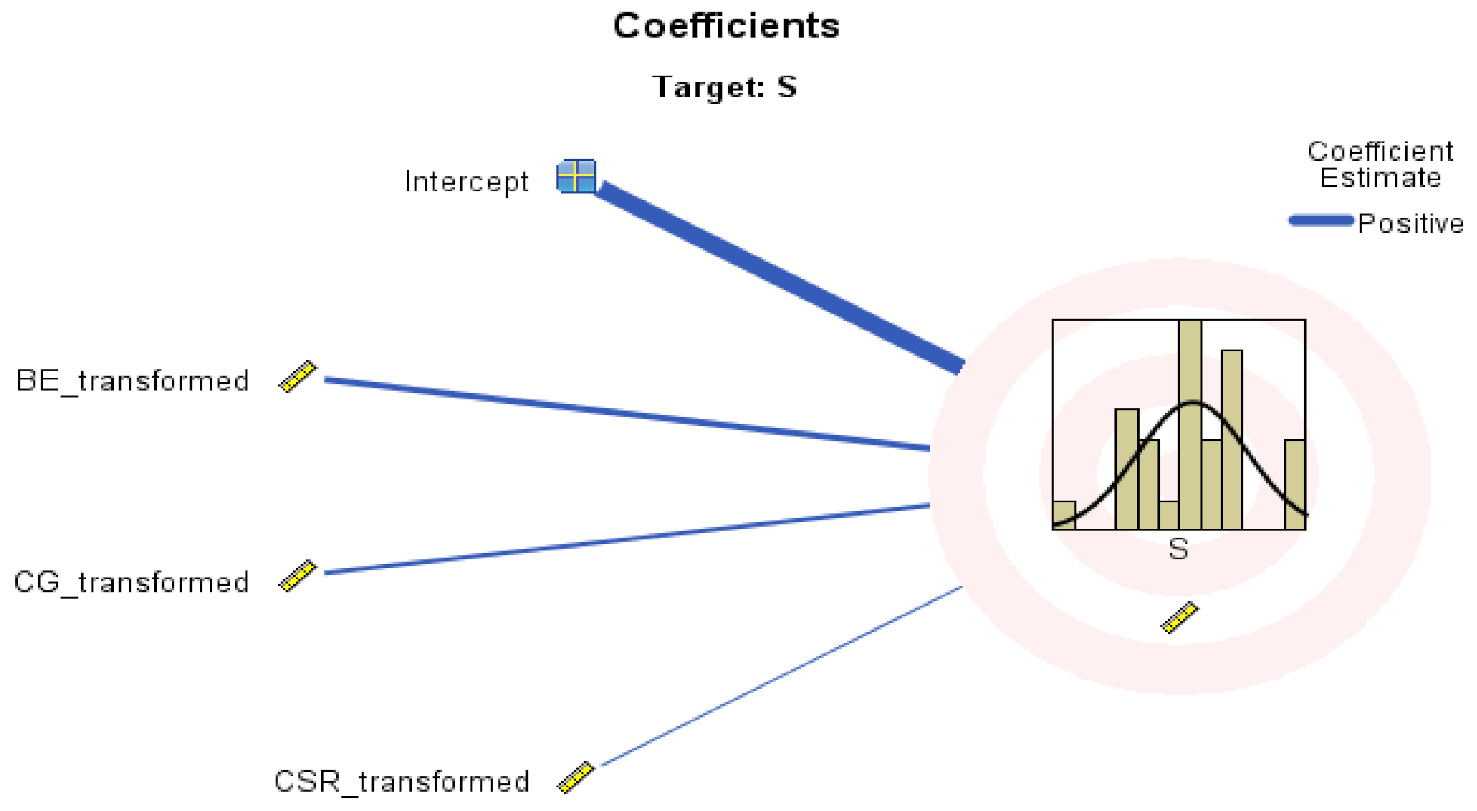
To investigate the H1 hypothesis’s validity, we will use linear regression’s automatic modeling function within SPSS v.20. The BE, CSR, and CG variables will be considered independent; the variable S will be dependent. Figure 1 shows the intensity and meaning of the links to be established between the variables considered.
Figure 1 underlines the positive influences of implementing principles and practices in CSR, CG, and BE on sustainability at the European Union level. Table 2, which contains the Spearman Rho correlation coefficients between the variables included in the linear regression modeling model, also indicates close links between S, BE, and CG.
The CSR variable has weak links with the other variables, indicating a prevalence of the economic vector over the environmental and social vectors regarding sustainability. The economic vector is essential because ethical business behavior and good CG lead to awareness of the importance of environmental protection and social issues.
Following the findings based on empirical results, we can say that the H1 hypothesis is validated, emphasizing the more intense influences of BE and CG on sustainability. The economic vector is the engine of economic growth and SD. Like other researchers [24,30,56,57], we believe that sustainability results from ethical principles, compliance with CG rules, and practical CSR program implementation.
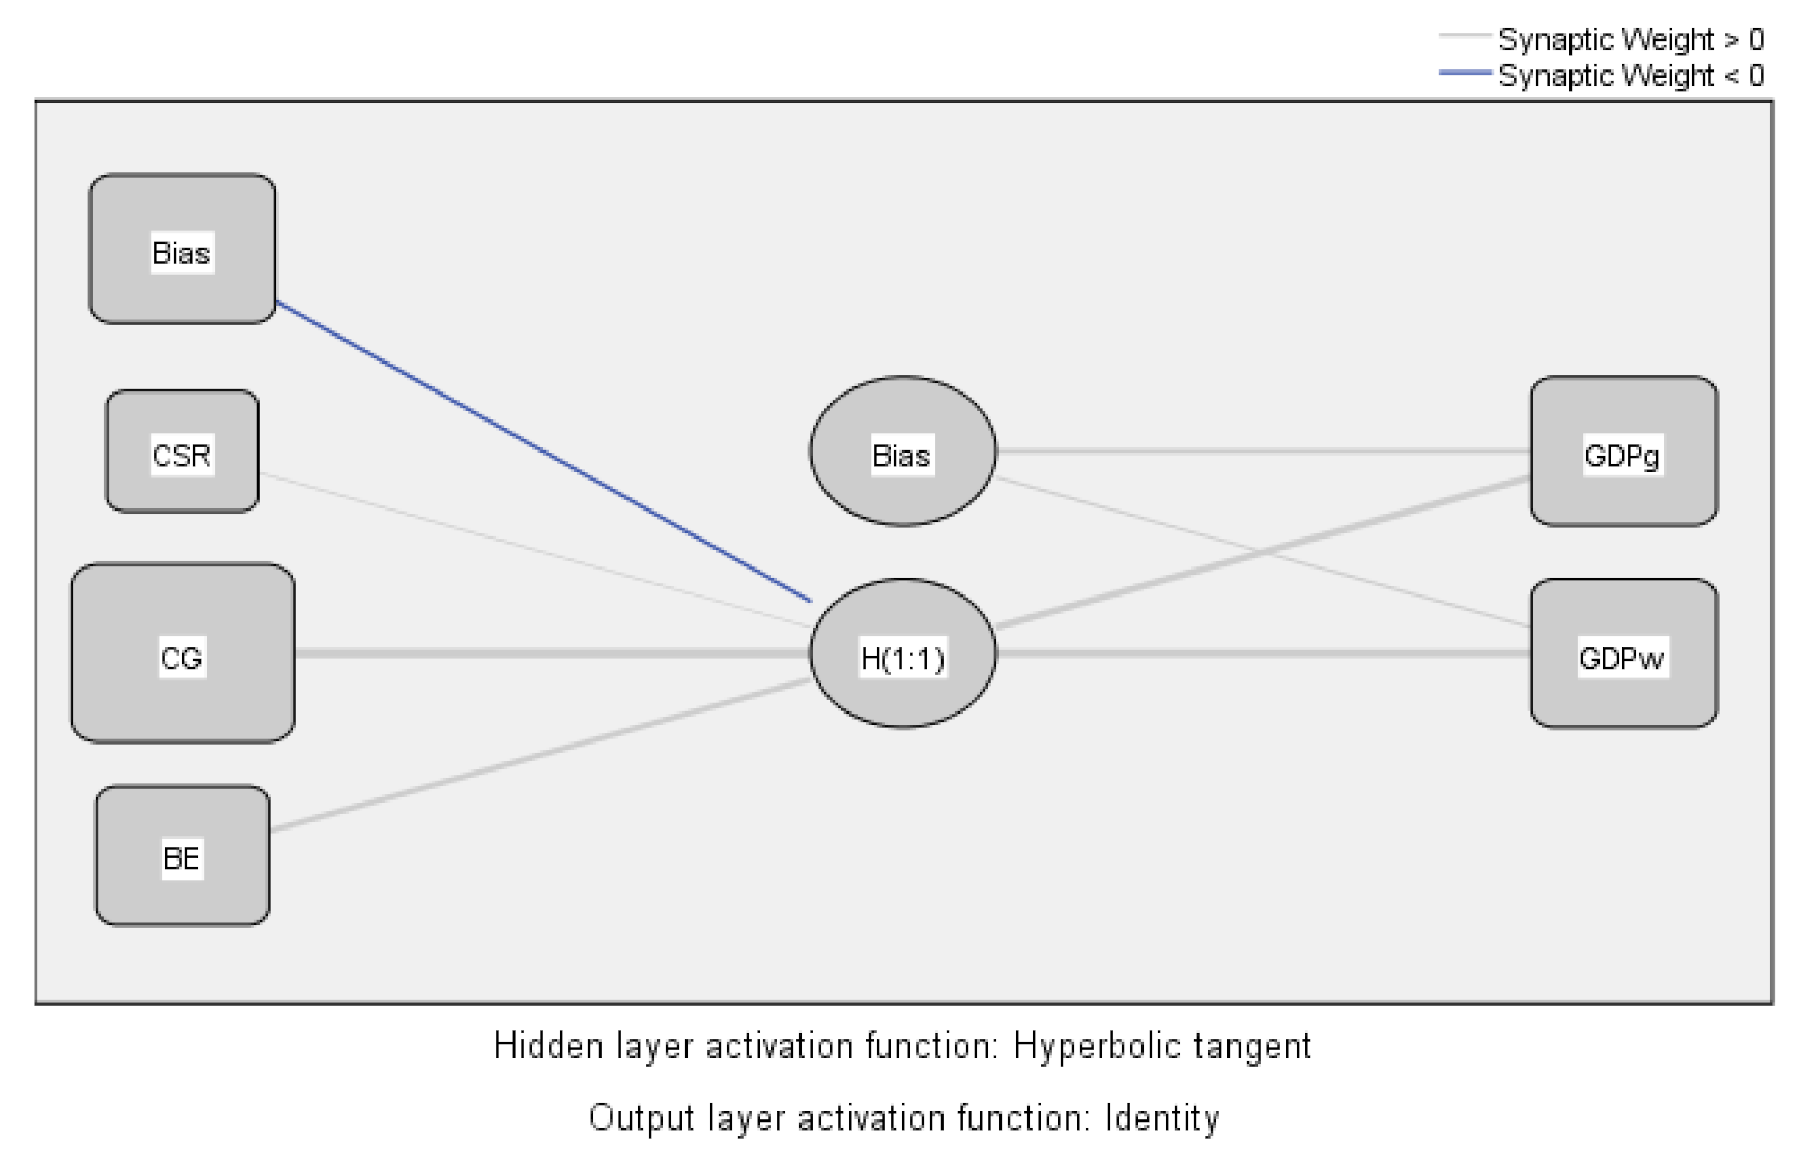
To determine the influence of the variables BE, CSR, and CG on the variables GDPg and GDPw, exercised through a common construct (corporate responsibility), we used the analysis of artificial neural networks. Artificial neural network analysis provides a multilayered perspective, allowing the detection of a hidden layer containing variables which intersect between the layer containing the input variables and the layer that includes the output variables. The model used is the multilayered perceptron. We defined BE, CSR, CG as input variables and GDPg and GDPw as output variables (Figure 2).
The hidden layer consists of a single unit representing the aggregate corporate responsibility variable (CR) that integrates the three individual variables (BE, CSR, and CG). The hidden layer’s activation function is the Hyperbolic tangent, while the output layer activation function is the Identity type. The overall error resulting from the model testing is 0.993, while the general error resulting from training is 0.752.
The rescaling method used for the dependent and independent variables was data standardization. Table 3 presents the predicted values of the model.
Following the research of the links between input variables (BE, CSR, and CG) and output variables (GDPg and GDPw), we found positive influences through the variable in the hidden layer defined as CR. Input variables (BE, CSR, and CG) exert a strong positive effect on the hidden layer variable (CR) with a low negative bias. In turn, the hidden layer variable (CR) exerts positive influences on output variables (GDPg and GDPw), a lower impact in intensity on economic growth (GDPg), and a more substantial effect on economic power (GDPw), moderated by the countries development.
The CG variable exerted the most crucial influence because corporate responsibility is a CG function that extends management’s concern regarding economic vectors and situations for social and environmental vectors. The adoption of ethical and socially responsible behavior depends on management.
Based on what we have found from the research carried out, we can state that the H2 hypothesis is partially validated. The influence of BE, CSR, and CG on the variables GDPg and GDPw, exercised through a common construct (corporate responsibility), is positive. Still, it is the CG variable that is the most important in corporate responsibility. The results are similar to those of other research in the field [56,58].
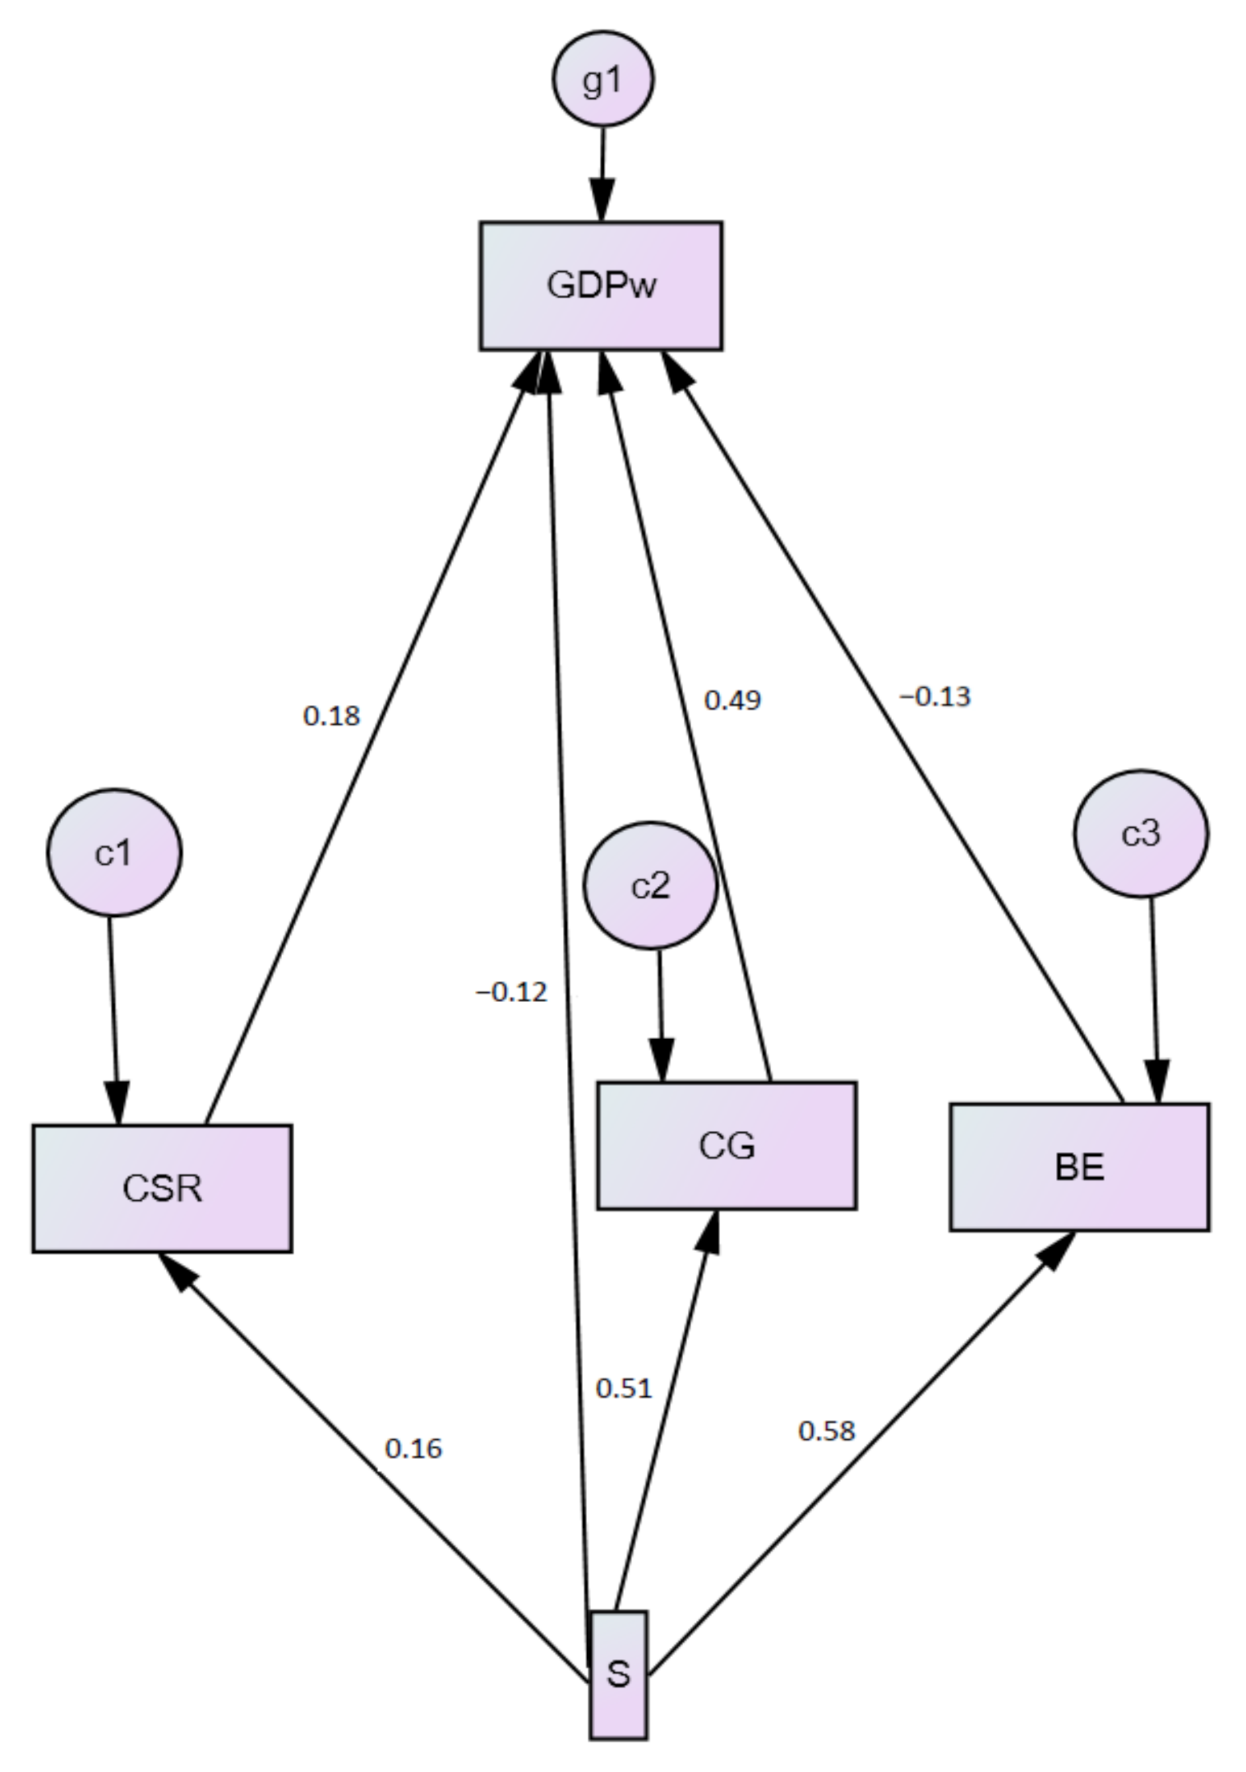
To investigate the validity of the H3 hypothesis, we used the methodology of modeling structure equations to demonstrate the mediating effect of the BE, CSR, and CG variables on the relationship between variable S and variables GDPg and GDPw. In Figure 3, we presented the relationship diagram (standardized estimates) established between the model variables.
In this model, we used the method of estimating maximum likelihood. The non-normed fit index (NNFI) and the comparative fit index (CFI) recorded the values 0.934 and 1000, respectively. The values greater than 0.90 indicate good significance. The root mean square of error approximation (RMSEA) recorded by the base model is 0.00. Practical experience shows that a value of the RMSEA of about 0.05 or less would indicate a close fit of the model concerning the degrees of freedom [59]. Table 4 shows the direct, indirect, and total standardized effects recorded among the model variables.
Figure 3 and Table 4 indicate a relatively significant mediation effect of the three variables (BE, CSR, and CG) on the GDPg variable. The direct impact of the implementation of sustainability policies on economic growth is negative (−0.202). The effects mediated by CSR, CG, and BE on implementing sustainability policies on growth are positive (an overall positive effect of corporate responsibility in the amount of 0.209). The implementation of sustainability policies affects economic growth due to the assumed costs. Still, given corporate responsibility mediation through BE, CSR, and CG, the overall effect is slightly positive (0.007) in the statistical population surveyed (EU countries).
In Figure 4, we presented the diagram of the relationships (standardized estimates) between the model variables for determining the mediation effect between sustainability (S) and economic power (GDPw).
In the model, were used methods for estimating maximum probability. The non-normed fit index (NNFI) and the comparative fit index (CFI) recorded the values 0.943 and 1000, respectively, and values greater than 0.90 show good significance. The root mean square of error approximation (RMSEA) recorded by the base model is 0.00. Table 5 shows the direct, indirect, and total standardized effects recorded between the model variables.
Similarly to economic growth there exists a relatively significant mediation effect of the three variables (BE, CSR, and CG) on the GDPw variable. The direct impacts of implementing sustainability policies on economic growth are negative (−0.119). The effects mediated by CSR, CG, and BE of implementing sustainability policies on economic growth are positive (an overall positive effect of corporate responsibility of 0.203). The implementation of sustainability policies affects economic power due to the assumed costs. Still, given corporate responsibility mediation through CSR, CG, and BE, the overall effect is slightly positive (0.084) in the statistical population surveyed (EU countries).
Research into the H3 hypothesis’s validity has led us to conclude that BE, CSR, and CG significantly mediate variable S’s influence on GDPg and GDPw. CSR, CG, and BE policies and practices contribute to significant economic growth, ensuring sustainable development, and increasing its economic power in the statistical population surveyed (EU countries).
To investigate the validity of the H4 hypothesis, we proceeded to group the European Union states into homogeneous clusters depending on the variables of corporate responsibility and sustainability (BE, CSR, CG, and S).
We conducted a hierarchical cluster analysis with the data collected for the variables involved (BE, CSR, CG, and S), with the results being shown in Table 6.
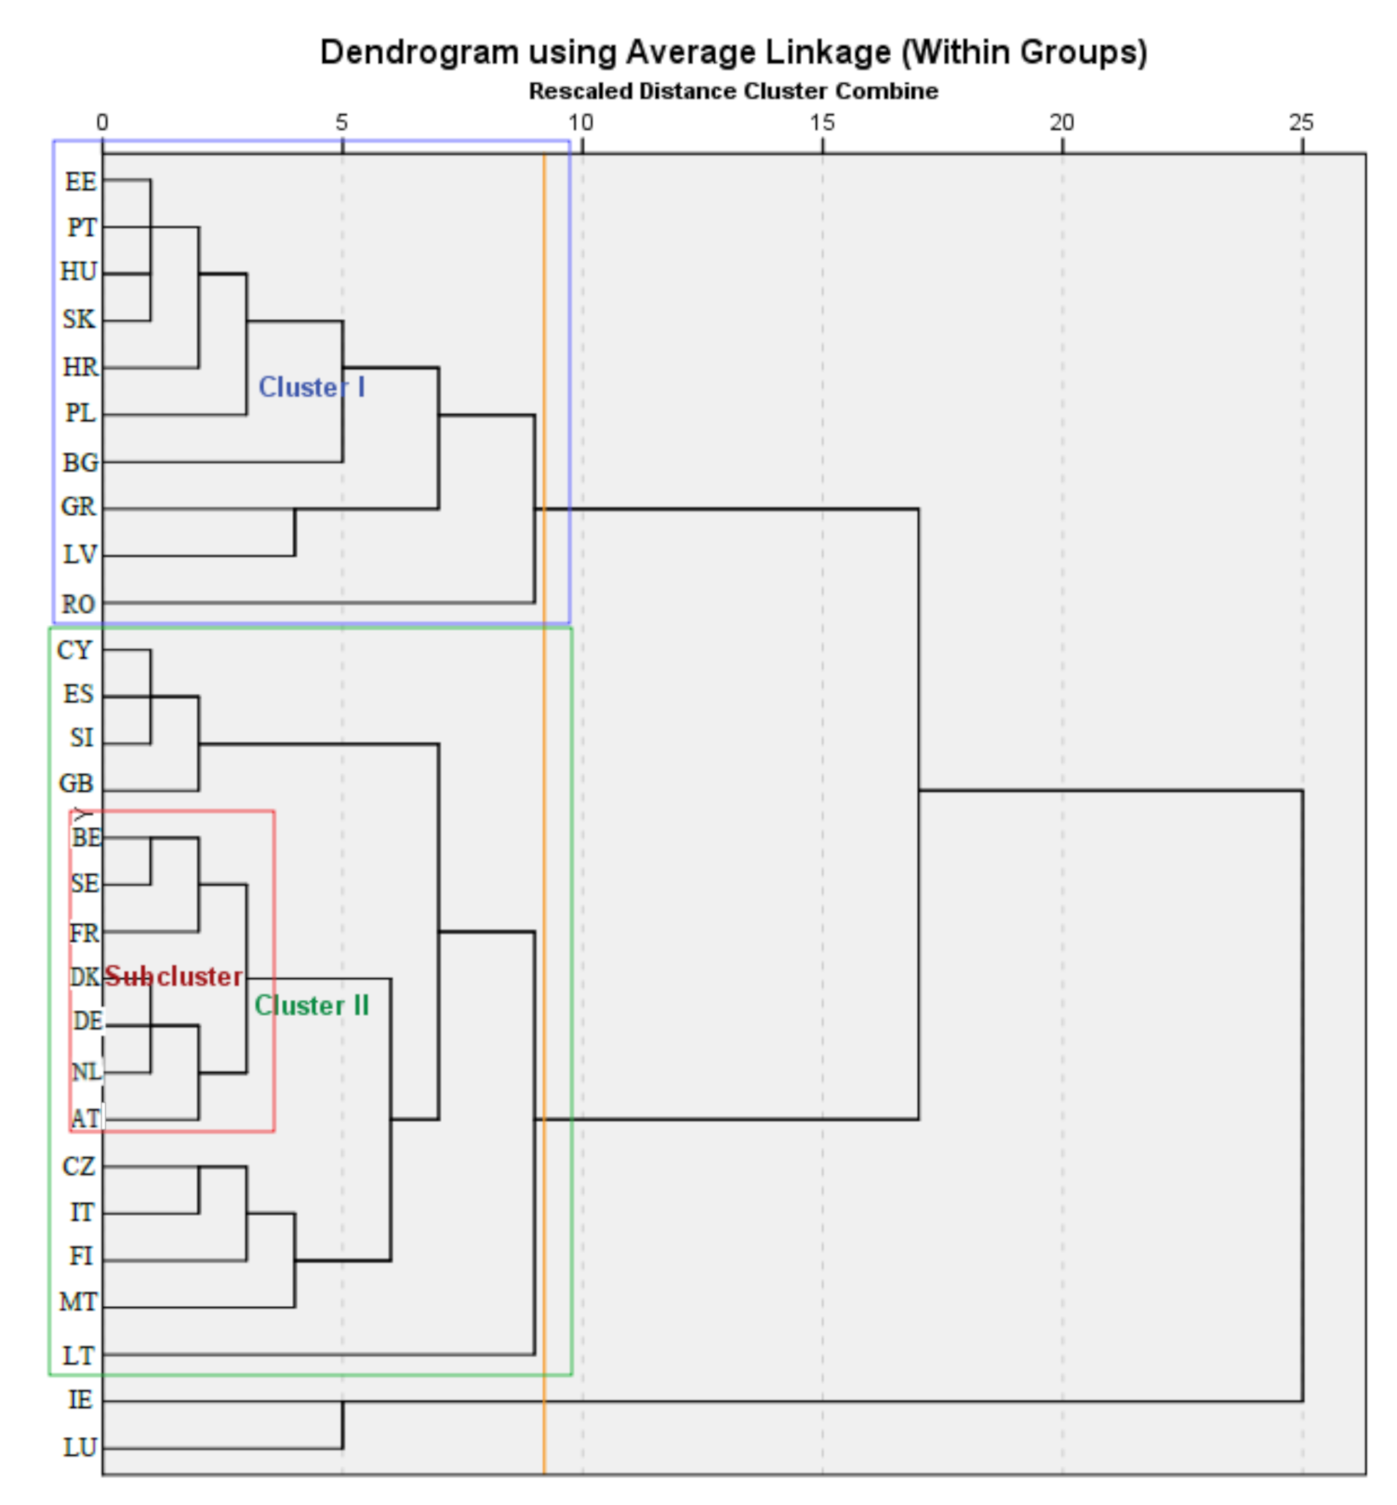
The dendrogram of our research implies the rising of two clusters. Two countries (Ireland and Luxembourg) do not fall within either of the two clusters, excluding the extreme values recorded by the economic performance variables (Figure 5). We used the average linkage method within the groups for clustering, and as a measurement interval we used Pearson correlation.
Table 7 is grouped by countries and consists of corporate responsibility and sustainability (BE, CSR, CG, and S) and economic performance variables (economic growth and power) according to the chosen clustering method, included in Cluster I. The orange line indicates the distance taken into account in delimiting the clusters. The countries in Cluster I are countries of Central and Eastern Europe, except for Portugal.
It is also evident that, except for two countries (Greece and Portugal), the countries included in Cluster I are former communist countries. While having a higher average economic growth level than the EU average, these countries have low economic power, affecting sustainability levels. As a result of the national cultures still paying tribute to the communist mindsets, we can see that even indications illustrating CSR and BE are below the European average. The only index approaching the European mean value is the CG, due to multinationals’ penetration and the expansion of acceptable CG practices.
According to Cluster II’s chosen clustering method, Table 8 grouped countries depending on corporate responsibility and sustainability (BE, CSR, CG, and S) and economic performance variables (growth and economic power).
The countries included in Cluster II are Western European countries, except for the Czech Republic, Lithuania, Slovenia, and two Mediterranean countries (Cyprus and Malta). These countries have a lower average economic growth level than the EU average but have higher economic power than the EU average, which positively influences the sustainability levels. Even indices illustrating CG, CSR, and BE are significantly above the European average. These countries have a strengthened market economy with sustainable economic growth, high economic power, and national corporate-oriented cultures.
Table 9 is grouped by countries and consists of corporate responsibility and sustainability (BE, CSR, CG, and S) and the economic performance variables (growth and economic power) according to the chosen clustering method, included in Cluster II’s subcluster. We have retained Cluster II’s subcluster for analysis due to its homogeneity, which can facilitate the study of correlations among the variables of sustainability and social responsibility, the level of economic growth, and economic power.
The countries included in the subcluster of Cluster II are countries of Western Europe. These countries have a lower average economic growth level than the Cluster II average.
Still, they have higher economic power than the EU average and the Cluster I average, significantly influencing sustainability and corporate responsibility, which are significantly above the European average. These countries have a high-performance market economy with the highest economic power in the EU and national corporate-oriented cultures, facilitating their implementation of BE principles, CSR, CG, and SD.
In-depth research of homogeneous clusters obtained according to corporate responsibility and sustainability variables (BE, CSR, CG, and S) shows a significant influence on economic performance variables (growth and economic power) not only on sustainability but also on corporate responsibility, which produces results in line with those of other research [48,49]. Consequently, we can say that hypothesis H4 is validated.
5. Integrative Approach of Corporate Responsibility to Ensure Sustainable Development
As stated in the Literature Review Section, the 2030 Agenda provides an opportunity for the EU to integrate strategic guidance into the global effort to build a sustainable future. The global vision on which sustainable development objectives under the 2030 Agenda are based is entirely in line with the European strategy for sustainable development in the following three pillars: social, economic, and environmental.
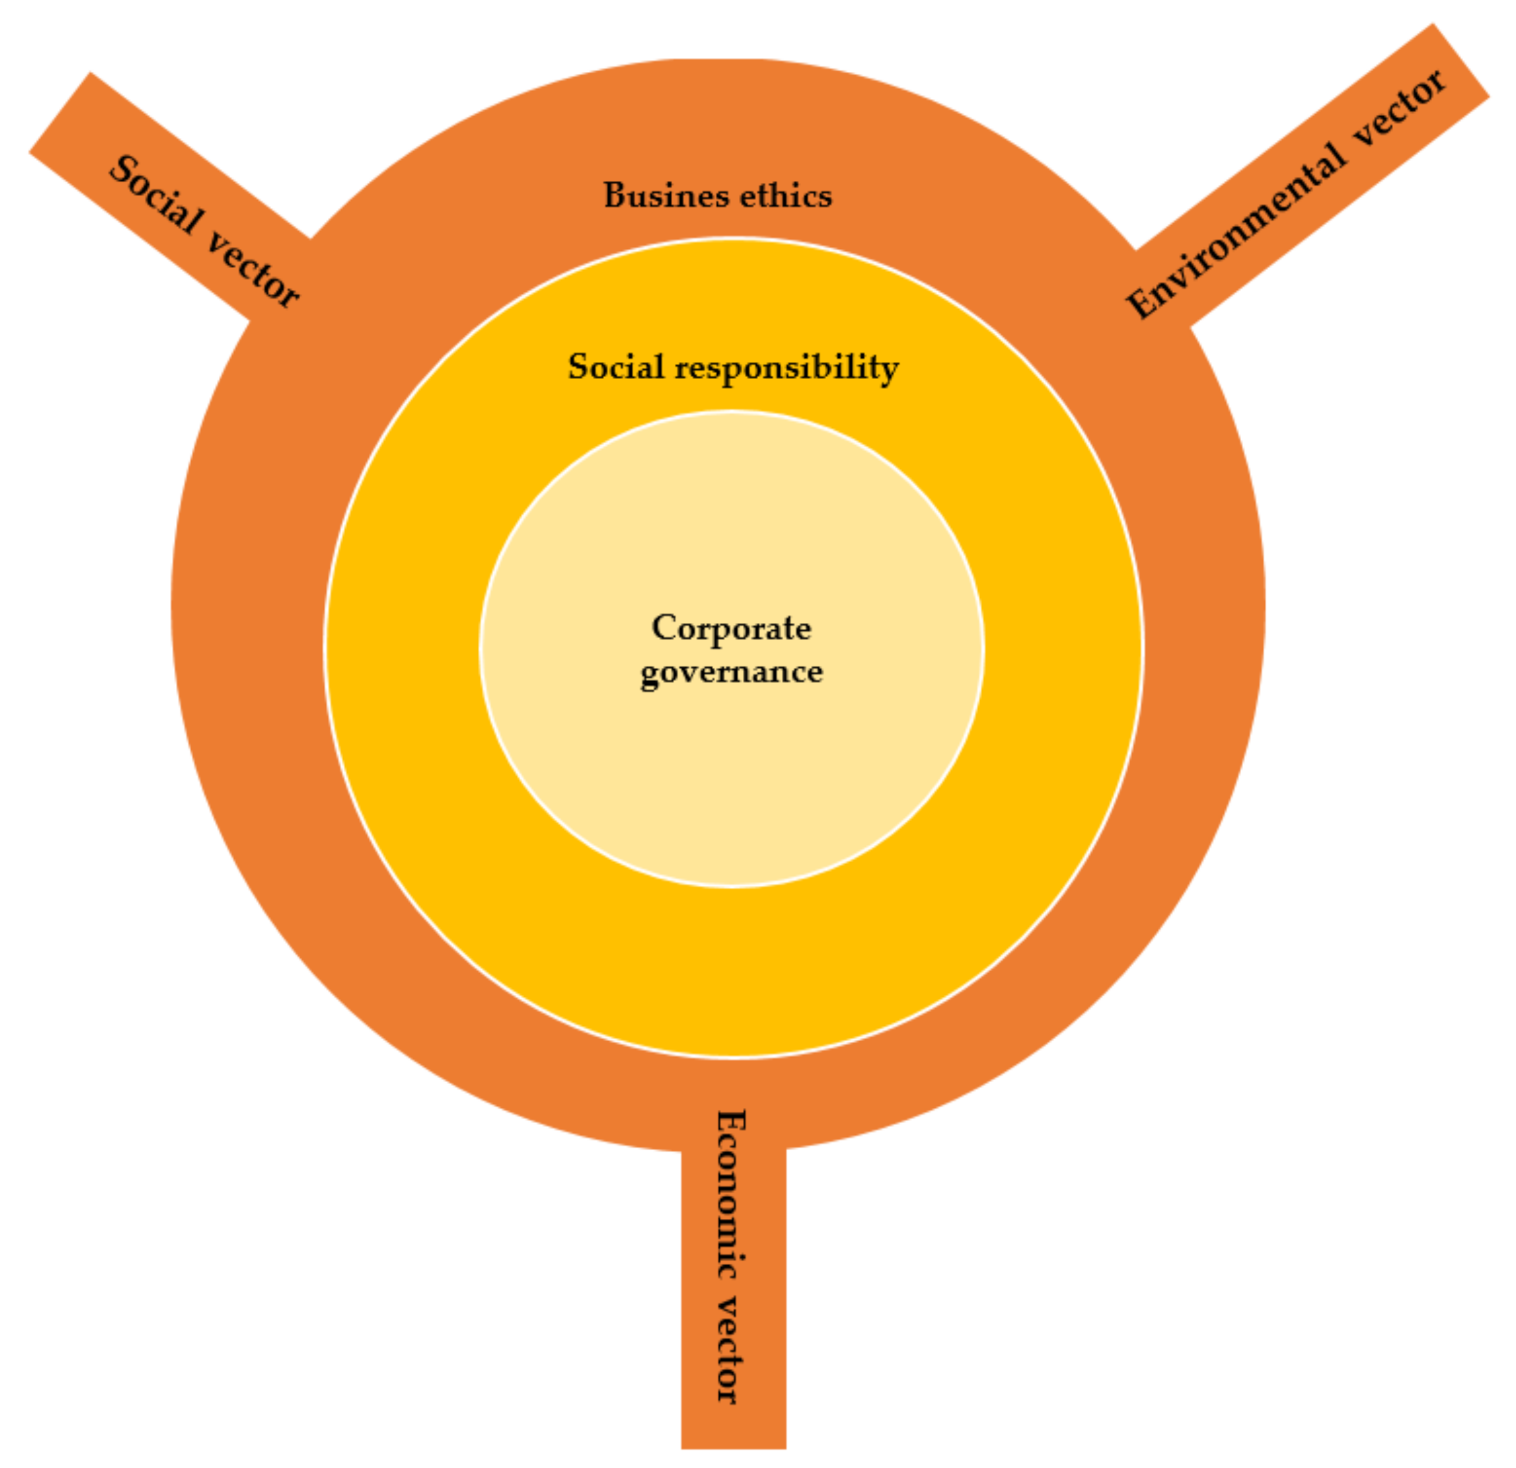
Given the similarities between the three pillars of sustainable development and the concerns of BE, CSR, and CG at the organization level, based on the results of empirical research we have proposed integrating the three concepts of corporate responsibility as a tool to achieve sustainable development. The integrative approach to the three dimensions of corporate responsibility (BE, CSR, and CG) and sustainability are illustrated in a concentric “sun” model (Figure 6).
CG is the core of this model, the force that integrates and correlates internal stakeholders: shareholders (owners of the organization who make strategic decisions through general meetings with shareholders and boards of directors), managers (who implement strategic choices and adopt the necessary tactical decisions as well as operational ones), and executive employees (who implement management decisions and depending on the degree of autonomy offered and make decisions about the activities that concern them).
The second layer of the concentric model is the organization’s social responsibility, which adds attention to the internal stakeholder’s care for external stakeholders’ requirements. A socially responsible organization looks beyond its borders. It integrates external stakeholders’ interests into the organizational strategy: suppliers, customers, public authorities, employers’ and trade union organizations, the community, and society. To this end, the organization has initiatives in CSR or promotes responsible behavior concerning business partners and regulators or tax authorities.
The third layer of the concentric model is business ethics. The two tools (code of ethics and code of conduct) integrate organizational behavior into BE and behavioral prescriptions that ensure ethical decision-making mechanisms. CG is strictly concerned with managing internal stakeholders’ relations, while CSR involves internal and external links with the external environment. BE provides the principles underlying these relationships and behavior patterns, with a wide range of action covering the organization’s entire activity.
The fourth component of the model is sustainability, which manifests itself in the form of outputs, such as the three vectors of the “triple bottom line” approach: the economic vector, the environmental vector, and the social vector [59]. This component takes principles, prescriptions, and behavioral patterns from CG, CSR, and BE and integrates them into its strategy by creating a way to survive and grow under sustainable conditions.
The model provides the organization with coherence in addressing stakeholders and ethical issues they face in work, providing a factual basis for sustainable development.
Implementing this model in practice requires an instrumental approach, enabling the integration and tools used by the three areas underlying sustainable business development: CG, CSR, and BE.
Table 10 provides an integrative view of the tools used by CG, CSR, and BE, harmonizing and integrating them into a common tool that we propose, which we have called an organizational sustainability implementation program.
This organizational sustainability implementation program is a practically unique tool that integrates all other instruments specific to CG, CSR, and BE into an available document. It contains CG principles, the organization’s CSR, BE, prescriptions of conduct, actions to be taken, and tracked and measured results. Such an organizational sustainability implementation program would be an integrated tool that provides a competitive advantage to the implementing organization. Employees will better manage information on how an organization can act towards sustainability, eliminating the plurality of existing codes at the organization level and ensuring sustainability policy consistency. Such an instrument should use the Jorgensen model methodology for the integrated management system [60], which involves three integration levels (compatibility, coordination, integration). Compatibility involves ensuring correspondence between codes and prescriptions of conduct specific to CG, CSR, BE, eliminating duplication, confusion, and redundancies. In processes and activities, coordination ensures that principles and behaviors are aligned [61]. Integration involves interweaving principles, prescriptions of conduct, patterns of behavior, and actions to develop a single strategy that underpins the organization’s sustainable development in the three dimensions (economic, social, and environmental).
This vision can be embedded in the organization by developing systems, processes, policies, plans, practices, and programs. If the organization wants to implement corporate responsibility practices successfully, efforts should be institutionalized and perpetuated. Additionally, top management should try to build a system through which organizational responsibility becomes sustainable.
6. Conclusions
Concepts of ethical behavior and CSR have emerged in developed and developing countries due to companies’ increasing ethical issues. CSR, CG, and BE are essential for organizational growth and success. BE leads to positive relationships between employees, customers, and the community and creates a better image and public reputation for the organization, ensuring customer loyalty and stronger, healthier community relationships and creates benefits for socially responsible corporations.
Corporate responsibility is closely linked to sustainable development principles, proposing that organizations’ decisions should no longer be based merely on financial or economic factors and consider the social consequences for their environment and activities. Corporate responsibility, therefore, refers to how organizations align their values and behavior with the expectations and needs of different stakeholders. It also describes the company’s commitment to respond to changes in its environment, be responsible for people and society, and be transparent in its business practices—i.e., to demonstrate good governance.
In recent years, many corporations have adopted the Triple Bottom Line, an integrated approach for the public reporting of environmental, social, and economic results. Organizations take steps to integrate all three dimensions of the organization’s responsibility and BE with business strategies. This approach is rooted in the organizations’ senior leadership. Several internal and external pressures influence corporate leaders to use ethical techniques: the growing influence of non-governmental organizations (NGOs); the media seeking scandalous news; the unpleasant effect of scandals over fraudulent accounting, such as in Enron, WorldCom, and Lehman Brothers; the growth of the regulatory phenomenon; the increase in socially responsible investment; the changes in consumer and employee expectations; and the intensification of social activists’ campaigns. Senior leadership’s must integrate ethical vision into organizational decision-making and translate vision, statements, and missions into practice.
Organizational leaders need to realize the importance of putting people and the planet in the same place as profit, if not before it. Ensuring a positive impact on society can be crucial for both corporate reputation and business success. Regarding the incorporation of ethical considerations, senior leadership must be aware that the three dimensions of organizational responsibility must integrate into all administrative activities. However, such awareness of corporate responsibility must be supported by commitment and attention given to incorporating ethics and organizational values into everyday decision-making. Senior leadership’s role is crucial because it has a responsibility to translate this vision into business strategy. It must continue to use responsibility practices by highlighting the organizational transformation through which this vision is implemented from top to bottom. This vision can be embedded in the organization by developing systems, processes, policies, plans, practices, and programs. Finally, it penetrates the whole organization from top to bottom and in all functional areas, including human resources, marketing and sales, service, accounting, general administration, and finance.
This paper advocate developing a global ontological framework for practices in these areas based on sustainable development policies and principles to contribute to the literature of CSR, CG, and BE integration. By deepening the perspectives on nature; depth of integration; and the influence of CG, CSR, and BE on sustainability, this paper highlights the need to propose an integrated model of SD of the organization that incorporates the three dimensions of corporate responsibility, an integrative concept of CG, CSR, and BE. Empirical research is macroeconomic, with the research variables being defined in the form of some synthetic indicators that illustrate corporate responsibility and economic performance. At the same time, we addressed the relationship among CG, CSR, BE, sustainability, and economic performance, emphasizing the need for an integrated approach and the importance of sustainability and corporate responsibility in achieving economic performance that can lead to economic development. It should be noted that there needs to be a balance between economic responsibility and social responsibility. Only in this way can an organization survive in the long run. An organization must ensure that its activities in the field of social responsibility are adequately aligned with its operational activities. Social responsibility should be an essential aspect of an organization’s work, as it represents what is right and ethical and rewards organizational efforts. The real value it offers to all stakeholders and society will determine the future of an organization. States should encourage organizations to integrate responsibility and sustainability into their strategies through a legislative framework and economic incentives, given the beneficial effects for both the organization and society of sustainable and responsible policies at the organization level. Raising awareness that corporate responsibility significantly correlates with better economic performance has led to organizational strategy changes from top to bottom. Organizations are required not only by customers but also by other stakeholders to incorporate social welfare and sustainability into their modus operandi. Organizations that do not carry out corporate responsibility actions will, at some point, face a negative impact on their reputation, credibility, and strategic advantage. Organizations that perform corporate responsibility actions are considered reliable, socially responsible partners with a positive reputation. No organization can ignore the importance of BE, CSR, CG, and sustainability nowadays. Corporate responsibility and sustainability create additional value for the organization and intend to align organizations with the communities and society.
This study aimed to capture the researched phenomena using the latest data on BE, CSR, CG, sustainability, and GDP currently available. A limitation of this study stems from the fact that since there are no macroeconomically calculated indices for each country, to illustrate BE and CG, we have used two indicators calculated by the World Bank in the Doing Business 2020 report, which significantly explain the model variables. Another limitation derives from the fact that we have conducted cross-sectional and not longitudinal research of the relationship established between the research’s defined variables. Future research should aim to carry out a longitudinal analysis, including focus on the time factor.
Author Contributions
Conceptualization, A.A.V. and C.G.B.; Formal analysis, A.A.V. and C.G.B.; Investigation, A.A.V., C.G.B., and M.M.N.; Methodology, A.A.V. and C.G.B.; Validation, C.G.B.; Writing—original draft, A.A.V. and C.G.B.; Writing—review and editing, A.A.V. and M.M.N. All authors have read and agreed to the published version of the manuscript.
Funding
This research received no external funding.
Institutional Review Board Statement
Not applicable.
Informed Consent Statement
Not applicable.
Data Availability Statement
Data available in a publicly accessible repository. The data presented in this study are openly available in Eurostat at http://appsso.eurostat.ec.europa.eu/nui/show.do?dataset=tec00114&lang=en (accessed 26 October 2020); World Bank DOING BUSINESS 2020 Report at http://documents1.worldbank.org/curated/en/688761571934946384/pdf/Doing-Business-2020-Comparing-BusinessRegulation-in-190-Economies.pdf (accessed 26 October 2020); Candriam at https://academy.candriam.com/wp-content/uploads/pdf/2017countrysrireport.pdf (accessed 26 October 2020); The Sustainable Development Goals and COVID-19. Sustainable Development Report 2020 at https://s3.amazonaws.com/sustainabledevelopment.report/2020/2020_sustainable_development_report.pdf (accessed 26 October 2020).
Conflicts of Interest
The authors declare no conflict of interest.
References
- Aguilera, R.; Ruth, V.; Rupp, D.; Williams, C.A.; Ganapathi, J. Putting the S back in corporate social responsibility: A multi-level theory of social change in organizations. Acad. Manag. Rev. 2007, 32, 836–863. [Google Scholar] [CrossRef] [Green Version]
- Nicolaides, A. Corporate social responsibility as an ethical imperative. Athens J. Law 2018, 4, 285–300. [Google Scholar] [CrossRef]
- Tuazon, D.; Corder, G.; McLellan, B. Sustainable development: A review of theoretical contributions. Int. J. Sustain. Futur. Hum. Secur. 2013, 1, 40–48. [Google Scholar] [CrossRef]
- Boyer, R.H.W.; Peterson, N.D.; Arora, P.; Caldwell, K. Five Approaches to social sustainability and an integrated way forward. Sustainability 2016, 8, 878. [Google Scholar] [CrossRef] [Green Version]
- Filho, W.L.; Ulisses, A.; Alves, F.; Pace, P.; Mifsud, M.; Brandli, L.; Caeiro, S.S.; Disterheft, A. Reinvigorating the sustainable development research agenda: The role of the sustainable development goals (SDG). Int. J. Sustain. Dev. World Ecol. 2017, 25, 131–142. [Google Scholar] [CrossRef] [Green Version]
- Ramos, T.B. Development of regional sustainability indicators and the role of academia in this process: The Portuguese practice. J. Clean. Prod. 2009, 17, 1101–1115. [Google Scholar] [CrossRef]
- European Commission. Key European Action Supporting the 2030 Agenda and the Sustainable Development Goals; European Comission: Strasbourg, Germany, 2016. [Google Scholar]
- Josephsen, L. Approaches to the Implementation of the Sustainable Development Goals—Some Considerations on the Theoretical Underpinnings of the 2030 Agenda. Economics Discussion Papers, No 2017-60. Kiel Institute for the World Economy. 2017. Available online: http://www.economics-ejournal.org/economics/discussionpapers/2017-60 (accessed on 22 October 2020).
- United Nations. Transforming Our World: The 2030 Agenda for Sustainable Development. 2015. Available online: https://sustainabledevelopment.un.org/post2015/transformingourworld (accessed on 19 October 2020).
- Lehtonen, M. The environmental-social interface of sustainable development: Capabilities, social capital, institutions. Ecol. Econ. 2004, 49, 199–214. [Google Scholar] [CrossRef]
- Le Blanc, D. Towards Integration at Last? The Sustainable Development Goals as a Network of Targets. UN Department of Economic and Social Affairs 2015, DESA Working Paper No. 141. ST/ESA/2015/DWP/141. Available online: http://www.un.org/esa/desa/papers/2015/wp141_2015.pdf (accessed on 27 October 2020).
- Coopman, A.; Derek, O.; Farooq, U. Seeing the Whole: Implementing the SDGs in an Integrated and Coherent Way. A Research Pilot by Stakeholder Forum, Bioregional and Newcastle University. 2015. Available online: http://lcn.pascalobservatory.org/pascalnow/pascal-activities/news/seeing-whole-implementing-sustainable-development-goals-integrated- (accessed on 25 October 2020).
- Flammer, C. Does corporate social responsibility lead to superior financial performance? A Regression Discontinuity Approach. Manag. Sci. 2015, 61, 2549–2568. [Google Scholar] [CrossRef] [Green Version]
- Carroll, A.B. Corporate social responsibility. Bus. Soc. 1999, 38, 268–295. [Google Scholar] [CrossRef]
- Zingales, L.; Guiso, L.; Sapienza, P. The values of corporate culture. J. Financ. Econ. 2016, 117, 60–76. [Google Scholar]
- Sahut, J.-M.; Peris-Ortiz, M.; Teulon, F. Corporate social responsibility and governance. J. Manag. Gov. 2019, 23, 901–912. [Google Scholar] [CrossRef] [Green Version]
- Dyck, A.; Morse, A.; Zingales, L. How Pervasive Is Corporate Fraud? Working Paper; University of Chicago: Chicago, IL, USA, 2014. [Google Scholar]
- Ntim, C.G.; Opong, K.K.; Danbolt, J. The Relative value relevance of shareholder versus stakeholder corporate governance disclosure policy reforms in South Africa. Corp. Gov. Int. Rev. 2011, 20, 84–105. [Google Scholar] [CrossRef]
- Postel, N.; Rousseau, S. RSE et éthique d’entreprise: La nécessité des institutions. Management 2008, 11, 137–160. [Google Scholar] [CrossRef]
- Ashrafi, M.; Adams, M.; Walker, T.R.; Magnan, G. ‘How corporate social responsibility can be integrated into corporate sustainability: A theoretical review of their relationships’. Int. J. Sustain. Dev. World Ecol. 2018, 25, 672–682. [Google Scholar] [CrossRef]
- Montiel, I. Corporate social responsibility and corporate sustainability separate pasts, common futures. Organ. Environ. 2008, 21, 245–269. [Google Scholar] [CrossRef] [Green Version]
- Linnenluecke, M.K.; Russell, S.V.; Griffiths, A. Subcultures and sustainability practices: The impact on understanding corporate sustainability. Bus. Strategy Environ. 2009, 18, 432–452. [Google Scholar] [CrossRef]
- Lozano, R. Towards better embedding sustainability into companies’ systems: An analysis of voluntary corporate initiatives. J. Clean. Prod. 2012, 25, 14–26. [Google Scholar] [CrossRef]
- Bansal, P.; Song, H.C. Similar but not the same: Differentiating corporate responsibility from sustainability. Acad. Manag. Ann. 2017, 11, 105–149. [Google Scholar] [CrossRef]
- Chang, R.D.; Zuo, J.; Zhao, Z.Y.; Zillante, G.; Gan, X.L.; Soebarto, V. Evolving theories of sustainability and firms: History, future directions and implications for renewable energy SSO research. Renew. Sustain. Energy Rev. 2017, 72, 48–56. [Google Scholar] [CrossRef]
- Montiel, I.; Delgado-Ceballos, J. Defining and measuring corporate sustainability: Are we there yet? Organ. Environ. 2014, 27, 48–56. [Google Scholar] [CrossRef]
- Hahn, T.; Pinkse, J.; Preuss, L.; Figge, F. Tensions in corporate sustainability: Towards an integrative framework. J. Bus. Ethics 2015, 127, 297–316. [Google Scholar] [CrossRef]
- Dyllick, T.L.; Muff, K. Clarifying the meaning of sustainable business: Introducing a typology from business-as-usual to true business sustainability. Organ. Environ. 2015, 29, 156–174. [Google Scholar] [CrossRef] [Green Version]
- Lozano, R. A holistic perspective on corporate sustainability drivers. Corp. Soc. Responsib. Environ. Manag. 2015, 22, 32–44. [Google Scholar] [CrossRef]
- Carroll, A.B. Corporate social responsibility: The centerpiece of competing and complementary frameworks. Organ. Dyn. 2015, 44, 87–96. [Google Scholar] [CrossRef]
- Aguinis, H. Organizational responsibility: Doing good and doing well. In APA Handbook of Industrial and Organizational Psychology; Zedeck, S., Ed.; American Psychological Association: Washington, DC, USA, 2011; Volume 3, pp. 855–879. [Google Scholar]
- Schwartz, M.S.; Carroll, A.B. Integrating and unifying competing and complementary frameworks. Bus. Soc. 2008, 47, 148–186. [Google Scholar] [CrossRef]
- Fassin, Y.; Van Rossem, A.; Buelens, M. Small-business owner-managers’ perceptions of business ethics and CSR-related concepts. J. Bus. Ethics 2011, 98, 425–453. [Google Scholar] [CrossRef]
- Orlitzky, M. Corporate social responsibility, noise, and stock market volatility. Acad. Manag. Perspect. 2013, 27, 238–254. [Google Scholar] [CrossRef] [Green Version]
- Kendall, N. Good corporate governance. Account. Dig. 1999, 40, 42–54. [Google Scholar]
- Ntim, C.G.; Soobaroyen, T. Black economic empowerment disclosures by South African listed corporations: The influence of ownership and board characteristics. J. Bus. Ethics 2013, 116, 121–138. [Google Scholar] [CrossRef]
- Marcus, J.; Kurucz, E.C.; Colbert, B.A. Conceptions of the business-society-nature interface: Implications for management scholarship. Bus. Soc. 2010, 49, 402–438. [Google Scholar] [CrossRef]
- Martínez-Ferrero, J.; Frías-Aceituno, J.V. Relationship between sustainable development and financial performance: International empirical research. Bus. Strategy Environ. 2013, 24, 20–39. [Google Scholar] [CrossRef]
- Elalfy, A.; Palaschuk, N.; El-Bassiouny, D.; Wilson, J.; Weber, O. Scoping the evolution of corporate social responsibility (CSR) research in the sustainable development goals (SDGs) Era. Sustainability 2020, 12, 5544. [Google Scholar] [CrossRef]
- Webb, N.J. Corporate profits and social responsibility: Subsidization of corporate income under charitable. J. Econ. Bus. 1996, 48, 401–421. [Google Scholar] [CrossRef]
- Dowell, G.; Hart, S.; Yeung, B. Do corporate global environmental standards create or destroy market value? Manag. Sci. 2000, 46, 1059–1074. [Google Scholar] [CrossRef] [Green Version]
- Peirö-Signes, A.; Segarra-Ona, M.; Mondejar-Jimenez, J.; Vargas-Vargas, M. Influence of the environmental, social and corporate governance ratings on the economic performance of companies: An overview. Int. J. Environ. Res. 2013, 7, 105–112. [Google Scholar]
- Friede, G.; Busch, T.; Bassen, A. ESG and financial performance: Aggregated evidence from more than 2000 empirical studies. J. Sustain. Financ. Invest. 2015, 5, 210–233. [Google Scholar] [CrossRef] [Green Version]
- Shaukat, A.; Qiu, Y.; Trojanowski, G. Board Attributes, Corporate Social Responsibility Strategy, and Corporate Environmental and Social Performance. J. Bus. Ethics 2016, 135, 569–585. [Google Scholar] [CrossRef] [Green Version]
- Velte, P. Does ESG performance have an impact on financial performance? Evidence from Germany. J. Glob. Responsib. 2017, 8, 169–178. [Google Scholar] [CrossRef]
- Taliento, M.; Favino, C.; Netti, A. Impact of environmental, social, and governance information on economic performance: Evidence of a corporate ‘sustainability advantage’ from Europe. Sustainability 2019, 11, 1738. [Google Scholar] [CrossRef] [Green Version]
- Lokuwaduge, C.S.D.S.; Heenetigala, K. Integrating environmental, social and governance (esg) disclosure for a sustainable development: An australian study. Bus. Strategy Environ. 2017, 26, 438–450. [Google Scholar] [CrossRef]
- Van Beurden, P.; Gössling, T. The worth of values—A literature review on the relation between corporate social and financial performance. J. Bus. Ethics 2008, 82, 407–424. [Google Scholar] [CrossRef] [Green Version]
- Landi, G.; Sciarelli, M. Towards a more ethical market: The impact of ESG rating on corporate financial performance. Soc. Responsib. J. 2018, 15, 11–27. [Google Scholar] [CrossRef]
- Sachs, J.; Schmidt-Traub, G.; Kroll, C.; Lafortune, G.; Fuller, G.; Woelm, F. The Sustainable Development Goals and COVID-19. Sustainable Development Report 2020; Cambridge University Press: Cambridge, UK, 2020. [Google Scholar]
- Candriam. ESG Country Report. 2017. Available online: https://www.candriam.com/en/professional/market-insights/topics/sri/candriam-releases-its-2017-esg-country-report/ (accessed on 26 October 2020).
- World Bank. Doing Business 2020; World Bank: Washington, DC, USA, 2020. [Google Scholar]
- World Bank. World Bank National Accounts Data, and OECD National Accounts Data Files. 2020. Available online: https://data.worldbank.org/indicator/NY.GDP.MKTP.KD.ZG (accessed on 25 October 2020).
- Eurostat. GDP per Capita in PPS. 2020. Available online: http://appsso.eurostat.ec.europa.eu/nui/show.do?dataset=tec00114&lang=en (accessed on 29 October 2020).
- Kaplan, D. Structural Equation Modeling. In International Encyclopedia of the Social and Behavioral Sciences; Neil, J., Smelser, P., Baltes, B., Eds.; Pergamon: Oxford, UK, 2001; pp. 15215–15222. [Google Scholar]
- Everitt, B.S.; Landau, S.; Leese, M. Cluster Analysis, 4th ed.; Wiley Publishing: Hoboken, NJ, USA, 2009. [Google Scholar]
- Sarkar, S.; Searcy, C. Zeitgeist or chameleon? A quantitative analysis of CSR definitions. J. Clean. Prod. 2016, 135, 1423–1435. [Google Scholar] [CrossRef]
- Sitnikov, C.S. Triple Bottom Line. In Encyclopedia of Corporate Social Responsibility; Idowu, S.O., Capaldi, N., Zu, L., Das Gupta, A., Eds.; Springer: New York, NY, USA, 2013; pp. 2558–2564. [Google Scholar]
- Browne, M.W.; Cudeck, R. Alternative Ways of Assessing Model Fit. In Testing Structural Equation Models; SAGE: Newbury Park, CA, USA, 1993; pp. 136–162. ISBN 978-08-0394-507-4. [Google Scholar]
- Jørgensen, T.H.; Remmen, A.; Mellado, M.D. Integrated management systems—Three different levels of integration. J. Clean. Prod. 2006, 14, 713–722. [Google Scholar] [CrossRef]
- Mangra, M.G.; Cotoc, E.; Dumitru, A. Sustainable economic development through environmental management systems implementation. J. Stud. Soc. Sci. 2014, 6, 1–14. [Google Scholar]
Figure 1.
Automatic linear regression for determinants of sustainability. Source: own construction using SPSS v.20.
Figure 1.
Automatic linear regression for determinants of sustainability. Source: own construction using SPSS v.20.

Figure 2.
Multilayer perceptron model for identifying the influences of corporate responsibility on economic performance. Source: own construction using SPSS v.20.
Figure 2.
Multilayer perceptron model for identifying the influences of corporate responsibility on economic performance. Source: own construction using SPSS v.20.

Figure 3.
Diagram of relationships in modeling structural equations to determine the mediation effect between sustainability and economic growth. Source: own construction using AMOS for SPSS v20.
Figure 3.
Diagram of relationships in modeling structural equations to determine the mediation effect between sustainability and economic growth. Source: own construction using AMOS for SPSS v20.

Figure 4.
Diagram of relationships in modeling structural equations to determine the mediation effect between sustainability and economic power. Source: own construction using AMOS for SPSS v20.
Figure 4.
Diagram of relationships in modeling structural equations to determine the mediation effect between sustainability and economic power. Source: own construction using AMOS for SPSS v20.

Figure 5.
Dendrogram of clustering EU countries depending on S, CSR, CG, BE. Source: own construction using SPSS.
Figure 5.
Dendrogram of clustering EU countries depending on S, CSR, CG, BE. Source: own construction using SPSS.

Figure 6.
Concentric “sun” approach. Source: own concept.


Table 1.
Descriptive statistics.
| Variable | N | Minimum | Maximum | Mean | Std. Deviation | Skewness | Kurtosis |
|---|---|---|---|---|---|---|---|
| S | 28 | 70.80 | 84.70 | 78.2857 | 3.27354 | 0.058 | 0.088 |
| CSR | 28 | 48.75 | 93.85 | 75.4232 | 10.32313 | −0.497 | 0.036 |
| CG | 28 | 54.30 | 85.30 | 75.9286 | 6.04366 | −0.392 | 1.191 |
| BE | 28 | 66.10 | 85.30 | 76.4750 | 4.51373 | −0.273 | −0.016 |
| GDPg | 28 | −1.03 | 7.06 | 2.3950 | 1.46557 | 0.835 | 3.287 |
| GDPw | 28 | 53 | 261 | 102.11 | 42.038 | 2.360 | 7.238 |
| Valid N (listwise) | 28 |
Source: developed by authors using SPSS.
Table 2.
Correlations between Sustainability, Corporate Governance, Corporate Social Responsibility, and Business Ethics.
Table 2.
Correlations between Sustainability, Corporate Governance, Corporate Social Responsibility, and Business Ethics.
| S | CSR | CG | BE | ||
|---|---|---|---|---|---|
| S | Correlation Coefficient | 1.000 | 0.131 | 0.566 ** | 0.609 ** |
| Sig. (2-tailed) | 0.505 | 0.002 | 0.001 | ||
| N | 28 | 28 | 28 | 28 | |
| CSR | Correlation Coefficient | 0.131 | 1.000 | 0.134 | 0.062 |
| Sig. (2-tailed) | 0.505 | 0.497 | 0.755 | ||
| N | 28 | 28 | 28 | 28 | |
| CG | Correlation Coefficient | 0.566 ** | 0.134 | 1.000 | 0.709 ** |
| Sig. (2-tailed) | 0.002 | 0.497 | 0.000 | ||
| N | 28 | 28 | 28 | 28 | |
| BE | Correlation Coefficient | 0.609 ** | 0.062 | 0.709 ** | 1.000 |
| Sig. (2-tailed) | 0.001 | 0.755 | 0.000 | ||
| N | 28 | 28 | 28 | 28 |
Source: own construction using SPSS v.20. Note: ** significant correlation.
Table 3.
The predictors of the multilayer perceptron model.
| Predictor | Predicted | |||||
|---|---|---|---|---|---|---|
| Hidden Layer 1 | Output Layer | |||||
| H(1:1) | GDPg | GDPw | Importance | Normalized Importance | ||
| Input Layer | (Bias) | −0.055 | ||||
| CSR | 0.041 | 0.029 | 4.0% | |||
| CG | 1.035 | 0.729 | 100.0% | |||
| BE | 0.309 | 0.242 | 33.2% | |||
| Hidden Layer 1 | (Bias) | 0.068 | 0.047 | |||
| H(1:1) | 0.422 | 0.781 | ||||
Source: own construction using SPSS v.20.
Table 4.
Standardized effects recorded among variables of structural equation modeling to determine the mediation effect between sustainability and economic growth.
Table 4.
Standardized effects recorded among variables of structural equation modeling to determine the mediation effect between sustainability and economic growth.
| Total Standardized Effects | Direct Standardized Effects | Indirect Standardized Effects | ||||||||||||
|---|---|---|---|---|---|---|---|---|---|---|---|---|---|---|
| S | BE | CSR | CG | S | BE | CSR | CG | S | BE | CSR | CG | |||
| BE | 0.577 | 0.000 | 0.000 | 0.000 | BE | 0.577 | 0.000 | 0.000 | 0.000 | BE | 0.000 | 0.000 | 0.000 | 0.000 |
| CSR | 0.157 | 0.000 | 0.000 | 0.000 | CSR | 0.157 | 0.000 | 0.000 | 0.000 | CSR | 0.000 | 0.000 | 0.000 | 0.000 |
| CG | 0.509 | 0.000 | 0.000 | 0.000 | CG | 0.509 | 0.000 | 0.000 | 0.000 | CG | 0.000 | 0.000 | 0.000 | 0.000 |
| GDPg | 0.007 | 0.312 | 0.137 | 0.014 | GDPg | −0.202 | 0.312 | 0.137 | 0.014 | GDPg | 0.209 | 0.000 | 0.000 | 0.000 |
Source: Developed by authors based on data collected using AMOS for SPSS v20.
Table 5.
Standardized effects recorded between structural equation modeling variables to determine the mediation effect between sustainability and economic power.
Table 5.
Standardized effects recorded between structural equation modeling variables to determine the mediation effect between sustainability and economic power.
| Total Standardized Effects | Direct Standardized Effects | Indirect Standardized Effects | ||||||||||||
|---|---|---|---|---|---|---|---|---|---|---|---|---|---|---|
| S | BE | CSR | CG | S | BE | CSR | CG | S | BE | CSR | CG | |||
| BE | 0.509 | 0.000 | 0.000 | 0.000 | BE | 0.509 | 0.000 | 0.000 | 0.000 | BE | 0.000 | 0.000 | 0.000 | 0.000 |
| CSR | 0.577 | 0.000 | 0.000 | 0.000 | CSR | 0.577 | 0.000 | 0.000 | 0.000 | CSR | 0.000 | 0.000 | 0.000 | 0.000 |
| CG | 0.157 | 0.000 | 0.000 | 0.000 | CG | 0.157 | 0.000 | 0.000 | 0.000 | CG | 0.000 | 0.000 | 0.000 | 0.000 |
| GDPw | 0.084 | 0.487 | −0.126 | 0.175 | GDPw | −0.119 | 0.487 | −0.126 | 0.175 | GDPw | 0.203 | 0.000 | 0.000 | 0.000 |
Source: Developed by authors based on data collected using AMOS for SPSS v20.
Table 6.
Agglomeration schedule.
| Stage | Cluster Combined | Coefficients | Appears | Next Stage | ||
|---|---|---|---|---|---|---|
| Cluster 1 | Cluster 2 | Cluster 1 | Cluster 2 | |||
| 1 | 8 | 22 | 1.000 | 0 | 0 | 7 |
| 2 | 5 | 26 | 0.999 | 0 | 0 | 4 |
| 3 | 7 | 11 | 0.999 | 0 | 0 | 8 |
| 4 | 5 | 25 | 0.998 | 2 | 0 | 10 |
| 5 | 13 | 24 | 0.998 | 0 | 0 | 7 |
| 6 | 2 | 27 | 0.998 | 0 | 0 | 9 |
| 7 | 8 | 13 | 0.996 | 1 | 5 | 13 |
| 8 | 7 | 20 | 0.996 | 3 | 0 | 11 |
| 9 | 2 | 10 | 0.995 | 6 | 0 | 15 |
| 10 | 5 | 28 | 0.994 | 4 | 0 | 23 |
| 11 | 1 | 7 | 0.994 | 0 | 8 | 15 |
| 12 | 6 | 15 | 0.993 | 0 | 0 | 14 |
| 13 | 4 | 8 | 0.992 | 0 | 7 | 16 |
| 14 | 6 | 9 | 0.991 | 12 | 0 | 17 |
| 15 | 1 | 2 | 0.991 | 11 | 9 | 21 |
| 16 | 4 | 21 | 0.989 | 13 | 0 | 20 |
| 17 | 6 | 19 | 0.987 | 14 | 0 | 21 |
| 18 | 12 | 16 | 0.984 | 0 | 0 | 22 |
| 19 | 14 | 18 | 0.982 | 0 | 0 | 27 |
| 20 | 3 | 4 | 0.981 | 0 | 16 | 22 |
| 21 | 1 | 6 | 0.977 | 15 | 17 | 23 |
| 22 | 3 | 12 | 0.974 | 20 | 18 | 25 |
| 23 | 1 | 5 | 0.973 | 21 | 10 | 24 |
| 24 | 1 | 17 | 0.966 | 23 | 0 | 26 |
| 25 | 3 | 23 | 0.965 | 22 | 0 | 26 |
| 26 | 1 | 3 | 0.933 | 24 | 25 | 27 |
| 27 | 1 | 14 | 0.899 | 26 | 19 | 0 |
Source: own construction SPSS v.20.
Table 7.
Cluster I.
| Country | S (Score) | CSR (Score) | CG (Score) | BE (Score) | GDPg (Percentage) | GDPw (Percentage) |
|---|---|---|---|---|---|---|
| Bulgaria | 74.8 | 65.13 | 72.0 | 72.0 | 2.75 | 53 |
| Croatia | 78.4 | 66.30 | 73.6 | 73.6 | 1.48 | 65 |
| Estonia | 80.1 | 81.47 | 80.6 | 80.6 | 4.43 | 84 |
| Greece | 74.3 | 48.75 | 68.4 | 68.4 | −1.03 | 68 |
| Hungary | 77.3 | 71.86 | 73.4 | 73.4 | 3.14 | 73 |
| Latvia | 77.7 | 62.21 | 80.3 | 80.3 | 3.56 | 69 |
| Poland | 78.1 | 85.75 | 76.4 | 76.4 | 3.72 | 73 |
| Portugal | 77.6 | 77.77 | 76.5 | 76.5 | 1.01 | 79 |
| Romania | 74.8 | 93.85 | 73.3 | 73.3 | 3.78 | 69 |
| Slovakia | 77.5 | 69.22 | 75.6 | 75.6 | 2.56 | 74 |
| Mean values of cluster | 77.06 | 72.23 | 75.01 | 75.01 | 2.54 | 70.70 |
| Mean values at UE level | 78.29 | 75.42 | 75.93 | 76.48 | 2.40 | 102.11 |
Source: own construction using SPSS.
Table 8.
Cluster II.
| Country | S (Score) | CSR (Score) | CG (Score) | BE (Score) | GDPg (Percentage) | GDPw (Percentage) |
|---|---|---|---|---|---|---|
| Austria | 70.8 | 82.9 | 78.7 | 78.7 | 1.73 | 127 |
| Belgium | 80 | 72.62 | 75.0 | 75.0 | 1.65 | 117 |
| Cyprus | 75.2 | 61.56 | 73.4 | 73.4 | 1.63 | 89 |
| Czech Republic | 80.6 | 80.54 | 76.3 | 76.3 | 2.50 | 92 |
| Denmark | 84.6 | 86.35 | 85.3 | 85.3 | 2.02 | 129 |
| Finland | 83.8 | 86.35 | 80.2 | 80.2 | 1.46 | 111 |
| France | 81.1 | 73.77 | 76.8 | 76.8 | 1.58 | 106 |
| Germany | 80.8 | 85.62 | 79.7 | 79.7 | 1.84 | 121 |
| Italy | 77.0 | 86.8 | 72.9 | 72.9 | 0.45 | 95 |
| Lithuania | 75.0 | 77.43 | 54.3 | 81.6 | 3.72 | 82 |
| Malta | 76.0 | 87.52 | 66.1 | 66.1 | 2.87 | 99 |
| Netherlands | 80.4 | 78.56 | 76.1 | 76.1 | 1.75 | 128 |
| Slovenia | 79.8 | 66.96 | 76.5 | 76.5 | 2.04 | 88 |
| Spain | 78.1 | 65.45 | 77.9 | 77.9 | 1.55 | 91 |
| Sweden | 84.7 | 73.09 | 82.0 | 82.0 | 2.35 | 120 |
| United Kingdom | 79.8 | 77.97 | 83.5 | 83.5 | 2.01 | 105 |
| Mean values of cluster | 79.23 | 77.72 | 75.92 | 77.63 | 1.95 | 106.25 |
| Mean values at UE level | 78.29 | 75.42 | 75.93 | 76.48 | 2.40 | 102.11 |
Source: own construction using SPSS.
Table 9.
Subcluster of Cluster II.
| Country | S (Score) | CSR (Score) | CG (Score) | BE (Score) | GDPg (Percentage) | GDPw (Percentage) |
|---|---|---|---|---|---|---|
| Austria | 70.8 | 82.9 | 78.7 | 78.7 | 1.73 | 127 |
| Belgium | 80.0 | 72.62 | 75.0 | 75.0 | 1.65 | 117 |
| Denmark | 84.6 | 86.35 | 85.3 | 85.3 | 2.02 | 129 |
| France | 81.1 | 73.77 | 76.8 | 76.8 | 1.58 | 106 |
| Germany | 80.8 | 85.62 | 79.7 | 79.7 | 1.84 | 121 |
| Netherlands | 80.4 | 78.56 | 76.1 | 76.1 | 1.75 | 128 |
| Sweden | 84.7 | 73.09 | 82.0 | 82.0 | 2.35 | 120 |
| Mean values of subcluster | 80.34 | 78.99 | 79.09 | 79.09 | 1.85 | 121.14 |
| Mean values of cluster | 79.23 | 77.72 | 75.92 | 77.63 | 1.95 | 106.25 |
| Mean values at UE level | 78.29 | 75.42 | 75.93 | 76.48 | 2.40 | 102.11 |
Source: own construction using SPSS.
Table 10.
Tools used by CG, CSR, and BE to ensure sustainability.
| Domain | Tools |  Organizational sustainability implementation program | Output | Directions |
| Corporate governance | Corporate governance codes | Sustainable development | Economic vector | |
| Social responsibility of the organization | Initiatives in the area of social responsibility; Standards (ISO 26000); Tools for measuring social and environmental performance | Social vector | ||
| Business ethics | Codes of ethics; Codes of conduct | Environmental vector |
Source: own concept.
Publisher’s Note: MDPI stays neutral with regard to jurisdictional claims in published maps and institutional affiliations. |
© 2021 by the authors. Licensee MDPI, Basel, Switzerland. This article is an open access article distributed under the terms and conditions of the Creative Commons Attribution (CC BY) license (http://creativecommons.org/licenses/by/4.0/).
Share and Cite
MDPI and ACS Style
Vărzaru, A.A.; Bocean, C.G.; Nicolescu, M.M. Rethinking Corporate Responsibility and Sustainability in Light of Economic Performance. Sustainability 2021, 13, 2660. https://doi.org/10.3390/su13052660
AMA Style
Vărzaru AA, Bocean CG, Nicolescu MM. Rethinking Corporate Responsibility and Sustainability in Light of Economic Performance. Sustainability. 2021; 13(5):2660. https://doi.org/10.3390/su13052660
Chicago/Turabian StyleVărzaru, Anca Antoaneta, Claudiu George Bocean, and Michael Marian Nicolescu. 2021. "Rethinking Corporate Responsibility and Sustainability in Light of Economic Performance" Sustainability 13, no. 5: 2660. https://doi.org/10.3390/su13052660
Note that from the first issue of 2016, this journal uses article numbers instead of page numbers. See further details here.