
An MCDM Model for Sustainable Decision-Making in Municipal Residential Buildings Facilities Management


1
Faculty of Civil Engineering and Architecture, Kaunas University of Technology, 51367 Kaunas, Lithuania
2
Institute of Architecture and Construction, Kaunas University of Technology, 44405 Kaunas, Lithuania
3
Faculty of Business Management, Vilnius Gediminas Technical University, 10223 Vilnius, Lithuania
4
School of Engineering, Frederick University, Nicosia 1036, Cyprus
*
Author to whom correspondence should be addressed.
Sustainability 2021, 13(5), 2820; https://doi.org/10.3390/su13052820
Submission received: 19 January 2021
/
Revised: 21 February 2021
/
Accepted: 2 March 2021
/
Published: 5 March 2021
(This article belongs to the Special Issue Sustainable Real Estate: Management, Assessment and Innovations)
Abstract
:Measuring and monitoring sustainability plays an essential role in impact assessment of global changes and development. Multi-criteria decision-making (MCDM) represents a reliable and adequate technique for assessing sustainability, especially in the field of municipal buildings management, where numerous parameters and criteria are involved. This study presents an MCDM model for the sustainable decision-making, tailored to municipal residential buildings facilities management. The main outcome of this research concerned normalized and weighted decision-making matrixes, based on the complex proportion assessment (COPRAS) and weighted aggregated sum product assessment (WASPAS) methods, applied for ranking investment alternatives related to the management of the buildings. The delivered model was applied to 20 municipal buildings of Kaunas city municipality, located in Lithuania, which an EU member state employing practices and regulations in accordance with the EU acquis, as well as a former Soviet Republic. The proposed model aspires to enhance sustainability practices in the management of municipal buildings and to demonstrate a solid tool that will allow informed decision-making in the building management sector.
1. Introduction
The United Nations stated that by 2050, 68% of the earth’s population is projected to be urban, which is about 14% more than in 2018 [1]. In order to adopt the 2030 Agenda for Sustainable Growth, including attempts to forge a new urban development system, it is important to consider the key developments in urbanization that are likely to unfold over the coming years [2]. According to Eurostat data in 2018, 26.1% of final energy consumption belongs to households [3], being 0.5% more than in 2015 [4]. To meet the increasing housing needs, societies should proactively account for future demands. Municipalities are anticipated to have a significant role under this context, mainly due to the fact that they manage social housing, which currently consists of the main affordable housing for thousands of families around Europe and worldwide.
Advanced practices in construction management and engineering involve complex methods and applications, which deliver an increased amount of data, resulting in the need for developing tools and methodologies for data management [5,6]. The use of data, new information, and communication technologies has led to sustainable developments related to established sustainable development goals (SDGs), including SDG 7 (Affordable and clean energy), SDG 11 (Sustainable Cities and Communities), SDG13 (Climate action), and others [2,7,8].
Sustainable construction sets the boundaries of morality, ethics, and performance in the architectural and construction sectors. It creates the necessary conditions for cost-effective processes that reduce negative environmental impacts and save energy as well as natural resources.
In order to promote sustainable construction management practices, one should employ advanced methodologies, including digitalization and enhanced decision-making techniques, such as multi-criteria decision-making. Digitization drives the changes in the Industrial 4.0 revolution in the construction sector. With the help of digitization, new business models are anticipated to be created, focusing on the integration of equipment, the IT systems, and people. [9]. Sustainable decision-making [2,7,8,10,11,12] stands for decision-making that contributes to the transition to sustainable society [7]. The significance of reducing resources consumption in building sector has been underlined in the recent past in numerous studies [13,14,15,16].
Multi-criteria decision-making (MCDM) application in the sustainability field has been constantly growing by presenting the potential of applying MCDM methods for sustainable decision-making in civil engineering, construction building technology, public environmental occupational health, social issues, and multidisciplinary engineering. In order to justify the backgrounds of this study and to emphasize its novelty, we conducted an analysis of scientific articles. The Clarivate Analytics (Web of Science) database was employed, aiming to elucidate the prevalence of the application of MCDM methods in construction-related scientific publications. Studies employing MCDM methods were identified and articles related to measuring, monitoring, and applying MCDM in the sustainability field were identified (Figure 1).
The number of studies using the keywords “MCDM” and “Sustainability” that were filtered for the years 2016–2020 is shown in Figure 1.
The literature overview reveals that although MCDM is trending in buildings sustainability management, and analysis of specific types of buildings, providing further insights in building management practices, are still to be conducted. The significance of municipal building management has been justified in the recent past in numerous studies [13,16,17] The main research goal of this study was to develop and to introduce a comprehensive MCDM model for the sustainability assessment of municipal buildings. The proposed model is based on the generation of a priority que of facilities compliance regulations, delivering recommendations on the management of social housing, and meeting the minimum established criteria on the basis of the economic ratio calculations. The proposed model can also be used for the optimization of government and municipal facilities management, incorporating the concept of social sustainability into the technical assessment and management of buildings. The level of detail of the information demonstrated in this study allows for the development of the backend and frontend of an appropriate application, enabling the replication and establishment of the proposed model. The MCDM model demonstrated in this study considers related SDGs to the building sector, resulting in decision-making tailored to the needs of informed resources consumption, and is in line with the requirements of the EU policy on research efficient Europe. It is also a consumer-centric model that satisfies building users comfort needs in more efficient buildings, leading to social sustainability. The research purpose was to present a new perspective of sustainability through sustainable decision-making methods and to present residential buildings facilities management model for municipalities [17,18] that are based on MCDM techniques by using complex proportion assessment (COPRAS) [19] and weighted aggregated sum product assessment (WASPAS) [20,21] methods.
2. Research Methodology for the Evaluation and Sustainable Decision-Making in Municipal Residential Buildings Facilities Management
2.1. Application Levels of the Municipal Social Housing Evaluation Model
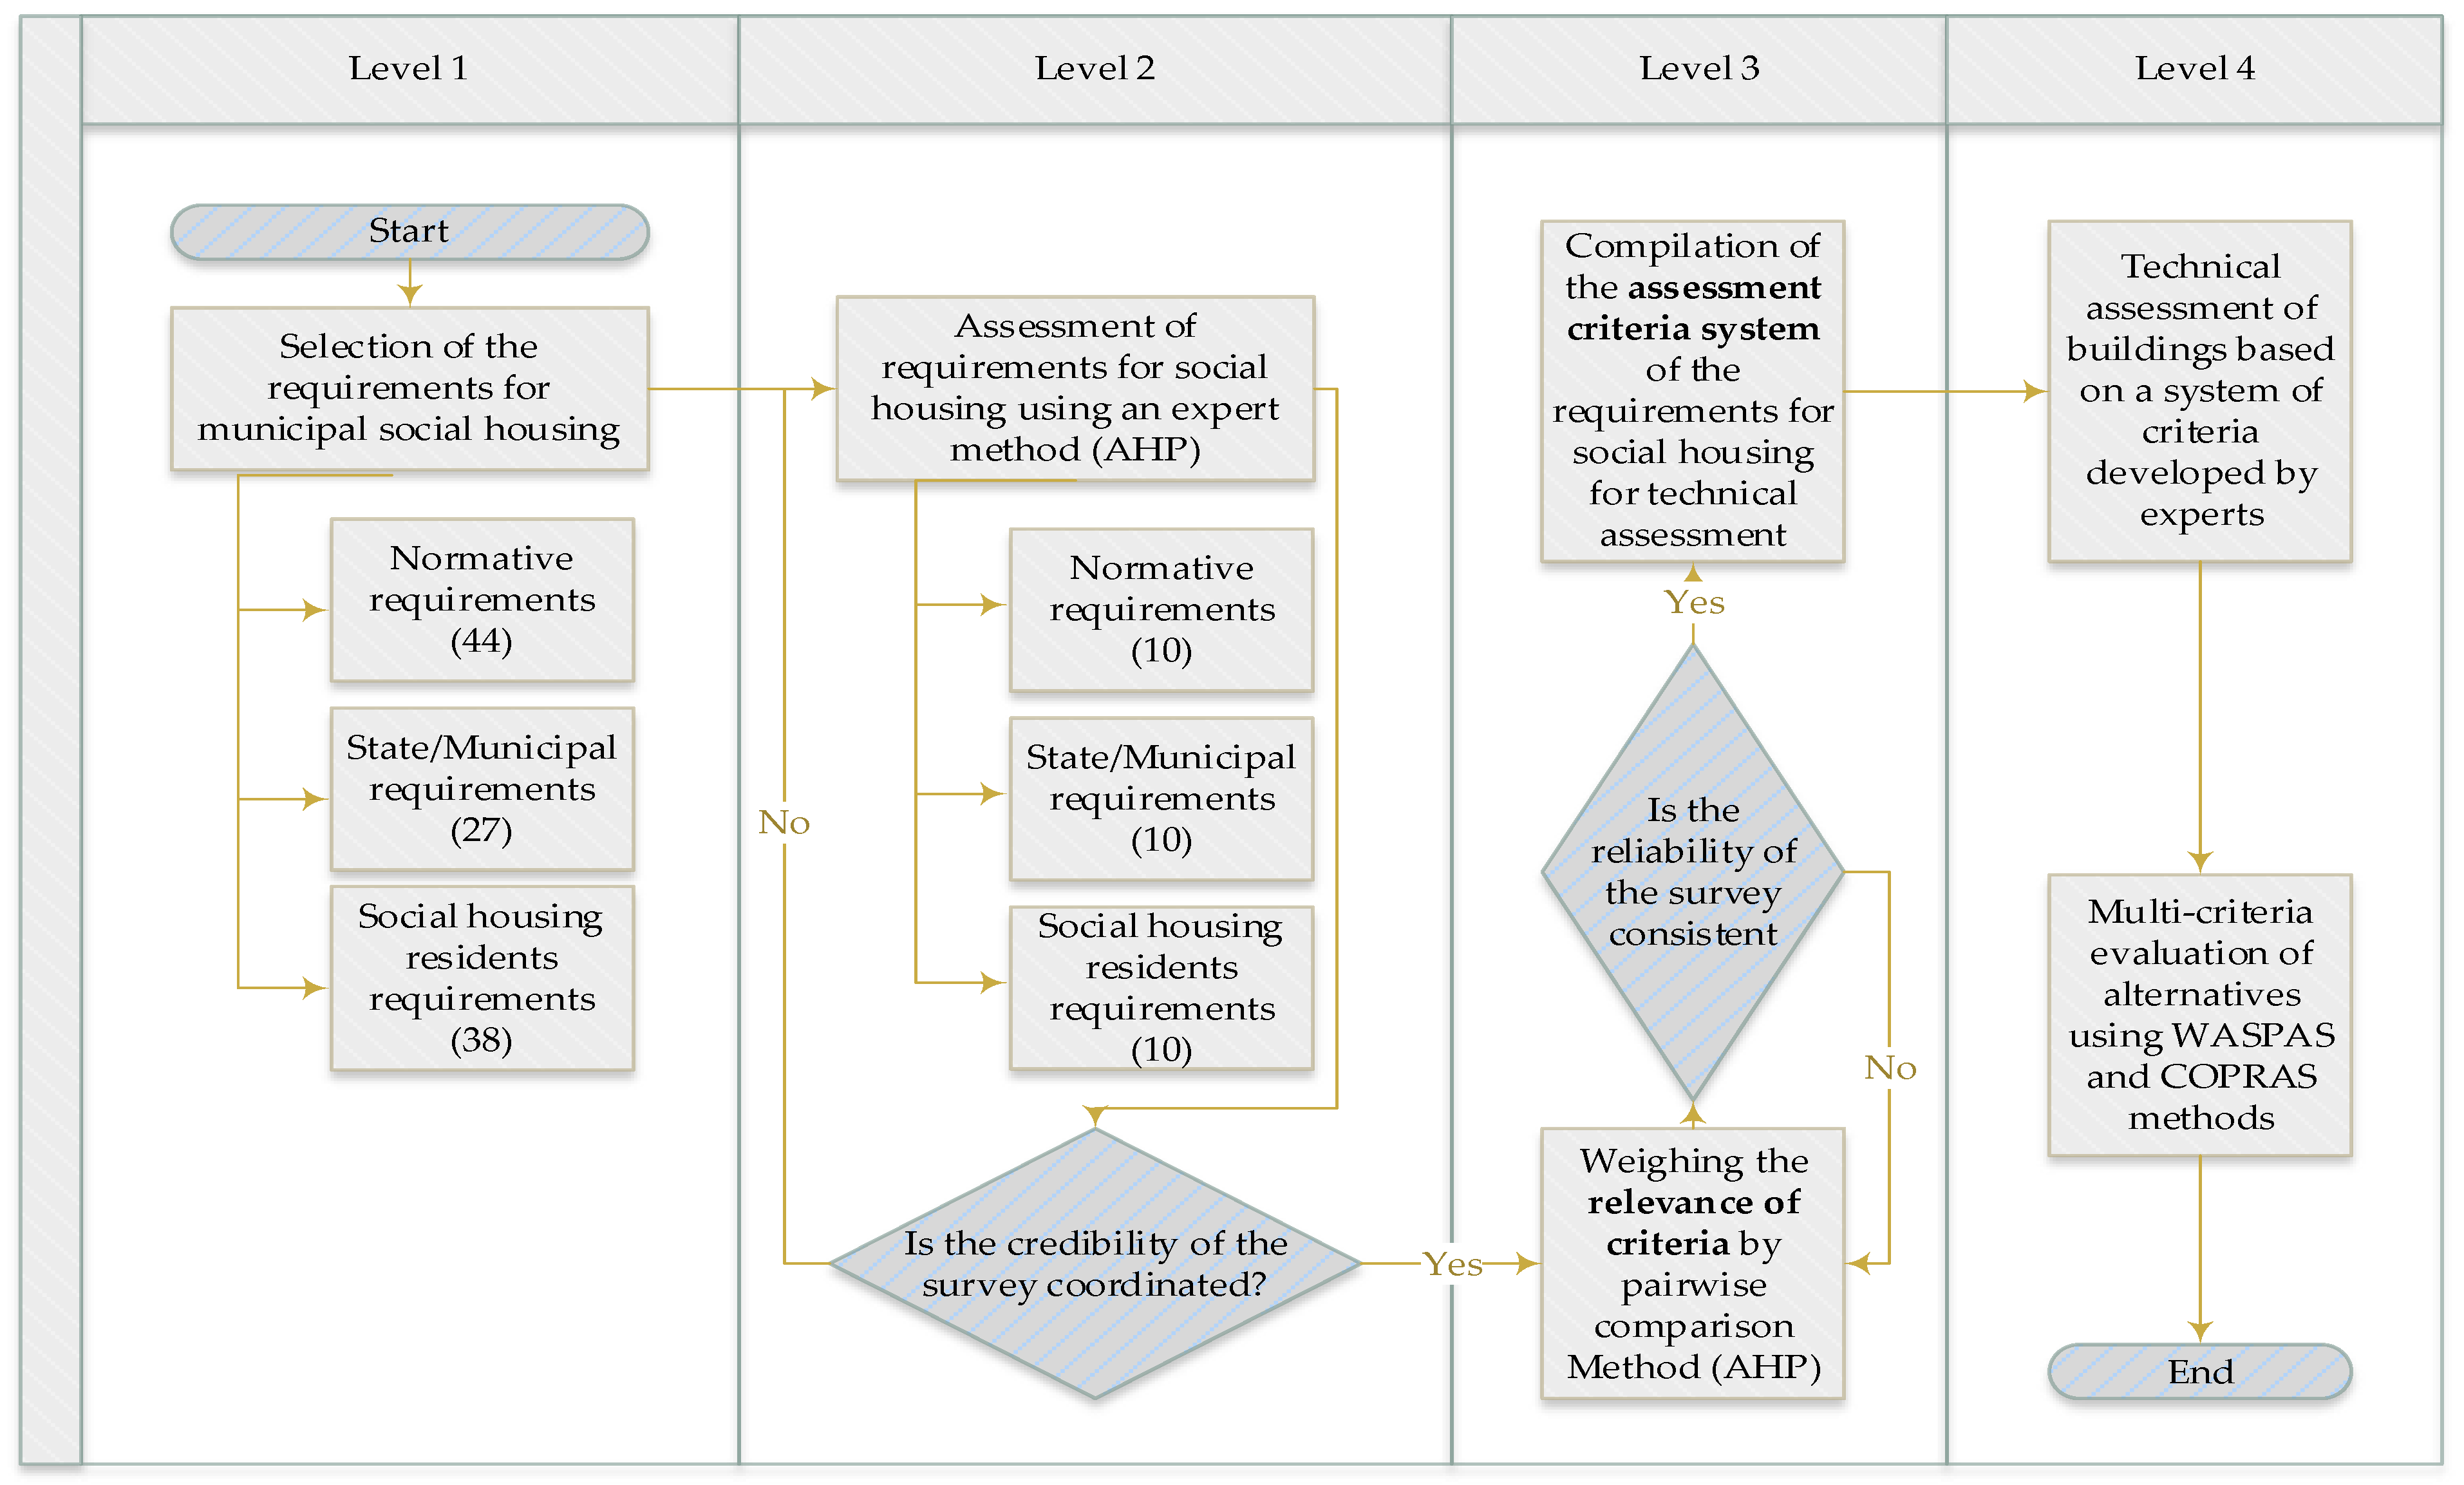
The municipal social housing assessment method developed by the authors includes the required elements for a comprehensive decision-making scheme. In particular, the scheme is based on a system of normative documents, the requirements for municipal social housing, as well as the compliance of social housing residents’ needs for their housing and environment with the established requirements. The methodology also includes a ranking procedure according to the requirements described, presented in Figure 2.
The proposed model consists of the following key levels:
The first level is the development of a system of requirements for municipal buildings by normative documents, functions assigned to municipalities, and other needs of building residents assigned to buildings. One hundred and nine requirements were selected in the analysis of normative documents, municipal requirements, and the needs of the residents of social housing. A survey of 63 residents of social housing was conducted, with the aim to identify the requirements of social housing tenants.
The second level is the optimization of the requirements system by selecting the most important requirements with the use of an expert method.
The work aimed to reduce the number of requirements for social housing buildings and to select the 109 most important from each group of requirements, according to which the municipal buildings would be assessed. The priorities of the requirements according to the normative documents, municipal requirements for the social housing, and residents of premises requirements were determined by the expert method. A group of 43 national level experts was set up for this purpose. It consisted of certified construction engineers, maintenance managers, and researchers. The experts analyzed the compliance of the buildings with the submitted requirements and presented their assessments on a 10-point scale, where 1 was the highest rank, and 10 was the least significant criterion.
A selection of the 10 requirements for each group with the lowest sum of evaluation scores is presented in Table 1. From here on, xn1, xm1, and xr1 mark criteria (n—the criteria of the requirements applicable by regulations, m—the criteria of requirements applicable by municipalities, r—the criteria of resident’s requirements applicable to social housing). The selected sets of requirements were named as criteria for assessing the condition of buildings. The reliability of the survey was checked, and the calculations revealed that the survey was reliable; thus, its results could be used for further calculations.
The third step in optimizing the system of building criteria is to determine the significance of the criteria for municipal residential buildings—qij. At this stage, a group of 34 experts completed a paired comparison (AHP, analytic hierarchy process) questionnaire to determine the significance of the criteria using the AHP method [22]. The method is convenient to use as the criteria can be compared in pairs [22,23,24,25].
Only duly completed questionnaires were evaluated (11, 13, and 10). Initially, the ranking of criteria was performed according to the obtained data (Appendix A, Table A1, Table A2 and Table A3). The averages of the significance of the criteria obtained by experts were calculated, the compatibility of the survey was checked, and a system of evaluation criteria for municipal social housing buildings was created. The consistency index (S) of all three expert groups was sufficient, with a significance level of 0.01 [26,27,28,29]. The last step was to calculate the significance values of the criteria, which were calculated according to the methodology described below:
- The pairwise comparison of the criteria, xi and xj is denoted by xij, where i, j = 1,..., n. xij is the ratio of ranks of criteria i and j, which were presented by the expert. The criteria were compared in pairs and their numerical priority values were determined. The results of the pairwise comparison table are written in matrix P [17]:The pairwise comparison matrix is inverse, symmetric, i.e.,
- Each element of column P of the matrix is divided by the sum of the elements of that column:This gives a new matrix B:
- The arithmetic mean of the elements of rows B of the matrix and gives the significance values of the respective criteria according to the matrix of the pairwise comparison of one expert:
The significance of the criteria (Appendix A, Table A4, Table A5 and Table A6) obtained according to Equations (1)–(4) can be used in further calculations if the compatibility of the pairwise comparison matrix P is sufficient, i.e., the elements of the matrix P satisfy the condition of transitivity:
where A, B, and C are elements of the same set.
The research results allowed the team to identify 30 criteria that make up the municipal social housing building assessment system, which is used in the next stages to perform a technical assessment of buildings. It is important to note that municipal buildings can be assessed according to each group of criteria separately. Thus, the analysis would be more detailed or all together. In our case, the buildings were assessed by covering the whole system of criteria, each of them setting the significance level 1/3. The developed model is easily applied to any buildings, and municipal social housing was chosen because Lithuania faces the most problems in managing this real estate.
Last step—technical assessment and rating of buildings in accordance with the criteria system presented in paragraphs below.
2.2. Technical Assessment of the Facilities Following the System of Facilities Assessment Criteria
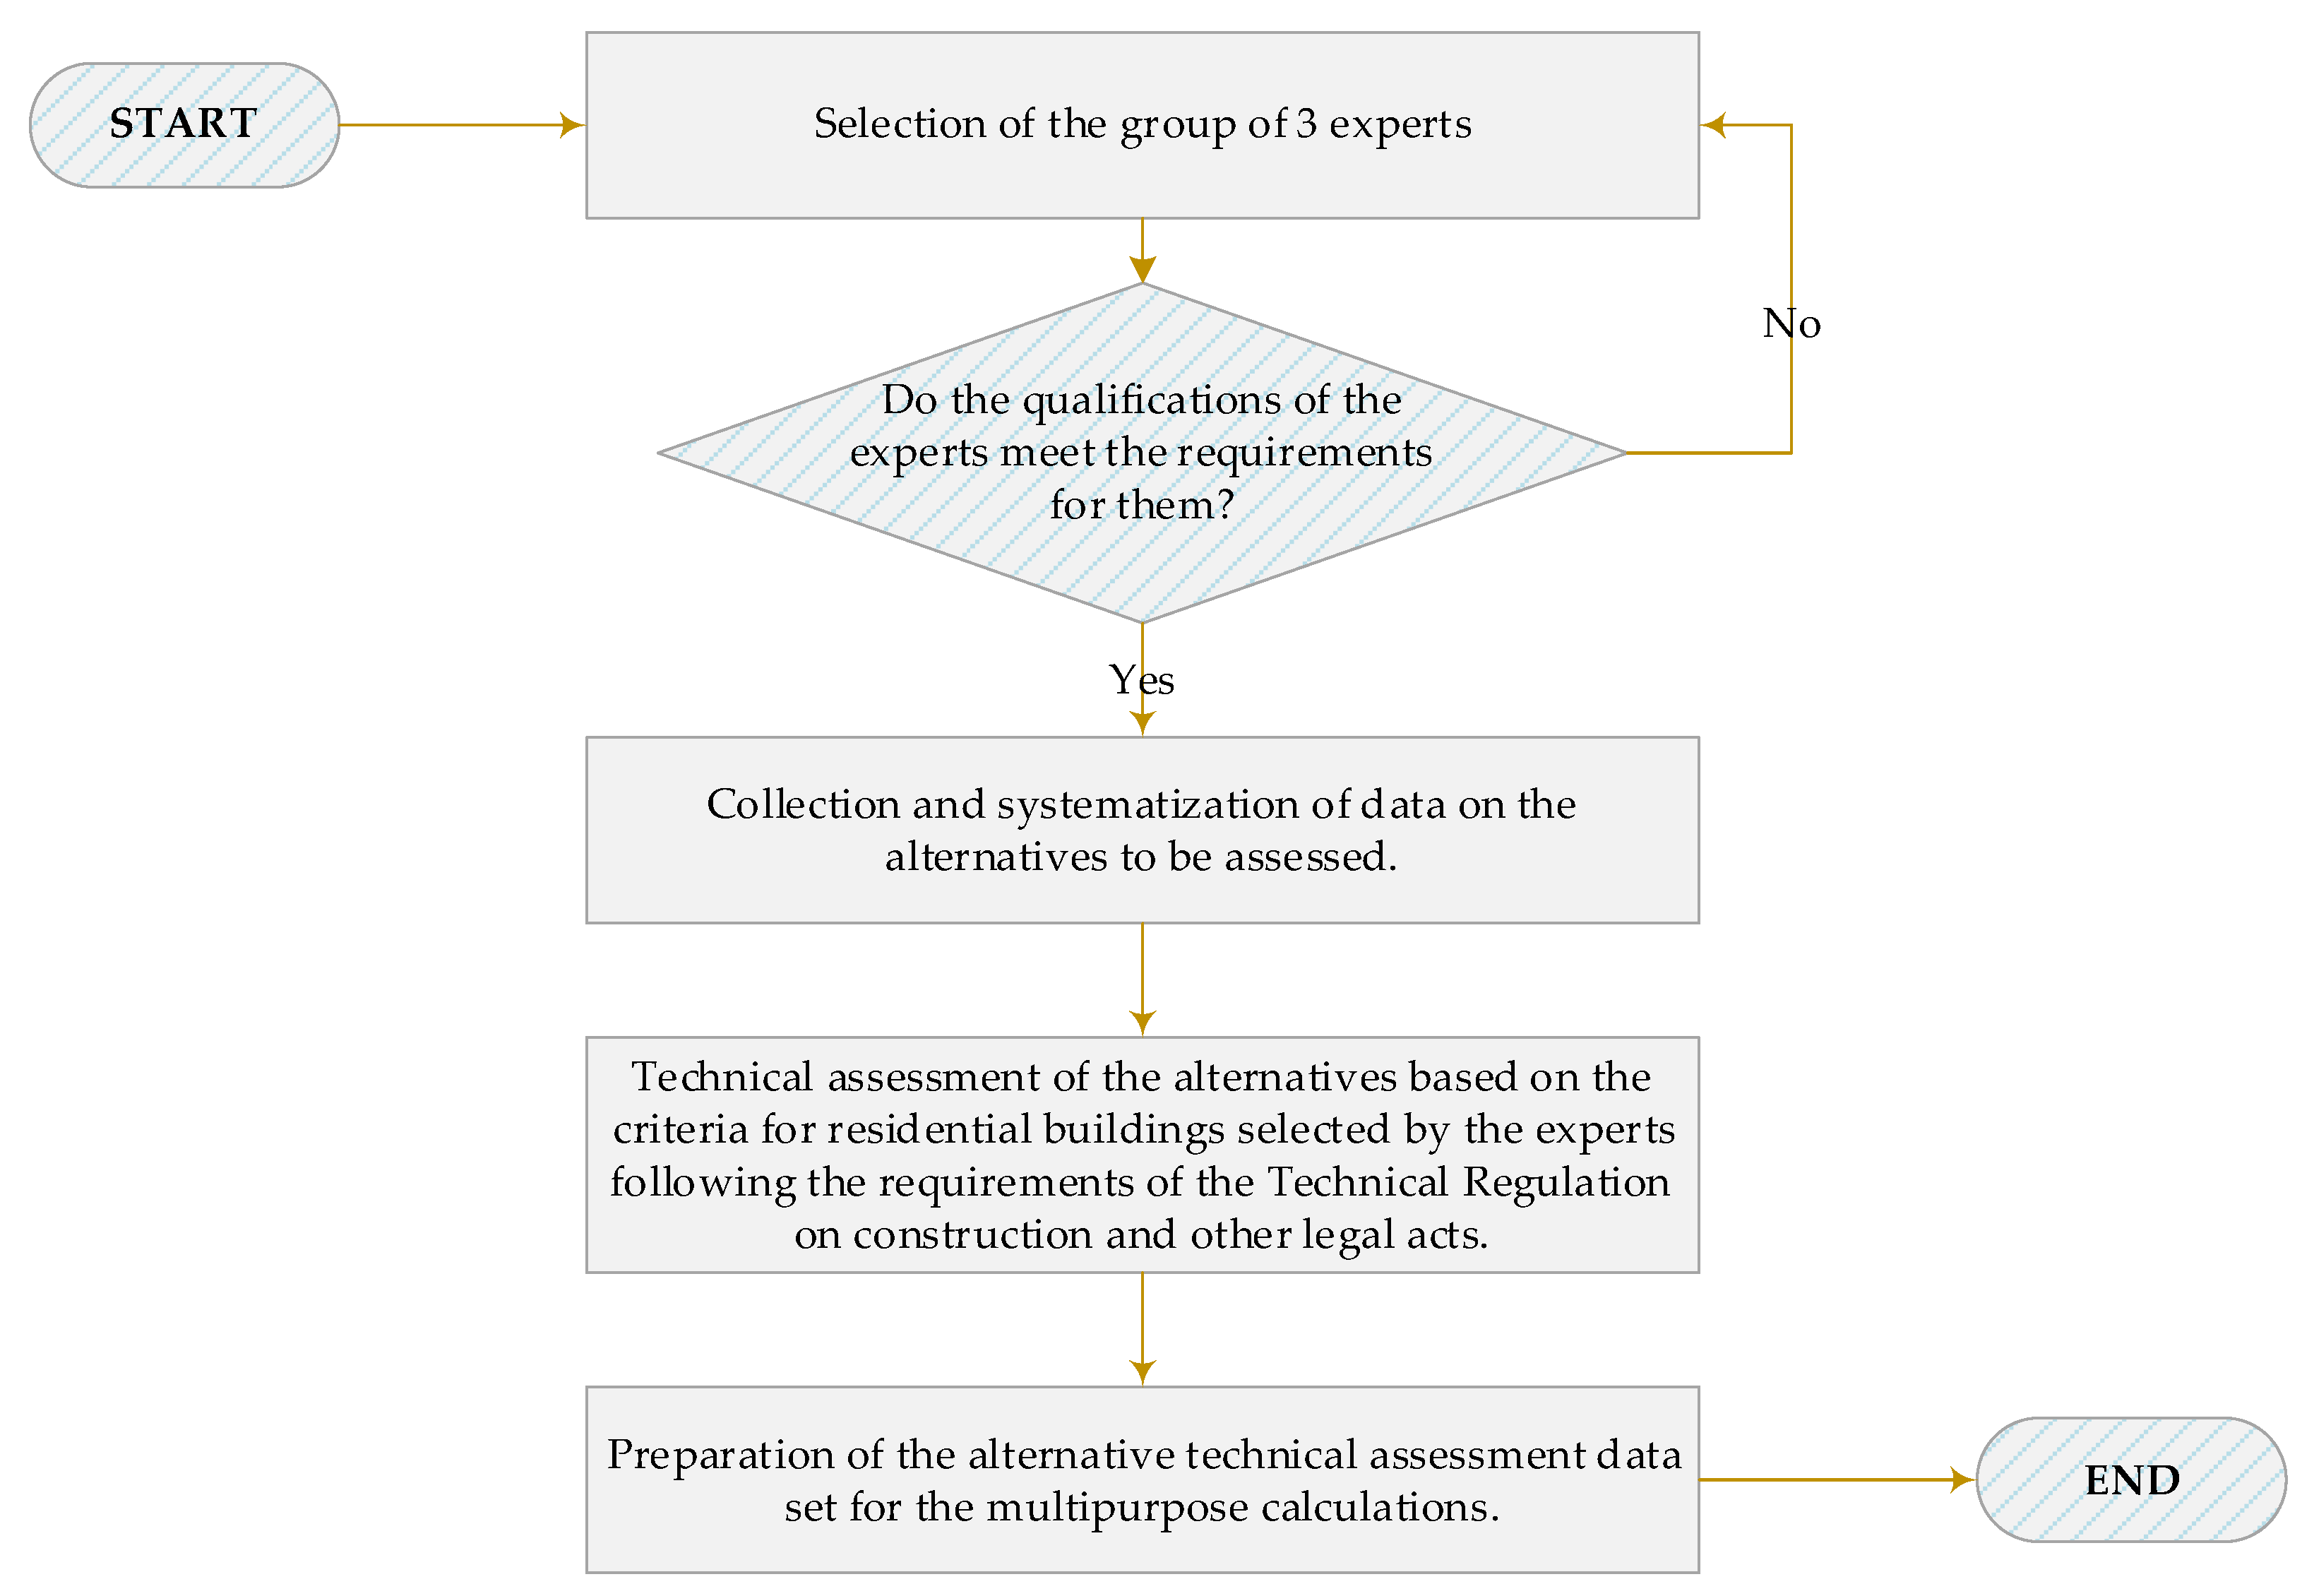
After assessing the significance of the criteria, we performed a technical assessment of social housing. Its stages (Figure 3) are described in this section.
In the first stage, a group of experts consisting of at least three certified building experts, maintenance managers, or engineers with at least 10 years’ experience in construction were selected. These experts undertook an independent assessment of the designated buildings according to social housing requirements chosen by experts by the Technical Regulation on Construction [30] and other normative acts, using the experience and the necessary standard testing methods.
The second step was to collect and systematize data on the alternatives under assessment.
The third stage was the technical assessment of alternatives according to the criteria of the requirements for municipal social housing selected by the expert group.
The fourth stage was the preparation of alternative technical assessment data for multi-criteria calculations.
2.3. Methodology for Multi-Criteria Decision-Making Methods, Case Study, and Results
This case study was calculated according to the two most successfully applied multi-criteria decision-making (MCDM) methods: weighted aggregated sum product assessment (WASPAS) [21,22] and complex proportion assessment (COPRAS) [20]. The fact that the selected MCDM methods are appropriate and successfully used for this type of case study is proven by a series of research [17,31,32]. The AHP method was selected for weighting criteria for COPRAS method, which also includes an additive version of AHP and is actively being used for this type of case study’s calculations. The WASPAS method basically combines additive and multiplicative versions of AHP. Many case studies, which were calculated by the authors, were related with the main direction towards sustainable goals.
Normalized values of the j criterion for i alternative with COPRAS method are calculated on the basis of Equation (6). Regarding the direction of optimization of the line of particular criteria, we chose the following normalization formulas: if criteria are minimizing, thus normalization for WASPAS method is carried out with Equation (7); if criteria are maximizing—Equation (8). For the WASPAS method, normalized and weighted values are calculated separately for the summarizing of determination and separately for the multiplication section, and are implemented with the help of Equations (9) and (10), respectively.
From here on, xij is the value of j criterion for i alternative; m is the number of alternatives, n is the number of criteria; q is the weight of a criterion.
If optimal value is minimizing
Final determination is carried out by applying the following formulas: Equation (11) for COPRAS method, and Equation (12) for WASPAS method.
where
S+j—the sum of maximizing values from j row’s alternative.
S−j—the sum of minimizing values from j row’s alternative.
3. Modelling the Sustainable Decision-Making Process: The Case of Lithuanian Municipal Buildings
In order to evaluate the proposed method, we applied the municipal social housing evaluation model for the case of Lithuanian municipal buildings. The developed method is based on a system of requirements for municipal social housing buildings, as well as on the determination of their compliance with the declared needs. The scheme delivers a ranking according to the methodology of technical assessment of buildings.
With the collapse of the Soviet Union in 1990, Lithuania regained its independence, and the Lithuanian state and municipalities took over a large part of the real estate. However, 30 years after the restoration of independence, the 2020 audit of state real estate management [34] revealed real estate management problems—no institution has a summary of real estate and how much it is transferred to municipalities. In many cases, municipalities do not possess sufficient information concerning their building properties. One-third of the municipalities managing the state do not have accurate information about the state real estate managed by the right of trust [34]. According to 2020 data concerning Lithuanian building stock, housing stock in 2019 increased by 10.4 thousand (0.7%) compared to 2018, and amounted to 1.5 million dwellings [34]. The useful floor area of dwellings in Lithuania was 102.4 million m2 and increased by 1 million m2 (1%) over the year. Private ownership accounted for 98.6% of the housing stock, with the remainder owned by the state and municipalities. The useful floor area of the housing stock was 62.1 million m2 in urban areas and 40.3 million m2 in rural areas (Table 2).
At the end of 2019, there were 531 dwellings per 1000 inhabitants in Lithuania (as of 31 December 2018—527 dwellings). The average useful floor area per capita was 36.7 m2. Of these, in urban areas—33 m2, in rural areas—44.1 m2. The average size of private housing (Table 3) was 69.5 m2, of which 63.3 m2 was in the city and 81.7 m2 in the countryside. State and municipal dwellings were smaller. The average size of one dwelling was 49.1 m2, in urban areas—45.5 m2, and in rural areas—60.9 m2.
During the technical assessment process, 20 social housing buildings of Kaunas City Municipality were randomly selected. This number was chosen according to the smallest municipality in Lithuania, which has the same number of social housing buildings as in our case. This choice confirms that the model works with a minimum number of buildings.
Information on buildings, energy consumption, air condition in the district, and other necessary data was also collected by official registers, JSC “Kauno energija”, Environmental Protection Agency, Information Technology and Communications Department, and independent real estate appraisers. A group of three experts appointed by the municipality assessed the condition of the municipality’s social housing by filling in questionnaires according to the provided criteria.
A common system of assessment criteria must be used for the technical assessment of buildings at least every 5 years. Because the evaluation criteria have different measurement dimensions, we chose multi-criteria evaluation methods for the calculations. The investigated MCDM case study was defined with the use of 20 different alternatives, described with 10 criteria of each group. The initial decision-making matrix is presented in (Appendix A, Table A4, Table A5 and Table A6). The criteria were weighted with the help of pairwise questioner, in which representatives from different interest parties participated. The results of pairwise matrix were determined with the AHP method. The normalized and weighted decision-making matrix for COPRAS method’s calculations, the normalized matrix for WASPAS method, and the normalized and weighted matrix for multiplication part are presented in Appendix A (Table A7, Table A8 and Table A9).
The main results and rank of calculations are described and presented in Appendix A (Table A10). On the basis of the MCDM findings, results of Kaunas City Municipality, and research data, we found that 20% of the social housing buildings at the end of the priority queue were in the worst condition, namely, No. 8, No. 14, No. 15, and No. 16. The calculations included a detailed assessment of the alternatives for each criterion as well as the highest non-compliance. Considering the condition of social housing after conducting a technical assessment of buildings and prioritizing them, we present possible alternatives depending on the property’s condition. We suggest three groups of social housing, after a multi-criteria assessment:
- usable social housing;
- the need for social housing;
- social housing, which the municipality should disclaim.
Usable social housing refers to buildings that meets all the requirements but need minor repair or ongoing maintenance. Municipalities must evaluate the lack of social housing, consider possible alternatives, and choose only those that meet all the requirements after assessment. Social housing, which the municipality should disclaim, could be leased, sold, or rented.
According to each criterion’s significance, it is necessary to identify the priorities and required investment, as well as decide which is suitable for social housing but require ongoing maintenance, renovation, or repair.
The following economic indices of the structures at the end of the priority queue is calculated after the assessment of municipal social housing on the basis of the selected criteria of the three groups: the construction value of the facility, the reconstruction cost (construction) value of the apartment, the amortization value, and the reconstruction value (Table 4).
The economic indicators of the municipal social housing buildings that meet the system of criteria the least are calculated: construction, reconstruction costs, and amortization values to facilitate decision-making. These economic indices of facilities at the end of the municipal real estate priority que are computed by evaluating the municipal social housing on the basis of the selected three groups of criteria: construction value of the object, reconstruction price (construction) apartment value, depreciation value, and reconstruction value (Table 4). Buildings with a value of 61 to 100% of the essential requirements of the building fall into the third group—social housing, which the municipality should disclaim. Such real estate is in a state of emergency, unsuitable for use, and it is not profitable for municipalities to renovate it. The same is confirmed by the calculated economic indices presented in Table 4—for example, alternative 8. The amortization value of this property (26143.71 EUR) is twice as high as its reconstruction value (12876.75 EUR), and the apartment reconstruction cost value (39020.46 EUR) is only one-third higher than the amortization value.
4. Conclusions
In this study, a four-stage decision-making model for municipal buildings management was developed and demonstrated. The developed model is based on a decision-making methodology that identifies the worst-case real estate, for which strategic decisions have to be made in municipalities. The proposed model is based on 109 requirements of three groups for social housing buildings. Using expert assessment methods, we reduced the requirements to 30 (10 normative, 10 municipal, and 10 resident requirements) in order to simplify and speed up the decision-making process. After optimizing the building criteria system, the significance of residential building criteria is determined by the AHP method. In the third stage, the survey’s compatibility is verified, and a system of evaluation criteria is developed for municipal residential buildings with calculated significances, which allow for assessing the importance of each criterion in a more detailed evaluation process. The last stage of the model is dedicated to the technical assessment of buildings according to the developed system of three groups of criteria used by the MCDM methods—WASPAS and COPRAS, in order to model the decision-making process in municipalities. The model developed in this study delivers informed decisions on sustainability aspects related to sustainable development goals (SDGs), including SDG 7 (affordable and clean energy), SDG 11 (sustainable cities and communities), SDG13 (climate action), and others.
According to the developed methodology, the inventory and monitoring of buildings can be simplified. The model allows for the evaluation of numerous aspects of real estate properties including the need for a property, suitability for its functions, efficiency, optimization measures, staff needs for property maintenance, and condition and maintenance costs. By optimizing real estate management, the need for buildings decreases, more efficient buildings better meet users’ needs, less energy is used, and environmental pollution is mitigated. One of the main outcomes of the proposed model concerns recommendations for the management, use, and disposal of municipal buildings, in accordance with the principles of public law, rationality, management efficiency, and economic benefits.
Author Contributions
Conceptualization, E.K., R.B. and P.A.F.; methodology, E.K., M.M. and R.B.; calculations, M.M. and E.K.; validation, M.M. and E.K.; investigation, E.K.; resources, E.K. and M.M.; data curation, E.K.; writing—original draft preparation, E.K. and M.M.; writing—review and editing, P.A.F.; visualization, E.K.; supervision, R.B. and P.A.F.; project administration, E.K., R.B., M.M. and P.A.F. All authors have read and agreed to the published version of the manuscript.
Funding
This research received no external funding.
Institutional Review Board Statement
Not applicable.
Informed Consent Statement
Not applicable.
Data Availability Statement
Not applicable.
Conflicts of Interest
The authors declare no conflict of interest.
Appendix A

Table A1.
Rankings of criteria for social housing requirements in normative documents according to 11 experts [17].
Table A1.
Rankings of criteria for social housing requirements in normative documents according to 11 experts [17].
| Expert No. | xn1 | xn2 | xn3 | xn4 | xn5 | xn6 | xn7 | xn8 | xn9 | xn10 | S |
|---|---|---|---|---|---|---|---|---|---|---|---|
| Expert 1 | 1 | 3 | 4 | 2 | 6 | 8 | 5 | 7 | 9 | 10 | 0.11434 |
| Expert 2 | 1 | 2 | 4 | 3 | 6 | 8 | 5 | 7 | 9 | 10 | 0.066306 |
| Expert 3 | 1 | 3 | 4 | 2 | 7 | 8 | 5 | 6 | 9 | 10 | 0.102355 |
| Expert 4 | 1 | 3 | 4 | 2 | 5 | 7 | 6 | 8 | 9 | 10 | 0.093 |
| Expert 6 | 1 | 10 | 4 | 2 | 5 | 6 | 3 | 8 | 7 | 9 | 0.058 |
| Expert 7 | 1 | 3 | 4 | 2 | 6 | 8 | 5 | 7 | 9 | 10 | 0.096 |
| Expert 8 | 1 | 4 | 3 | 2 | 6 | 7 | 8 | 5 | 9 | 10 | 0.068 |
| Expert 16 | 1 | 8 | 3 | 2 | 6 | 5 | 7 | 4 | 9 | 10 | 0.092 |
| Expert 17 | 1 | 3 | 4 | 2 | 7 | 8 | 5 | 6 | 9 | 10 | 0.101 |
| Expert 18 | 1 | 3 | 4 | 2 | 5 | 6 | 7 | 8 | 9 | 10 | 0.091 |
| Expert 32 | 1 | 4 | 3 | 2 | 5 | 6 | 7 | 8 | 9 | 10 | 0.104 |
Table A2.
Municipal requirements for social housing and rank of their criteria according to 13 experts [17].
Table A2.
Municipal requirements for social housing and rank of their criteria according to 13 experts [17].
| Expert No. | xm1 | xm2 | xm3 | xm4 | xm5 | xm6 | xm7 | xm8 | xm9 | xm10 | S |
|---|---|---|---|---|---|---|---|---|---|---|---|
| Expert 27 | 2 | 3 | 6 | 5 | 4 | 7 | 8 | 9 | 1 | 10 | 0.095 |
| Expert 1 | 1 | 2 | 6 | 5 | 4 | 9 | 8 | 7 | 3 | 10 | 0.07 |
| Expert 2 | 1 | 2 | 6 | 5 | 4 | 9 | 8 | 7 | 3 | 10 | 0.07 |
| Expert 3 | 1 | 2 | 6 | 5 | 4 | 9 | 8 | 7 | 3 | 10 | 0.069 |
| Expert 5 | 1 | 2 | 6 | 4 | 5 | 9 | 8 | 7 | 3 | 10 | 0.108 |
| Expert 7 | 2 | 3 | 6 | 4 | 5 | 9 | 8 | 7 | 1 | 10 | 0.102 |
| Expert 34 | 1 | 3 | 6 | 5 | 4 | 9 | 7 | 8 | 2 | 10 | 0.022 |
| Expert 9 | 2 | 3 | 6 | 5 | 4 | 7 | 8 | 9 | 1 | 10 | 0.092 |
| Expert 10 | 1 | 3 | 6 | 5 | 4 | 9 | 7 | 8 | 2 | 10 | 0.022 |
| Expert 14 | 1 | 3 | 6 | 5 | 4 | 9 | 8 | 7 | 2 | 10 | 0.12 |
| Expert 15 | 1 | 4 | 6 | 5 | 3 | 9 | 7 | 8 | 2 | 10 | 0.041 |
| Expert 23 | 1 | 2 | 6 | 5 | 4 | 9 | 8 | 7 | 3 | 10 | 0.07 |
| Expert 29 | 2 | 3 | 6 | 5 | 4 | 7 | 8 | 9 | 1 | 10 | 0.092 |
Table A3.
Residents of social housing requirements and rank of their criteria according to 10 experts [17].
Table A3.
Residents of social housing requirements and rank of their criteria according to 10 experts [17].
| Expert No. | xr1 | xr2 | xr3 | xr4 | xr5 | xr6 | xr7 | xr8 | xr9 | xr10 | S |
|---|---|---|---|---|---|---|---|---|---|---|---|
| Expert 1 | 1 | 3 | 6 | 5 | 4 | 9 | 7 | 8 | 2 | 10 | 0.022 |
| Expert 6 | 1 | 10 | 4 | 2 | 5 | 6 | 3 | 8 | 7 | 9 | 0.058 |
| Expert 3 | 3 | 5 | 10 | 2 | 8 | 9 | 7 | 4 | 1 | 6 | 0.085 |
| Expert 7 | 1 | 3 | 4 | 2 | 6 | 8 | 5 | 7 | 9 | 10 | 0.096 |
| Expert 8 | 1 | 4 | 3 | 2 | 6 | 7 | 8 | 5 | 9 | 10 | 0.068 |
| Expert 18 | 1 | 3 | 4 | 2 | 5 | 6 | 7 | 8 | 9 | 10 | 0.091 |
| Expert 32 | 1 | 4 | 3 | 2 | 5 | 6 | 7 | 8 | 9 | 10 | 0.104 |
| Expert 5 | 1 | 4 | 3 | 2 | 5 | 7 | 6 | 8 | 9 | 10 | 0.124 |
| Expert 16 | 1 | 8 | 3 | 2 | 6 | 5 | 7 | 4 | 9 | 10 | 0.092 |
| Expert 17 | 1 | 3 | 4 | 2 | 7 | 8 | 5 | 6 | 9 | 10 | 0.101 |
Table A4.
The initial decision-making matrix, which presents the values of the criteria for social housing requirements in the normative documents and their significances qj [17].
Table A4.
The initial decision-making matrix, which presents the values of the criteria for social housing requirements in the normative documents and their significances qj [17].
| Criteria | ||||||||||
|---|---|---|---|---|---|---|---|---|---|---|
| xn1 | xn2 | xn3 | xn4 | xn5 | xn6 | xn7 | xn8 | xn9 | xn10 | |
| max | min | min | max | min | min | min | max | max | min | |
| qj | 0.309 | 0.113 | 0.114 | 0.148 | 0.07 | 0.066 | 0.068 | 0.069 | 0.025 | 0.018 |
| A1 | 75 | 10.42 | 15 | 125 | 10 | 45 | 21 | 6 | 4 | 2 |
| A2 | 84 | 8.32 | 20 | 125 | 41 | 21 | 20 | 7 | 3 | 1 |
| A3 | 70 | 10.42 | 30 | 125 | 49 | 51 | 19 | 7 | 3.5 | 1 |
| A4 | 92 | 10.81 | 10 | 125 | 25 | 21 | 15 | 6 | 4.5 | 1 |
| A5 | 81 | 8.69 | 27 | 125 | 40 | 35 | 10 | 7 | 3 | 1 |
| A6 | 91 | 7.24 | 10 | 125 | 21 | 20 | 15 | 8 | 3 | 1 |
| A7 | 66 | 9.54 | 40 | 125 | 40 | 35 | 15 | 5 | 2.5 | 1 |
| A8 | 33 | 18.32 | 90 | 65 | 75 | 100 | 51 | 3 | 2 | 1 |
| A9 | 93 | 11.98 | 10 | 125 | 21 | 10 | 15 | 7 | 3 | 2 |
| A10 | 93 | 11.98 | 10 | 125 | 21 | 10 | 15 | 7 | 3 | 2 |
| A11 | 93 | 11.98 | 10 | 125 | 21 | 10 | 15 | 7 | 3 | 2 |
| A12 | 93 | 11.98 | 10 | 125 | 21 | 20 | 15 | 7 | 3 | 2 |
| A13 | 99 | 7.24 | 5 | 125 | 21 | 20 | 15 | 8 | 2.5 | 1 |
| A14 | 63 | 16.68 | 60 | 125 | 61 | 40 | 40 | 4 | 3 | 1 |
| A15 | 28 | 18.98 | 85 | 125 | 65 | 61 | 41 | 3 | 4 | 1 |
| A16 | 63 | 14.67 | 60 | 125 | 40 | 41 | 41 | 6 | 3 | 1 |
| A17 | 69 | 15.97 | 75 | 125 | 40 | 55 | 35 | 6 | 2.5 | 1 |
| A18 | 100 | 7.18 | 5 | 100 | 10 | 2 | 1 | 9 | 3.5 | 1 |
| A19 | 100 | 7.38 | 5 | 100 | 10 | 2 | 1 | 9 | 3 | 1 |
| A20 | 99 | 7.6 | 5 | 100 | 10 | 2 | 1 | 9 | 3.5 | 1 |
| OPT | 100 | 7.18 | 5 | 125 | 10 | 2 | 1 | 9 | 4.5 | 1 |
Table A5.
The initial decision-making matrix, which presents the values of the criteria for municipal requirements for social housing and their significance qj [17].
Table A5.
The initial decision-making matrix, which presents the values of the criteria for municipal requirements for social housing and their significance qj [17].
| Criteria | ||||||||||
|---|---|---|---|---|---|---|---|---|---|---|
| xm1 | xm2 | xm3 | xm4 | xm5 | xm6 | xm7 | xm8 | xm9 | xm10 | |
| max | min | min | min | min | min | min | min | min | max | |
| qj | 0.238 | 0.143 | 0.066 | 0.107 | 0.114 | 0.031 | 0.033 | 0.036 | 0.212 | 0.019 |
| A1 | 75 | 0.47 | 1 | 1091 | 3 | 2 | 4 | 1 | 1 | 0.4 |
| A2 | 84 | 0.37 | 1 | 367 | 7 | 1 | 4 | 1 | 1 | 0.7 |
| A3 | 70 | 0.47 | 1 | 960 | 7 | 1 | 4 | 1 | 1 | 0.8 |
| A4 | 92 | 0.49 | 1 | 324 | 7 | 1 | 4 | 1 | 1 | 0.8 |
| A5 | 81 | 0.38 | 1 | 239 | 7 | 1 | 4 | 1 | 1 | 0.6 |
| A6 | 91 | 0.33 | 1 | 830 | 7 | 1 | 4 | 1 | 1 | 0.7 |
| A7 | 66 | 0.43 | 1 | 630 | 7 | 1 | 4 | 2 | 1 | 0.7 |
| A8 | 33 | 0.71 | 3 | 52 | 7 | 1 | 3 | 1 | 1 | 1 |
| A9 | 93 | 0.54 | 1 | 231 | 7 | 2 | 3 | 1 | 1 | 0.5 |
| A10 | 93 | 0.54 | 1 | 233 | 7 | 2 | 2 | 1 | 1 | 0.5 |
| A11 | 93 | 0.54 | 1 | 233 | 7 | 2 | 3 | 1 | 1 | 0.5 |
| A12 | 93 | 0.54 | 1 | 270 | 7 | 2 | 4 | 1 | 1 | 0.6 |
| A13 | 99 | 0.33 | 1 | 378 | 7 | 1 | 3 | 1 | 1 | 0.6 |
| A14 | 63 | 0.76 | 1 | 381 | 7 | 1 | 4 | 1 | 1 | 0.6 |
| A15 | 28 | 0.65 | 3 | 460 | 7 | 1 | 3 | 2 | 1 | 0.7 |
| A16 | 63 | 0.67 | 1 | 590 | 7 | 1 | 3 | 1 | 1 | 0.6 |
| A17 | 69 | 0.73 | 1 | 187 | 7 | 1 | 3 | 1 | 1 | 0.7 |
| A18 | 100 | 0.25 | 1 | 1063 | 2 | 1 | 2 | 1 | 1 | 1 |
| A19 | 100 | 0.25 | 1 | 1063 | 2 | 1 | 2 | 1 | 1 | 1 |
| A20 | 99 | 0.26 | 1 | 1063 | 2 | 1 | 4 | 1 | 1 | 1 |
| OPT | 100 | 0.25 | 1 | 52 | 2 | 1 | 2 | 1 | 1 | 1 |
Table A6.
The initial decision-making matrix, which presents the values of the criteria of social housing residents for social housing and their significance qj [17].
Table A6.
The initial decision-making matrix, which presents the values of the criteria of social housing residents for social housing and their significance qj [17].
| Criteria | ||||||||||
|---|---|---|---|---|---|---|---|---|---|---|
| xr1 | xr2 | xr3 | xr4 | xr5 | xr6 | xr7 | xr8 | xr9 | xr10 | |
| min | max | min | max | max | min | min | min | min | min | |
| qj | 0.281 | 0.107 | 0.101 | 0.142 | 0.073 | 0.061 | 0.061 | 0.07 | 0.08 | 0.024 |
| A1 | 169 | 8 | 1 | 7 | 0.4 | 5 | 5 | 1 | 25 | 4 |
| A2 | 200 | 7 | 2 | 10 | 0.7 | 40 | 10 | 1 | 27 | 4 |
| A3 | 146 | 5 | 1 | 8 | 0.8 | 30 | 5 | 1 | 40 | 4 |
| A4 | 162 | 8 | 2 | 8 | 0.8 | 30 | 5 | 1 | 20 | 2 |
| A5 | 106 | 7 | 3 | 8 | 0.6 | 60 | 5 | 1 | 28 | 4 |
| A6 | 100 | 9 | 1 | 9 | 0.7 | 10 | 5 | 1 | 19 | 2 |
| A7 | 63 | 5 | 5 | 7 | 0.7 | 55 | 5 | 2 | 30 | 3 |
| A8 | 39 | 3 | 5 | 6 | 1 | 21 | 80 | 2 | 75 | 3 |
| A9 | 104 | 9 | 1 | 9 | 0.5 | 21 | 1 | 1 | 15 | 2 |
| A10 | 104 | 9 | 1 | 8 | 0.5 | 21 | 1 | 1 | 15 | 2 |
| A11 | 104 | 9 | 1 | 8 | 0.5 | 21 | 1 | 1 | 15 | 2 |
| A12 | 104 | 9 | 1 | 8 | 0.6 | 5 | 5 | 1 | 19 | 2 |
| A13 | 100 | 9 | 1 | 9 | 0.6 | 5 | 5 | 1 | 19 | 2 |
| A14 | 180 | 6 | 5 | 10 | 0.6 | 35 | 50 | 1 | 47 | 4 |
| A15 | 65 | 2 | 2 | 10 | 0.7 | 5 | 80 | 1 | 56 | 4 |
| A16 | 229 | 5 | 4 | 9 | 0.6 | 10 | 35 | 1 | 40 | 4 |
| A17 | 168 | 6 | 3 | 9 | 0.7 | 45 | 35 | 2 | 43 | 4 |
| A18 | 24 | 10 | 2 | 8 | 1 | 21 | 1 | 1 | 4 | 2 |
| A19 | 26 | 10 | 2 | 8 | 1 | 21 | 1 | 1 | 4 | 2 |
| A20 | 20 | 10 | 2 | 8 | 1 | 21 | 1 | 1 | 4 | 2 |
| OPT | 20 | 10 | 1 | 10 | 1 | 5 | 1 | 1 | 4 | 2 |
Table A7.
Normalized and weighted decision-making matrix for COPRAS method (developed by the authors).
Table A7.
Normalized and weighted decision-making matrix for COPRAS method (developed by the authors).
| A1 | 0.01126183 | 0.0069217 | 0.00275 | 0.0109664 | 0.0028264 | 0.00248 | 0.0019701 | 0.0016364 | 0.0106 | 0.0005429 |
| A2 | 0.01261325 | 0.005449 | 0.00275 | 0.003689 | 0.006595 | 0.00124 | 0.0019701 | 0.0016364 | 0.0106 | 0.0009500 |
| A3 | 0.01051104 | 0.0069217 | 0.00275 | 0.0096496 | 0.006595 | 0.00124 | 0.0019701 | 0.0016364 | 0.0106 | 0.0010857 |
| A4 | 0.01381451 | 0.0072163 | 0.00275 | 0.0032567 | 0.006595 | 0.00124 | 0.0019701 | 0.0016364 | 0.0106 | 0.0010857 |
| A5 | 0.01216278 | 0.0055963 | 0.00275 | 0.0024023 | 0.006595 | 0.00124 | 0.0019701 | 0.0016364 | 0.0106 | 0.0008143 |
| A6 | 0.01366435 | 0.0048599 | 0.00275 | 0.0083429 | 0.006595 | 0.00124 | 0.0019701 | 0.0016364 | 0.0106 | 0.0009500 |
| A7 | 0.00991041 | 0.0063326 | 0.00275 | 0.0063326 | 0.006595 | 0.00124 | 0.0019701 | 0.0032727 | 0.0106 | 0.0009500 |
| A8 | 0.00495521 | 0.0104562 | 0.00825 | 0.0005227 | 0.006595 | 0.00124 | 0.0014776 | 0.0016364 | 0.0106 | 0.0013571 |
| A9 | 0.01396467 | 0.0079526 | 0.00275 | 0.0023219 | 0.006595 | 0.00248 | 0.0014776 | 0.0016364 | 0.0106 | 0.0006786 |
| A10 | 0.01396467 | 0.0079526 | 0.00275 | 0.002342 | 0.006595 | 0.00248 | 0.0009851 | 0.0016364 | 0.0106 | 0.0006786 |
| A11 | 0.01396467 | 0.0079526 | 0.00275 | 0.002342 | 0.006595 | 0.00248 | 0.0014776 | 0.0016364 | 0.0106 | 0.0006786 |
| A12 | 0.01396467 | 0.0079526 | 0.00275 | 0.002714 | 0.006595 | 0.00248 | 0.0019701 | 0.0016364 | 0.0106 | 0.0008143 |
| A13 | 0.01486562 | 0.0048599 | 0.00275 | 0.0037995 | 0.006595 | 0.00124 | 0.0014776 | 0.0016364 | 0.0106 | 0.0008143 |
| A14 | 0.00945994 | 0.0111926 | 0.00275 | 0.0038297 | 0.006595 | 0.00124 | 0.0019701 | 0.0016364 | 0.0106 | 0.0008143 |
| A15 | 0.00420442 | 0.0095726 | 0.00825 | 0.0046238 | 0.006595 | 0.00124 | 0.0014776 | 0.0032727 | 0.0106 | 0.0009500 |
| A16 | 0.00945994 | 0.0098671 | 0.00275 | 0.0059305 | 0.006595 | 0.00124 | 0.0014776 | 0.0016364 | 0.0106 | 0.0008143 |
| A17 | 0.01036088 | 0.0107508 | 0.00275 | 0.0018797 | 0.006595 | 0.00124 | 0.0014776 | 0.0016364 | 0.0106 | 0.0009500 |
| A18 | 0.01501577 | 0.0036818 | 0.00275 | 0.0106849 | 0.0018843 | 0.00124 | 0.0009851 | 0.0016364 | 0.0106 | 0.0013571 |
| A19 | 0.01501577 | 0.0036818 | 0.00275 | 0.0106849 | 0.0018843 | 0.00124 | 0.0009851 | 0.0016364 | 0.0106 | 0.0013571 |
| A20 | 0.01486562 | 0.003829 | 0.00275 | 0.0106849 | 0.0018843 | 0.00124 | 0.0019701 | 0.0016364 | 0.0106 | 0.0013571 |
Table A8.
Normalized and weighted matrix for summarizing part of WASPAS method (developed by the authors).
Table A8.
Normalized and weighted matrix for summarizing part of WASPAS method (developed by the authors).
| A1 | 0.1785 | 0.07606383 | 0.066 | 0.0050999 | 0.076 | 0.0155 | 0.0165 | 0.036 | 0.212 | 0.0076 |
| A2 | 0.19992 | 0.09662162 | 0.066 | 0.0151608 | 0.0325714 | 0.031 | 0.0165 | 0.036 | 0.212 | 0.0133 |
| A3 | 0.16660 | 0.07606383 | 0.066 | 0.0057958 | 0.0325714 | 0.031 | 0.0165 | 0.036 | 0.212 | 0.0152 |
| A4 | 0.21896 | 0.07295918 | 0.066 | 0.0171728 | 0.0325714 | 0.031 | 0.0165 | 0.036 | 0.212 | 0.0152 |
| A5 | 0.19278 | 0.09407895 | 0.066 | 0.0232803 | 0.0325714 | 0.031 | 0.0165 | 0.036 | 0.212 | 0.0114 |
| A6 | 0.21658 | 0.10833333 | 0.066 | 0.0067036 | 0.0325714 | 0.031 | 0.0165 | 0.036 | 0.212 | 0.0133 |
| A7 | 0.15708 | 0.08313953 | 0.066 | 0.0088317 | 0.0325714 | 0.031 | 0.0165 | 0.018 | 0.212 | 0.0133 |
| A8 | 0.07854 | 0.05035211 | 0.022 | 0.1070000 | 0.0325714 | 0.031 | 0.0220 | 0.036 | 0.212 | 0.0190 |
| A9 | 0.22134 | 0.06620370 | 0.066 | 0.0240866 | 0.0325714 | 0.0155 | 0.0220 | 0.036 | 0.212 | 0.0095 |
| A10 | 0.22134 | 0.06620370 | 0.066 | 0.0238798 | 0.0325714 | 0.0155 | 0.0330 | 0.036 | 0.212 | 0.0095 |
| A11 | 0.22134 | 0.06620370 | 0.066 | 0.0238798 | 0.0325714 | 0.0155 | 0.0220 | 0.036 | 0.212 | 0.0095 |
| A12 | 0.22134 | 0.06620370 | 0.066 | 0.0206074 | 0.0325714 | 0.0155 | 0.0165 | 0.036 | 0.212 | 0.0114 |
| A13 | 0.23562 | 0.10833333 | 0.066 | 0.0147196 | 0.0325714 | 0.031 | 0.0220 | 0.036 | 0.212 | 0.0114 |
| A14 | 0.14994 | 0.04703947 | 0.066 | 0.0146037 | 0.0325714 | 0.031 | 0.0165 | 0.036 | 0.212 | 0.0114 |
| A15 | 0.06664 | 0.05500000 | 0.022 | 0.0120957 | 0.0325714 | 0.031 | 0.0220 | 0.018 | 0.212 | 0.0133 |
| A16 | 0.14994 | 0.05335821 | 0.066 | 0.0094305 | 0.0325714 | 0.031 | 0.0220 | 0.036 | 0.212 | 0.0114 |
| A17 | 0.16422 | 0.04897260 | 0.066 | 0.0297540 | 0.0325714 | 0.031 | 0.0220 | 0.036 | 0.212 | 0.0133 |
| A18 | 0.23800 | 0.14300000 | 0.066 | 0.0052342 | 0.1140000 | 0.031 | 0.0330 | 0.036 | 0.212 | 0.0190 |
| A19 | 0.23800 | 0.14300000 | 0.066 | 0.0052342 | 0.1140000 | 0.031 | 0.0330 | 0.036 | 0.212 | 0.0190 |
| A20 | 0.23562 | 0.137500000 | 0.066 | 0.0052342 | 0.1140000 | 0.031 | 0.0165 | 0.036 | 0.212 | 0.0190 |
Table A9.
Normalized and weighted matrix for multiplication part (developed by the authors).
| A1 | 0.933823 | 0.9136828 | 1 | 0.7220464 | 0.954829 | 0.9787417 | 0.9773858 | 1 | 1 | 0.9827411 |
| A2 | 0.9593531 | 0.9454805 | 1 | 0.8113217 | 0.8669145 | 1 | 0.9773858 | 1 | 1 | 0.9932461 |
| A3 | 0.9186146 | 0.9136828 | 1 | 0.7319971 | 0.8669145 | 1 | 0.9773858 | 1 | 1 | 0.9957692 |
| A4 | 0.9803508 | 0.9082541 | 1 | 0.8222124 | 0.8669145 | 1 | 0.9773858 | 1 | 1 | 0.9957692 |
| A5 | 0.9510852 | 0.9418817 | 1 | 0.8494225 | 0.8669145 | 1 | 0.9773858 | 1 | 1 | 0.9903413 |
| A6 | 0.9778041 | 0.9610764 | 1 | 0.7434829 | 0.8669145 | 1 | 0.9773858 | 1 | 1 | 0.9932461 |
| A7 | 0.9058399 | 0.9253786 | 1 | 0.7657428 | 0.8669145 | 1 | 0.9773858 | 0.9753555 | 1 | 0.9932461 |
| A8 | 0.7680798 | 0.8613417 | 0.9300579 | 1 | 0.8669145 | 1 | 0.9867088 | 1 | 1 | 1 |
| A9 | 0.9828765 | 0.8957217 | 1 | 0.8525226 | 0.8669145 | 0.9787417 | 0.9867088 | 1 | 1 | 0.9869165 |
| A10 | 0.9828765 | 0.8957217 | 1 | 0.8517365 | 0.8669145 | 0.9787417 | 1 | 1 | 1 | 0.9869165 |
| A11 | 0.9828765 | 0.8957217 | 1 | 0.8517365 | 0.8669145 | 0.9787417 | 0.9867088 | 1 | 1 | 0.9869165 |
| A12 | 0.9828765 | 0.8957217 | 1 | 0.83841 | 0.8669145 | 0.9787417 | 0.9773858 | 1 | 1 | 0.9903413 |
| A13 | 0.9976109 | 0.9610764 | 1 | 0.808762 | 0.8669145 | 1 | 0.9867088 | 1 | 1 | 0.9903413 |
| A14 | 0.895866 | 0.8530001 | 1 | 0.8080782 | 0.8669145 | 1 | 0.9773858 | 1 | 1 | 0.9903413 |
| A15 | 0.7386243 | 0.8722858 | 0.9300579 | 0.7919491 | 0.8669145 | 1 | 0.9867088 | 0.9753555 | 1 | 0.9932461 |
| A16 | 0.895866 | 0.8685138 | 1 | 0.7711364 | 0.8669145 | 1 | 0.9867088 | 1 | 1 | 0.9903413 |
| A17 | 0.9154742 | 0.8579268 | 1 | 0.8720177 | 0.8669145 | 1 | 0.9867088 | 1 | 1 | 0.9932461 |
| A18 | 1 | 1 | 1 | 0.7240579 | 1 | 1 | 1 | 1 | 1 | 1 |
| A19 | 1 | 1 | 1 | 0.7240579 | 1 | 1 | 1 | 1 | 1 | 1 |
| A20 | 0.9976109 | 0.9944071 | 1 | 0.7240579 | 1 | 1 | 0.9773858 | 1 | 1 | 1 |
Table A10.
The main results and rank of calculations (COPRAS and WASPAS) (developed by the authors).
Table A10.
The main results and rank of calculations (COPRAS and WASPAS) (developed by the authors).
| COPRAS | WASPAS | |
|---|---|---|
| A1 | 0.046058 | 0.62113111 |
| A2 | 0.054097 | 0.66920271 |
| A3 | 0.044846 | 0.58805007 |
| A4 | 0.0539 | 0.66802909 |
| A5 | 0.054919 | 0.67705963 |
| A6 | 0.050812 | 0.66349593 |
| A7 | 0.04604 | 0.58265386 |
| A8 | 0.040039 | 0.5683961 |
| A9 | 0.053045 | 0.66267223 |
| A10 | 0.053558 | 0.67195586 |
| A11 | 0.053023 | 0.66228297 |
| A12 | 0.052255 | 0.65216668 |
| A13 | 0.057408 | 0.71326512 |
| A14 | 0.044817 | 0.56761251 |
| A15 | 0.035293 | 0.43893124 |
| A16 | 0.044574 | 0.56598893 |
| A17 | 0.048552 | 0.61885593 |
| A18 | 0.057473 | 0.81064607 |
| A19 | 0.057473 | 0.81064607 |
| A20 | 0.055977 | 0.78744943 |
References
- United Nations. The World’s Cities in 2018, Data Booklet. Economics & Social Affairs. Department of Economic and Social Affairs. 2018. [Interactive]. Available online: https://population.un.org/wup/Publications/ (accessed on 10 January 2021).
- Jang, H.J.; Kim, B.; Kim, J.; Jung, S.Y. An Efficient Grid-Based K-Prototypes Algorithm for Sustainable Decision-Making on Spatial Objects. Sustainability 2018, 10, 2614. [Google Scholar] [CrossRef] [Green Version]
- Eurostat. Energy Consumption and Use by Households. 2020. [Interactive]. Available online: https://ec.europa.eu/eurostat/web/products-eurostat-news/-/DDN-20200626-1 (accessed on 10 January 2021).
- Bertoldi, P.; Diluiso, F.; Castellazzi, L.; Labanca, N.; Serrenho, T. Energy Consumption and Energy Efficiency Trends in the EU-28 2000–2015 [Interactive]; Publications Office of the European Union: Luxembourg, 2018; p. 175. Available online: https://ec.europa.eu/jrc/en/publication/eur-scientific-and-technical-research-reports/energy-consumption-and-energy-efficiency-trends-eu-28-2000-2015 (accessed on 10 January 2021).
- Zavadskas, E.K.; Saparauskas, J.; Antucheviciene, J. Sustainability in Construction Engineering. Sustainability 2018, 10, 2236. [Google Scholar] [CrossRef] [Green Version]
- Capolongo, S.; Sdino, L.; Dell’Ovo, M.; Moioli, R.; Della Torre, S. How to assess urban regeneration proposals by considering conflicting values. Sustainability 2019, 11, 3877. [Google Scholar] [CrossRef] [Green Version]
- Hersh, M.A. Sustainable Decision Making: The Role of Decision Support Systems. IEEE Trans. Syst. Man Cybern. C Appl. Rev. 1999, 29, 395–408. [Google Scholar] [CrossRef]
- Yu, M.; Zhu, F.; Yang, X.; Wang, L.; Sun, X. Integrating Sustainability into Construction Engineering Projects: Perspective of Sustainable Project Planning. Sustainability 2018, 10, 784. [Google Scholar] [CrossRef] [Green Version]
- Fokaides, P.A.; Apanaviciene, R.; Černeckiene, J.; Jurelionis, A.; Klumbyte, E.; Kriauciunaite-Neklejonoviene, V.; Pupeikis, D.; Rekus, D.; Sadauskiene, J.; Seduikyte, L.; et al. Research Challenges and Advancements in the field of Sustainable Energy Technologies in the Built Environment. Sustainability 2020, 12, 8417. [Google Scholar] [CrossRef]
- Zavadskas, E.K.; Antucheviciene, J.; Vilutiene, T.; Adeli, H. Sustainable Decision-Making in Civil Engineering, Construction and Building Technology. Sustainability 2018, 10, 14. [Google Scholar] [CrossRef] [Green Version]
- Dong, Y.; Miraglia, S.; Manzo, S.; Georgiadis, S.; Sorup, H.J.D.; Boriani, E.; Hald, T.; Thons, S.; Houschild, M. Environmentally sustainable decision making—The need and obstacles for integration of LCA into decision analysis. Environ. Sci. Policy 2018, 87, 33–44. [Google Scholar] [CrossRef]
- Gonzalez-Ramirez, J.; Arora, P.; Podesta, G. Using Insights from Prospect Theory to Enhance Sustainable Decision Making by Agribusinesses in Argentina. Sustainability 2018, 10, 2693. [Google Scholar] [CrossRef] [Green Version]
- Cinelli, M.; Coles, S.R.; Kirwan, K. Analysis of the potentials of multi criteria decision analysis methods to conduct sustainability assessment. Ecol. Indic. 2014, 46, 138–148. [Google Scholar] [CrossRef] [Green Version]
- Stender, M.; Walter, A. The role of social sustainability in building assessment. Build. Res. Inf. 2018, 1–13. [Google Scholar] [CrossRef]
- Mjornell, K.; Boss, A.; Lindahl, M.; Molnar, S. A Tool to Evaluate Different Renovation Alternatives with Regard to Sustainability. Sustainability 2014, 6, 4227–4245. [Google Scholar] [CrossRef] [Green Version]
- Malmgren, L.; Mjornell, K. Application of a Decision Support Tool in Three Ronovation Projects. Sustainability 2015, 7, 12521–12538. [Google Scholar] [CrossRef] [Green Version]
- Klumbytė, E. Development and Application of Municipal Residential Buildings Facilities Management Model. Summary of Doctoral Dissertation. Doctoral Dissertation, Kaunas University of Technology, Kaunas, Lithuania, 2018. [Google Scholar]
- Klumbyte, E.; Bliudzius, R.; Fokaides, P. Development and application of municipal residential buildings facilities management model. Sustain. Cities Soc. 2020, 52, 101804. [Google Scholar] [CrossRef]
- Kaklauskas, A.; Zavadskas, E.K.; Raslanas, S.; Ginevicius, R.; Komka, A.; Malinauskas, P. Selection of low-e windows in retrofit of public buildings by applying multiple criteria method COPRAS: A Lithuanian case. Energy Build. 2006, 38, 454–462. [Google Scholar] [CrossRef]
- Zavadskas, E.K.; Turskis, Z.; Antucheviciene, J.; Zakarevicius, A. Optimization of Weighted Aggregated Sum Product Assessment. Electron. Electr. Eng. 2012, 122, 3–6. [Google Scholar] [CrossRef]
- Zavadskas, K.E.; Baušys, R.; Lazauskas, M. Sustainable Assessment of Alternative Sites for the Construction of a Waste Incineration Plant by Applying WASPAS Method with Single-Valued Neutrosophic Set. Sustainability 2015, 7, 15923–15936. [Google Scholar] [CrossRef] [Green Version]
- Saaty, L.T. The Analytic Hierarchy Process: Planning, Priority Setting, Resource Allocation: Book; McGraw-Hill: New York, NY, USA, 1980; p. 287. ISBN1 10: 0070543712. ISBN2 13:9780070543713. [Google Scholar]
- Zhu, K. Fuzzy analytic hierarchy process: Fallacy of the popular methods. Eur. J. Oper. Res. 2014, 236, 209–217. [Google Scholar] [CrossRef]
- Samvedi, A.; Jain, V.; Chan, F.T. An integrated approach for machine tool selection using fuzzy analytical hierarchy process and grey relational analysis. Int. J. Prod. Res. 2011, 50, 3211–3221. [Google Scholar] [CrossRef]
- Chou, Y.-C.; Sun, C.-C.; Yen, H.-Y. Evaluating the criteria for human resource for science and technology (HRST) based on an integrated fuzzy AHP and fuzzy DEMATEL approach. Appl. Soft Comput. 2012, 12, 64–71. [Google Scholar] [CrossRef]
- Bešelev, S.D.; Gurvič, F.G. Methods of Expert Assessment of Mathematical Statistics: Textbook; Statistika: Moscow, Russia, 1974; p. 156. [Google Scholar]
- Evlanov, L.G. Decision making Theory and Practice: A Textbook; Ekonomika: Moscow, Russia, 1984; p. 176. [Google Scholar]
- Zavadskas, E.K. Complex Assessment and Selection of Resource Saving Solutions in Construction: A Handbook; Mokslas: Vilnius, Lithuania, 1987; p. 212. [Google Scholar]
- Podvezko, V. Ekspertų Įverčių Suderinamumas; Technological and Economic Development of Economy; Technika: Vilnius, Lithuania, 2005; Volume 9, pp. 101–107. ISSN 1392-8619. Available online: https://vb.vgtu.lt/object/elaba:6117157/ (accessed on 10 January 2021).
- The Ministry of Environment of the Republic of Lithuania. Technical Building Regulations STR 1.03.07:2017, Procedures for Maintenance and Operation of Structures. Procedure for Formation of New Real Estate Cadaster Objects [Interactive]; The Ministry on Environment of Republic of Lithuania: Vilnius, Lithuania, 30 December 2016; Available online: https://www.e-tar.lt/portal/lt/legalAct/f5109e80ce8811e69e09f35d37acd719 (accessed on 6 January 2021).
- Zavadskas, E.K.; Cavallaro, F.; Podzveko, V.; Ubarte, I.; Kaklauskas, A. MCDM Assessment of a Healthy and Safe Built Environment According to Sustainable Development Principles: A Practical Neighborhood Approach in Vilnius. Sustainability 2017, 9, 702. [Google Scholar] [CrossRef] [Green Version]
- Hatefi, S.M. Strategic planning of urban transportation system based on sustainable development dimensions using an integrated SWOT and fuzzy COPRAS approach. Glob. J. Environ. Sci. Manag. 2018, 4, 99–112. [Google Scholar] [CrossRef]
- Staniūnas, M.; Medineckienė, M.; Zavadskas, E.; Kalibatas, D. To modernize or not: Ecological-economical assessment of multi-dwelling houses modernization. Arch. Civ. Mech. Eng. 2013, 13, 88–98. [Google Scholar] [CrossRef]
- State Account. Public Audit Report: Management of State Immovable Property Transferred to Municipalities under the Right of Trust [Interactive]. Vilnius, 2020, No VAE-6. Available online: https://www.vkontrole.lt/failas.aspx?id=4099 (accessed on 10 January 2021).
- Sistela. The Real Estate Recovery Costs (Construction Value) Price List NTK 2021. Residential and Non-Residential Buildings; Statybos Produkcijos Sertifikavimo Centras: Vilnius, Lithuania, 2021; Volume XVII. [Google Scholar]
- Sistela. Comparative Economic Indicators of Estimated Prices for Construction of Buildings According to 2020 October Prices; Statybos Produkcijos Sertifikavimo Centras: Vilnius, Lithuania, 2020. [Google Scholar]
Figure 1.
The search procedure and preliminary results. Note: * the number contained in brackets indicates the number of articles in the sustainability topic.
Figure 1.
The search procedure and preliminary results. Note: * the number contained in brackets indicates the number of articles in the sustainability topic.

Figure 2.
Application levels of the municipal social housing evaluation model (developed by the authors).
Figure 2.
Application levels of the municipal social housing evaluation model (developed by the authors).

Figure 3.
The process of technical assessment of social housing (developed by the authors).

Table 1.
Ratings of the requirements for residential buildings.
| Rank | Normative Requirements Applicable to Social Housing | Municipal Requirements Applicable to Social Housing | Social Housing Resident’s Requirements Applicable to Social Housing | |||
|---|---|---|---|---|---|---|
| 1 | xn1 | Compliance with specific social housing requirements | xm1 | Good technical condition of the asset | xr1 | Safety |
| 2 | xn3 | Safety of heating installations | xm2 | Low heating costs | xr4 | Infrastructure |
| 3 | xn8 | Requirements for sustainable buildings | xm9 | The premises are without difficulties to dispose of and manage them | xr2 | Comfort |
| 4 | xn2 | Energy needs for heating | xm5 | Energy performance class of buildings | xr3 | Neighbors |
| 5 | xn4 | Building type | xm4 | The price of 1 m2 of usable floor area | xr9 | Utilities |
| 6 | xn9 | Natural sunlight requirements | xm3 | Apartment with amenities | xr5 | Car parking |
| 7 | xn7 | Power and low power supply systems | xm8 | Social housing is suitable for families with young children | xr8 | The main characteristics of the rooms |
| 8 | xn5 | Social housing’s heating and air conditioning system | xm7 | Social housing is adapted for people with disabilities | xr6 | Environment |
| 9 | xn6 | Water supply system | xm6 | Access to the building by car | xr7 | Entrance |
| 10 | xm10 | Number of places for parking | xm10 | Car parking | xr10 | Environmental pollution in the area |
Table 2.
Housing stock at the end of 2019, in thousands of square meters of usable area [34].
Table 2.
Housing stock at the end of 2019, in thousands of square meters of usable area [34].
| Housing Stock | Of Which by Forms of Ownership | The Average Useful Floor Area per Capita Was | ||||
|---|---|---|---|---|---|---|
| Private | % | State and Municipal Property | % | |||
| Total | 102,430.8 | 100,964.1 | 98.6 | 1466.7 | 1.4 | 36.7 |
| Urban areas | 62,154.2 | 61,110.9 | 98.3 | 1043.3 | 1.7 | 33 |
| Rural areas | 40,276.6 | 39,853.2 | 98.9 | 423.4 | 1.1 | 44.1 |
Table 3.
Number of dwellings at the end of 2019, in thousands [34].
Table 3.
Number of dwellings at the end of 2019, in thousands [34].
| Number of Dwellings, Total | Average Useful Floor Space of Dwellings, m2 | |
|---|---|---|
| Urban areas | 988.3 | 62.9 |
| Rural areas | 494.7 | 81.4 |
| Private property | 1453.1 | 69.5 |
| Urban areas | 965.4 | 63.3 |
| Rural areas | 487.7 | 81.7 |
| State and municipal property | 29.9 | 49.1 |
| Urban areas | 22.9 | 45.5 |
| Rural areas | 7 | 60.9 |
| Total | 1483.0 | 69.1 |
Table 4.
Economic indices of the alternatives (developed by the authors based on “Sistela” estimation prices for the construction of the structures as of 2020 and 2021) [35,36].
| Alt. No | Volume, m3 Social Housing | Reconstruction Price per 1 m3 | Construction Value of the Facility | Amortization (%) | Apartment Reconstruction Cost Value, EUR | Amortization Value, EUR | Apartment Reconstruction Value, EUR |
|---|---|---|---|---|---|---|---|
| Apartment | Per Apartment | ||||||
| A8 | 395 | 252.75 | 84,827.09 | 67 | 39,020.46 | 26,143.71 | 12,876.75 |
| 182 | 46,000.5 | ||||||
| A14 | 4456 | 169.15 | 828,994.24 | 37 | 16,579.88 | 6134.56 | 10,445.32 |
| 75 | 1286.25 | ||||||
| A15 | 656 | 222.24 | 128,241.44 | 72 | 31,034.42 | 22,334.78 | 8689.64 |
| 159 | 35,336.16 | ||||||
| A16 | 7725 | 156.52 | 1,437,159 | 37 | 31,617.50 | 11,698.47 | 19,919.02 |
| 167 | 26,138.84 |
Publisher’s Note: MDPI stays neutral with regard to jurisdictional claims in published maps and institutional affiliations. |
© 2021 by the authors. Licensee MDPI, Basel, Switzerland. This article is an open access article distributed under the terms and conditions of the Creative Commons Attribution (CC BY) license (http://creativecommons.org/licenses/by/4.0/).
Share and Cite
MDPI and ACS Style
Klumbytė, E.; Bliūdžius, R.; Medineckienė, M.; Fokaides, P.A. An MCDM Model for Sustainable Decision-Making in Municipal Residential Buildings Facilities Management. Sustainability 2021, 13, 2820. https://doi.org/10.3390/su13052820
AMA Style
Klumbytė E, Bliūdžius R, Medineckienė M, Fokaides PA. An MCDM Model for Sustainable Decision-Making in Municipal Residential Buildings Facilities Management. Sustainability. 2021; 13(5):2820. https://doi.org/10.3390/su13052820
Chicago/Turabian StyleKlumbytė, Eglė, Raimondas Bliūdžius, Milena Medineckienė, and Paris A. Fokaides. 2021. "An MCDM Model for Sustainable Decision-Making in Municipal Residential Buildings Facilities Management" Sustainability 13, no. 5: 2820. https://doi.org/10.3390/su13052820
Note that from the first issue of 2016, this journal uses article numbers instead of page numbers. See further details here.