
School Engagement, Academic Achievement, and Self-Regulated Learning
by
 , , and
Iris Estévez
1 ,
,
Carolina Rodríguez-Llorente
2,* ,
,
Isabel Piñeiro
2,
Rocío González-Suárez
2 and
and
Antonio Valle
2 1
Department of Pedagogy and Didactics, Campus de Elviña s/n, College of Education, University of A Coruña, 15071 A Coruña, Spain
2
Department of Psychology, Campus de Elviña s/n, College of Education, University of A Coruña, 15071 A Coruña, Spain
*
Author to whom correspondence should be addressed.
Sustainability 2021, 13(6), 3011; https://doi.org/10.3390/su13063011
Submission received: 3 February 2021
/
Revised: 24 February 2021
/
Accepted: 3 March 2021
/
Published: 10 March 2021
(This article belongs to the Special Issue New Perspectives on the Role of Intrinsic Motivation and Self-Regulation)
Abstract
:School engagement occupies a place of reference in recent educational psychology research owing to its potential to address poor school results and school dropout rates. However, there is a need for a unifying theoretical framework. The study proposed the characterization of school engagement and explored the extent to which different profiles are associated with academic performance and self-regulation. With a sample of 717 5th and 6th year primary school students, this study was carried out via the latent profile analysis (LPA). Two groups of low school engaged students—one characterized by low behavioral engagement (5.02%) and the other by low emotional engagement (6.55%)—were distinguished. The majority of participants showed moderately high (31.95%) or moderate (56.48%) levels of school engagement in its three dimensions. Students with high engagement had the best grades and managed their time and study surroundings better, were the most strategic in seeking information, and showed less maladaptive regulatory behavior. The differences between students exhibiting low behavioral and emotional engagement and those exhibiting moderate levels in these dimensions may center upon the management of contextual resources and management of information and help. This research supports the need to approach the study of school engagement by observing the combination of its emotional, behavioral, and cognitive dimensions.
1. Introduction
Over the last two decades, school engagement has acquired a leading position as a research topic in educational psychology research owing to its relationship to academic performance, maladaptive behavior, and school dropout [1,2,3]. The evidence is that school engagement is negatively linked to school dropout and positively linked to indicators of academic performance and wellbeing [4,5,6,7]. Although the number of early leavers from school has reduced significantly in Europe, the progress has stagnated over the past few years, according to Eurostat [8]. As quality education is a key Sustainable Development Goal (SDG), encouraging school engagement might be considered an important objective for educational reform and for the design of sustainable learning environments.
Despite the difficulty of reaching a consensus in the literature about a unifying concept of school engagement, the scientific community generally recognizes that the construction of school engagement is multifaceted [9], highlighting three dimensions: cognitive, emotional, and behavioral [10,11]. Behavioral engagement covers students’ participation in school activities, and in positive activities and practices in the school, such as completing tasks [12], attending class, paying attention in class [13], making efforts in school tasks, academic success [14], and respecting school rules and the absence of disruptive behavior [10]. The cognitive dimension is defined as the level of the students’ investment in mastering tasks and refers to flexible problem-solving, individual effort, and self-regulation strategies [11]. Finally, the emotional dimension is characterized by the connection between the student and the school, their sense of identification with it [13], and the positive emotional reactions towards school, classmates, and teachers [15]. In addition to focusing on feelings of happiness, interest, anxiety, and the feeling of belonging, some conceptualizations include the students’ perceptions of support from other important people in this dimension [16,17].
Although many previous studies have looked at these aspects of engagement separately [18,19,20,21], dichotomizing behavioral, cognitive, and emotional engagement, it is important to analyze them together as they are factors that are dynamically interrelated in each individual [3,22,23]. The particular utility of this multifaceted construct comes from its potential to integrate behaviors, thoughts, and feelings associated with the school concept which are conceptually different yet highly interactive [24].
In this regard, given the need to develop an overall unifying theoretical framework that incorporates most of the critical elements of the construct [25], the combination of the three dimensions in a study via the latent profile analysis (LPA) may be an innovative extension on previous work and strengthen our understanding of school engagement [22,26] and its outcomes. Therefore, the aim of this study is to determine how the cognitive, behavioral, and affective dimensions together characterize students’ school engagement, and explore the extent to which the different combinations may be associated with academic performance and self-regulation of learning.
1.1. School Engagement and Academic Achievement
Research into student engagement, which has flourished exponentially in recent years [25], allows us to state that school engagement is positively associated with academic performance [27,28,29]. However, with few exceptions [27,30,31], most of the contributions around the role of school engagement in learning and student performance have focused on secondary education, and that is why in this study we explore the interaction between school engagement and academic achievement in the last few years of primary education. Moreover, previous research has analyzed the effects of certain dimensions of school engagement on students’ performance [30,31]. For this reason, it seems vitally important to determine if the three dimensions of school engagement interact differently with achievement in primary schools.
In a recent meta-analysis by Lei et al. [32], the positive correlation that the three dimensions of engagement had on student academic performance was observed, highlighting the fundamental role of behavioral engagement in the explanation of academic achievement in both primary and secondary school samples [30,31,33,34]. Cognitive engagement may also significantly affect students’ academic results, although the research into this relationship is not as clear as it is for behavioral engagement [35,36]. Although cognitive engagement seems to be associated with academic performance, in general, at least in secondary education [37,38], this may be depending on whether students use deep or shallow strategies, and may be mediated by various motivational components [39]. With regard to emotional engagement, it might have an impact on students’ achievement as well as the other dimensions [40], though this relationship has not been as widely studied as with behavioral engagement.
Lastly, according to previous studies school engagement may vary among school subjects [41]. Therefore, it may be worthwhile to study the existence of different profiles comparing the academic outcomes in at least two subjects.
1.2. School Engagement and Self-Regulated Learning
Self-regulation has been conceptualized in many different ways, but it is also commonly defined as a multidimensional construct [42]. It addresses a series of skills that are traditionally linked to academic performance and school adjustment [43,44,45], which may also be key in promoting school engagement [46,47]. A good proportion of the research regarding school engagement has focused on contextual and motivational influences [48,49,50] and on their effects on academic performance [51,52,53]. Nonetheless, studies about the link between engagement and self-regulated learning are still scarce.
While the importance of school engagement for academic performance and school dropout rates seems to be well established, self-regulation skills in terms of managing contextual resources, information resources, or help may be seen as precursors or mediators and/or a consequence of school engagement. Little previous research has shown that self-regulation is an important predictor of engagement [45], and also a significant outcome [54]. However, this last relationship has not been studied enough, at least at the primary education level. In this context, here we explore the use of self-regulation strategies in students with different profiles of school engagement in the last few years of primary education.
1.3. The Present Study
The objective of this study is to determine how behavioral, cognitive, and emotional dimensions characterize students’ school engagement together, and to explore the extent to which the different combinations relate to academic achievement and the self-regulation of learning.
Following the literature review, our first hypothesis is to expect that students with profiles of high cognitive, emotional, and behavioral engagement to have better grades in mathematics and Spanish. On the other hand, our second hypothesis is to expect that these students exhibit better self-regulation of their contextual resources, better management of information and help in their learning, and in general, not to exhibit maladaptive regulatory behaviors. At this point, it might be worth exploring the interaction between cognitive engagement and seeking and learning information strategies, as well as the relationship between behavioral engagement and maladaptive regulatory behavior.
2. Materials and Methods
2.1. Sample
Using convenience sampling, we gained access to 717 primary education students from 15 schools (10 publicly funded, 5 privately funded) in the North of Spain. More than half (60%) were in an urban setting, with the remaining 40% being in either rural or semi-urban zones. Most of the students were from families with moderate socioeconomic levels, with annual incomes between €22,000 and €33,000, compared to the mean annual household income in Spain of €27,658 [55]. The participants were relatively evenly split between girls (51.5%) and boys (48.5%), with 52.48% in the 5th grade, and 37.52% in the 6th grade of primary school.
2.2. Materials
To evaluate school engagement, we used the Spanish version of the school engagement measure (SEM) from Fredricks et al. [23] and validated by Ramos-Díaz et al. [56]. This instrument allowed us to differentiate between emotional engagement (example items: “I’m happy at school, I like being at school, and I have fun in class”; α = 0.84), cognitive engagement (example items: “When I read a book I ask questions to make sure I understand what I’m reading; I read additional books about things we do at school; and I try to watch TV programs about things we do at school”; α = 0.73), and behavioral engagement (example items: “I follow the rules at school, I pay attention in class, and I stay out of trouble at school”; α = 0.70). The scale is made up of a total of 16 items (α = 0.85) with a 5-point Likert-type response format (where 1 = never and 5 = always), of which 4 correspond to the behavioral dimension, 5 to the emotional dimension, and 7 to the cognitive dimension.
To assess the students’ use of various self-regulation strategies, we used the self-regulation strategy inventory—self-report, from Cleary [57]. The factorial structure for the sample in this study basically replicated the dimensions: (a) Seeking and learning information (example items: “I ask my teacher what topics will be on the next test, I try to relate what they teach us in class with things I already know, and I try to know what the next tests will be like”; α = 0.70) and (b) maladaptive regulatory behavior (example items: “I lose notes or materials that are important for study. When I don’t understand something I leave it or give it up, and I forget to take things home that I need for study”; α = 0.66). However, in this case we were able to differentiate between items measuring students’ arrangements of the physical environment and study materials (example items: “I try to study in a quiet place; I try to study in a place that has no distractions, e.g., noise, people talking, and I make sure no one disturbs me when I study”; α = 0.75), and items related to managing behavior through the use of time (example items: “I make a schedule to help me organize my study time, I think about how best to study before I begin studying, and I use binders or folders to organize my science study materials”; α = 0.78). In this way we differentiated between a measure of (c) environment management and a measure of (d) time management, even though these formed a single scale.
To measure academic achievement, we used students give self-reported information about their grades in Spanish and mathematics on a scale coded as: 1 (fail), 2 (pass), 3 (good), 4 (very good), and 5 (outstanding).
2.3. Procedure
Data collection was at a single time point, previously arranged with the participating schools, and with the consent of the students’ families (as the students were all minors). The research team were tasked with visiting the schools after organizing a time which would have the least impact on classes. Before giving out the questionnaires, students were given an explanation of the aims of the research, precise instructions for completing the questionnaire, and assurances that their responses would be anonymous, as well as being told of the importance of answering each question honestly.
The data on the variables being considered in this study were collected in agreement with the recommendations of the ethical standards laid out by the Research and Teaching Ethics Committee at the University of A Coruña and the Helsinki Declaration. Data confidentiality and voluntary participation was ensured, with participants reminded that they could drop out of the study at any time. All the data created in this research is available at Zenodo [58].
2.4. Data Analysis
To produce the engagement profiles we performed a LPA [59], using Mplus version 7.11 [60]. The best model was selected according to data provided by the formal adjusted likelihood ratio test from Lo et al. [61] (LMRT), the Akaike information criteria (AIC), the Schwarz Bayesian information criteria (BIC), and the sample-size adjusted BIC (SSA-BIC), as well as the entropy value and the size of each subgroup.
The p value associated with the LMRT test indicates whether the solution with more (p < 0.05) or fewer classes (p > 0.05) has the best fit to the data. The AIC, BIC, and SSA-BIC are descriptive indices of fit, where lower values indicate better fit in the model. It is also important to note that small classes (containing less than 5% of the sample) are usually considered to be spurious classes, something which indicates the extraction of too many profiles [62].
To determine the selected model’s classification accuracy, we considered the calculation of a posteriori probabilities and the entropy statistic. The entropy statistic ranges between zero and one, with values closer to one indicating higher classification accuracy. The final criteria used to evaluate the model was via a MANOVA, through which we analyzed the differences between classes or profiles with respect to the variables that had been used to create them (emotional engagement, cognitive engagement and behavioral engagement). The differences in the variables between classes are expected to be statistically significant.
Once the engagement profiles were identified, we performed a MANOVA in order to examine the differences between the profiles in academic performance (in mathematics and Spanish) and self-regulation. We used the criteria established by Cohen [63] to interpret the effect sizes, according to which an effect is small when ηp2 = 0.01 (d = 0.20), moderate when ηp2 = 0.059 (d = 0.50), and large when ηp2 = 0.138 (d = 0.80).
3. Results
3.1. Descriptive and Correlational Analysis
Table 1 shows the descriptive statistics for the variables used in this study. The correlation analysis shows us the expected positive correlations between the three engagement dimensions (Table 1). The correlations were also positive and significant between behavioral engagement and performance both in Spanish and mathematics. We also saw positive correlations between emotional engagement and academic achievement. Cognitive engagement was less important in Spanish performance, and did not reach significance for mathematics performance.
The correlations between the three engagement dimensions and self-regulation were also positive in the cases of managing the environment, time, and information and help, and negative in relation to deficits of self-regulation. Specifically, we note the significant positive correlations between cognitive engagement, information and help management, and time management. We also highlight the correlation between behavioral engagement, management of the environment, and, more especially, maladaptive behavior (negative). Performance in both Spanish and mathematics was positively and significantly related to management of the environment, and information and help; and negatively related to maladaptive regulatory behavior (Table 1).
3.2. Identification of Engagement Profiles
The latent classes were formed on the basis of three variables: emotional engagement, cognitive engagement, and behavioral engagement. The process of fit was done successively with models that had increasing numbers of latent classes, stopping the process when a model showed no substantial improvement on the previous model. In this case we stopped on a model with five latent classes, as this model did not improve on the previous (four-latent-class) model. The results of the model fit are given in Table 2.
We stopped the model fit process at the five-class model because this model had a group containing less than 5% of the sample. In addition, the entropy value was higher in the four-class model than the five-class model. Therefore, although the values of AIC, BIC, and SSA-BIC were slightly higher in the four-class model than the five-class, because the entropy was higher in the four-class model, and because in this model no group contained less than 5% of the total sample, the four-class model was considered to have a better fit than the five-class model.
In addition, although the LMRT may indicate that the four-profile model was not statistically better than the three-profile model, the values of AIC, BIC, and SSA-BIC were lower in the four-class model than the three-class model. According to these criteria, the model with four classes had a better fit than the model with three classes. In addition to that, the entropy was higher in the four-class model than the three-class model, which indicates better classification accuracy by the model with four groups.
In terms of classification accuracy of the four-class model, the entropy of this model gave an appropriate value (0.742). Table 3 gives information about the classification accuracy in each class and the number of subjects in each class. The coefficients associated with the groups the participants were assigned to are in bold in the main diagonal in the table. Most of those coefficients were close to 100%, indicative of high classification accuracy. From the analysis of the values outside the diagonal one can deduce that the classes represent groups that are well differentiated from each other.
Lastly, we performed a MANOVA, taking the classes as an independent variable and the variables used to create the classes as dependent variables, in order to determine the importance of each of these three variables in the definition of each profile (group). The results indicate that, at a multivariate level, the subjects in the four profiles exhibited statistically significant differences in emotional engagement, cognitive engagement, and behavioral engagement (λWilks = 0.159, F (9,1730) = 216.59; p < 0.001, ηp2 = 0.458). The effect size was large. In contrast, although the three types of engagement do contribute significantly to the differentiation of the subjects between each of the four profiles, emotional engagement is especially important. There were statistically significant differences between the four classes in the three criterion variables emotional engagement (F (3,713) = 538.77; p < 0.001; ηp2 = 0.694), cognitive engagement (F (3,713) = 168.67; p < 0.001; ηp2 = 0.415) and behavioral engagement (F (3,713) = 202.07; p < 0.001; ηp2 = 0.460). The effect size was large in each case.
Therefore, considering the statistical data about model fit, the results of the ANOVA to examine the contribution of each of the variables making up the profiles in differentiating between classes, and also its theoretical suitability, we considered the four-class solution to be the most appropriate.
3.3. Description of Engagement Profiles
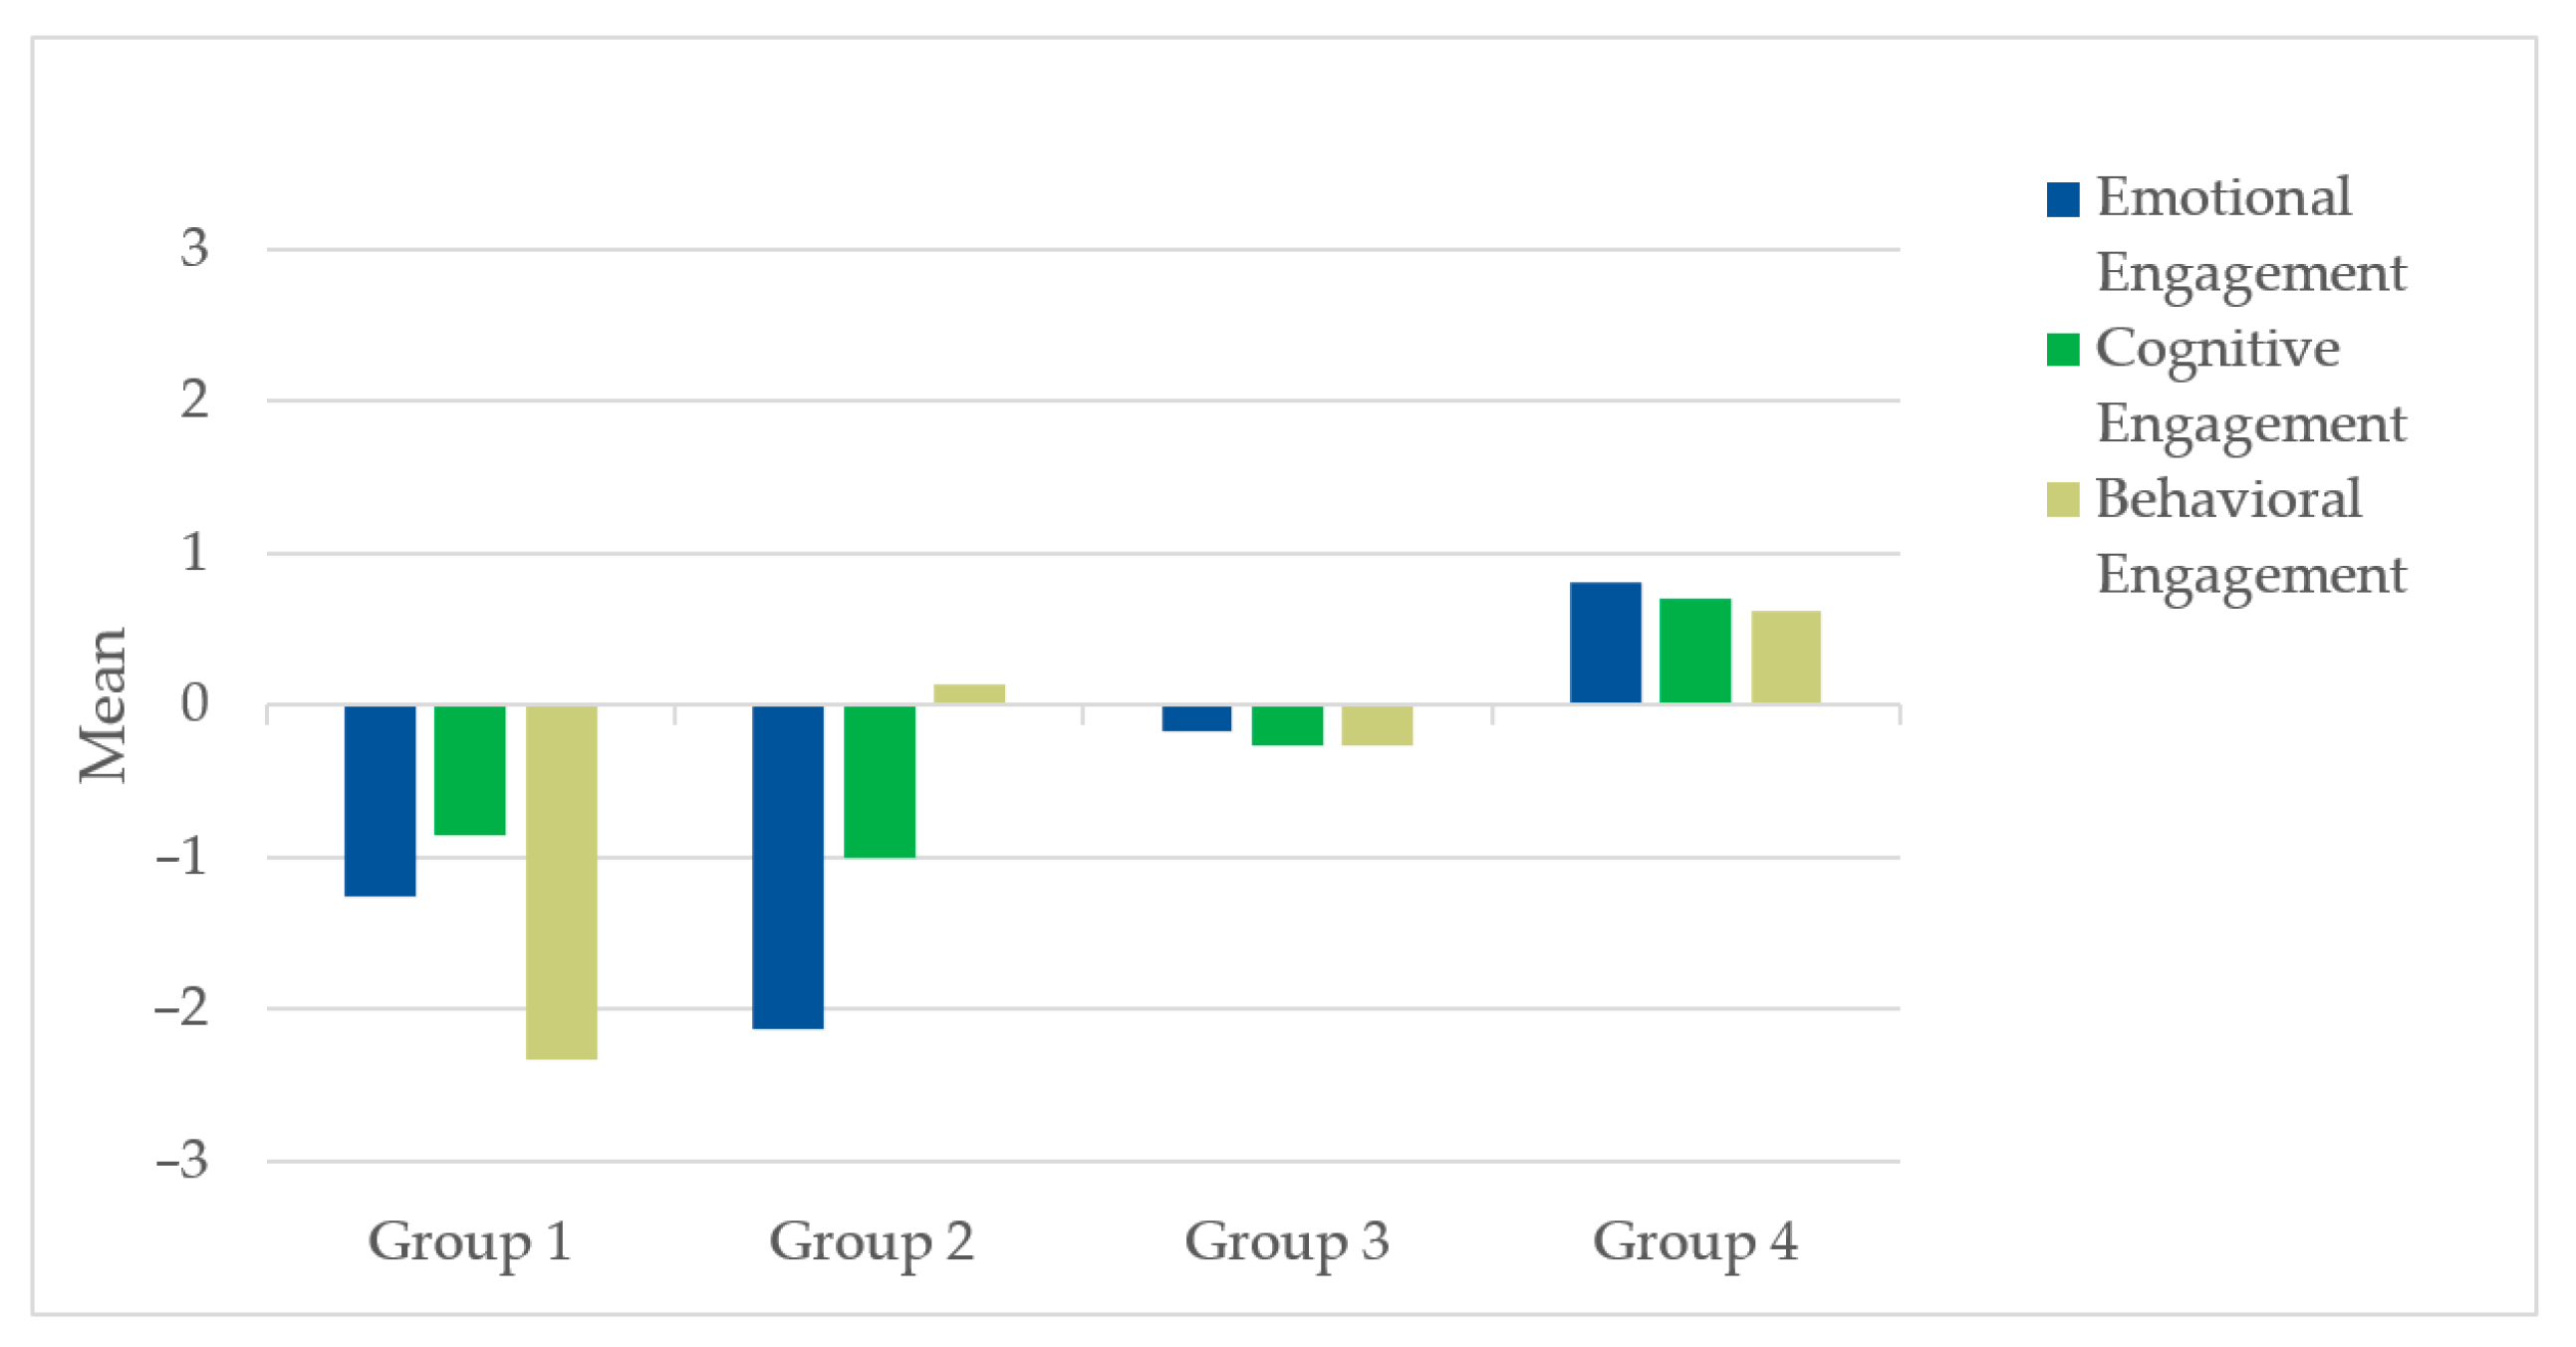
Table 4 shows the mean scores of the subjects belonging to the latent classes in the chosen model. In order to more clearly describe each of the profiles, and their similarities and differences, we standardized (in z scores) each of the three variables (M = 0, SD = 1). Figure 1 is a graphical representation of the profiles.
The first group of students we identified (n = 36; 5.02%) were characterized by low levels of cognitive and emotional engagement and very low levels of behavioral engagement. The second group (n = 47; 6.55%) was defined by very low emotional engagement, low cognitive engagement and moderate behavioral engagement. The third group (n = 405; 56.48%) was characterized by moderate levels of all three types of engagement. The fourth group (n = 229; 31.95%) was made up of students with moderately high levels of all three types of engagement (see Figure 1).
It is clear that most of the primary students that we studied exhibited average levels (Group 3; 56.48%) or above average levels (Group 4; 31.95%) of school engagement, whereas in the 10% of students exhibiting lower school engagement, we were able to distinguish between those with the lowest behavioral engagement (Group 1) and those who demonstrated the lowest emotional engagement (Group 2) (see Figure 1).
3.4. Differences between Profiles in Academic Achievement and Self-Regulation
The results indicate that there were statistically significant differences between the four groups in the dependent variables taken together (λWilks = 0.631, F (18,2003) = 19.67; p < 0.001, ηp2 = 0.142) with a large effect size (see Table 5).
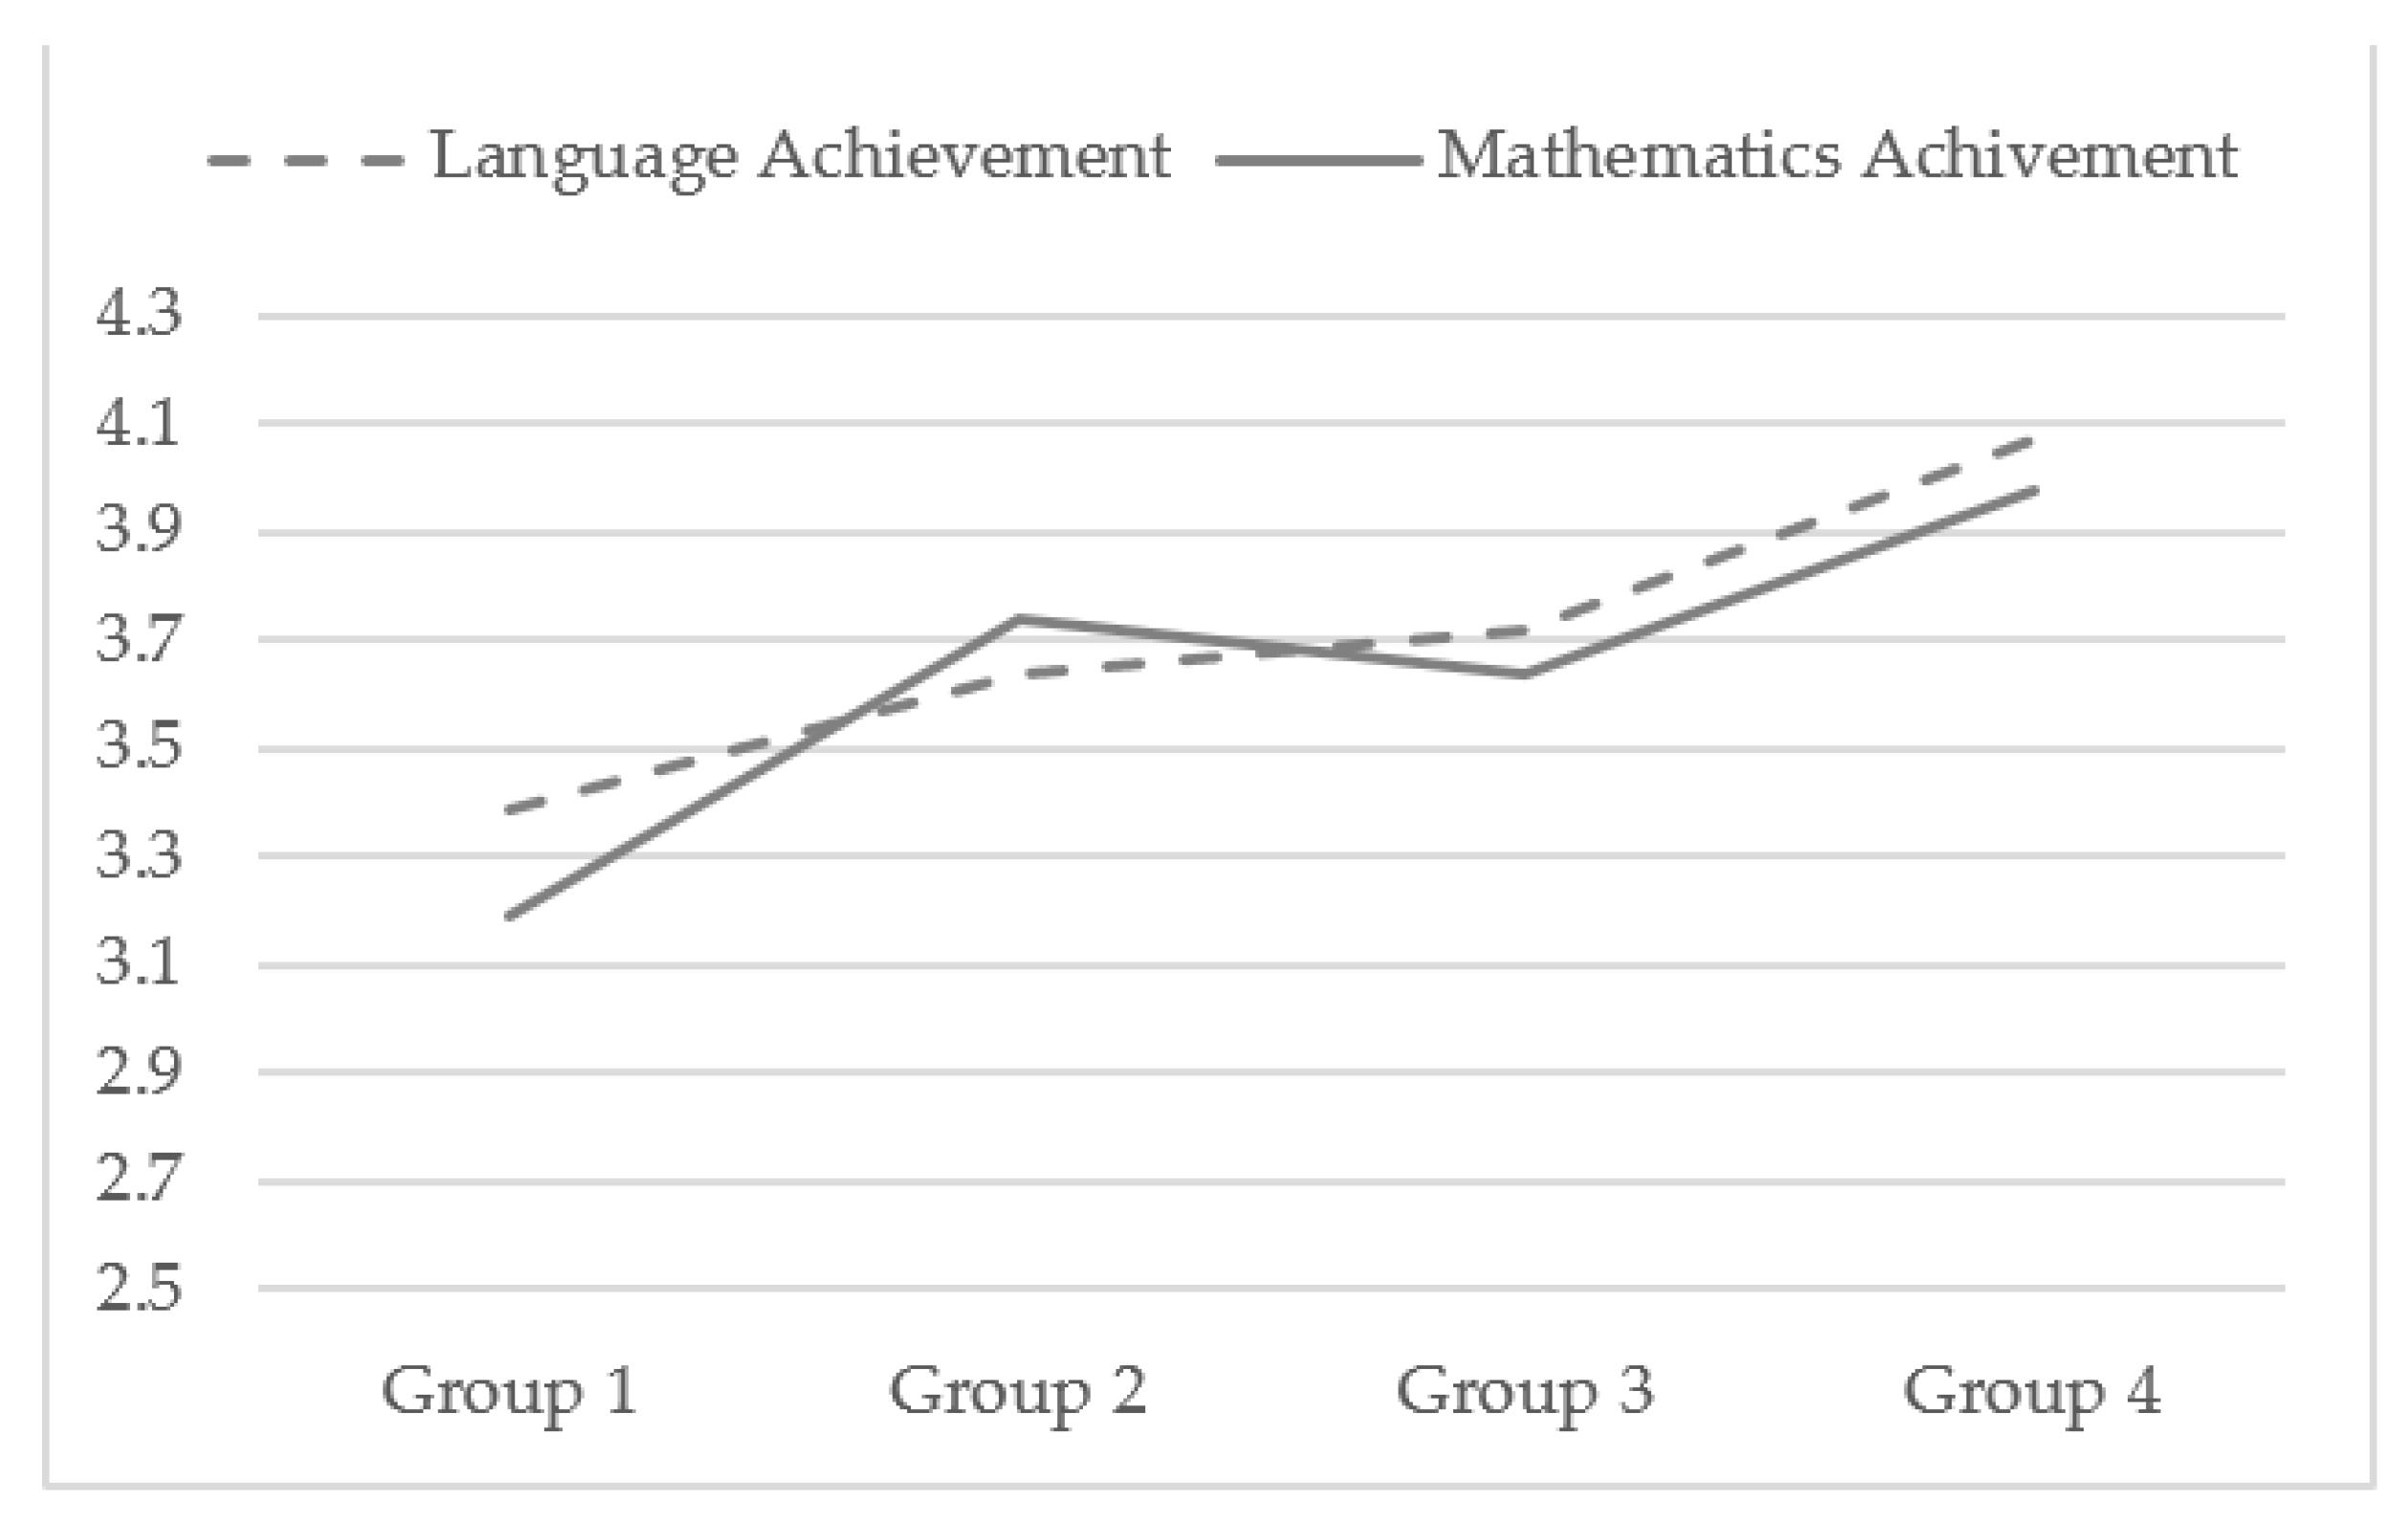
If we look at each variable individually, there were statistically significant differences between groups in “Performance in Spanish” (F(3,713) = 10.48; p < 0.001; ηp2 = 0.042) and in “Performance in Mathematics” (F(3,713) = 8.50; p < 0.001; ηp2 = 0.035). In both cases the effect sizes were near to moderate.
Post hoc analysis suggested that the group with the most engaged students (Group 4) had significantly better performance in mathematics than the less engaged students with low behavioral engagement (Group 1). The differences were also statistically significant between this highly engaged group (Group 4) and the moderately engaged group (Group 3). The analysis of these differences leads us to consider the particular importance of behavioral engagement in mathematics performance.
As we expected, the post hoc (Scheffé) analysis also allowed us to conclude that the academic performance in Spanish of the more engaged students (Group 4) was significantly better than the other groups (see Figure 2).
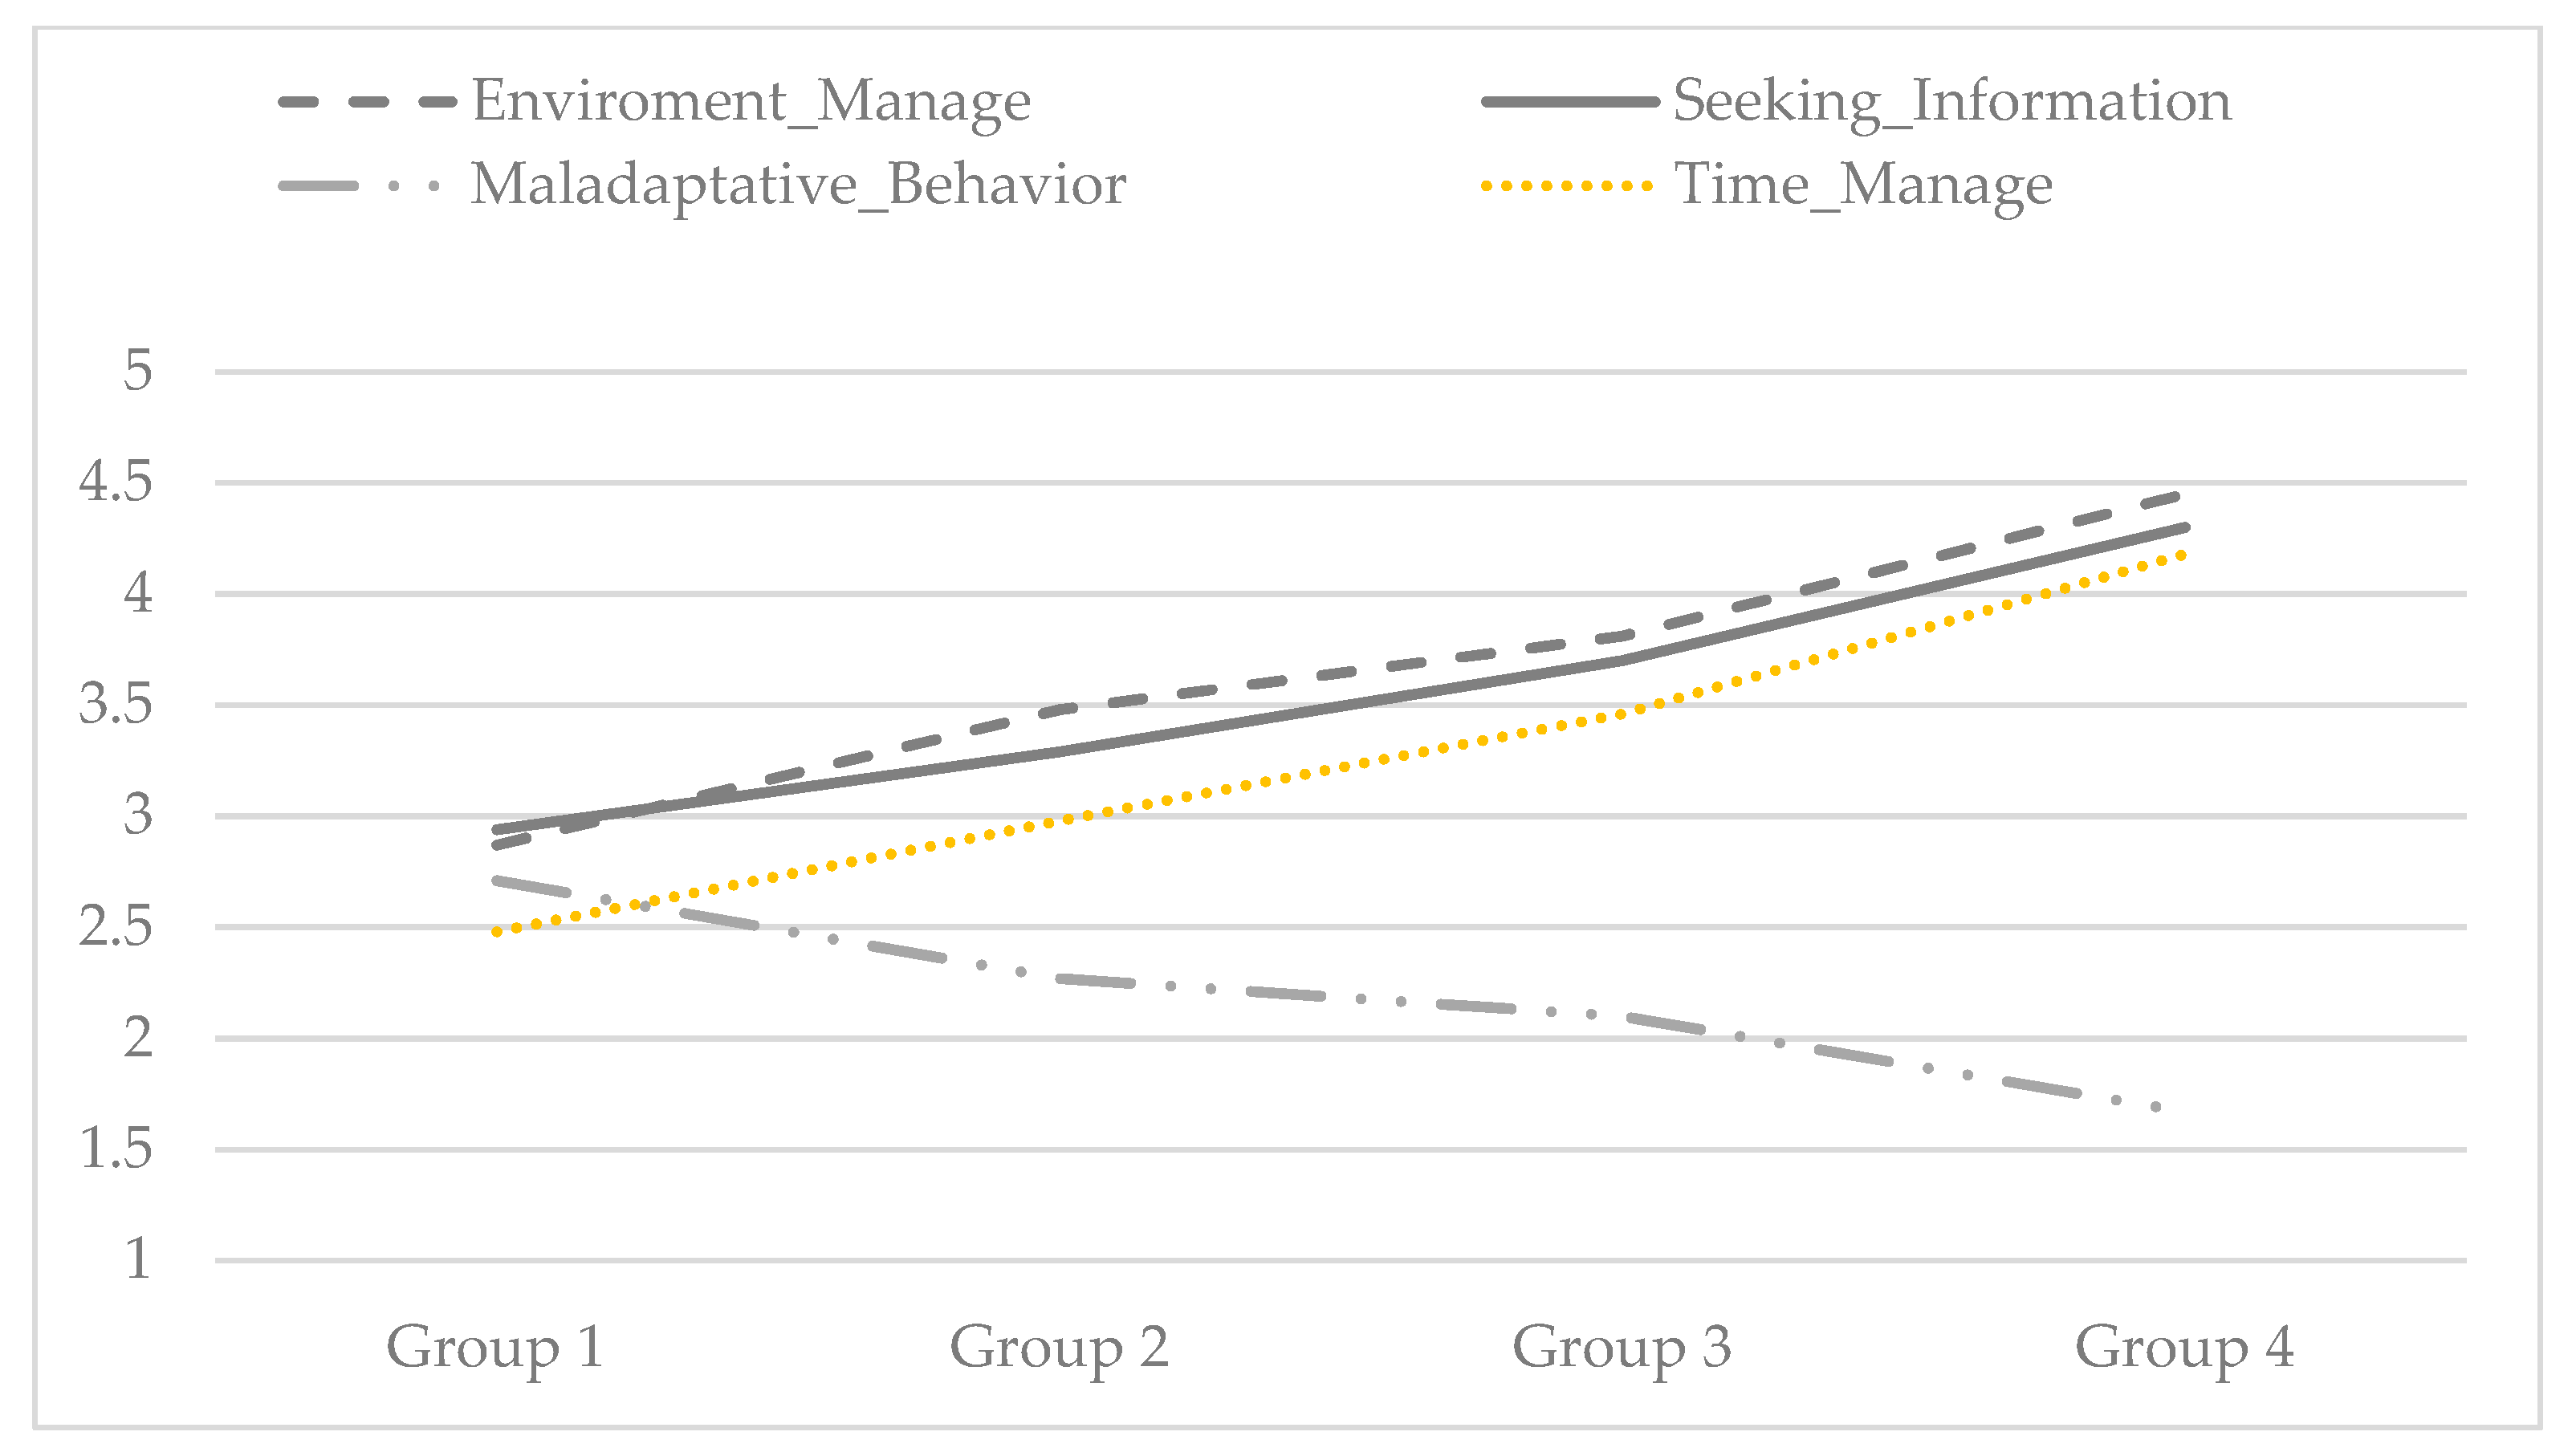
There were also statistically significant differences between the groups in environment management (F (3,697) = 77.10; p < 0.001; ηp2 = 0.249), in seeking and learning information (F (3,676) = 81.13; p < 0.001; ηp2 = 0.265), in maladaptive regulatory behavior (F (3,652) = 39.18; p < 0.001; ηp2 = 0.153), in time management (F (3,620) = 124.88; p < 0.001; ηp2 = 0.354), and in all cases with large effect sizes.
Post hoc analysis indicated that the group of students who were the most highly engaged in the three dimensions of school engagement (Group 4) would exhibit the best management of their time and environment, whereas the largest group of students, characterized by moderate levels of engagement in the three dimensions of the construct (Group 3) would self-regulate both contextual aspects better than the two groups with low engagement. Of the two groups characterized by their low school engagement, students with the lowest levels of behavioral engagement (Group 1) would be the worst managers of their time and surroundings (see Figure 3).
In terms of managing information and help, it is worth noting that the two groups characterized by low school engagement (Groups 1 and 2) exhibited the worst levels of self-regulation in this area. Here, in contrast to what we found for management of time and environment, the combinations of engagement with low behavioral or emotional engagement contributed similarly to limit students’ management of information and help in the academic arena (see Figure 3).
Along similar lines, the group of students characterized by the highest levels of school engagement (Group 4) exhibited less maladaptive behavior than the others, and the most maladaptive behaviors were found in the low engagement profiles (Groups 1 and 2), although the differences were not statistically significant on this point between the group with low emotional engagement and the largest group, with moderate school engagement (Group 3) (see Figure 3).
4. Discussion
This study supports the need to approach the study of school engagement by observing the combination of, at the very least, its emotional, behavioral, and cognitive dimensions, and contributes empirical support to those theories that note school engagement as a multidimensional, integrated construct. Based on moderate correlations, LPA allows us to strengthen the understanding of the school engagement construct with three theoretically different dimensions. It is suggested that the cognitive, behavioral, and affective dimensions together characterize students’ school engagement, and that the different combinations may be associated with academic performance and self-regulation of learning.
As Bae et al. [26] found, the approach we used here of employing latent class models allowed us to differentiate in the less engaged students between those with low behavioral engagement (n = 36; 5.02%) and those with low emotional engagement (n = 47; 6.55%), and to see differences between these two smaller groups in contextual self-regulation (management of environment and time) and even in academic performance. Our results contribute in this matter to the literature about disengagement (or ‘disaffection’) [64,65] in that they give us a deeper view of the different ways that school disengagement can be demonstrated and guide differential approaches to address the needs of students with low engagement.
Low behavioral engagement, in comparison to low emotional engagement, may be characterized by greater difficulties in organizing the place of study and materials, and in organizing time for study. These students were characterized by not following school rules, getting into trouble, and not paying attention in class. They also reported maladaptive regulatory behavior, forgot their school materials, and often gave up when they did not understand something. These self-regulatory characteristics may have particular impact, for example, on performance in mathematics, which is characteristically lower in students with low behavioral engagement.
Low cognitive engagement, both in the group with low behavioral engagement and the group with low emotional engagement, may be behind their similarities in terms of strategies for seeking and managing information. Both groups of students with low school engagement, which is characterized by low monitoring of their understanding, are not used to reviewing their work, checking whether they understand or guessing what they do not understand. Because they lack the initiative to extend or think about academic content, they do not usually read or watch programs related to school content, they seem to be less aware of the importance of thinking and asking questions in the classroom about activities and tests.
The person-centered approach to school engagement may begin to unstick some of the concerns that researchers have about, for example, the interactions between the cognitive and behavioral dimensions of school engagement [66,67], or about the nature of affective engagement [68,69].
Apart from the indices of cognitive and emotional engagement, the results of this study suggest that behavioral engagement may be key when it comes to explaining academic performance. Behavioral engagement, defined here as following the rules, making an effort, and paying attention, will probably function as the closest precursor of achievement, as prior research has suggested [14,33,34,70].
On the other hand, the differences between students exhibiting low behavioral and emotional engagement (n = 47; 6.55%) and those exhibiting moderate levels of these school engagement dimensions (n = 405; 56.48%) may center on the management of contextual resources, such as time and study surroundings, and management of information and help. In fact, the group of students characterized by their low emotional engagement, those who enjoyed school the least, and had the least fun in class, may demonstrate similar academic performance to those in the largest group of students, with moderate school engagement, and not differ from them in, for example, maladaptive regulatory behavior.
This study also allows us to suggest that the vast majority of our 5th and 6th grade primary students can be characterized as having high (Group 4; 31.95%) or moderate (Group 3; 56.48%) school engagement in behavioral, emotional, and cognitive terms. However, the level of school engagement between the two groups is sufficiently important as to find significant differences, not only in performance, but also in all of the self-regulation measures we assessed. Students with the highest engagement had the best grades, and managed their time and study surroundings better, were the most strategic in seeking and managing information, and showed significantly less maladaptive regulatory behavior. Although we are dealing with differentiated constructs, looking at the effect sizes we found there does seem to be a strong interaction between self-regulatory skill and school engagement, at least in primary education students. In fact, according to Uka and Uka [71], both constructs appear to be relevant for successful school transitions. Primary school students with high self-regulated learning skills and emotional engagement might have a better experience when they move to secondary school.
Finally, the results of this study provide evidence of the close relationship between school engagement and academic achievement in primary education, where there has been little study up to now of this relationship looking at the three engagement dimensions simultaneously [26,72]. Studying school engagement in this primary stage of compulsory education is important in that it not only seems to contribute to immediate academic performance, but also subsequent performance in secondary school [73,74,75].
This study has some limitations. Firstly, it was developed using cross-sectional data self-reported by the students, which means that the information has a certain degree of subjectivity. Secondly, a survey was the only mean used to collect information about students’ engagement and use of self-regulatory learning skills, when there are other instruments that offer more information at the primary school stage. Using different data collection methods, such as interviews, could have also enriched the research results. Lastly, some relevant contextual variables, especially those related to parents, has not been addressed in this research.
In the future, it will be worth exploring the extent of the impact of school engagement on academic achievement in the different educational stages, as it is possible that moderate or low levels of school engagement do not sufficiently discriminate the differences in performance in primary education. In addition, future research should examine the extent to which the cognitive and behavioral dimensions of school engagement are activity or subject specific, or the way in which emotional engagement may fluctuate in different situations [68,69]. It could also be worthwhile to broaden the research results on academic outcomes to other subjects, as they may vary from one to another. On the other hand, the strong interaction between cognitive engagement and managing resources such as time could also be the object of future study. Furthermore, as school engagement is apparently associated with sustainable behavior [76], it becomes vitally important to tackle students’ disengagement.
We can extract some educational implications from this study: it highlights the importance of providing, within the school context, learning methodologies, and activities that encourages students to engage more with the school and which contribute to the development of better self-regulatory strategies. Intervention specifically aimed at preventing maladaptive regulatory behavior via periodic supervision of classroom routines or specific instruction in the strategic use of information may be associated with better profiles of school engagement and may contribute to lower rates of early dropout, something that still blights certain areas.
The observation of groups with low school engagement allows the suggestion of differential intervention for students characterized by low behavioral engagement and those with low affective engagement. Thus, whereas attention might be focused toward teaching strategies related to time management and organizing the place of study and materials with the first group, the group with greater affective disengagement may be better served by focusing on emotional management, facilitating positive peer interactions, collaborative working, and the use of suitable motivational reinforcement in the classroom. Finally, previous research has shown that it is possible to promote sustainable development by increasing their school engagement of its three dimensions [77]. Understanding how different self-regulatory profiles are linked to school engagement may constitute a contribution from sustainability psychology to the design of intervention and prevention programs.
Author Contributions
Conceptualization, C.R.-L. and R.G.-S.; methodology, I.E.; validation, I.E., C.R.-L. and R.G.-S.; formal analysis, I.E.; investigation, I.P.; data curation, C.R.-L. and R.G.-S.; writing—original draft preparation, C.R.-L.; writing—review and editing, A.V.; supervision, I.P. and A.V.; project administration, I.P. and A.V. All authors have read and agreed to the published version of the manuscript.
Funding
This study was performed thanks to financing from research project EDU2013-44062-P (MINECO) and EDU2017-82984-P (MEIC).
Institutional Review Board Statement
The study was conducted according to the guidelines of the Declaration of Helsinki, and the Ethics Committee of the University of A Coruña.
Informed Consent Statement
Informed consent was obtained from all subjects involved in the study.
Data Availability Statement
The data presented in this study are openly available in Zenodo at 10.5281/zenodo.4018677, reference number [md5:e78662372aa9e019ba8df54d52e02eaf].
Acknowledgments
This study was performed thanks to financing from research project EDU2013-44062-P (MINECO) and EDU2017-82984-P (MEIC) and financing received by one of the authors from the FPU program (FPU18/02191), granted by the Ministry of Science, Innovation, and Universities.
Conflicts of Interest
The authors declare no conflict of interest.
References
- Christenson, S.L.; Reschly, A.L.; Wylie, C. Handbook of Research on Student Engagement; Springer Science and Business Media LLC: Berlin/Heidelberg, Germany, 2012; pp. 491–513. [Google Scholar]
- Salmela-Aro, K.; Upadyaya, K. School burnout and engagement in the context of demands-resources model. Br. J. Educ. Psychol. 2014, 84, 137–151. [Google Scholar] [CrossRef]
- Wang, M.-T.; Peck, S.C. Adolescent educational success and mental health vary across school engagement profiles. Dev. Psychol. 2013, 49, 1266–1276. [Google Scholar] [CrossRef] [Green Version]
- Cadime, I.; Pinto, A.M.; Lima, S.; Rego, S.; Pereira, J.; Ribeiro, I. Well-being and academic achievement in secondary school pupils: The unique effects of burnout and engagement. J. Adolesc. 2016, 53, 169–179. [Google Scholar] [CrossRef] [Green Version]
- Froiland, J.M.; Worrell, F.C. Intrinsic motivation, learning goals, engagement, and achievement in a diverse high school. Psychol. Sch. 2016, 53, 321–336. [Google Scholar] [CrossRef]
- Yi, H.; Tian, L.; Huebner, E.S. Mastery goal orientations and subjective well-being in school among elementary school students: The mediating role of school engagement. Eur. J. Psychol. Educ. 2019, 35, 429–450. [Google Scholar] [CrossRef]
- Yuen, C.Y. Linking life satisfaction with school engagement of secondary students from diverse cultural backgrounds in Hong Kong. Int. J. Educ. Res. 2016, 77, 74–82. [Google Scholar] [CrossRef]
- EU. Sustainable Development In The Europen Union. Intern. Audit. Risk Manag. 2020, 43, 1–13. [Google Scholar] [CrossRef]
- Wang, M.-T.; Willett, J.B.; Eccles, J.S. The assessment of school engagement: Examining dimensionality and measurement invariance by gender and race/ethnicity. J. Sch. Psychol. 2011, 49, 465–480. [Google Scholar] [CrossRef]
- Appleton, J.J. Systems Consultation: Developing the Assessment-to-Intervention Link with the Student Engagement Instrument. In Handbook of Research on Student Engagement; Springer International Publishing: New York, NY, USA, 2012; pp. 725–741. [Google Scholar]
- Fredricks, J.A.; Blumenfeld, P.C.; Paris, A.H. School Engagement: Potential of the Concept, State of the Evidence. Rev. Educ. Res. 2004, 74, 59–109. [Google Scholar] [CrossRef] [Green Version]
- Reschly, A.L.; Christenson, S.L. Prediction of Dropout Among Students with Mild Disabilities. Remedial Spéc. Educ. 2006, 27, 276–292. [Google Scholar] [CrossRef]
- Voelkl, K.E. School Identification. In Handbook of Research on Student Engagement; Springer International Publishing: New York, NY, USA, 2012; pp. 193–218. [Google Scholar]
- Wang, M.-T.; Holcombe, R. Adolescents’ Perceptions of School Environment, Engagement, and Academic Achievement in Middle School. Am. Educ. Res. J. 2010, 47, 633–662. [Google Scholar] [CrossRef]
- Yazzie-Mintz, E. Voices of Students on Engagement: A Report on the 2006 High School Survey of Student Engagement; Center for Evaluation & Educational Policy: Bloomington, IN, USA, 2007; Available online: http://ceep.indiana. edu/pdf/HSSSE_2006_Report.pdf (accessed on 15 October 2020).
- Appleton, J.J.; Christenson, S.L.; Kim, D.; Reschly, A.L. Measuring cognitive and psychological engagement: Validation of the Student Engagement Instrument. J. Sch. Psychol. 2006, 44, 427–445. [Google Scholar] [CrossRef]
- Skinner, E.A.; Belmont, M.J. Motivation in the classroom: Reciprocal effects of teacher behavior and student engagement across the school year. J. Educ. Psychol. 1993, 85, 571–581. [Google Scholar] [CrossRef]
- Eccles, J.S.; Wang, M.-T. Part I Commentary: So What Is Student Engagement Anyway? In Handbook of Research on Student Engagement; Springer International Publishing: New York, NY, USA, 2012; pp. 133–145. [Google Scholar]
- Fredricks, J.A.; McColskey, W.; Meli, J.; Mordica, J.; Montrosse, B.; Mooney, K. Measuring Student Engagement in Upper Elementary through High School: A Description of 21 Instruments (Issues & Answers. REL 2011-No. 098); US Department of Education, Institute of Education Sciences, National Center for Education: Washington, DC, USA, 2011. Available online: http://ies.ed.gov/ncee/edlabs/projects/project.asp?projectID=268 (accessed on 15 October 2020).
- Gonida, E.N.; Kiosseoglou, G.; Voulala, K. Perceptions of parent goals and their contribution to student achievement goal orientation and engagement in the classroom: Grade-level differences across adolescence. Eur. J. Psychol. Educ. 2007, 22, 23–39. [Google Scholar] [CrossRef]
- Ladd, G.W.; Ettekal, I.; Kochenderfer-Ladd, B. Peer victimization trajectories from kindergarten through high school: Differential pathways for children’s school engagement and achievement? J. Educ. Psychol. 2017, 109, 826–841. [Google Scholar] [CrossRef]
- Bae, C.L.; DeBusk-Lane, M. Middle school engagement profiles: Implications for motivation and achievement in science. Learn. Individ. Differ. 2019, 74. [Google Scholar] [CrossRef]
- Fredricks, J.A.; Blumenfeld, P.; Friedel, J.; Paris, A. School Engagement. In What Do Children Need to Flourish? Springer Science and Business Media LLC: Berlin/Heidelberg, Germany, 2006; Volume 3, pp. 305–321. [Google Scholar]
- Ben-Eliyahu, A.; Moore, D.; Dorph, R.; Schunn, C.D. Investigating the multidimensionality of engagement: Affective, behavioral, and cognitive engagement across science activities and contexts. Contemp. Educ. Psychol. 2018, 53, 87–105. [Google Scholar] [CrossRef]
- Azevedo, R. Defining and Measuring Engagement and Learning in Science: Conceptual, Theoretical, Methodological, and Analytical Issues. Educ. Psychol. 2015, 50, 84–94. [Google Scholar] [CrossRef]
- Bae, C.L.; DeBusk-Lane, M.L.; Lester, A.M. Engagement profiles of elementary students in urban schools. Contemp. Educ. Psychol. 2020, 62. [Google Scholar] [CrossRef]
- Archambault, I.; Dupéré, V. Joint trajectories of behavioral, affective, and cognitive engagement in elementary school. J. Educ. Res. 2016, 110, 188–198. [Google Scholar] [CrossRef]
- Bae, C.L.; DeBusk-Lane, M. Motivation belief profiles in science: Links to classroom goal structures and achievement. Learn. Individ. Differ. 2018, 67, 91–104. [Google Scholar] [CrossRef]
- Linnenbrink-Garcia, L.; Wormington, S.V.; Snyder, K.E.; Riggsbee, J.; Perez, T.; Ben-Eliyahu, A.; Hill, N.E. Multiple pathways to success: An examination of integrative motivational profiles among upper elementary and college students. J. Educ. Psychol. 2018, 110, 1026–1048. [Google Scholar] [CrossRef]
- Chen, J.; Huebner, E.S.; Tian, L. Longitudinal relations between hope and academic achievement in elementary school students: Behavioral engagement as a mediator. Learn. Individ. Differ. 2020, 78, 1–10. [Google Scholar] [CrossRef]
- Olivier, E.; Galand, B.; Hospel, V.; Dellisse, S. Understanding behavioural engagement and achievement: The roles of teaching practices and student sense of competence and task value. Br. J. Educ. Psychol. 2020, 90, 887–909. [Google Scholar] [CrossRef]
- Lei, H.; Cui, Y.; Zhou, W. Relationships between student engagement and academic achievement: A meta-analysis. Soc. Behav. Personal. Int. J. 2018, 46, 517–528. [Google Scholar] [CrossRef]
- Putwain, D.W.; Nicholson, L.J.; Pekrun, R.; Becker, S.; Symes, W. Expectancy of success, attainment value, engagement, and Achievement: A moderated mediation analysis. Learn. Instr. 2019, 60, 117–125. [Google Scholar] [CrossRef]
- Reyes, M.R.; Brackett, M.A.; Rivers, S.E.; White, M.; Salovey, P. Classroom emotional climate, student engagement, and academic achievement. J. Educ. Psychol. 2012, 104, 700–712. [Google Scholar] [CrossRef] [Green Version]
- Gregoire, M.; University of Florida, Gainesville, FL, USA; Ashton, P.; University of Florida, Gainesville, FL, USA; Algina, J.; University of Florida, Gainesville, FL, USA. The role of prior and perceived ability in influencing the relationship of goal orientation to cognitive engagement and academic achievement. Personal communication, 2001. [Google Scholar]
- Metallidou, P.; Vlachou, A. Motivational beliefs, cognitive engagement, and achievement in language and mathematics in elementary school children. Int. J. Psychol. 2007, 42, 2–15. [Google Scholar] [CrossRef]
- Wang, M.-T.; Chow, A.; Hofkens, T.; Salmela-Aro, K. The trajectories of student emotional engagement and school burnout with academic and psychological development: Findings from Finnish adolescents. Learn. Instr. 2015, 36, 57–65. [Google Scholar] [CrossRef]
- Wara, E.; Aloka, P.J.; Odongo, B.C. Relationship between Cognitive Engagement and Academic Achievement among Kenyan Secondary School Students. Mediterr. J. Soc. Sci. 2018, 9, 61–72. [Google Scholar] [CrossRef] [Green Version]
- Sedaghat, M.; Abedin, A.; Hejazi, E.; Hassanabadi, H. Motivation, cognitive engagement, and academic achievement. Procedia Soc. Behav. Sci. 2011, 15, 2406–2410. [Google Scholar] [CrossRef] [Green Version]
- Wara, E.; Aloka, P.J.O.; Odongo, B.C. Relationship between Emotional Engagement and Academic Achievement among Kenyan Secondary School Students. Acad. J. Interdiscip. Stud. 2018, 7, 107–118. [Google Scholar] [CrossRef] [Green Version]
- Green, J.; Martin, A.J.; Marsh, H.W. Motivation and engagement in English, mathematics and science high school subjects: Towards an understanding of multidimensional domain specificity. Learn. Individ. Differ. 2007, 17, 269–279. [Google Scholar] [CrossRef]
- Baumeister, R.F.; Vohs, K.D. Self-regulation and the executive function of the self. In Handbook of Self and Identity; Leary, M.R., Tangney, J.P., Eds.; Guilford Press: New York, NY, USA, 2003; pp. 197–217. [Google Scholar]
- Blair, C.; Razza, R.P. Relating Effortful Control, Executive Function, and False Belief Understanding to Emerging Math and Literacy Ability in Kindergarten. Child. Dev. 2007, 78, 647–663. [Google Scholar] [CrossRef]
- Sameroff, A.J. Conceptual Issues in Studying the Development of Self-Regulation. In Biopsychosocial Regulatory Processes in the Development of Childhood Behavioral Problems; Cambridge University Press: New York, NY, USA, 2009; pp. 1–18. [Google Scholar]
- Valiente, C.; Lemery-Chalfant, K.; Castro, K.S. Children’s Effortful Control and Academic Competence: Mediation through School Liking. Merrill-Palmer Q. 2007, 53, 1–25. [Google Scholar] [CrossRef]
- Skinner, E.A.; Pitzer, J.R. Developmental Dynamics of Student Engagement, Coping, and Everyday Resilience. In Handbook of Research on Student Engagement; Springer Science and Business Media LLC: Berlin/Heidelberg, Germany, 2012; pp. 21–44. [Google Scholar]
- Smit, K.; de Brabander, C.J.; Boekaerts, M.; Martens, R.L. The self-regulation of motivation: Motivational strategies as mediator between motivational beliefs and engagement for learning. Int. J. Educ. Res. 2017, 82, 124–134. [Google Scholar] [CrossRef]
- Erdoğdu, M.Y. The roles of attitudes towards learning and opposite sex as a predictor of school engagement: Mixed or single gender education? Palgrave Commun. 2020, 6, 1–9. [Google Scholar] [CrossRef]
- Fernández-Zabala, A.; Goñi, E.; Camino, I.; Zulaika, L.M. Family and school context in school engagement. Eur. J. Educ. Psychol. 2016, 9, 47–55. [Google Scholar] [CrossRef] [Green Version]
- Li, W.; Gao, W.; Sha, J. Perceived Teacher Autonomy Support and School Engagement of Tibetan Students in Elementary and Middle Schools: Mediating Effect of Self-Efficacy and Academic Emotions. Front. Psychol. 2020, 11, 1–9. [Google Scholar] [CrossRef]
- Gutiérrez, M.; Tomás, J.M.; Barrica, J.M.; Romero, I. Influencia del clima motivacional en clase sobre el compromiso escolar de los adolescentes y su logro académico. Enseñanza Teach. Rev. Interuniv. Didáctica 2017, 35, 21–37. [Google Scholar] [CrossRef] [Green Version]
- Miranda-Zapata, E.; Lara, L.; Navarro, J.-J.; Saracostti, M.; De-Toro, X. Modelización del efecto del compromiso escolar sobre la asistencia a clases y el rendimiento escolar. Rev. Psicodidáctica 2018, 23, 102–109. [Google Scholar] [CrossRef]
- Sirin, S.R.; Rogers-Sirin, L. Components of School Engagement Among African American Adolescents. Appl. Dev. Sci. 2005, 9, 5–13. [Google Scholar] [CrossRef]
- Stefansson, K.K.; Gestsdottir, S.; Birgisdottir, F.; Lerner, R.M. School engagement and intentional self-regulation: A reciprocal relation in adolescence. J. Adolesc. 2018, 64, 23–33. [Google Scholar] [CrossRef]
- National Statistics Institute (INE). Renta Media Anual por Hogar en Galicia; Instituto Nacional de Estadística: Madrid, Spain, 2018; Available online: https://www.ine.es/jaxiT3/Datos.htm?t=9949#!tabs-tabla (accessed on 12 October 2020).
- Ramos-Díaz, E.; Rodríguez-Fernández, A.; Revuelta, L. Validation of the Spanish Version of the School Engagement Measure (SEM). Span. J. Psychol. 2016, 19, E86. [Google Scholar] [CrossRef]
- Cleary, T.J. The development and validation of the Self-Regulation Strategy Inventory—Self-Report. J. Sch. Psychol. 2006, 44, 307–322. [Google Scholar] [CrossRef]
- Rodríguez, S.; Valle, A.; Piñeiro, I.; Vieites, T.; González-Suárez, R.; Rodríguez-Llorente, C. School Engagement, SRL and Academic Achievement (Version 1). Zenodo. 2020. Available online: http://doi.org/10.5281/zenodo.4018678 (accessed on 15 October 2020).
- Lanza, S.T.; Flaherty, B.P.; Collins, L.M. Latent Class and Latent Transition Analysis. In Handbook of Psychology; Wiley: Hoboken, NJ, USA, 2003; Volume 2, pp. 663–685. [Google Scholar]
- Muthén, L.K.; Muthén, B.O. 1998–2012: Mplus User’s Guide; Muthén & Muthén: Los Angeles, CA, USA, 2012. [Google Scholar]
- Lo, Y.; Mendell, N.R.; Rubin, D.B. Testing the number of components in a normal mixture. Biometrika 2001, 88, 767–778. [Google Scholar] [CrossRef]
- Hipp, J.R.; Bauer, D.J. Local solutions in the estimation of growth mixture models. Psychol. Methods 2006, 11, 36–53. [Google Scholar] [CrossRef] [Green Version]
- Cohen, J. Statistical Power Analysis for the Behavioral Sciences, 2nd ed.; Routledge: New York, NY, USA, 1988. [Google Scholar]
- Skinner, E.; Furrer, C.; Marchand, G.; Kindermann, T. Engagement and disaffection in the classroom: Part of a larger motivational dynamic? J. Educ. Psychol. 2008, 100, 765–781. [Google Scholar] [CrossRef] [Green Version]
- Skinner, E.A.; Kindermann, T.A.; Furrer, C.J. A Motivational Perspective on Engagement and Disaffection. Educ. Psychol. Meas. 2008, 69, 493–525. [Google Scholar] [CrossRef] [Green Version]
- Reich, K.H.; Oser, F.K.; Valentin, P. Knowing why I now know better: Children’s and youth’s explanations of their worldview changes. J. Res. Adolesc. 1994, 4, 151–173. [Google Scholar] [CrossRef]
- Schommer, M.; Calvert, C.; Gariglietti, G.; Bajaj, A. The development of epistemological beliefs among secondary students: A longitudinal study. J. Educ. Psychol. 1997, 89, 37–40. [Google Scholar] [CrossRef]
- Akbaş, Y.; Gençtürk, E. The effect of conceptual change approach to eliminate 9th grade high school students’ misconceptions about air pressure. Educ. Sci. Theory Pract. 2011, 11, 2217–2222. [Google Scholar]
- Posner, G.J.; Strike, K.A.; Hewson, P.W.; Gertzog, W.A. Accommodation of a scientific conception: Toward a theory of conceptual change. Sci. Educ. 1982, 66, 211–227. [Google Scholar] [CrossRef]
- Dotterer, A.M.; Lowe, K. Classroom Context, School Engagement, and Academic Achievement in Early Adolescence. J. Youth Adolesc. 2011, 40, 1649–1660. [Google Scholar] [CrossRef]
- Uka, A.; Uka, A. The Effect of Students’ Experience with the Transition from Primary to Secondary School on Self-Regulated Learning and Motivation. Sustainability 2020, 12, 8519. [Google Scholar] [CrossRef]
- Salmela-Aro, K.; Muotka, J.; Alho, K.; Hakkarainen, K.; Lonka, K. School burnout and engagement profiles among digital natives in Finland: A person-oriented approach. Eur. J. Dev. Psychol. 2016, 13, 704–718. [Google Scholar] [CrossRef]
- Hughes, J.N.; Luo, W.; Kwok, O.-M.; Loyd, L.K. Teacher-student support, effortful engagement, and achievement: A 3-year longitudinal study. J. Educ. Psychol. 2008, 100, 1–14. [Google Scholar] [CrossRef] [Green Version]
- Ladd, G.W.; Dinella, L.M. Continuity and change in early school engagement: Predictive of children’s achievement trajectories from first to eighth grade? J. Educ. Psychol. 2009, 101, 190–206. [Google Scholar] [CrossRef] [Green Version]
- Luo, W. Classifying Academically At-Risk First Graders into Engagement Types: Association with Long-Term Achievement Trajectories. Elem. Sch. J. 2009, 109, 380–405. [Google Scholar] [CrossRef] [Green Version]
- Muñoz-García, A.; Villena-Martínez, M.D. Influences of Learning Approaches, Student Engagement, and Satisfaction with Learning on Measures of Sustainable Behavior in a Social Sciences Student Sample. Sustainability 2021, 13, 541. [Google Scholar] [CrossRef]
- Antúnez, Á.; Pérez-Herrero, M.D.H.; Rosário, P.; Vallejo, G.; Núñez, J.C. Engagement SPIRALS in Elementary Students: A School-Based Self-Regulated Learning Approach. Sustainability 2020, 12, 3894. [Google Scholar] [CrossRef]
Figure 1.
Graphical representation of engagement profiles (z scores). Note. Group 1: low emotional and cognitive engagement and very low behavioral engagement; Group 2: very low emotional engagement, low cognitive engagement and medium level of behavioral engagement; Group 3: moderate levels of engagement; Group 4: moderately high levels of engagement.

Figure 2.
Profiles of school engagement and academic achievement. Note. Group 1: low emotional and cognitive engagement and very low behavioral engagement; Group 2: very low emotional engagement, low cognitive engagement and moderate level of behavioral engagement; Group 3: moderate levels of engagement; Group 4: moderately high levels of engagement.

Figure 3.
Profiles of school engagement and self-regulation strategies. Note. Group 1: low emotional and cognitive engagement and very low behavioral engagement; Group 2: very low emotional engagement, low cognitive engagement and moderate level of behavioral engagement; Group 3: moderate levels of engagement; Group 4: moderately high levels of engagement.


Table 1.
Means, standard deviations, asymmetry, kurtosis, and correlation matrix.
| 1 | 2 | 3 | 4 | 5 | 6 | 7 | 8 | 9 | |
|---|---|---|---|---|---|---|---|---|---|
| 1. Emotional Engag. | – | ||||||||
| 2. Cognitive Engag. | 0.50 a | – | |||||||
| 3. Behavioral Engag. | 0.39 a | 0.37 a | – | ||||||
| 4. Spanish Achieve. | 0.17 a | 0.09 b | 0.31 a | – | |||||
| 5. Math Achieve. | 0.13 a | 0.04 | 0.30 a | 0.57 a | – | ||||
| 6. Mgmt of Env | 0.26 a | 0.26 a | 0.35 a | 0.24 a | 0.14 a | – | |||
| 7. Mgmt. Infor. Hlp. | 0.27 a | 0.30 a | 0.24 a | 0.17 a | 0.22 a | 0.58 a | – | ||
| 8. Maladapt. Bhvr | −0.25 a | −0.10 b | −0.40 a | −0.29 a | −0.26 a | −.29 a | −0.298 a | – | |
| 6. Time Mgmt | 0.36 a | 0.52 a | 0.24 a | 0.06 | −0.002 | 0.64 a | 0.59 | –0.30 a | – |
| M | 3.61 | 2.92 | 4.17 | 3.81 | 3.74 | 3.94 | 3.82 | 2.01 | 3.61 |
| SD | 0.91 | 0.77 | 0.63 | 0.93 | 1.06 | 0.81 | 0.73 | 0.70 | 0.77 |
| Asymmetry | −0.63 | 0.05 | −0.98 | –0.78 | −0.74 | −0.88 | −0.62 | 0.80 | −0.44 |
| Kurtosis | 0.15 | −0.17 | 1.58 | 0.47 | −0.06 | 0.68 | 0.41 | 0.59 | −0.20 |
Mean scales: all variables have a minimum of 1 and a maximum of 5. a p < 0.01; b p < 0.05.
Table 2.
Results of the fit of the latent class models.
| Latent Class Models | ||||
|---|---|---|---|---|
| M2 | M3 | M4 | M5 | |
| AIC | 4674.776 | 4573.157 | 4528.631 | 4491.545 |
| BIC | 4720.526 | 4637.208 | 4610.982 | 4592.197 |
| SSA-BIC | 4688.774 | 4592.754 | 4553.827 | 4522.341 |
| LMRT | 260.314 | 105.604 | 50.602 | 43.434 |
| (p of LMRT) | (0.001) | (0.031) | (0.131) | (0.411) |
| Entropy | 0.641 | 0.686 | 0.742 | 0.739 |
| Number of groups with n < 5% | 0 | 0 | 0 | 1 |
M2 = Model with two latent classes, …M5 = Model with five latent classes; AIC = Akaike information criterion; BIC—Schwarz Bayesian information criterion; SSA-BIC = BIC adjusted by sample size; LMRT = Formal test of the maximum adjusted likelihood ratio from Lo et al. [61].
Table 3.
Characterization of latent profiles and classification accuracy of the individuals in each profile.
Table 3.
Characterization of latent profiles and classification accuracy of the individuals in each profile.
| Latent Profiles | ||||||
|---|---|---|---|---|---|---|
| 1 | 2 | 3 | 4 | n | % | |
| Class 1 | 0.786 | 0.107 | 0.106 | 0.000 | 36 | 5.02 |
| Class 2 | 0.040 | 0.858 | 0.103 | 0.000 | 47 | 6.55 |
| Class 3 | 0.010 | 0.027 | 0.858 | 0.105 | 405 | 56.48 |
| Class 4 | 0.000 | 0.000 | 0.150 | 0.850 | 229 | 31.95 |
Table 4.
Description of the latent profiles (means, standard errors, and confidence intervals).
| Confidence Intervals | ||||
|---|---|---|---|---|
| M | SE | Lower 5% | Higher 5% | |
| Group 1 (n = 36) | ||||
| Emotional engagement | 2.22 | 0.36 | 1.63 | 2.81 |
| Cognitive engagement | 1.99 | 0.22 | 1.63 | 2.36 |
| Behavioral engagement | 2.78 | 0.34 | 2.39 | 3.17 |
| Group 2 (n = 47) | ||||
| Emotional engagement | 1.91 | 0.15 | 1.66 | 2.16 |
| Cognitive engagement | 2.12 | 0.16 | 1.85 | 2.39 |
| Behavioral engagement | 4.12 | 0.13 | 3.90 | 4.34 |
| Group 3 (n = 405) | ||||
| Emotional engagement | 3.50 | 0.07 | 3.37 | 3.62 |
| Cognitive engagement | 2.75 | 0.05 | 2.67 | 2.82 |
| Behavioral engagement | 4.05 | 0.06 | 3.96 | 4.15 |
| Group 4 (n = 229) | ||||
| Emotional engagement | 4.39 | 0.07 | 4.28 | 4.50 |
| Cognitive engagement | 3.51 | 0.09 | 3.36 | 3.66 |
| Behavioral engagement | 4.58 | 0.04 | 4.51 | 4.64 |
Table 5.
Descriptive statistics in academic performance and self-regulation for each of the four profiles.
Table 5.
Descriptive statistics in academic performance and self-regulation for each of the four profiles.
| Group 1 | Group 2 | Group 3 | Group 4 | |||||
|---|---|---|---|---|---|---|---|---|
| M | SD | M | SD | M | SD | M | SD | |
| Spanish Achieve. | 3.39 | 0.99 | 3.64 | 1.05 | 3.72 | 0.92 | 4.07 | 0.86 |
| Math Achieve. | 3.19 | 1.01 | 3.74 | 0.97 | 3.64 | 1.05 | 3.98 | 0.97 |
| Environ_Mgmt | 2.87 | 0.92 | 3.48 | 0.95 | 3.81 | 0.75 | 4.45 | 0.51 |
| Informat_Mgmt | 2.94 | 0.91 | 3.29 | 0.74 | 3.70 | 0.64 | 4.30 | 0.50 |
| Maladapt_behavior | 2.71 | 0.72 | 2.27 | 0.66 | 2.10 | 0.65 | 1.67 | 0.61 |
| Time_Mgmt | 2.48 | 0.76 | 2.98 | 0.84 | 3.46 | 0.64 | 4.18 | 0.50 |
Note. Group 1: low emotional and cognitive engagement and very low behavioral engagement; Group 2: very low emotional engagement, low cognitive engagement, and moderate behavioral engagement; Group 3: moderate levels of engagement; Group 4: moderately high levels of engagement. All of the variables are on a scale of 1 = minimum and 5 = maximum.
Publisher’s Note: MDPI stays neutral with regard to jurisdictional claims in published maps and institutional affiliations. |
© 2021 by the authors. Licensee MDPI, Basel, Switzerland. This article is an open access article distributed under the terms and conditions of the Creative Commons Attribution (CC BY) license (http://creativecommons.org/licenses/by/4.0/).
Share and Cite
MDPI and ACS Style
Estévez, I.; Rodríguez-Llorente, C.; Piñeiro, I.; González-Suárez, R.; Valle, A. School Engagement, Academic Achievement, and Self-Regulated Learning. Sustainability 2021, 13, 3011. https://doi.org/10.3390/su13063011
AMA Style
Estévez I, Rodríguez-Llorente C, Piñeiro I, González-Suárez R, Valle A. School Engagement, Academic Achievement, and Self-Regulated Learning. Sustainability. 2021; 13(6):3011. https://doi.org/10.3390/su13063011
Chicago/Turabian StyleEstévez, Iris, Carolina Rodríguez-Llorente, Isabel Piñeiro, Rocío González-Suárez, and Antonio Valle. 2021. "School Engagement, Academic Achievement, and Self-Regulated Learning" Sustainability 13, no. 6: 3011. https://doi.org/10.3390/su13063011
Note that from the first issue of 2016, this journal uses article numbers instead of page numbers. See further details here.