
Examining the Asymmetric Impact of COVID-19 Pandemic and Global Financial Crisis on Dow Jones and Oil Price Shock


1
School of Economics and Management, Southeast University, Nanjing 210096, China
2
Endicott College of International Studies, Woosong University, Daejeon 34606, Korea
3
Faculty of Civil and Environmental Engineering, and Architecture, UTP University of Science and Technology, 85-796 Bydgoszcz, Poland
4
School of Management and Law, Zurich University of Applied Sciences, 8401 Winterthur, Switzerland
*
Authors to whom correspondence should be addressed.
Sustainability 2021, 13(9), 4688; https://doi.org/10.3390/su13094688
Submission received: 30 January 2021
/
Revised: 11 April 2021
/
Accepted: 15 April 2021
/
Published: 22 April 2021
(This article belongs to the Special Issue A Prerequisite for Sustainability: Financial Sustainability)
Abstract
:COVID-19 has significantly affected the financial and commodity markets. The purpose of this investigation is to understand the impact of the COVID-19 crisis on Dow Jones and West Texas Intermediate (WTI) oil returns in relation to other crises using the Exponential Generalized Autoregressive Conditional Heteroskedasticity (EGARCH) model. The results indicate that COVID-19 and the accompanying lockdown have adversely impacted both yields and that the impact on oil prices is more significant than on the Dow Jones index. The variance and squared residuals of oil prices and the Dow Jones reached their highest historical levels during the COVID-19 outbreak, even higher than during the global financial crisis, and especially the VaR of both markets reached their historical peak points during the COVID-19 era. The variance of WTI during COVID-19 is higher than that of DJI, as was also the case during the financial crisis. These findings confirm that COVID-19 has negatively impacted investors’ ability to determine optimal portfolios and thus the sustainability of financial and energy markets more than the global financial crisis of 2007–2009. We, therefore, suggest that policy changes are needed to maintain financial sustainability and help investors deal with future financial and other crises.
1. Introduction
Numerous events have affected oil prices in recent history, for example, the Iran–Iraq war (1979), the Gulf War (1990), the Asian Economic Crisis (1997), 9/11 (2001), the Great Recession (2014–2015), and the Global Financial Crisis (GFC) 2007–2009 [1]. The accompanying decreases in oil prices had major effects on the energy sector and led to lower corporate income and increased unemployment. On the other hand, a decrease in oil prices can also be beneficial for consumers and for the global economy in the longrun, for example, through cheaper energy and lower heating costs [2]. The more recent global lockdown triggered by the novel coronavirus (COVID-19) has also significantly affected oil prices. As a result, the capital expenditures of production companies will decrease significantly this year, with initial estimates indicating a 40% reduction in spending in the United States (US) and a 20% reduction compared to the previous year. Furthermore, global demand for oil is expected to decline by 29 million barrels (bbl) per year in April 2020 [3]. As a result of these estimates, the West Texas Intermediate (WTI), the US benchmark oil contract, turned negative for the first time [4].
Crude oil has performed inefficiently during the COVID-19 era, showing that the oil market is sensitive to a pandemic outbreak [5]. The decline in crude oil prices has affected the US stock markets more significantly than the pandemic outbreak, and oil prices typically lead the US market [6]. In addition, the increase in COVID-19 cases and deaths impacted the oil and financial markets in the US, Europe, and Asia [7]. The study of [8] specified that COVID-19 has severely affected economic activities. The investigation by [9] used the panel vector autoregressive model to determine the behavior of the oil and stock markets during COVID-19. The study found that both the oil market and stock markets volatility have a significant impact on oil returns. The study of [10] used the DCC-GARCH model and found that oil returns significantly affect stock market returns. Moreover, the study stated that a decrease in oil prices negatively affects the stock markets. The investigation by [11] employed the Autoregressive Distributed Lag (ARDL) model and stated that increases in COVID-19 deaths in the US and Japan are negatively correlated with oil prices. Furthermore, the study of [12] stated that COVID-19 has a significant impact on energy markets, i.e., crude oil and S&P GS Indexes. The study of [13] stated that gold is a substantial safe haven against oil prices. Moreover, [14] stated that COVID-19 cases and oil prices changes directly affect the Asian stock markets. Consequently, it becomes essential to evaluate the impact of COVID-19 news on the variance and mean returns of WTI. Conversely, the COVID-19 crisis offers a chance to develop new patterns of energy use and spur a sustainable evolution in the energy sector. While this year started in the worst possible way, the decrease in oil prices because of COVID-19 might also bean opportunityfor global cooperation to explore novel energy markets and help in the recovery from the natural crisis [15].
On the other hand, COVID-19 has significantly affected the stock markets of the world [16]. The investigation of [17] revealed that financial markets were about to crash due to COVID-19. Moreover, the first and second waves of the COVID-19 pandemic revealed dangerous impacts on financial markets of the globe in general and the US economy specifically [18]. COVID-19 has also impacted the financial and non-financial firms; however, financial firms transmit the financial contagion more prominently than non-financial firms [19].
The analysis of [20] claimed that COVID-19 had brought the globe closer to economic crises that are more dangerous thanGFC 2007–2009. Hence, it is important to explore the effects of COVID-19 on the stock markets. Most studies to date have used the S&P 500, Nasdaq Composite, CAC 40, Shanghai composite, or Nikkei 225 indices [7,21,22]. However, no one has explored the Dow Jones Industrial Index, which represents the largest 30 industries in the US and can also be highly affected by oil price shocks. Moreover, the trade war between China and the US can impact Dow Jones. Hence, this study employed the WTI and Dow Jones index to ascertain the impact of COVID-19 cases and deaths on the returns and volatility. On 19 March 2020, the Dow Jones fell by nearly 10 percent. According to a projection by JP Morgan Chase, US stock market activity will shrink by 14% in the second quarter, and COVID-19 will have a worse impact on financial markets than GFC. These developments have ushered a significant economic insolvency risk for both developing and developed nations. Thus, several governments have adopted the policy of interest-free lending and fiscal spending to handle the economic risk [23]. However, COVID-19 is ongoing and can have long-term effects, including on institutional and personal bankruptcy. The investigation done by [24] employed GDP, unemployment rate, share of debts, and household indebtedness to quantify the performance of an economy. The study revealed that low economic performance plays an important role in personal bankruptcies. However, [25] stated that bankruptcy risk is not predictable, as institutions have become more globalized and complex. Moreover, the study of [26] stated that explanatory factors of bankruptcy predictions are different for different nations. Hence, this investigation employed the Exponential Generalized Autoregressive Conditional Heteroskedasticity (E-GARCH) model assimilated with student and normal distribution to ascertain the downside risk of oil prices and the Dow Jones Index.
In such situations, it is important to understand the effects of the new coronavirus pandemic on returns and variance of the oil market and the US firms. This investigation utilized the Dow Jones Industrial Average Index (DJI) and West Texas Intermediate (WTI) as indicators for the US stock market and the US oil market, respectively. The key contribution of this study is theevaluation of the impact of COVID-19 on WTI and DJI markets. The analysis compares the influence of COVID-19 on these markets with that of the GFC and of the trade war between the United States and China. In addition, the study also evaluates the Value at Risk (VaR) of both markets to understand the financial risk pattern of these indices, so rational strategies can be made to optimize the investment portfolio. The general hypotheses that willbe evaluated in this study are as follows:
Hypothesis 1 (H1).
COVID-19 impact on DJI and oil markets is more dangerous than that of the GFC.
Hypothesis 2 (H2).
COVID-19 has raised the variance of these markets more than the GFC.
Hypothesis 3 (H3).
Value at Risk (VaR) of these markets has increased more during the COVID-19 era than during the GFC.
Hypothesis 4 (H4).
COVID-19 has affected oil returns more negatively than it has affected the DJI.
Thus, the study will answer the following critical questions from investors, researchers, academics, and policymakers: First, does the health crisis present a more significant danger for oil returns and the DJI than the GFC? Second, has COVID-19 reduced the returns of both markets more than the GFC? Third, has COVID-19 increased the variance of both markets more than the GFC? Fourth, does COVID-19 raise the downside risk of both markets more than the GFC? Finally, does COVID-19 pose a larger threat to WTI than to DJI? The answer to these questions will help investors, researchers, and policymakers to understand the impact of the health crisis and the financial crisis on these markets so that proactive measures can be taken in advance to cope with these and future crises.
The findings of the study revealed that COVID-19 has a greater negative impact on WTI and DJI than GFC. Moreover, the study stated that volatility generated due to COVID-19 remains the highest of the last three decades. The rest of the article is designed as follows. Section 2 explains the data and methodology, Section 3 provides a detailed discussion on the outcomes of this investigation, Section 4 states the conclusion derived from the analysis, and Section 5 discusses the limitations and future research directions.
2. Data and Methods
2.1. Data
This investigation used the daily prices of the Dow Jones Index (DJI) as the representationof the US industries and West Texas Intermediate (WTI) for the oil prices in the US (Table 1). This study recovered these prices from the database of Yahoo Finance from the period of 1 January 2007 to 23 April 2020. Moreover, dummy variables for GFC (1 January 2007–31 December 2009), the trade war between the United States and China (TWAR) (1 January 2018–30 December 2019), and COVID-19 (CVD) (31 December 2019–23 April 2020) were utilized to ascertain their impact on DJI and WTI. This is similar to [27,28], who used dummy variables to evaluate the daily, monthly, and yearly anomalies in the stock markets of the US, Canada, Germany, Japan, and the UK.
2.2. In-Sample Mean and Variance Estimation
This examination computed the daily returns as follows [29],
where Rit nominates the daily return value of a stock market i at time t. Pit and Pit−1 represent the closing value of a stock at time t and t−1, respectively. The investigation assigned the number one from 1 January 2007 to 31 December 2009 and zero otherwise to generate the dummy variable of GFC, the number one from 1 January 2020, to 23 April 2020, and zero otherwise for the nomination of COVID-19, and the number one through 1 June 2019–31 December 2019, and zero otherwise to denotes the trade war between the US and China. The analysis employed the Exponential Generalized Autoregressive Conditional Heteroskedasticity (EGARCH) model initiated by [30]. This model also accounts for the asymmetric shock effects that occurred in the sigma square series, and this technique does not employ the non-negative condition on the parameters [31]. The Akaike Information Criterion has been employed to select the best regression model. By following the approach of [30], mean and variance parameters of EGARCH (1, 1) can be modeled as:
where,
In Equation(2), and is the parameter of intercept, GFC, COVID-19 (CVD), and the trade war between the US and China (TWAR), respectively, while and denote the return values of a stock index i at time t and error term factor, respectively. This analysis assumed that the error term follows the Student’s t-distribution (t.d.) with a specific degree of freedom . Student’s t density provides better results than the normal distribution, and it captures the fat-tailed properties [32]. Further, in the variance equation (Equation (3)), portrays the variance of return series i, and indicates changes in own variance series, e.g., GARCH effect, whereas, , and signified the constant term, dummy factor of GFC, CVD, and TWAR, respectively. Furthermore, and symbolize the impact of change in returns on its own return series, e.g., ARCH impact and leverage effect, respectively.
2.3. In-Sample Downside Value at Risk (VaR) Modelling
An imperative objective of volatility prediction is to forecast the Value at Risk (VaR). VaR enumerates the extreme loss of security that can occur under normal circumstances through a given time and at a specific assurance level, e.g., 90%, 95%, and 99%. One day ahead and in-sample VaR of security can be specified as follows,
where point out the one-day ahead VaR value. Besides, indicates the qth quantile of the Student’s t-distribution and normal distribution; while, represents the forecasted variance through the EGARCH (1, 1) model by incorporating Equation (3). This project extracted the quantile after taking into account the zero mean and unit variance assumption and examined the VaR at a 99% confidence level. This analysis also implied an in-sample approach as it computes more effectual VaR [33].
2.4. VaR Back-Testing Approach
The general VaR verification process is known as the back-testing method, where projected VaR results are matched with realized returns of a series to obtain the VaR exceptions, e.g., how many times the negative returns exceed the estimated VaR. It is called “hit process” and can be illustrated as follows,
where Ri denotes the realized returns of series i. The investigation also makes use of the (Kupiec 1995) [34] test to back-test the VaR forecast. The null hypothesis of this test revealed that the actual numbers of violations are near the expected violation rate. The likelihood ratio of this test can be demonstrated as follows,
where , , and designate the observed violation rate, the number of the period these violations happened, and expected violations, respectively. This approach follows the Chi square distribution. Nonetheless, this study employed the (Christoffersen 1998) [35] technique that scrutinized the null hypothesis that the failure rate is independent and identically distributed (i.i.d) throughout the entire period. The likelihood statistics of this model can be explained as:
where and direct the maximum likelihood estimates and the number of transitions that fell from i to j (0 to 1), respectively. This approach follows the Chi square distribution.
3. Results and Discussion
3.1. ADF, PP, and Summary Statistics Fallouts
Table 2 indicates the findings of the unit root test, the heteroskedasticity test, and summary statistics of study variables. The summary of these variables signified that oil returns have a negative mean value, but DJI indicated a positive mean return. Moreover, the kurtosis value of both variables is high, which implies that chances of loss are high, and oil returns disclosed a higher standard deviation than DJI. The Jarque–Bera test denotes that both variables are not normally distributed. Hence, Student’s t-distribution can be engaged to capture the fat-tailed distribution properties of these variables. The study employed the Augmented Dickey–Fuller (ADF) test [36] and the Phillip Perron (PP) test [37] to ascertain the stationary level of study variables. The outcomes revealed that returns of both markets are stationary at level, e.g., I(0), and none of them have a second difference unit root. The fallouts of Autoregressive Conditional Heteroskedasticity Lagrange Multiplier (ARCH-LM) showthat returns of both indices showed a strong ARCH effect at a 1% level of significance.
3.2. Mean Equation Outcomes
The upshots of the mean equation (Equation (2)) are given in Table 3. The results showthat the constant factor of WTI is insignificant, but DJI has a significant constant term. The coefficient of GFC (ϑ1), in the mean equation of WTI, has a positive and significant association with oil returns. However, COVID-19 (ϑ2) showsa negative association with oil returns, implying that a 1 unit increase in the number of confirmed patients and death due to COVID-19 will bring a 0.66 unit decrease in oil returns of the US. The trade war between the US and China (ϑ3) exposed a positive but insignificant impact on oil returns. The findings of the DJI mean equation elaborated that GFC (ϑ1) and COVID-19 (ϑ2) have a negative association with oil returns in the US. These findings are matched with the analysis of [38]. Furthermore, the parameter of the trade war between the US and China (ϑ3) designated a direct but insignificant effect on DJI. The consequences specified that increases in fear of COVID-19 and the lockdown situation have negatively stimulated the returns of both variables, but the impact of COVID-19 on oil prices is higher than DJI. However, the trade war between the US and China remains insignificant. Hence, these findings matchthe study of [16], which stated that COVID-19 has significantly impacted the returns of the reputed stock markets of the world. Moreover, the study indicated that the impact of COVID-19 is greater than GFC on the stock markets of the US, Europe, and Asia. The investigation of [39] indicated that increases in COVID-19 cases and deaths have imperatively damaged the financial stability, which significantly impacts the manufacturing sector and global economy. The investigation done by [40] revealed that COVID-19 has expressively affected the manufacturing sector worldwide. Particularly, it will shrink the manufacturing sector of India by 5.5% to 20%. Moreover, the study of [41] stated that COVID-19 has not only damaged the manufacturing sector but also impacted the demand and supply all over the world. Hence, the smart industry can be the best option to overcome these issues [42,43,44].
It can be seen that COVID-19 has significantly harmed the returns of both markets. Hence, the hypothesis generated in this study regarding the negative impact of COVID-19 on market returns has been accepted.
3.3. Variance Equation Results
The verdicts of variance equation, Equation (3), for both variables, i.e., WTI and DJI, are presented in Table 4. These findings quantified that the constant term for both variables is significant, which means the average returns of these indices are other than zero. The variance parameter of GFC (κ1) connoted that it has significantly amplified the volatility of oil markets. Moreover, an intensification in the death rate due to COVID-19 also imperatively boosts the 0.06 unit volatility of the oil market. Further, changes that occurred in the variance of oil markets due to the trade war between the US and China presented an insignificant effect (κ3). The shocks quantified through standardized residuals at time t significantly distress the volatility of its returns at time t+1, entailing the substantial ARCH effect () in oil series. Furthermore, the shocks in the variance of the oil series have a major influence on its variance series, which confirmed the strong GARCH effect (). The gamma coefficient ( value of the oil market is negative and significant, which indicates that negative news about COVID-19, prevailing in the market, elevates the instability of the oil series more than good news of the same magnitude, inferring that oil series have a leverage effect. The coefficient of the degree of freedom hadthe satisfactory value of 7.83, which concludes that this examination has efficaciously captured the fat-tailed distribution properties of the oil market. The study of [45] investigated the effects of variations in the oil prices on the EUR/USD exchange price by using the approach of neural networks. The study argued that EUR/USD exchange price is significantly affiliated with the oil price in the international market. Moreover, the study of [46] stated that COVID-19 and oil price shock expressively affected the stock market and economic policy uncertainty.
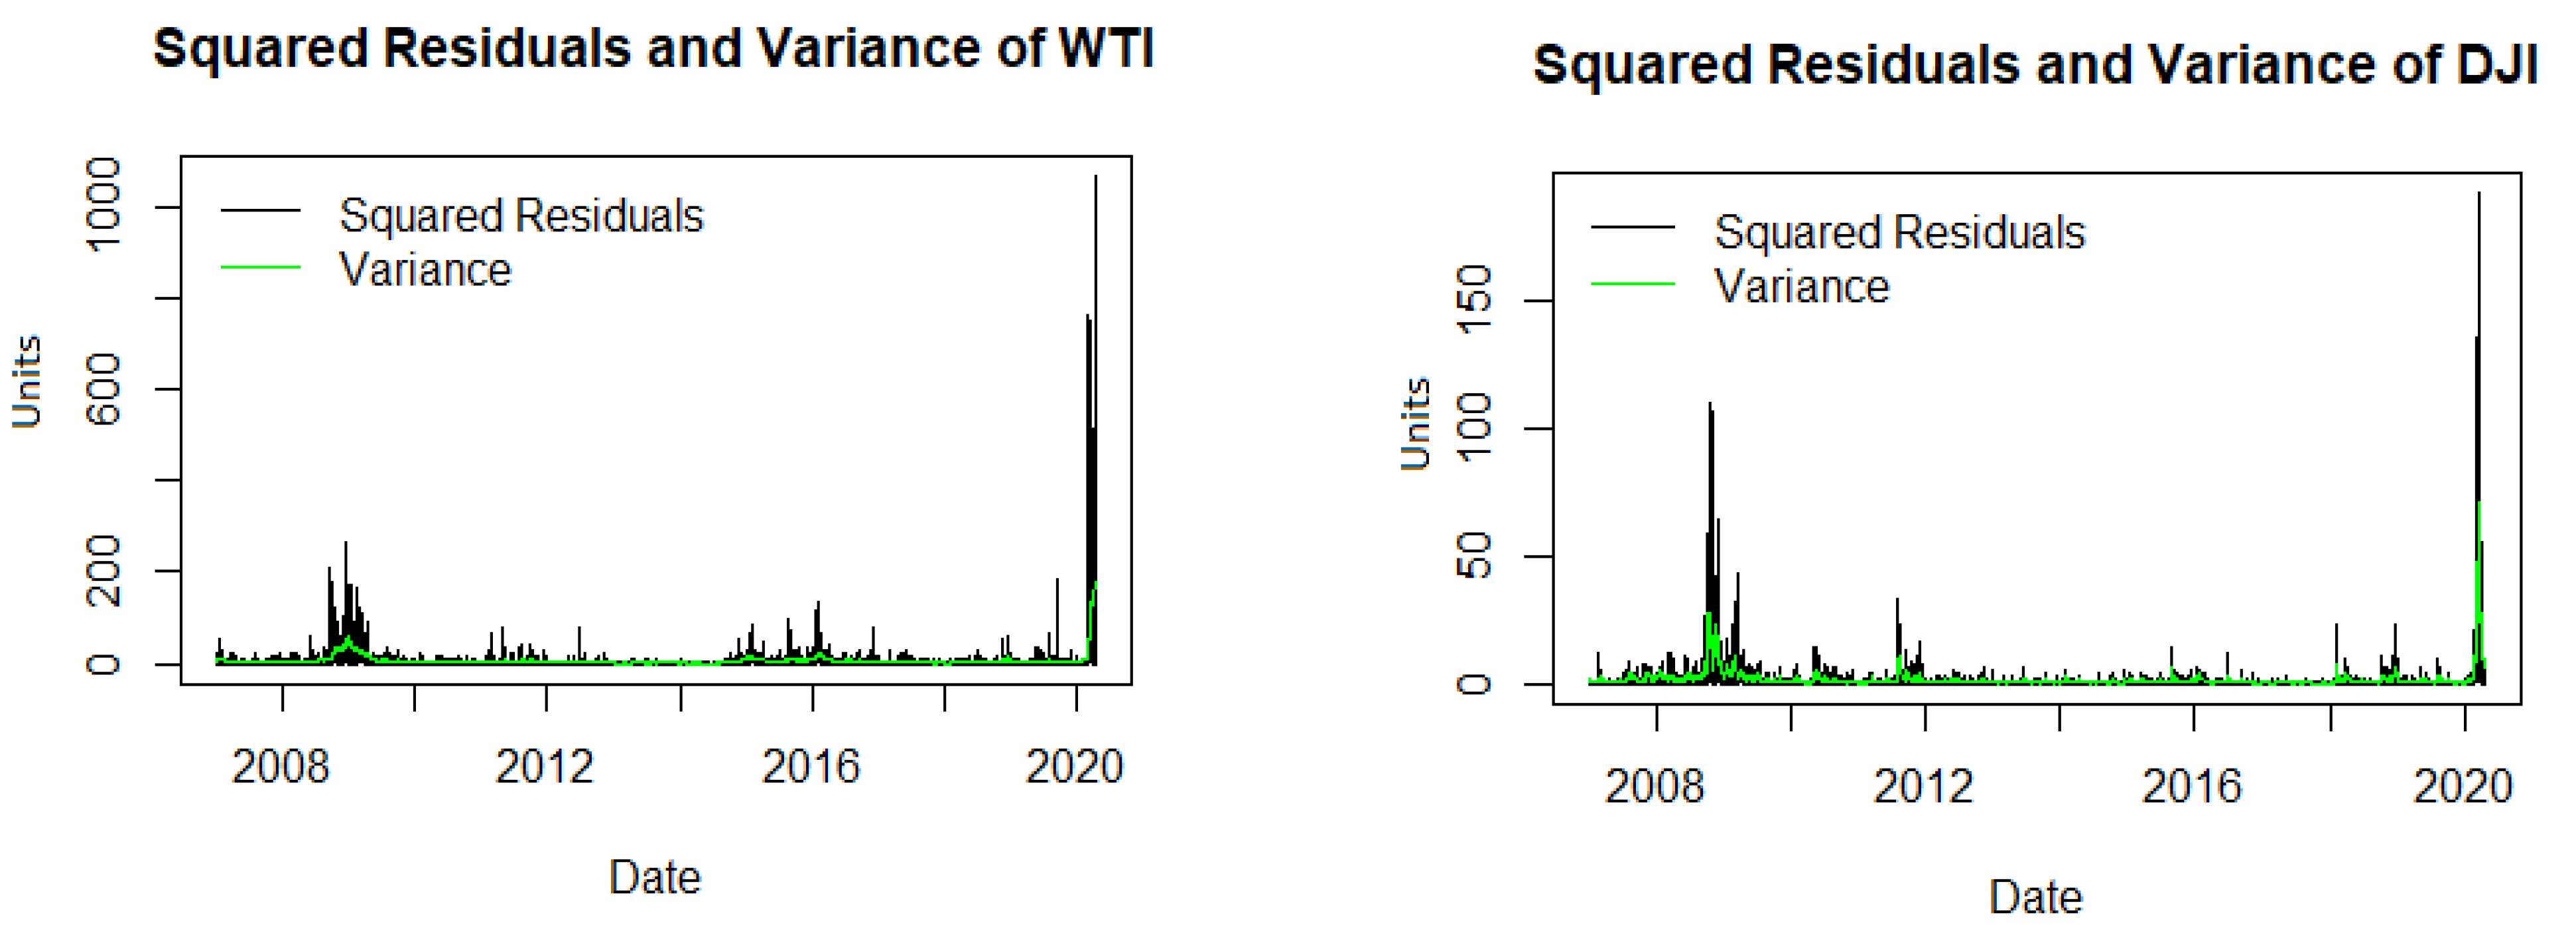
The findings of the DJI variance equation mentioned that it has direct links with the GFC. Furthermore, a 1unit growth in the confirmed cases and death rate because of COVID-19 expressively upturned the instability of DJI by 0.09 units. The uncertainty that occurred due to the trade war between China and the US has an insignificant impact on DJI. The variation in returns of DJI indicated a notable direct impact on its return series, suggesting that the ARCH effect () is present for DJI returns. Additionally, instability in the variance series of DJI momentously expands its inconsistency, inferring that the GARCH effect () exists in the DJI index. The gamma factor ) showedthat negative news in the markets has more effect on DJI returns than good news of the same magnitude, which surmises a strong leverage effect. The degree of freedom factor () has a fair and significant value of 6.03, which means this examination has successfully shownthe fat-tailed distribution of DJI. These calculations confirmed that COVID-19 has dramatically proliferated the volatility of markets. Moreover, lockdown conditionsas a result of COVID-19 have severely damaged the returns of oil markets as equated with DJI. Figure 1 shows that squared residuals and variance of WTI and DJI are high during the GFC era, butare the highest point of three decades due to COVID-19. Indeed, the variance of WTI is higher than DJI during the GFC period and the COVID-19 era. These findings showthat COVID-19 has significantly upsurged the volatility of the underlying markets. Hence, the investigation suggested that significant funds should be allocated to the health sector to prevent the health crisis. Moreover, the World Health Organization (WHO) should build a mechanism that reduces the chances of a health crisis in the future.
3.4. Shocks Persistency Period
The sum of ARCH and GARCH parameters measured the level of volatility persistence in a market. Accordingly, if the sum of ARCH and GARCH coefficient is near to 1, then volatility persists for a long time [47]. The sum of ARCH and GARCH number is equal to 1which identified that the shocks that occurred in the oil market due to COVID-19 will be prolonged for the long term period [48]. Indeed, the sum of the ARCH and GARCH parameters of DJI also revealed that shocks elongate for a long time duration but are less than WTI.
3.5. Value at Risk (VaR) Forecasting
This investigation has forecasted the one-day-ahead downside VaR of DJI and WTI markets by calculating Equation (5), stated above. The analysis utilized the Student’s t-distribution to assess real VaR and capture the excess leptokurtic properties in order tocompare its results with the normal distribution. The summary statistics of VaR for both markets at a 99% confidence level are shown in Table 5. The statistics show that the VaR of WTI is morethan DJI. Moreover, the average value of VaR for WTI and DJI is −5.83 and −2.66, respectively. Furthermore, the maximum loss calculated by Student’s t-distribution is higher than the normal distribution for both markets. The maximum loss that can occur is −34.81 and −21.84 per cent for WTI and DJI, respectively. Figure 2 shows the time-varying VaR of WTI and DJI. It shows that the VaR of these markets is higher during the era of the GFC, but due to COVID-19, it has reachedthe peak point of its history.
3.6. Back-Test the VaR Model
This research applied the Kupiec (1995) [34] and Christoffersen (1998) [35] tests to ascertain the accuracy of the VaR model. The likelihood value of unconditional and conditional tests presented in Table 6 showthat the EGARCH (1, 1) model assimilated with Student’s t-distribution has successfully captured the accurate VaR of both markets, indicating that these parameters are independent and identically distributed. Additionally, exceptions generated by Student’s t-distributions are near to the expected hit rate. Hence, it is confirmed that EGARCH (1, 1) model combined with Student’s t density flawlessly predicts the VaR, but normal distribution predicts biased values. These findings are supported by [49].
3.7. Diagnostic Test for EGARCH (1, 1) Model
This analysis applied the Engle (1982) [50] and Breusch and Pagan (2006) [51] tests to evaluate the heteroskedasticity and serial correlation in the standardized residuals of the EGARCH (1, 1) model. The null hypothesis of these tests stated that there is no heteroskedasticity and serial correlation. The parameters of these tests specified in Table 7 show that there is no heteroskedasticity in the residuals at lag 10. Furthermore, the serial correlation effect in standardized and squared standardized residuals is insignificant at lag 10.
4. Conclusions
The assessment in this study showed that the global financial crisis had a positive effect on oil returns, but COVID-19 had a negative effect on oil returns, and the trade war had no significant effect on oil returns. In addition, both the global financial crisis and COVID-19 had a negative impact on DJI. The study also found that COVID-19 and the global financial crisis have significantly increased the volatility of the oil market and DJI, with COVID-19 having a greater impact on the WTI than DJI. Furthermore, research shows that shocks in the variance of WTI and DJI have dramatically increased the volatility of these markets, and shocks measured by standard residuals have a substantial long-term effect on the returns of WTI and DJI. They were negatively affected by the news in these markets due to COVID-19; the oil markets had a more significant impact than the DJI, indicating that both markets had a leverage effect. This investigation found that the downside Value at Risk (VaR) in oil returns is higher in the full sample period than DJI. The EGARCH (1, 1) model combined the Student’s density parameters to capture the VaR at 99% confidence levels. However, the normal distribution fails to measure the correct VaR for WTI and DJI. The investigation of [52] confirmed that COVID-19 news negatively impacted oil prices. In addition, the study of [10] employed theDCC-GARCH model and found that oil price volatility imperatively affects the stock markets. Furthermore, [53] used the Vector Autoregressive model and confirmed that the COVID-19 pandemic caused oil prices to decrease. Hence, our analysis confirmed that COVID-19 is a bigger crisis than the global financial crisis of 2007–2009, and it has critically disturbed the world’s financial and commodity markets. Hence, these findings confirmed the hypotheses of this study. Moreover, due to the lockdown situation, consumption of oil has dramatically diminished, producing a large gap between demand and supply of oil. This effect can cause more severe damages before the economic circle restarts. Governments need to maintain the balance between the demand and supply of crude oil. Additionally, the US government should introduce new policies to stabilize oil prices so that the stability of the stock markets can be improved. This stabilization is critical to ensure long-term investment in sustainable developments are not negatively impacted by the systemic shock of COVID-19. For future research, other stock markets of the US, Europe, and Asian countries can be added to the model to verify the findings of the study. The results of this study are essential for policymakers and government officials in the United States and other oil-producing countries.
5. Limitations and Future Research Directions
The study is based on a specific Dow Jones Industrial Average (DJI) to represent performance in US financial markets. While the DJI is the most commonly followed equity index, other indices may providemore representative results for the overall US stock market.
Future research should provide further improvements by analyzing different stock market indices like the S&P 500 for large companies in the US or the Russell 3000 as a benchmark of the entire US stock market. The analysis could be further expanded to investigate how COVID-19 impacts the economy of the European Union and other markets. In addition, it could apply the implied volatilities of the stock index and WTI crude oil as well to capture the market’s view, and implement more variables into the model (e.g., some control variables). Moreover, non-linear GARCH models could be employed to validate the findings of this study.
Author Contributions
Conceptualization, K.S. and U.Z.; methodology, K.S.; software, K.S.; validation, X.L., J.G.; formal analysis, K.S.; investigation, K.S.; resources, U.Z., J.G.; data curation, U.Z., J.G.; writing—original draft preparation, K.S., U.Z.; writing—review and editing, K.S., U.Z. and C.P.; visualization, J.G.; supervision, X.L.; project administration, X.L.; funding acquisition, U.Z. All authors have read and agreed to the published version of the manuscript.
Funding
This research was funded by the National Natural Science Foundation of China, grant number 71673043.
Data Availability Statement
The data used in this study is available online at https://finance.yahoo.com (accessed on 25 April 2020).
Conflicts of Interest
The authors declare no conflict of interest.
References
- Mensi, W. Global financial crisis and co-movements between oil prices and sector stock markets in Saudi Arabia: A VaR based wavelet. Borsa Istanb. Rev. 2019, 19, 24–38. [Google Scholar] [CrossRef]
- Blas, J.; Kennedy, S. For Once, Low Oil Prices May Be a Problem for World’s Economy—Bloomberg. Available online: https://www.bloomberg.com/news/articles/2016-02-02/for-once-low-oil-prices-may-be-a-problem-for-world-s-economy (accessed on 16 March 2021).
- Tagliapietra, S. COVID-19 Is Causing the Collapse of Oil Markets: When Will They Recover?|Bruegel. Available online: https://www.bruegel.org/2020/04/covid-19-is-causing-the-collapse-of-oil-markets-when-will-they-recover/ (accessed on 30 April 2020).
- Yahoo Yahoo Finance—Stock Market Live, Quotes, Business & Finance News. Available online: https://finance.yahoo.com/ (accessed on 25 April 2020).
- Mensi, W.; Sensoy, A.; Vo, X.V.; Kang, S.H. Impact of COVID-19 outbreak on asymmetric multifractality of gold and oil prices. Resour. Policy 2020, 69, 101829. [Google Scholar] [CrossRef]
- Sharif, A.; Aloui, C.; Yarovaya, L. COVID-19 pandemic, oil prices, stock market, geopolitical risk and policy uncertainty nexus in the US economy: Fresh evidence from the wavelet-based approach. Int. Rev. Financ. Anal. 2020, 70, 101496. [Google Scholar] [CrossRef]
- Shehzad, K.; Xiaoxing, L.; Arif, M.; Rehman, K.U. Investigating the Psychology of Financial Markets During COVID-19 Era: A Case Study of the US and European Markets. Front. Psychol. 2020, 11, 1–13. [Google Scholar] [CrossRef] [PubMed]
- Bashir, M.F.; MA, B.; Shahzad, L. A brief review of socio-economic and environmental impact of Covid-19. Air Qual. Atmos. Health 2020, 13, 1403–1409. [Google Scholar] [CrossRef]
- Salisu, A.A.; Ebuh, G.U.; Usman, N. Revisiting oil-stock nexus during COVID-19 pandemic: Some preliminary results. Int. Rev. Econ. Financ. 2020, 69, 280–294. [Google Scholar] [CrossRef]
- Prabheesh, K.P.; Padhan, R.; Garg, B. COVID-19 and the Oil Price—Stock Market Nexus: Evidence From Net Oil-Importing Countries. Energy Res. Lett. 2020, 1, 1–6. [Google Scholar] [CrossRef]
- Nyga-łukaszewska, H. Energy Prices and COVID-Immunity: The Case of Crude Oil and Natural Gas Prices in the US and Japan. Energies 2020, 13, 6300. [Google Scholar] [CrossRef]
- Aloui, D.; Goutte, S.; Guesmi, K.; Hchaichi, R. COVID 19’ s impact on crude oil and natural gas S & P GS Indexes. SSRN Electron. J. 2020. [Google Scholar] [CrossRef]
- Salisu, A.A.; Vo, X.V.; Lawal, A. Hedging oil price risk with gold during COVID-19 pandemic. Resours. Policy 2020, 70, 101897. [Google Scholar] [CrossRef]
- Mishra, P.K.; Mishra, S.K. Corona Pandemic and Stock Market Behaviour: Empirical Insights from Selected Asian Countries. Millenn. Asia 2020. [Google Scholar] [CrossRef]
- Bocca, R. In the Wake of COVID-19, Is It Time for a New Energy Order?|World Economic Forum. Available online: https://www.weforum.org/agenda/2020/04/energy-oil-gas-electricity-sustainability-economy-covid19-coronavirus-pandemic-market-stability/ (accessed on 30 April 2020).
- Shehzad, K.; Xiaoxing, L.; Kazouz, H. COVID-19’s disasters are perilous than Global Financial Crisis: A rumor or fact? Financ. Res. Lett. 2020, 36, 101669. [Google Scholar] [CrossRef] [PubMed]
- Adam, T. How Coronavirus almost Brought down the Global Financial System. Available online: https://www.theguardian.com/business/2020/apr/14/how-coronavirus-almost-brought-down-the-global-financial-system (accessed on 17 April 2020).
- Yousfi, M.; Ben Zaied, Y.; Ben Cheikh, N.; Ben Lahouel, B.; Bouzgarrou, H. Effects of the COVID-19 pandemic on the US stock market and uncertainty: A comparative assessment between the first and second waves. Technol. Forecast. Soc. Chang. 2021, 167, 120710. [Google Scholar] [CrossRef]
- Akhtaruzzaman, M.; Boubaker, S.; Sensoy, A. Financial contagion during COVID–19 crisis. Financ. Res. Lett. 2021, 38, 101604. [Google Scholar] [CrossRef]
- Georgieva, K. IMF Managing Director Kristalina Georgieva’s Statement Following a G20 Ministerial Call on the Coronavirus Emergency. 2020. Available online: https://www.imf.org/en/News/Articles/2020/03/23/pr2098-imf-managing-director-statement-following-a-g20-ministerial-call-on-the-coronavirus-emergency (accessed on 30 April 2020).
- Just, M.; Echaust, K. Stock market returns, volatility, correlation and liquidity during the COVID-19 crisis: Evidence from the Markov switching approach. Financ. Res. Lett. 2020, 37, 101775. [Google Scholar] [CrossRef] [PubMed]
- Rudden, J. Impact of COVID-19 on the Global Financial Markets—Statistics & Facts|Statista. Available online: https://www.statista.com/topics/6170/impact-of-covid-19-on-the-global-financial-markets/ (accessed on 30 April 2020).
- Noy, I.; Doan, N.; Ferrarini, B.; Park, D. The Economic Risk from COVID-19 Is Not Where COVID-19 Is|VOX, CEPR Policy Portal. Available online: https://voxeu.org/article/economic-risk-covid-19-not-where-covid-19 (accessed on 19 March 2021).
- Kubálek, J.; Čámská, D.; Strouhal, J. Personal Bankruptcies from Macroeconomic Perspective. Int. J. Entrep. Knowl. 2018, 5, 78–88. [Google Scholar] [CrossRef]
- Kliestik, T.; Misankova, M.; Valaskova, K.; Svabova, L. Bankruptcy Prevention: New Effort to Reflect on Legal and Social Changes. Sci. Eng. Ethics 2018, 24, 791–803. [Google Scholar] [CrossRef]
- Kovacova, M.; Kliestik, T.; Valaskova, K.; Durana, P.; Juhaszova, Z. Systematic review of variables applied in bankruptcy prediction models of Visegrad group countries. Oecon. Copernic. 2019, 10, 743–772. [Google Scholar] [CrossRef] [Green Version]
- Choudhry, T. Day of the week effect in emerging Asian stock markets: Evidence from the GARCH model Day of the week e ect in emerging Asian stock markets: Evidence from the GARCH model. Appl. Financ. Econ. 2010, 37–41. [Google Scholar] [CrossRef]
- Kiymaz, H.; Berument, H. The day of the week effect on stock market volatility and volume: International evidence. Rev. Financ. Econ. 2003, 12, 363–380. [Google Scholar] [CrossRef] [Green Version]
- Bhuyan, R.; Robbani, M.G.; Talukdar, B.; Jain, A. Information transmission and dynamics of stock price movements: An empirical analysis of BRICS and US stock markets. Int. Rev. Econ. Financ. 2016, 46, 180–195. [Google Scholar] [CrossRef]
- Daniel, B. Nelson Conditional Heteroskedasticity in Asset Returns: A New Approach Author(s): Daniel B. Nelson Reviewed Work(s); Conditional Heteroskedasticity in Asset Returns; The Econometric Society: Cleveland, OH, USA, 1991; Volume 59, pp. 347–370. Available online: http://www.jstor.org/stable/2938260 (accessed on 30 April 2020).
- Sikhosana, A.; Aye, G.C. Asymmetric volatility transmission between the real exchange rate and stock returns in South Africa. Econ. Anal. Policy 2018, 60, 1–8. [Google Scholar] [CrossRef] [Green Version]
- Bollerslev, T. A Conditionally Heteroskedastic Time Series Model for Speculative Prices and Rates of Return. Rev. Econ. Stat. 1987. [Google Scholar] [CrossRef] [Green Version]
- Mensi, W.; Hammoudeh, S.; Nguyen, D.K.; Kang, S.H. Global financial crisis and spillover effects among the U.S. and BRICS stock markets. Int. Rev. Econ. Financ. 2016, 42, 257–276. [Google Scholar] [CrossRef]
- Kupiec, P.H. Techniques for Verifying the Accuracy of Risk Measurement Models. J. Deriv. 1995. [Google Scholar] [CrossRef]
- Christoffersen, P.F. Evaluating Interval Forecasts. Int. Econ. Rev. 1998, 841–862. [Google Scholar] [CrossRef]
- Dickey, D.A.; Fuller, W.A. Distribution of the estimators for autoregressive time series with a unit root. J. Am. Stat. Assoc. 1979, 74, 427–431. [Google Scholar]
- Phillips, P.C.B.; Perron, P. Testing for a unit root in time series regression. Biometrika 1988, 75, 345–346. [Google Scholar] [CrossRef]
- Bouazizi, T.; Lassoued, M.; Hadhek, Z. Oil Price Volatility Models during Coronavirus Crisis: Testing with Appropriate Models Using Further Univariate GARCH and Monte Carlo Simulation Models. Int. J. Energy Econ. Policy 2021, 11, 281–292. [Google Scholar] [CrossRef]
- Shehzad, K.; Xiaoxing, L.; Bilgili, F.; Koçak, E. COVID-19 and Spillover Effect of Global Economic Crisis on the United States’ Financial Stability. Front. Psychol. 2021, 12, 104. [Google Scholar] [CrossRef] [PubMed]
- Sahoo, P. Ashwani COVID-19 and Indian Economy: Impact on Growth, Manufacturing, Trade and MSME Sector. Glob. Bus. Rev. 2020, 21, 1159–1183. [Google Scholar] [CrossRef]
- Okorie, O.; Subramoniam, R.; Charnley, F.; Patsavellas, J.; Widdifield, D.; Salonitis, K. Manufacturing in the Time of COVID-19: An Assessment of Barriers and Enablers. IEEE Eng. Manag. Rev. 2020, 48, 167–175. [Google Scholar] [CrossRef]
- Valaskova, K.; Throne, O.; Kral, P.; Michalkova, L. Deep learning-enabled smart process planning in cyber-physical system-based manufacturing. J. Self Gov. Manag. Econ. 2020, 8, 121–127. [Google Scholar]
- Peters, E.; Kliestik, T.; Musa, H.; Durana, P. Product decision-making information systems, real-time big data analytics, and deep learning-enabled smart process planning in sustainable industry 4.0. J. Self Gov. Manag. Econ. 2020, 8, 16–22. [Google Scholar]
- Kliestik, T.; Nica, E.; Musa, H.; Poliak, M.; Mihai, E.-A. Networked, Smart, and Responsive Devices in Industry 4.0 Manufacturing Systems. Econ. Manag. Financ. Mark. 2020, 15, 23–29. [Google Scholar]
- Vochozka, M.; Rowland, Z.; Suler, P.; Marousek, J. The influence of the international price of oil on the value of the EUR/USD exchange rate. J. Compet. 2020, 12, 167–190. [Google Scholar] [CrossRef]
- Sharif, A.; Aloui, C.; Yarovaya, L. COVID-19 Pandemic, Oil Prices, Stock Market and Policy Uncertainty Nexus in the US Economy: Fresh Evidence from the Wavelet-Based Approach; Elsevier: Amsterdam, The Netherlands, 2020. [Google Scholar]
- Dedi, L.; Yavas, B.F. Return and volatility spillovers in equity markets: An investigation using various GARCH methodologies. Cogent Econ. Financ. 2016, 4, 1–18. [Google Scholar] [CrossRef]
- Shehzad, K.; Liu, X.; Tiwari, A. Analysing time difference and volatility linkages between China and the United States during financial crises and stable period using VARX-DCC-MEGARCH model. Int. J. Financ. Econ. 2020, 26, 1–20. [Google Scholar] [CrossRef]
- Ramalho, V.; Ricardo, D. Predictive Performance of Value-at-Risk Models: Covid-19 “Pandemonium”. Ph.D. Thesis, Instituto Superior de Economia e Gestao, Lisboa, Portugal, 2020. [Google Scholar]
- Engle, R.F. Autoregressive Conditional Heteroscedasticity with Estimates of the Variance of United Kingdom Inflation. Econometrica 1982, 50, 987. [Google Scholar] [CrossRef]
- Breusch, T.S.; Pagan, A.R. A Simple Test for Heteroscedasticity and Random Coefficient Variation. Econometrica 2006, 1287–1294. [Google Scholar] [CrossRef]
- Narayan, P.K. Oil price news and COVID-19—Is there any connection? Energy Res. Lett. 2020, 1, 1–5. [Google Scholar] [CrossRef]
- Mzoughi, H.; Urom, C.; Uddin, G.S.; GUESMI, K. The Effects of COVID-19 Pandemic on Oil Prices, CO2 Emissions and the Stock Market: Evidence from a VAR Model. SSRN Electron. J. 2020, 1–8. [Google Scholar] [CrossRef]
Figure 1.
Squared residuals and variance of both markets. It can be seen that the variance of both markets is high during theCOVID-19 era, which confirms the hypothesis of this study to be true.
Figure 1.
Squared residuals and variance of both markets. It can be seen that the variance of both markets is high during theCOVID-19 era, which confirms the hypothesis of this study to be true.

Figure 2.
Value at Risk (VaR) plots of both markets calculated through Student’s and normal distribution. It can be seen that the downside risk of both markets hasincreased during the COVID-19 era in comparison with the global financial crisis. Moreover, the downside risk of the oil market is greater than DJI. Hence, it confirms the acceptance of the study hypothesis.


Table 1.
Description of the variables.
| Variable Name | Source/Description |
|---|---|
| Dow Jones Industrial Index | Yahoo Finance |
| West Texas Intermediate Oil prices | The U.S. Energy Information Administration |
| COVID-19 Crisis | Dummy variable |
| Global Financial Crisis | Dummy variable |
| USA–China Trade War | Dummy variable |
Table 2.
Unit root, heteroskedasticity, and summary results.
| Variable | Std. Dev. | Skewness | Kurtosis | Jarque–Bera | Mean |
|---|---|---|---|---|---|
| WTI | 2.659791 | 0.438831 | 24.17405 | 64204.09 | −0.018125 |
| DJI | 1.255449 | −0.453576 | 19.05330 | 36097.42 | 0.019247 |
| Variable | ARCH LM | ADF | PP | ||
| F-stat. | I(0) | I(1) | I(0) | I(1) | |
| WTI | 759.2923 *** | −59.26339 *** | −28.23444 *** | −59.26339 *** | −295.9809 *** |
| DJI | 470.464 *** | −67.39095 *** | −25.59877 *** | −67.30813 *** | −960.1569 *** |
Note 1: *** denotes 1% level of significance: Source: Author’s calculation. Note 2: Here, WTI and DJI represent the West Texas Intermediate crude oil and Dow Jones Industrial Index, respectively.
Table 3.
Results of mean equation.
| Variable | Coefficient | Std.Err | T-Statistics | Prob. |
|---|---|---|---|---|
| WTI | ||||
| ϑ0 | −0.003476 | 0.032108 | −0.10826 | 0.913791 |
| ϑ1 | 0.145109 | 0.086974 | 1.66841 | 0.095234 |
| ϑ2 | −0.667377 | 0.202804 | −3.29075 | 0.000999 |
| ϑ3 | 0.079753 | 0.08821 | 0.90413 | 0.365928 |
| DJI | ||||
| ϑ0 | 0.058609 | 0.012653 | 4.63216 | 0.000000 |
| ϑ1 | −0.042758 | 0.03557 | −1.20209 | 0.229329 |
| ϑ2 | −0.056968 | 0.121473 | −2.46897 | 0.0639089 |
| ϑ3 | 0.020868 | 0.03087 | 0.67599 | 0.499046 |
Source: Author’s calculation. Note 1: Here WTI and DJI represent the West Texas Intermediate crude oil and Dow Jones Industrial Index, respectively. Moreover, ϑ0, ϑ1, ϑ2, and ϑ3 define the intercept, dummy variable of GFC, COVID-19, and trade war between China and the US, respectively.
Table 4.
Results of the variance equation.
| Variable | Coefficient | Std.Err | T-Statistics | Prob. |
|---|---|---|---|---|
| WTI | ||||
| κ0 | 0.008674 | 0.001923 | 4.51141 | 0.000000 |
| κ1 | 0.005014 | 0.003966 | 1.2644 | 0.020608 |
| κ2 | 0.06459 | 0.012792 | 5.0493 | 0.000000 |
| κ3 | −0.003895 | 0.005363 | −0.7262 | 0.467716 |
| 0.084907 | 0.011269 | 7.53476 | 0.000000 | |
| −0.071821 | 0.008246 | −8.71019 | 0.000000 | |
| 0.99185 | 0.000121 | 8179.6979 | 0.000000 | |
| 7.837777 | 0.978102 | 8.01325 | 0.000000 | |
| DJI | ||||
| κ0 | −0.030929 | 0.006493 | −4.76373 | 0.000000 |
| κ1 | 0.050832 | 0.012374 | 4.10803 | 0.000000 |
| κ2 | 0.097387 | 0.031871 | 3.05563 | 0.002246 |
| κ3 | 0.002901 | 0.012496 | 0.23217 | 0.816403 |
| 0.179255 | 0.020052 | 8.93939 | 0.000000 | |
| −0.197582 | 0.016424 | −12.02981 | 0.000000 | |
| 0.960464 | 0.005576 | 172.23549 | 0.000000 | |
| 6.032809 | 0.658381 | 9.1631 | 0.000000 |
Source: Author’s calculation. Note 1: Here WTI and DJI represent the West Texas Intermediate crude oil and Dow Jones Industrial Index, respectively. Here K0, K1, K2, and K3 indicate the constant term variance occurred due to GFC, COVID-19, and trade war between China and the US, respectively. Moreover, , , and indicate the ARCH effect, news effect (gamma), GARCH effect, and degree of freedom, respectively. It can be seen that COVID-19 has increased the variance of both markets than GFC. Hence, the study hypothesis of COVID-19 has boosted the variance of these markets more than GFC is true.
Table 5.
Summary statistics of Value at Risk (VaR) model.
| Panel A | Student’sDist. | Normal Dist. | ||||
|---|---|---|---|---|---|---|
| WTI | ||||||
| Confidence level | maximum | Minimum | Average | maximum | Minium | Average |
| 99% | −34.81096 | −2.061463 | −5.837464 | −31.06984 | −1.839918 | −5.210114 |
| DJI | ||||||
| Confidence level | maximum | Minimum | Average | maximum | Minimum | Average |
| 99% | −21.96734 | −0.673005 | −2.665718 | −19.60652 | −0.6006781 | −2.379234 |
Source: Author’s calculation. Note 1: Here WTI and DJI represent the West Texas Intermediate crude oil and Dow Jones Industrial Index, respectively. It can be seen that the downside risk of oil markets has been increased than DJI. Hence, these findings clear that COVID-19 has affected the oil markets more than DJI.
Table 6.
Back-testing of Value at Risk model.
| WTI | Student’s Distribution | |||
|---|---|---|---|---|
| Confidence level | Expected Exceed | Actual Exceed | Lruc | LRcc |
| 99% | 34 | 44 | 2.537914 | 2.819471 |
| Normal distribution | ||||
| 99% | 34 | 61 | 17.03359 ** | 17.04064 ** |
| DJI | Student’s Distribution | |||
| Confidence level | Expected Exceed | Actual Exceed | LRuc | LRcc |
| 99% | 34 | 39 | 0.8630743 | 1.36595 |
| Normal distribution | ||||
| Confidence level | Expected Exceed | Actual Exceed | LRuc | LRcc |
| 99% | 34 | 64 | 22.1221 ** | 22.16697 ** |
Note 1: ** denotes 5% level of significance: Source: Author’s calculation. Note 2: Here, WTI and DJI represent the West Texas Intermediate crude oil and Dow Jones Industrial Index, respectively.
Table 7.
Diagnostic parameters.
| Serial Correlation | STD. Residuals | Sq. STD. Residuals | ||
|---|---|---|---|---|
| Variables | F-statistics | p-value | F-statistics | p-value |
| WTI | 1.569 | 0.2104 | 2.102 | 0.5945 |
| DJI | 1.062 | 0.3028 | 2.895 | 0.7762 |
| Heteroskedasticity | ||||
| Variables | F-statistics | p-value | ||
| WTI | 0.1621 | 0.6872 | ||
| DJI | 0.1917 | 0.6615 | ||
Source: Author’s calculation. Note 1: Here, WTI and DJI represent the West Texas Intermediate crude oil and Dow Jones Industrial Index, respectively. Moreover, STD. Residuals and Sq. STD. Residuals represent the standardized residuals and theirsquare, respectively.
Publisher’s Note: MDPI stays neutral with regard to jurisdictional claims in published maps and institutional affiliations. |
© 2021 by the authors. Licensee MDPI, Basel, Switzerland. This article is an open access article distributed under the terms and conditions of the Creative Commons Attribution (CC BY) license (https://creativecommons.org/licenses/by/4.0/).
Share and Cite
MDPI and ACS Style
Shehzad, K.; Zaman, U.; Liu, X.; Górecki, J.; Pugnetti, C. Examining the Asymmetric Impact of COVID-19 Pandemic and Global Financial Crisis on Dow Jones and Oil Price Shock. Sustainability 2021, 13, 4688. https://doi.org/10.3390/su13094688
AMA Style
Shehzad K, Zaman U, Liu X, Górecki J, Pugnetti C. Examining the Asymmetric Impact of COVID-19 Pandemic and Global Financial Crisis on Dow Jones and Oil Price Shock. Sustainability. 2021; 13(9):4688. https://doi.org/10.3390/su13094688
Chicago/Turabian StyleShehzad, Khurram, Umer Zaman, Xiaoxing Liu, Jarosław Górecki, and Carlo Pugnetti. 2021. "Examining the Asymmetric Impact of COVID-19 Pandemic and Global Financial Crisis on Dow Jones and Oil Price Shock" Sustainability 13, no. 9: 4688. https://doi.org/10.3390/su13094688
Note that from the first issue of 2016, this journal uses article numbers instead of page numbers. See further details here.