
A Methodological Workflow for Deriving the Association of Tourist Destinations Based on Online Travel Reviews: A Case Study of Yunnan Province, China


Abstract
:1. Introduction
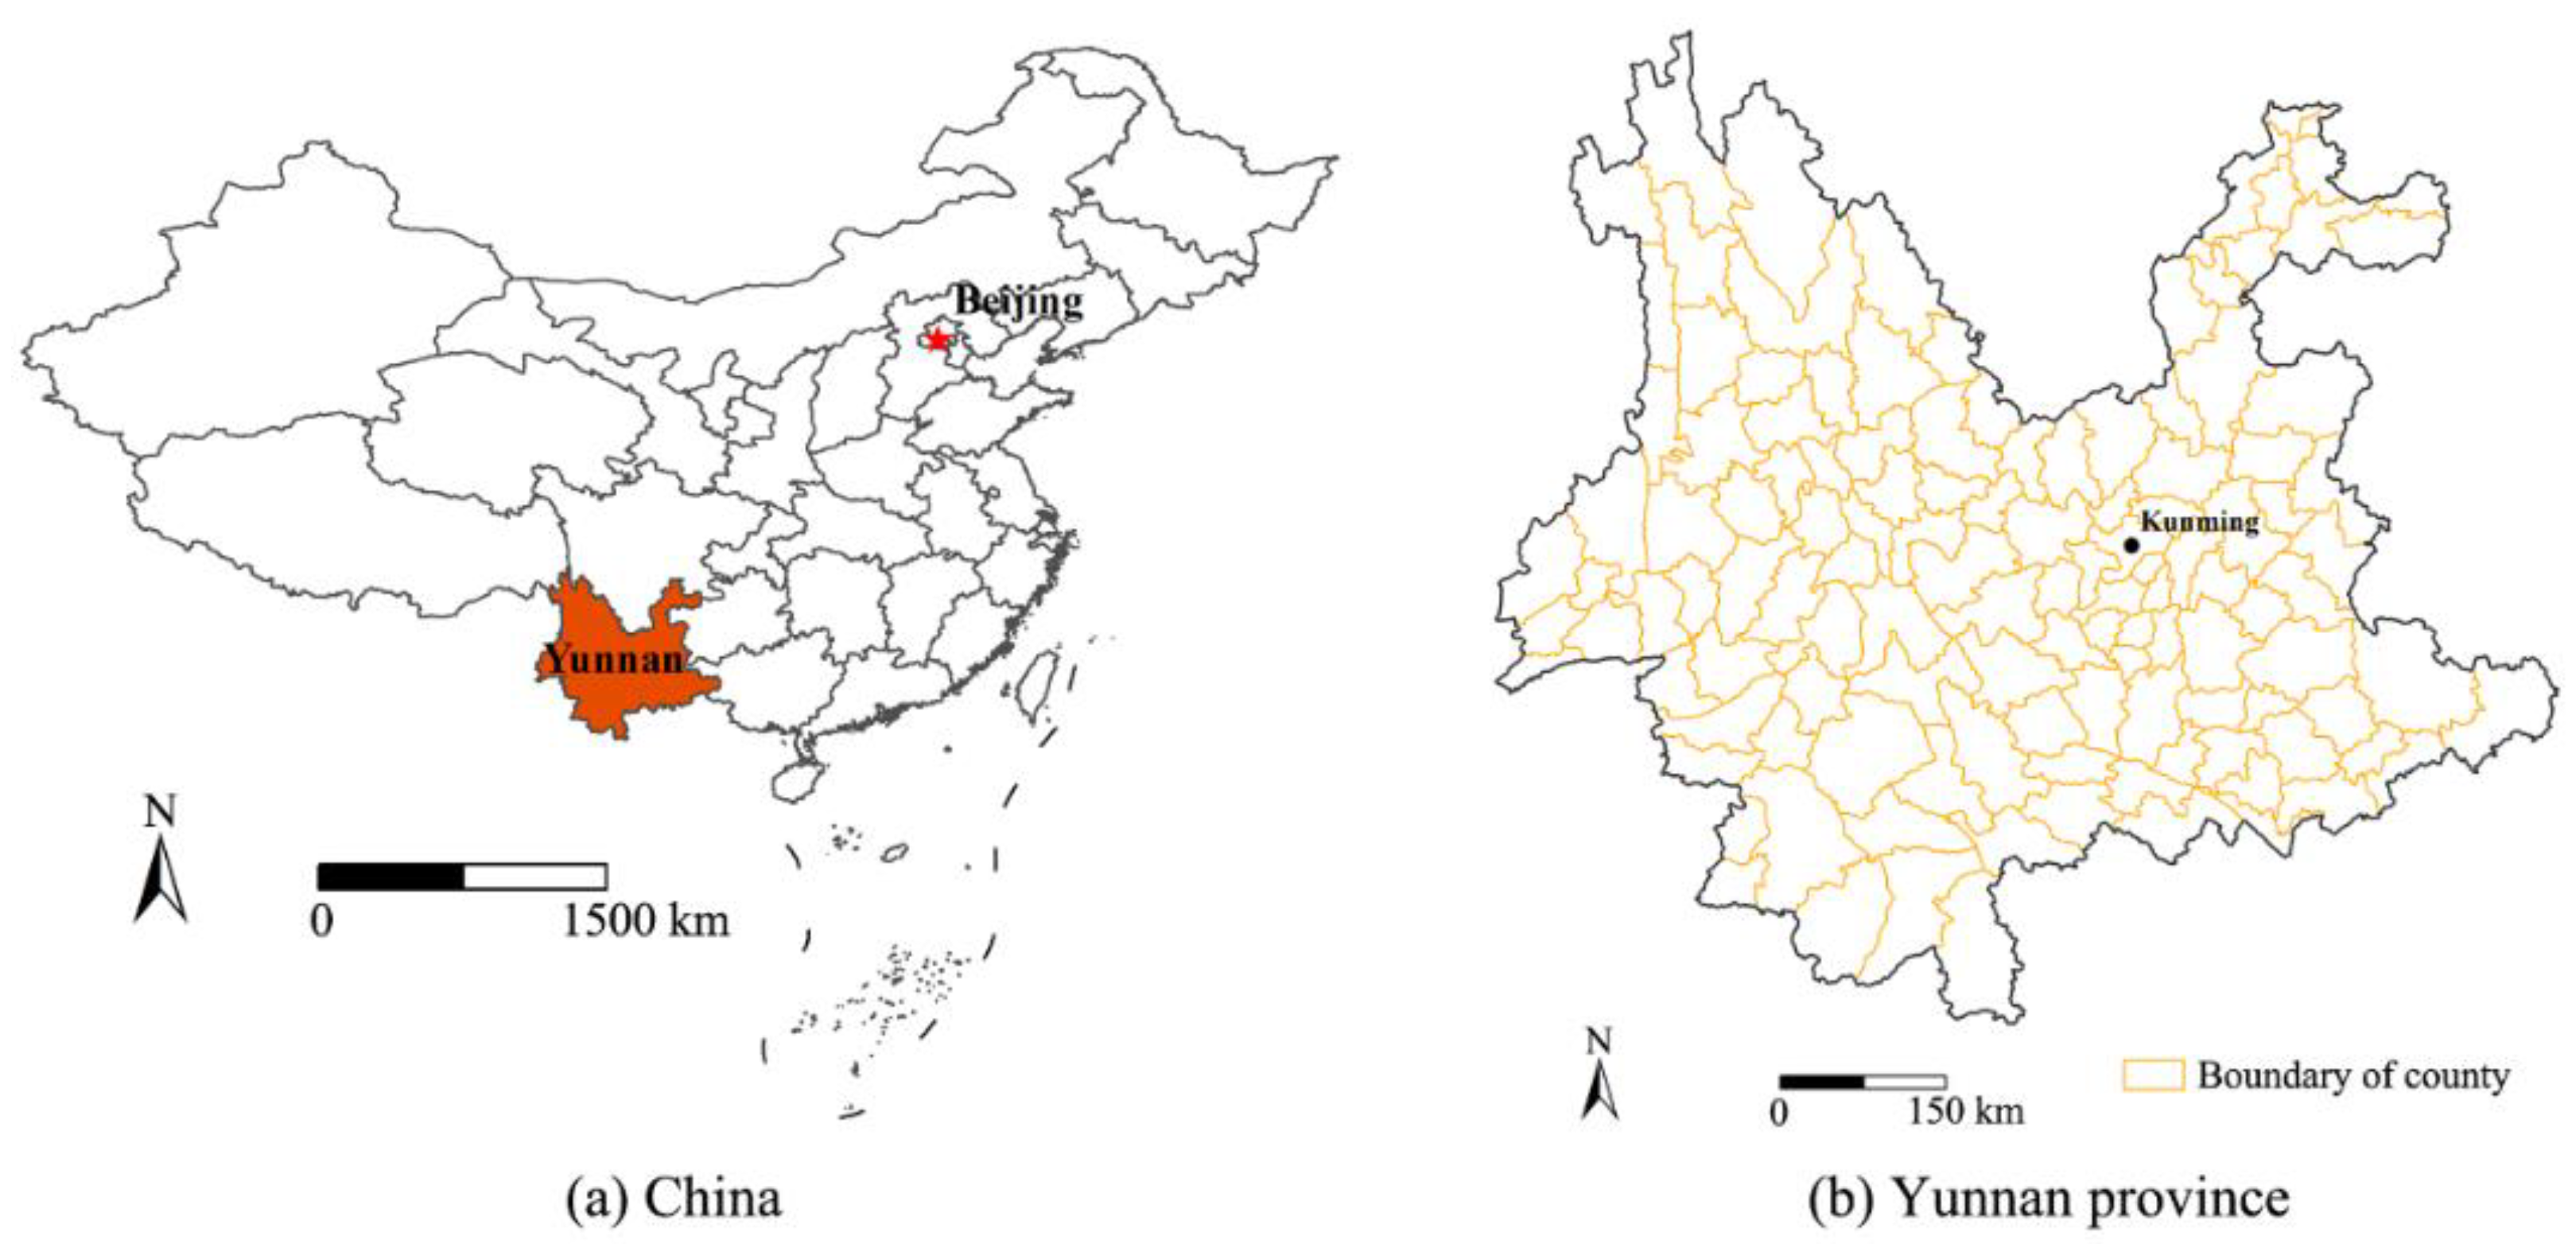
2. Study Area
3. Methodology
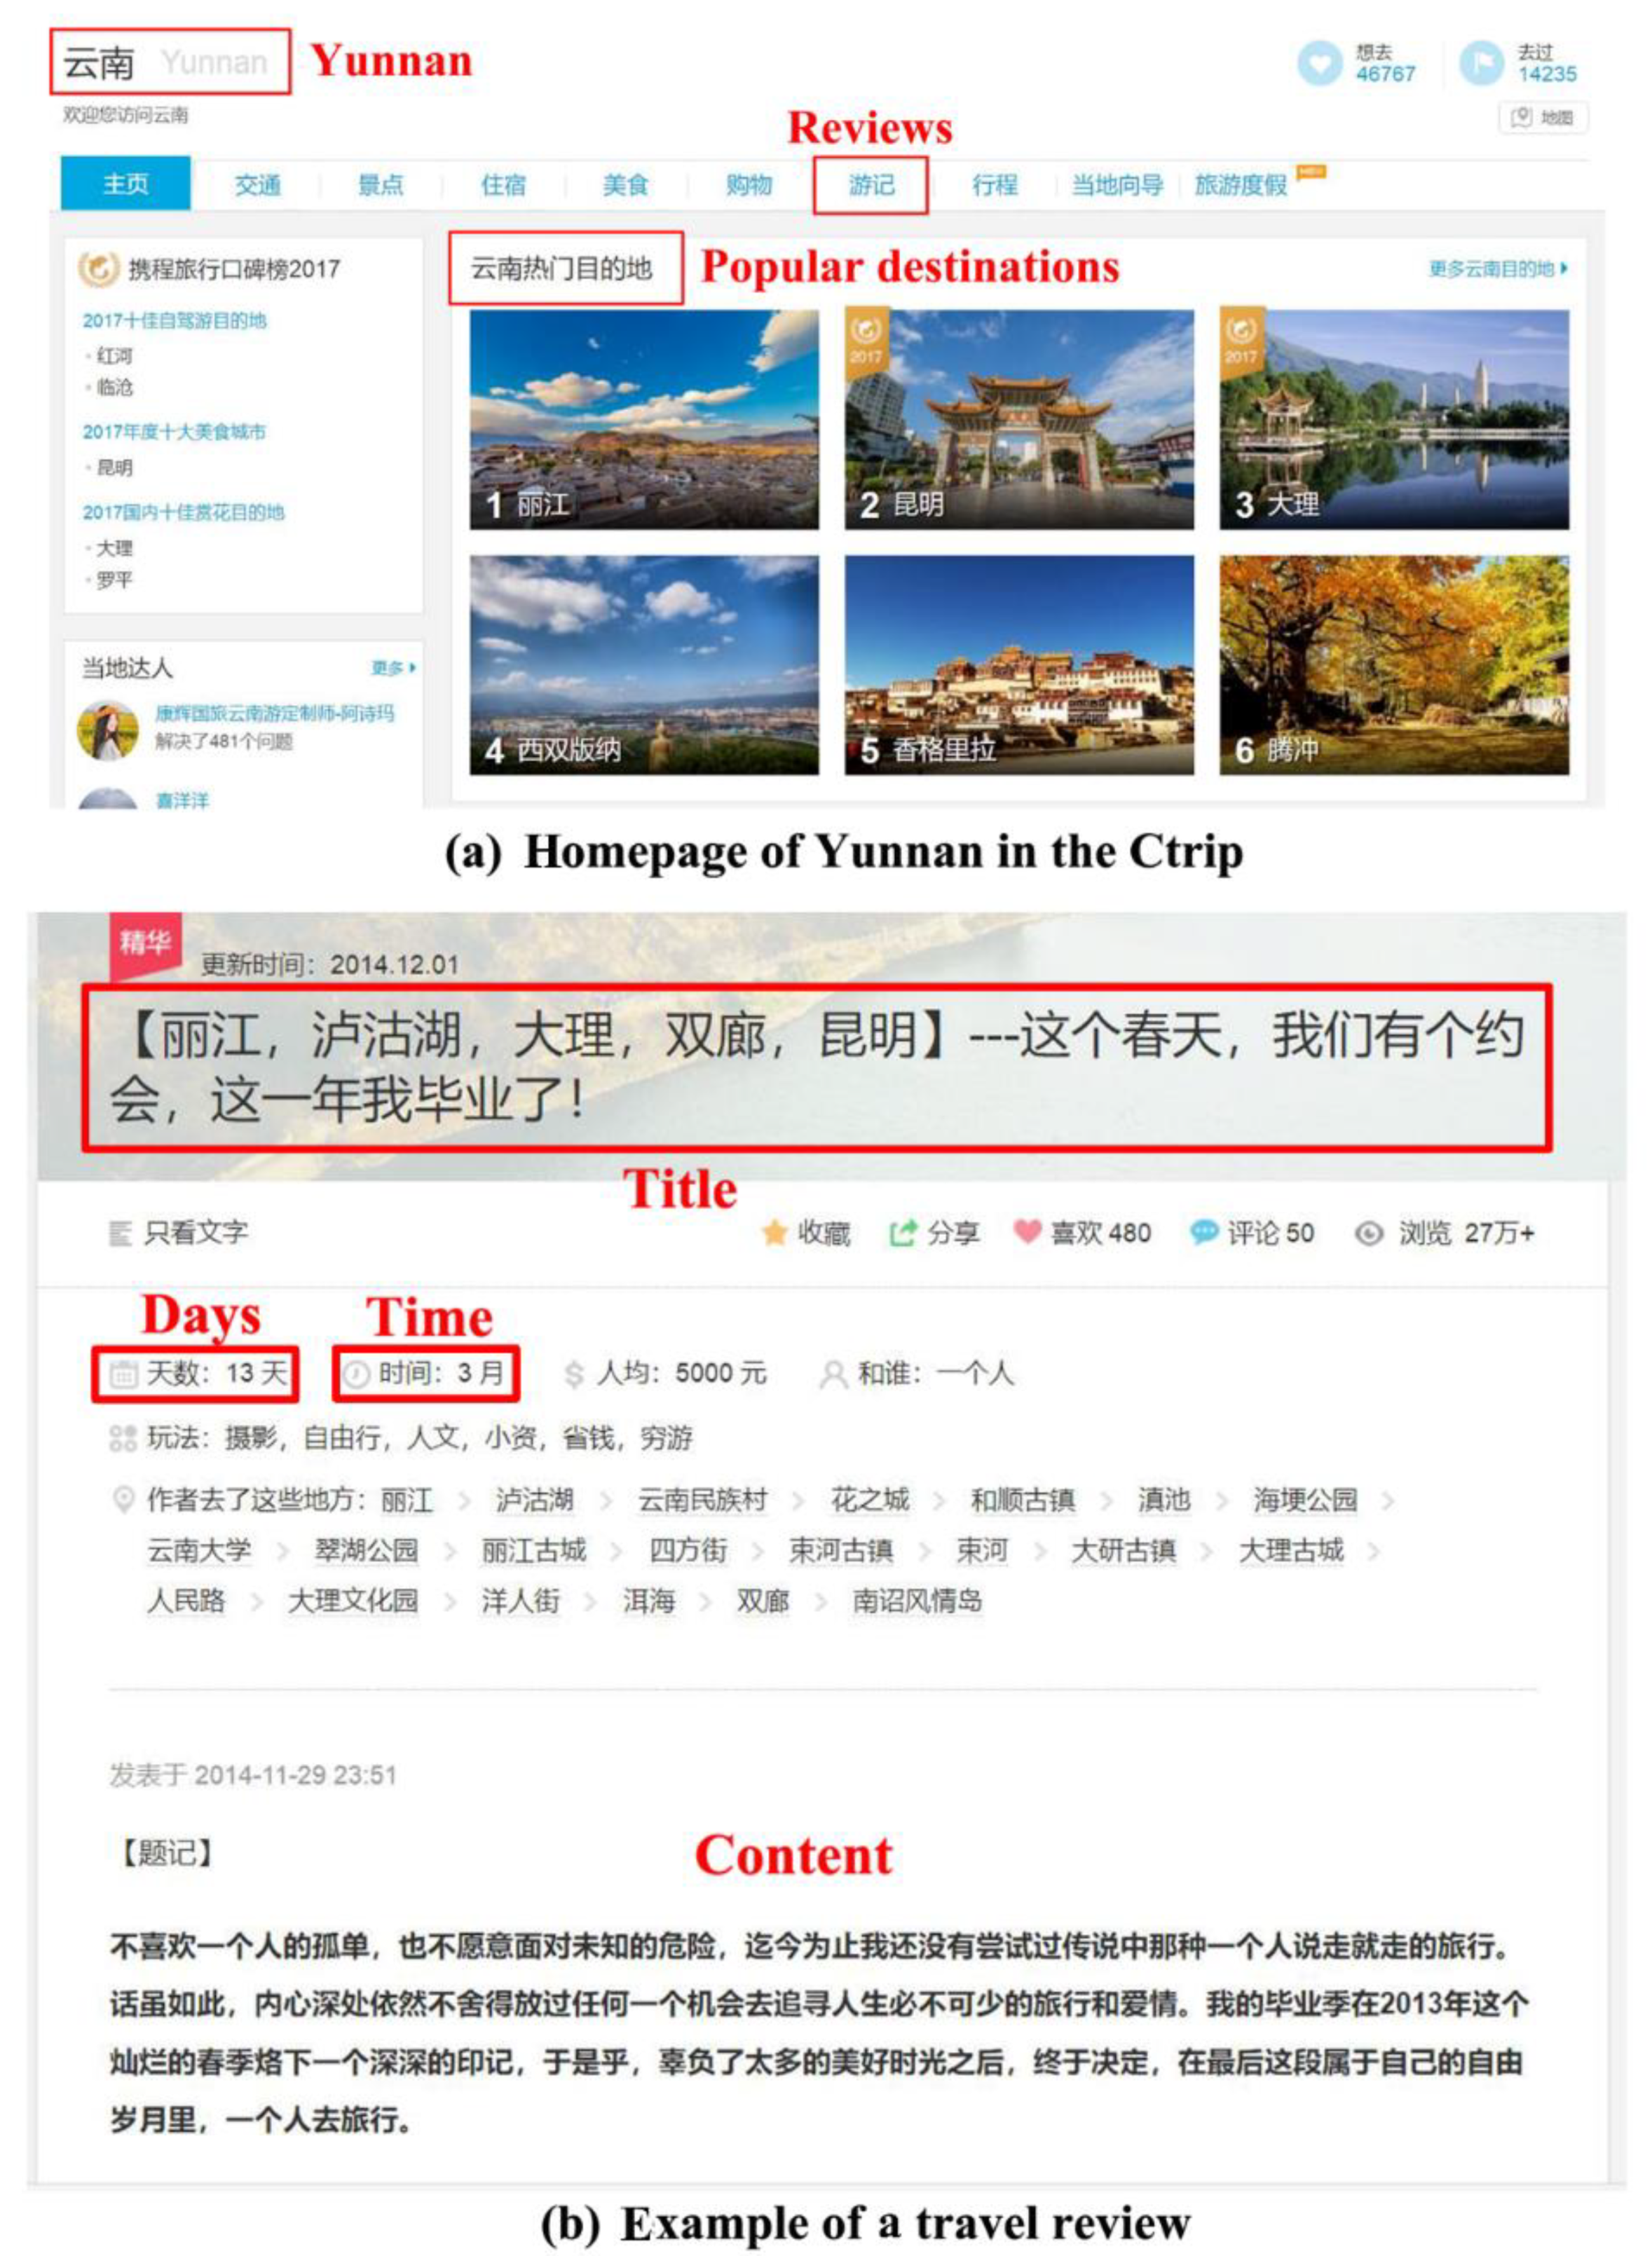
3.1. Data Collection
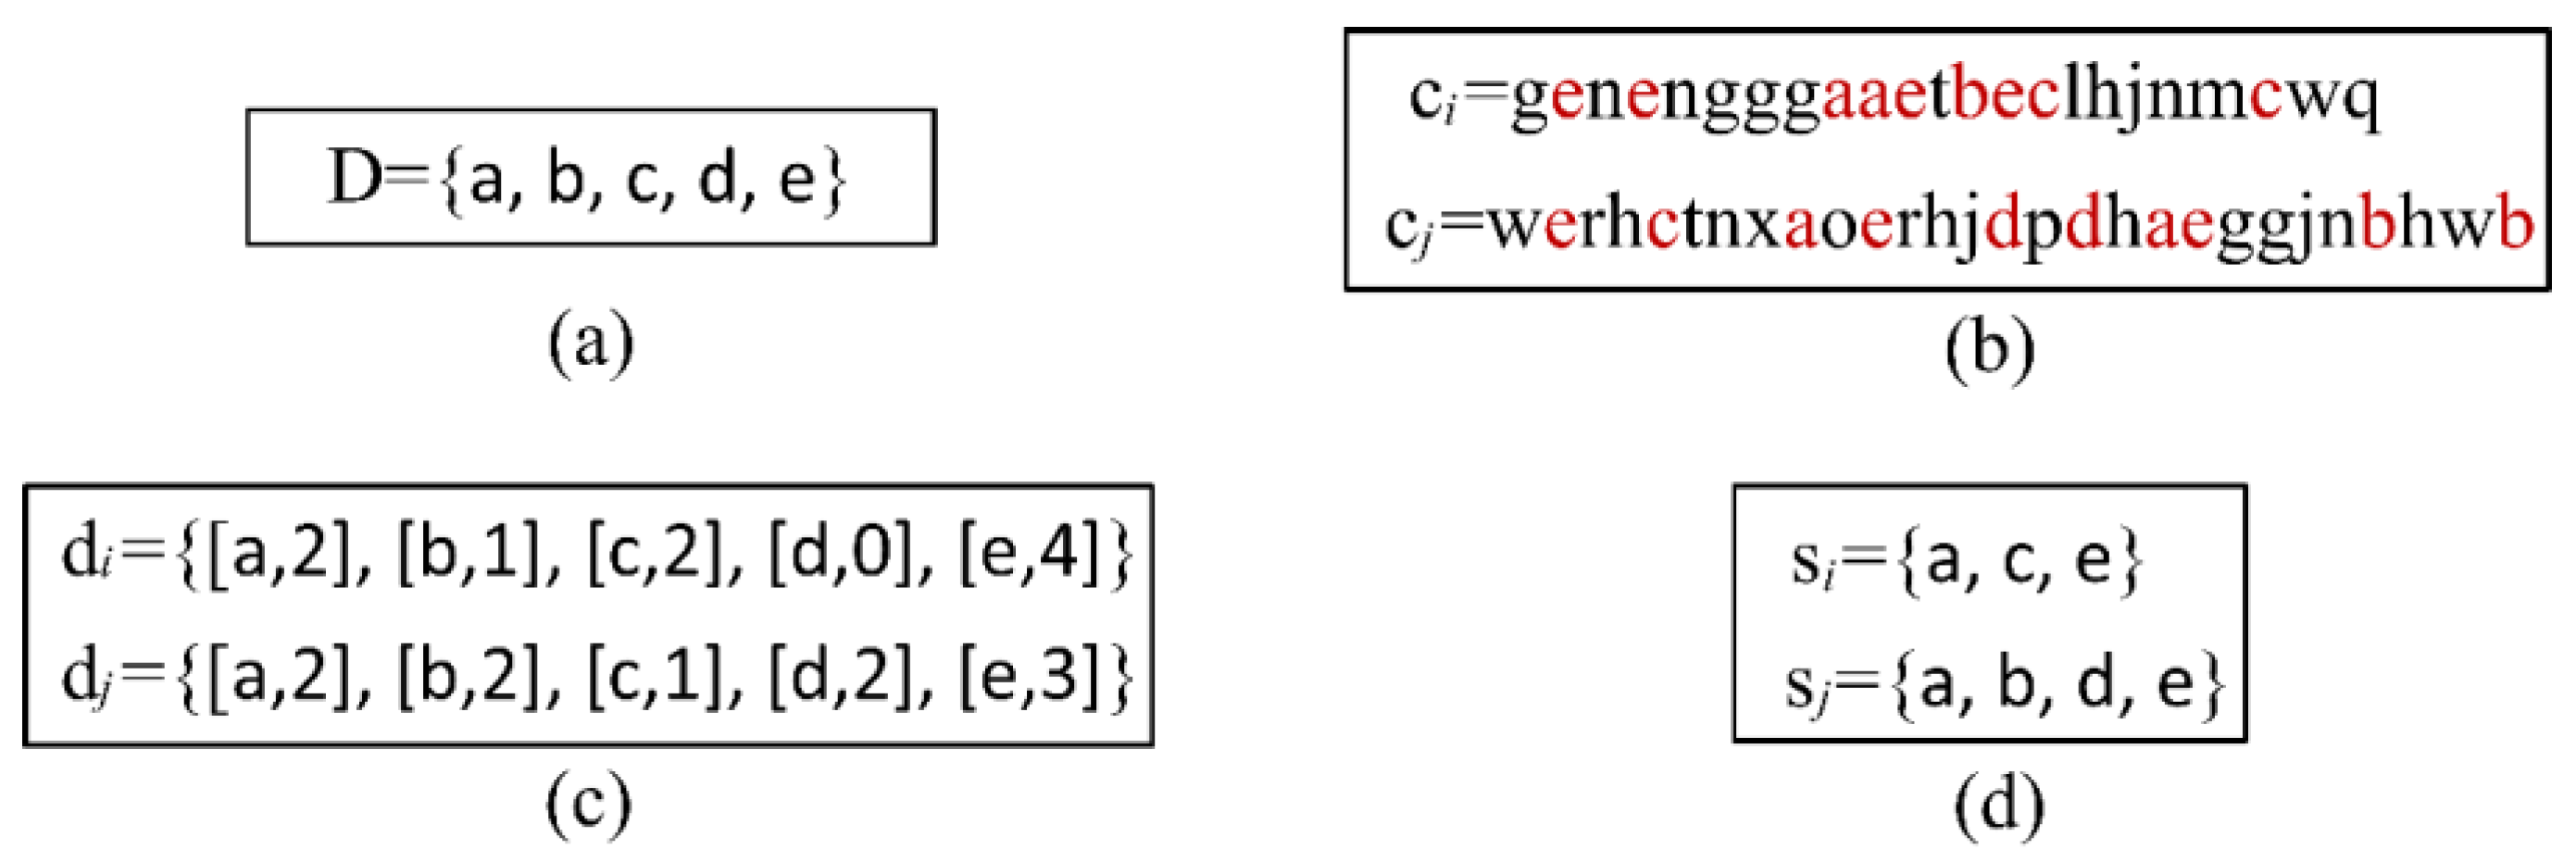
3.2. Extracting the Destination Sequences from Online Travel Reviews
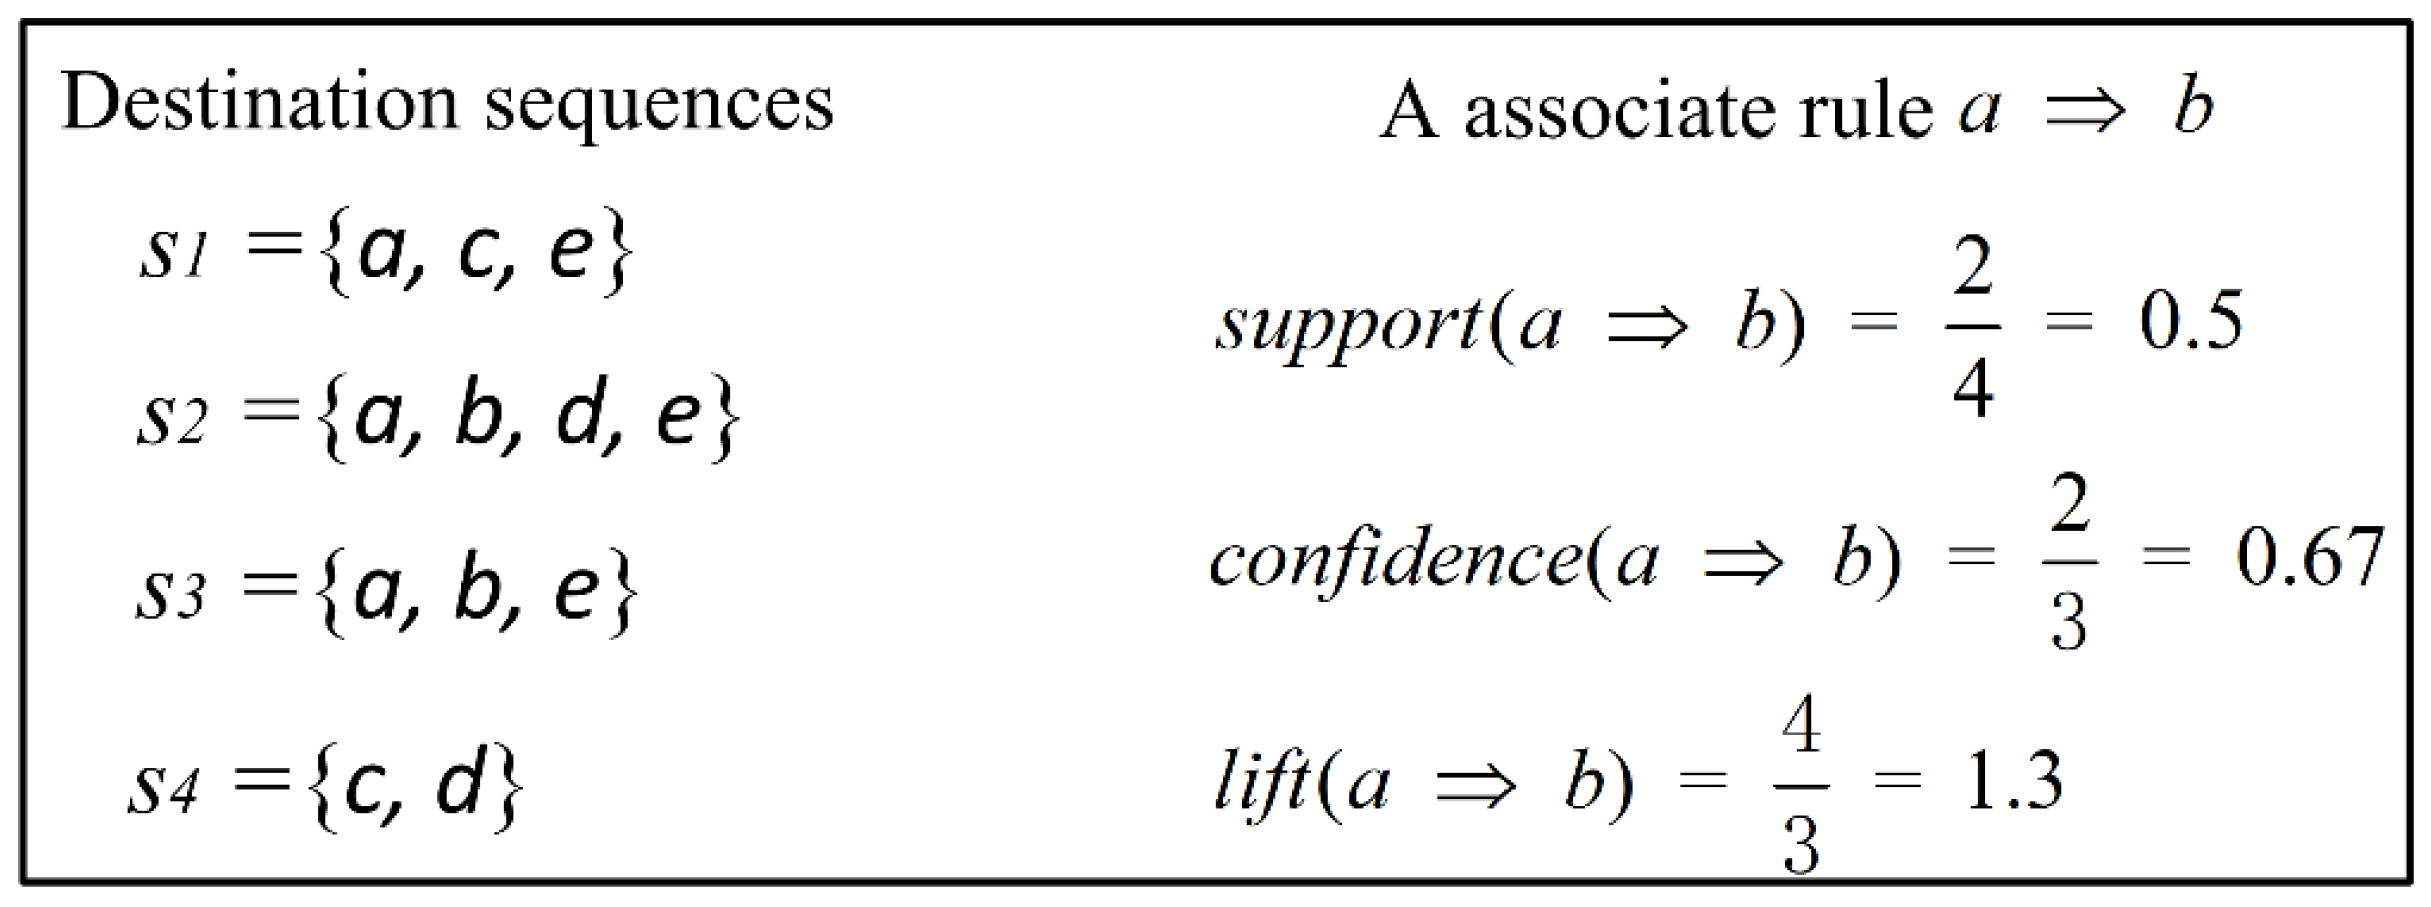
3.3. Mining Association Rules of Tourist Destinations
4. Results Analysis
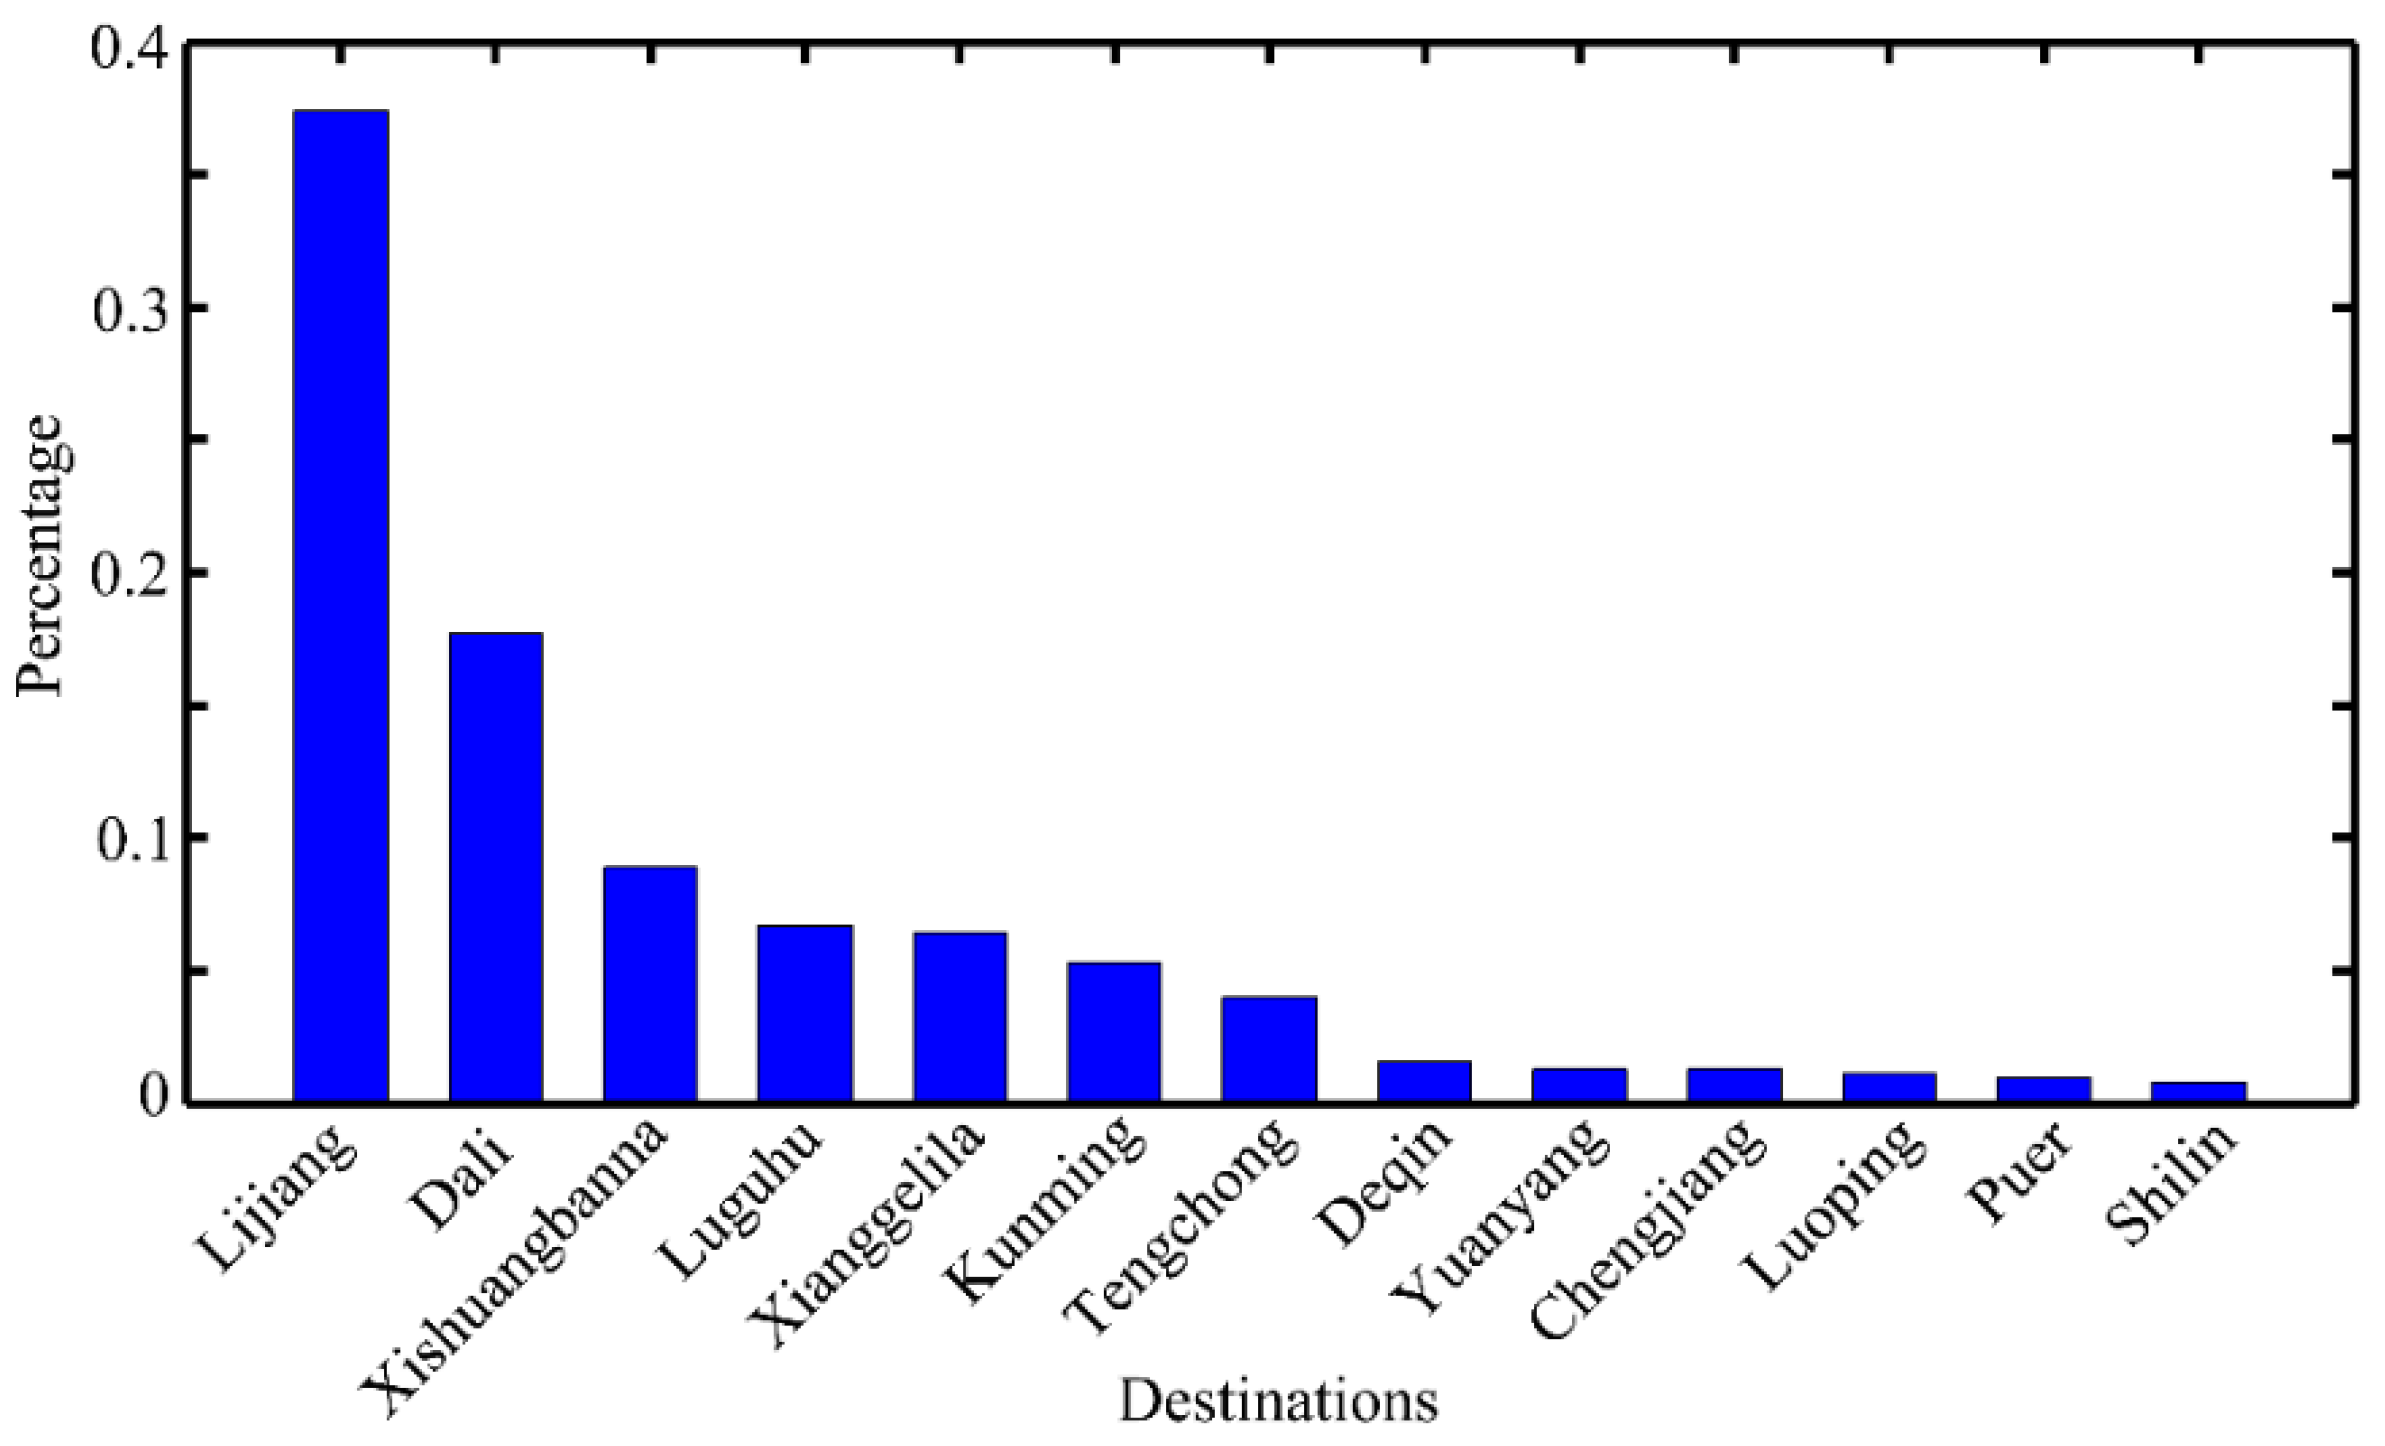
4.1. General Statistical Analysis
4.2. Association Rules among Tourist Destinations
5. Discussion
6. Conclusions
Author Contributions
Funding
Institutional Review Board Statement
Informed Consent Statement
Conflicts of Interest
References
- Shi, B.; Zhao, J.; Chen, P.-J. Exploring urban tourism crowding in Shanghai via crowdsourcing geospatial data. Curr. Issues Tour. 2017, 20, 1186–1209. [Google Scholar] [CrossRef]
- Shoval, N.; Isaacson, M. Tracking tourists in the digital age. Ann. Tour. Res. 2007, 34, 141–159. [Google Scholar] [CrossRef]
- Xiang, Z.; Gretzel, U. Role of social media in online travel information search. Tour. Manag. 2010, 31, 179–188. [Google Scholar] [CrossRef]
- Li, J.; Xu, L.; Tang, L.; Wang, S.; Li, L. Big data in tourism research: A literature review. Tour. Manag. 2018, 68, 301–323. [Google Scholar] [CrossRef]
- Zhang, J. Big data and tourism geographies—an emerging paradigm for future study? Tour. Geogr. 2018, 20, 899–904. [Google Scholar] [CrossRef] [Green Version]
- Lu, W.; Stepchenkova, S. User-Generated Content as a Research Mode in Tourism and Hospitality Applications: Topics, Methods, and Software. J. Hosp. Mark. Manag. 2015, 24, 119–154. [Google Scholar] [CrossRef]
- Brandt, T.; Bendler, J.; Neumann, D. Social media analytics and value creation in urban smart tourism ecosystems. Inf. Manag. 2017, 54, 703–713. [Google Scholar] [CrossRef]
- Shoval, N.; Ahas, R. The use of tracking technologies in tourism research: The first decade. Tour. Geogr. 2016, 18, 587–606. [Google Scholar] [CrossRef]
- Salas-Olmedo, M.H.; Moya-Gómez, B.; García-Palomares, J.C.; Gutiérrez, J. Tourists’ digital footprint in cities: Comparing Big Data sources. Tour. Manag. 2018, 66, 13–25. [Google Scholar] [CrossRef] [Green Version]
- Zhou, X.; Xu, C.; Kimmons, B. Detecting tourism destinations using scalable geospatial analysis based on cloud computing platform. Comput. Environ. Urban Syst. 2015, 54, 144–153. [Google Scholar] [CrossRef]
- Shao, H.; Zhang, Y.; Li, W. Extraction and analysis of city’s tourism districts based on social media data. Comput. Environ. Urban Syst. 2017, 65, 66–78. [Google Scholar] [CrossRef]
- Giglio, S.; Bertacchini, F.; Bilotta, E.; Pantano, P. Using social media to identify tourism attractiveness in six Italian cities. Tour. Manag. 2019, 72, 306–312. [Google Scholar] [CrossRef]
- Vu, H.Q.; Li, G.; Law, R.; Ye, B.H. Exploring the travel behaviors of inbound tourists to Hong Kong using geotagged photos. Tour. Manag. 2015, 46, 222–232. [Google Scholar] [CrossRef]
- Chua, A.; Servillo, L.; Marcheggiani, E.; Moere, A.V. Mapping Cilento: Using geotagged social media data to characterize tourist flows in southern Italy. Tour. Manag. 2016, 57, 295–310. [Google Scholar] [CrossRef]
- Raun, J.; Ahas, R.; Tiru, M. Measuring tourism destinations using mobile tracking data. Tour. Manag. 2016, 57, 202–212. [Google Scholar] [CrossRef]
- Girardin, F.; Calabrese, F.; Fiore, F.D.; Ratti, C.; Blat, J. Digital Footprinting: Uncovering Tourists with User-Generated Content. IEEE Pervasive Comput. 2008, 7, 36–43. [Google Scholar] [CrossRef] [Green Version]
- Kádár, B. Measuring tourist activities in cities using geotagged photography. Tour. Geogr. 2014, 16, 88–104. [Google Scholar] [CrossRef]
- Cheng, M.; Edwards, D. Social media in tourism: A visual analytic approach. Curr. Issues Tour. 2015, 18, 1080–1087. [Google Scholar] [CrossRef]
- Batista e Silva, F.; Marín Herrera, M.A.; Rosina, K.; Ribeiro Barranco, R.; Freire, S.; Schiavina, M. Analysing spatiotemporal patterns of tourism in Europe at high-resolution with conventional and big data sources. Tour. Manag. 2018, 68, 101–115. [Google Scholar] [CrossRef]
- Santos, F.; Almeida, A.; Martins, C.; Gonçalves, R.; Martins, J. Using POI functionality and accessibility levels for delivering personalized tourism recommendations. Comput. Environ. Urban Syst. 2019, 77, 101173. [Google Scholar] [CrossRef]
- Sun, X.; Huang, Z.; Peng, X.; Chen, Y.; Liu, Y. Building a model-based personalised recommendation approach for tourist attractions from geotagged social media data. Int. J. Digit. Earth 2019, 12, 661–678. [Google Scholar] [CrossRef]
- Wan, L.; Hong, Y.; Huang, Z.; Peng, X.; Li, R. A hybrid ensemble learning method for tourist route recommendations based on geo-tagged social networks. Int. J. Geogr. Inf. Sci. 2018, 32, 2225–2246. [Google Scholar] [CrossRef]
- Zeng, B.; Gerritsen, R. What do we know about social media in tourism? A review. Tour. Manag. Perspect. 2014, 10, 27–36. [Google Scholar] [CrossRef]
- Stepchenkova, S.; Morrison, A.M. The destination image of Russia: From the online induced perspective. Tour. Manag. 2006, 27, 943–956. [Google Scholar] [CrossRef]
- Költringer, C.; Dickinger, A. Analyzing destination branding and image from online sources: A web content mining approach. J. Bus. Res. 2015, 68, 1836–1843. [Google Scholar] [CrossRef]
- Marine-Roig, E. Measuring Destination Image through Travel Reviews in Search Engines. Sustainability 2017, 9, 1425. [Google Scholar] [CrossRef] [Green Version]
- Toral, S.L.; Martínez-Torres, M.R.; Gonzalez-Rodriguez, M.R. Identification of the Unique Attributes of Tourist Destinations from Online Reviews. J. Travel Res. 2017, 57, 908–919. [Google Scholar] [CrossRef]
- McCreary, A.; Seekamp, E.; Davenport, M.; Smith, J.W. Exploring qualitative applications of social media data for place-based assessments in destination planning. Curr. Issues Tour. 2020, 23, 82–98. [Google Scholar] [CrossRef]
- McKenzie, G.; Adams, B. A data-driven approach to exploring similarities of tourist attractions through online reviews. J. Locat. Based Serv. 2018, 12, 94–118. [Google Scholar] [CrossRef]
- Yang, Y. Understanding tourist attraction cooperation: An application of network analysis to the case of Shanghai, China. J. Destin. Mark. Manag. 2018, 8, 396–411. [Google Scholar] [CrossRef]
- Jin, C.; Cheng, J.; Xu, J. Using User-Generated Content to Explore the Temporal Heterogeneity in Tourist Mobility. J. Travel Res. 2018, 57, 779–791. [Google Scholar] [CrossRef]
- Ye, Q.; Zhang, Z.; Law, R. Sentiment classification of online reviews to travel destinations by supervised machine learning approaches. Expert Syst. Appl. 2009, 36, 6527–6535. [Google Scholar] [CrossRef]
- Valdivia, A.; Luzón, M.V.; Herrera, F. Sentiment Analysis in TripAdvisor. IEEE Intell. Syst. 2017, 32, 72–77. [Google Scholar] [CrossRef]
- Duan, W.; Cao, Q.; Yu, Y.; Levy, S. Mining Online User-Generated Content: Using Sentiment Analysis Technique to Study Hotel Service Quality. In Proceedings of the 2013 46th Hawaii International Conference on System Sciences, Wailea, HI, USA, 7–10 January 2013; pp. 3119–3128. [Google Scholar]
- Sparks, B.A.; Perkins, H.E.; Buckley, R. Online travel reviews as persuasive communication: The effects of content type, source, and certification logos on consumer behavior. Tour. Manag. 2013, 39, 1–9. [Google Scholar] [CrossRef] [Green Version]
- Fuchs, M.; Höpken, W.; Lexhagen, M. Big data analytics for knowledge generation in tourism destinations—A case from Sweden. J. Destin. Mark. Manag. 2014, 3, 198–209. [Google Scholar] [CrossRef]
- Park, E.; Kang, J.; Choi, D.; Han, J. Understanding customers’ hotel revisiting behaviour: A sentiment analysis of online feedback reviews. Curr. Issues Tour. 2020, 23, 605–611. [Google Scholar] [CrossRef]
- Hu, N.; Zhang, T.; Gao, B.; Bose, I. What do hotel customers complain about? Text analysis using structural topic model. Tour. Manag. 2019, 72, 417–426. [Google Scholar] [CrossRef]
- Wu, L.; Zhang, J.; Fujiwara, A. A tourist’s multi-destination choice model with future dependency. Asia Pac. J. Tour. Res. 2012, 17, 121–132. [Google Scholar] [CrossRef]
- Yang, Y.; Fik, T.; Zhang, J. Modeling sequential tourist flows: Where is the next destination? Ann. Tour. Res. 2013, 43, 297–320. [Google Scholar] [CrossRef]
- Rong, J.; Vu, H.Q.; Law, R.; Li, G. A behavioral analysis of web sharers and browsers in Hong Kong using targeted association rule mining. Tour. Manag. 2012, 33, 731–740. [Google Scholar] [CrossRef]
- Vu, H.Q.; Li, G.; Law, R.; Zhang, Y. Travel Diaries Analysis by Sequential Rule Mining. J. Travel Res. 2017, 57, 399–413. [Google Scholar] [CrossRef]
- Saura, J.R. Using data sciences in digital marketing: Framework, methods and performance metrics. J. Innov. Knowl. 2021, 6, 92–102. [Google Scholar] [CrossRef]
- Li, G.; Law, R.; Rong, J.; Vu, H. Incorporating Both Positive and Negative Association Rules into the Analysis of Outbound Tourism in Hong Kong. J. Travel Tour. Mark. 2010, 27, 812–828. [Google Scholar] [CrossRef]
- Lee, L.; Cai, G.; Lee, K. Mining points of interest association rules from Geo-tagged photos. In Proceedings of the 2013 46th Hawaii International Conference on System Sciences, Wailea, HI, USA, 7–10 January 2013; pp. 1580–1588. [Google Scholar]
- Versichele, M.; Groote, L.; Bouuaert, M.C.; Neutens, I.M.; Weghe, N.V. Pattern mining in tourist attraction visits through association rule learning on Bluetooth tracking data: A case study of Ghent, Belgium. Tour. Manag. 2014, 44, 67–81. [Google Scholar] [CrossRef] [Green Version]
- Qi, S.; Wong, C.U.I. An Application of Apriori Algorithm Association Rules Mining to Profiling the Heritage Visitors of Macau. In Information and Communication Technologies in Tourism 2015; Tussyadiah, I., Inversini, A., Eds.; Springer: Cham, Switzerland, 2015; pp. 139–151. [Google Scholar] [CrossRef]
- Gandhi, M. An enhanced approach for tourism recommendation system using hybrid filtering and association rule mining. Natl. J. Syst. Inf. Technol. 2015, 8, 1–8. [Google Scholar]
- Saura, J.R.; Ribeiro-Soriano, D.; Palacios-Marqués, D. From user-generated data to data-driven innovation: A research agenda to understand user privacy in digital markets. Int. J. Inf. Manag. 2021, 102331. [Google Scholar] [CrossRef]
- Sun, Y.; Shi, C.Y.; Tang, W.W.; Liu, J. Research on the spatial network characteristics of travel itinerary in Yunnan province. Hum. Geogr. 2016, 1, 147–153. (In Chinese) [Google Scholar]
- Tang, L.; Wei, J.; Zhao, M. Features of Regional Travel Itineraries Complex Networks: Taking Fujian Province as an Example. Tour. Trib. 2014, 29, 57–66. (In Chinese) [Google Scholar]


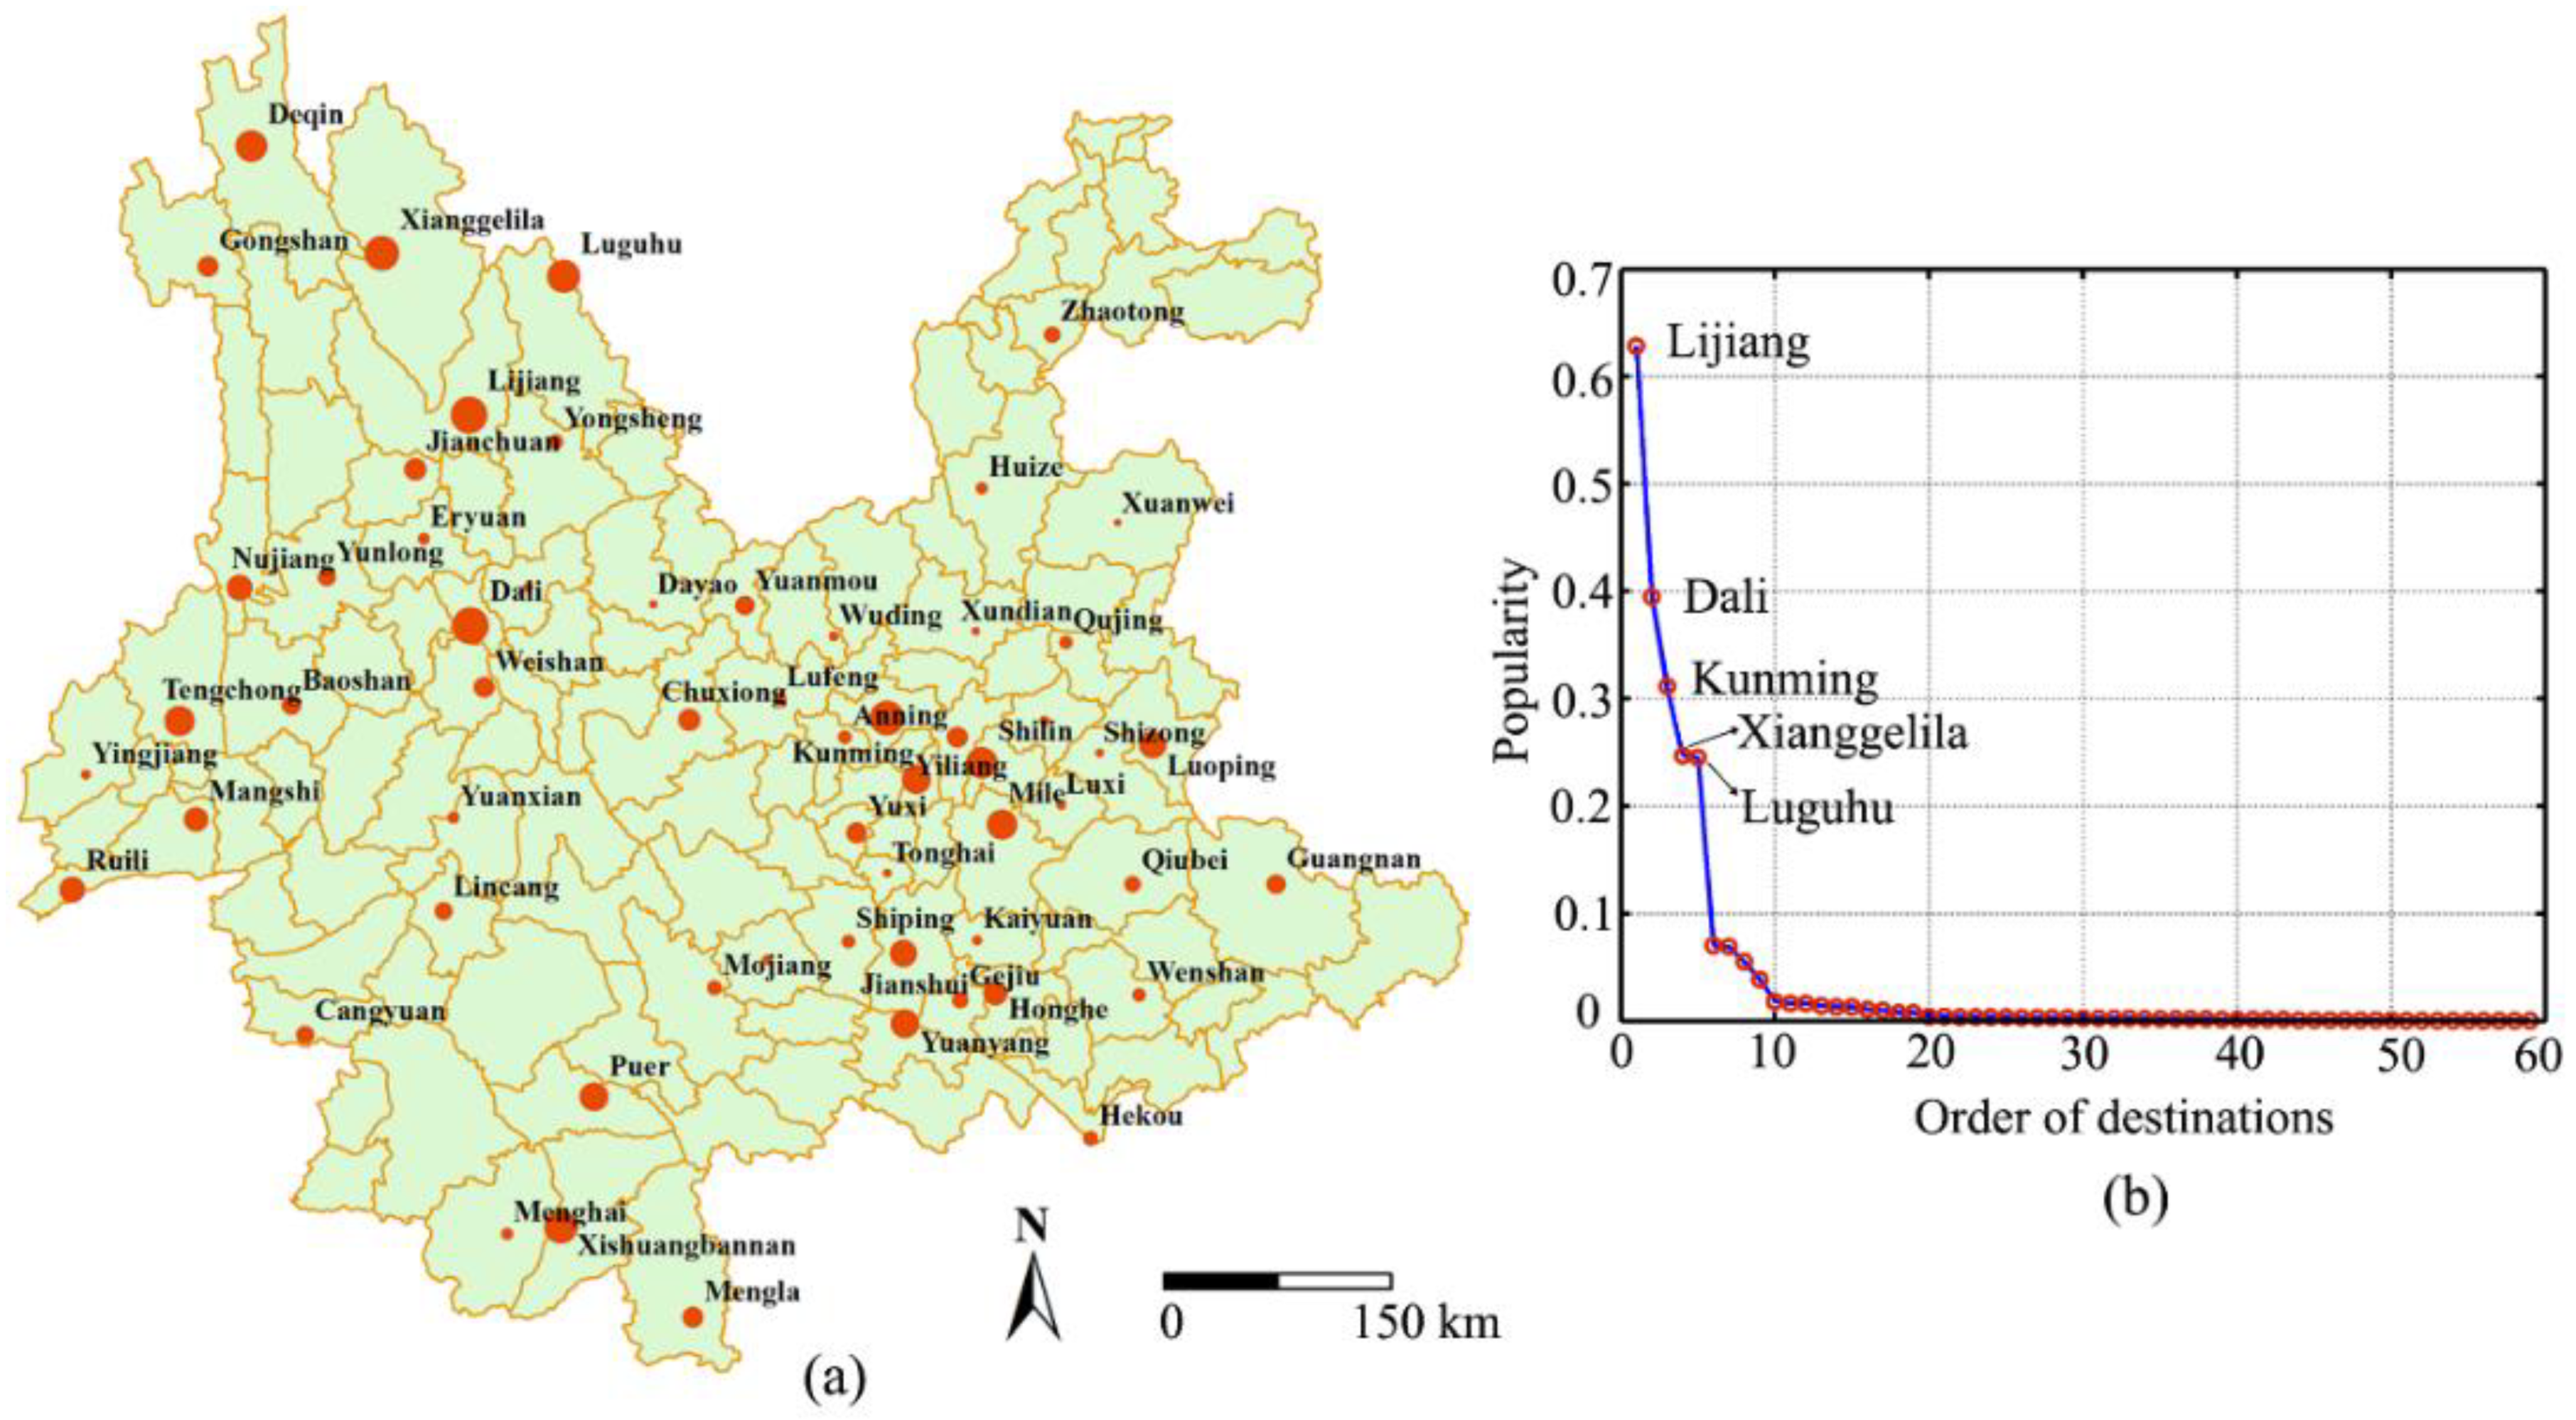
| Order | Name | p | Order | Name | p | Order | Name | p |
|---|---|---|---|---|---|---|---|---|
| 1 | Lijiang | 0.628 | 6 | Xishuangbanna | 0.07 | 11 | Yuanyang | 0.017 |
| 2 | Dali | 0.395 | 7 | Deqin | 0.069 | 12 | Puer | 0.016 |
| 3 | Kunming | 0.311 | 8 | Shilin | 0.055 | 13 | Chengjiang | 0.014 |
| 4 | Xianggelila | 0.247 | 9 | Tengchong | 0.039 | 14 | Jianshui | 0.013 |
| 5 | Luguhu | 0.245 | 10 | Mile | 0.018 | 15 | Luoping | 0.012 |
| Rule ID | Association Rules | Support | Confidence |
|---|---|---|---|
| Dali Lijiang | 0.505 | 0.877 | |
| Kunming Lijiang | 0.399 | 0.800 | |
| Luguhu Lijiang | 0.379 | 0.982 | |
| Xianggelila Lijiang | 0.355 | 0.933 | |
| Deqin Lijiang | 0.089 | 0.843 | |
| Kunming Dali | 0.350 | 0.701 | |
| Dali Kunming | 0.350 | 0.615 |
| Rule ID | Association Rules | Support | Confidence |
|---|---|---|---|
| Kunming | 0.302 | 0.605 | |
| Lijiang | 0.302 | 0.863 | |
| Dali | 0.302 | 0.756 | |
| Lijiang | 0.192 | 0.980 | |
| Lijiang | 0.181 | 0.962 | |
| Lijiang | 0.176 | 0.992 | |
| Lijiang | 0.158 | 0.988 | |
| Dali | 0.133 | 0.733 | |
| Dali | 0.129 | 0.704 | |
| Kunming | 0.133 | 0.679 | |
| Kunming | 0.129 | 0.685 | |
| Lijiang | 0.078 | 0.836 | |
| Xianggelila | 0.078 | 0.879 |
| Rule ID | Association Rules | Support | Confidence |
|---|---|---|---|
| Kunming | 0.133 | 0.690 | |
| Kunming | 0.126 | 0.697 | |
| Dali | 0.133 | 0.737 | |
| Dali | 0.126 | 0.715 | |
| Lijiang | 0.133 | 0.996 | |
| Lijiang | 0.126 | 0.979 | |
| Lijiang | 0.092 | 1.000 | |
| Lijiang | 0.085 | 0.994 |
| Rule ID | Association Rules | Support | Confidence |
|---|---|---|---|
| Kunming | 0.064 | 0.752 | |
| Lijiang | 0.064 | 1.000 | |
| Dali | 0.064 | 0.698 |
Publisher’s Note: MDPI stays neutral with regard to jurisdictional claims in published maps and institutional affiliations. |
© 2021 by the authors. Licensee MDPI, Basel, Switzerland. This article is an open access article distributed under the terms and conditions of the Creative Commons Attribution (CC BY) license (https://creativecommons.org/licenses/by/4.0/).
Share and Cite
Liu, T.; Zhang, Y.; Zhang, H.; Yang, X. A Methodological Workflow for Deriving the Association of Tourist Destinations Based on Online Travel Reviews: A Case Study of Yunnan Province, China. Sustainability 2021, 13, 4720. https://doi.org/10.3390/su13094720
Liu T, Zhang Y, Zhang H, Yang X. A Methodological Workflow for Deriving the Association of Tourist Destinations Based on Online Travel Reviews: A Case Study of Yunnan Province, China. Sustainability. 2021; 13(9):4720. https://doi.org/10.3390/su13094720
Chicago/Turabian StyleLiu, Tao, Ying Zhang, Huan Zhang, and Xiping Yang. 2021. "A Methodological Workflow for Deriving the Association of Tourist Destinations Based on Online Travel Reviews: A Case Study of Yunnan Province, China" Sustainability 13, no. 9: 4720. https://doi.org/10.3390/su13094720