
The Effect of Vehicle and Road Conditions on Rollover of Commercial Heavy Vehicles during Cornering: A Simulation Approach


1
Mechanical Engineering Department, Faculty of Engineering, Universiti Malaya, Kuala Lumpur 50603, Malaysia
2
School of Mechanical Engineering, College of Engineering, UiTM Shah Alam, Shah Alam 40450, Malaysia
3
Advanced Computational and Applied Mechanics (ACAM) Research Group, Faculty of Engineering, Universiti Malaya, Kuala Lumpur 50603, Malaysia
*
Authors to whom correspondence should be addressed.
Sustainability 2021, 13(11), 6337; https://doi.org/10.3390/su13116337
Submission received: 30 April 2021
/
Revised: 26 May 2021
/
Accepted: 31 May 2021
/
Published: 3 June 2021
(This article belongs to the Special Issue Sustainable Traffic Operations and Mobility Services)
Abstract
:Heavy vehicles make up a relatively small percentage of traffic volume on Malaysian roads compared to other vehicle types. However, heavy vehicles have been reported to be involved in 30,000–40,000 accidents yearly and caused significantly more fatalities. Rollover accidents may also incur cargo damages and cause environmental or human disasters for vehicles that carry hazardous cargos if these contents are spilled. Thus, in this paper, a comprehensive study was conducted to investigate the effects of vehicle and road conditions on rollover of commercial heavy vehicles during cornering at curved road sections. Vehicle conditions include the heavy vehicle class (based on the axle number and vehicle type), speed and gross vehicle weight, while road conditions include the cornering radius and coefficient of friction values. In order to reduce the risks involved in usage of actual heavy vehicles in crash experiments, a simulation approach using a multi-body vehicle dynamic software was applied in this study, where the verified virtual heavy vehicle model was simulated and the output results were extracted and analyzed. The results showed that a maximum of 40% and a minimum of 23% from the total number of simulations resulted in an unsafe condition (indicated as failed) during the simulations. From the unsafe conditions, two types of rollover accidents could be identified, which were un-tripped and tripped rollovers. The heavy vehicle speed was also found to have a strong correlation to the lateral acceleration (to cause a rollover), followed by gross vehicle weight, coefficient of friction and cornering radius, respectively.
1. Introduction
Many developing countries including Malaysia have shown rapid growth in the past decades, particularly in the industrial sectors and infrastructure developments. Parallel to this, Malaysia has seen remarkable a period of economic expansion and growth in terms of its population, industrialization and motorization. According to the Malaysian Automotive Association [1], an average of 60,000 new vehicles are registered in Malaysia every year, with the total number of new vehicles of 604,287 in 2019. These include various types of land vehicles, ranging from passenger cars to commercial vehicles, such as trucks, prime movers, pick-ups, panel vans and buses. This in turn adds up to the traffic composition on Malaysian roads, where 24.57% of traffic was contributed by heavy vehicles, such as light lorries (14.21%), medium lorries (6.29%) and heavy lorries (4.07%) [2].
Heavy vehicles have been reported to be involved in 30,000–40,000 accidents yearly and caused significantly more fatalities than cars [2]. The study by Karim et al. revealed that more than 10% of the fatalities occurred in accidents involving heavy vehicles were caused by a rollover [3]. Based on the National Automotive Sampling System Crashworthiness Data System (NASS-CDS), rollover accidents can be further classified into several types. Based on the data, a trip-rollover is the one that occurs more often (60%) compared to other types of rollover accidents [4]. Meanwhile, a study from NHTSA reported that 95% of single-vehicle rollovers are tripped [5].
Accidents involving heavy vehicle rollovers affect other road users in various aspects and endanger the safety of nearby vehicles or road users. According to Hamidun et al. [6], the involvement of heavy vehicles in road accidents often resulted in more than 80% of second vehicle fatalities. In addition, the probability of a fatal accident to occur has also been reported to significantly increase at locations with higher percentage of trucks in traffic [7]. Load displacements that often occur in such accidents may also cause cargo damages, which may significantly impact the companies’ expenses [8]. Heavy vehicles that carry hazardous cargos such as chemicals or flammable fuels have the potential to cause environmental or human disasters if these contents are spilled. In addition to that, a rollover accident is also much more likely to result in driver fatalities compared to other type of crashes that do not involve a rollover [6,9,10]. As a result, heavy vehicle accidentsundoubtedly cause severe traffic disruption, as the wreckage and casualties are more difficult to clear compared to accidents involving other types of vehicles.
Several studies on heavy vehicle rollover have been conducted via conventional means [11,12,13], such as crash experiments [14]. However, these approaches are time consuming and costly. To reduce or eliminate these consequences or risks, a simulation approach can be employed during such analyses to complete the project. Numerous researchers nowadays are migrating to make use of simulation approaches to study vehicle dynamics and safety. For example, Sun et al. [15], in their study, have developed a full heavy vehicle model with MWorks and analyzed the performance of kinematic and compliance of the heavy vehicle. The usage of validated virtual vehicle models has been shown to similarly to that of actual vehicles, with an acceptable percentage of error [16,17]. Other than that, simulation approaches have also been used to study other aspects that are involved in a rollover, such as the effect of tire criteria [18,19]. The robustness of simulation techniques has allowed for analyses and development of models to be carried out. For example, Inhwan et al. [20] have utilized the rollover test criteria developed by the National Highway Traffic Safety Administration (NHTSA) to simulate both un-tripped and tripped rollovers. Meanwhile, Ertlmeier et al. [21] and Shi et al. [22] have developed a physical model for tripped rollovers, which was then used to establish a rollover criteria improvement. Recently, Elamrani et al. reported on the development of real-time crash prediction models based on traffic and weather data by using machine learning techniques such as the support vector machine (SVM) and deep neural network multilayer perceptron (MLP) [23]. Zou et al. have also used real climate data sets to simulate the relationship between climatic conditions and social development factors in fatal traffic accidents [24].
However, very few reports can be found on the simulation analyses of rollovers involving various types of commercial heavy vehicles, particularly the single unit trucks (SUT) and single truck-trailers (STT) that can be commonly found on Malaysian roads. Thus, in this study, a simulation analysis was conducted with the aim to understand the key factors involved in the occurrence of rollovers in these commercial heavy vehicles, such as (in general) the heavy vehicle conditions and road conditions. To achieve that, IPG TruckMaker(R), a multi-body dynamic simulation software, was used to generate output data of lateral acceleration with various simulation input data, such as heavy vehicle classes, gross vehicle weights, heavy vehicle speeds, road friction coefficient, cornering radius of the road and driver capabilities.
2. Materials and Methods
2.1. Simulation Settings
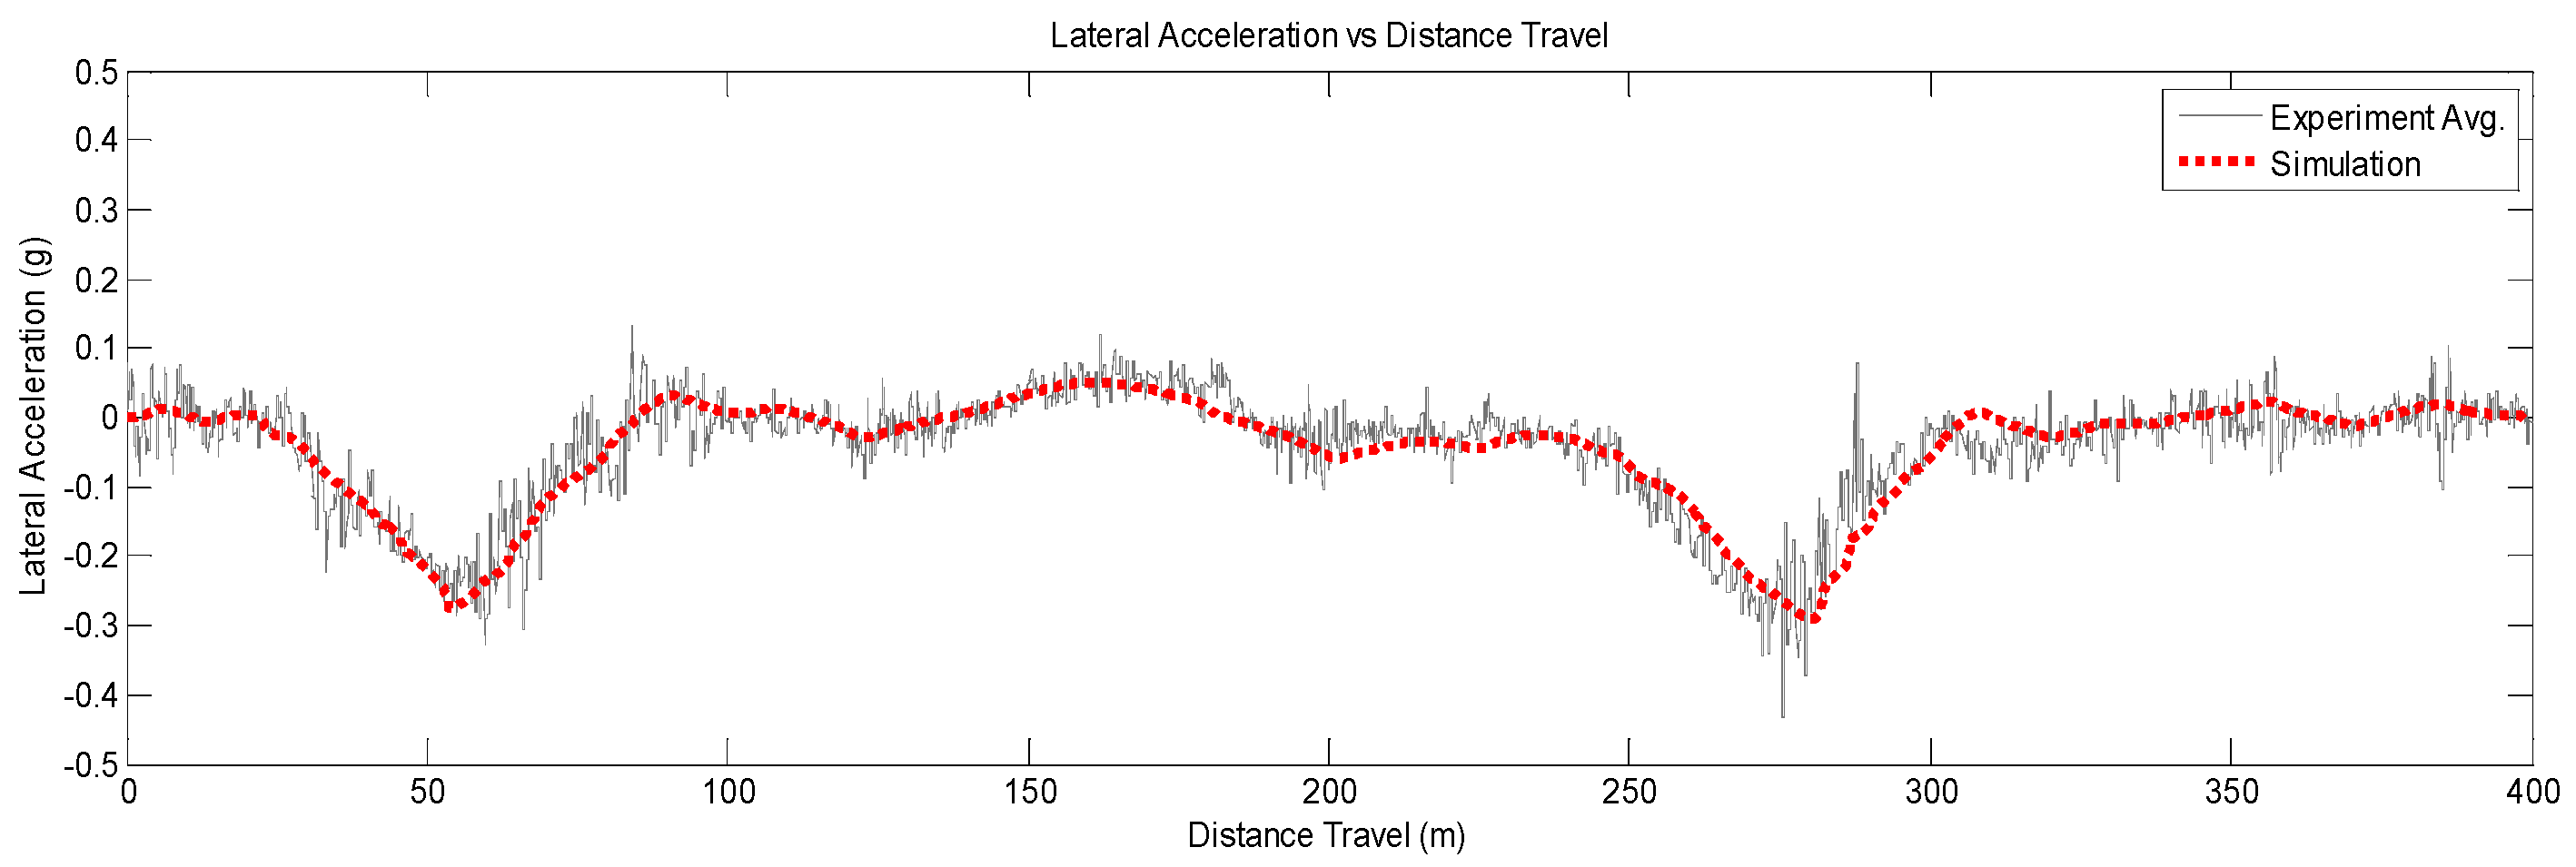
Validation of the virtual heavy vehicle model with the actual heavy vehicle is important when a simulation approach is employed. This is to ensure that the virtual heavy vehicle model is replicating the actual heavy vehicle as accurately as it can, in terms of its performance and dynamic behavior (Figure 1), as we have reported previously [25]. The virtual model was found to closely represent the actual heavy vehicle and this was further validated by multiple performance indices. As shown in Table 1, the root mean square error (RMSE) of lateral acceleration was very close to 0, indicating a good correlation was obtained between both experimental and simulation data. The lateral acceleration mean absolute error (MAE) was also very close to 0, implying that the simulation model accurately represents the experimental data. The regression coefficient (R) for lateral acceleration was also observed to be close to 1, indicating that the simulation model has explained the majority of the variances observed.
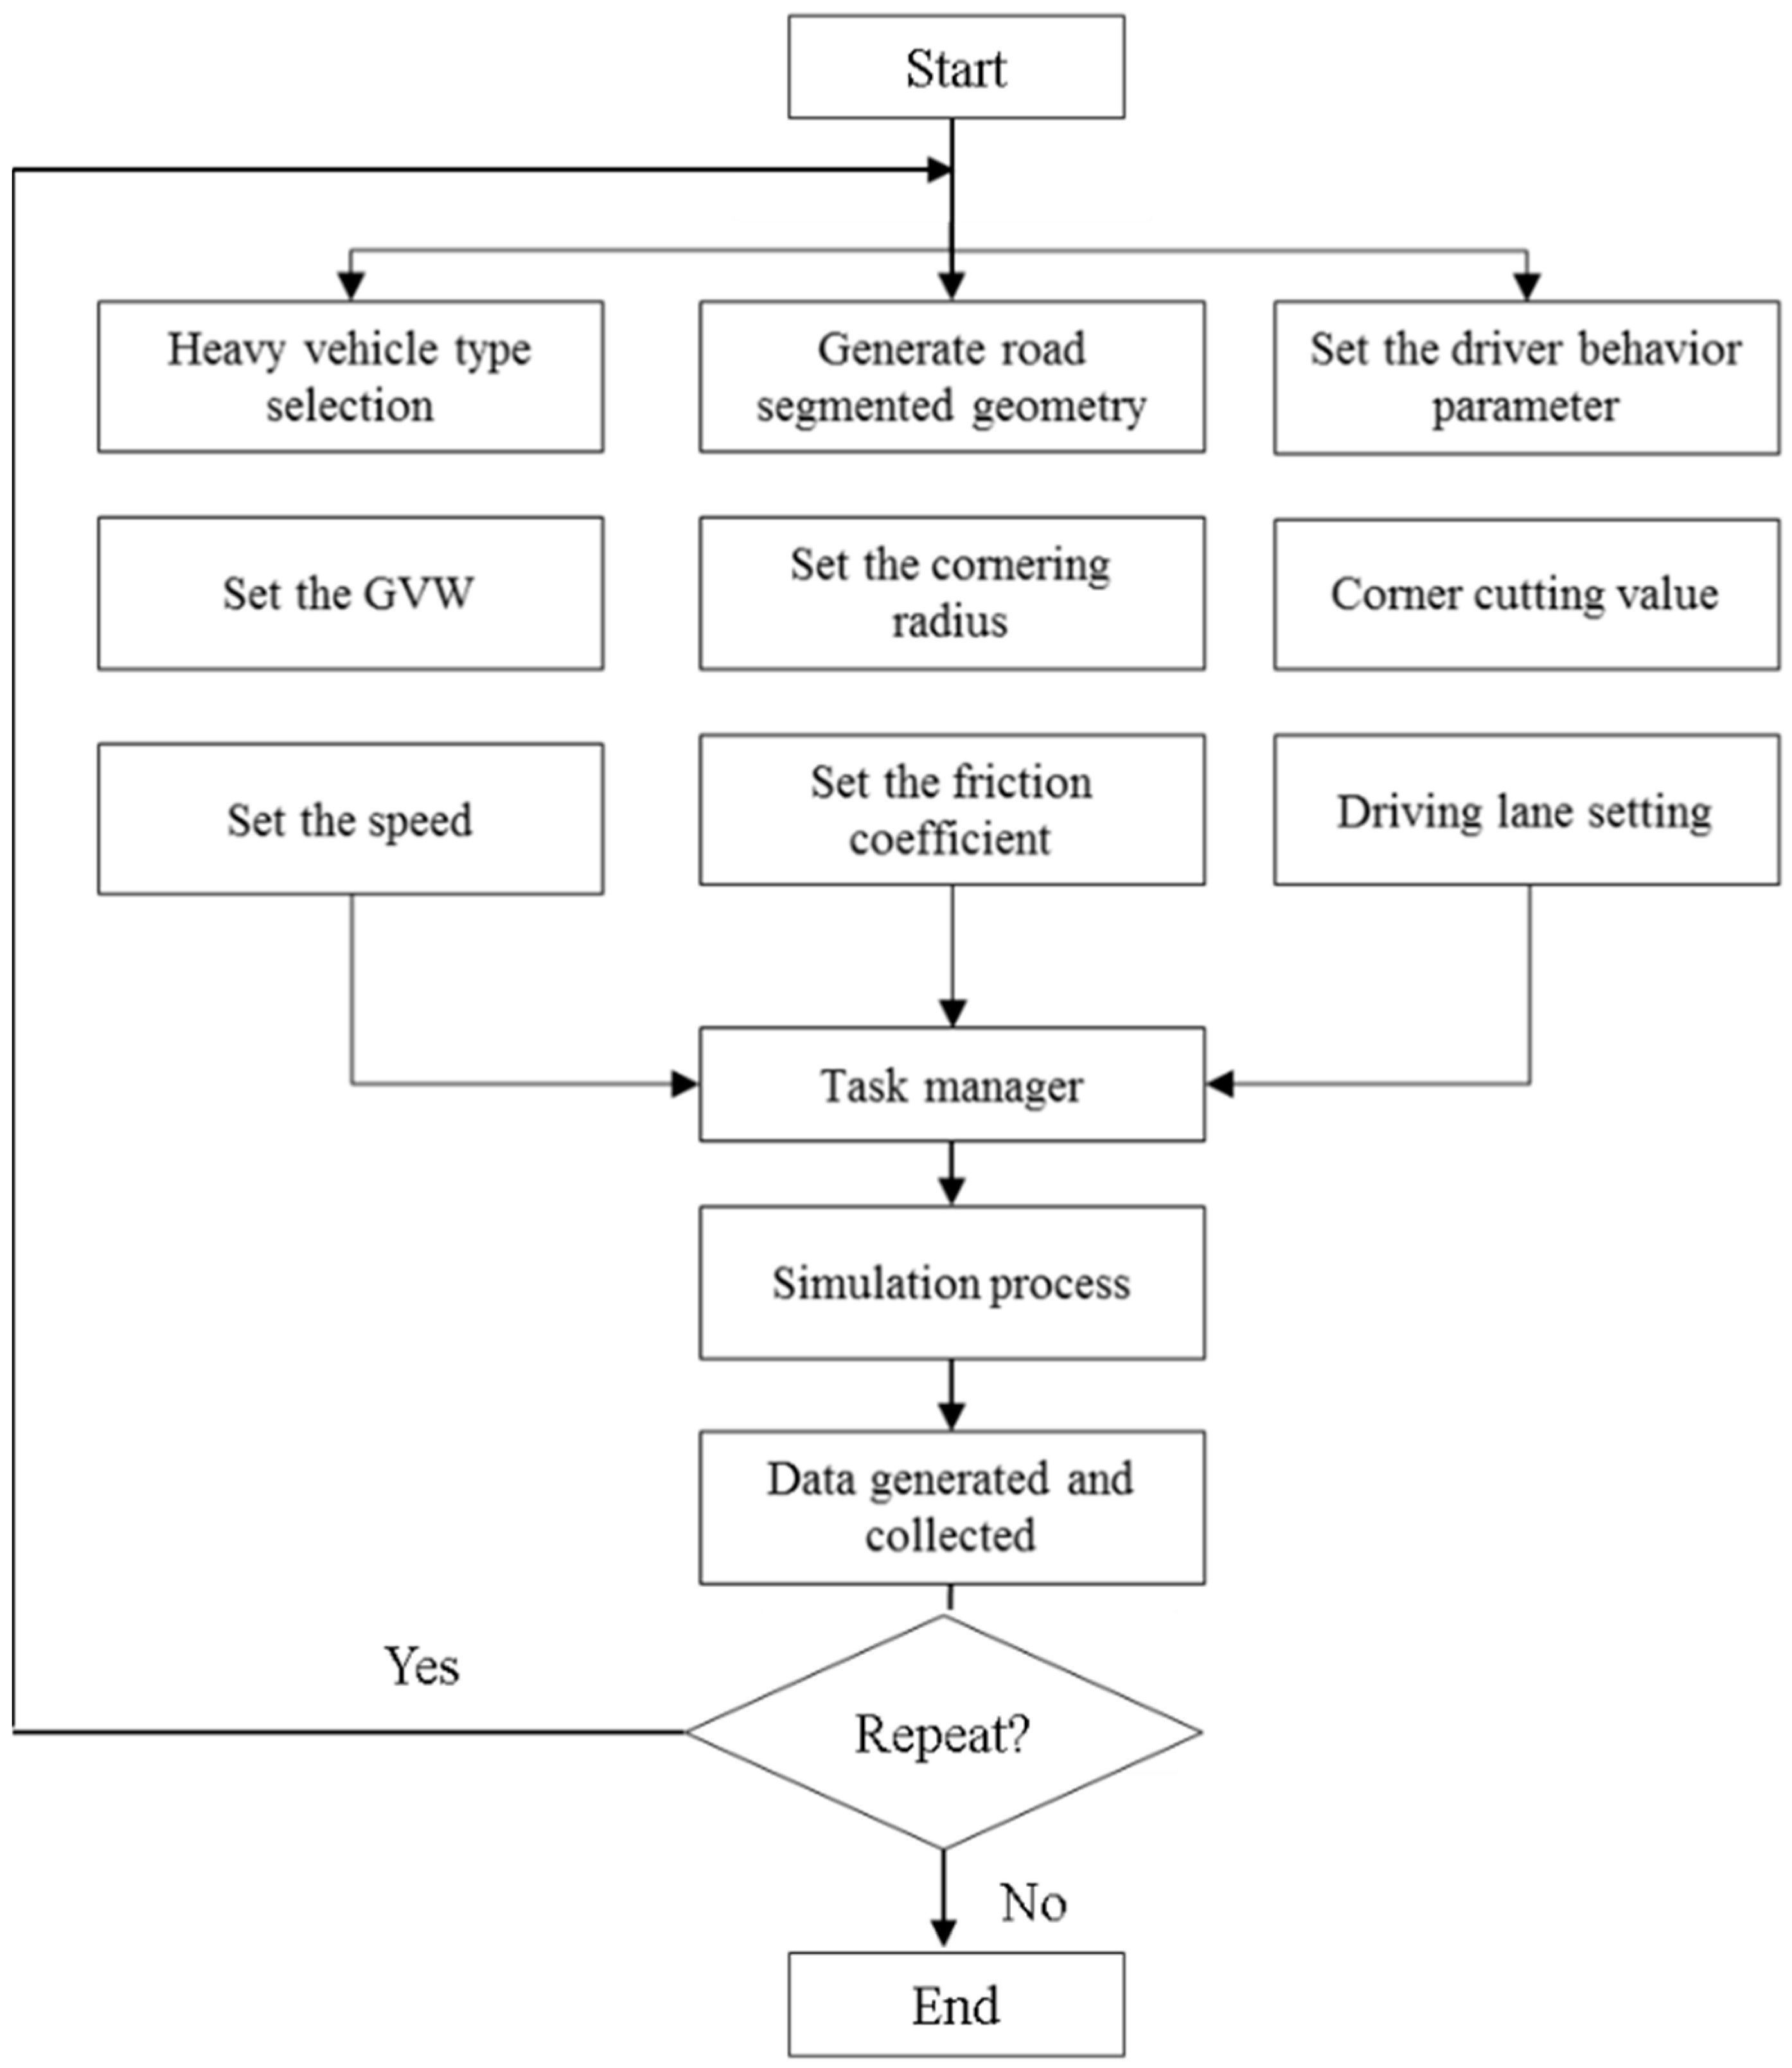
Thus, in this paper, several classes of verified heavy vehicles with various independent parameters were simulated. These independent parameters were divided into several categories as outlined in Table 2, while Figure 2 shows the flowchart describing the simulation process that had been conducted using the IPG TruckMaker(R) software. The analysis took into consideration the common single unit trucks (SUT) and single truck-trailers (STT) that are commonly used in Malaysia, which are SUTs with two, three and four axles and SSTs with four and five axles. Figure 3 shows the SUTs and STTs used in the simulations conducted in this study.
It has been reported that GVW, speed and road condition were among the contributing factors in a rollover accident [5,9,10,26,27,28,29,30,31]. Thus, in this study, the simulation of the heavy vehicles was conducted using various speed values, gross vehicle weights (GVW), coefficient of friction and cornering radius. Additionally, Karim et al. [32] have analyzed and reported the prevalence and degree of GVW and speed violations in selected areas in Malaysia; these data were used as the reference value and input data for the simulation settings in this study. Karim et al. [32] have also reported that 2-axle vehicles recorded the highest percentage of GVW violation, with 120% from its permissible GVW, followed by 3-axle (101%), 4-axle (83.9%) and 5 axle ones (51.9%). It was also reported that 46% of the total heavy vehicles weighing more than 20t violated the permissible speed (driving at more than 90 km/h) [32]. However, heavy vehicles driven at very low speeds (below 40 km/h) were also recorded. Table 3 shows the summary of heavy vehicle settings for speed and GVW used in the simulation.
In order to precisely determine the vehicle stability, the location of the vehicle center of gravity should be considered [10]. However, in this study, the location of the center of gravity (CoG) for each of the different heavy vehicle types was established by the IPG Truck Maker(R) software, where the volume and the height of the load was assumed to be uniform, regardless of the load weight (GVW) applied. According to Elischer and Prem, even though homogeneous loading does not fully represent the actual situation, it can be used to represent the “worst case” loading configuration, when used to determine the stability and safety of the heavy vehicle [33].
Jones and Childers defined the coefficient of friction of wet condition as 0.4 and 0.9 for dry condition [34]. Meanwhile, Kordani et al. mentioned the coefficient of friction of the roads used in his study is between 0.18 (icy) to 0.9 (dry) [29]. In addition, several studies have also reported on coefficients of friction that ranged from as low as 0.17 to 0.7 [35,36]. Thus, five values of road coefficient were also used to represent the real condition of Malaysian roads, which were 0.3 (wet condition), 0.4 and 0.5 (normal conditions) and 0.6 and 0.7 (dry conditions). In the simulation, the road segmented geometry was designed to have a cornering section that started and continued with a straight lane. This road was purposely designed in order to observe the effect of the vehicle stability and safety when maneuvering on the curved section of the road with different coefficients of friction and cornering radius values. Three values of cornering radius, which were 150 m, 200 m and 250 m, calculated 90 degrees of turning from its center, were selected. Figure 4 shows the road geometry generated using the IPG TruckMaker(R). Each cornering radius was designed to follow the superelevation value and the left side was set as the drive lane, in accordance with the Malaysian law. IPG TruckMaker(R) also offered the driving and maneuvering mode features to accurately replicate the driving experience, which were the corner cutting value and driving mode. The corner cutting value was set to “1”, which indicated that the heavy vehicle was only allowed to drive on the driving lane area for the entire simulation, while the driving mode was set as “normal”; this was to indicate that the driver was in a calm condition while driving through the simulation. This normal driving mode was rated by a maximum value of the longitudinal and lateral acceleration (known as G-G diagram) of 3.0 ms−2 or approximately 0.31 g while cornering. Other driving modes available in the software were “defensive” and “agressive” conditions with different maximum G-G diagram value [37].
There are several parameters that can be used to measure the roll stability of a vehicle, such as through lateral load transfer (LTR), vehicle roll angle and lateral acceleration [10,38,39]. In this study, lateral acceleration was chosen as dependent parameter as it is commonly used to determine the roll stability and rollover propensity [15,17].
2.2. Post-Processing and Correlation Analysis
A number of simulations were run with various parameters, thus generating numerous sets of simulation files in spreadsheet format. Each file consisted of thousands of output data (lateral acceleration). The exhaustive list of data values was then screened to reveal the data of interest, i.e., the values for maximum lateral acceleration that occurred during vehicle cornering. For this purpose, a computer program language software, MATLAB was used. Through the use of custom-generated coding, the maximum values of lateral acceleration were sorted and transferred into a dedicated file. The flow of the screening process using MATLAB is as shown in Figure 5.
The data collected were then tabulated and entered into a statistical analysis software, SPSS. A multivariate Pearson coefficient correlation analysis was employed to investigate the significance and degree of relationships between the independent and dependent variables. The correlation analysis was essential to determine which and whether the independent variables played a significant role in the occurrence of rollovers.
3. Results and Discussion
3.1. Simulation of Virtual Heavy Vehicle Models
The simulation files for the results obtained from IPG TruckMaker(R) were exported into spreadsheet format (Microsoft Excel) using an IPG TruckMaker(R) feature called IPG Control. This enabled the data to be screened and thoroughly analyzed. In total, there were 8235 simulation files that had been generated, with 1080 files from two-axle SUTs, 1485 files from three-axle SUTs, 1755 files from four-axle SUTs, 1755 files from four-axle STTs and 2160 files from five-axle STTs. Different types of heavy vehicles generated a different amount of simulation data due to the different maximum number of GVW sets (see Figure 2), as, the higher the maximum GVW, the more simulation data would be generated for the same speed, coefficient of friction and cornering radius. After all data had been successfully screened and sorted, they were then imported into a statistical analysis software (SPSS) to be further analyzed.
3.2. Data Screening and Processing
Each simulation file for each vehicle class produced a data set which consisted of the distance travelled, vehicle speed, GVW, CoF, curve radius and lateral acceleration. The maximum value of lateral acceleration was screened from each data set by using a customized programming language on MATLAB. The selected screened data for two-axle SUTs maneuvered at cornering radius of 150 m, CoF of 0.3 and GVW of 10,000 kg and 15,000 kg are shown in Table 4.
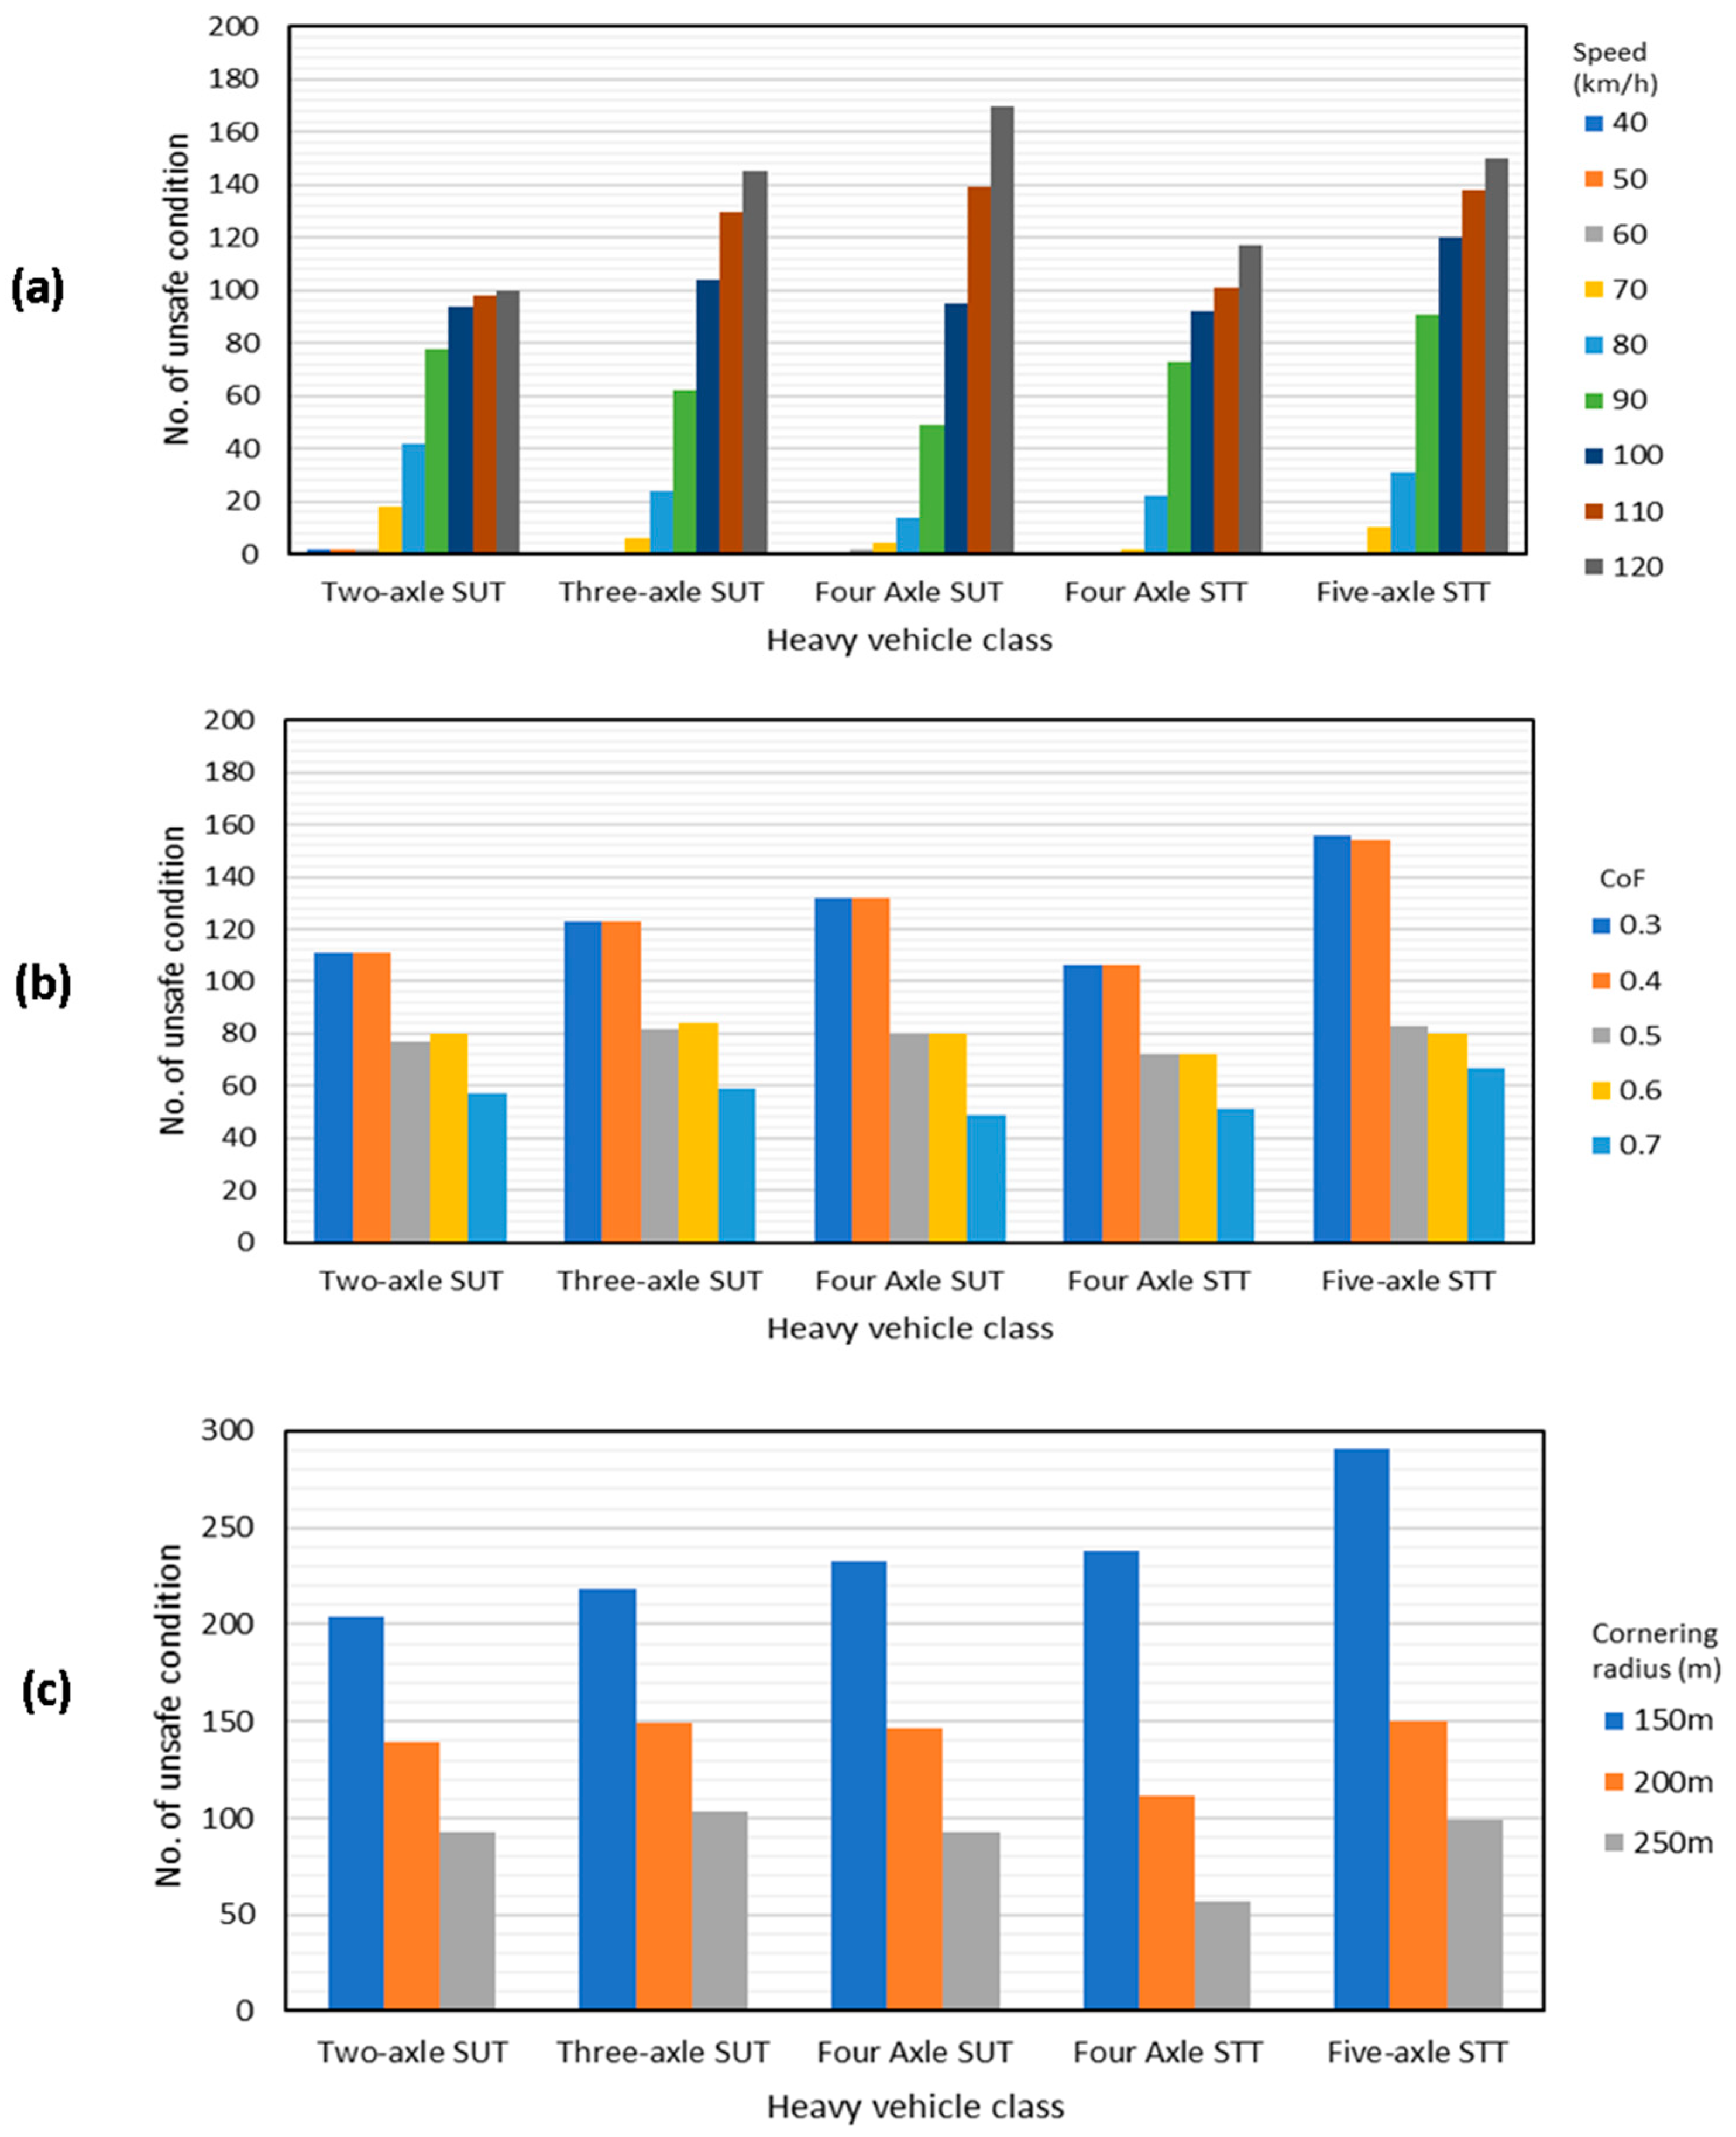
Table 5 shows a summary of vehicle safety conditions generated through the simulations. The vehicle was categorized to be in either safe or unsafe (rollover) conditions based on a large number of simulations. Two-axle SUTs recorded the highest percentage of unsafe conditions (40%), followed by three-axle SUTs (32%), four-axle SUTs (27%), five-axle STTs (25%) and four-axle STTs (23%), out of the total number of simulations. These different percentage values of unsafe conditions could be due to the number of axles on the heavy vehicle. For example, for simulations computed using the same GVW, vehicle speed and road conditions, the three-axle SUT was likely to be more stable than the two-axle SUT, since three-axle SUTs would have more tire contact patches on the road to hold the lateral force and slide slip, compared to the two-axle SUT. However, four-axle STTs recorded 4% less unsafe conditions compared to four-axle SUTs, even though similar GVW, speed and road condition settings were used in the simulation. This was due to the fact that four-axle SUTs have a shorter wheelbase than four-axle STTs, thus generating more lateral force during cornering. In addition, Figure 6 shows the number of unsafe conditions when arranged according to the heavy vehicle speed, coefficient of friction and cornering radius. Based on Figure 6, it can be observed that speed has a positive correlation with the occurrence of unsafe conditions, whereby as the vehicle speed increased, the number of unsafe conditions also increased. This observation obeys the principle of circular motion where the increase of lateral acceleration value is directly proportional to the speed of the vehicle, when the cornering radius is constant. In contrast, as the CoF and cornering radius increased, the number of unsafe conditions were observed to decrease, due to the better road grip during vehicle maneuvering.
The unsafe conditions in these simulation cases can be divided into two types, which are tripped rollover and un-tripped rollover [19]. The tripped rollover occurred when the heavy vehicle left the driving lane, tripped to the curb and rolled over (Figure 7). Meanwhile, an un-tripped rollover occurred when the heavy vehicle started to roll over on the driving lane due to overspeeding and excessive GVW. The road coefficient of friction (CoF) was found to be the main contributing factor that resulted in the occurrence of either tripped or un-tripped rollovers. For instance, when the same vehicle type, GVW, speed and cornering radius were used during the simulation, a lower CoF would result in a tripped rollover, while a higher CoF would result in an un-tripped rollover. Table 6 shows the percentage of tripped and un-tripped rollovers from the unsafe conditions of the different heavy vehicle classes.
3.3. Analysis of Simulation Results
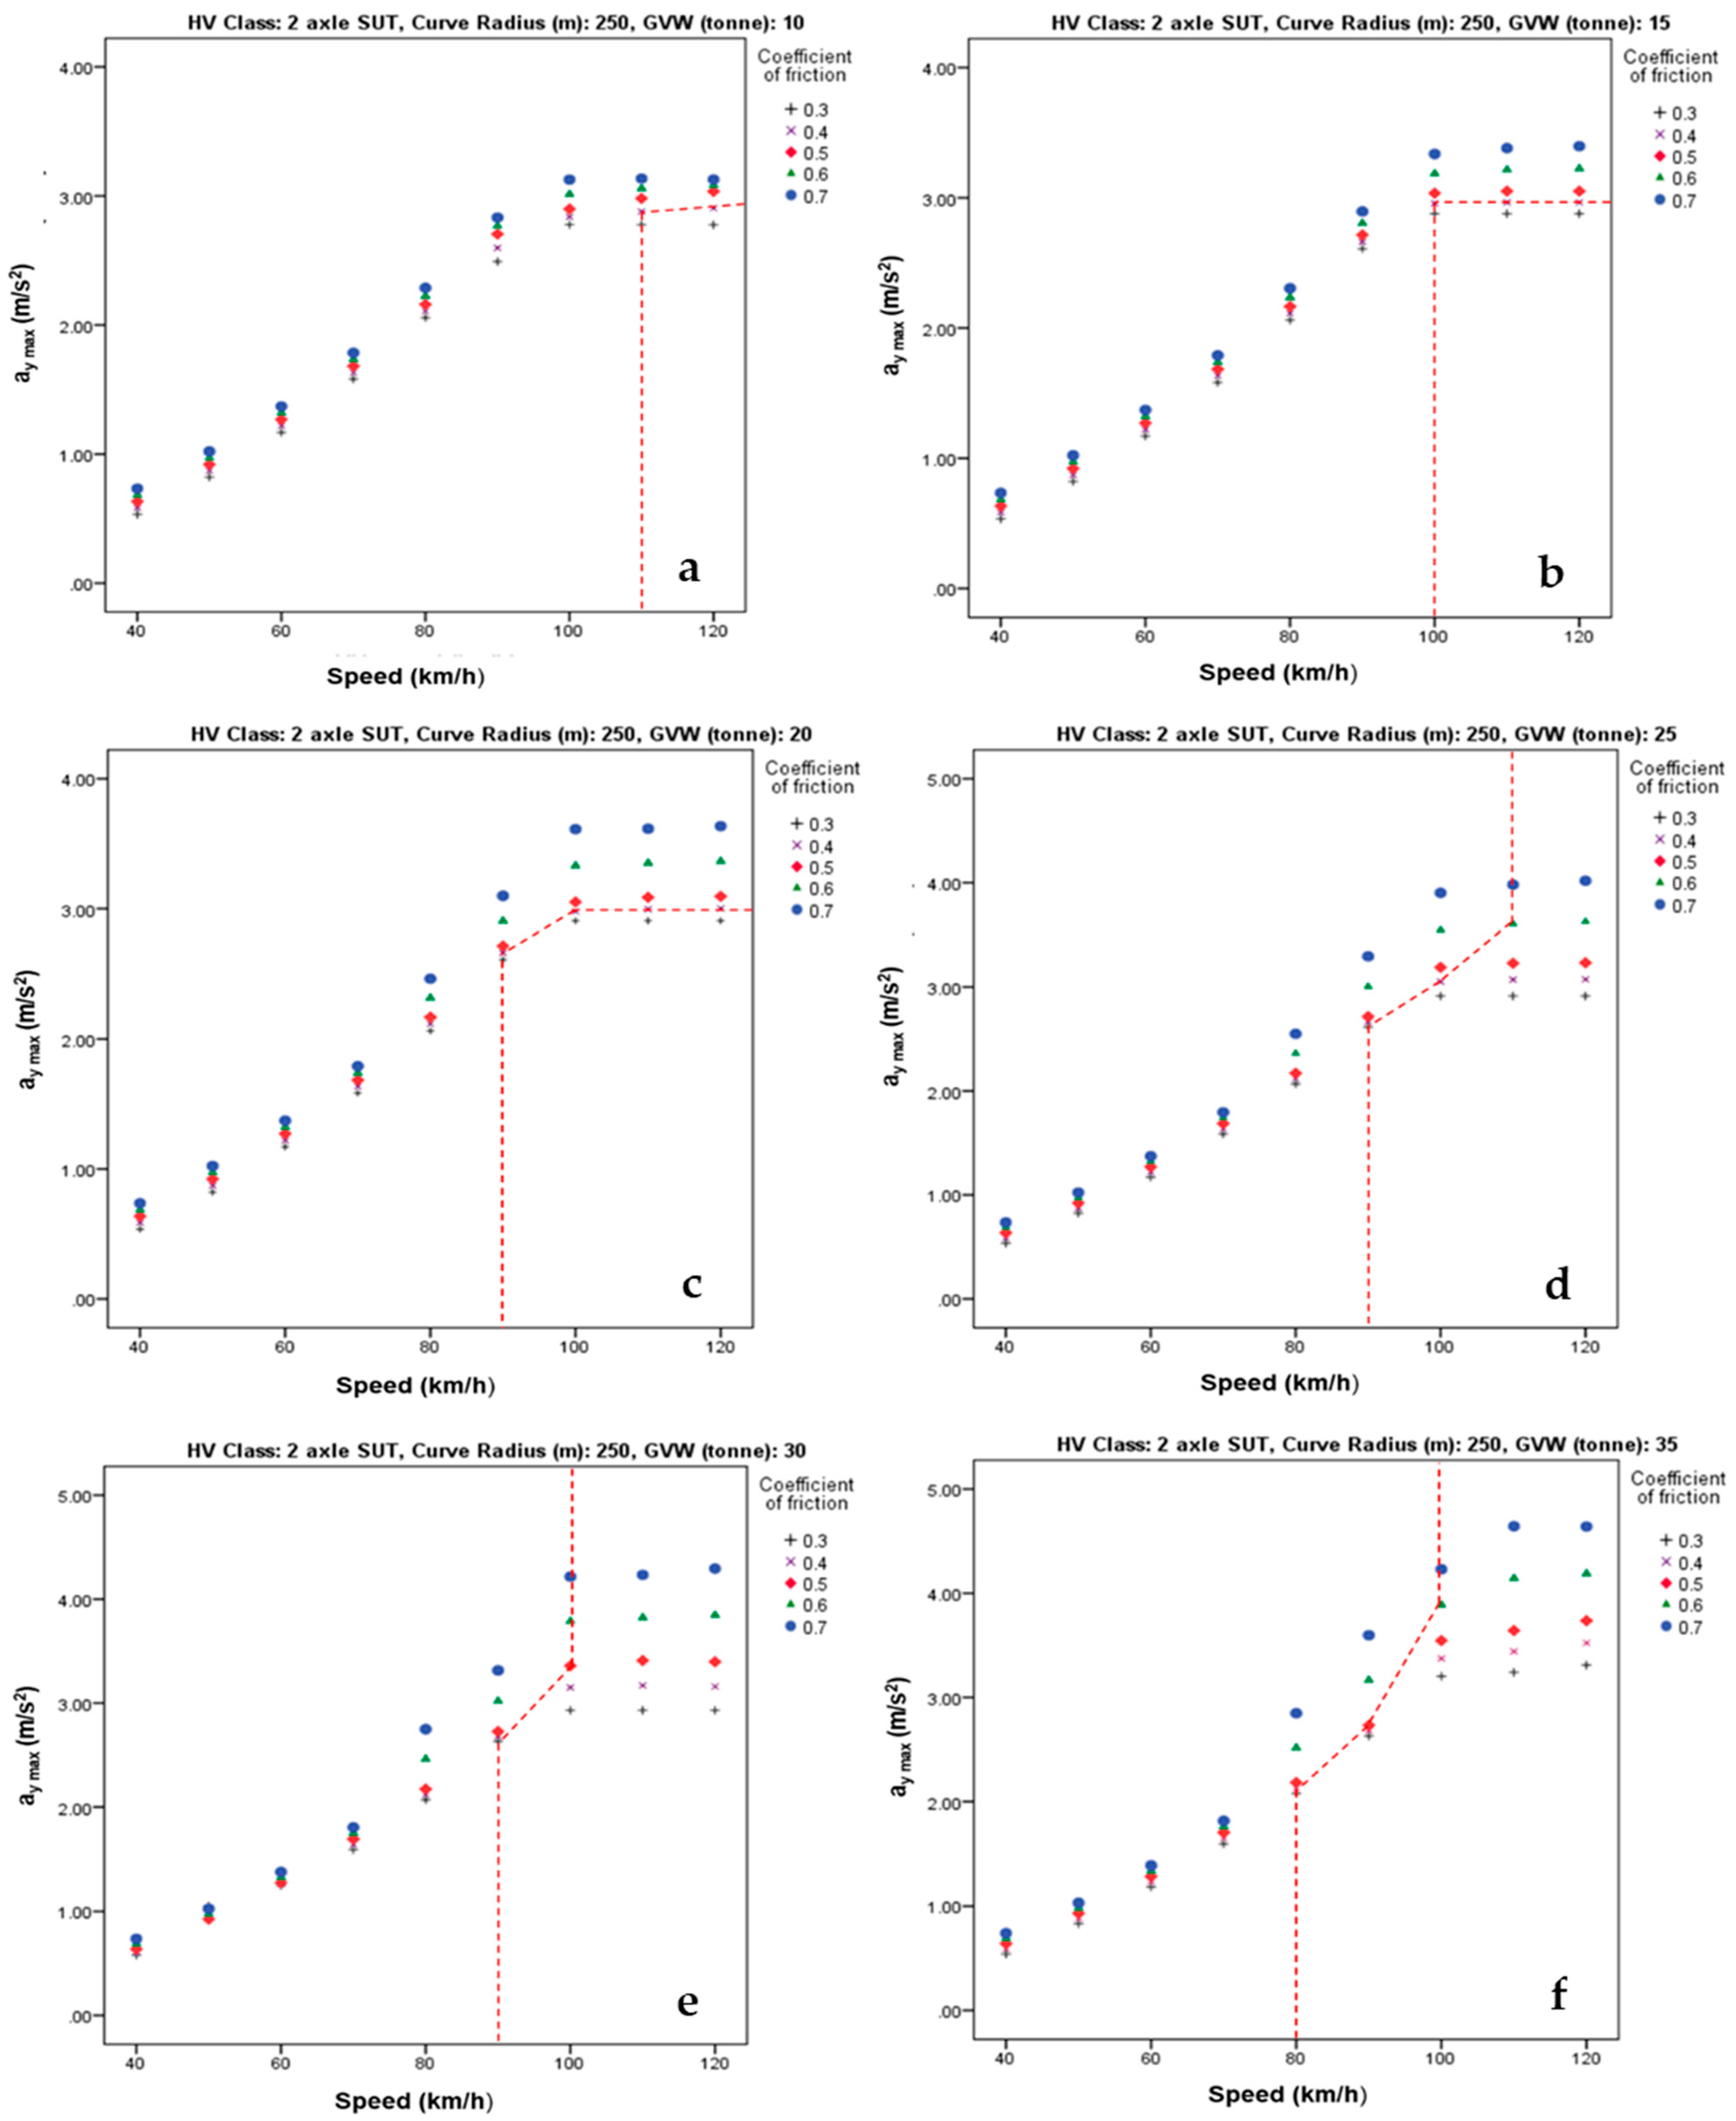
Data analysis revealed that there is a relationship between the maximum lateral acceleration and the heavy vehicle speed (Table 4), where the maximum lateral acceleration increases with increasing heavy vehicle speed, at any coefficient of friction values. In other words, the faster the heavy vehicle is, the higher is the maximum lateral acceleration that would be generated during cornering, thus increasing the risks of unsafe conditions and rollover propensity. To understand these in detail, the graphs generated by a two-axle SUT when maneuvering a 150 m, 200 m and 250 m cornering radius are shown in Figure 8, Figure 9 and Figure 10. The heavy vehicle rollover incidences were indicated by the red-colored line in the graphs. The maximum lateral acceleration values that were beyond the right section of the red-colored lines were the lateral acceleration values at which an impending rollover would occur.
The graphs show that, at the same speed and CoF, the maximum lateral acceleration increased when GVW increased. However, these can be seen clearly at the speed of 60 km/h and above, since speeds of 40 km/h and 50 km/h showed a very minimal change of maximum lateral acceleration value when GVW increased. Hence, it can be concluded that the heavier the load carried by the heavy vehicle is, the higher are the risks of rollover during cornering [27,28]. Furthermore, as the CoF increased, the maximum lateral acceleration also increased. This was due to the road surface becoming rougher as the CoF values increased, resulting in a better tire contact patch on the road (more grip), hence more lateral acceleration was required for a rollover and unsafe condition to occur [29]. Data analysis conducted on three-axle SUTs, four-axle SUTs, four-axle STTs and five-axle STTs also showed similar trends (graphs not shown).
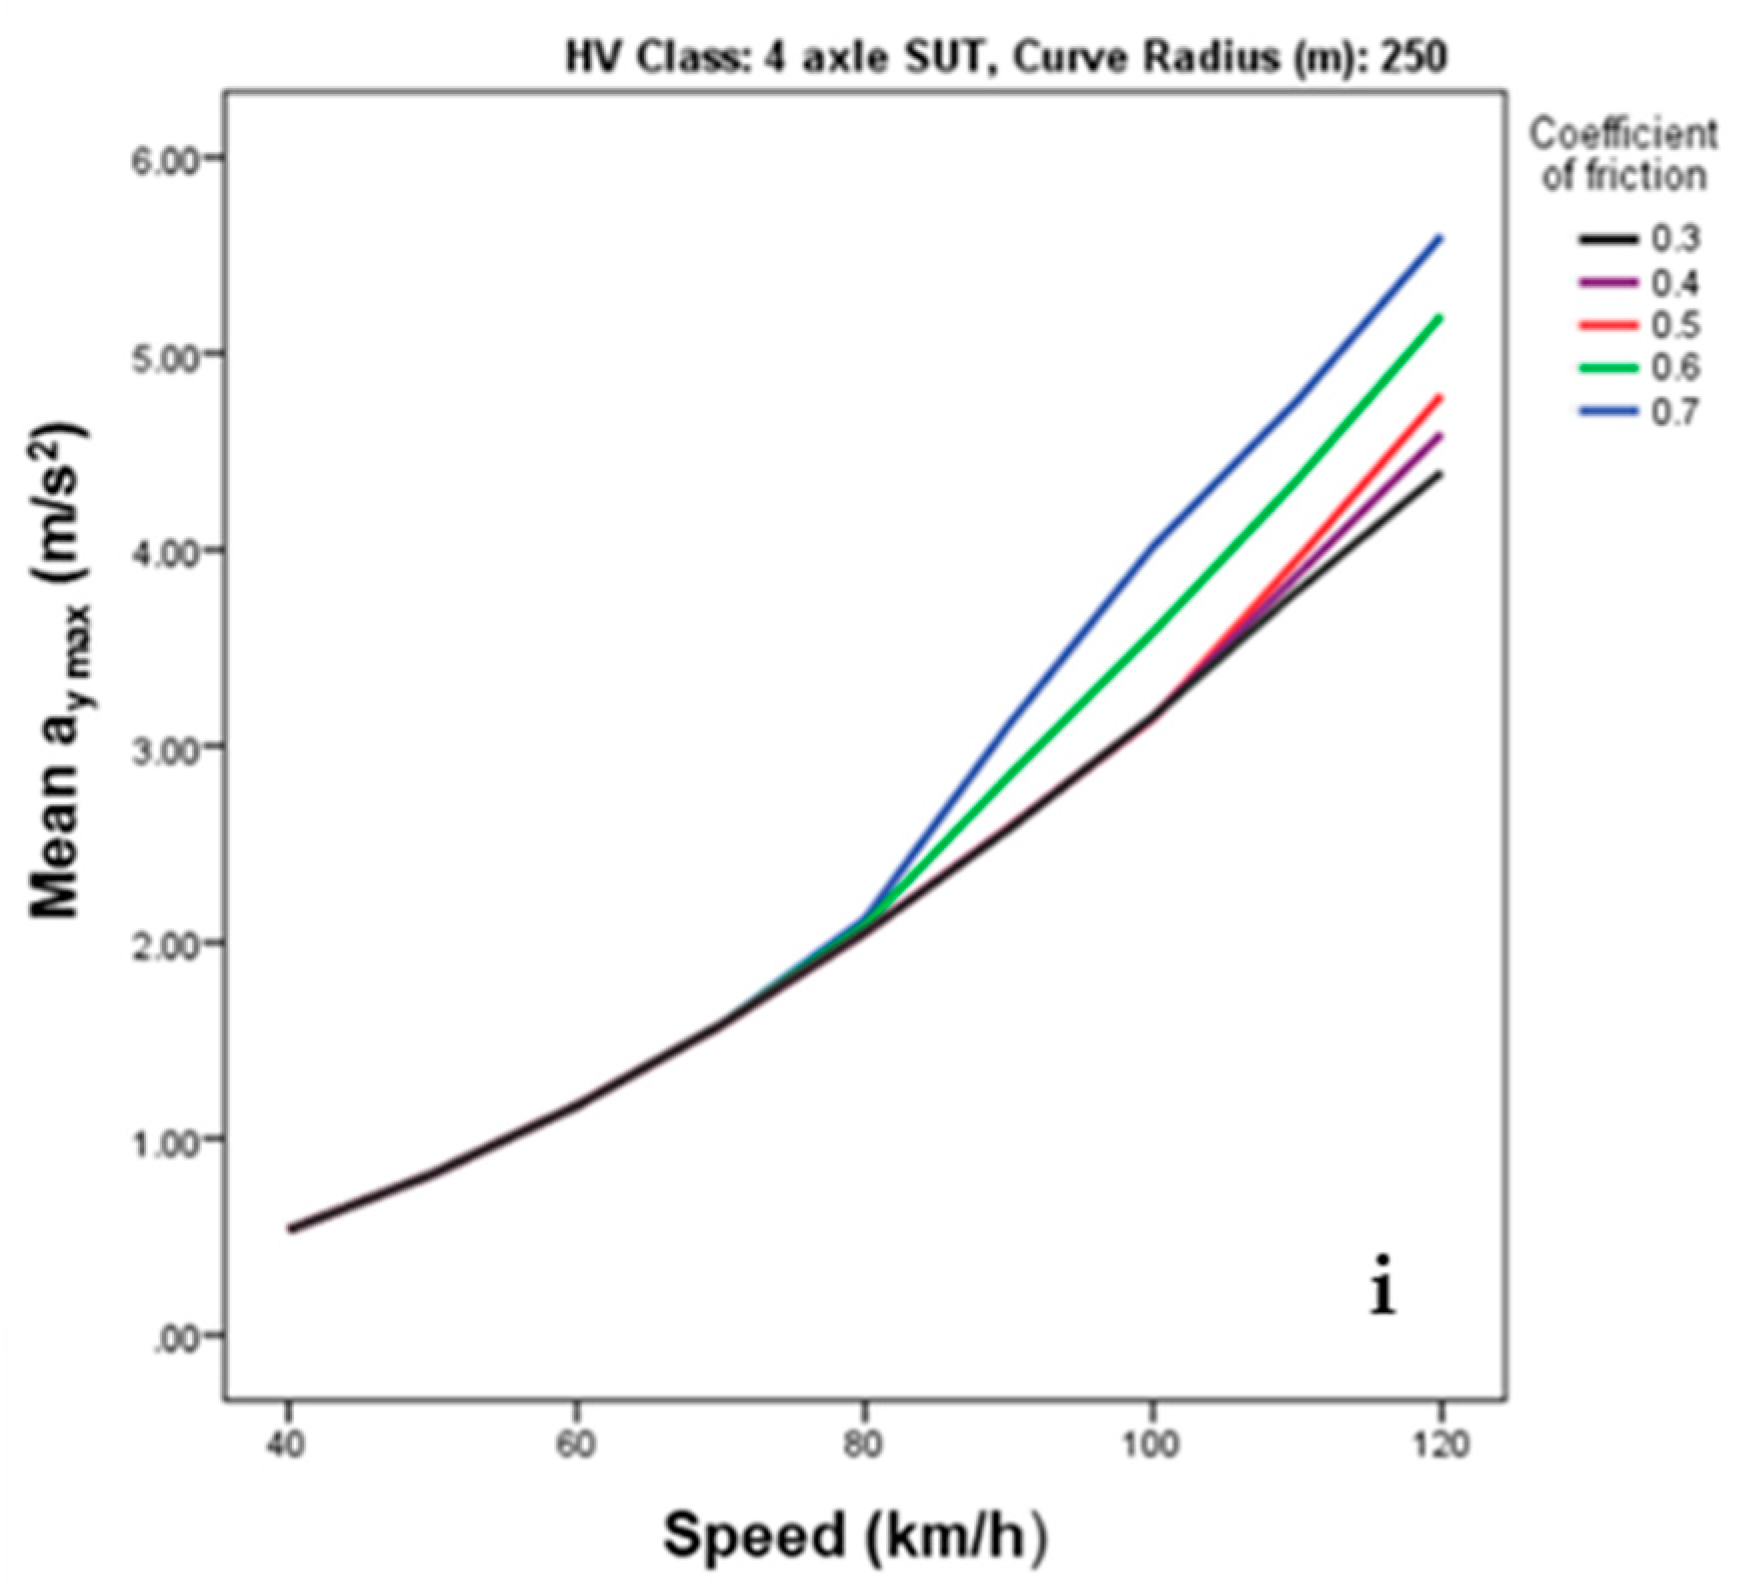
For every heavy vehicle type, the maximum lateral acceleration values resulting from the different GVW (at the same speed, CoF and cornering radius) were tabulated and used to determine the mean maximum lateral acceleration. Table 7 shows an example of the calculated mean maximum lateral acceleration of a two-axle SUT driven at 40 km/h, with CoF of 0.3 and cornering radius of 150 m. The relationship between the mean maximum lateral acceleration and vehicle speeds (at various cornering radius) of other heavy vehicle classes were also analyzed and these are shown in Figure 11, for other SUTs, and Figure 12 for STTs. For two-axle SUTs, the trends observed for cornering radii of 200 m and 250 m were similar to those for 150 m, as explained in previous paragraphs. Data analysis also revealed that the mean maximum lateral acceleration increased when vehicle speed was increased (for all heavy vehicle classes). On the other hand, the mean maximum lateral acceleration increased when the CoF increased.
3.4. Correlation Analysis
A Pearson correlation analysis was performed to determine the degree and strength of the relationships between the dependent and independent variables. This exercise was also done to ensure that any change (in value) of the independent variables would correlate and result in a significant change to the dependent variables. Otherwise, the independent variables could be deemed as not important and thus neglected.
In the case of two-axle SUTs (Table 8), a significantly strong correlation was observed between the speed of the two-axle SUT and maximum lateral acceleration (r = 0.873, p < 0.01). A significant correlation was also observed between the two-axle SUT GVW and the maximum lateral acceleration, but this correlation was observed to be low (r = 0.352, p < 0.01). Meanwhile, a significant correlation was found between the two-axle SUT CoF and the maximum lateral acceleration (r = 0.346, p < 0.01), indicating that the maximum lateral acceleration increased when CoF values increased. In contrast, a very weak and negligible correlation (albeit significant) was observed between the two-axle SUT cornering radius and the maximum lateral acceleration (r = −0.214, p < 0.01).
Similar observations were also recorded when a Pearson correlation analysis was conducted for all classes of heavy vehicles (Table 9). These findings further confirmed that vehicle speed, GVW and CoF are significant factors that influenced the maximum lateral acceleration that can cause a heavy vehicle to roll over, in parallel with findings in previous reports [27,28,29]. These results are consistent with those reported in previous studies, where vehicle speed and road conditions (CoF) have been shown to significantly influence lateral acceleration [40,41,42]. In parallel with our results, Ryu et al. [43] also stated that vehicles with a heavy load often have a higher center of gravity, thus increasing the risk to roll over in an accident. However, in this study, the location of the center of gravity (CoG) for each of the different heavy vehicle types was established by the IPG Truck Maker(R) software, where the volume and the height of the load were assumed to be uniform, regardless of the load weight (GVW) applied. Even though homogeneous loading does not fully represent the actual situation, we postulate that this configuration would represent the “worst case” scenario that could happen, when a particular heavy vehicle with high GVW (with high loading) maneuvers a curved section of the road.
4. Conclusions
This study has demonstrated the application of multibody dynamics software in investigating the effects of vehicle conditions and road conditions that can influence rollover of heavy vehicles during maneuvering on a curved road section. This approach can reduce the time taken and cost compared to the experimental testing. Previous research has shown that there are many cases of heavy vehicle speed violations and exceeding permissible GVW that can lead to serious accidents (especially rollovers) during cornering. In this study, the verified heavy vehicle models with different classes were simulated with various independent factors such as gross vehicle weight, speed, coefficient of friction of the road and radius of curvature. Lateral acceleration was used as the dependent value to indicate the rollover propensity. Based on the results, two-axle SUTs recorded the highest percentage of unsafe conditions (40%) followed by three-axle SUTs (32%), four-axle SUTs (27%), five-axle STTs (25%) and four-axle STTs (23%), out of the total number of simulations. A strong correlation was then observed between the heavy vehicle speed and maximum lateral acceleration, followed by GVW and CoF, accordingly. In contrast, a very weak and negligible correlation was observed between the cornering radius and the maximum lateral acceleration. The results of this study provide essential information and further elaborate on the key factors and their degree of influence on rollover propensity of heavy vehicles, compared to a description of rather general factors, as claimed in previous studies. Data analysis also revealed that speed and GVW violations are among the main contributors in a heavy vehicle rollover during cornering, despite the published speed limit and permissible GVW stipulated under the Malaysian law. Thus, we strongly recommend that a stricter and more vigilant law enforcement by the authorities is required. In terms of the practical application of the current findings, the data collected through the simulation analysis can be used in future studies to predict the rollover propensity of a heavy vehicle based on several factors such as GVW, speed, cornering radius and road coefficient of friction. Such findings will be of great importance and have the potential to be commercially utilized as part of the existing rollover warning system (RWS).
Author Contributions
Conceptualization, N.I. and A.S.; methodology, N.I.; software, A.S.; validation, N.I., A.S. and R.R.; formal analysis, N.I.; investigation, N.I.; resources, A.S. and R.R.; data curation, N.I.; writing—original draft preparation, N.I.; writing—review and editing, N.I., A.S. and R.R.; visualization, N.I.; supervision, A.S. and R.R.; project administration, N.I.; funding acquisition, A.S. All authors have read and agreed to the published version of the manuscript.
Funding
This research was funded by Sciencefund Grant (ref No: 03-01-03-SF0772) and PPP (Peruntukan Penyelidikan Pascasiswazah) Grant (Project No: PG093-2013B).
Informed Consent Statement
Written informed consent has been obtained from the Journal of Mechanical Engineering to reproduce Figure 1 to be published in this paper.
Acknowledgments
The authors gratefully acknowledge the support from the Computational and Applied Mechanics (ACAM) Research Group, Faculty of Engineering, Universiti Malaya, Malaysia. The authors also would like to thank Universiti Malaya (Grant PPP PG093-2013B) and the Ministry of Science, Technology and Innovation of Malaysia, MOSTI (Sciencefund Grant Ref No: 03-01-03-SF0772) for the financial support provided.
Conflicts of Interest
The authors declare no conflict of interest. The funders had no role in the design of the study; in the collection, analyses, or interpretation of data; in the writing of the manuscript, or in the decision to publish the results.
References
- Malaysian Automotive Association. Sales and Production Statistics; Malaysian Automotive Association: Selangor, Malaysia, 2020. [Google Scholar]
- Ministry of Transport Malaysia. Transport Statistics Malaysia 2018; Ministry of Transport Malaysia: Putrajaya, Malaysia, 2019.
- Karim, M.R.; Saifizul, A.; Yamanaka, H.; Sharizli, A.; Ramli, R. An Investigation on Safety Performance Assessment of Close-Following Behavior of Heavy Vehicle Using Empirical-Simulation Technique. J. Transp. Technol. 2014, 4, 22–30. [Google Scholar] [CrossRef] [Green Version]
- Radja, G.A. National Automotive Sampling System–Crashworthiness Data System 2015. In Analytical User’s Manual; National Highway Traffic Safety Administration: Washington, DC, USA, 2016. [Google Scholar]
- Hinch, J.; Shadle, S.; Klein, T.M. NHTSA’s rollover rulemaking program-results of testing and analysis. SAE Trans. 1992, 101, 677–690. [Google Scholar] [CrossRef]
- Hamidun, R.; Hoong, A.P.W.; Roslan, A.; Shabadin, A.; Jamil, H. Characteristics of heavy goods vehicles (HGV) accidents in Malaysia. In IOP Conference Series: Materials Science and Engineering, Proceedings of the 10th Malaysian Road Conference and Exhibition 2018, Selangor, Malaysia, 29–31 October 2018; IOP Publishing: Bristol, UK, 2019; Volume 512, p. 012021. [Google Scholar]
- Buddhavarapu, P.; Banerjee, A.; Prozzi, J.A. Influence of pavement Condition on Horizontal Curve Safety. Accid. Anal. Prev. 2013, 52, 9–18. [Google Scholar] [CrossRef] [PubMed]
- Sharizli, A.A.; Rahizar, R.; Karim, M.R.; Saifizul, A. New Method for Distance-based Close Following Safety Indicator. Traffic Inj. Prev. 2015, 16, 190–195. [Google Scholar] [CrossRef] [PubMed]
- Goldman, R.W.; El-Gindy, M.; Kulakowski, B.T. Rollover dynamics of road vehicles: Literature survey. Int. J. Heavy Veh. Syst. 2001, 8, 103–141. [Google Scholar] [CrossRef]
- Hyun, D.; Langari, R. Modeling to Predict Rollover Threat of Tractor-Semitrailers. Veh. Syst. Dyn. 2003, 39, 401–414. [Google Scholar] [CrossRef]
- Winkler, C.; Ervin, R. Rollover of Heavy Commercial Vehicles. In University of Michigan Transportation Research Institute Research Review; University of Michigan Transportation Research Institute: Ann Arbor, MI, USA, 2000; Volume 31. [Google Scholar]
- Garrott, W.R.; Howe, J.G.; Forkenbrock, G. Results from NHTSA’s Experimental Examination of Selected Maneuvers that may Induce On-Road Untripped, Light Vehicle Rollover. SAE Tech. Pap. Ser. 2001, 12, 21–39. [Google Scholar] [CrossRef]
- Tokunaga, R.A.; Asano, M.; Munehiro, K.; Hagiwara, T.; Kunugiza, K.; Kagaya, S. Effects of curve designs and road conditions on driver’s curve sharpness judgment and driving behavior. J. East. Asia Soc. Transp. Stud. 2005, 6, 3536–3550. [Google Scholar]
- Bambach, M.; Grzebieta, R.; McIntosh, A.; Mattos, G. Cervical and thoracic spine injury from interactions with vehicle roofs in pure rollover crashes. Accid. Anal. Prev. 2013, 50, 34–43. [Google Scholar] [CrossRef]
- Sun, Y.; Chen, W.; Zhang, Y.; Chen, L. Modeling and Simulation of Heavy Truck with Works. In Proceedings of the 8th International Modelica Conference, Dresden, Germany, 20–22 March 2011; Linköping University Electronic Press: Linköping, Sweden, 2011; Volume 63, pp. 725–729. [Google Scholar]
- Ahmad, F.; Mazlan, S.; Zamzuri, H.; Jamaluddin, H.; Hudha, K.; Short, M. Modelling and Validation of the Vehicle Longitudinal Model. Int. J. Automot. Mech. Eng. 2014, 10, 2042–2056. [Google Scholar] [CrossRef]
- Dong, X.; Jiang, Y.; Zhong, Z.; Zeng, W. Rollover threshold investigation of a heavy-duty vehicle during cornering based on multi-body dynamics. Adv. Mech. Eng. 2018, 10, 1687814018789505. [Google Scholar] [CrossRef]
- Takahashi, T.; Hada, M.; Oyama, K.; Sakai, H. New Model of Tire Overturning Moment Characteristics and Analysis of Their Influence on Vehicle Rollover Behavior. Veh. Syst. Dyn. 2004, 42, 109–118. [Google Scholar] [CrossRef]
- Fukushima, T.; Shitamichi, M.; Nishikata, O.; Mori, M.; Hatano, K.; Torigaki, T.; Nishi, M.; Miyachi, T. A Study of the Ditch Fall-over Test Method Using Numerical Simulation. SAE Int. J. Passeng. Cars Mech. Syst. 2012, 5, 76–88. [Google Scholar] [CrossRef]
- Han, I.; Rho, K. Characteristic analysis of vehicle rollover accidents: Rollover scenarios and prediction/warning. Int. J. Automot. Technol. 2017, 18, 451–461. [Google Scholar] [CrossRef]
- Ertlmeier, R.; Faisst, H.; Spannaus, P.; Brandmeier, T. Model-Based Soil Trip Rollover Prediction Using Driving Dynamics. In Sustainable Automotive Technologies 2012; Springer: Berlin/Heidelberg, Germany, 2012; pp. 363–372. [Google Scholar]
- Shi, Y.; Nusholtz, G.S. Simple Models for Analysis of Curb- and Soil-trip Rollover Events. SAE Tech. Pap. Ser. 2006, 653–668. [Google Scholar] [CrossRef]
- Elassad, Z.E.A.; Mousannif, H.; Al Moatassime, H. Class imbalanced crash prediction based on real time traffic and weather data: A driving simulator study. Traffic Inj. Prev. 2020, 21, 201–208. [Google Scholar] [CrossRef] [PubMed]
- Zou, Y.; Zhang, Y.; Cheng, K. Exploring the Impact of Climate and Extreme Weather on Fatal Traffic Accidents. Sustainability 2021, 13, 390. [Google Scholar] [CrossRef]
- Ikhsan, N.; Saifizul, A.; Ramli, R. Experimental validation of vehicle dynamic characteristics of a virtual heavy vehicle model. J. Mech. Eng. 2017, 4, 131–143. [Google Scholar]
- Jabatan Keselamatan Jalan Raya Malaysia. Road Safety Plan Malaysia 2014–2020; Jabatan Keselamatan Jalan Raya: Putrajaya, Malaysia, 2014.
- Saifizul, A.; Yamanaka, H.; Karim, M.R. Empirical analysis of gross vehicle weight and free flow speed and consideration on its relation with differential speed limit. Accid. Anal. Prev. 2011, 43, 1068–1073. [Google Scholar] [CrossRef]
- Aziza, R.S.R.A.; Karim, M.R.; Saifizul, A.; Yamanaka, H. The effect of gross vehicle weight on platoon speed and size characteristics on two-lane road. In Proceedings of the International Conference on Innovative Trends in Multidisciplinary Academic Research, Istanbul, Turkey, 20–21 October 2014. [Google Scholar]
- Kordani, A.A.; Rahmani, O.; Nasiri, A.S.A.; Boroomandrad, S.M. Effect of Adverse Weather Conditions on Vehicle Braking Distance of Highways. Civ. Eng. J. 2018, 4, 46. [Google Scholar] [CrossRef] [Green Version]
- Green, S.D. Prevent Heavy Truck Rollover. In Traffic Safety (Chicago); National Safety Council: Itasca, IL, USA, 2002; Volume 2. [Google Scholar]
- McKnight, A.J.; Bahouth, G.T. Analysis of Large Truck Rollover Crashes. Traffic Inj. Prev. 2009, 10, 421–426. [Google Scholar] [CrossRef]
- Karim, M.R.; Saifizul, A.; Yamanaka, H.; Ramli, R. Degree of vehicle overloading and its implication on road safety in developing countries. J. Civ. Environ. Res. 2013, 3, 20–31. [Google Scholar]
- Elischer, M.; Prem, H. Stability of Over–Height Low-Density Freight Vehicles and its Prediction. In Proceedings of the 5th International Symposium on Heavy Vehicle Weights and Dimensions, Queensland, Australia, 29 March–2 April 1998. [Google Scholar]
- Jones, E.R.; Childers, R.L. Contemporary College Physics; McGraw Hill: New York, NY, USA, 2001. [Google Scholar]
- Yang, J.-D.; Chen, Y.-K.; Shi, Q.; Li, Y.-M.; Wang, F.-C.; Zhu, L. Variable Speed Limits on Circular Curved Road Sections under Various Weather Conditions. In Proceedings of the 15th COTA International Conference of Transportation Professionals, Beijing, China, 25–27 July 2015; pp. 3242–3253. [Google Scholar] [CrossRef]
- Permanent International Association of Road Congress. Road Safety Manual: Recommendations from the World Road Association; Route2 Market: Boston, MA, USA, 2003. [Google Scholar]
- Olofsson, M.; Pettersson, J. Parameterization and Validation of Road and Driver Behavior Models for CarMaker Simulations and Transmission HIL-Rig. Master’s Thesis, Chalmers University of Technology, Goteborg, Sweden, 2015. [Google Scholar]
- Li, H.; Zhao, Y.; Wang, H.; Lin, F. Design of an improved predictive LTR for rollover warning systems. J. Braz. Soc. Mech. Sci. Eng. 2017, 39, 3779–3791. [Google Scholar] [CrossRef]
- Tsourapas, V.; Piyabongkarn, D.; Williams, A.C.; Rajamani, R. New method of identifying real-time Predictive Lateral load Transfer Ratio for rollover prevention systems. In Proceedings of the 2009 American Control Conference, Saint Louis, MO, USA, 10–12 June 2009; pp. 439–444. [Google Scholar]
- Eboli, L.; Mazzulla, G.; Pungillo, G. Combining speed and acceleration to define car users’ safe or unsafe driving behaviour. Transp. Res. Part C Emerg. Technol. 2016, 68, 113–125. [Google Scholar] [CrossRef]
- Farmer, C.M.; Lund, A.K. Rollover risk of cars and light trucks after accounting for driver and environmental factors. Accid. Anal. Prev. 2002, 34, 163–173. [Google Scholar] [CrossRef]
- Reymond, G.; Kemeny, A.; Droulez, J.; Berthoz, A. Role of Lateral Acceleration in Curve Driving: Driver Model and Experiments on a Real Vehicle and a Driving Simulator. Hum. Factors J. Hum. Factors Ergon. Soc. 2001, 43, 483–495. [Google Scholar] [CrossRef] [PubMed]
- Ryu, Y.I.; Kang, D.O.; Heo, S.J.; In, J.H. Rollover mitigation for a heavy commercial vehicle. Int. J. Automot. Technol. 2010, 11, 283–287. [Google Scholar] [CrossRef]
Figure 1.
Validation graph of lateral acceleration against distance travel of two-axle SUT [25].
Figure 1.
Validation graph of lateral acceleration against distance travel of two-axle SUT [25].

Figure 2.
Flowchart of the heavy vehicle simulation process using IPG TruckMaker(R).

Figure 3.
Pictures showing the different types of heavy vehicles used in the simulations: (a) single unit truck (SUT), (b) single truck-trailer (STT).
Figure 3.
Pictures showing the different types of heavy vehicles used in the simulations: (a) single unit truck (SUT), (b) single truck-trailer (STT).

Figure 4.
Road geometry generated in IPG TruckMaker(R).

Figure 5.
The flow of screening of data procedure in MATLAB.

Figure 6.
The number of unsafe conditions for all vehicle class, arranged by (a) heavy vehicle speed, (b) coefficient of friction and (c) cornering radius.
Figure 6.
The number of unsafe conditions for all vehicle class, arranged by (a) heavy vehicle speed, (b) coefficient of friction and (c) cornering radius.

Figure 7.
The two-axle SUT leaves the drive lane during cornering (tripped rollover).

Figure 8.
Maximum lateral acceleration vs. speed for two-axle SUTs, when maneuvering at r = 150 m, GVW = (a) 10,000 kg, (b) 15,000 kg, (c) 20,000 kg, (d) 25,000 kg, (e) 30,000 kg, (f) 35,000 kg.
Figure 8.
Maximum lateral acceleration vs. speed for two-axle SUTs, when maneuvering at r = 150 m, GVW = (a) 10,000 kg, (b) 15,000 kg, (c) 20,000 kg, (d) 25,000 kg, (e) 30,000 kg, (f) 35,000 kg.

Figure 9.
Maximum lateral acceleration vs. speed for two-axle SUTs, when maneuvering at r = 200 m, GVW = (a) 10,000 kg, (b) 15,000 kg, (c) 20,000 kg, (d) 25,000 kg, (e) 30,000 kg, (f) 35,000 kg.
Figure 9.
Maximum lateral acceleration vs. speed for two-axle SUTs, when maneuvering at r = 200 m, GVW = (a) 10,000 kg, (b) 15,000 kg, (c) 20,000 kg, (d) 25,000 kg, (e) 30,000 kg, (f) 35,000 kg.

Figure 10.
Maximum lateral acceleration vs. speed for two-axle SUTs, when maneuvering at r = 250 m, GVW = (a) 10,000 kg, (b) 15,000 kg, (c) 20,000 kg, (d) 25,000 kg, (e) 30,000 kg, (f) 35,000 kg.
Figure 10.
Maximum lateral acceleration vs. speed for two-axle SUTs, when maneuvering at r = 250 m, GVW = (a) 10,000 kg, (b) 15,000 kg, (c) 20,000 kg, (d) 25,000 kg, (e) 30,000 kg, (f) 35,000 kg.

Figure 11.
Average maximum lateral acceleration against heavy vehicle speed for SUTs. (a) 2-axle, r = 150 m. (b) 2-axle, r = 200 m. (c) 2-axle, r = 250 m. (d) 3-axle, r = 150 m. (e) 3-axle, r = 200 m. (f) 3-axle, r = 250 m. (g) 4-axle, r = 150 m. (h) 4-axle, r = 200 m. (i) 4-axle, r = 250 m.
Figure 11.
Average maximum lateral acceleration against heavy vehicle speed for SUTs. (a) 2-axle, r = 150 m. (b) 2-axle, r = 200 m. (c) 2-axle, r = 250 m. (d) 3-axle, r = 150 m. (e) 3-axle, r = 200 m. (f) 3-axle, r = 250 m. (g) 4-axle, r = 150 m. (h) 4-axle, r = 200 m. (i) 4-axle, r = 250 m.


Figure 12.
Average maximum lateral acceleration against heavy vehicle speed for STTs. (a) 4-axle, r = 150 m. (b) 4-axle, r = 200 m. (c) 4-axle, r = 250 m. (d) 5-axle, r = 150 m. (e) 5-axle, r = 200 m. (f) 5-axle, r = 250 m.
Figure 12.
Average maximum lateral acceleration against heavy vehicle speed for STTs. (a) 4-axle, r = 150 m. (b) 4-axle, r = 200 m. (c) 4-axle, r = 250 m. (d) 5-axle, r = 150 m. (e) 5-axle, r = 200 m. (f) 5-axle, r = 250 m.


Table 1.
Values of RMSE, MAE and R for experimental and simulation data for lateral acceleration.
| Output | RMSE | MAE | R |
|---|---|---|---|
| Lateral acceleration | 0.0445 | 0.0325 | 0.7797 |
Table 2.
Summary of independent parameters used in the simulation settings.
| Category | Heavy Vehicle Characteristics | Environment and Road Factor | Other Parameters |
|---|---|---|---|
| Details | Heavy vehicle class | Cornering radius | Corner cutting value |
| Heavy vehicle speed | Road friction | Driver behavior | |
| Gross vehicle weight (GVW) | Super-elevation | Selected drive lane |
Table 3.
Summary of heavy vehicle settings (speed and gross vehicle weight, GVW) used in the simulation.
Table 3.
Summary of heavy vehicle settings (speed and gross vehicle weight, GVW) used in the simulation.
| Type | No of Axles | Max GVW in kg * | Speed (km/h) |
|---|---|---|---|
| SUT | 2 | 35,000 | Varied starting from 40 km/h to 120 km/h (with intervals of 10 km/h) |
| 3 | 57,000 | ||
| 4 | 71,000 | ||
| STT | 4 | 71,000 | |
| 5 | 86,000 |
* GVW is added starting from curb weight until max GVW with interval of 5 t.
Table 4.
Selected simulation results for two-axle SUTs maneuvered at cornering radius of 150 m, CoF of 0.3, GVW of 10,000 kg and 15,000 kg at various speeds.
Table 4.
Selected simulation results for two-axle SUTs maneuvered at cornering radius of 150 m, CoF of 0.3, GVW of 10,000 kg and 15,000 kg at various speeds.
| Input/Variables | Output/Dependent Value | Test Result | ||
|---|---|---|---|---|
| Heavy Vehicle Type | GVW (kg) | Speed (km/h) | Maximum Lateral Acceleration (ms−2) | |
| 2-axle SUT | 10,000 | 40 | 0.87 | Pass |
| 50 | 1.36 | Pass | ||
| 60 | 1.56 | Pass | ||
| 70 | 2.07 | Pass | ||
| 80 | 2.65 | Failed | ||
| 90 | 2.90 | Failed | ||
| 100 | 2.96 | Failed | ||
| 110 | 3.08 | Failed | ||
| 120 | 3.27 | Failed | ||
| 15,000 | 40 | 0.87 | Pass | |
| 50 | 1.36 | Pass | ||
| 60 | 1.86 | Pass | ||
| 70 | 2.27 | Pass | ||
| 80 | 2.85 | Failed | ||
| 90 | 3.08 | Failed | ||
| 100 | 3.22 | Failed | ||
| 110 | 3.30 | Failed | ||
| 120 | 3.50 | Failed | ||
Table 5.
The number and percentage of unsafe and safe conditions for all types of heavy vehicles.
| Vehicle Class | Frequency | Safe Condition | Unsafe Condition | Total no. of Simulations |
|---|---|---|---|---|
| Two-axle SUT | No. of sim. | 644 | 436 | 1080 |
| % | 60% | 40% | 100% | |
| Three-axle SUT | No. of sim. | 1014 | 471 | 1485 |
| % | 68% | 32% | 100% | |
| Four-axle SUT | No. of sim. | 1282 | 473 | 1755 |
| % | 73% | 27% | 100% | |
| Four-axle STT | No. of sim. | 1348 | 407 | 1755 |
| % | 77% | 23% | 100% | |
| Five-axle STT | No. of sim. | 1620 | 540 | 2160 |
| % | 75% | 25% | 100% |
Table 6.
The number and percentage of tripped and un-tripped rollovers for all types of heavy vehicles.
Table 6.
The number and percentage of tripped and un-tripped rollovers for all types of heavy vehicles.
| Vehicle Class | Frequency | Tripped Rollover | Un-Tripped Rollover | Total no. and Percentage of Unsafe Conditions |
|---|---|---|---|---|
| Two-axle SUT | No. of sim. | 285 | 151 | 436 |
| % | 65% | 35% | 100% | |
| Three-axle SUT | No. of sim. | 294 | 177 | 471 |
| % | 62% | 38% | 100% | |
| Four-axle SUT | No. of sim. | 325 | 148 | 473 |
| % | 69% | 31% | 100% | |
| Four-axle STT | No. of sim. | 315 | 92 | 407 |
| % | 77% | 23% | 100% | |
| Five-axle STT | No. of sim. | 387 | 153 | 540 |
| % | 72% | 28% | 100% |
Table 7.
Determination of mean maximum lateral acceleration for two-axle vehicles driven at 40 km/h, with CoF of 0.3 and cornering radius of 150 m.
Table 7.
Determination of mean maximum lateral acceleration for two-axle vehicles driven at 40 km/h, with CoF of 0.3 and cornering radius of 150 m.
| No | GVW (kg) | Speed (km/h) | Coe. of Friction | Cornering Radius (m) | Maximum Lateral Acceleration (m/s2) |
|---|---|---|---|---|---|
| 1 | 10,000 | 40 | 0.3 | 150 | 0.872 |
| 2 | 15,000 | 0.874 | |||
| 3 | 20,000 | 0.880 | |||
| 4 | 25,000 | 0.881 | |||
| 5 | 30,000 | 0.883 | |||
| 6 | 35,000 | 0.892 | |||
| Mean maximum lateral acceleration = 0.880 (plotted in graph) |
Table 8.
Output of Pearson correlation analysis conducted on SPSS for two-axle SUTs.
| Correlations | ||||||
|---|---|---|---|---|---|---|
| Max. Lateral Acceleration (m/s2) | HV Speed (km/h) | GVW (Tonne) | Coefficient of Friction | Curve Radius (m) | ||
| Max. Lateral Acceleration (m/s2) | Pearson Correlation | 1 | ||||
| Sig. (2-tailed) | ||||||
| N | 1080 | |||||
| HV speed (km/h) | Pearson Correlation | 0.873 | 1 | |||
| Sig. (2-tailed) | 0.000 | |||||
| N | 1080 | 1080 | ||||
| GVW (tonne) | Pearson Correlation | 0.352 | 0.000 | 1 | ||
| Sig. (2-tailed) | 0.000 | 1.000 | ||||
| N | 1080 | 1080 | 1080 | |||
| Coefficient of friction | Pearson Correlation | −0.346 | 0.000 | 0.000 | 1 | |
| Sig. (2-tailed) | 0.000 | 1.000 | 1.000 | |||
| N | 1080 | 1080 | 1080 | 1080 | ||
| Curve Radius (m) | Pearson Correlation | −0.214 | 0.000 | 0.000 | 0.000 | 1 |
| Sig. (2-tailed) | 0.000 | 1.000 | 1.000 | 1.000 | ||
| N | 1080 | 1080 | 1080 | 1080 | 1080 | |
Table 9.
Output of Pearson correlation analysis conducted on SPSS for all heavy vehicle classes.
| Correlations | ||||||
|---|---|---|---|---|---|---|
| Max. Lateral Acceleration (m/s2) | HV Speed (km/h) | GVW (Tonne) | Coefficient of Friction | Curve Radius (m) | ||
| Max. Lateral Acceleration (m/s2) | Pearson Correlation | 1 | ||||
| Sig. (2-tailed) | ||||||
| N | 8235 | |||||
| HV speed (km/h) | Pearson Correlation | 0.853 | 1 | |||
| Sig. (2-tailed) | 0.000 | |||||
| N | 8235 | 8235 | ||||
| GVW (tonne) | Pearson Correlation | 0.373 | 0.000 | 1 | ||
| Sig. (2-tailed) | 0.000 | 1.000 | ||||
| N | 8235 | 8235 | 8235 | |||
| Coefficient of friction | Pearson Correlation | −0.341 | 0.000 | 0.000 | 1 | |
| Sig. (2-tailed) | 0.000 | 1.000 | 1.000 | |||
| N | 8235 | 8235 | 8235 | 8235 | ||
| Curve Radius (m) | Pearson Correlation | −0.214 | 0.000 | 0.000 | 0.000 | 1 |
| Sig. (2-tailed) | 0.000 | 1.000 | 1.000 | 1.000 | ||
| N | 8235 | 8235 | 8235 | 8235 | 8235 | |
Publisher’s Note: MDPI stays neutral with regard to jurisdictional claims in published maps and institutional affiliations. |
© 2021 by the authors. Licensee MDPI, Basel, Switzerland. This article is an open access article distributed under the terms and conditions of the Creative Commons Attribution (CC BY) license (https://creativecommons.org/licenses/by/4.0/).
Share and Cite
MDPI and ACS Style
Ikhsan, N.; Saifizul, A.; Ramli, R. The Effect of Vehicle and Road Conditions on Rollover of Commercial Heavy Vehicles during Cornering: A Simulation Approach. Sustainability 2021, 13, 6337. https://doi.org/10.3390/su13116337
AMA Style
Ikhsan N, Saifizul A, Ramli R. The Effect of Vehicle and Road Conditions on Rollover of Commercial Heavy Vehicles during Cornering: A Simulation Approach. Sustainability. 2021; 13(11):6337. https://doi.org/10.3390/su13116337
Chicago/Turabian StyleIkhsan, Nurzaki, Ahmad Saifizul, and Rahizar Ramli. 2021. "The Effect of Vehicle and Road Conditions on Rollover of Commercial Heavy Vehicles during Cornering: A Simulation Approach" Sustainability 13, no. 11: 6337. https://doi.org/10.3390/su13116337
Note that from the first issue of 2016, this journal uses article numbers instead of page numbers. See further details here.