
The Sustainability of Waste Management Models in Circular Economies


1
Escuela Técnica Superior de Ingeniería de Montes, Forestal y del Medio Natural, Universidad Politécnica de Madrid, c/José Antonio Novais 10, 28040 Madrid, Spain
2
Departamento Economía de la Empresa (ADO), Economía Aplicada II y Fundamentos Análisis Económico, Universidad Rey Juan Carlos, Paseo de los Artilleros s/n, Vicálvaro, 28032 Madrid, Spain
*
Author to whom correspondence should be addressed.
Sustainability 2021, 13(13), 7105; https://doi.org/10.3390/su13137105
Submission received: 14 April 2021
/
Revised: 11 May 2021
/
Accepted: 14 May 2021
/
Published: 24 June 2021
(This article belongs to the Topic Industrial Engineering and Management)
Abstract
:The circular economy (CE) is considered a key economic model to meet the challenge of sustainable development. Strenous efforts are focused on the transformation of waste into resources that can be reintroduced into the economic system through proper management. In this way, the linear and waste-producing value chain problems are solved, making them circular, and more sustainable solutions are proposed in those chains already benefiting from circular processes, so that waste generation and waste are reduced on the one hand, and on the other, the non-efficient consumption of resources decreases. In the face of this current tide, there is another option that proposes a certain nuance, based on the premise that, although circular systems promote sustainability, it does not mean that they are in themselves sustainable, given that, in the first place, the effects of CE on sustainable development are not fully known and, on the other hand, the CE model includes the flow of materials, with only scant consideration of the flow of non-material resources (water, soil and energy). This paper aims to contrast both currents from an empirical viewpoint. To achieve this, a sustainability analysis of the circular waste management systems measured through a sustainability indicator, the carbon footprint (CF), as a main sustainable indicator in climate change action, is carried out. A crucial difference between circular models that promote waste management and those that do not is found in the collective systems of extended producer responsibility (or CPR). One of the most efficient recycling processes in Europe, waste tire management, has been chosen. Thus, the aim is to verify the sense of including environmental sustainability indicators, as CF, in the process of these systems. A sustainability management model (SBA) applies to End-of Life tire collection systems (ELT). This model is based on the accumulation of environmental impacts through the activities that generate them. To be transparent, this study requires a publicly recognized CF, so the study is focused on SIGNUS, the main Spanish waste tires CPR. The results achieved allow us to conclude that CF is much lower using CPR than non-linear processes. Despite the role that CPR have in the management and use of waste as secondary raw material, it is a priority to focus efforts on their redesign in order to reduce waste. In terms of circular economy, all actions are necessary in order to achieve system efficiencies, even when externalities occur in this process.
1. Introduction
Circular economy (‘CE’) emerged as an “umbrella” concept in 2010 in order to create an economic system in which the use of resources is more efficient [1]. It pursues the circularization of productive processes; the creation of closed cycles of materials and energy flows [2,3]. Certain authors, according to Sauvé et al., considered that the CE might become the tool for sustainable development [4]. That is why all the stakeholders involved—governments, investors, companies and civil society—display growing interest in its promotion [5,6]. This interest scant bearing on the economic and environmental dimensions [5]. Not all systems that introduce circular principles, encourage circularity or are part of circularity are necessarily more sustainable in all areas [7]. The processes to reincorporate reused and/or recycled materials under the concept of CE have economic and environmental impacts on the environment. CE is viewed as a promoter of sustainable development [8] and others view clearly its link with sustainable development [6]. There are authors who go beyond this and maintain that CE is a conditional concept for sustainability [5], which requires a change in the manner of generating value, understanding and making business or management models [9]. In this sense, the proposal of circular integration of the processes of industrial symbiosis [10] may be the alternative to the change that is requested for a new development model, linked to the strategies to create sustainable business models.
Although Moraga et al. argue that the effects of CE on the economy, society and the natural environment should be considered, their relationship is still complex and its effect on sustainable development is not yet well documented [11]. Even so, the CE defines and identifies the circularity of materials, components and products through waste management processes [11]: prevention, reuse preparation, recycling, other recovery and disposal/landfill [12,13]. Elia et al. and Geng et al. add that the assessment of CE must include the use of renewable energy, water and land [14,15], although the lack of consideration of non-material flows is one of CE’s critical points [11]. In order to incorporate them, indicators should be identified or found that allow the CE’s progress to be checked. Although the CE focuses on design and circularization processes of open or traditional production lines, much of the efforts at all levels are made in the management of waste generated: being able to manage it properly implies the inclusion of new systems that classify, redirect or innovate in its reduction.
CE must be assessed from a long-term outlook and incorporated into all industrial processes, as it is portrayed as the new disruptive element to create new economic development systems that encourage the regeneration of current development networks through the change in design and production structures [16,17]. Furthermore, it has been estimated that eco-design, prevention and reuse can generate savings for European companies of more than €600 million [18].
Against this backdrop, a study is proposed to ascertain the environmental impact of the processes involved in waste management, centralized in Collective System of Extended Producer Responsibility System companies (hereinafter, CPR). These kinds of organizations have been adopted in many EU member states for different products, including vehicle waste tires, which have the highest rate of recycling product (94%) [19].
To achieve this, we have chosen as a sustainability indicator the carbon footprint (hereinafter, CF) owing to its relationship with the concept of life cycle thinking, its massive use by companies as an indicator of sustainability, the existence of standardized methods for its measurement and the existence of official public records in which the results can be recorded. They also have to undergo a minimum verification process by the public authority that manages them [20]. Alongside this aspect, this indicator will not only allow us to ascertain the greenhouse gas (hereinafter, GHG) emissions generated by these processes but will also provide us with information on the origin, nature, renewability or not, and consumption of the energy resources used in these processes, aspects relevant to the concept of CE for sustainable development [6,21]. In this way, it is determined how the waste management processes are sustainable in the context of the EC, through the calculation of one of the environmental sustainability indicators, CF, including non-material flows of waste circularization.
The main purpose of this work is to show that eco-design and waste management are complementary and necessary. The first reduces in origin the waste while the second allows a circularization of the economy.
To do so, we critically examine the organization and performance of an existing CPR in terms of one sustainability indicator, the carbon footprint, to reflect the need of further holistic research. Based on this, we examine the question “how much emissions a CPR produces to close the loop of current Extended Producer Responsibility Systems (EPR) from the current ambitions of CE?”.
To accomplish the above, the following steps must be taken: (1) analysis of the extended product producer waste management systems (CPR) from a CE perspective; (2) determination to what extent CPR are sustainable, in terms of CF. To achieve this, an activity-based sustainability management model, the SBA model, will be applied [22]. Since it is intended to analyze the environmental impact generated by CPR in their tire waste management process, it is necessary to focus on those ones that have calculated their carbon footprint by applying ISO 14064-1 and ISO 14069 standards for the establishment of inventory and classification of GHG emissions and, in addition, they do so in a transparent manner, by registering said indicator in public records. Given that of the countries that manage more end-of-life tires (ELT), only Spain has this public and accessible registry, we will focus the analysis on those CPR that have their carbon footprint registered in said registry.
In the following section, a bibliographic review is carried out on CE models, waste management and collective systems of extended producer responsibility (CPR)focused on ELT and its involvement in climate change and sustainable development, through the environmental sustainability indicator, the carbon footprint. In the third section, the activity-based sustainable management model, SBA model, to determine the environmental sustainability of a CPR is explained through its application in the management of end-of-life tires from a climate change perspective. Finally, the conclusions and future proposals of this research paper will be unveiled.
2. State of the Art
2.1. The Circular Economy as a Model to Achieve Sustainable Development
The sustainable development (SD) construct, as defined in the Brundtland Report, has been the lever of change towards a different economic growth model, focused on “not (…) damaging the natural system that supports life on Earth: the atmosphere, water, soils and the living beings” [23,24]. Serageldin broadens the concept as “the search for the improvement of human well-being and social sustainability by protecting the sources of raw materials used to cover human needs [24]. Furthermore, it must be ensured that human waste does not exceed storage locations. Humans should learn to live with the biological and physical limitations that the natural environment imposes on them.” This limit is called the “planetary limit”, a conceptual framework where nine fundamental processes are described to allow the stability of the Earth system. These must be between certain thresholds to maintain the habitability of the planet, meaning that if they are exceeded, human development is endangered [25]. According to Rockström et al., these limits are widely accepted as the basis for sustainable global development from an environmental perspective [26,27]. These concepts include the biosphere as the framework in which the satisfaction of human needs must be considered through economic models yet considering the biosphere as a fundamental element.
Circular economy may be the central development model [28] that proposes solutions to the environmental challenges of the 21st century and promotes sustainable development [29]. Yet in turn, the insertion of social and environmental aspects into economic progress has become a key element [6,30].
Suarez-Eiroa et al. suggest that “the aspiration of the CE from the perspective of sustainable development should decouple economic development from the use of finite resources and the generation of waste and emissions by maintaining extraction ratios of resources and the ratios of generation of waste and emissions below planetary limits” [21].
Circular economy’s aim is to achieve sustainability through closed cycles to accomplish the balance between economic valuation, social inclusiveness and environmental resilience [5]. It focuses on the proposal of transformation of energy and material flows used to generate economic value, from a linear system to a circular system inspired by the concept of sustainable development [28]. In this sense, the most commonly accepted concept of CE on the part of professionals and companies is that proposed by Mihelcic et al., which introduces the phases of reuse, remanufacturing and recycling of materials, components and products when they have reached the end of their use or the end of their useful life, whose original economic value has already been lost [29]. The incorporation of these phases implies a decrease in the demand for resources.
This forces the development of socially desirable and efficient “circles” [30]. Circular economy has its effects included in the reintroduction of the flow of materials, but should include their economic, environmental and social effects. Furthermore, the effects of CE on sustainable development are still not properly documented [5]. Geissdoerfer et al. state that the relationship between CE and sustainable development is conditional, beneficial and compensatory, which may have different results than the aims set forth by this new development model [11]. Another highly criticized aspect of CE is the low consideration of non-material flows: energy, water and soil [14,15,31]. Essential elements for the implementation of CE are as presented in the model of Mihelcic et al. [29]. On the other hand, Geissdoerfer et al. say that CE promotes sustainability, thus not implying that the circular systems are sustainable [7].
Under this paradigm, Korhonen et al. propose the CE as “a sustainable development initiative with the aim of reducing the social systems of production–consumption of materials and energy of linear performance by the application of circular, renewable materials and cascading energy flows. Circular economy promotes circular materials of great value at the same time as the traditional recycling and development of new systems aimed at cooperation between producers, consumers and other social stakeholders to work on sustainable development” [28].
In this line is the concept proposed by Walmsley et al. of circular integration (CI) for the design of sustainable systems [32]: “CI in a holistic approach to the planning of circular systems, where the designs, operations and maintenance of each subsystem encompasses multiple scales and dimensions them to maximize total sustainability”. Linked to ‘life cycle thinking’ “is the ability to see products and services beyond the design, production, consumption, use and disposal cycle to include their interactions with sustainability” [11].
Drawing on CE’s potential, Korhonen et al. have identified six limitations in the practical application of this concept of CE [18]: (1) thermodynamic limits; (2) spatial and temporal limits of the system; (3) limits derived from the physical scale of the economy; (4) limits set by the dependence on market positioning; (5) governance and management limits and (6) limits imposed by cultural and social definitions. The foregoing affects the application of material cycles, renewable energy and cascading energy flows of production–consumption systems. Converting linear material flows into other circular aspects could be also affected by incremental costs [6]. Millar et al. state that CE is the model for sustainable development, but it features the same barriers and challenges as the linear economy: biophysical barriers of the natural environment, economic growth and social equity [29].
These limitations, in our opinion, can be grouped into three areas linked to the seven ‘R’s’ of CE: (1) modification of the value-innovation proposal focused on product design and production systems; (2) reduction of impacts on sustainability based on management of the resources introduced in the manufacturing process and of the waste generated throughout the life cycle; and (3) governance (political, social and cultural). The first two items must be treated from a sustainable perspective, since both produce economic, social and environmental impacts [6].
The seven ‘R’s’ are related to three strategies to address CE [3]: (1) use fewer resources in the processes to generate less waste; (2) lengthen the product use phase; and (3) introduce recycling process to introduce recycled resources. These strategies comply with the five principles of CE [10]: (1) design out waste, (2) build resilience through diversity; (3) reliance on renewable energy; (4) residue as a foodstuff; and (5) ecosystem thinking or thinking about systems. Bocken et al. in their case study determine that the creation of an innovative product for circularity is directly related to an innovative business model [3].
2.2. Waste Management
The essence of CE is to reduce in order to decouple the economic growth of natural resource consumption [33,34,35]. To achieve this, it is necessary to reduce material consumption and minimize waste generation [12].
Waste generation is currently a highly serious issue. By 2050, waste levels will double. Rubbish is generated faster than other environmental pollutants, including GHG emissions [36]. According to the World Bank the generation of global solid waste will triple in the year 2100, due to [37]: (1) increase in consumption directly related to world population growth, and (2) to the linear system of industrialization, which is still under transformation into a circular system [38].
This situation generates an unsustainable situation affecting the three pillars: environmentally, the generation of solid waste has a significant impact with a sizeable global footprint and is directly related to problems of soil, water and air pollution [39,40]. If the social impact is analyzed, solid waste poses a significant risk to the population’s health [41]. From an economic viewpoint, the generation of waste involves elevated management costs, of USD 205.4 per ton [42]. Thus, researchers such as Zhang et al., Huang et al. and Liu et al. have focused their studies on waste reduction, since it contributes to the reduction of use of natural resources and reduces environmental pollution [43,44,45].
Therefore, the reduction of waste through its transformation into new resources is a priority. Waste management is in the 2030 Agenda for Sustainable Development with its inclusion in the SDG “Responsible Production and Consumption” in goal 12.5, which is to “considerably reduce the generation of waste through activities based on prevention, reduction, recycling and reuse” [46].
There are currently structures for waste management backed by international and national regulations. This allows the identification of essential operations for waste management and prioritized, in descending order of importance, as follows [13]: prevention, reuse preparation, recycling, other recovery (including energy use) and disposal/landfill. This hierarchical structure for waste management is directly related to the CE concept of Mihelcic et al. and is endorsed by the EU Circular Economy Strategy COM/2015/0614 [29]. Although the general priority is prevention, EU policies have focused their objectives preferably on reuse and recycling versus prevention [47], which takes shape, for example, in the proposal of a 70% waste recycling and reuse rate by 2030 [48].
This prioritization of waste management processes is shared by Korhonen et al. who, to define their CE concept, propose that products at the end of their life must first be reused, remodeled or repaired and, as applicable, if they cannot be, they must be recycled [28]. On the other hand, in line with the CE, combustion for energy must be the second option and its disposal in landfill is the last of the options because, in this way, the materials are not reintroduced into the economic system to generate other products. According to van Ewijk and Stegemann, the CE should focus on reuse and recycling to ensure that the circle of materials and energy is closed, to regenerate the use of resources. Incineration and landfill are the representation of waste from the industrial system. In our opinion, it is necessary to focus efforts to solve the problems of minimization of the waste that is currently generated, but much more should be done by the previous phases of the processes, eco-design and process rethinking, with the idea that they are much more efficient in this regard [49].
2.3. Climate Change and Waste Management
Resilience “is the ability of a system to recover its initial state when the disturbance to which it had been subjected has ceased” [50] and climate change is the disturbance of the 21st century that is leading us towards the development of sustainable activities. This step requires a great change in the way of generating value, and of understanding and devising business or management models. When change is achieved, we will become resilient [9].
Climate change is a phenomenon caused by the increase in greenhouse gas concentrations in the atmosphere derived mainly from fossil fuel combustion, deforestation, devastating agricultural developments and unsustainable industrial processes [51]. This situation implies an increase in the temperature of the planet that can degenerate causing multiple and severe risks. From an economic perspective, climate change is involved in the most important economic risks, in terms of probability and impact, identified by the World Economic Forum [52], and affects the health of people [51] and ecosystems [53]. According to the Intergovernmental Panel on Climate Change (IPCC) [54] and NASA [55], climate change affects different socioeconomic levels, the resilience and vulnerability of systems and the implementation of adaptation and mitigation options in the development of human activities
To discover how human and industrial activities affect climate change, Wiedmann and Minx defined the carbon footprint (CF) [19]. This is a sustainability indicator that measures (tonnes of CO2 equivalent—t CO2e) the climate impact of a product, service or organization in the development of its activities [56]. This indicator allows us to know how many GHG emissions are generated in the production processes and provides information on the amount of energy resources consumed to obtain the products/services.
Waste management has a major atmospheric bearing in terms of climate change. Lee et al. have set the conversion factors of CO2e to ascertain the CF generated in the manufacturing processes of different products depending on the origin of the materials used, depending on whether they are natural raw material stock or come from a process of reuse or recycling [57]. This shows how emissions from material recycling are lower than emissions from non-recycled materials. However, in the reuse and recycling processes of certain products there are elevated GHG emissions. It is worthwhile mentioning plastics, tires, paper and asphalt. The evidence is clear: waste management processes impact strongly from an environmental viewpoint. In this document, the tire valuation process will be dealt with, given the high consumption of resources both in their production and recycling and reuse processes, and since it is one of the elements that creates the most GHG in open production processes, behind plastic derivatives.
2.4. Extended Producer Responsibility
In the context of the circular economy as a tool to reduce the production of waste and the difficulty of transforming linear systems into circulars, there is the concept of extended producer responsibility (EPR). This is defined in European Directive 2008/98/CE on waste and repealing certain directives [58] transposed for Spain by Law 22/2011 on waste and contaminated soils (OFFICIAL STATE GAZETTE, 2016), which involves the producers of those products that become waste in the phases of prevention and management organization. This materializes in the definition of other phases: reuse, recycling and recovery of waste. This law also determines responsibilities in previous phases of product design and production.
The OECD considers that EPR “is a policy approach under which producers have a significant financial and/or physical responsibility for the treatment or disposal of their products beyond their consumption” [59]. It can also be defined as a system that transfers responsibility to producers for the management of the waste generated when their product is transformed into waste [60,61,62]. The aim is to generate direct economic incentives for producers to invest in the product design phase so that it is easily reusable or recyclable and durable. This generates direct economic incentives for producers to invest in the design phase of an easily reusable or recyclable product, or more durable, or more environmentally friendly, with environmental and economic benefits [63,64].
Although EPR has clear benefits from an environmental perspective, the production system has problems for producers wanting to improve product design, which depends on factors such as compensation between recyclability and durability [65]. From a legal approach, article 31 of Law 22/2011 imposes a series of obligations on manufacturers that can hinder producers’ ability to change their product design. In addition, there are other considerations [65]: (1) an ecolabel has not been identified for products from extended CE processes; (2) there is no control mechanism by the regulator for the financial compliance of the EPR nor sanctions for non-compliance, for example, withdrawal of authorizations for recyclers; and (3) it is necessary to establish a mechanism for public information on recycling, to involve consumers in the continuation of the cycle.
In order to remedy or correct these considerations, the producers that are obliged to comply with this law may opt for the constitution of non-profit entities under any legal form accepted by the law, which guarantees access to all producers and allows compliance with the aims set forth (Official State Gazette, 2016). In general, these entities are called collective producer responsibility systems (CPR).
3. Modelization of Sustainable Management of CPR: Activity Based Sustainability Model
Beyond the benefits that a CPR can provide for the management of waste generated by producers and their contribution to the environment, it must transcend towards sustainability. The behaviour of CPR must be sustainable to be resilient, and reduce the vulnerability of economic activities and natural and social systems.
To achieve this, the use of the Sustainability Model Based on Activities (SBA) is proposed. This is the basis of a proposal by Rodríguez-Olalla and Avilés-Palacios for the integration of sustainability in organizations [22]. It is a model that relates resources, activities and products/services based on the methodology of the activity-based costing (ABC) model of management accounting. The idea of the SBA model is that the activities consume resources and, in doing so, there are impacts (social, environmental or economic) that accumulate through the activities and whose impact should be disclosed. The aim of the SBA model is the generation of useful information for decision making and sustainability management in the organization [22].
The SBA model involves internal analysis of organizations and the way it relates to resources, activities, products/services results in a sustainability indicator that is incorporated into the Maas et al. model in the management of sustainable control, which will allow for the assessment of the organization’s sustainability [66]. On the other hand, it represents a breakthrough in the sustainability integration model for the performance of the Morioka and Carvalho organization [67], since the SBA model facilitates the identification and internal knowledge of the organization’s processes with regard to sustainability. In this way, an action plan that facilitates the transformation of the organization into a sustainable body can be developed.
The SBA model assigns impact ratings to whatever one wishes to analyze from a sustainability perspective, which may be a product, service, customer or market. The basis of the SBA model is to consider the activities that generate impacts and the objects of impact are those that are consumption activities. Therefore, knowing these activities will allow the organization to quantify the impacts under an internal analysis to achieve sustainability.
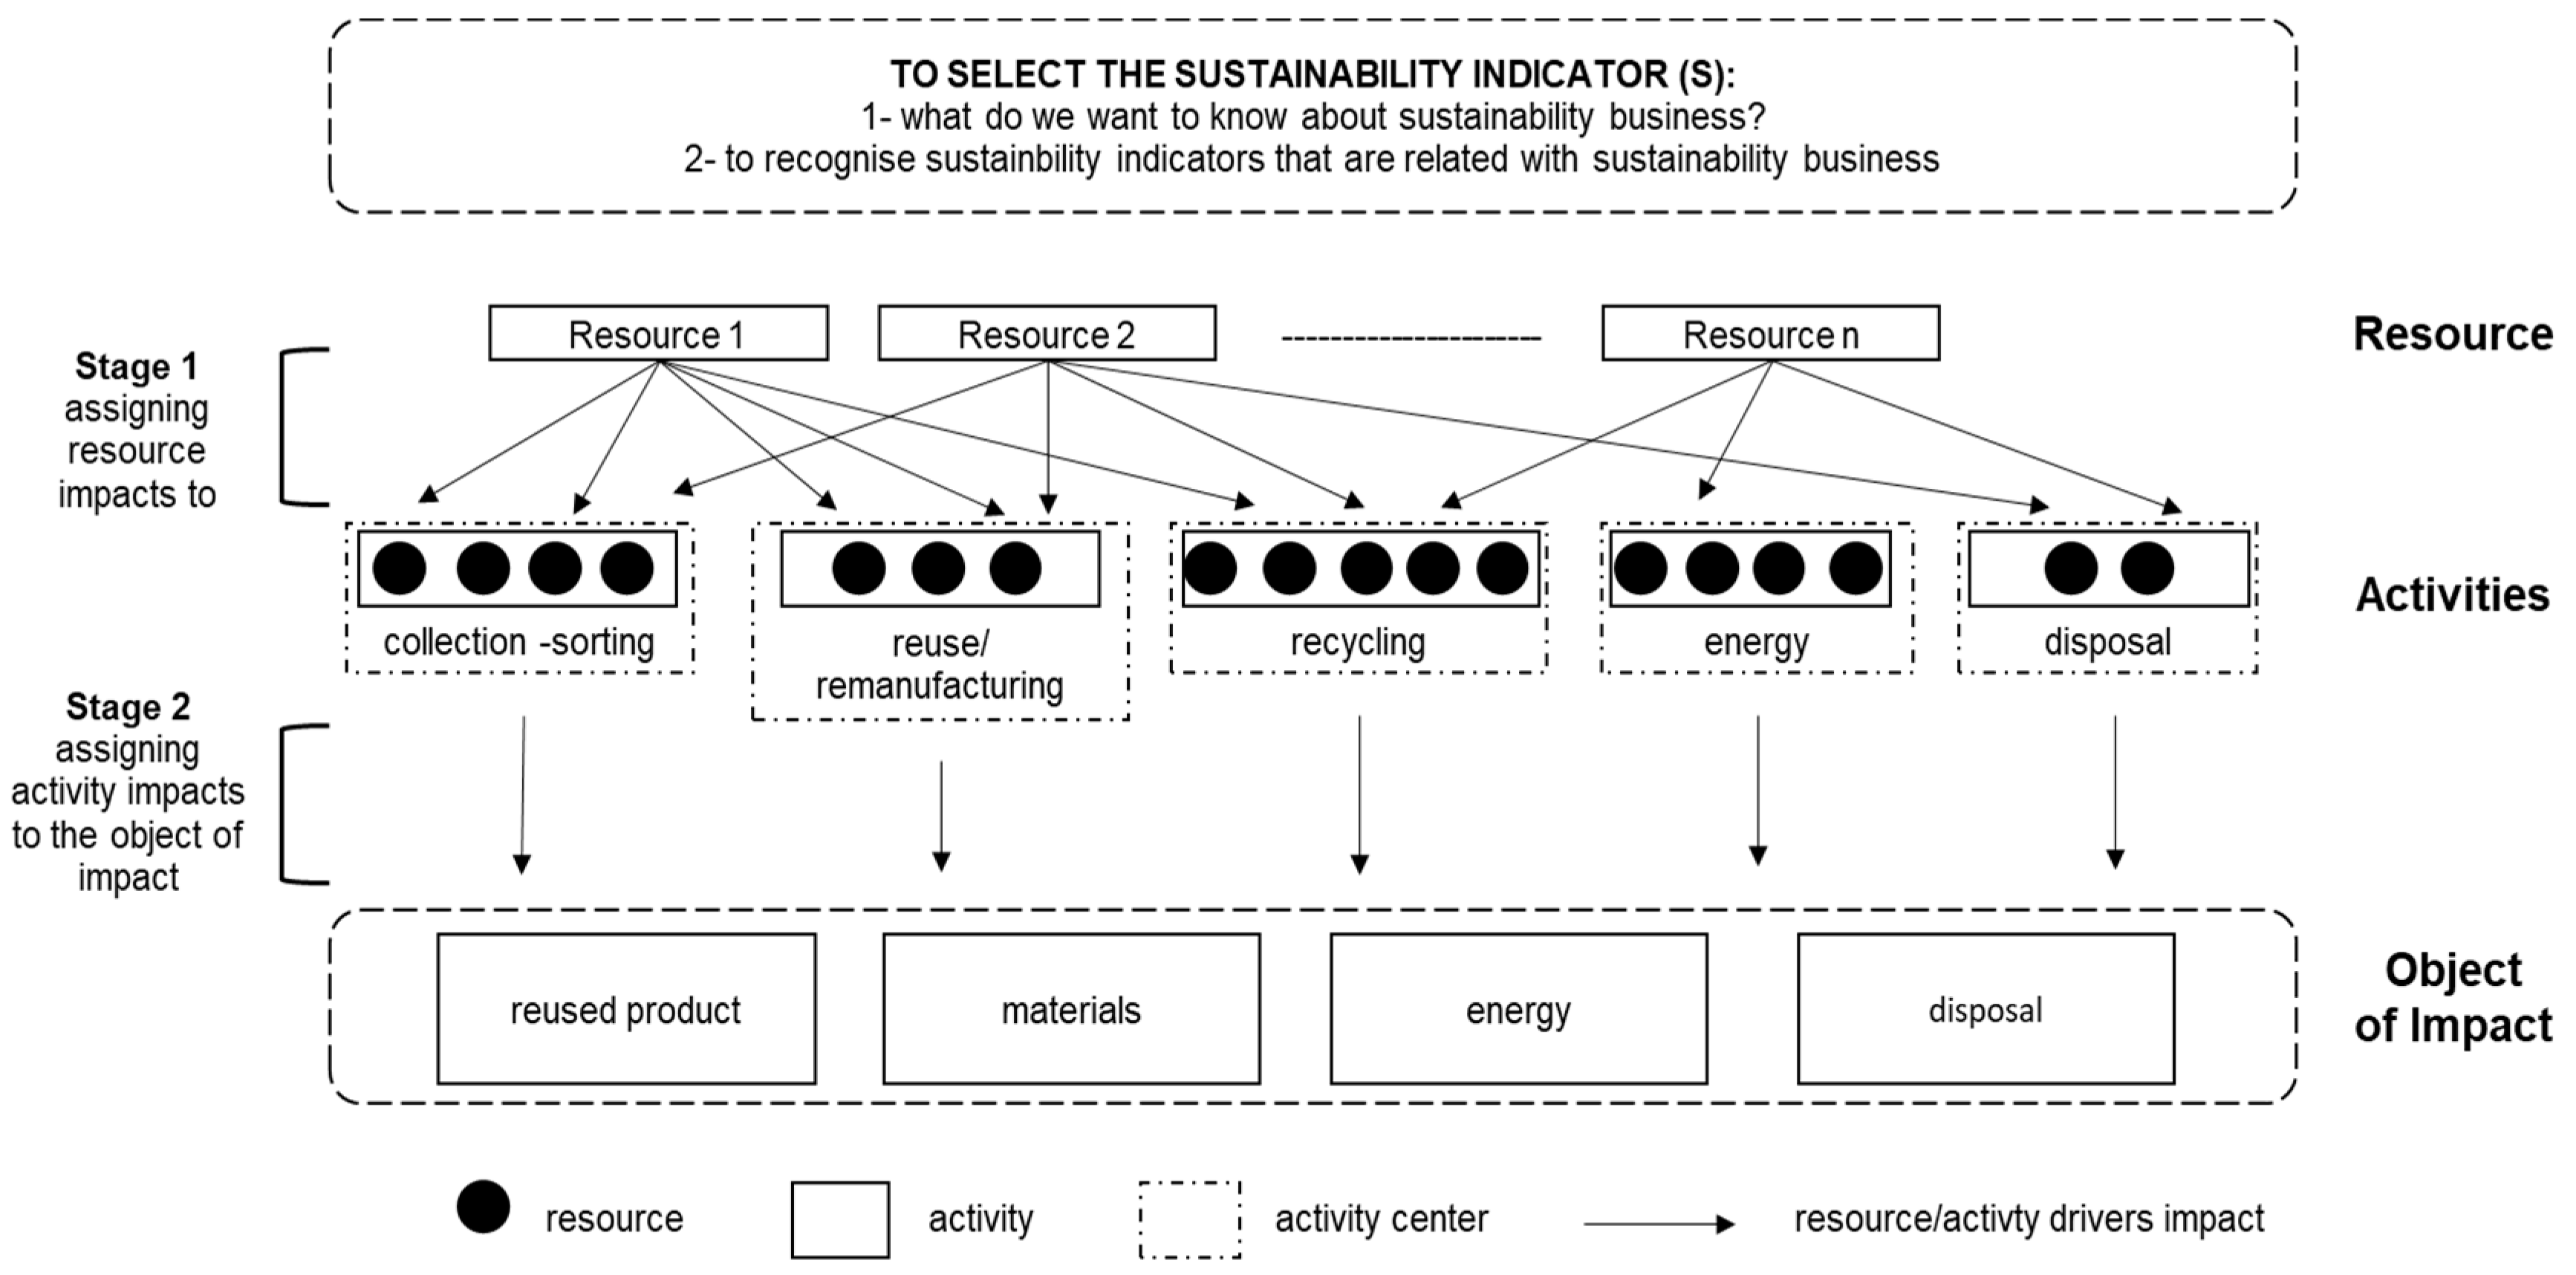
The SBA model follows the same phases as the ABC model. As this model analyzes impact and not costs, it is necessary to establish a background phase that determines the aspects of sustainability to be studied. Once chosen, the foregoing follows the same phases as the ABC model (Figure 1). The first phase assigns the impacts that each resource generates and moves to the activities that consume them, resulting in the impact of each activity.
The second phase consists in quantifying how much environmental impact an activity generates, which forms the basis of the impact to be disclosed. From the perspective of CPR vis-à-vis sustainable management, the impact of activities derived from waste management is divided thus:
- Activities at company level are the activities carried out by the CPR so that the producers comply with the current legislation in force.
- Activities at the product level are activities related to the reuse and recycling of waste: collection, sorting, preparation for reuse, recycling, to name a few.
4. Empirical Implementation of Sustainable Management of a CPR from the Perspective of Climate Change
4.1. Climate Impact of the Management of Used Tires in the European Union
The European Union has high tire recycling rates [68]. If we analyze the group of countries that make up EU28, and the expanded group (EU28 + NO + CH + Serbia + TR), it is verified that Germany, England, France, Italy, Poland and Spain are the six EU countries that manage more ELT. Of these five, only Germany, Italy and Spain are able to recycle 100% of the managed ELT, located above the European average of 94%.
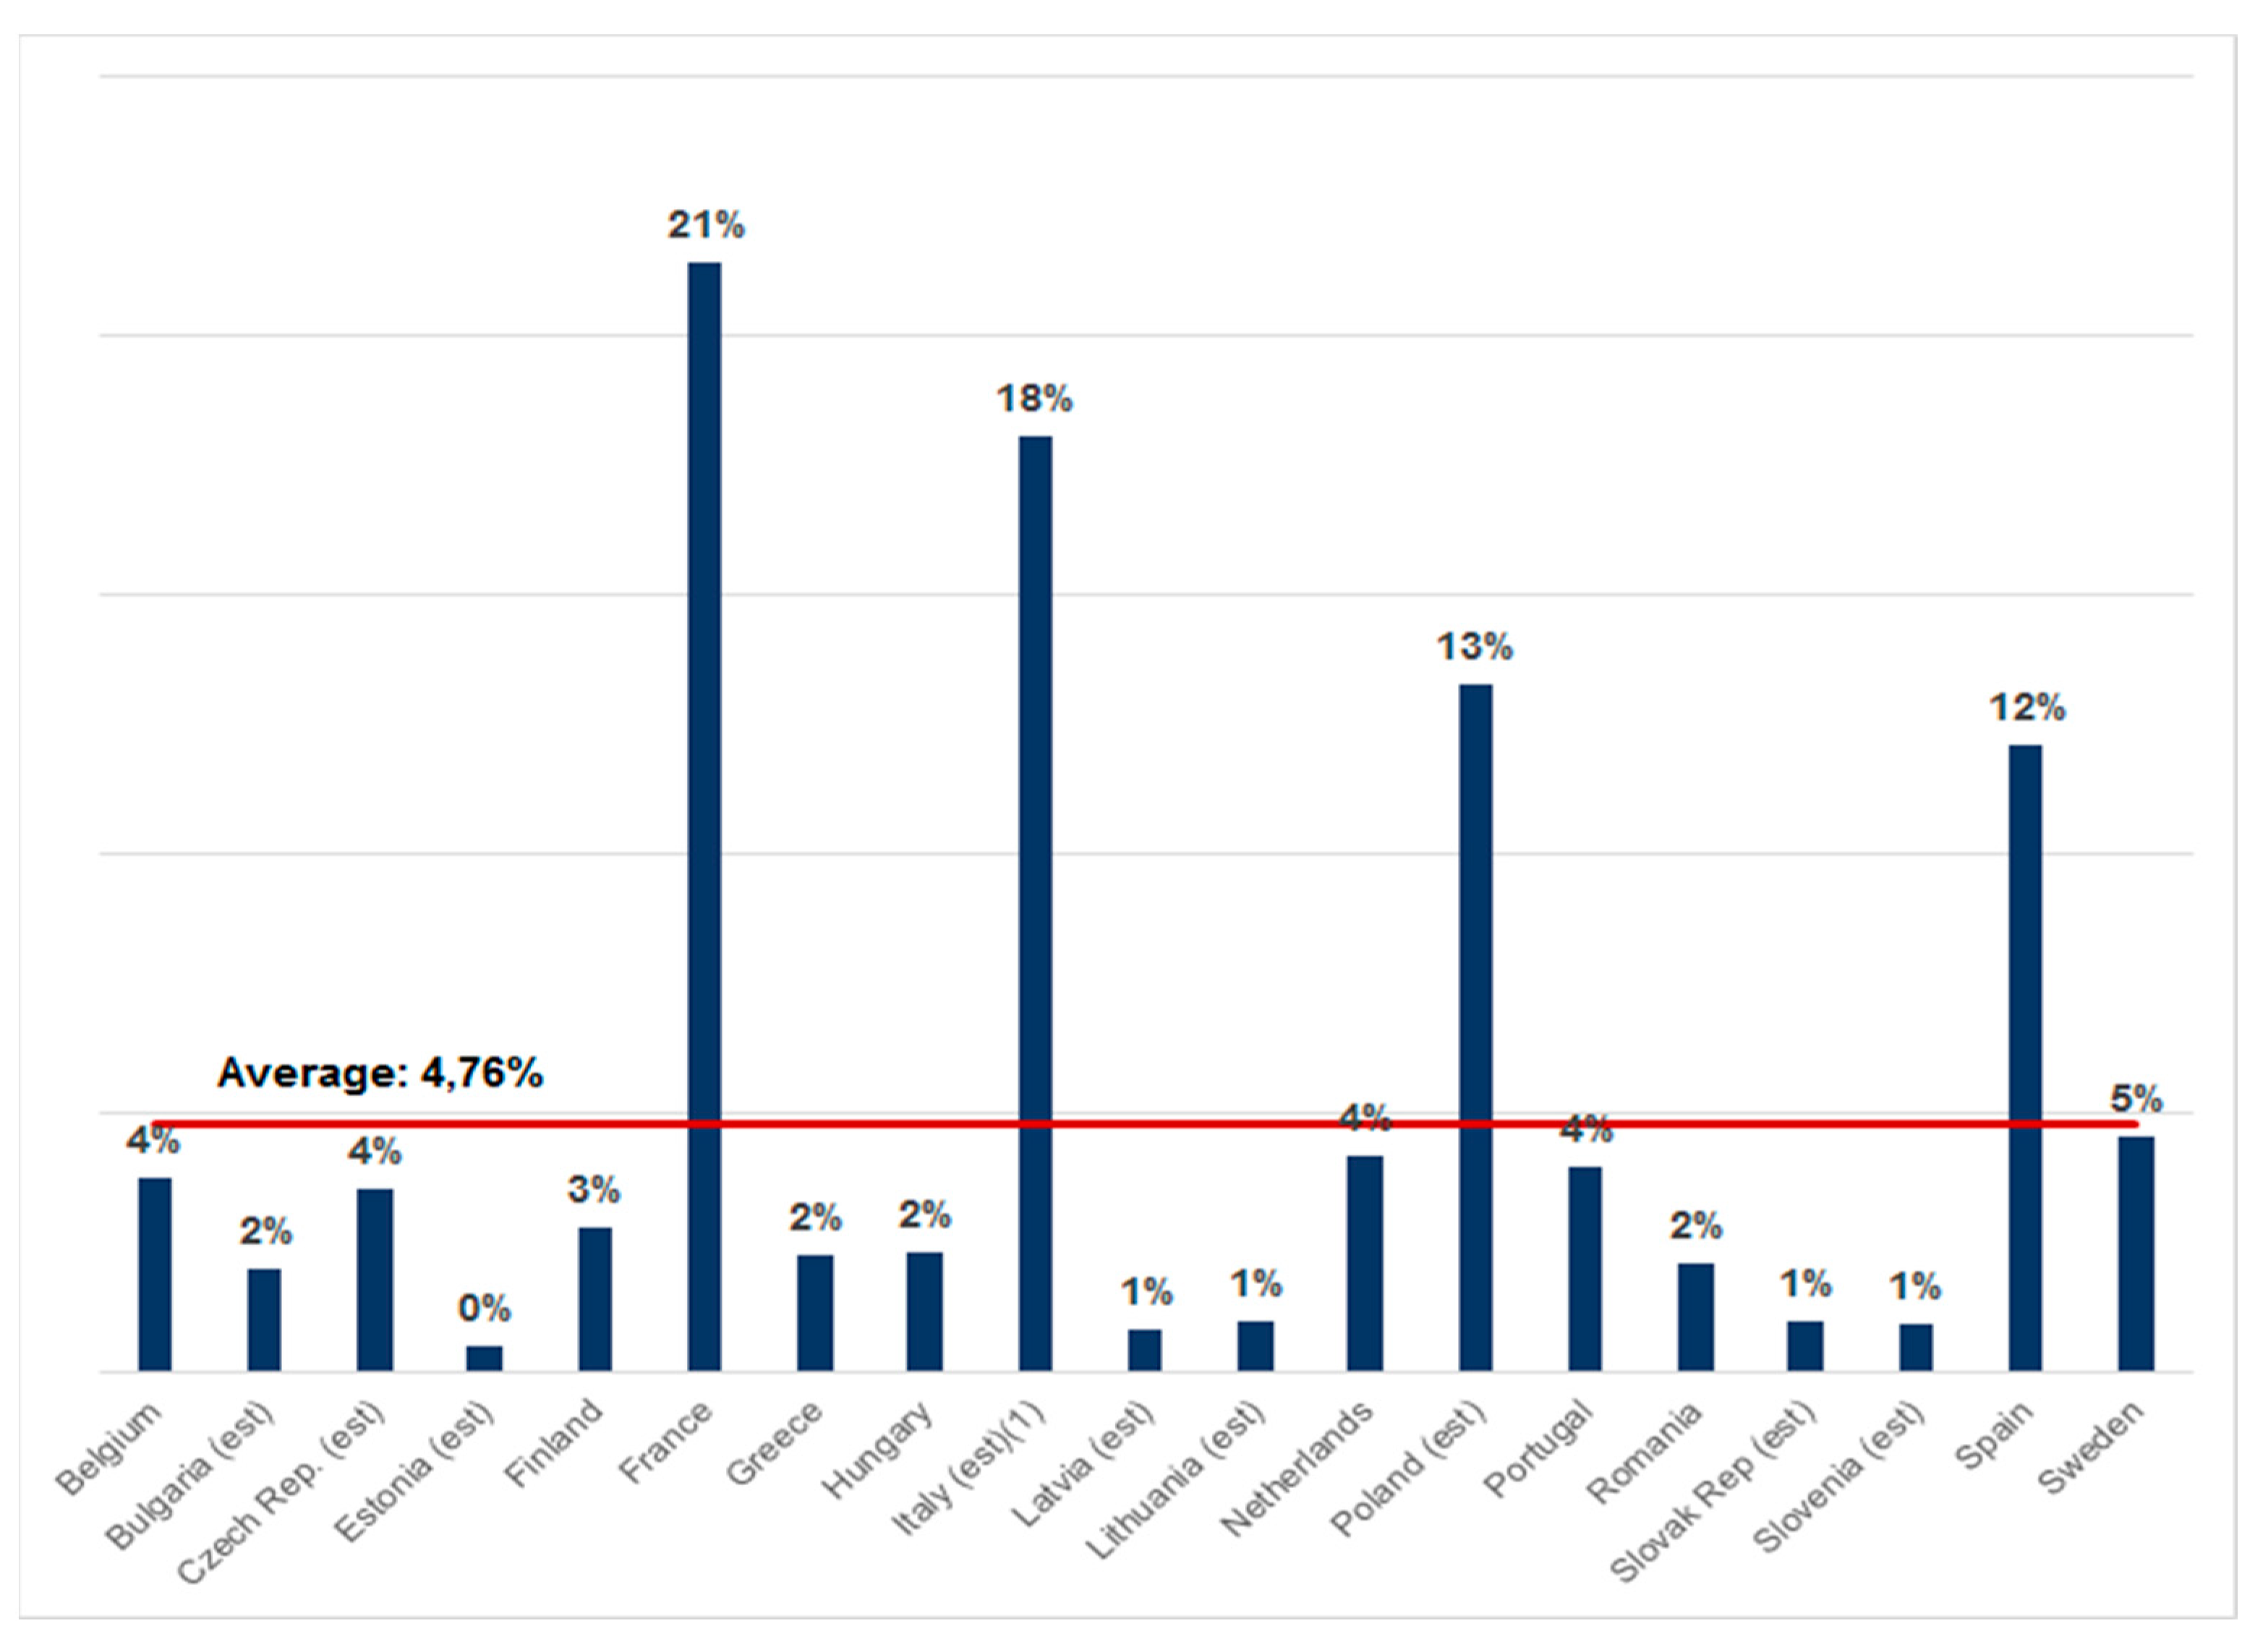
On the other hand, if Spain’s ELT management is compared with that of other EU countries that manage ELT under the same extended producer management system through a collective management system, it can be verified that Spain has a representation of 12%, positioning itself as the fourth country in terms of this type of management, ranked well above the average of EU28 countries, 4.76% (Figure 2).
This document aims to analyze the environmental impact generated by CPR in their tire waste management process. To achieve this, it is necessary to focus on those CPR that have calculated their carbon footprint by applying ISO 14064-1 and ISO 14069 standards for the establishment of the inventory and classification of GHG emissions and, in addition, they do so in a transparent manner, when registering said indicator in public records. It has been proven that Spain is the only country of these four in which the CF can be registered, and, in addition, this information is public and accessible. Therefore, the analysis has to focus on this country.
If the onus is placed on the ELT management in Spain, these are subject to Royal Decree RD1619/2005. This royal decree establishes a series of obligations to tire producers who must declare an amount of ELT equivalent to the tires placed on the market to carry out their environmental management. Furthermore, “they are obliged to develop business prevention plans that identify the manufacturing mechanisms that prolong the working life of tires and facilitate the reuse and recycling of ELT” (OFFICIAL STATE GAZETTE, 2006). These plans have to be defined taking into account that one of the essential factors in the tires’ eco-design is the safety aspect.
On the other hand, in RD1619/2005, management activities, the legal regime and the way in which storage and technical requirements of the facilities must be carried out are defined, in addition to defining and regulating the responsibilities of producers, managers and collective systems of extended responsibility.
In this sense, there is only CPR in Spain (SIGNUS) that meets these requirements and manages 70% of the total used tires from the replacement market in Spain [69]. It presents a clear compliance commitment to Law 22/2011 of tire producers in terms of CE.
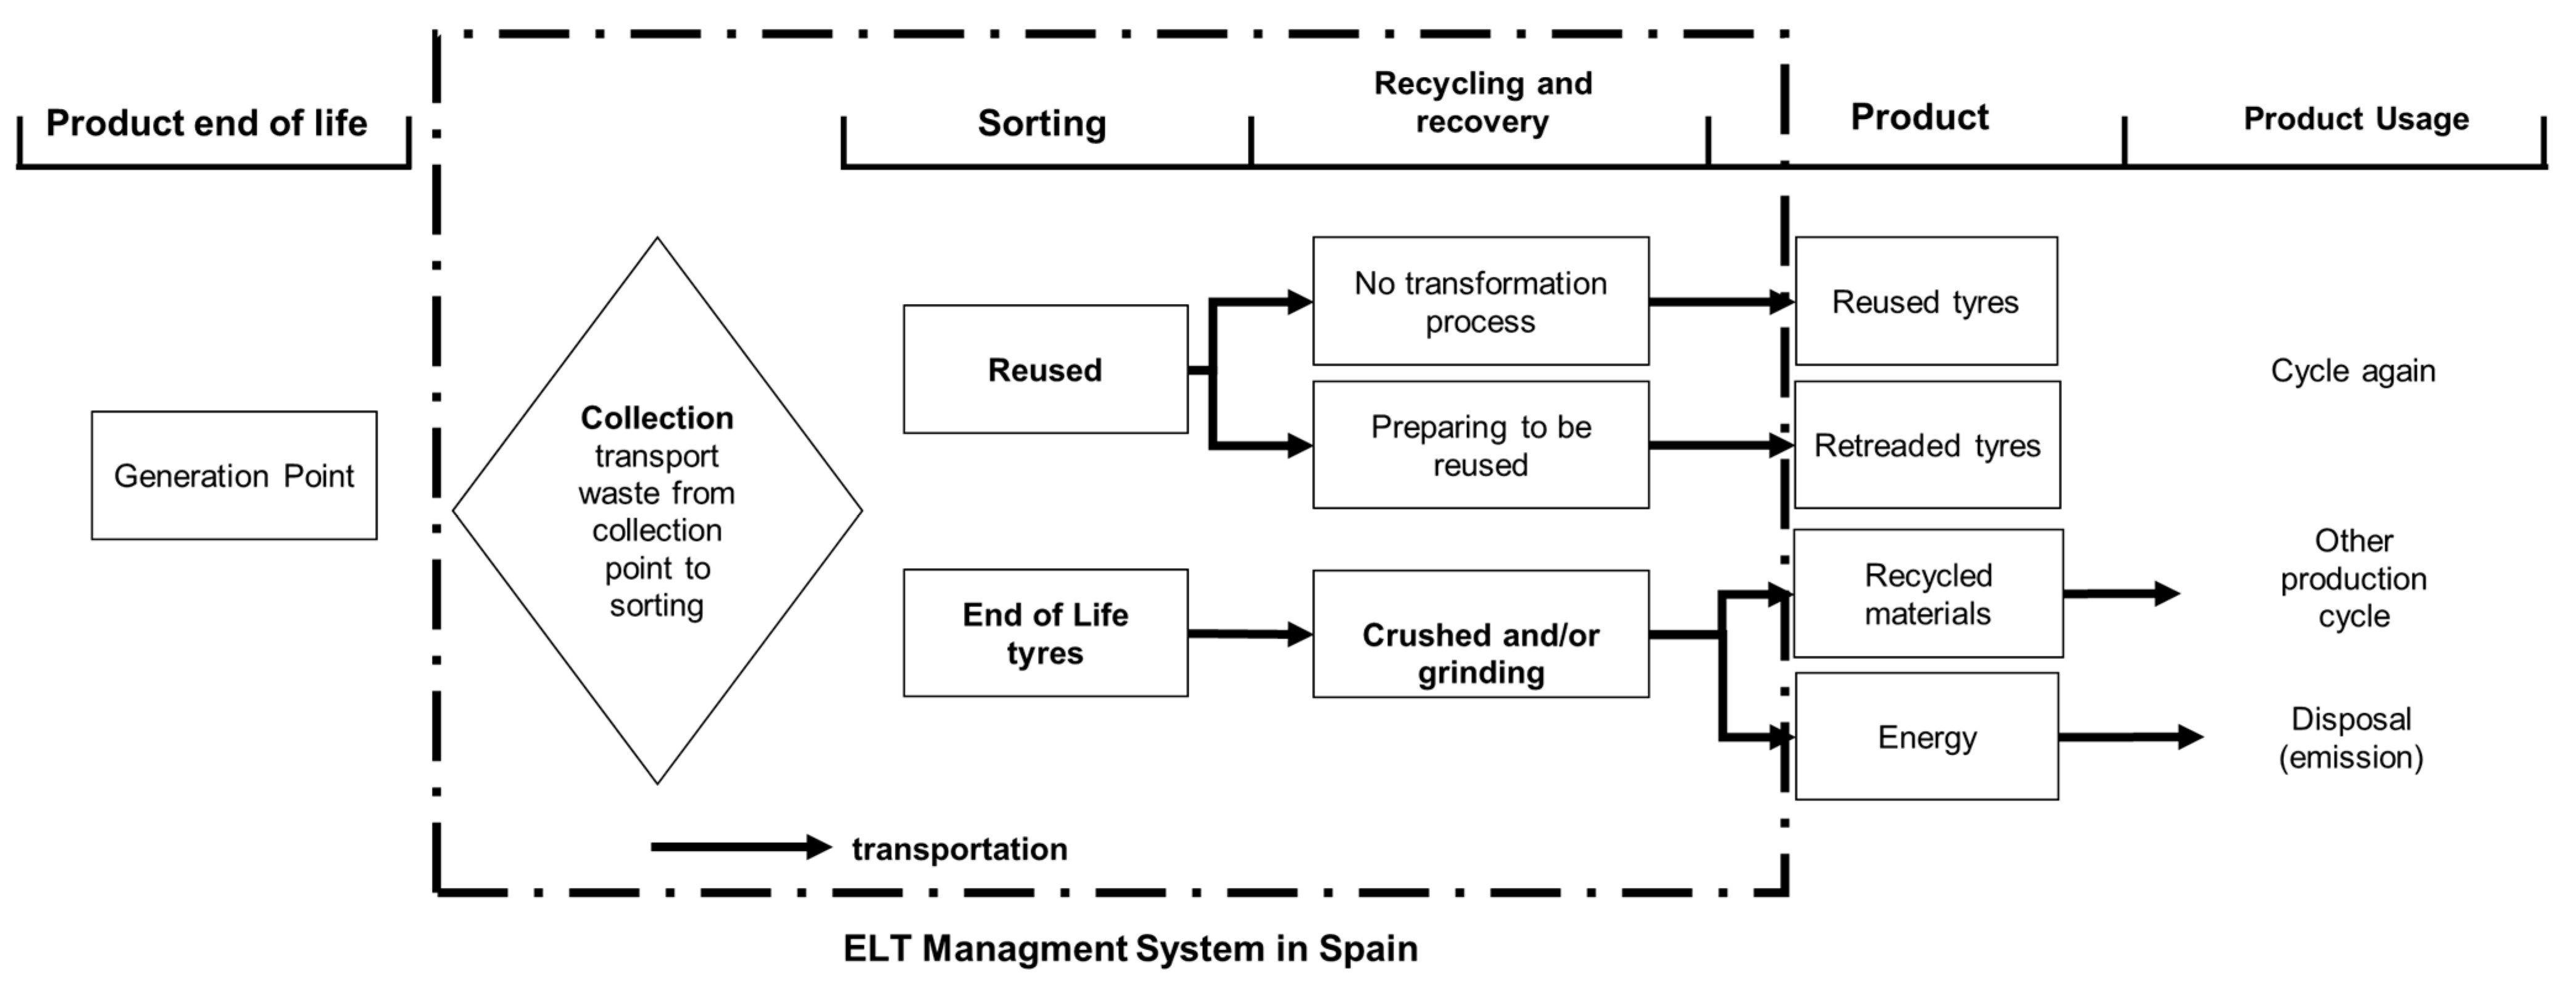
The activities related to the Used Tires (UT) management, which is the situation that the tires acquire when they lose their characteristics and cannot be reused for their main objective, the mobility of means of transport by road, are (Figure 3):
- Collection and sorting: consisting of the UT collection from the generation points to the collection and sorting centers (CSC), where reusable used tires and tires beyond their working lifetime (ELT) are separated.
- Recycling and recovery: ELT that cannot be reused are derived either from the recycling process for the separation of different materials for their material recovery (grinding process) or energy recovery (cement kilns, energy, energy generation).
- Transportation: this activity involves the transfer of the ELT from the CSC to the different recovery facilities.
4.2. Implementation of SBA from Climate Change Perspective: Three-Stages Analysis
The main advantage of the SBA model is that it provides an accurate and integrated quantification of impacts, especially when indirect impacts are an important part of the totals generated per impact object. In the case of SIGNUS, all impacts are indirect. Each ELT management procedure needs to perform activities identified and grouped by the level of action with respect to the product [51]:
- Activities at company level are the activities that support the management of ELT.
- ○
- ELT management: these are the activities carried out by CPR for compliance with Law 22/2011 affecting tire manufacturers.
- Batch level activities are the activities that are performed each time a batch of products is processed:
- ○
- Collection–sorting;
- ○
- Recycling–recovery;
- ○
- Transportation.
4.2.1. Preliminary Stage: To Identify Sustainability Indicator8a
To implant the SBA model, it is necessary to know the sustainability indicator that allows us to evaluate and assess the impact one wishes to appraise. In this case, we look for the climate impact of ELT management activities; therefore, the indicator that allows us to know the contribution to climate change of management activities is the SIGNUS carbon footprint that is detailed in Table 1 in GHG emissions.
For the rating of this carbon footprint (Table 1) the decision was made to use the methodology proposed by the UNE-EN ISO 14064-1: 2012 Standard “Greenhouse gases. Part 1: Specification with guidance at the organizational level for quantification and reporting of emissions and removals of greenhouse gases.”
This UNE-EN ISO 14064-1: 2012 standard explains in detail the way in which the GHG emissions inventory has to be carried out and its rating in the following scopes [72]:
- Scope 1: Direct emissions occur from sources that are owned or controlled by the company.
- Scope 2: These are indirect emissions generated by electricity acquired and consumed by the organization.
- Scope 3: These are other indirect emissions that are a consequence of the company’s activities but occur in sources that are not owned or controlled by the company.
Any organization that applies UNE-EN ISO 14064-1: 2012 is required to quantify emissions of scope 1 and 2. Emissions from scope 3, being dependent on the characteristics of the organization, are voluntary. In this situation, three scopes have been calculated, for which the following classification is made according to Standard UNE-ISO/TR 14069 “Greenhouse gases. Quantification and reporting of greenhouse gas emissions for organizations. Guidance for the application of ISO 14064-1” (ISO, 2013).
- Scope: 1
- ○
- Emissions from mobile combustion: derived from fuel consumption by vehicles owned by the company.
- ○
- Fugitive emissions generated by the use of air conditioners.
- Scope 2:
- ○
- Indirect emissions from the importation of electrical energy from electricity suppliers and for heat pump heating supplied by the building manager where companies headquarters are located.
- Scope 3:
- ○
- Professional journeys: these are the emissions generated by the trips that employees must make to undertake their professional activities at CPR.
- ○
- Transportation of customers and visitors: these are the emissions emitted by the transportation of visitors and customers who are invited by CPR.
- ○
- End of product life, and it is divided into three sections:
- Collection–sorting: emissions in ELT transport activities from the collection points to the classification centers (CSC). The sorting process involves the separation of ELT for reuse or recycling.
- Recycling and recovery: GHGs generated in the processes of recycling and recovery of the ELT.
- Transportation: GHG emissions caused by the transport of ELT from CSC to recycling centers and/or energy valuation.
- ○
- Employee mobility: these are the emissions that occur in transportation that employees use to go to their jobs from their homes and vice versa.
Other indirect emissions not included in the previous categories are from event organization. These are the emissions generated in the organization and holding of events by CPR (Table 2). These GHG emissions are those generated by SIGNUS for the management of ELT. That is, they are the emissions from the reuse and recycling processes to obtain materials that will be introduced in other manufacturing processes, which will have their own emissions and have not been quantified in this study since they are not within the scope of management.
4.2.2. Stage 1: Assigning Resources Impacts to Activities
Knowing the sustainability indicator allows us to identify which resources generate this impact. Therefore, the GHG emissions of resources can be known. Now, according to the SBA model we have to transfer these emissions to the activities that consume these resources. The final result is the GHG emissions of the activities detailed in Table 3.
- Step 1: Identification of GHG emissions at activity level:
- GHG emissions at company level:
- ELT management: the sum of the emissions of scopes 1 and 2 and the following GHG emissions of scope 3: work trips, events, employee mobility and customer and visitor trips.
- Emissions at the lot level:
- Collection–sorting: totaling 3,783.19 tCO2e, which come from the consumption of fuel in the ELT collection activity and fuel and electricity for classification.
- Recycling–recovery: this activity generates a total of 6,608.82 tCO2e derived mainly from electricity consumption.
- Transport: the emissions generated by this activity are 2,602.19 tCO2e produced by fossil fuel consumption.
- Step 2: Identification of the drivers involved in the activities:
- GHG emissions at company level: the driver is the number of companies involved in the management of ELT. In this case, for the year 2017 SIGNUS managed 50 companies.
- GHG emissions at the lot level: the driver is the tonnes of ELT managed:
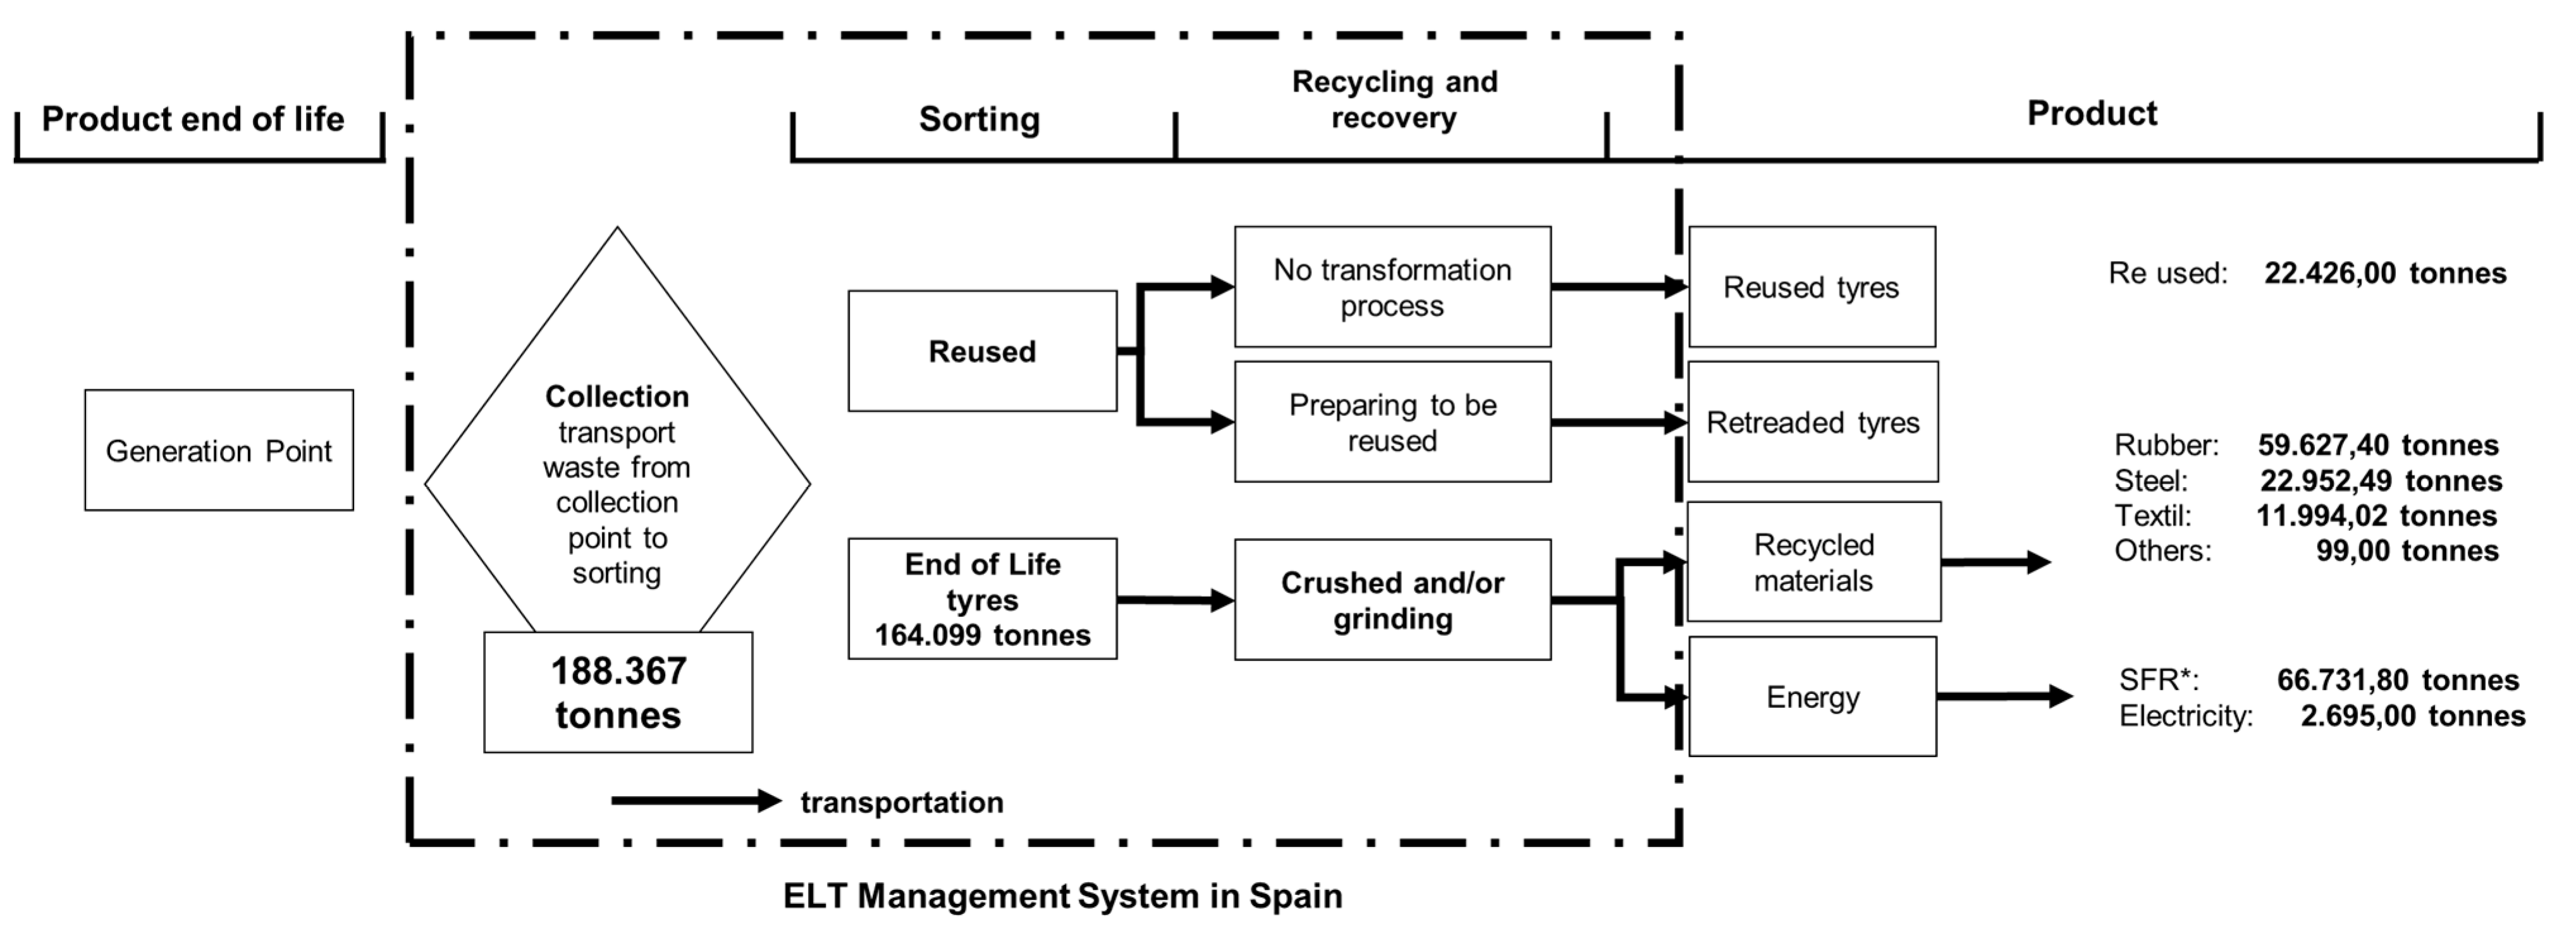
- Collection-sorting: 188,367 tonnes of ELT collected and classified.
- Recycling-recovery: 164,099 tonnes of recycled ELT, 94,673 tonnes to obtain materials to reintroduce them into the system and 69,426 tonnes for energy production.
- Transport: 131,598.52 tonnes transported from the sorting centers to the recycling centers: 127,355.61 tonnes by land transport and 4242.91 by sea transport.
- Step 3: Unit GHG emissions for each activity:
- GHG emissions at company level: GHG emissions by number of companies.
- GHG emissions at the lot level: GHG emissions per ton of ELT managed.
- Step 4: Assignment of GHG emissions for each activity pertaining to the waste management process: reuse, recycling material recovery, recycling energy recovery and disposal.
4.2.3. Stage 2: Assigning Activity Impacts to the Objects of Impact
When the GHG emissions generated by the activities involved in ELT management are known, an assignment to the impact object can then be made. For this it is necessary to perform the following steps (Table 3):
- Step 1: Identification of impact object:
- Reused tire.
- Recycling material recovery (grinding process). The materials obtained are: rubber, steel, textile and others;
- Recycling energy recovery (crushing process). Combustion or generation of electrical energy.
- Step 2: Identification of the drivers of the impact objects. For any of these, tonnes of ELT are used.
- Step 3: Unit GHG emissions for each impact object: GHG emissions per ton of ELT.
- Step 4: Assignment of GHG emissions to the impact object.
5. Results and Discussion
According to the results of Section 4, after applying the SBA model to SIGNUS (Table 3), it is possible to determine that 3.67% of GHG emissions are linked to reuse processes, a high percentage, 95.82 %, to those of recycling, of which 53.26% is to obtain materials to reintroduce them into the system and 42.56% is to produce energy. The total environmental impact measured in terms of CF is 13,066.85 t CO2e, an impact derived from the additional activities incorporated into the tire production system for the promotion of EC.
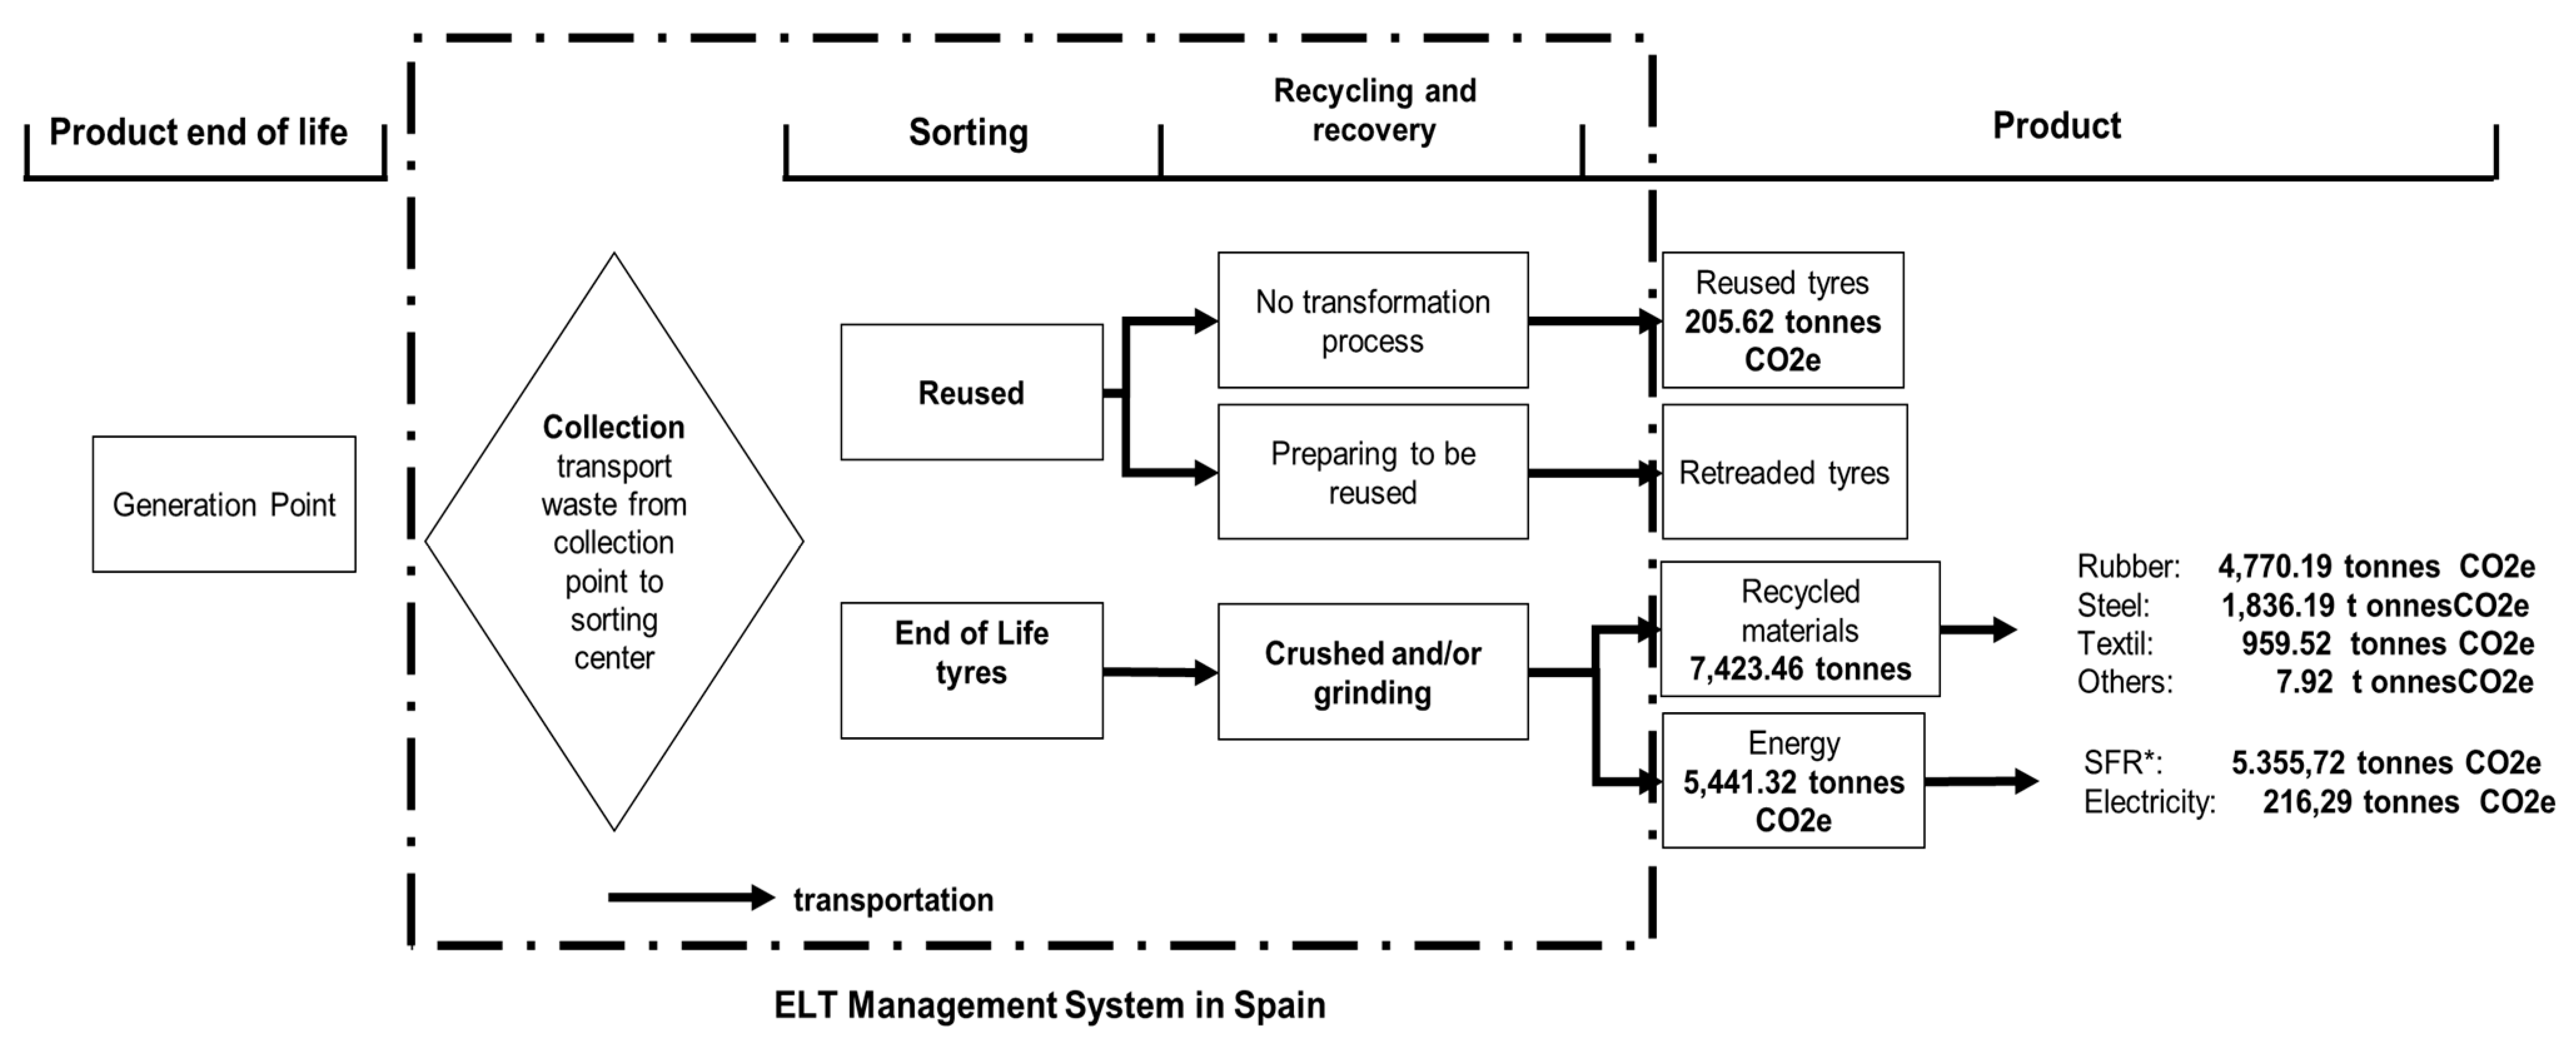
With the application of the SBA model we can not only ascertain the GHG emissions of activities involved in the management of the ELT, but we can also assign them to the GHG emissions of each product obtained in each of the phases of waste management (Figure 5). This information can be useful to know the life cycle of products manufactured from recycled materials or to establish comparisons between products manufactured from natural resources.
It also allows us to compare the carbon footprint of different processes. According to data from the Department for Business, Energy and Industrial Strategy of the UK Government Conversion Factor for Company Reporting (2020), tire manufacturing has a carbon footprint of 3.34 tCO2e per tonne of tire manufactured. This is much higher than the carbon footprint of recycled tires, which amounts to 0.04 tCO2e [73].
The results obtained are important for the decision-making process for ELT managers, which can encourage them to improve the design and production process of reused materials and materials from ELT recycling, to reduce their impact and contribution to climate change; in short, to contribute to the CE promoting sustainable development and creating sustainable organizations. On the other hand, these results can be useful for the development of policies with specific objectives in the prevention of waste generation based on two aspects: (1) product design to extend its use and (2) responsible consumption.
If attention is paid to the concept of CE set out by Mihelcic et al. (Figure 2) it is observed that, in order to establish the cycles of reuse, recycling and disposal, it is necessary to add energy, time and costs [29]. Of these three elements, the only one that can be obtained from natural resources is energy and with the SBA model we can know the origin and nature of the resources used to obtain energy in ELT management. Specifically, non-renewable resources were used in:
- ELT Collection–sorting activity: it consumes 1,115,304.63 litres of diesel for the transport of ELT from the collection points to the classification centers. The centers consume a total of 641,663.73 kWh of electricity.
- Recycling–recovery activity: its electricity consumption amounted to 18,359,041.05 kWh for obtaining granules and 314,764.25 kWh for crushing. Only 9.59% of the electricity consumed to obtain granules comes from renewable resources.
- Transport: There are no consumption data derived from the kilometers travelled, but of the type of resources used, diesel or gasoline, both non-renewable resources are known.
6. Conclusions
There is a benefit to promote business models that contribute to the development of the circular economy where sustainability criteria are integrated that take into account: (1) environmental aspects, such as climate change; (2) the flows of non-material elements such as the energy consumed; (3) social aspects, such as the intervention in the prevention of waste generation; and (4) economic aspects such as the improvement of efficiency of the processes both in the production of the product and the process of recycling them.
There is a real need to manage waste until the circular transformation of linear industrial processes occurs. While this occurs, sustainable waste management is required and one of the organizations proven to be more efficient is CPR.
As sustainability of these organizations should be studied, the SBA model has proven to be an efficient tool for quantifying impacts, since it identifies resources, activities and impact objects in such a way that it facilitates the traceability of the impacts generated in the development of the activities involved in waste management.
In the case of tires, the development of business plans focused on a more efficient, safe, natural resource consumer and waste generator design must be promoted. This must be complemented with the correct reuse and recycling of ELT.
Using sustainability management models such as the SBA model allows us to evaluate the impact generated by waste management processes and calculate GHG emissions from products obtained in the reuse and recycling of ELT. In this sense, it could be thought that these activities increase the carbon footprint of the overall process, as shown by the high carbon footprint results from tire manufacture, but under a life cycle viewpoint, the total amount of CF in EC processes is much lower.
This result could be both a limitation and a future opportunity for this research line. This sustainability indicator cannot be taken as a single element; that is, although GHG emissions affect the overall total, the incorporation of these processes of reuse, recycling and recovery are more than necessary since they reduce the consumption of the necessary natural resources and reduce the amount of waste. That is why other sustainability indicators like water footprint, or ecological footprint could be considered in further research as well as the comparison in terms of cost of circular processes.
For CPR, as organizations, knowing the environmental impact measured in CF allows decisions to be made with a sustainable bias and to establish action plans that involve all stakeholders in waste management:
The managers involved in the reuse and recycling processes will know their impacts and will be able to develop their own action plans, which will allow them to be resilient and adaptable to the changing conditions of the environment in terms of sustainability.
Producers will have information that will facilitate their decision-making on issues of sustainability strategies for adaptation and mitigation of climate change or other impacts. This will lead them to promote sustainable development and foster sustainable CE from a life cycle perspective.
From a policy perspective, aims geared towards the reduction of waste generation can be established through the development of measures that encourage new innovative processes focused on the design of product manufacture and the promotion of responsible consumption. It is imperative not solely to reduce and manage waste but moreover, to act on the origin by rethinking and redesigning the products under the sustainability criteria established through the circular economy model.
Author Contributions
Conceptualization, C.A.-P. and A.R.-O.; methodology, C.A.-P. and A.R.-O.; validation, C.A.-P. and A.R.-O.; resources, A.R.-O.; data curation, A.R.-O.; writing—original draft preparation, C.A.-P. and A.R.-O.; writing—review and editing, C.A.-P. and A.R.-O.; supervision, C.A.-P.; project administration, C.A.-P.; funding acquisition, C.A.-P. Both authors have read and agreed to the published version of the manuscript.
Funding
This research was partially funded by COMUNIDAD DE MADRID, Spain, Action financed by the Community of Madrid within the framework of the Multiyear Agreement with the Universidad Politécnica de Madrid in the line of action Program of Excellence for UniversityTeaching Staff–Echegaray Grant).
Institutional Review Board Statement
Not applicable.
Informed Consent Statement
Not applicable.
Data Availability Statement
Data sharing is not applicable to this article.
Acknowledgments
To SIGNUS for their help and information.
Conflicts of Interest
The authors declare no conflict of interest.
References
- Blomsma, F.; Brennan, G. The Emergence of Circular Economy: A New FramingAround Prolonging Resource Productivity. J. Ind. Ecol. 2017, 21, e603–e614. [Google Scholar] [CrossRef]
- EMF. Towards a Circular Economy: Business Rationale for an Accelerated Transition Accessed. 2015. Available online: https://www.ellenmacarthurfoundation.org/assets/downloads/TCE_Ellen-MacArthur-Foundation_9-Dec-2015.pdf (accessed on 30 June 2018).
- Bocken, N.M.P.; de Pauw, I.; Bakker, C.; van der Grinten, B. Product design and business model strategies for a circular economy. J. Ind. Prod. Eng. 2016, 33, 308e320. [Google Scholar] [CrossRef] [Green Version]
- Sauvé, S.; Bernard, S.; Sloan, P. Environmental sciences, sustainable development and circular economy: Alternative concepts for trans-disciplinary research. Environ. Dev. 2016, 17. [Google Scholar] [CrossRef] [Green Version]
- Geissdoerfer, M.; Savaget, P.; Bocken, N.M.P.; Hultink, E.J. The Circular Economy: A new sustainability paradigm? J. Clean. Prod. 2017, 143, e757–e768. [Google Scholar] [CrossRef] [Green Version]
- Korhonen, J.; Honkasalo, A.; Seppälä, J. Circular Economy: The Concept and its limitations. Ecol. Econ. 2018. [Google Scholar] [CrossRef]
- Geissdoerfer, M.; Vladimirova, D.; Evans, S. Sustainable business model innovation: A review. J. Clean. Prod. 2018, 198, e401–e416. [Google Scholar] [CrossRef]
- Kirchherr, J.; Reike, D.; Hekkert, M. Conceptualizing the circular economy: An analysis of 114 definitions. Resour. Conserv. Recycl. 2017, 127, 221–232. [Google Scholar] [CrossRef]
- Pieroni, M.P.P.; McAloone, T.C.; Pigosso, D.C.A. Business model innovation of circular economy and sustainability: A review of approaches. J. Clean. Prod. 2019. [Google Scholar] [CrossRef]
- Baldassarre, B.; Schepers, M.; Bocken, N.; Cuppen, E.; Korevaar, G.; Calabretta, G. Industrial Symbiosis: Towards a design process for eco-industrial clusters by integrating Circular Economy and Industrial Ecology perspectives. J. Clean. Prod. 2019, 216. [Google Scholar] [CrossRef]
- Moraga, G.; Huysveld, S.; Mathieux, F.; Blengini, G.A.; Alaerts, L.; Van Acker, K.; de Meester, S.; Dewulf, J. Circular economy indicators: What do they measure? Resour. Conserv. Recycl. 2019. [Google Scholar] [CrossRef]
- European Environment Agency (EEA). Circular Economy in Europe-Developing the Knowledge Base; European Environment Agency/Publications Office of the European Union: Luxembourg, 2016; ISBN 978-92-9213-719-9. [Google Scholar] [CrossRef]
- Pires, A.; Marthino, G. Waste hierarchy index for circular economy in waste management. Waste Manag. 2019. [Google Scholar] [CrossRef] [PubMed]
- Geng, Y.; Fu, J.; Sarkis, J.; Xue, B. Towards a national circular economy indicator system in China: An evaluation and critical analysis. J. Clean. Prod. 2012, 23, 216–224. [Google Scholar] [CrossRef]
- Elia, V.; Gnoni, M.G.; Tornese, F. Measuring circular economy strategies through index methods: A critical analysis. J. Clean. Prod. 2017, 142, 2741–2751. [Google Scholar] [CrossRef]
- Esposito, M.; Tse, T.; Soufani, K. Introducing a Circular Economy: New Thinking with New Managerial and Policy Implications. Calif. Manag. Rev. 2018, 60, 5–19. [Google Scholar] [CrossRef]
- Hopkinson, P.; Zils, M.; Hawkins, P.; Roper, S. Managing a Complex Global Circular Economy Business Model: Opportunities and Challenges. Calif. Manag. Rev. 2018, 60, 71–94. [Google Scholar] [CrossRef]
- Kalmykova, Y.; Sadagopan, M.; Rosado, L. Circular Economy- from review of theoris and practices to development of implementation tools. Resour. Conserv. Recycl. 2018. [Google Scholar] [CrossRef]
- ETRMA. ELT Management Figures 2016. 2018. Available online: http://www.etrma.org/uploads/Modules/Documentsmanager/20180502---2016-elt-data_for-press-release.pdf (accessed on 4 August 2019).
- Wiedmann, T.; Minx, J.C. A definition of carbon footprint. In Ecological Economic Research Trend; Petsan, C.C., Ed.; Nova Science Publisher: New York, NY, USA, 2007. [Google Scholar]
- Suárez-Eiroa, B.; Fernández, E.; Méndez-Martínez, G.; Soto-Oñate, D. Operational principles of circular economy for sustainable development: Linking theory and practice. J. Clean. Prod. 2019. [Google Scholar] [CrossRef]
- Rodríguez-Olalla, A.; Avilés-Palacios, C. Integrating Sustainability in Organisations: An Activity based Sustainability Model. Sustainability 2017, 9, 1072. [Google Scholar] [CrossRef] [Green Version]
- WCED. Our Common Future; Oxford University Press: Oxford, UK, 1987. [Google Scholar]
- Serageldin, I. Making development sustainable. Financ. Dev. 1993, 30, 6–10. [Google Scholar]
- Steffen, W.; Richardson, K.; Rockström, J.; Cornell, S.E.; Fetzer, I.; Bennett, E.; Biggs, R.; Carpenter, S.R.; de Vries, W.; de Wit, C.A.; et al. Planetary boundaries: Guiding human development on a changing planet. Science 2015. [Google Scholar] [CrossRef] [PubMed] [Green Version]
- Rockström, J.; Steffen, W.; Noone, K.; Persson, A.; Lambin, E.; Lenton, T.M.; Folke, C.; Scheffer, M.; Chapin, F.S., III; Nykvist, B.; et al. Planetary boundaries: Exploring the safe operating space for humanity. Ecol. Soc. 2009, 14. [Google Scholar] [CrossRef]
- Robért, K.-H.; Broman, G.; Basile, G. Analyzing the concept of planetary boundaries from a strategic sustainability perspective: How does humanity avoid tipping theplanet? Ecol. Soc. 2013, 18, 5. [Google Scholar] [CrossRef]
- Korhonen, J.; Nuur, C.; Feldmann, A.; Birkie, S.E. Circular economy as an essentially contested concept. J. Clean. Prod. 2018. [Google Scholar] [CrossRef]
- Mihelcic, J.R.; Crittenden, J.C.; Small, M.J.; Shonnard, D.R.; Hokanson, D.R.; Qiong, Z.H.; Sorby, S.A.; James, V.U.; Sutherland, J.W.; Schnoor, J.L. Sustainability science and engineering: The emergence of anew metadiscipline. Environ. Sci. Technol. 2003, 37, 5314–5324. [Google Scholar] [CrossRef]
- Andersen, M.S. An introductory note of the environmental economics of the circular economy. Sustain. Sci. 2007, 2, 133. [Google Scholar] [CrossRef]
- Muñoz-Torres, M.J.; Fernández-Izquierdo, M.A.; Rivera-Lirio, J.M.; Ferrero-Ferrero, I.; Escrig-Olmedo, E.; Gisbert-Navarro, J.V.; Marullo, M.C. An Assessment Tool to Integrate Sustainability Principles into the Global Supply Chain. Sustainatibility 2018, 10, 535. [Google Scholar] [CrossRef] [Green Version]
- Walmsley, T.G.; Ong, B.H.; Klemeš, J.J.; Tan, R.R.; Varbanov, P.S. Circular Integration of processes, industries, and economies. Renew. Sustain. Energy Rev. 2019, 107, 507–515. [Google Scholar] [CrossRef]
- EASAC. Indicators for a Circular Circular Economy; European Academies’ Science Advisory Council: Halle, Germany, 2016. [Google Scholar]
- Cullen, J.M. Circular Economy: Theoretical Benchmark or Perpetual Motion Machine? J. Ind. Ecol. 2017, 21, 483–486. [Google Scholar] [CrossRef]
- Pauliuk, S. Critical appraisal of the circular economy standard BS 8001:2017 and a dashboard of quantitative system indicators for its implementation in organizations. Resour. Conserv. Recycl. 2018, 129, 81–92. [Google Scholar] [CrossRef]
- Hoornweg, D.; Bhada-Tata, P.; Kennedy, C.W. Environment: Waste production must peak this century. Nat. Cell Biol. 2013, 502, 615–617. [Google Scholar] [CrossRef] [Green Version]
- World Bank. Global Waste on Pace to Triple by 2100. 2013. Available online: http://www.worldbank.org/en/news/feature/2013/10/30/global-waste-on-pace-to-triple (accessed on 30 October 2014).
- Minelgaitė, A.; Liobikienė, G. Waste problem in European Union and its influence on waste management behaviours. Sci. Total Environ. 2019, 667, 86–93. [Google Scholar] [CrossRef] [PubMed]
- Brunner, P.H. Cycles, spirals and linear flows. Waste Manag. Res. 2013, 31, 1–2. [Google Scholar] [CrossRef] [Green Version]
- Das, S.; Lee, S.-H.; Kumar, P.; Kim, K.-H.; Bhattacharya, S.S. Solid waste management: Scope and the challenge of sustainability. J. Clean. Prod. 2019, 228, 658–678. [Google Scholar] [CrossRef]
- De, S.; Debnath, B. Prevalence of Health Hazards Associated with Solid Waste Disposal—A Case Study of Kolkata, India. Procedia Environ. Sci. 2016, 35, 201–208. [Google Scholar] [CrossRef]
- Hoornweg, D.; Bhada-Tata, P. What a Waste: A Global Review of Solid Waste Management; World Bank Group: Washington, DC, USA, 2012. [Google Scholar]
- Zhang, X.; Huang, Q.; Deng, F.; Huang, H.; Wan, Q.; Liu, M.; Wei, Y. Mussel-inspired fabrication of functional materials and their environmental applications: Progress and prospects. Appl. Mater. Today 2017, 7, 222–238. [Google Scholar] [CrossRef]
- Huang, Q.; Zhao, J.; Liu, M.; Chen, J.; Zhu, X.; Wu, T.; Tian, J.; Wen, Y.; Zhang, X.; Wei, Y. Preparation of polyethylene polyamine@tannic acid encapsulated MgAl-layered double hydroxide for the efficient removal of copper (II) ions from aqueous solution. J. Taiwan Inst. Chem. Eng. 2018, 82, 92–110. [Google Scholar] [CrossRef]
- Liu, Y.; Huang, H.; Gan, D.; Guo, L.; Liu, M.; Chen, J.; Deng, F.; Zhou, N.; Zhang, X.; Wei, Y. A facile strategy for preparation of magnetic graphene oxide composites and their potential for environmental adsorption. Ceram. Int. 2018, 44, 18571–18577. [Google Scholar] [CrossRef]
- United Nations (UN). Sustainable Development Goals—17 Goals to Transform Our World. 2016. Available online: http://www.un.org/sustainabledevelopment/sustainable-development-goals/ (accessed on 8 July 2019).
- Cecere, G.; Mancinelli, S.; Mazzanti, M. Waste prevention and social preferences:the role of intrinsic and extrinsic motivations. Ecol. Econ. 2014, 107, 163–176. [Google Scholar] [CrossRef] [Green Version]
- Malinauskaite, J.; Jouhara, H.; Czajczynska, D.; Stanchev, P.; Katsou, E.; Rostkowski, P.; Thorne, R.J.; Colón, J.; Ponsá, S.; Mansour, S.; et al. Municipal solid waste management and waste-to-energy in the context of a circular economy and energy recycling in Europe. Energy 2017, 141, 2013–2044. [Google Scholar] [CrossRef]
- Van Ewijk, S.; Stegemann, J. Limitations of the waste hierarchy for achieving absolute reductions in material throughput. J. Clean. Prod. 2016, 132, 122–128. [Google Scholar] [CrossRef] [Green Version]
- Real Academia Española (RAE). Resiliencia. 2019. Available online: http://www.rae.es/ (accessed on 7 July 2019).
- Tong, S.; Ebi, K. Preventing and mitigating health risks of climate change. Environ. Res. 2019, 174. [Google Scholar] [CrossRef]
- World Economic Forum. The Global Risks Report 2019, 14th ed.; World Economic Forum: Geneva, Switzerland, 2019; ISBN 978-1-944835-15-6. [Google Scholar]
- IPBES. Summary for Policymakers of the IPBES Regional Assessemnt Report on Biodiversity and Ecosistem Services for Europe and Central Asia; IPBES: Bonn, Germany, 2018; ISBN 978-3-947851-03-4. [Google Scholar]
- Intergovernmental Panel on Climate Change (IPCC). Global Warming of 1.5 °C. 2018. Available online: http://report.ipcc.ch/sr15/pdf/sr15_spm_final.pdf (accessed on 3 July 2019).
- NASA. 2019. Available online: https://climate.nasa.gov/vital-signs/carbon-dioxide/ (accessed on 3 July 2019).
- Yang, C.H.; Lee, K.C.; Chen, H.C. Incorporating carbon footprint with activity based costing constraints into sustainable publica transport infrastructure project decisions. J. Clean. Prod. 2016. [Google Scholar] [CrossRef]
- Lee, S.; Kim, J.; Chong, W.K.O. The causes of the municipal solid waste and the green house gas emissions from the waste sector in the United States. Waste Manag. 2016, 56, e593–e599. [Google Scholar] [CrossRef]
- European Directive 2008/98/CE on Waste and Repealing Certain Directives (European Parliament and Council). 2008. Available online: https://eur-lex.europa.eu/legal-content/en/TXT/PDF/?uri=CELEX:02008L0098-20180705&from=EN (accessed on 7 July 2019).
- OECD. Extended Producer Responsibility: A Guidance Manual for Governments; OECD: Paris, France, 2001; 164p. [Google Scholar]
- Lindhqvist, T.; Lidgren, K. Modeller för Förlängt producentansvar [Model for extended producer responsibility]. Ministry of the Environment, Från vaggan till graven–sex studier av varors miljöpåverkan. 1990, pp. 7–44. Available online: https://portal.research.lu.se/portal/en/publications/extended-producer-responsibility-in-cleaner-production-policy-principle-to-promote-environmental-improvements-of-product-systems(e43c538b-edb3-4912-9f7a-0b241e84262f).html (accessed on 15 July 2019).
- Lifset, R.J. Take it back: Extended producer responsibility as a form of incentive-based environmental policy. J. Resour. Manag. Technol. 1993, 21, 163–175. [Google Scholar]
- Pearce, D.W.; Turner, R.K. Market-based approaches to solid waste management. Resour. Conserv. Recycl. 1993, 8, 63–90. [Google Scholar] [CrossRef]
- Hickle, G. Extending the boundaries: An assessment of the integration of extended producer responsibility within corporate social responsibility. Bus. Strategy Environ. 2017, 26, 112–1724. [Google Scholar] [CrossRef]
- Gui, L.; Atasu, A.; Ergun, Ö.; Toktay, L.B. Design Incentives Under Collective Extended Producer Responsibility: A Network Perspective. Manag. Sci. 2018, 64, 5083–5104. [Google Scholar] [CrossRef] [Green Version]
- Calvo, E.; Izquierdo, R.; López, P.; Mattera, M. Economía Circular versus Objetivos de Desarrollo Sostenible: Análisis de la responsabilidad del productor en el caso de los neumáticos fuera de uso. In Proceedings of the 14º Congreso Nacional del Medio Ambiente, Madrid, Spain, 26 November 2018. [Google Scholar]
- Maas, K.; Schaltegger, S.; Crutzen, N. Integrating corporate sustainability assessment, management accounting, control, and reporting. J. Clean. Prod. 2016, 36, 237–248. [Google Scholar] [CrossRef]
- Morioka, S.N.; De Carvalho, M.M. A systematic literature review towards a conceptual framework for integrating sustainability performance into business. J. Clean. Prod. 2016, 136, 134–146. [Google Scholar] [CrossRef]
- MITECO. Factores de Emisión. Registro de Huella de Carbono, Compensación y Proyectos de Absorción de Dióxido de Carbono. 2018. Available online: https://www.miteco.gob.es/es/cambio-climatico/temas/mitigacion-politicas-y-medidas/factoresemision_tcm30-479095.pdf (accessed on 5 May 2019).
- SIGNUS. Memoria Anual. 2017. Available online: https://www.signus.es/memoria2017/ (accessed on 28 May 2020).
- Navío, C. ¿Porqué es Importante Registrar la Huella de Carbono? 2020. Available online: https://blog.signus.es/por-que-es-importante-registrar-la-huella-de-carbono/ (accessed on 28 May 2020).
- SIGNUS. Memoria Anual. 2016. Available online: https://www.signus.es/wp-content/uploads/2017/07/signus_memoria_2016.pdf (accessed on 28 May 2020).
- World Business Council for Sustainable Development and World Resources Institute. 2004. ISBN 1-56973-568-9. Available online: https://ghgprotocol.org/sites/default/files/standards/ghg-protocol-revised.pdf (accessed on 12 July 2019).
- UK Government GHG Conversion Factor for Company Reporting. 2020. Available online: https://www.gov.uk/government/publications/greenhouse-gas-reporting-conversion-factors-2020 (accessed on 28 March 2021).
Figure 1.
Collective producer responsibility systems (CPR) impact assignment according to the Sustainability Model Based on Activities (SBA). Source: in-house based on Rodríguez-Olalla and Avilés-Palacios [22].
Figure 1.
Collective producer responsibility systems (CPR) impact assignment according to the Sustainability Model Based on Activities (SBA). Source: in-house based on Rodríguez-Olalla and Avilés-Palacios [22].

Figure 2.
End-of-life-tires management in countries with Extended Producer Responsibility legislation. 2016. Source: in-house based on ETRMA, 2018.
Figure 2.
End-of-life-tires management in countries with Extended Producer Responsibility legislation. 2016. Source: in-house based on ETRMA, 2018.

Figure 3.
System limits: ELT Management System in a circular economy model. Source: in-house based on Mihelcic et al. [29] and SIGNUS [69].

Figure 4.
Quantity (in tonnes) of UT by SIGNUS in 2017. * SFR: Solid Fuel Recovered. Source: in-house based on SIGNUS [69].
Figure 4.
Quantity (in tonnes) of UT by SIGNUS in 2017. * SFR: Solid Fuel Recovered. Source: in-house based on SIGNUS [69].

Figure 5.
GHG emissions from the reuse of ELT and materials from ELT recycling (2017). * SFR: Solid Fuel Recovered. Source: in-house based on SIGNUS [69,71].


Table 1.
Greenhouse gas (GHG) emissions of SIGNUS by scope and categories. Data corresponding to the year 2017.
Table 1.
Greenhouse gas (GHG) emissions of SIGNUS by scope and categories. Data corresponding to the year 2017.
| SCOPE | Sources | Resource/Units | Consumption ** | EF * (kg CO2e/u) | GEI (kg CO2e) (a) | GEI (t CO2e) |
| SCOPE 1 | Corporate vehicles | liters | 9411.76 | 2.38 | 22,400.00 | 22.4 |
| SCOPE 2 | Electricity | kWh | 16,651.16 | 0.43 | 7160.00 | 7.16 |
| Sources | Resource/Units | Consumption ** | EF *** (t CO2e/u) | GEI (t CO2e) (b) | GEI (t CO2e) | |
| SCOPE 3 | Collection and sorting | tonnes of tires | 22,427.00 | 0.07 | 1567.54 | 13,037.29 |
| Recycling—Recovery | 164,099.00 | 11,469.75 | ||||
| Transportation | ||||||
| TOTAL | 13,066.85 |
Table 2.
Stage 1: Assigning resources impacts to SIGNUS’s activities (2017).
| Activity Level | Totals (t CO2e) A | Activity Driver B | Driver Number C | GHG/DRIVER (t CO2e/ton) D = A/C UNRWA | Reutilization | Recycling-Material Valuation | Recycling-Energy Valuation | |||
|---|---|---|---|---|---|---|---|---|---|---|
| Driver Number E | GEI (t CO2e) F = D + E | Driver Number G | GEI (t CO2e) H = D*G | Driver Number I | GEI (t CO2e) J = D*I | |||||
| Activities at company level (facility level) | ||||||||||
| Management | 29.56 | number of managers | 50 | 0.59 | 29 | 17.14 | 18 | 10.64 | 9 | 5.32 |
| Activities at the production line level (product-sustaining level) | ||||||||||
| Collection + sorting (reuse preparation) | 1567.54 | tonnes | 186,526.00 | 0.01 | 22,427.00 | 188.47 | 94,673.00 | 795.62 | 69,426.00 | 583.45 |
| Recycling +transportation | 11,469.75 | 164,099.00 | 0.07 | 94,673.00 | 6617.20 | 69,426.00 | 4852.55 | |||
| TOTAL GHG EMISSIONS (t CO2e) | 13,066.85 | 205.62 | (1) 7423.46 | (2) 5441.32 | ||||||
Table 3.
Stage 2: Assigning activity impacts to SIGNUS objects of impact (2017). Source: in-house based on SIGNUS [69].
Table 3.
Stage 2: Assigning activity impacts to SIGNUS objects of impact (2017). Source: in-house based on SIGNUS [69].
| Removed Recycling Material | Rubber | Steel | Textile | Others | ||||||||
| Recycling Process | Totals (t CO2e) A | Object Driver B | Driver Number C | GHG/DRIVER (t CO2e/ton) D = A/C UNRWA | Driver Number E | GEI (t CO2e) F = D + E | Driver Number G | GEI (t CO2e) H = D*G | Driver Number I | GEI (t CO2e) J = D*I | Driver Number K | GEI (t CO2e) L = D*K |
| Recycling material valuation (1) | 7423.46 | tonnes | 94,673.00 | 0.08 | 59,627.40 | 4770.19 | 22,952.49 | 1836.19 | 11,994.02 | 959.52 | 99.00 | 7928 |
| Removed Recycling Material | Grinding | Electrical Power | ||||||||||
| Recycling Process | Driver Number | GEI (t CO2e) | Driver Number | GEI (t CO2e) | ||||||||
| Recycling energy valuation (2) | 5441.32 | tonnes | 69,426.00 | 0.08 | 66,731.80 | 5355.72 | 2695.00 | 216.29 | ||||
Publisher’s Note: MDPI stays neutral with regard to jurisdictional claims in published maps and institutional affiliations. |
© 2021 by the authors. Licensee MDPI, Basel, Switzerland. This article is an open access article distributed under the terms and conditions of the Creative Commons Attribution (CC BY) license (https://creativecommons.org/licenses/by/4.0/).
Share and Cite
MDPI and ACS Style
Avilés-Palacios, C.; Rodríguez-Olalla, A. The Sustainability of Waste Management Models in Circular Economies. Sustainability 2021, 13, 7105. https://doi.org/10.3390/su13137105
AMA Style
Avilés-Palacios C, Rodríguez-Olalla A. The Sustainability of Waste Management Models in Circular Economies. Sustainability. 2021; 13(13):7105. https://doi.org/10.3390/su13137105
Chicago/Turabian StyleAvilés-Palacios, Carmen, and Ana Rodríguez-Olalla. 2021. "The Sustainability of Waste Management Models in Circular Economies" Sustainability 13, no. 13: 7105. https://doi.org/10.3390/su13137105
Note that from the first issue of 2016, this journal uses article numbers instead of page numbers. See further details here.