
Digital Twin of COVID-19 Mass Vaccination Centers
by
 ,
,
Francesco Pilati
1,*, 
Riccardo Tronconi
1, 
Giandomenico Nollo
1,
Sunderesh S. Heragu
2 and
Florian Zerzer
3 1
Department of Industrial Engineering, University of Trento, Via Sommarive 9, 38123 Trento, Italy
2
Industrial Engineering and Management Department, Oklahoma State University, Stillwater, OK 73107, USA
3
South Tyrol Public Healthcare Agency, Via Cassa di Risparmio 4, 39100 Bolzano, Italy
*
Author to whom correspondence should be addressed.
Sustainability 2021, 13(13), 7396; https://doi.org/10.3390/su13137396
Submission received: 7 June 2021
/
Revised: 23 June 2021
/
Accepted: 28 June 2021
/
Published: 1 July 2021
(This article belongs to the Special Issue Social, Economic and Environmental Sustainability in Vaccination Logistics: Global Supply Chain Experiences and Perspectives on COVID-19 Vaccination)
Abstract
:The problem is the vaccination of a large number of people in a short time period, using minimum space and resources. The tradeoff is that this minimum number of resources must guarantee a good service for the patients, represented by the time spent in the system and in the queue. The goal is to develop a digital twin which integrates the physical and virtual systems and allows a real-time mapping of the patient flow to create a sustainable and dynamic vaccination center. Firstly, to reach this goal, a discrete-event simulation model is implemented. The simulation model is integrated with a mobile application that automatically collects time measures. By processing these measures, indicators can be computed to find problems, run the virtual model to solve them, and replicate improvements in the real system. The model is tested in a South Tyrol vaccination clinic and the best configuration found includes 31 operators and 306 places dedicated for the queues. This configuration allows the vaccination of 2164 patients in a 10-h shift, with a mean process time of 25 min. Data from the APP are managed to build the dashboard with indicators like number of people in queue for each phase and resource utilization.
1. Introduction
Since the beginning of 2020, the world has been facing a devastating pandemic called COVID-19, which has caused more than 150 million infected people and 3 million deaths as of the end of April 2021 [1]. To combat the virus, in the second half of 2020, different mass testing campaigns were carried out in Europe, such as the Slovakian mass testing, implemented in November 2020 to break the chain of contagion [2]. A second action carried out to face the pandemic was the establishment of local lockdown on the most affected areas. To do that, it could be important to predict the contagion trend in a specific region and prevent future problems such as full hospitals. Kim et al. [3] presented a model that, according to the characteristics of the dataset, finds the classification algorithm which better predicts future trends. They demonstrated that this model provides a solution quickly and, thus, allows digital technologies to save time and electrical power and be more sustainable from different perspectives. Moreover, as a new promising way to defeat the coronavirus, in December 2020 the first vaccine against COVID-19, developed by Pfizer-BioNTech, was approved by European Medicines Agency (EMA), which recommended the administration to people above 16 years of age [4]. This vaccine is stored in trays which contain 195 multidose vials, each of which contains five doses. One issue of this vaccine is that it must be transported at very low temperatures, between −60 °C and −80 °C, which can be reached through ultra-cold freezer [5]. Very few countries had these refrigerators and, thus, all the other European nations had to improve their cold chain to deal with this logistic problem [6]. Besides Pfizer-BioNTech, several vaccines have been approved and provided to all the countries, many of which require higher temperatures [7].
These different vaccine types are a relevant support to reduce the infectability of this coronavirus, represented by the indicator R0. This indicator is important in a Susceptible-Infected-Recovered (SIR) model to understand whether the pandemic can be contained and how much time it takes. R0 is strongly affected by the probability of contact between two people and, consequently, it depends on the beginning and the duration of the restrictions. By knowing the start and the duration of a lockdown, it is possible to predict the time of occurrence and the impact of a future new wave of the pandemic and test the different scenarios according to the delay in starting a lockdown [8]. As stated above, vaccination plays an important role in lowering the epidemic. Sandmann et al. demonstrated that a massive vaccination campaign in the UK can reduce both the number of infections and the number of deaths over 10 years without recurring physical distancing restrictions [9]. To dramatically decrease the pandemic infections, the Centers for Disease Control and Prevention suggested administering the vaccine first to residents and personnel of long-term care facilities and healthcare workers because they are in the vulnerable population [10]. Because the proportion of population to vaccinate in this first phase is low, the number of doses is limited, and most countries have organized the vaccination in existing clinics. When the majority of the population needs the vaccine, nations will have to be ready to organize large mass vaccination structures to vaccinate many people every day [6]. Some countries have already designed the settings for a mass coverage. In Belfast, for example, the SSE Arena will become the mass vaccination center for the Northern Ireland adult population under the age of 60. It will open in April and will be a supporting structure for vaccination besides the normal pharmacies [11]. Furthermore, Israel administered almost one million doses up until the end of 2020, in a population of 9.3 million people. This rapid roll-out of the vaccine is due to specific characteristics of this country. Firstly, the number of people over the age of 60 is very low and, thus, the number of doses requested were limited. In addition, the urbanization made the distribution to the single settings easier. Moreover, Israel is used to national emergencies and, consequently, has ready access to large facilities for a national mobilization. All these factors helped Israel administer 950 thousand doses in 10 days, from 20th to 30th of December 2020, becoming the third country, after China and the US, for administered doses [12]. The switch from existing basic settings to mass vaccination clinics introduces logistic issues because the latter shares some characteristics in common with industrial setting, where the efficiency becomes a key factor and resources must be effectively utilized. Since these mass clinics can be considered as manufacturing systems, and since manufacturing in Industry 4.0 has been spreading very fast during recent years, the Fourth Revolution technologies can also be applied in the vaccination process, even if it is a service process.
Since the last decade, the industrial sector has entered into the so-called Industry 4.0 era. This is considered the fourth industrial revolution and aims at digitalizing industrial processes. It is characterized by technologies like Cyber-Physical Systems (CPS) and Internet of Things (IoT) which enable both connection between different devices and gathering of data, to improve the entire system in real time [13]. Industry 4.0 principles can be applied to assembly systems to reduce set-up costs, enable fast learning, and to increase the flexibility of these systems. Devices are connected and can exchange data that are then translated into usable information. This information is used by the production line to self-adapt in response to changes caused by external factors [14]. IoT is linked to Radio Frequency Identification (RFID) technology which provides data about each machine or device with a RFID-tag attached to them [13]. RFID is used in industrial processes such as assembly. Andriolo et al. developed a RFID pick-to-light system which leveraged a wearable RFID reader and RFID tags on the shelves to send data to a central server. According to the picking list of the operator, the central server highlights the stock location with a specific color light unless the location is incorrect and, consequently, a red light informs the operator of the mistake [15]. The connection between machines created by IoT helped the development of digital twins, which are virtual models that represent physical systems and their modification in real time. Digital twins exploit sensors, anchors and other IoT technologies to gather real-time data of the physical system and become more reliable. Then, they can simulate several scenarios and predict what could happen in the real world if a specific event occurred. Thus, there is a bidirectional flow of data, both from the physical system to the virtual system and vice-versa. The former is performed through IoT technologies that allow the digital twin to change in real time. The latter improves the real process after having checked the results through virtual simulations [16]. Many contributions in the literature show that Industry 4.0 improves both the environmental and the social performance of the companies. From the environmental perspective, Industry 4.0 reduces waste, energy consumption and greenhouse gases emission through data analysis of production and service processes. From the social point of view, digitalization supports employees in arduous and repetitive activities, increasing their satisfaction and motivation [17]. With respect to environmental sustainability, IoT can help to implement simulation tools for the Food Supply Chain management. In particular, this simulation tool can run multiple scenarios and find the decisions that minimize food waste [18]. Authors of [19] showed how the COVID-19 pandemic has increased the investment on Industry 4.0 technology in Italy, like digitalization of working or purchases on digital technologies. They also underlined that organizations which invested more on digitalization in recent years faced the pandemic better than the others. As stated by Vaccari et al., IoT technologies are useful to collect data regarding patient’s health conditions and, consequently, to develop machine learning algorithms to refine the mechanism of symptoms identification [20]. Especially for the COVID-19 pandemic, the IoT can collect data through its architecture from the physical layer and send them to the digital counterpart to be analyzed. The real-time data analysis allows the prediction of pandemic evolution or the continuous monitoring of infected people to treat them remotely where possible [21,22].
Starting from the gaps highlighted in the previous paragraphs, this paper develops a digital twin for the design of a walk-in vaccination clinic and its real-time management. The study has been specifically applied to mass vaccination against COVID-19 which would be of particular interest in 2021 to severely impede the growth of this pandemic and reverse the trajectory. This work is among the first that deals with the development and implementation of a Digital Twin in a mass process like the mass vaccination campaign. Moreover, to create this digital framework, the technology used is cost-efficient and easy to install since it exists just in common smartphones with a pre-installed new application. This digital twin integrates the simulation of a real vaccination process, to find the ideal configuration of the clinic, with information systems, to collect data and observe the physical system in real-time. Indeed, the specific motivation that has guided this work is threefold: the possibility to digitalize a real service process which could fall into severe inefficiencies, the collection of real data that can make the virtual model more reliable, and the acquisition of real-time information from the physical vaccination center that can present in real-time. This mapping of the real-world is important to improve the planning of the clinic in an adaptive way. This digital twin becomes a sustainable solution because it uses fewer physical resources and space to dedicate to a huge event such as a mass vaccination.
The remainder of the paper is organized as follows. Section 2 reports a brief literature review on simulation models in healthcare and the use of digital twin in different sectors. In Section 3, the problem is defined, with the description of the vaccination process and the importance of the data collection to increase its reliability. Section 4 presents the mathematical model and the technology used for the digitalization of the process of collection. In Section 5 there is a description of the case study while Section 6 reports the results obtained. Finally, Section 7 contains the conclusions of the paper and future research on this topic.
2. Literature Review
Computer Simulation is an Operation Research method and a simulation model is a virtual representation of the real world which can be used to test alternate scenarios and find the best one according to specific outputs [23]. This method is widely used in healthcare, especially during the last two decades when simulation has been more studied. Indeed, much of the literature about simulation modelling in healthcare has been written after 2000. Among the different simulation techniques, Discrete-Event Simulation is the second most applied technique for medical purposes such as resource planning and risk assessment [24]. For example, simulation techniques were implemented to assess the risks and benefits of administering the vaccine against Rotavirus to infants in France. The quantitative benefit-risk models (qBRms) are more precise but more complicated, so the researchers applied a Discretely Integrated Condition Event (DICE) simulation. They collected all the conditions as inputs, performed changes which could cause a modification on the parameters and found the outputs of the problem to understand the pros and cons of the vaccination in terms of hospitalizations and deaths [25]. Ahmed and Alkhamis [26] performed simulation and optimization to solve a planning problem for emergency department healthcare in Kuwait. They modeled the actual physical system via simulation, and improved it with an optimization model, to create a decision support system. The output parameters optimized were the throughput, that is the number of patients processed per hour, and the average waiting time in the system. Hernandez et al. [27] presented another integration between simulation and optimization modelling. Here, the goal was to design an ideal Point of Dispensing (POD) by minimizing the waiting time and maximizing the throughput. The process is more complex than the one in [26] because it considered the possibility for a patient of having already filled in the form or being rejected after the medical evaluation.
Simulation models are particularly useful in modeling mass campaigns, where many people must be processed in few days. Hupert et al. [28] developed a simulation model to predict the system behavior and plan the antibiotic distribution after a bio-terroristic attack. They tested three scenarios with different levels of disease prevalence to find, for each situation, the optimal staffing in each phase of the process. In their paper, the researchers used statistical distribution for working times and considered different paths according to the patient category. A drawback of the paper is that the arrival rate was represented by a statistical distribution which stayed constant for the entire working day. Another mass event was the one presented by [29] whose authors developed a discrete-event simulation model to configure a mass vaccination walk-in clinic. The peculiarity of their study is the collection of data through tables at the beginning of each phase, where the timestamp is recorded. On the other hand, this kind of data collection is static and represents just the specific situation tested because there is no communication between the tables and the virtual system. A discrete-event simulation model was developed to design a drive-through clinic in the city of Louisville, Kentucky, for the mass vaccination against H1N1 pandemic in 2009 [30]. The objective was to find the best configuration in terms of average cycle time and average waiting time in the consent tent. For this model, the researchers supposed exponential distributions for the interarrival times and triangular distributions for the working times. They tested multiple scenarios to find the ideal number of operators to allocate to each phase of the process. As also confirmed by [31], the best scenarios were compared with the real situation measured by the University of Louisville during the mass vaccination campaign. Starting from the Kentucky example, Asgary et al. [32] presented a simulation model to plan a drive-through clinic against COVID-19. The limit of these last two papers is the creation of multiple queues, one for each resource of a phase, which decreases the efficiency of the entire process. A problem shared by all these aforementioned papers is the creation of static models based on pre-collected data, without a dynamic real-time adaptation according to what is happening on the physical system. In other words, the literature has numerous papers pertaining to simulation models in healthcare, but there are few contributions on the digital twin concept.
The digital twin concept was introduced for the first time in 2003 at the University of Michigan and it consists of a three-part system. The first part is the physical object, the second part is the virtual object that represents the physical object in a reliable way, and the integration of data and information between these two objects [33]. For example, the virtual object can virtually represent a shoe for a football player by inserting into the physical shoe a sensor which communicates information like speed and position. With this information, coaches and trainers can test different scenarios and improve the players’ performance [34]. NASA and the U.S. Air Force also adopted the digital twin to test their vehicles. In fact, before the introduction of this concept, they created a model based on a probability and reliability methodology which failed when the real system changed and thus did not represent the changed reality. Digital twin collected all the data from sensors, fleet history and maintenance to mirror the behavior of the real system in a virtual environment. Through this virtual system, it was possible to study the physical system status in real time and predict if the mission would have been successful [35]. Coelho et al. [36] improved the concept of digital twin in manufacturing, expanding its dimensions from three to six. Besides the physical system, the virtual system, and data integration, they added the service system, the decision-support system (DSS) and the connection between all these dimensions. Their paper focused on the virtual system and the DSS dimensions. The former was developed for both the distribution and the production system and it was validated comparing its result with the real values collected in the physical system. The latter dimension was a consequence of the validation because, once validated, the simulation model can be used as a tool for the decision support for industrial logistics. Digital twin as a decision-support tool in manufacturing can be leveraged to increase the efficiency of the company. For example, it was used in a German food logistic company to plan the employees’ working shifts and find the optimal number of workers every day. To test the efficacy of the model, the planning was performed both with and without the digital support and an improvement was found on resource utilization [37]. Digital twin is also used in healthcare even if it is more complex than in manufacturing because of the physiology of everyone. This technology can collect data, through sensors, to represent a virtual patient even at the molecular level. By providing information about each patient, digital twin could enable doctors to monitor and treat people remotely [38]. Liu et al. [39] developed a digital twin to support Elderly Healthcare System with a real-time health monitoring. The physical part was represented by the patients, with some wearable sensors attached to them, and medical equipment. The virtual part is designed to display the physical condition of each patient and communicate each disease in real-time to the doctor. Digital twin often exploits mobile applications for Android or iOS. In healthcare, for example, the trend of heart monitoring through smart watches and mobile Apps is increasing dramatically. Authors of [40] developed an Android application to monitor the heart rate of the patients and communicate in real time, through a WhatsApp message, with the doctor if some values are not ok. These values are collected through wearable sensors which transfer the data to the smartphone through Bluetooth Low Energy technology. Thus, mobile applications integrated with physical devices, provided to the operators, allow the efficient development of a digital twin for any healthcare process. Karakra et al. [41] leveraged digital twin framework to address planning problems, such as staff scheduling or the reduction in waiting time. They integrated a discrete-event simulation model, which virtually represent the physical system, with IoT technologies, which collect data to update the model in real time. By testing different scenarios, they could find the optimal number of resources that increases the efficiency of the real system, in terms of waiting time on each phase and number of patients which enter and exit the system.
In this paper, simulation is integrated with Industry 4.0 creating a digital twin where the virtual and physical environment continuously communicate with each other. Indeed, after discovering and implementing the best settings for the clinic, the physical system is constantly observed and real-time interventions on it can be decided on if the virtual system detects some problems. To obtain information about the system behavior, a mobile application has been developed which collects the time measures and sends them to the decision-makers every day. Then, these data are analyzed and processed to understand the real situation in terms of queues and resource utilization, and to immediately fix any issue.
3. Problem Description
The problem involves vaccinating as many people as possible in the shortest time interval by leveraging the least amount of resources and space, and creating short queues and waiting times. We propose the development of a digital twin to plan and design a clinic for the vaccination process that dynamically changes through a constant bidirectional flow of information, from the physical to the virtual system and vice versa.
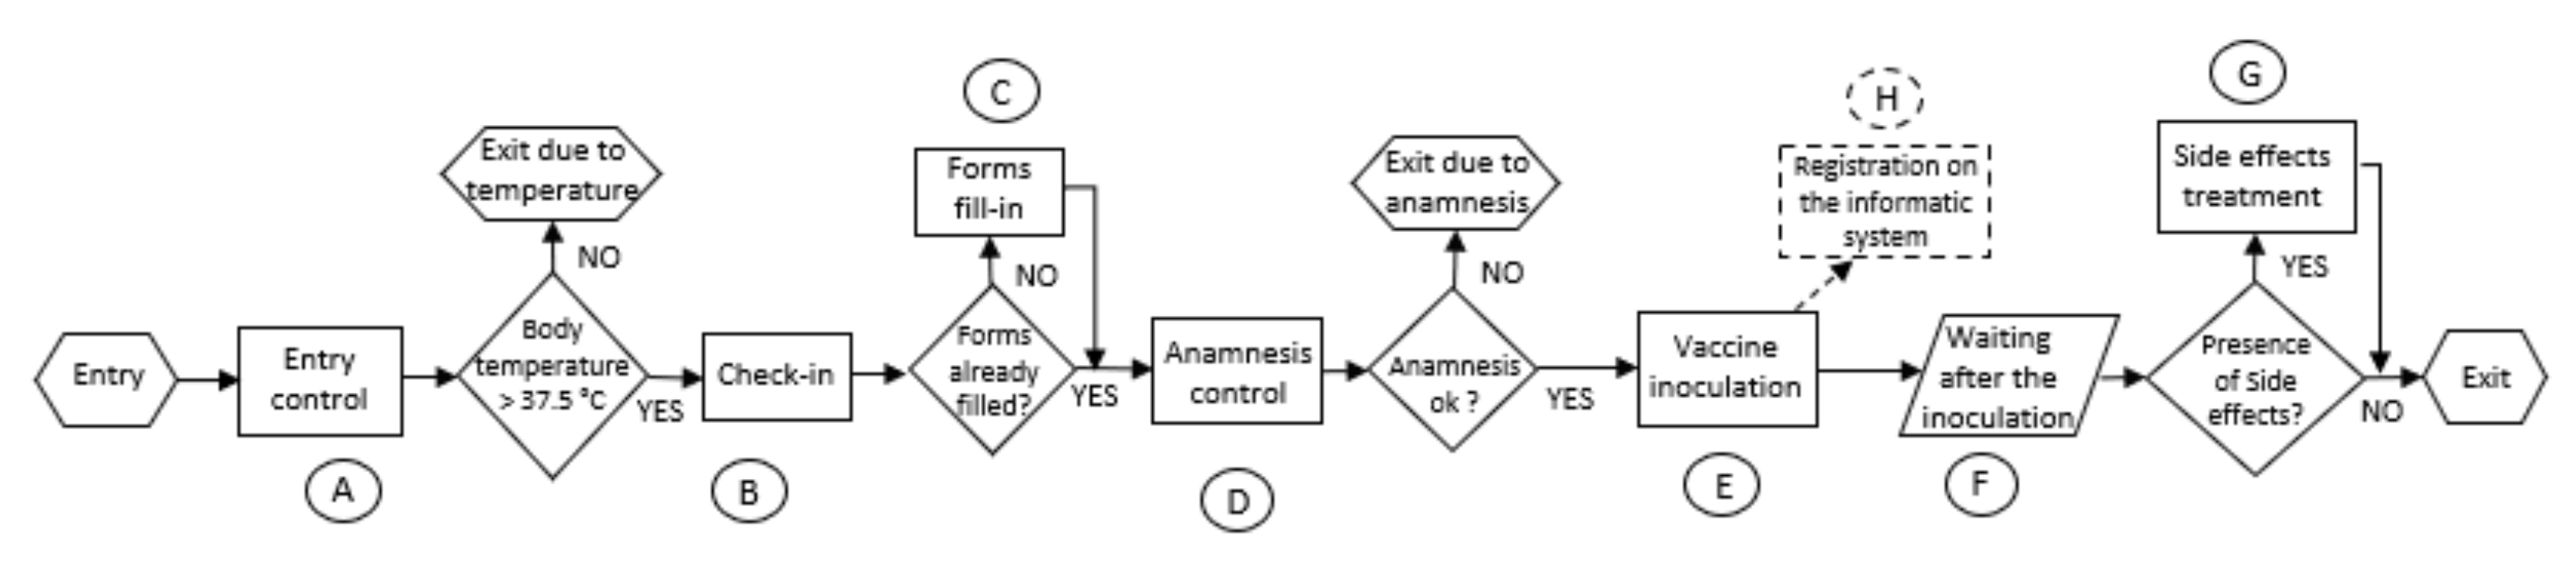
The first issue addressed is the design and planning of a clinic for any kind of walk-in mass vaccination, here applied for the vaccination against the specific pandemic of COVID-19. To deal with it, it is necessary to analyze the process in all its peculiarities (Figure 1). First, the process contains some differences both in terms of probability of an event and in terms of working times, according to the patient category vaccinated. Indeed, every phase is based on statistical distributions which represent the duration of the activity in a more reliable way than the single average measures. In addition, some of these phases are characterized by a probability for a particular event to occur, which makes patients take different paths according to the event occurrence. As can be observed from the figure below, the process includes four decision blocks which divide the flow according to these events. The first phase of the process is the entry control, where some volunteers measure the temperature of each person and give them both the anamnesis and privacy form to be filled if they have already completed them. If the temperature is under 37.5 °C, the patient can proceed to the phase B and check-in. Otherwise, they are rejected and exit the clinic. In the check-in phase, some volunteers simply direct the patient flow. People who have already filled the forms are directed to the anamnesis control phase (phase D), while the others are asked to fill in the modules in a specific area (phase C). In phase D, a doctor checks the patient’s health conditions and depending upon the answers on the anamnesis form, they can decide to not vaccinate the patient because of the underlying risk. Patients who respect all the necessary health conditions proceed to the inoculation phase (phase E), where nurses prepare and administer the vaccine. After the inoculation, patients must wait in a specific area for about 15 min to detect possible side effects, and this waiting is actually a part of the vaccination process (phase F). If, during this time, people need help, a specialized doctor intervenes to treat them (phase G), otherwise people can exit the system after waiting for 15 min. For the side effects treatment, this process also considers the eventual fear of this new vaccine which can lead people to ask for a treatment even if they do not have any reaction to the inoculation. The registration phase (phase H) is an activity performed by administrative people independently of the patient and consists of registering the personal information and the anamnesis of each patient on the informatic system.
To improve the reliability of a simulation model, data from the physical system are collected. In this way, decision makers rely on a well-structured model in which the working times and probabilities used are like the real ones. To be reliable, a model needs at least 50 measures of the same parameter, and the development of the statistical distribution which better fits these collected values. Indeed, a simulation model is more reliable if the working times of each phase follow a probabilistic trend rather than being defined by the fixed average value. Moreover, if the data collection is continuously performed, the virtual model provides a real-time mapping of the physical situation. Therefore, the integration of a static simulation model, which reflects the initial status of the vaccination process, with a tool for the automatic collection of real-time data is the solution for a dynamic and reliable system, even called digital twin.
4. Materials and Methods
In this section, we present the two parts that constitute the digital twin: the static simulation model and the digital technology for data collection.
4.1. Simulation Model
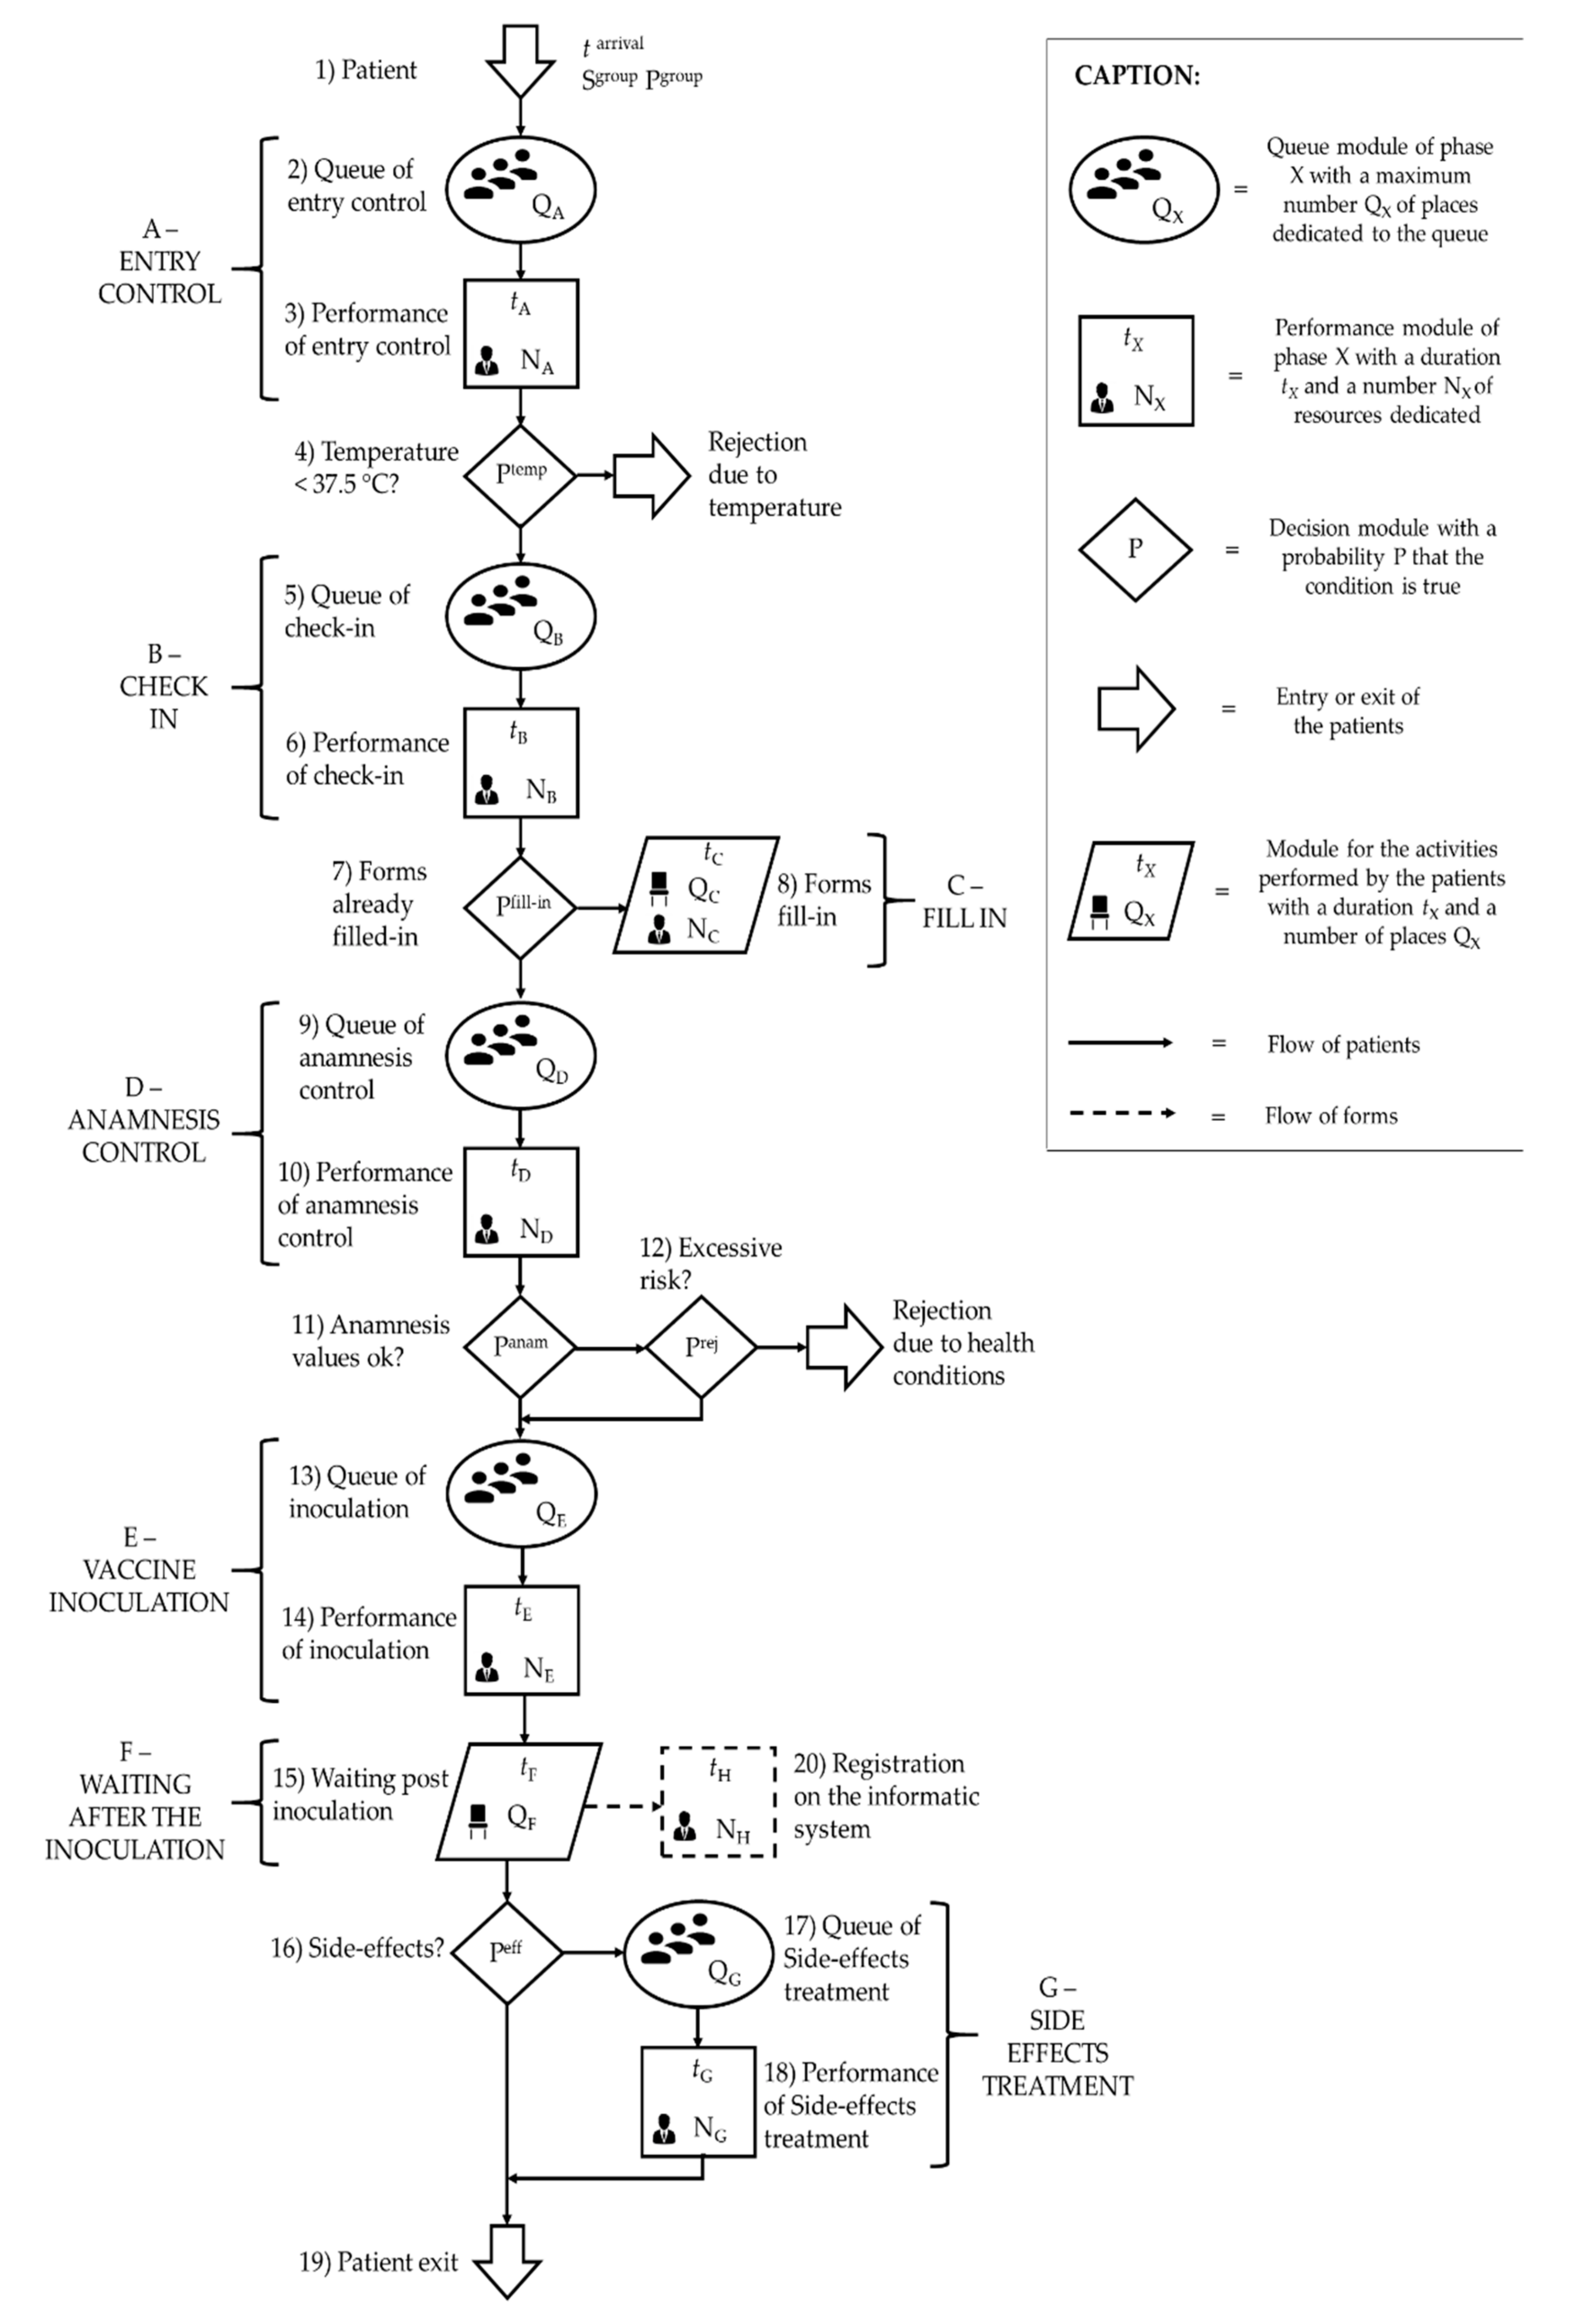
Beginning with the vaccination process flowchart described above, the simulation model is developed to virtually represent this process. First, the simulation model contains two entities, form and patient. The former represents forms such as anamnesis and privacy policy, which must be registered in the information system and, thus, is present just in a single phase (phase H) of the process. The latter is the main entity because it is present in the entire process. The resources of the model are all the operators which work in the different phases of the process. In particular, there are three kinds of resources: administrative employees, who perform the registration phase; volunteers, who can perform the entry control or the check-in phase, or can control the exit of the patients from the system; and healthcare workers (nurses or doctors), who can perform the anamnesis control, the inoculation or the side-effects treatment. The activities are represented in the virtual environment by one or more modules that contain all the parameters which characterize the module, such as time or number of resources (Figure 2). As described in Section 3, all the time-related parameters are defined by statistical distributions. The first module is the patient arrival inside the system. One of the parameters of this module is Sgroup which is the size of the group that enters the system at a specific instant and has a probability Pgroup related to each size. Another parameter is the time between two consecutive group arrivals (tarrival) which determines the hourly arrival rate. The second module is the queue of entry control which represents the waiting before the entry control phase. This module is characterized by QA, the maximum number of places to dedicate to the queue in phase A. This phase is the only one that includes a single queue for each resource, while the others have just one queue for the entire phase to increase the efficiency of the system. When at least one resource in phase A is idle, the patient proceeds to the performance of entry control module where there are NA volunteers carrying out the activity in a time tA, which is the statistic distribution of time to perform all the actions contained in the entry control phase. Module 4 is the decision module, where the probability that a patient can be rejected because the body temperature is higher than 37.5 °C is Ptemp. If the temperature is normal, the patient flows through modules 5 and 6 which represent phase B. Module 5 is the queue of phase B and, thus, it contains the parameter QB, while module 6 is the activity and is characterized by the time tB and the number of check-in operators NB. Then, a second decision module (module 7) appears with a probability Pfill-in of having already filled in the forms. If it is false, the patient proceeds to module 8, which represents phase C (forms fill-in). In this module, the parameter QC represents the maximum number of places to dedicate to the forms fill-in because phase C does not have any queue. The other parameters of module 8 are the duration of the activity tC, and the number NC of volunteers allocated to this phase. If the patient has already filled in the forms, he/she proceeds to phase D, contained in modules 9 and 10. As for the other phases, the former module is the queue, whose parameter QD represents the maximum number of places in the queue to dedicate to phase D, while the latter is the performance itself, characterized by the duration tD, which changes if the health conditions are ok or not, and the number of resources ND. The third decision module (module 11) manages the rejection due to health conditions and contains a probability that the values of the anamnesis are all good Panam. If the condition is not satisfied, decision module 12 defines the probability Prej to be rejected because some negative conditions do not affect the vaccination. Patients admitted to the vaccination flow through phase E. Here, they wait in module 13, characterized by QE, and then are processed in module 14, defined by duration tE and number of nurses NE. After the inoculation phase, patients must wait for possible side effects for an aleatory time tF in module 15. This can be considered as a queue with QF the maximum number of places to dedicate for the waiting. Module 15 is linked to the decision module 16 that manages possible side effects which can occur with a probability Peff. If the condition is true, modules 17 and 18 represent the side-effects treatment phase, with QG as maximum number of patients in queue, tG as the duration of the performance and NG as the number of doctors staffed. Time tG varies according to the fact that the patient shows real side effects or is just scared. Otherwise, patients exit the system through module 19. From module 14 the forms flow starts and reaches the module 20 which represents the registration of the information in the informatic system. The activity is performed by NH administrative operators in a time tH.
Table 1 lists the parameters described above, with their units of measure. All the time-related parameters represent statistical distributions, based on the values collected, and not a fixed value.
A simulation model must be tested to find the best scenario for multiple situations. The best scenario amongst these is the solution that optimizes the output indicators previously defined by the decision makers. Thus, it is important to list the output parameters in this specific model. The main output parameter is the number of patients vaccinated every hour per nurse (Npat/nurse). This parameter gives a measure of the system efficiency because it relates the number of people vaccinated with the number of resources available. In addition, the total number of patients vaccinated in a day (Npat) is a relevant measure to study the capacity of the system. Two time-related output indicators are the average and maximum time spent in the system (Tsys-avg and Tsys-max) and in the queue (Twait-avg and Twait-max) by each patient. These values give us an idea of the speed of the process and the percentage of the time lost for non-value-added activities. Finally, the third group of output parameters is the resources utilization (Ui, with i = phase of the process) which reflects both the effort in using the minimum number of resources and the avoidance of resource overutilization to reduce employee’s burnout and unsatisfaction. All these outputs are summarized in Table 2.
4.2. Digital Technology
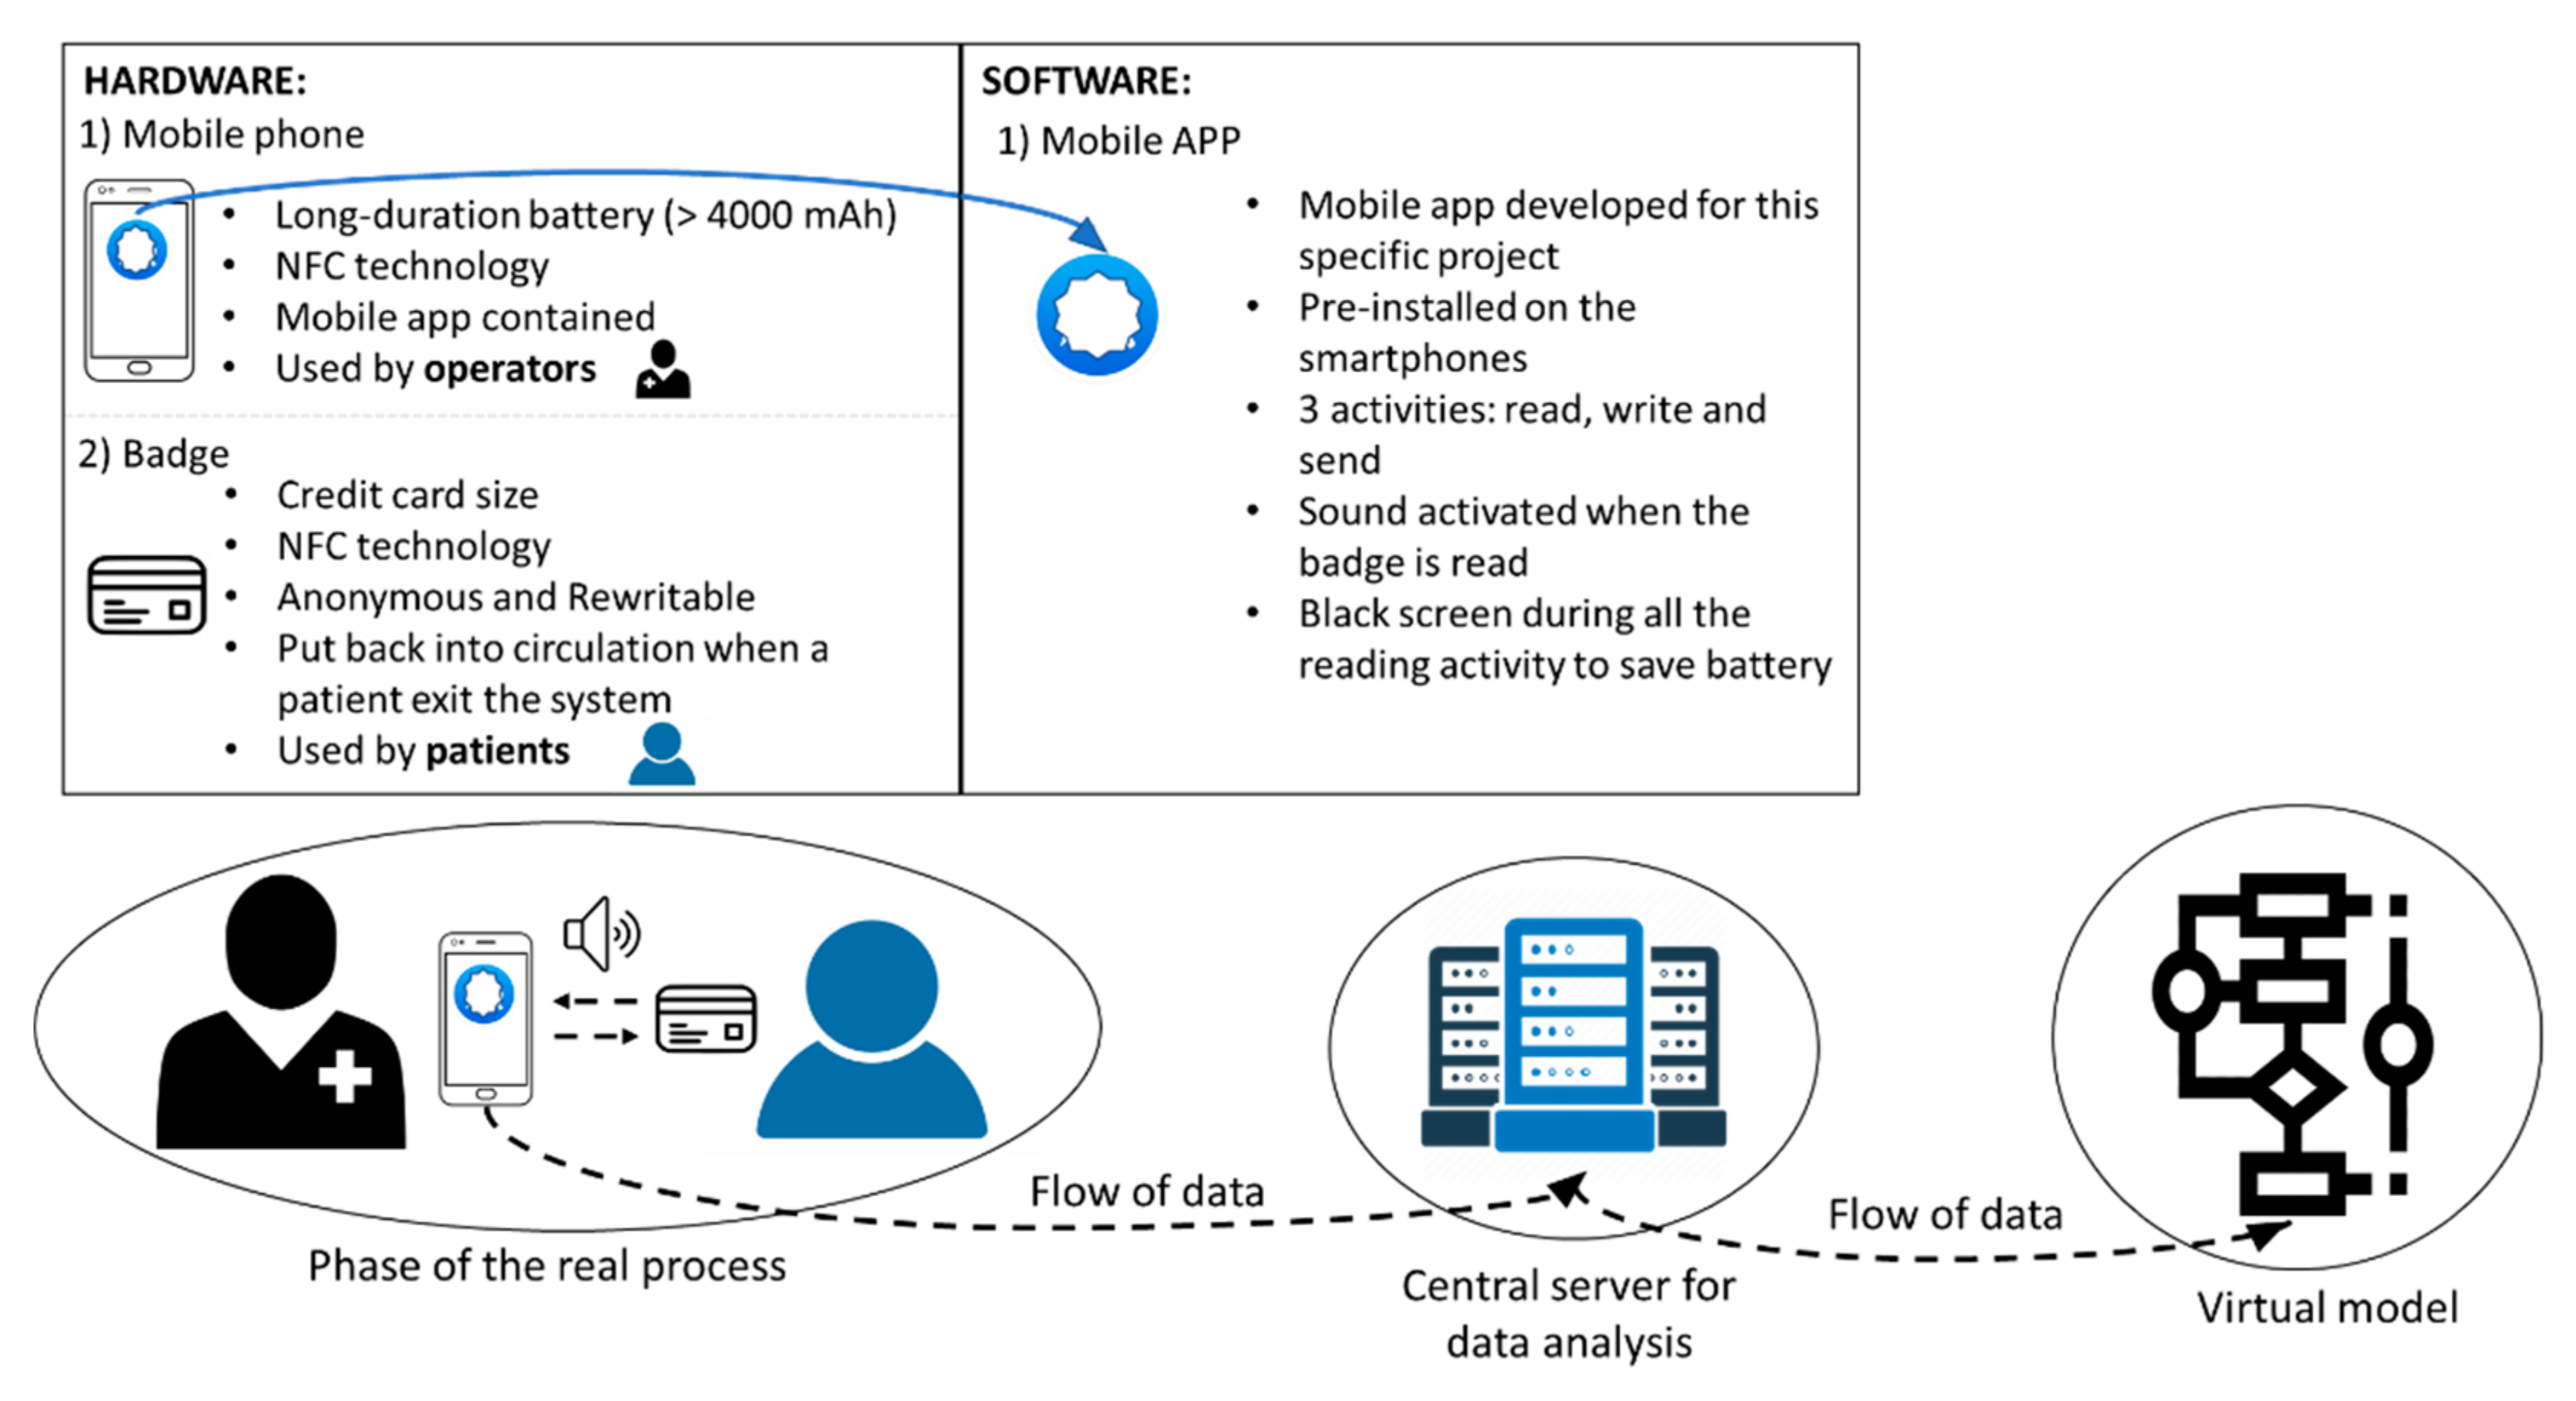
The data collection is automated through a digital technology that measures, stores and sends to the decision maker the time values. According to the information provided by this tool, planners can map the real process in an adaptive way and change some settings to adequate the system (Figure 3). This digital technology is composed of a hardware architecture and a software application. The hardware part is represented by readers, such as common mobile phones equipped with Near Field Communication (NFC) technology, and NFC tags, such as badges. The mobile phones can write or read information on the tag by simply getting closer to it through a novel software application developed and installed on them. This new mobile application was specially developed for this work with some properties that are useful for this specific purpose. The APP is designed in such a way that, during the scan activity, the screen is turned off and the smartphone can last the entire working day without being charged. Moreover, to detect the beginning and the end of each measurement, the application emits a sound both when the badge-phone contact begins and when this contact ends.
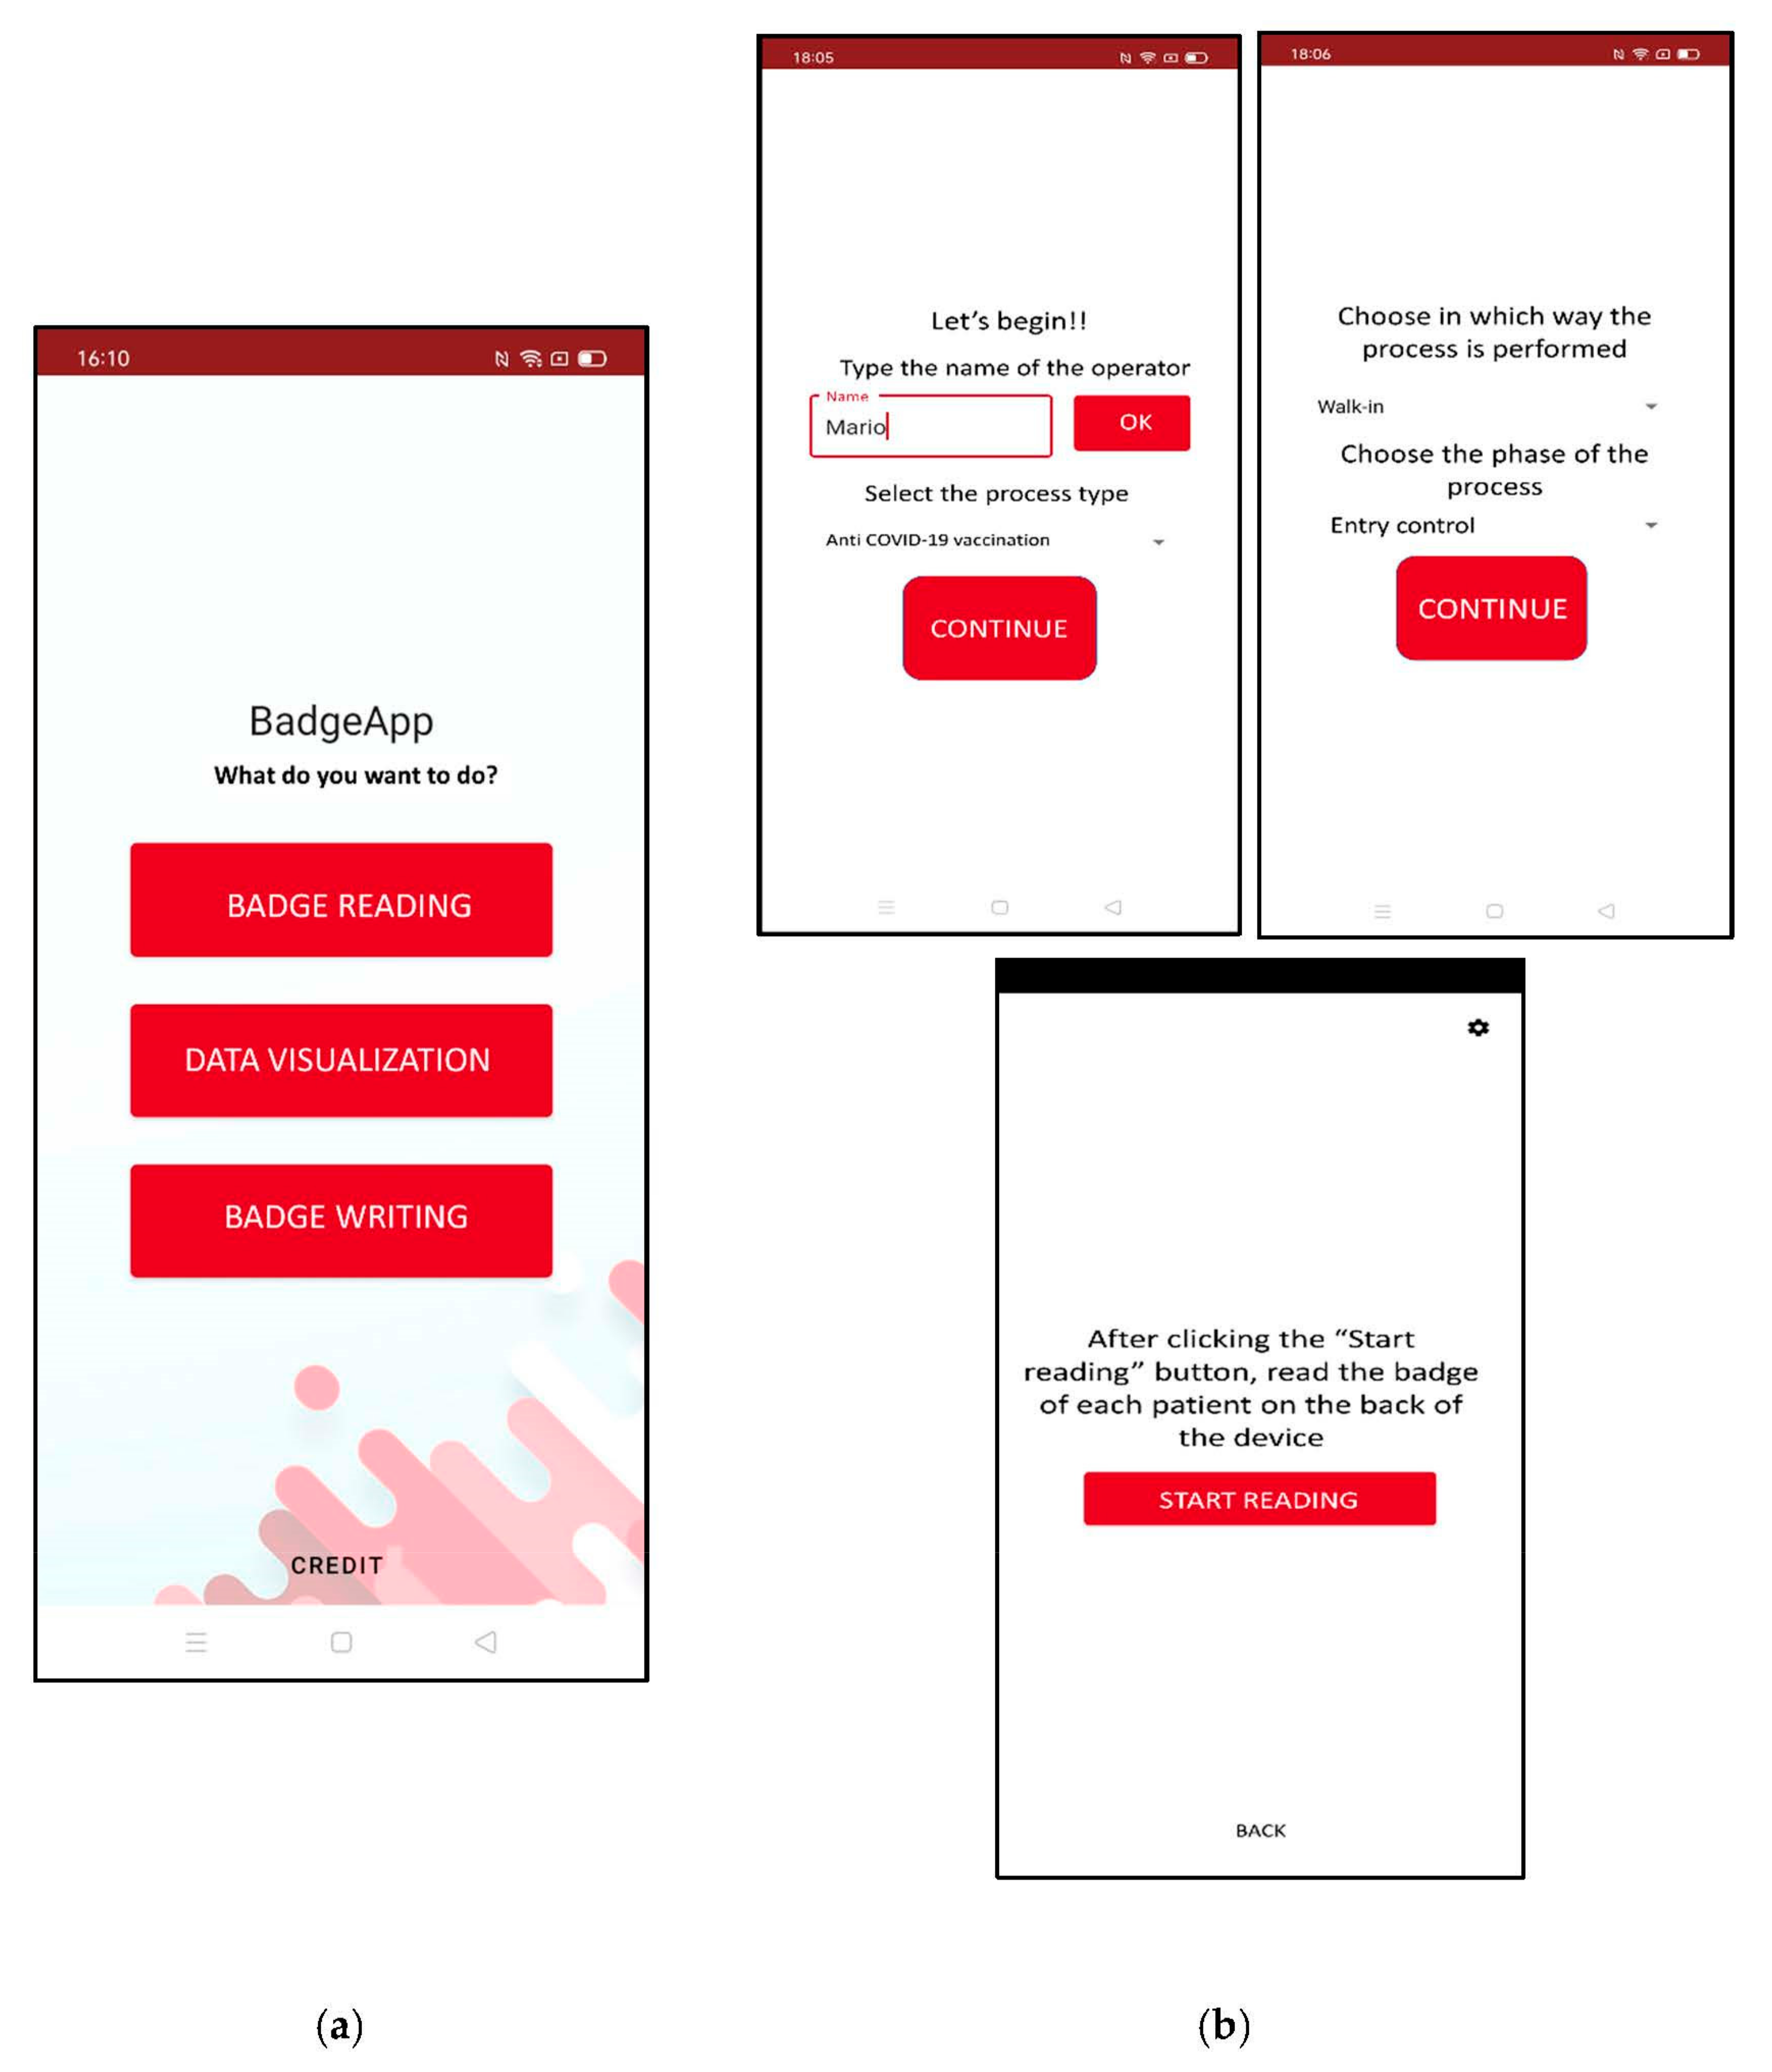
This software application can read the information on the NFC tag, write new information on it, visualize all the measures, and send them to the decision maker, as illustrated in Figure 4a. These activities are implemented by giving the smartphones to the employees and a badge to each patient. It is important to highlight the fact that the badges are anonymous and, because the number of patients is not previously known, are re-used when a patient exits the system. For the first phase, some settings must be decided before starting the reading, such as the process and the specific phase. The reading can be carried out in two ways. When the service is carried out by a resource, the badge is placed by the resource on the smartphone during the entire activity, collecting both the beginning and the duration of the activity. When the activity is carried out by the patient, such as forms fill-in, the contact badge-smartphone lasts just few milliseconds and is performed by the patient at the beginning and at the end of the activity to store the two timestamps (Figure 4b). The second phase is the visualization and sending of the collected measures. To perform this phase, operators must select the right folder and press the “share” button to send the data to the decision maker via email. The last phase is the writing of the badge, made before the system activation. Here, planners must write the new information in the specific pane and place each badge on one of the smartphones to move this information to the NFC tag.
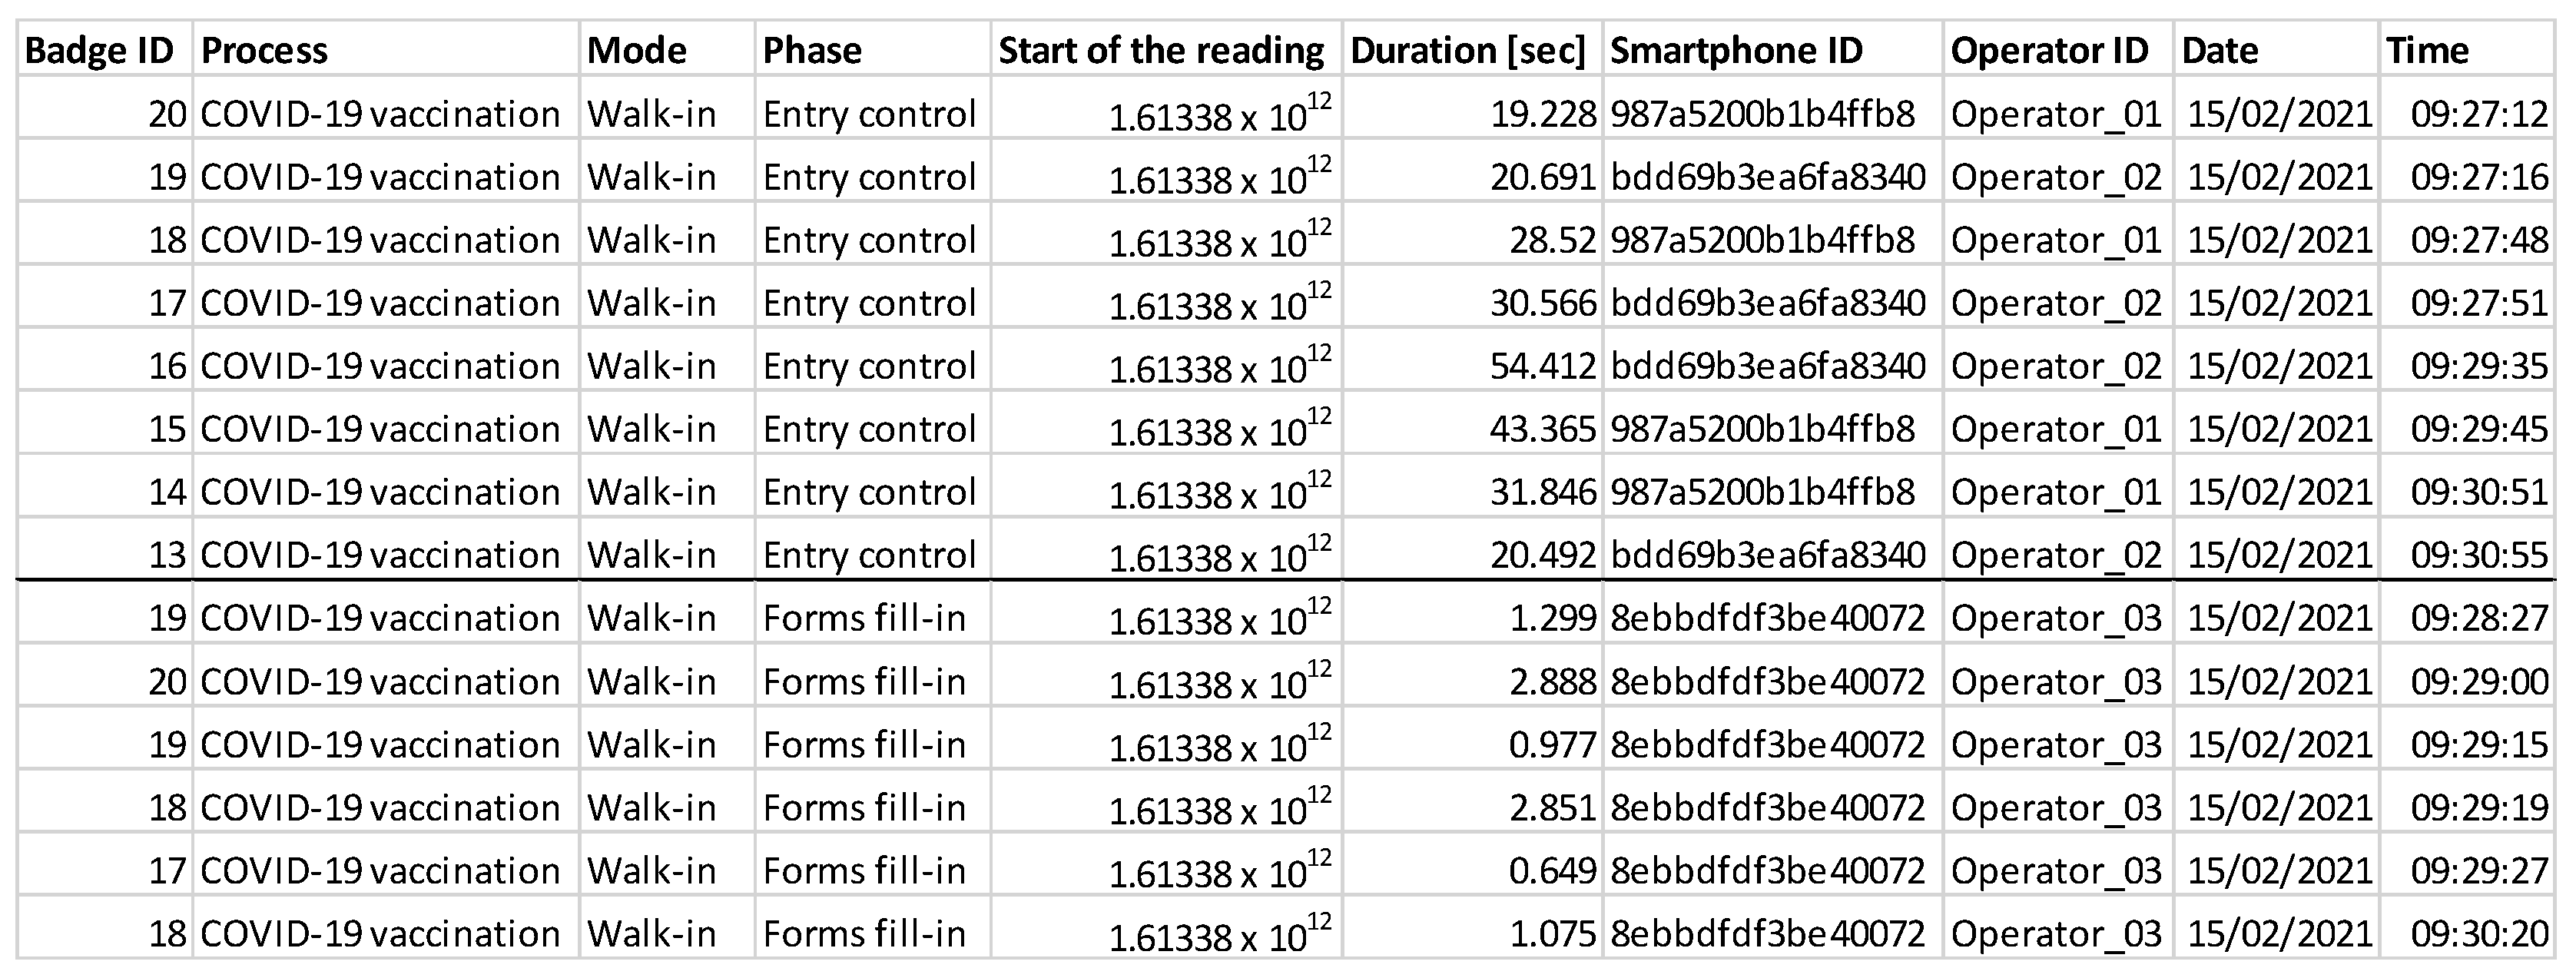
The data are sent by each smartphone to the decision maker as a .csv file. Thus, the decision maker receives as many files as the number of operators that use the digital technology and joins these files to create a single dataset converted into Excel format (Figure 5).
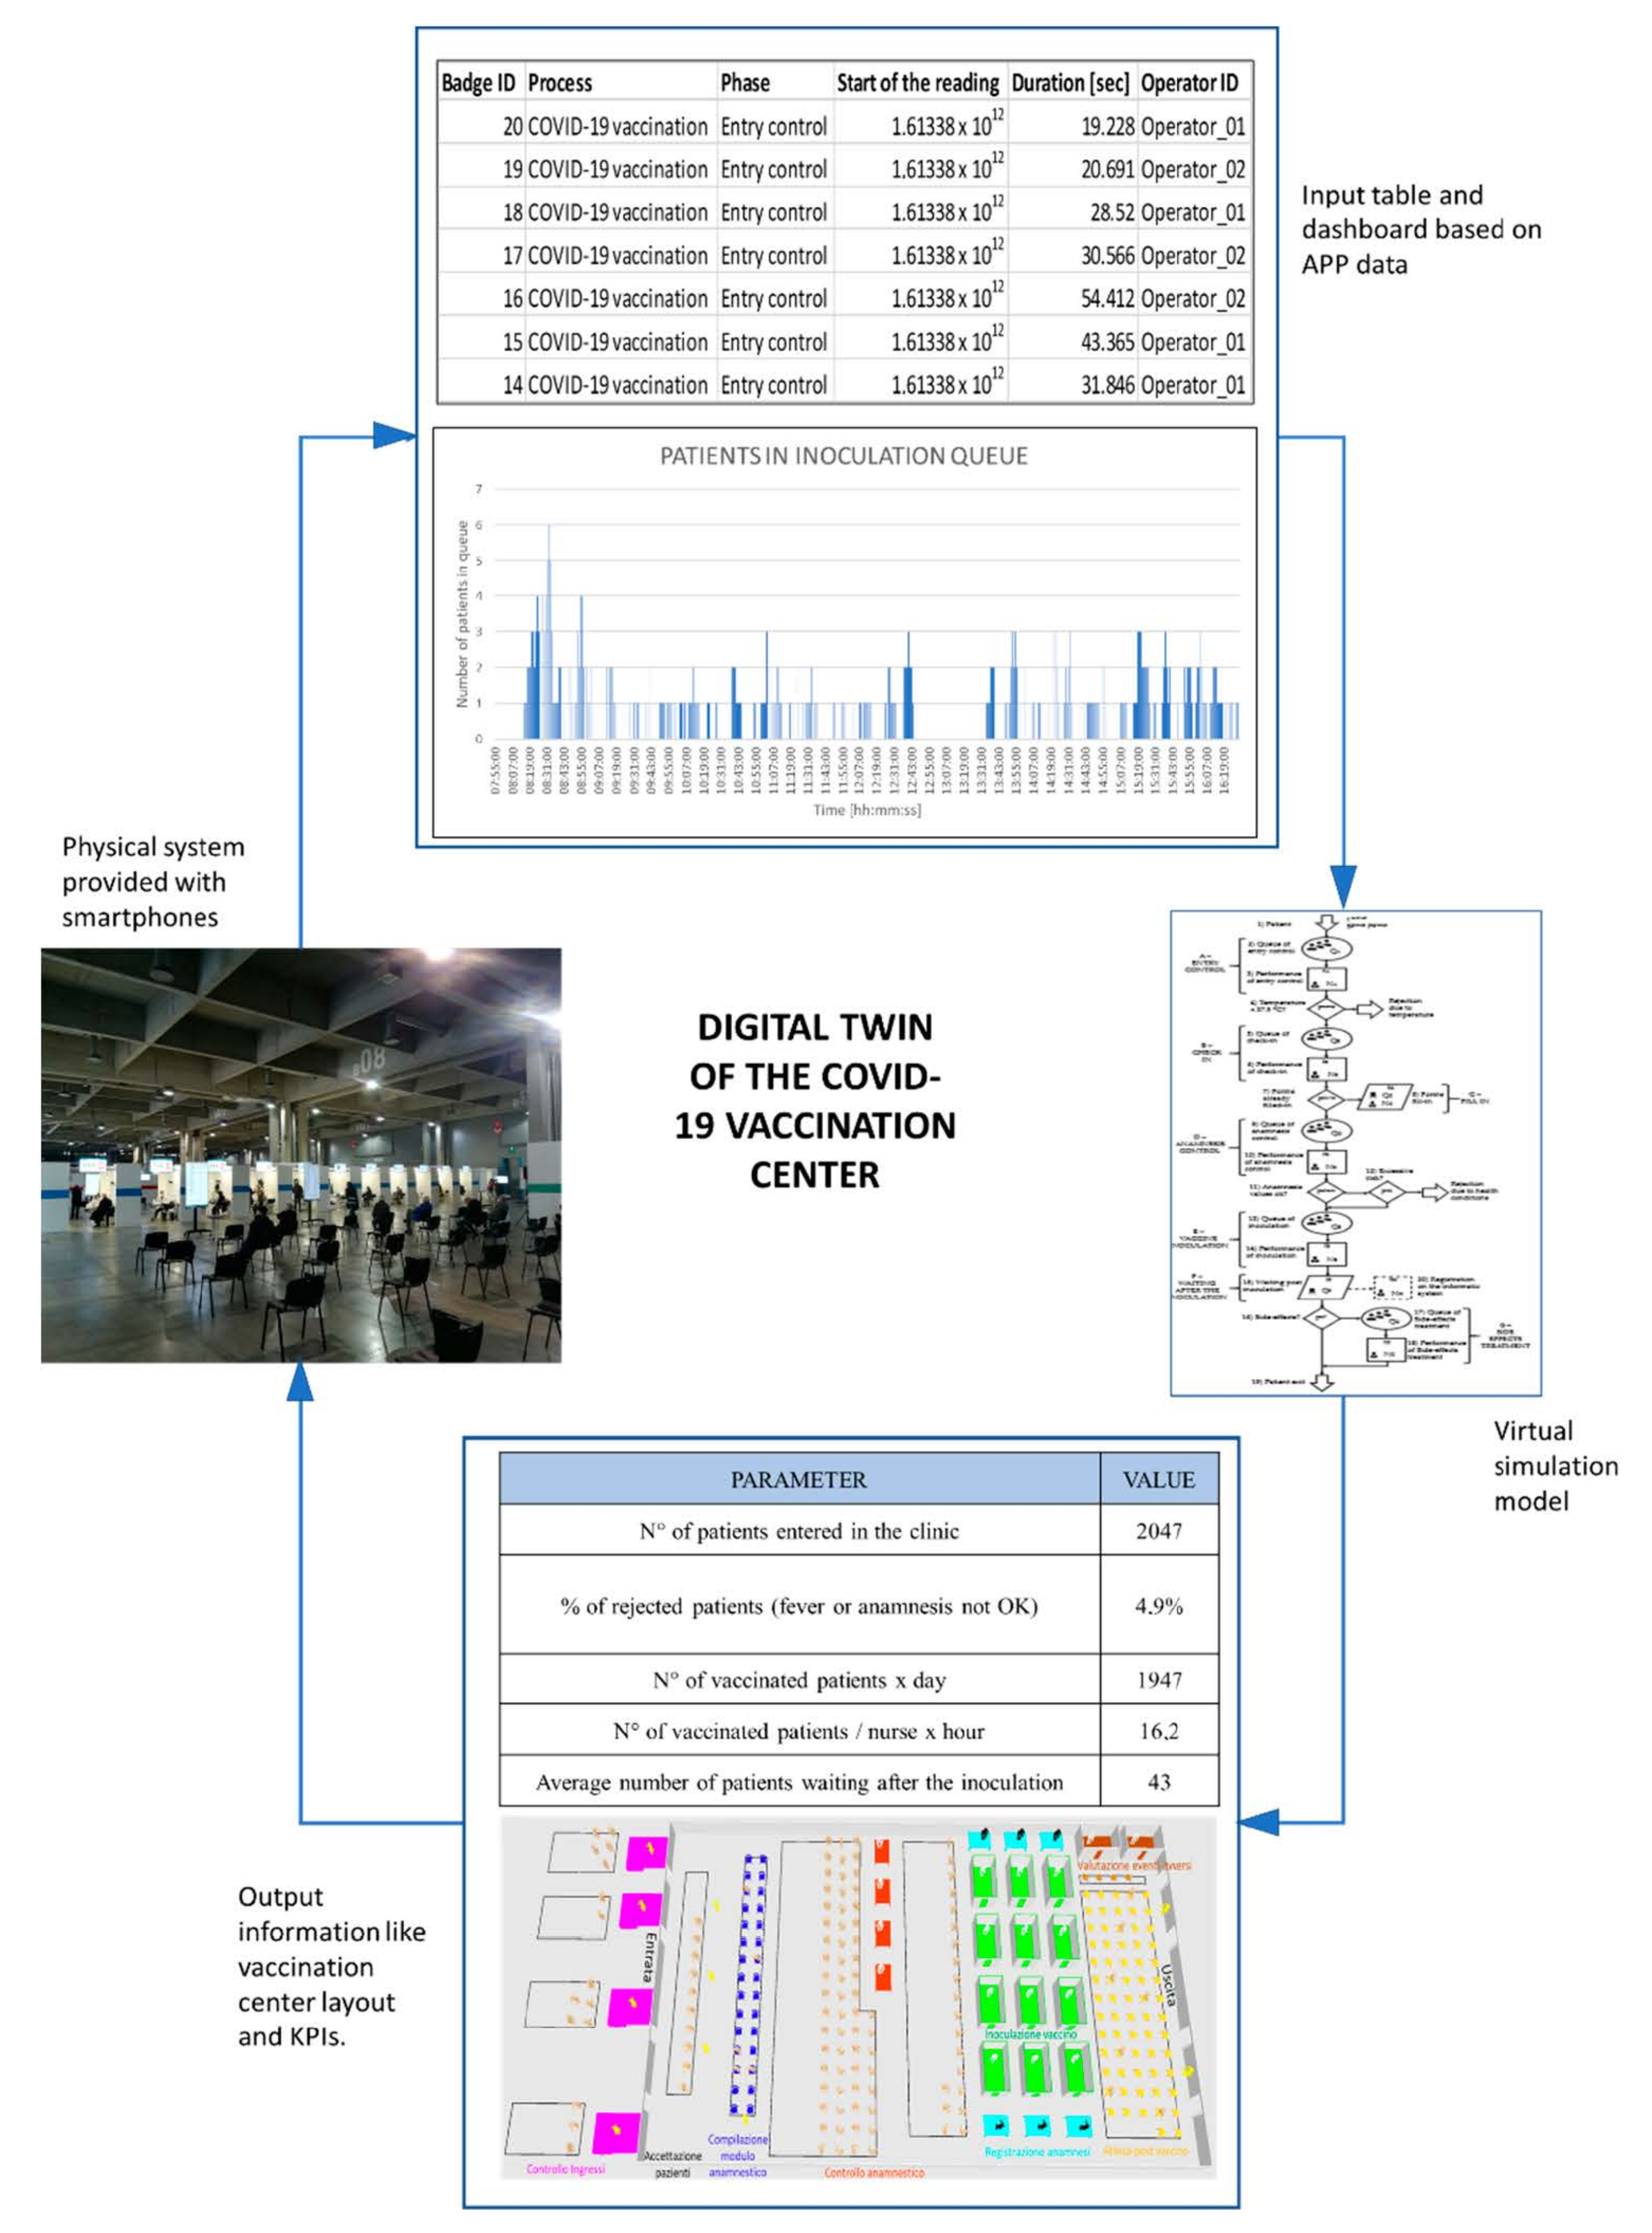
From Figure 4, it can be noted that the column “Start of the reading” contains the Unix time stamp, which is a common informatic language that represents the number of milliseconds from 1st January 1970. To make this information more suitable for all the users, the last two columns translate these values in Date and Time. The digital twin consists of the fact that this dataset from the physical system represents the input of the virtual system. Indeed, the dataset is elaborated through Excel to develop a dashboard which sums up the behavior of the real system and highlights emerged problems. Then, planners run the virtual model previously described to test various scenarios and find the best solution that solves these emerged issues. When a solution is defined that helps dealing with the problems, this is replicated in the physical system and the digital twin cycle is closed (Figure 6).
5. Case Study
The model was tested during a mass vaccination campaign against COVID-19 in South Tyrol. Although the model developed manages situations with multiple patient categories, in the case study the model is implemented just for adults. This results in lower working times, especially for forms fill-in, because elderly people are slower in writing their personal information, and for vaccine inoculation, because elderly people often wear a suit and tie and take more time to undress. In addition, some probabilities change between adults and elderly people, such as Pfill-in which is higher for adults since they are more used to technology and are likely to print the form at home. As argued before, the model needs real data to be reliable and, thus, researchers have visited several clinics for flu vaccination, in October and November 2020, to collect many measurements on those parameters that could be useful for the COVID-19 vaccination too. For each phase, about 100 time-related values were measured which are then inserted in a data-fitting software to find the statistical distribution that better represents these data. Researchers also collected measures of the time between two consecutive groups’ arrivals, and Table 3 shows the distribution for each time parameter in seconds. In particular, there are three main distributions that represent these time-measures: the triangular distribution (TRIA), the gamma distribution (GAMM) and the Weibull distribution (WEIB). From the process observation and the conversation with the clinic’s managers, the probability measures are defined and inserted in the simulation model (Table 4).
A second hypothesis to consider is the space available to implement a mass vaccination clinic. The most feasible solution is a sports arena because it is sufficiently large to receive a huge number of people every day. For this reason, researchers considered the standard dimensions of a sports arena and adapted them reaching a space of 67 m × 37 m. A smaller space would not have been feasible for a mass campaign while, if a larger space was necessary, the single layout could be replicated several times. The reference center considered for the clinic design was the Bozen expo Point of Dispense (POD) This POD is chosen because seems like the ideal system designed with the simulation model in terms of phases and queue type (a single queue for each phase instead of a specific queue for each resource of a phase). In addition, it is large enough to test a huge number of people every day, about 1000, because its available space is similar to the sports arena layout supposed in the virtual model.
To implement a complete digital twin framework, the mobile application is tested in a smaller clinic. Researchers give the devices to the operators in each phase to cover all the process and to map the flow of the patients from their entrance to their exit. The data collected are useful to build a dashboard that sums up all the most important indicators that a decision-maker wants to check. This dashboard contains both tables and graphs that change dynamically according to the new incoming data. The smaller case is used as a Beta-test to check if the application and the dashboard work well and to teach operators the use of the application. Then, the decision-makers could extend the framework to a bigger case by adding new smartphones and new badges. Therefore, they could use this digital technology as a support either to design a new mass vaccination clinic or to analyse the clinic’s situation in real-time and apply some changes in the clinic’s configuration dynamically. A relevant point is that the designed configuration cannot be simply extended if the clinic is bigger because there is no linear relation. Consequently, the digital twin must be implemented for each specific clinic because it gives different best configurations according to the system dimension and other properties.
6. Results
After the input definition, the simulation model was implemented using a commercial software to carry out a sensitivity analysis which found the best scenario for this specific case, according to the output indicators previously decided. The two variables which were changed during this analysis were tarrival and the number of resources (Ni), both medical and non-medical. The time between two consecutive arrivals ranged between TRIA(54,127,540) and TRIA(42,99,420), with a step of 7-s decrease in the mean value. For the number of resources, researchers started from the maximum number of resources feasible inside the defined layout and reduced this number until the system deteriorated. In particular, the number of non-medical employees varied from 22 to 14 while the medical personnel varied from 22 to 18. Thus, combining all these different possibilities, the total number of tested scenarios was 225. Many scenarios were tested because a larger number of resources does not result in a more efficient system, but a balanced integration of the different kind of resources is necessary. For example, if the maximum number of doctors is chosen, the anamnesis control phase will become very fast and this creates a bottleneck in the following phase (vaccine inoculation). Thus, the objective is to find the right number of doctors according to the other resources. From the 225 scenarios, the best five scenarios selected are the ones that maximized the main parameter Npat/nurse and are compared to find the optimal (Table 5). This scenario has the highest value of Npat/nurse but it is also feasible. To be feasible, the solution must respect layout boundaries related to the maximum number of people allowed in the queue or chairs dedicated for the forms fill-in and for the waiting after the inoculation. After a study of the layouts available, this total number was set to 310 places. Each of these five scenarios has some strengths and weaknesses. The first respects all the layout boundaries, has accepted values of Ui, but, since it has high interarrival time, fewer patients are vaccinated. The second scenario has the same interarrival time distribution of the third scenario but it needs one more nurse and so it is less efficient in terms of patients vaccinated by each nurse. The fourth and last scenarios would be the best, according to the Npat/nurse indicator, but they exceed the layout boundaries and so they are not feasible. In addition, the fifth scenario overutilizes the anamnesis, inoculation, and registration resources because the value of Ui is higher than 85%. Thus, the best scenario among those considered was the third one because it maximized Npat/nurse, respecting the space limit. This configuration increases the sustainability of the system both socially, with an acceptable workload for the operators, and economically, because the target number of patients is vaccinated in the least number of days and with the most efficient use of resources. This reduces costs due to the center opening and due to the workers’ salary.
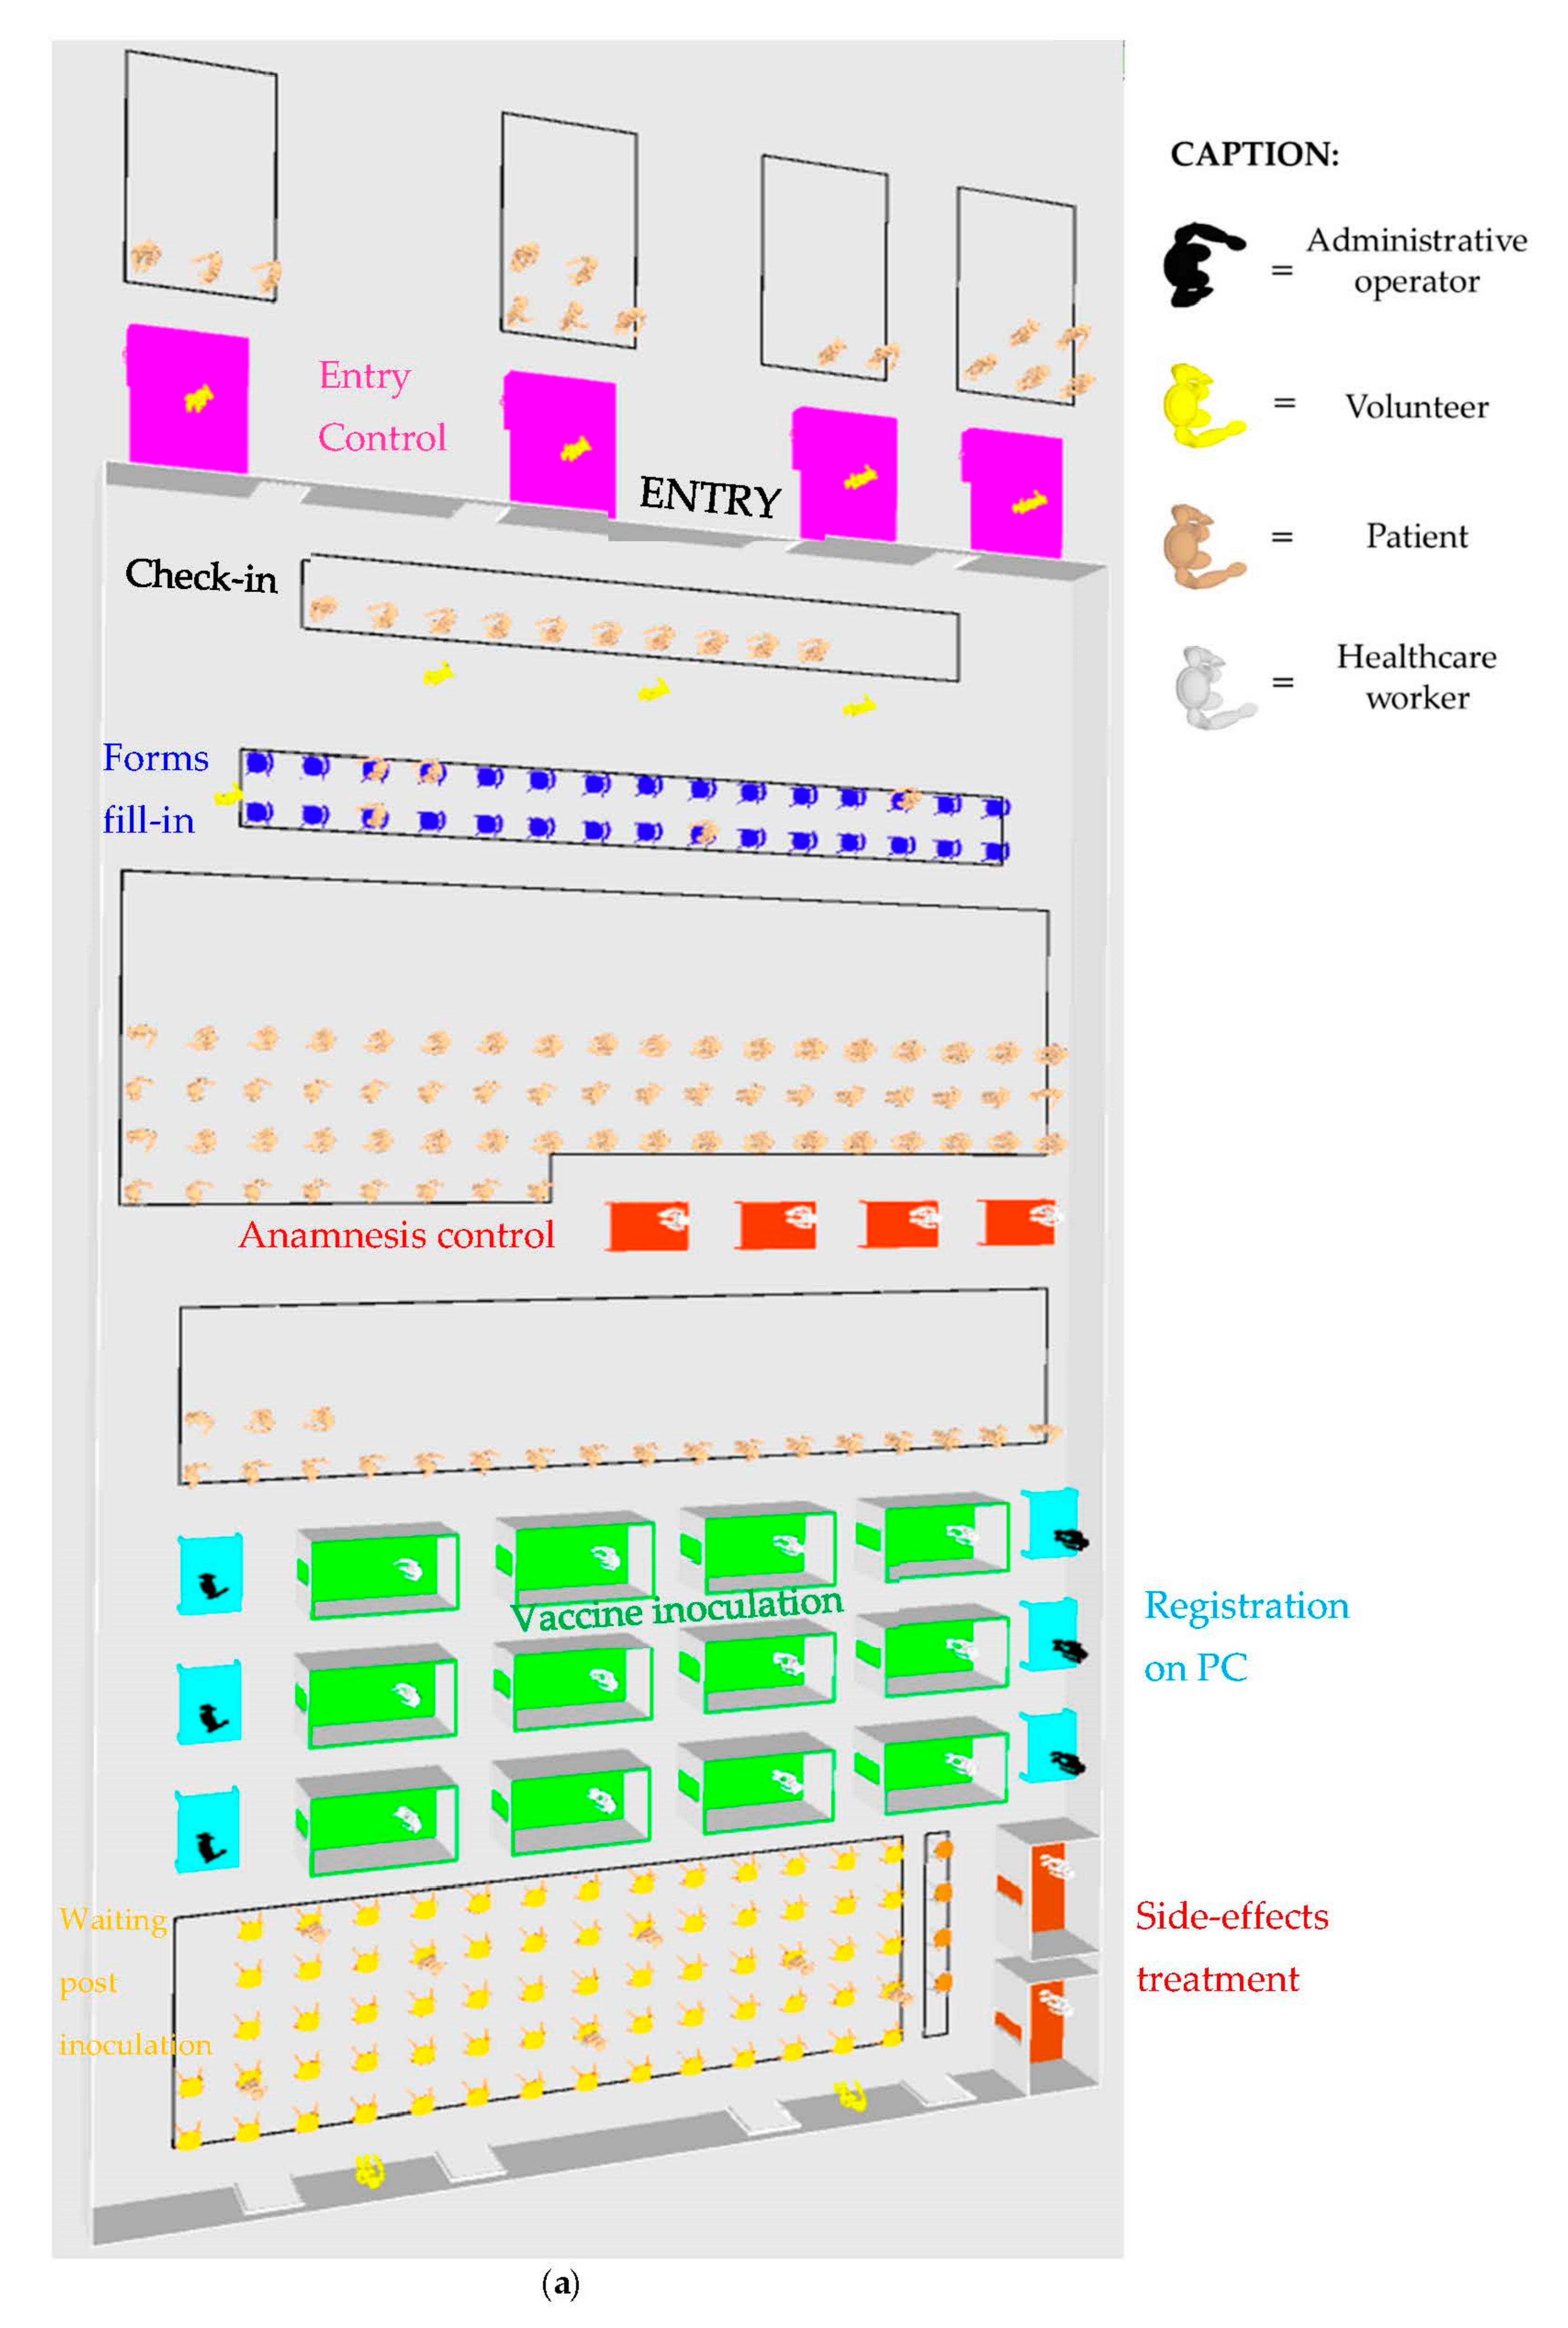
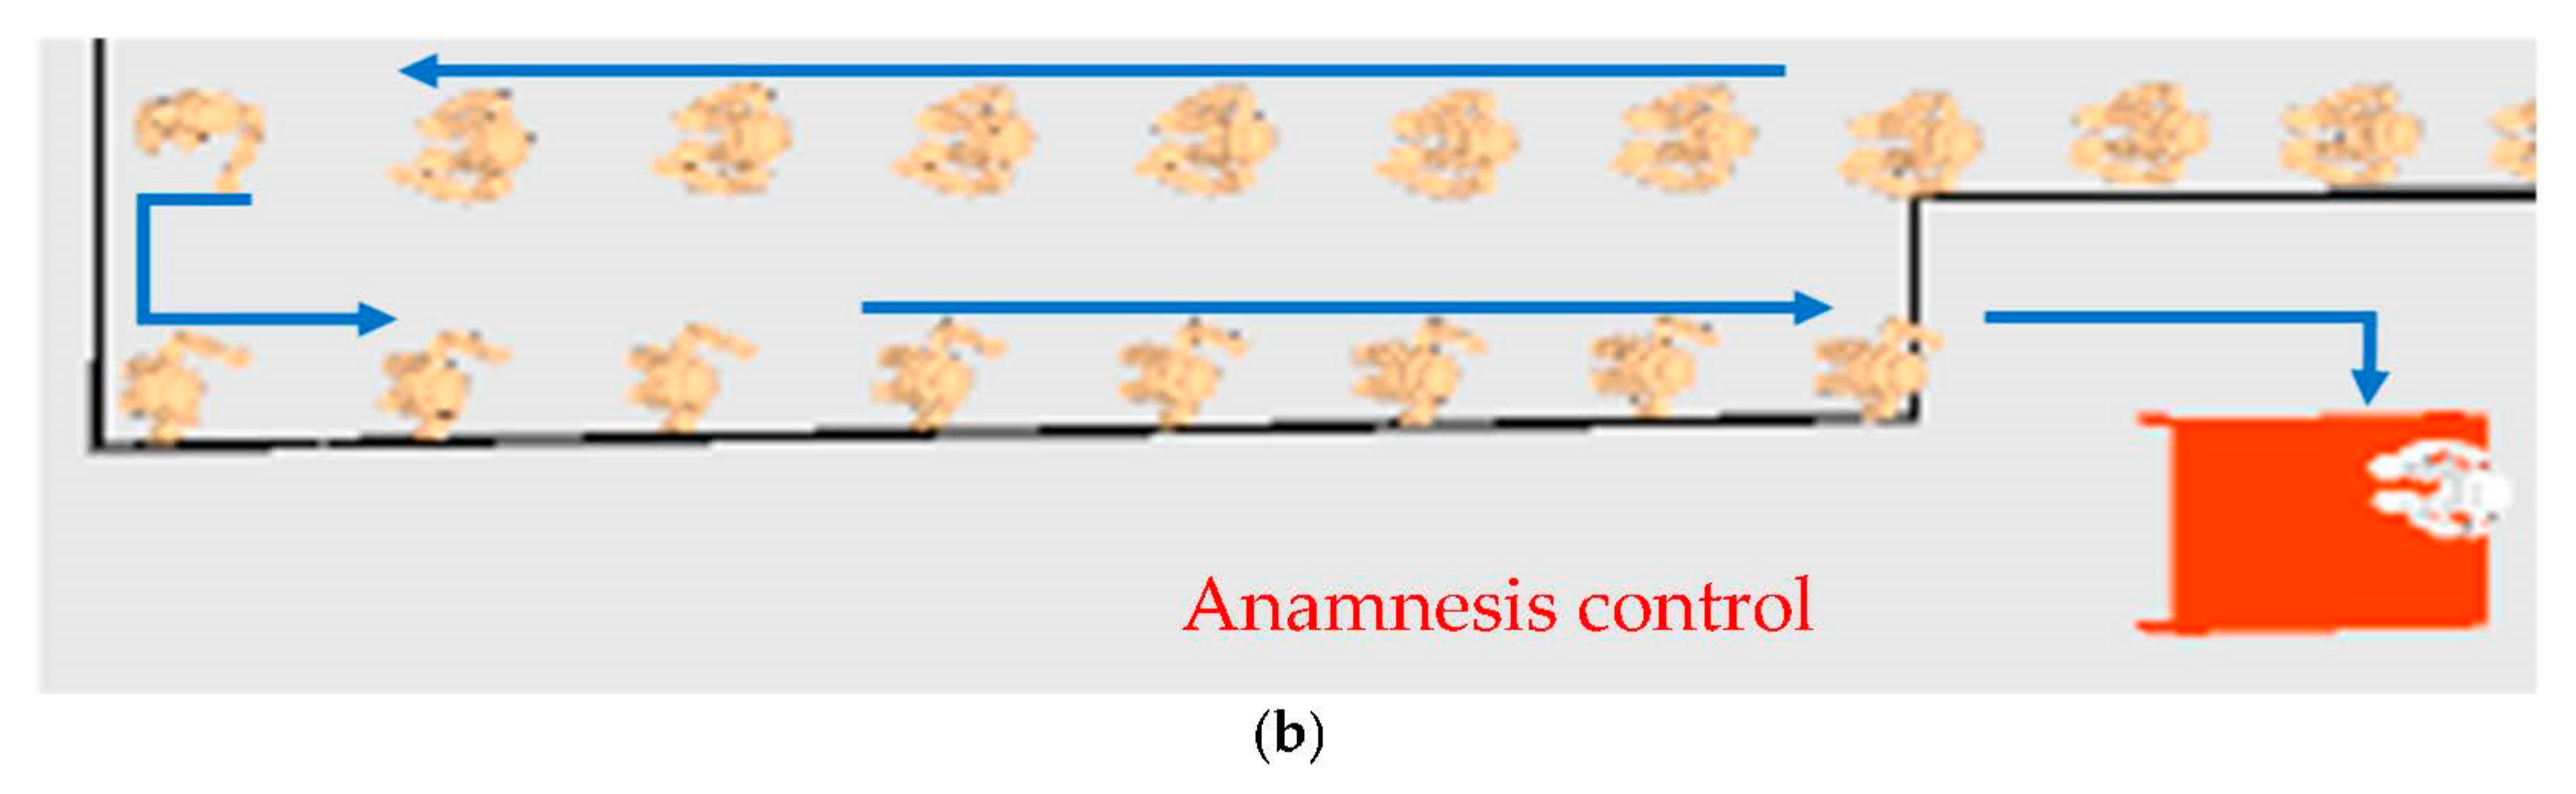
An important support to understand the efficiency of the solution is the 3D visualization of the optimal configuration that shows all the phases and the queues in the ideal clinic. It helps to understand how to place the multiple phases in a fixed layout and to determine whether the clinic is too crowded (Figure 7a). The 3D layout also shows the kind of queue designed in this clinic, with a single long queue for the entire phase, and people that flow in an “S” path (Figure 7b).
This configuration maximizes the main parameter Npat/nurse which represents the efficiency of a clinic. In detail, the value of this indicator is 18.03 patients vaccinated/hour per nurse, which means that, if we suppose a 10-h shift, each nurse vaccinates about 180 people each day. This is a very high value that is combined with other KPIs such as the total number of patients vaccinated every day (Npat) which is equal to 2164 for this best configuration. Other parameters are time-related, such as the average time in system (Tsys-avg), which is 25 min, and the average time in queue (Twait-avg), which is 5.4 min. This means that just 20% of the time spent by a patient in the system is expended in non-value-added activities. These two measures are also computed for their maximum values to understand the worst-case scenario. To conclude, the third set of output parameters is the resources utilization (Ui) that stays under 85%, which can be considered as a limit besides which employees are overutilized and burnout or unsatisfaction phenomenon can arise (Table 6).
From the mobile application, data are collected and sent to the data analyst. With the use of 10 smartphones, 10 datasets are created, each one representing a specific phase of the process. Through programming code, many parameters are computed starting from the input data, such as:
- Duration of each phase for each patient and average durations.
- Timestamps of the beginning and the end of each phase.
- Number of patients in each queue in every minute.
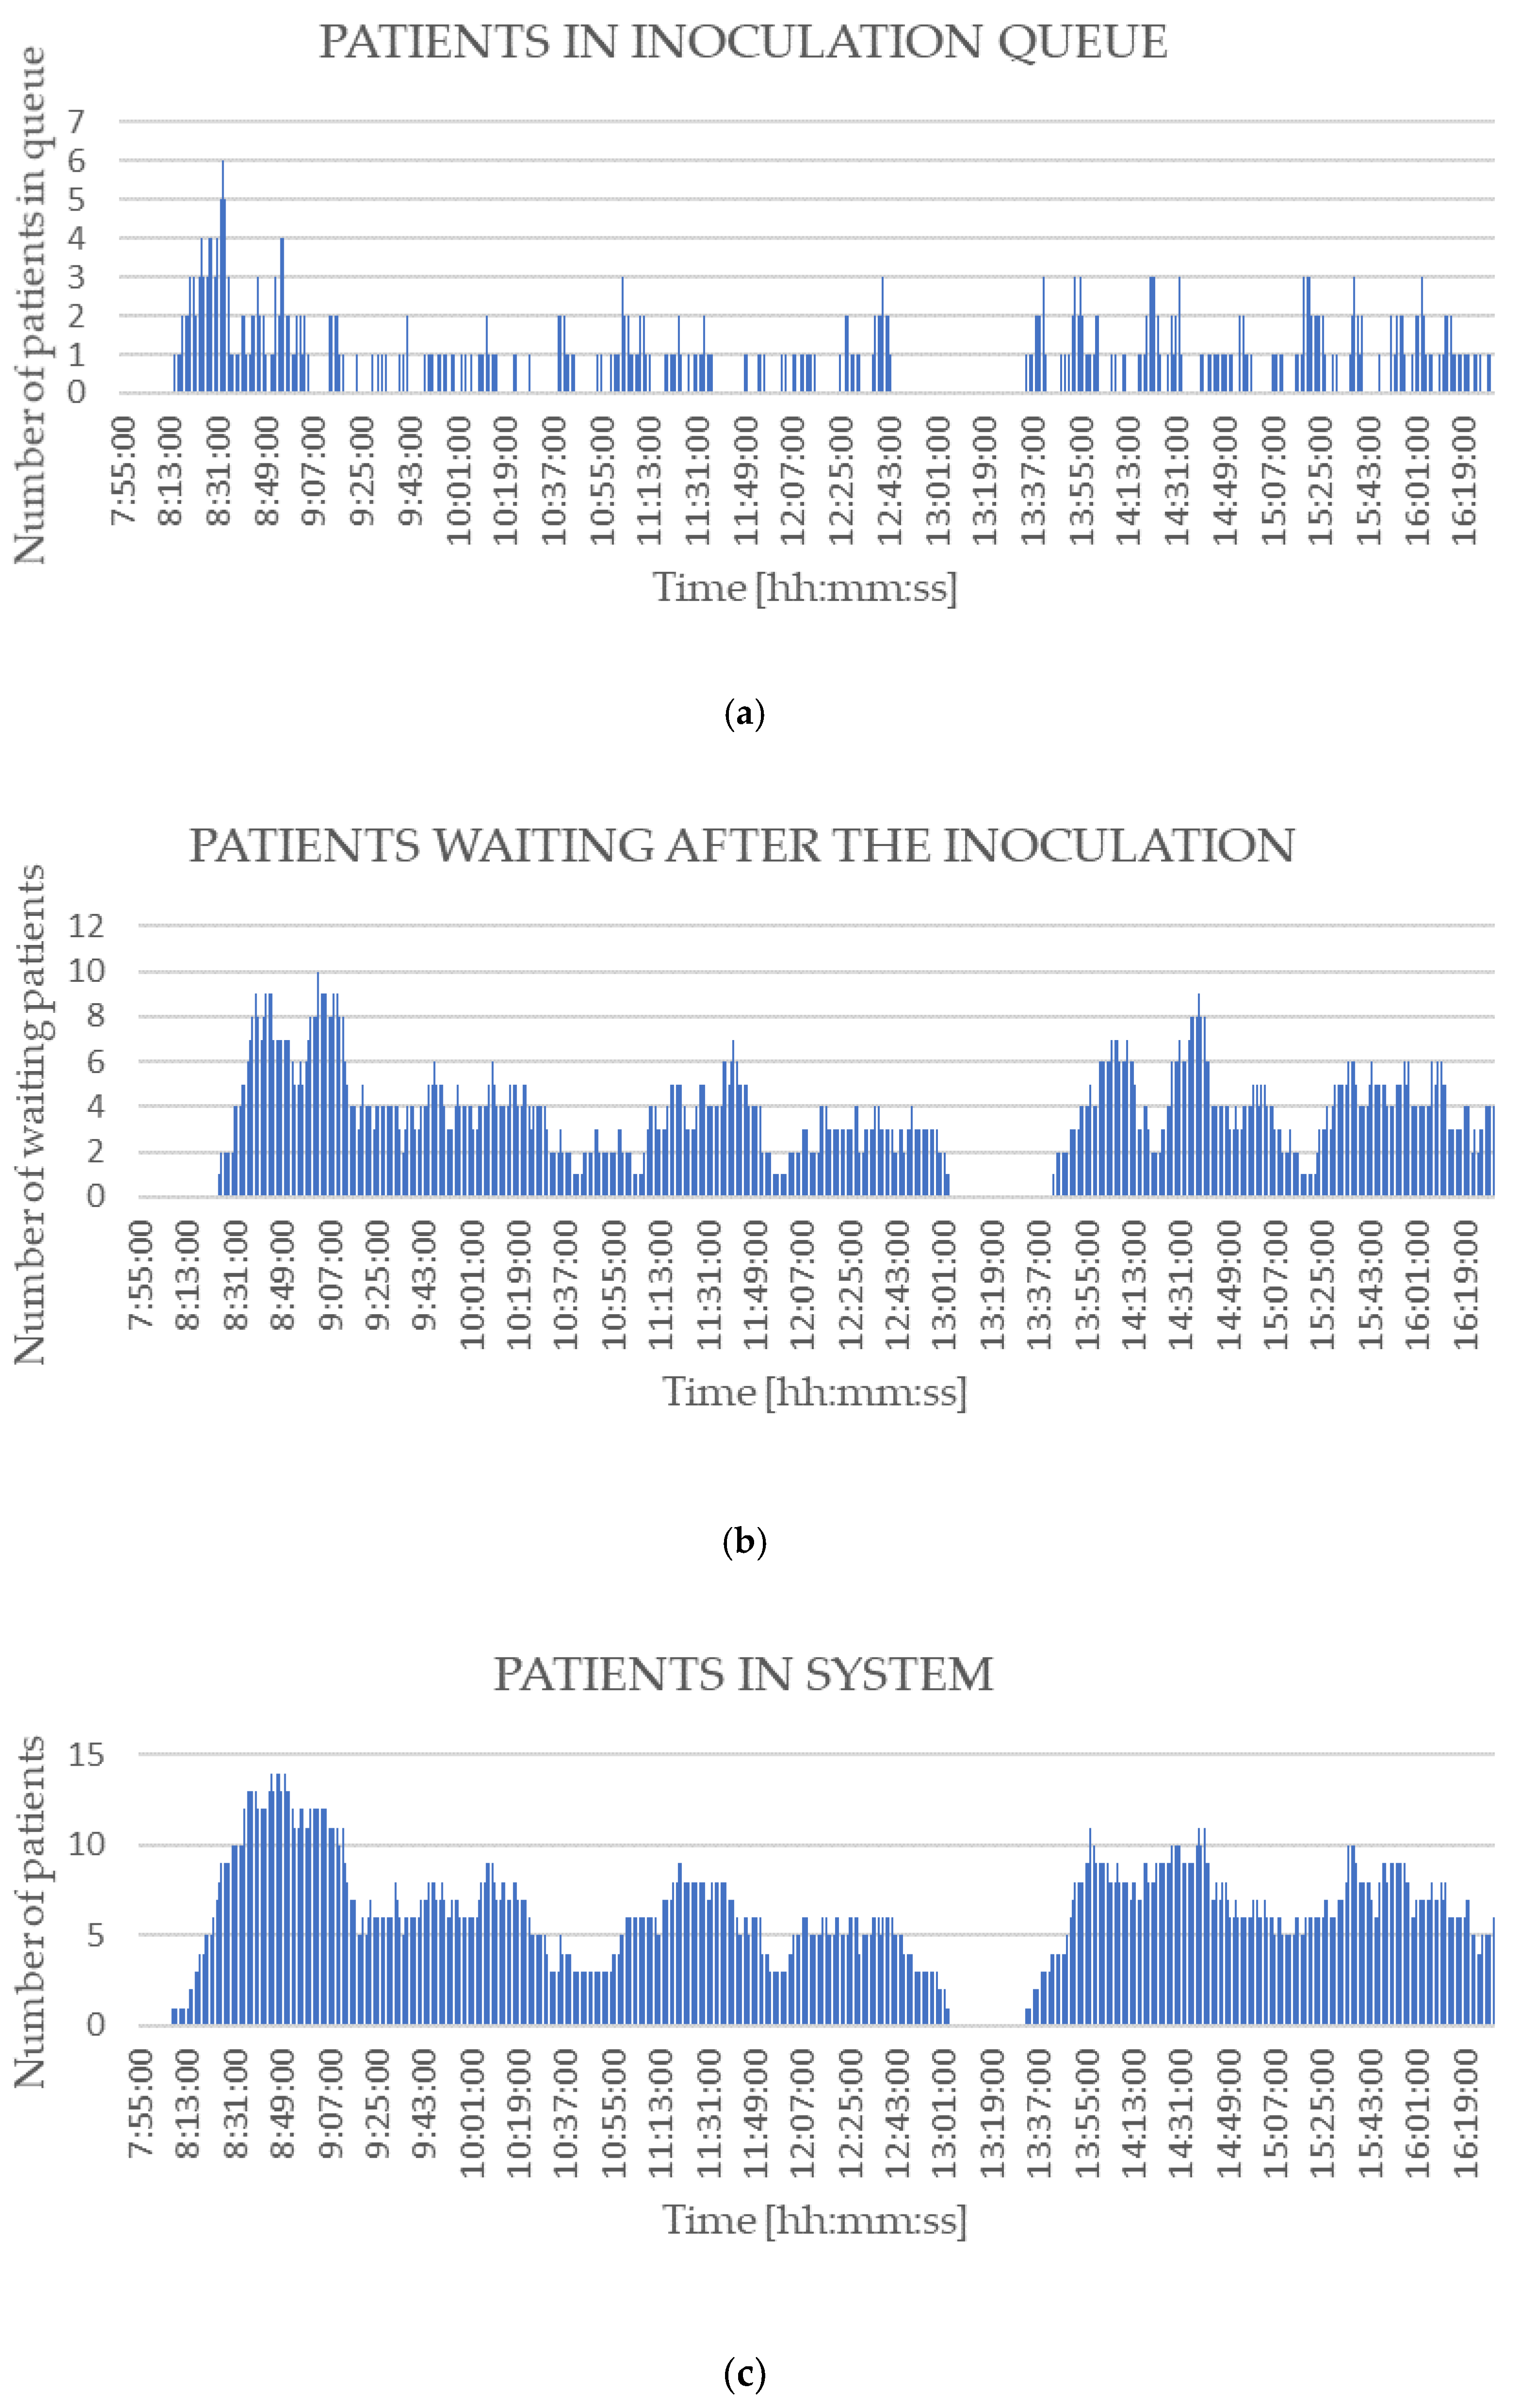
From these parameters, researchers calculate the outputs relevant for the decision-makers and draw a dynamic dashboard with all these indicators together. This dashboard contains the most relevant KPIs that can support the decision-maker in defining future improvements and deal with occurring problems. Because the test case is very small, the indicators found are lower than the ones reported above regarding the ideal clinic simulated, but they are reliable and relevant as well. The first section of the dashboard represents the number of patients in the various queues and in the overall system (Figure 8). In detail, this case study presents queues before and after the inoculation phase. In all the three graphs an empty interval is visible between 1 PM and 2 PM which represents the lunch break. These graphs allow analysts to understand the exact time at which the situation deteriorates and too many people are in the system simultaneously. Indeed, by drawing a vertical line across the three graphs it is possible to study the number of people in each queue at a particular minute of the day.
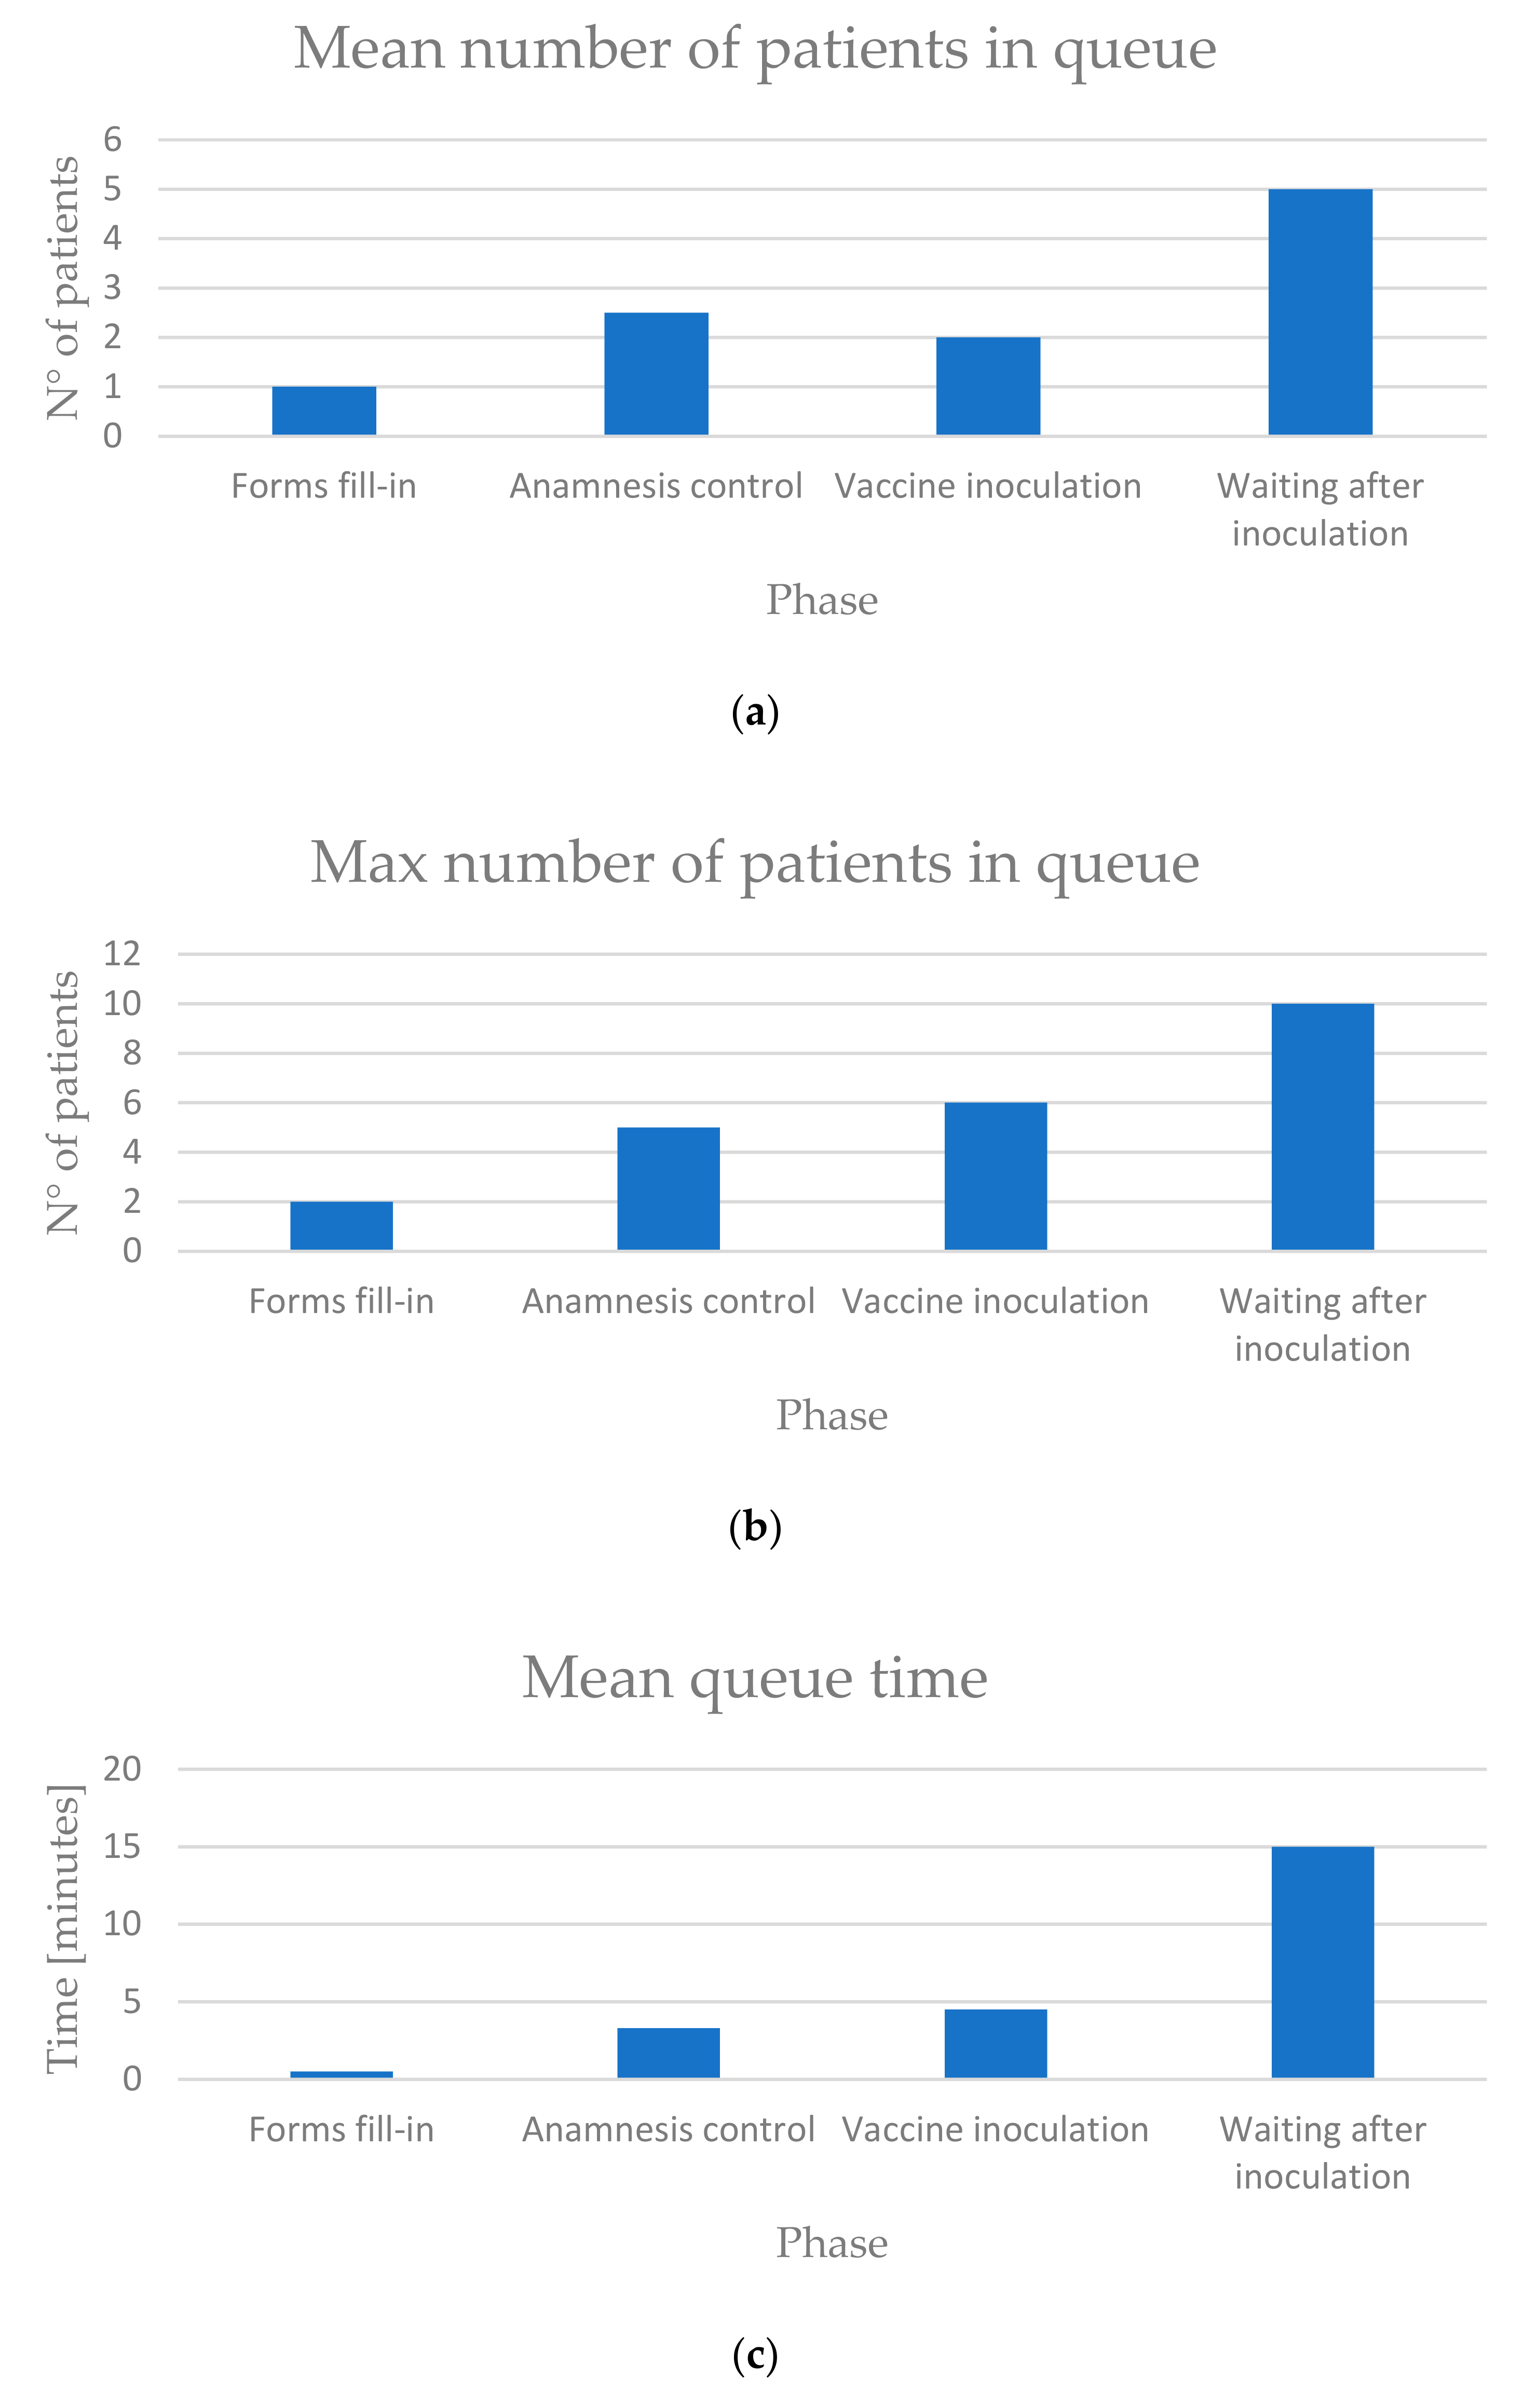
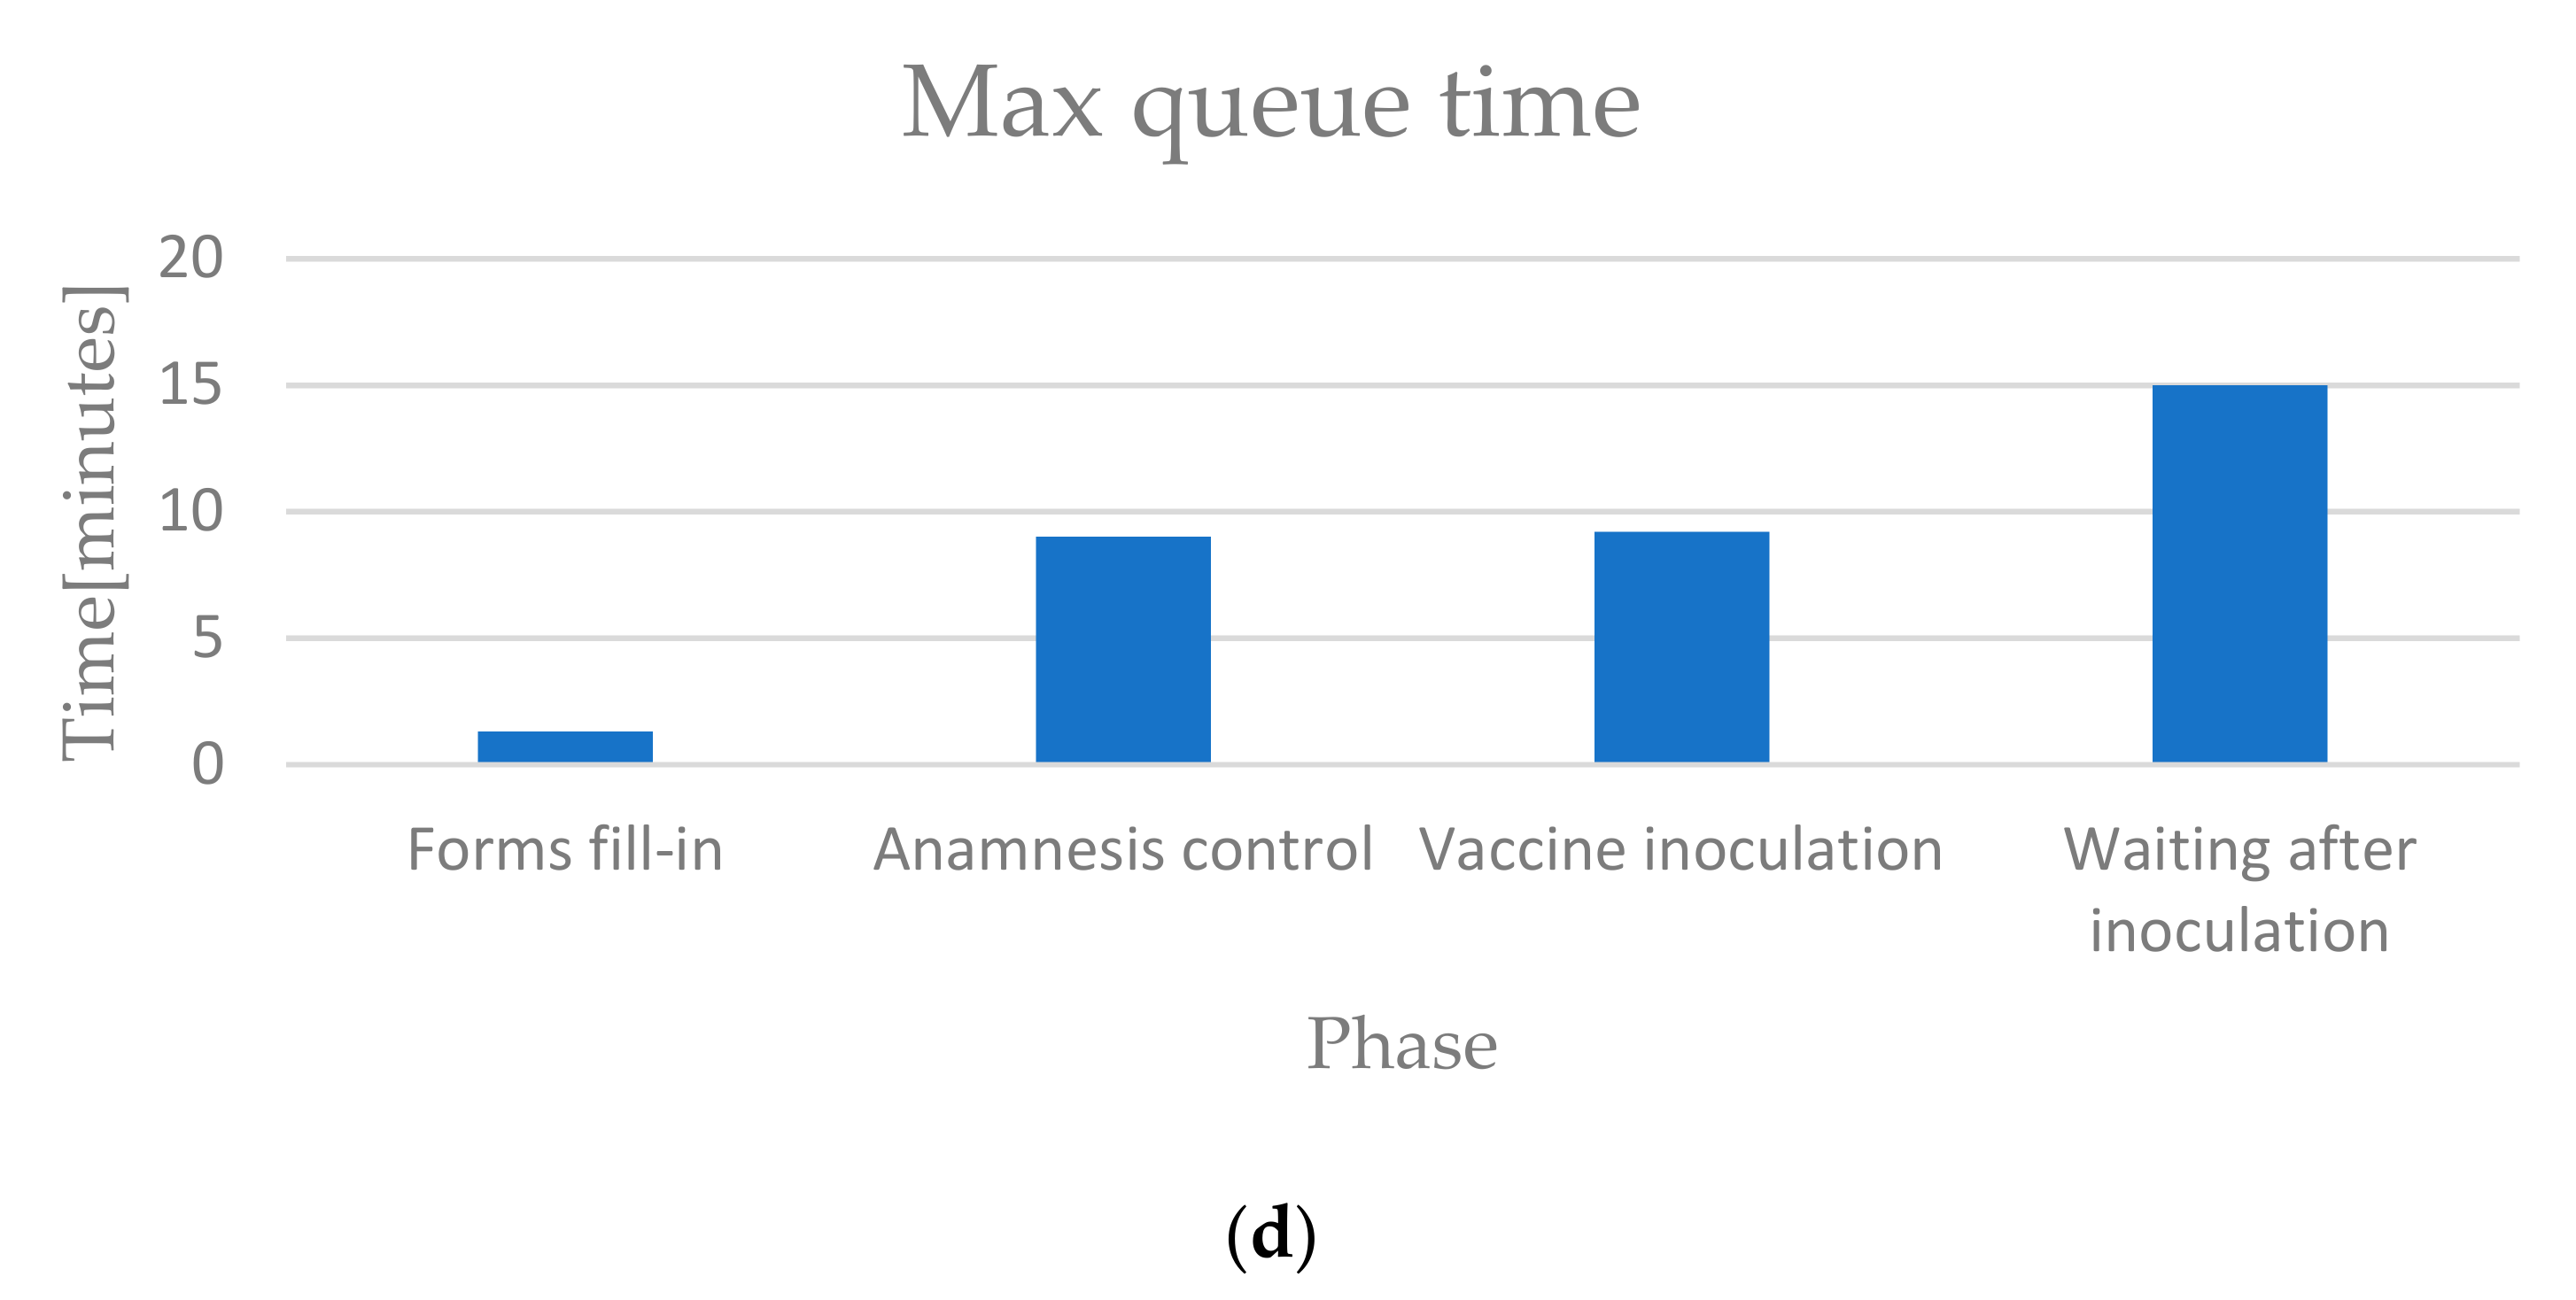
The second section of the dashboard concerns the mean and maximum values of the queue, especially number of patients and time (Figure 9). In terms of number of patients, the waiting after inoculation is the most critical phase because the values are much higher than the values for the inoculation queue. In terms of time, the distinctive characteristic is the constant time of 15 min for the post-inoculation waiting, due to a strict control of the operators on the patients.
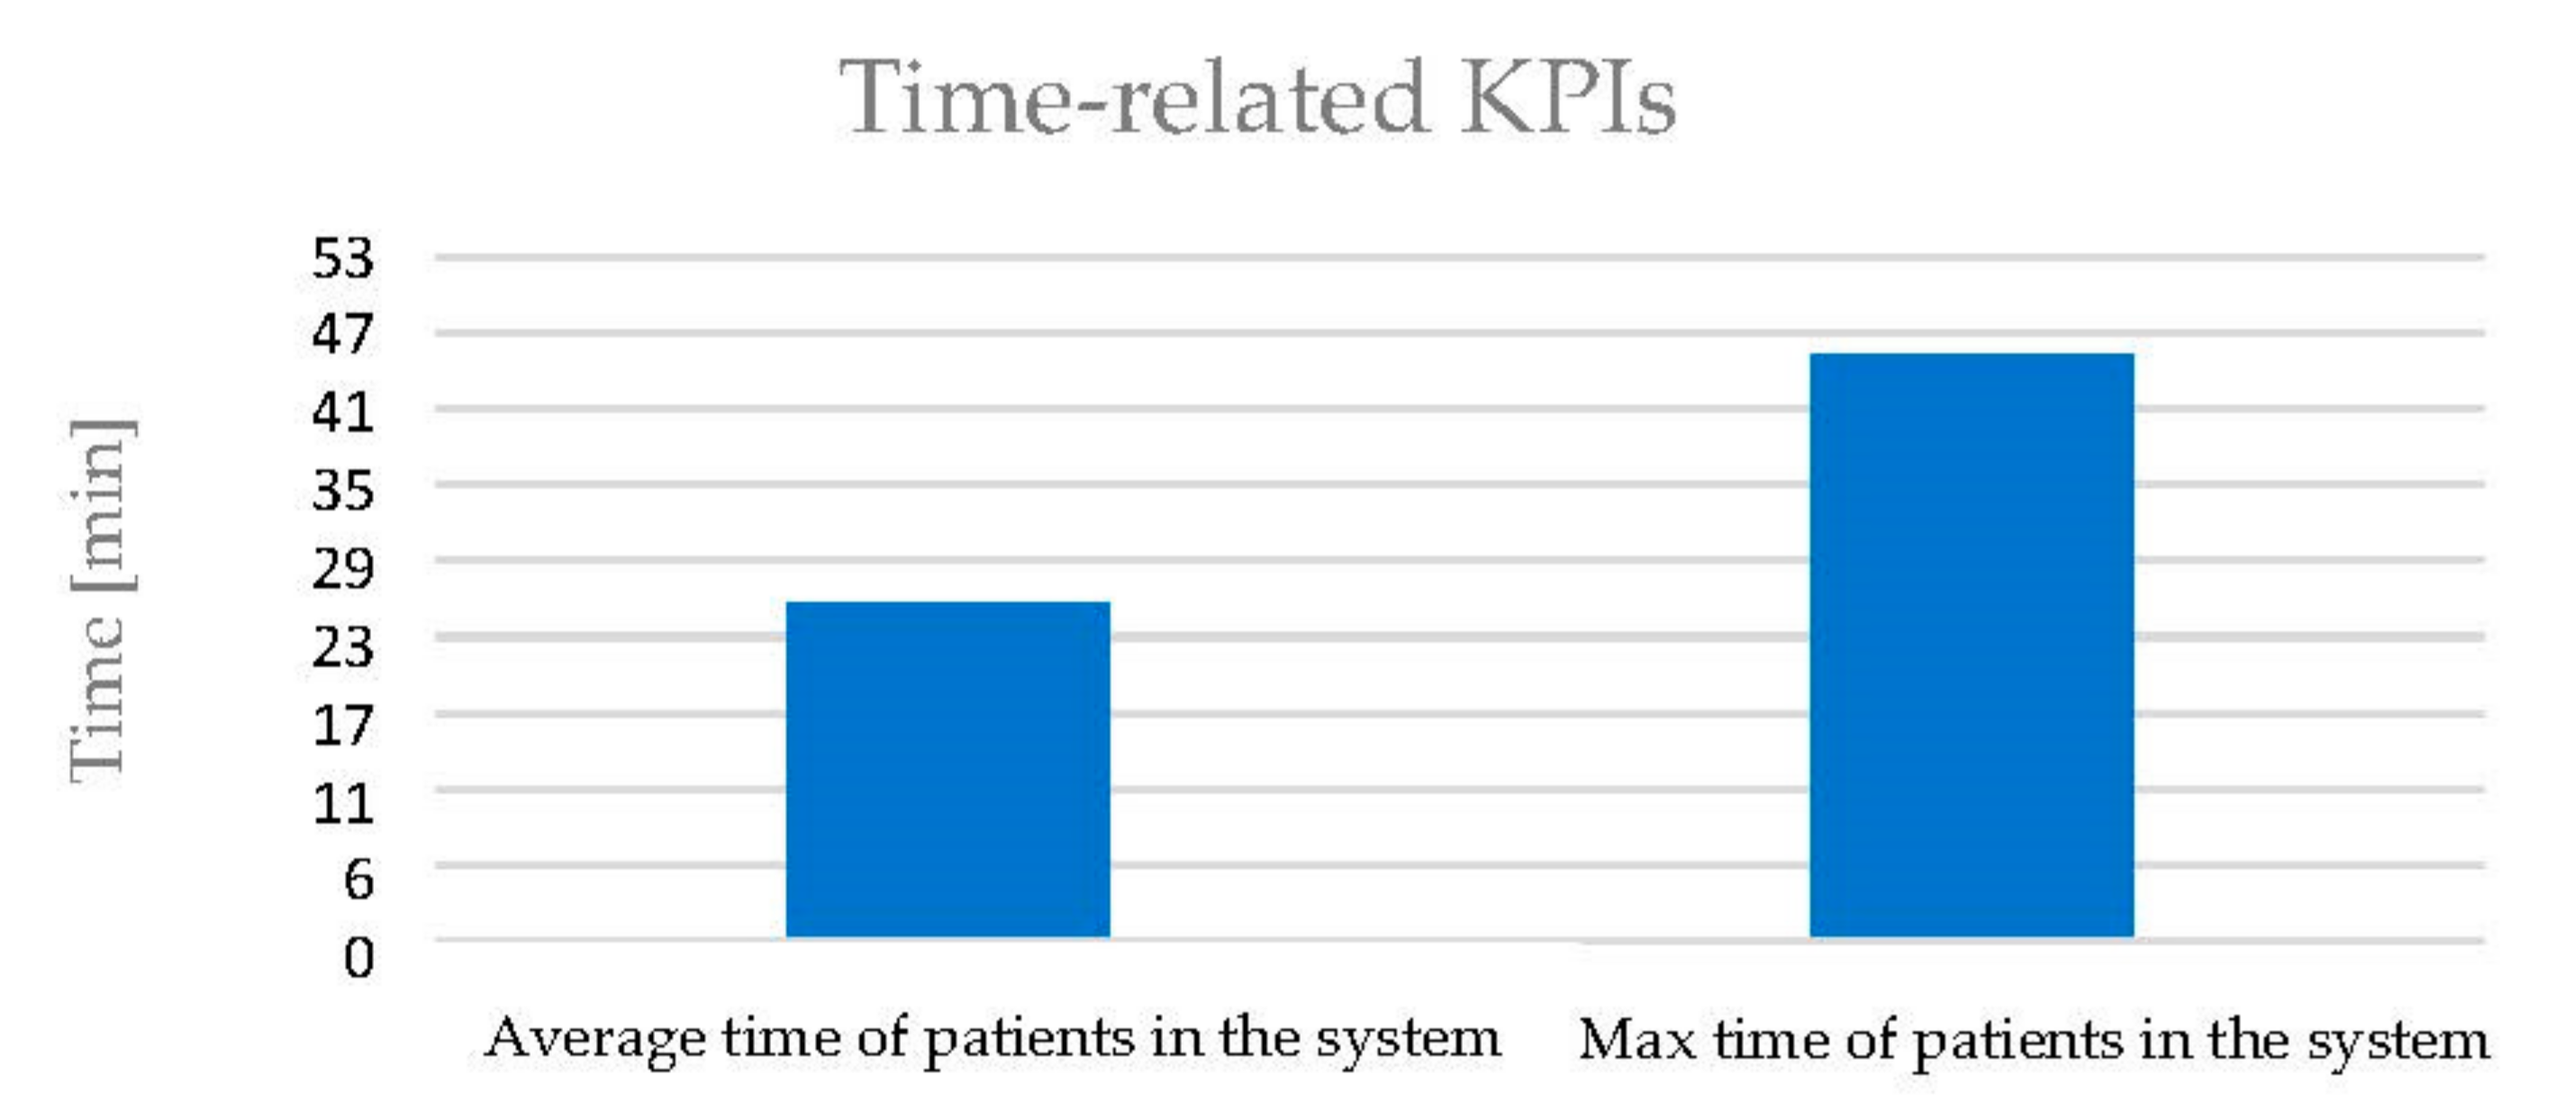
The third section of the dashboard regards the overall time-related KPIs which describe the situation of the entire system rather than the situation of a specific phase (Figure 10). It can be observed that the average time in system is low (about 25 min) because, considering a constant 15-min time of waiting after the inoculation, the process from the beginning to the inoculation lasts just 10 min. The maximum time in the system is almost doubled because, during some crowded moments of the day, the time in queue for each phase increases by a lot.
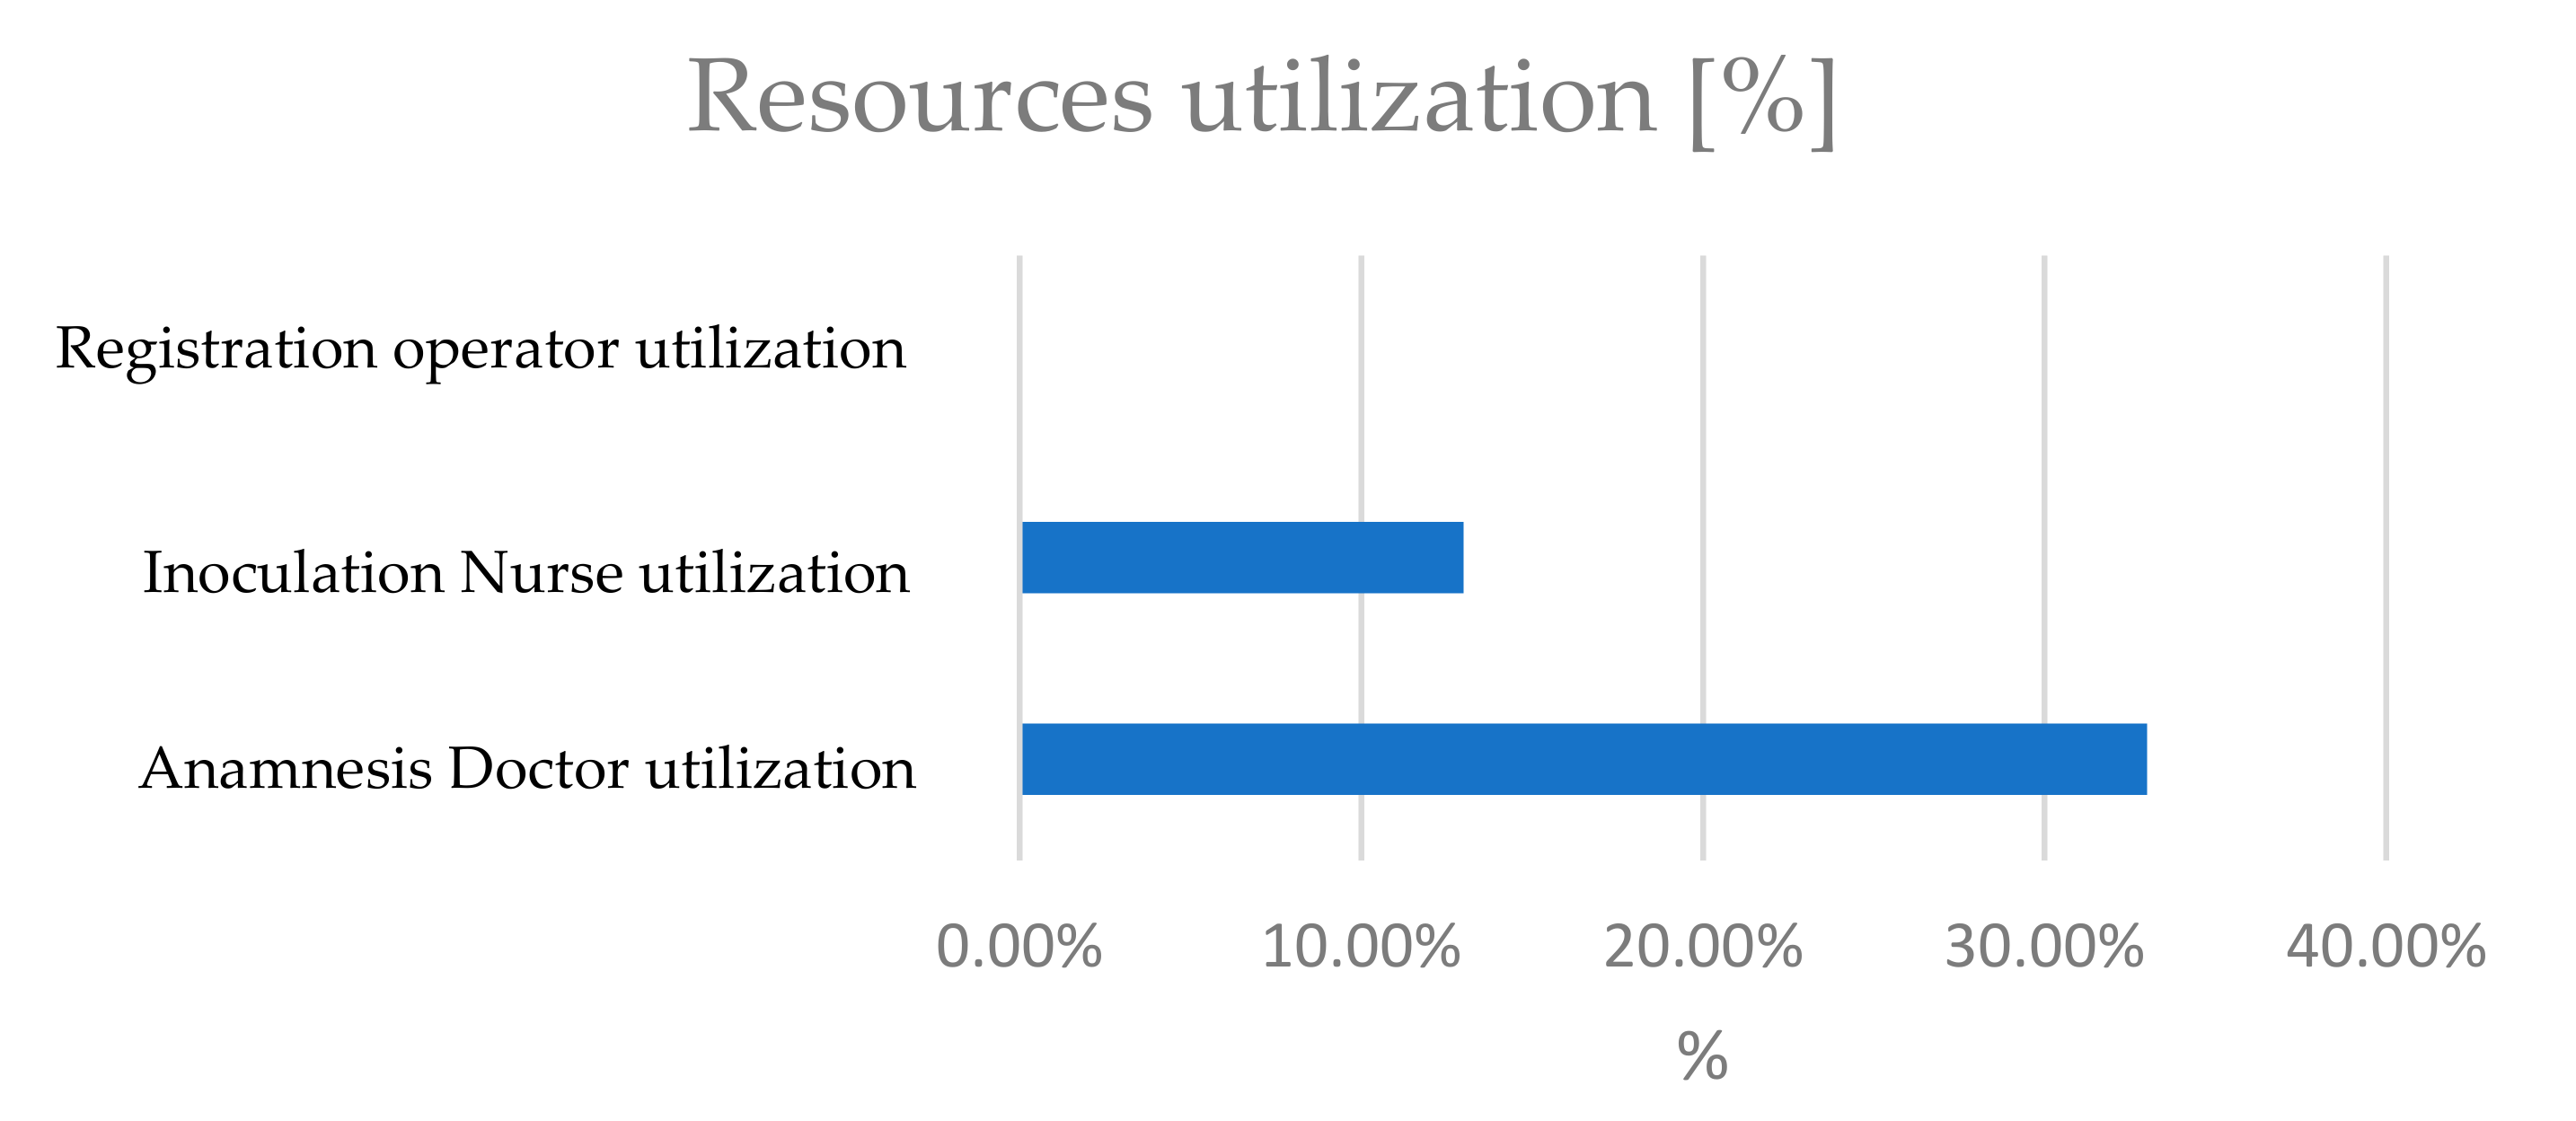
The next part of the dashboard shows the resources utilization (Figure 11). In this small case study, the percentages are lower than the ones in a normal situation but give an idea of the most used resource. Indeed, the doctors allocated to the anamnesis control phase are the critical resource because their utilization is more than twice the utilization of nurses allocated to the inoculation phase.
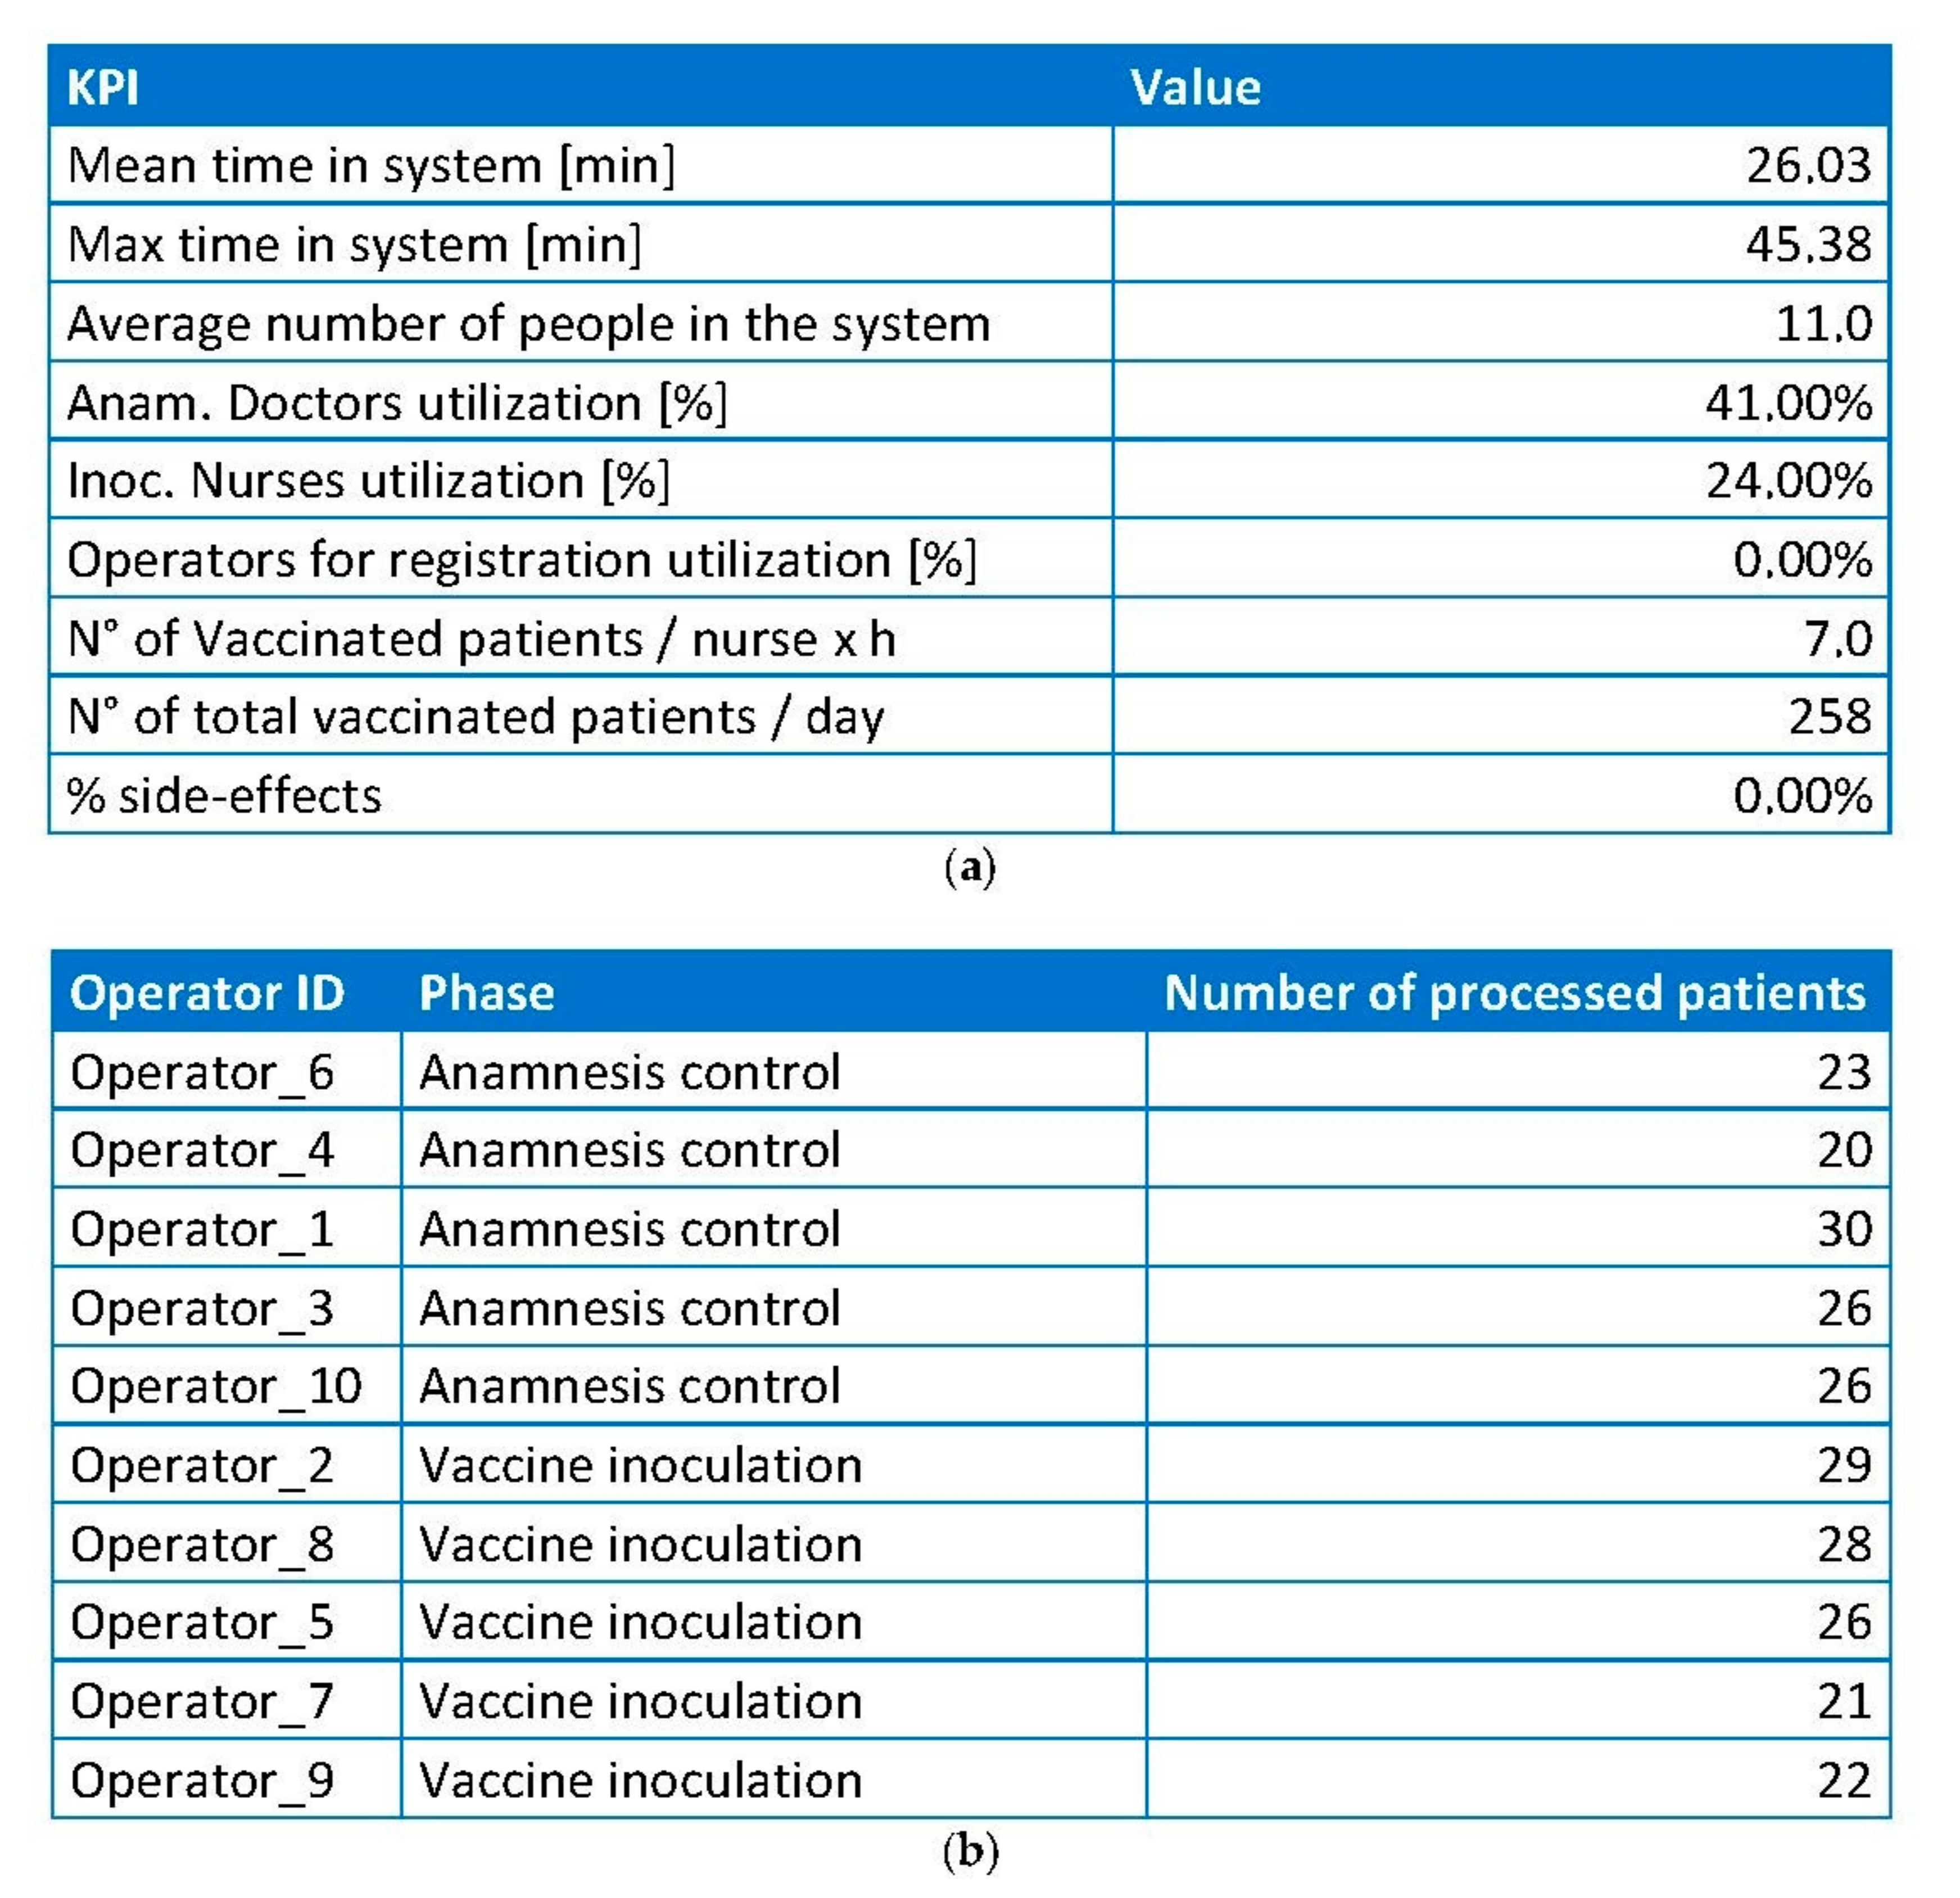
The last section of the dashboard contains two tables (Figure 12). The first table collects all the relevant KPIs reported in the graphs, adding the Npat and Npat/nurse indicators. The second table shows the number of patients processed by each single resource and it is important to understand if some resources are more exploited than others during a working day.
The dashboard shows which are the critical points and where to focus the new implementation of the simulation model. In this case study, the dashboard reports a long queue at the beginning of the day in the inoculation phase, which may be due to an anticipated arrival of patients which generates an increased flow. However, observing the resources utilization histogram, the most used resource is the doctor in the anamnesis control phase. From this remark, a possible improvement can be a dynamic shift between doctors and nurses during the day so that for the first period of the day one doctor can perform the inoculation and then, when the inoculation queue decreases, one nurse can perform the anamnesis to reduce the doctors utilization.
7. Conclusions
This paper describes the development of a digital twin for the mass vaccination process against the COVID-19 pandemic. The problem was to vaccinate many people in a very short time, leveraging the minimum number of resources, especially when healthcare workers are scarce. First, we developed a virtual system, which replicated the physical clinic, based on some real information like time-related measures and probability measures. The former was collected in the field to determine the statistical distribution of the working time of each phase. Once developed, the simulation model was tested for many scenarios to find a sustainable solution according to specific output parameters previously defined. In particular, the most relevant KPI considered was the number of patients vaccinated every hour by a single nurse (Npat/nurse) because it gave a measure of the system efficiency. The best configuration found included 31 total resources, 18 of which medical, and provided a Npat/nurse equal to 18 patients vaccinated by each nurse every hour. This high efficiency allows dedicating a smaller space which leads to lower waste and energy consumption. After the definition of the static ideal clinic, the model was expanded with a smartphone application that helped to digitalize the entire process and change it dynamically. The application is based on NFC technology, where operators have an NFC reader (a smartphone) and each patient has an NFC tag (a badge) that is read by the smartphone for the entire duration of an activity. These durations are then sent to the data analysts to be managed. Through this application, researchers were able to collect time measures in real time from the physical system, analyze them to find the drawbacks of this system, run the virtual model, and translate the improvements found in the physical clinic, creating a typical digital twin. Because it is still in a preliminary state, this digital twin developed was tested in a small POD but it gave different improvement cues as well. Indeed, the outcomes of the digital twin suggested a dynamic shift between nurses and doctors to deal with both the huge queue before the inoculation phase at the beginning of the day and the high doctor utilization during the entire day.
A detected limitation of the model is the difficulty for the operators in the adoption of the technology. Indeed, the data collected in the first period of testing at the small clinic were not considered because they could be affected by the learning phase of the individuals. This work can be enhanced in different ways. First, the paper reports an example of a walk-in clinic but the digital twin model can also be used in drive-through systems. Therefore, a possible future work can be the testing of the simulation model and the mobile application in a drive-through environment which has different time measures and some differences in phases. In addition, this research can be expanded by adding new smartphones to digitalize a bigger clinic like the one in Bozen expo. In this way, decision makers map the flow for a large number of patients and in a configuration similar to an industrial process, where entities flow continuously from one phase to the next and the objective is to reduce the bottlenecks. This expansion provides a more reliable dashboard and a stronger support of decision making for managers which could lead to an increasing sustainability of the vaccination clinic.
Author Contributions
Conceptualization, F.P.; methodology, F.P.; software, R.T.; validation, F.Z.; formal analysis, F.P. and R.T.; investigation, F.P.; resources, F.Z.; data curation, R.T.; writing—original draft preparation, F.P. and R.T.; writing—review & editing, S.S.H.; visualization, G.N. and S.S.H.; supervision, G.N. and S.S.H.; project administration, F.P. All authors have read and agreed to the published version of the manuscript.
Funding
This research received no external funding.
Institutional Review Board Statement
Not applicable.
Informed Consent Statement
Not applicable.
Data Availability Statement
Not applicable.
Acknowledgments
The Authors sincerely thank the Medical Director Pierpaolo Bertoli and the Occupational Safety Coordinator for operational service Peter Auer of the South Tyrol Public Healthcare Agency, and the Provincial Head of Croce Bianca Italiana Markus Leimegger for their fundamental endorsement and support for this research activity.
Conflicts of Interest
The authors declare no conflict of interest.
References
- WHO. Coronavirus (COVID-19) Dashboard. Available online: https://covid19.who.int (accessed on 21 April 2021).
- Holt, E. Slovakia to Test All Adults for SARS-CoV-2. Lancet 2020, 396, 1386–1387. [Google Scholar] [CrossRef]
- Kim, J.; Kwon, O. A Model for Rapid Selection and COVID-19 Prediction with Dynamic and Imbalanced Data. Sustainability 2021, 19, 3099. [Google Scholar] [CrossRef]
- European Centre for Disease Prevention and Control (ECDC). COVID-19 Vaccination and Prioritisation Strategies in the EU/EEA; Technical Report; ECDC: Solna Municipality, Sweden, 2020. [Google Scholar]
- CDC. Pfizer-BioNTech COVID-19 Vaccine Storage and Handling Summary; CDC: Atlanta, GA, USA, 2021.
- European Centre for Disease Prevention and Control (ECDC). Overview of the Implementation of COVID-19 Vaccination Strategies and Vaccine Deployment Plans in the EU/EEA; Technical Report; ECDC: Solna Municipality, Sweden, 2021. [Google Scholar]
- CDC. Moderna COVID-19 Vaccine: Storage and Handling Summary; CDC: Atlanta, GA, USA, 2021.
- Chiruţă, C.; Bulgariu, E.; Avsec, J.; Ferčec, B.; Mencinger, M. Comparison of the Evolution of the COVID-19 Disease between Romania and Italy. Appl. Syst. Innov. 2020, 3, 44. [Google Scholar] [CrossRef]
- Sandmann, F.G.; Davies, N.G.; Vassall, A.; Edmunds, W.J.; Jit, M.; Sun, F.Y.; Villabona-Arenas, C.J.; Nightingale, E.S.; Showering, A.; Knight, G.M.; et al. The Potential Health and Economic Value of SARS-CoV-2 Vaccination alongside Physical Distancing in the UK: A Transmission Model-Based Future Scenario Analysis and Economic Evaluation. Lancet Infect. Dis. 2021, S1473309921000797. [Google Scholar] [CrossRef]
- CDC. When Vaccine Is Limited, Who Gets Vaccinated First? Available online: https://www.cdc.gov/coronavirus/2019-ncov/vaccines/recommendations.html (accessed on 21 April 2021).
- SSE Arena to Be Mass Vaccination Centre. Available online: https://www.health-ni.gov.uk/news/sse-arena-be-mass-vaccination-centre (accessed on 21 April 2021).
- Rosen, B.; Waitzberg, R.; Israeli, A. Israel’s Rapid Rollout of Vaccinations for COVID-19. Isr. J. Health Policy Res. 2021, 10, 6. [Google Scholar] [CrossRef]
- Xu, L.D.; Xu, E.L.; Li, L. Industry 4.0: State of the Art and Future Trends. Int. J. Prod. Res. 2018, 56, 2941–2962. [Google Scholar] [CrossRef] [Green Version]
- Cohen, Y.; Faccio, M.; Galizia, F.G.; Mora, C.; Pilati, F. Assembly System Configuration through Industry 4.0 Principles: The Expected Change in the Actual Paradigms. IFAC-Pap. 2017, 50, 14958–14963. [Google Scholar] [CrossRef]
- Andriolo, A.; Battini, D.; Calzavara, M.; Gamberi, M.; Peretti, U.; Persona, A.; Pilati, F.; Sgarbossa, F. New RFID Pick-to-Light System: Operating Characteristics and Future Potential. Int. J. RF Technol. 2016, 7, 43–63. [Google Scholar] [CrossRef]
- Madni, A.; Madni, C.; Lucero, S. Leveraging Digital Twin Technology in Model-Based Systems Engineering. Systems 2019, 7, 7. [Google Scholar] [CrossRef] [Green Version]
- Müller, J.M.; Kiel, D.; Voigt, K.-I. What Drives the Implementation of Industry 4.0? The Role of Opportunities and Challenges in the Context of Sustainability. Sustainability 2018, 10, 247. [Google Scholar] [CrossRef] [Green Version]
- Accorsi, R.; Bortolini, M.; Baruffaldi, G.; Pilati, F.; Ferrari, E. Internet-of-Things Paradigm in Food Supply Chains Control and Management. Procedia Manuf. 2017, 11, 889–895. [Google Scholar] [CrossRef]
- Lepore, D.; Micozzi, A.; Spigarelli, F. Industry 4.0 Accelerating Sustainable Manufacturing in the COVID-19 Era: Assessing the Readiness and Responsiveness of Italian Regions. Sustainability 2021, 13, 2670. [Google Scholar] [CrossRef]
- Vaccari, I.; Orani, V.; Paglialonga, A.; Cambiaso, E.; Mongelli, M. A Generative Adversarial Network (GAN) Technique for Internet of Medical Things Data. Sensors 2021, 21, 3726. [Google Scholar] [CrossRef]
- Ramallo-González, A.P.; González-Vidal, A.; Skarmeta, A.F. CIoTVID: Towards an Open IoT-Platform for Infective Pandemic Diseases Such as COVID-19. Sensors 2021, 21, 484. [Google Scholar] [CrossRef] [PubMed]
- Singh, R.P.; Javaid, M.; Haleem, A.; Suman, R. Internet of Things (IoT) Applications to Fight against COVID-19 Pandemic. Diabetes Metab. Syndr. Clin. Res. Rev. 2020, 14, 521–524. [Google Scholar] [CrossRef]
- Gunal, M.M. A Guide for Building Hospital Simulation Models. Health Syst. 2012, 1, 17–25. [Google Scholar] [CrossRef]
- Katsaliaki, K.; Mustafee, N. Applications of Simulation within the Healthcare Context. J. Oper. Res. Soc. 2011, 62, 1431–1451. [Google Scholar] [CrossRef]
- Arlegui, H.; Nachbaur, G.; Praet, N.; Bégaud, B.; Caro, J.J. Using Discretely Integrated Condition Event Simulation To Construct Quantitative Benefit–Risk Models: The Example of Rotavirus Vaccination in France. Clin. Ther. 2020, 42, 1983–1991.e2. [Google Scholar] [CrossRef]
- Ahmed, M.A.; Alkhamis, T.M. Simulation Optimization for an Emergency Department Healthcare Unit in Kuwait. Eur. J. Oper. Res. 2009, 198, 936–942. [Google Scholar] [CrossRef]
- Hernandez, I.; Ramirez-Marquez, J.E.; Starr, D.; McKay, R.; Guthartz, S.; Motherwell, M.; Barcellona, J. Optimal Staffing Strategies for Points of Dispensing. Comput. Ind. Eng. 2015, 83, 172–183. [Google Scholar] [CrossRef]
- Hupert, N.; Mushlin, A.I.; Callahan, M.A. Modeling the Public Health Response to Bioterrorism: Using Discrete Event Simulation to Design Antibiotic Distribution Centers. Med Decis. Mak. 2002, 22 (Suppl. S1), 17–25. [Google Scholar] [CrossRef]
- Aaby, K.; Herrmann, J.W.; Jordan, C.S.; Treadwell, M.; Wood, K. Montgomery County’s Public Health Service Uses Operations Research to Plan Emergency Mass Dispensing and Vaccination Clinics. Interfaces 2006, 36, 569–579. [Google Scholar] [CrossRef] [Green Version]
- Van de Kracht, T.; Heragu, S.S. Lessons from Modeling and Running the World’s Largest Drive-Through Mass Vaccination Clinic. Inf. J. Appl. Anal. 2021, 51, 91–105. [Google Scholar]
- Gupta, A.; Evans, G.W.; Heragu, S.S. Simulation and Optimization Modeling for Drive-through Mass Vaccination—A Generalized Approach. Simul. Model. Pract. Theory 2013, 37, 99–106. [Google Scholar] [CrossRef] [Green Version]
- Asgary, A.; Najafabadi, M.M.; Karsseboom, R.; Wu, J. A Drive-through Simulation Tool for Mass Vaccination during COVID-19 Pandemic. Healthcare 2020, 8, 469. [Google Scholar] [CrossRef]
- Grieves, M.; Vickers, J. Digital Twin: Mitigating Unpredictable, Undesirable Emergent Behavior in Complex Systems. In Transdisciplinary Perspectives on Complex Systems; Kahlen, F.-J., Flumerfelt, S., Alves, A., Eds.; Springer International Publishing: Cham, Switzerland, 2017; pp. 85–113. ISBN 978-3-319-38754-3. [Google Scholar]
- Balachandar, S.; Chinnaiyan, R. Reliable Digital Twin for Connected Footballer. In International Conference on Computer Networks and Communication Technologies; Smys, S., Bestak, R., Chen, J.I.-Z., Kotuliak, I., Eds.; Lecture Notes on Data Engineering and Communications Technologies; Springer: Singapore, 2019; Volume 15, pp. 185–191. ISBN 978-981-10-8680-9. [Google Scholar]
- Glaessgen, E.; Stargel, D. The Digital Twin Paradigm for Future NASA and U.S. Air Force Vehicles. In Proceedings of the 53rd AIAA/ASME/ASCE/AHS/ASC Structures, Structural Dynamics and Materials Conference & 20th AIAA/ASME/AHS Adaptive Structures Conference & 14th AIAA, Honolulu, HI, USA, 23–26 April 2012. [Google Scholar]
- Coelho, F.; Relvas, S.; Barbosa-Póvoa, A.P. Simulation-Based Decision Support Tool for in-House Logistics: The Basis for a Digital Twin. Comput. Ind. Eng. 2021, 153, 107094. [Google Scholar] [CrossRef]
- Korth, B.; Schwede, C.; Zajac, M. Simulation-Ready Digital Twin for Realtime Management of Logistics Systems. In Proceedings of the 2018 IEEE International Conference on Big Data (Big Data), Seattle, WA, USA, 10–13 December 2018; pp. 4194–4201. [Google Scholar]
- Jimenez, J.I.; Jahankhani, H.; Kendzierskyj, S. Health Care in the Cyberspace: Medical Cyber-Physical System and Digital Twin Challenges. In Digital Twin Technologies and Smart Cities; Farsi, M., Daneshkhah, A., Hosseinian-Far, A., Jahankhani, H., Eds.; Internet of Things; Springer International Publishing: Cham, Switzerland, 2020; pp. 79–92. ISBN 978-3-030-18731-6. [Google Scholar]
- Liu, Y.; Zhang, L.; Yang, Y.; Zhou, L.; Ren, L.; Wang, F.; Liu, R.; Pang, Z.; Deen, M.J. A Novel Cloud-Based Framework for the Elderly Healthcare Services Using Digital Twin. IEEE Access 2019, 7, 49088–49101. [Google Scholar] [CrossRef]
- Hashim, U.N.; Salahuddin, L.; Ikram, R.R.R.; Hashim, U.R.; Choon, N.H.; Mohayat, M.H.N. The Design and Implementation of Mobile Heart Monitoring Applications Using Wearable Heart Rate Sensor. Int. J. Adv. Comput. Sci. Appl. 2021, 12, 6. [Google Scholar]
- Karakra, A.; Fontanili, F.; Lamine, E.; Lamothe, J.; Taweel, A. Pervasive Computing Integrated Discrete Event Simulation for a Hospital Digital Twin. In Proceedings of the 2018 IEEE/ACS 15th International Conference on Computer Systems and Applications (AICCSA), Aqaba, Jordan, 28 October–1 November 2018; pp. 1–6. [Google Scholar]
Figure 1.
Flowchart of the vaccination process.

Figure 2.
Simulation model developed to mirror the real system.

Figure 3.
Conceptual framework of the digital technology.

Figure 4.
(a) Main screen of the mobile app, with the 3 possible activities; (b) 3 screens of the reading part where the planner defines the process and the phase and activates the reading.
Figure 4.
(a) Main screen of the mobile app, with the 3 possible activities; (b) 3 screens of the reading part where the planner defines the process and the phase and activates the reading.

Figure 5.
Section of the joined dataset with information for all the phases.

Figure 6.
Loop of the digital twin of the COVID-19 vaccination center.

Figure 7.
(a) 3D visualization of the designed clinic; (b) zoomed-in detail of a phase queue.


Figure 8.
First section of the dashboard. (a) Plot of the number of people in queue before the inoculation phase at every minute; (b) Plot of the number of people in queue after the inoculation phase at every minute; (c) Plot of the number of people in the entire system at every minute.
Figure 8.
First section of the dashboard. (a) Plot of the number of people in queue before the inoculation phase at every minute; (b) Plot of the number of people in queue after the inoculation phase at every minute; (c) Plot of the number of people in the entire system at every minute.

Figure 9.
Second section of the dashboard. (a) the histogram reports the average number of people in queue in each phase; (b) the histogram reports the maximum number of people in queue in each phase; (c) the histogram reports the average time that a patient spends in queue for each phase; (d) the histogram reports the maximum time that a patient spends in queue for each phase.


Figure 10.
Third section of the dashboard. The histogram shows the average and the maximum time in system spent by each patient.
Figure 10.
Third section of the dashboard. The histogram shows the average and the maximum time in system spent by each patient.

Figure 11.
Fourth section of the dashboard. The histogram shows the resources utilization in percentage.
Figure 11.
Fourth section of the dashboard. The histogram shows the resources utilization in percentage.

Figure 12.
Fifth section of the dashboard. (a) Table with all the most relevant KPIs, such as Npat and Npat/nurse; (b) Table that shows the number of patients processed by each resource.
Figure 12.
Fifth section of the dashboard. (a) Table with all the most relevant KPIs, such as Npat and Npat/nurse; (b) Table that shows the number of patients processed by each resource.


Table 1.
List of input parameters.
| Name | Symbol | Units of Measure |
|---|---|---|
| Group size | Sgroup | patients |
| Probability of a specific group size | Pgroup | % |
| Inter-arrival time | tarrival | sec |
| Probability of having a body temperature lower than 37.5 °C | Ptemp | % |
| Probability of having already filled-in the forms at home | Pfill-in | % |
| Probability that the anamnesis is completely ok | Panam | % |
| Probability of being rejected because of the anamnesis | Prej | % |
| Probability of experiencing side effects | Peff | % |
| Working time of a specific phase i | ti i = A, …, H | sec |
| Number of resources needed in a specific phase i | Ni i = A, …, H | resources |
| Number of places to dedicate in queue for a specific phase i | Qi i = A, …, H | places |
Table 2.
List of output parameters.
| Name | Symbol | Units of Measure |
|---|---|---|
| Number of patients vaccinated per hour per nurse | Npat/nurse | Patients/nurse × hour |
| Number of patients vaccinated per day | Npat | Patients/day |
| Average time spent in the system by a patient | Tsys-avg | min |
| Maximum time spent in the system by a patient | Tsys-max | min |
| Average time spent in queue by a patient | Twait-avg | min |
| Maximum time spent in queue by a patient | Twait-max | min |
| Resource utilization for each phase i | Ui i = A, …, H | % |
Table 3.
Statistical distribution of the time-related parameters.
| Time-Related Parameter | Statistical Distribution [s] |
|---|---|
| tarrival = time between 2 consecutive arrivals | TRIA(51,120,510) |
| tA = working time of entry control phase | 7 + WEIB(17.2, 1.03) |
| tB = working time of check-in phase | 6.5 + GAMM(6.27, 2.22) |
| tC = working time of forms fill-in phase | 54 + WEIB(73.6, 1.15) |
| tD = working time of anamnesis control phase | OK: 24.5 + WEIB(19, 1.54) NOT OK: 32 + WEIB(24.4, 1.51) |
| tE = working time of vaccine inoculation phase | 67 + GAMM(21.7, 2.12) |
| tF = waiting time after the inoculation | TRIA(480,780,960) |
| tG = working time of side effects treatment phase | REAL EFFECTS: TRIA(240,420,600) FEAR: TRIA(60,120,180) |
| tH = working time of registration phase | TRIA(42.5,75.5,122) |
Table 4.
Values of the probability parameters.
| Probability Parameter | Value [%] |
|---|---|
| Ptemp = Probability of having a body temperature lower than 37.5 °C | 99 |
| Pfill-in = Probability of having already filled-in the forms at home | 60 |
| Panam = Probability that the anamnesis is completely ok | 30 |
| Prej = Probability of being rejected because of the anamnesis | 5 |
| Peff = Probability of experiencing side effects | 5 |
Table 5.
Comparison of the best 5 scenarios.
| PARAMETERS | SCENARIOS | |||||
|---|---|---|---|---|---|---|
| 1 | 2 | 3 | 4 | 5 | ||
| Triangular coefficients for interarrival time [s] | A | 54 | 51 | 51 | 48 | 42 |
| B | 127 | 120 | 120 | 113 | 99 | |
| C | 540 | 510 | 510 | 480 | 420 | |
| Number of resources (Ni) i = A, …, G or i = “Exit control” | A- Entry control | 4 | 4 | 4 | 4 | 4 |
| B- Check-in | 3 | 3 | 3 | 3 | 3 | |
| D- Anamnesis Control | 4 | 4 | 4 | 4 | 4 | |
| E- Vaccine Inoculation | 12 | 13 | 12 | 12 | 13 | |
| H- Registration on PC | 6 | 6 | 6 | 6 | 6 | |
| G- Side effects treatment | 2 | 2 | 2 | 2 | 2 | |
| Exit control | 2 | 2 | 2 | 2 | 2 | |
| Num tot medical resources | 18 | 19 | 18 | 18 | 19 | |
| Num tot non-medical resources | 15 | 15 | 15 | 15 | 15 | |
| NUM TOT RESOURCES | 33 | 34 | 33 | 33 | 34 | |
| Resource utilization (Ui) i = A, …, G | A- Entry control | 33.8% | 36.5% | 36.3% | 38.1% | 44.0% |
| B- Check-in | 38.1% | 41.2% | 40.8% | 42.9% | 49.5% | |
| D- Anamnesis Control | 71.6% | 77.4% | 76.6% | 80.4% | 91.8% | |
| E- Vaccine Inoculation | 75.0% | 74.7% | 80.2% | 84.1% | 88.4% | |
| H- Registration on PC | 71.6% | 77.4% | 76.5% | 80.5% | 91.4% | |
| G- Side effects treatment | 19.4% | 22.6% | 21.9% | 23.2% | 25.4% | |
| Time [min] | Tsys-avg | 23.7 | 23.9 | 25.1 | 26.4 | 32.8 |
| Tsys-max | 52.7 | 59.3 | 60.9 | 64.1 | 97.3 | |
| Twait-avg | 4 | 3.4 | 5.4 | 5.9 | 12.4 | |
| Twait-max | 38.4 | 44.3 | 48 | 56 | 83.4 | |
| Number of places to dedicate in the layout (Qi) i = A, …, G | A- Entry control | 26 | 32 | 25 | 27 | 43 |
| B- Check-in | 29 | 30 | 30 | 29 | 33 | |
| D- Anamnesis Control | 101 | 136 | 116 | 143 | 320 | |
| E- Vaccine Inoculation | 43 | 17 | 64 | 74 | 20 | |
| F- Waiting post Inoculation | 66 | 68 | 67 | 67 | 70 | |
| G- Side effects treatment | 3 | 4 | 4 | 3 | 3 | |
| Num tot places in the layout | 268 | 287 | 306 | 343 | 489 | |
| Npat | 2026 | 2192 | 2164 | 2270 | 2567 | |
| Npat/nurse | 16.9 | 16.9 | 18.0 | 18.9 | 19.8 | |
Table 6.
Values of the output parameters.
| Output Parameter | Value | Units of Measures |
|---|---|---|
| Npat/nurse | 18.03 | Patients/nurse × hour |
| Npat | 2164 | Patients/day |
| Tsys-avg | 25.1 | min |
| Tsys-max | 60.9 | min |
| Twait-avg | 5.4 | min |
| Twait-max | 48 | min |
| UA | 36.3 | % |
| UB | 40.8 | % |
| UD | 76.6 | % |
| UE | 80.2 | % |
| UG | 21.9 | % |
| UH | 76.5 | % |
Publisher’s Note: MDPI stays neutral with regard to jurisdictional claims in published maps and institutional affiliations. |
© 2021 by the authors. Licensee MDPI, Basel, Switzerland. This article is an open access article distributed under the terms and conditions of the Creative Commons Attribution (CC BY) license (https://creativecommons.org/licenses/by/4.0/).
Share and Cite
MDPI and ACS Style
Pilati, F.; Tronconi, R.; Nollo, G.; Heragu, S.S.; Zerzer, F. Digital Twin of COVID-19 Mass Vaccination Centers. Sustainability 2021, 13, 7396. https://doi.org/10.3390/su13137396
AMA Style
Pilati F, Tronconi R, Nollo G, Heragu SS, Zerzer F. Digital Twin of COVID-19 Mass Vaccination Centers. Sustainability. 2021; 13(13):7396. https://doi.org/10.3390/su13137396
Chicago/Turabian StylePilati, Francesco, Riccardo Tronconi, Giandomenico Nollo, Sunderesh S. Heragu, and Florian Zerzer. 2021. "Digital Twin of COVID-19 Mass Vaccination Centers" Sustainability 13, no. 13: 7396. https://doi.org/10.3390/su13137396
Note that from the first issue of 2016, this journal uses article numbers instead of page numbers. See further details here.