
UAVs in Disaster Management: Application of Integrated Aerial Imagery and Convolutional Neural Network for Flood Detection

 ,
,  ,
,  ,
,
Abstract
:1. Introduction
2. Literature Review
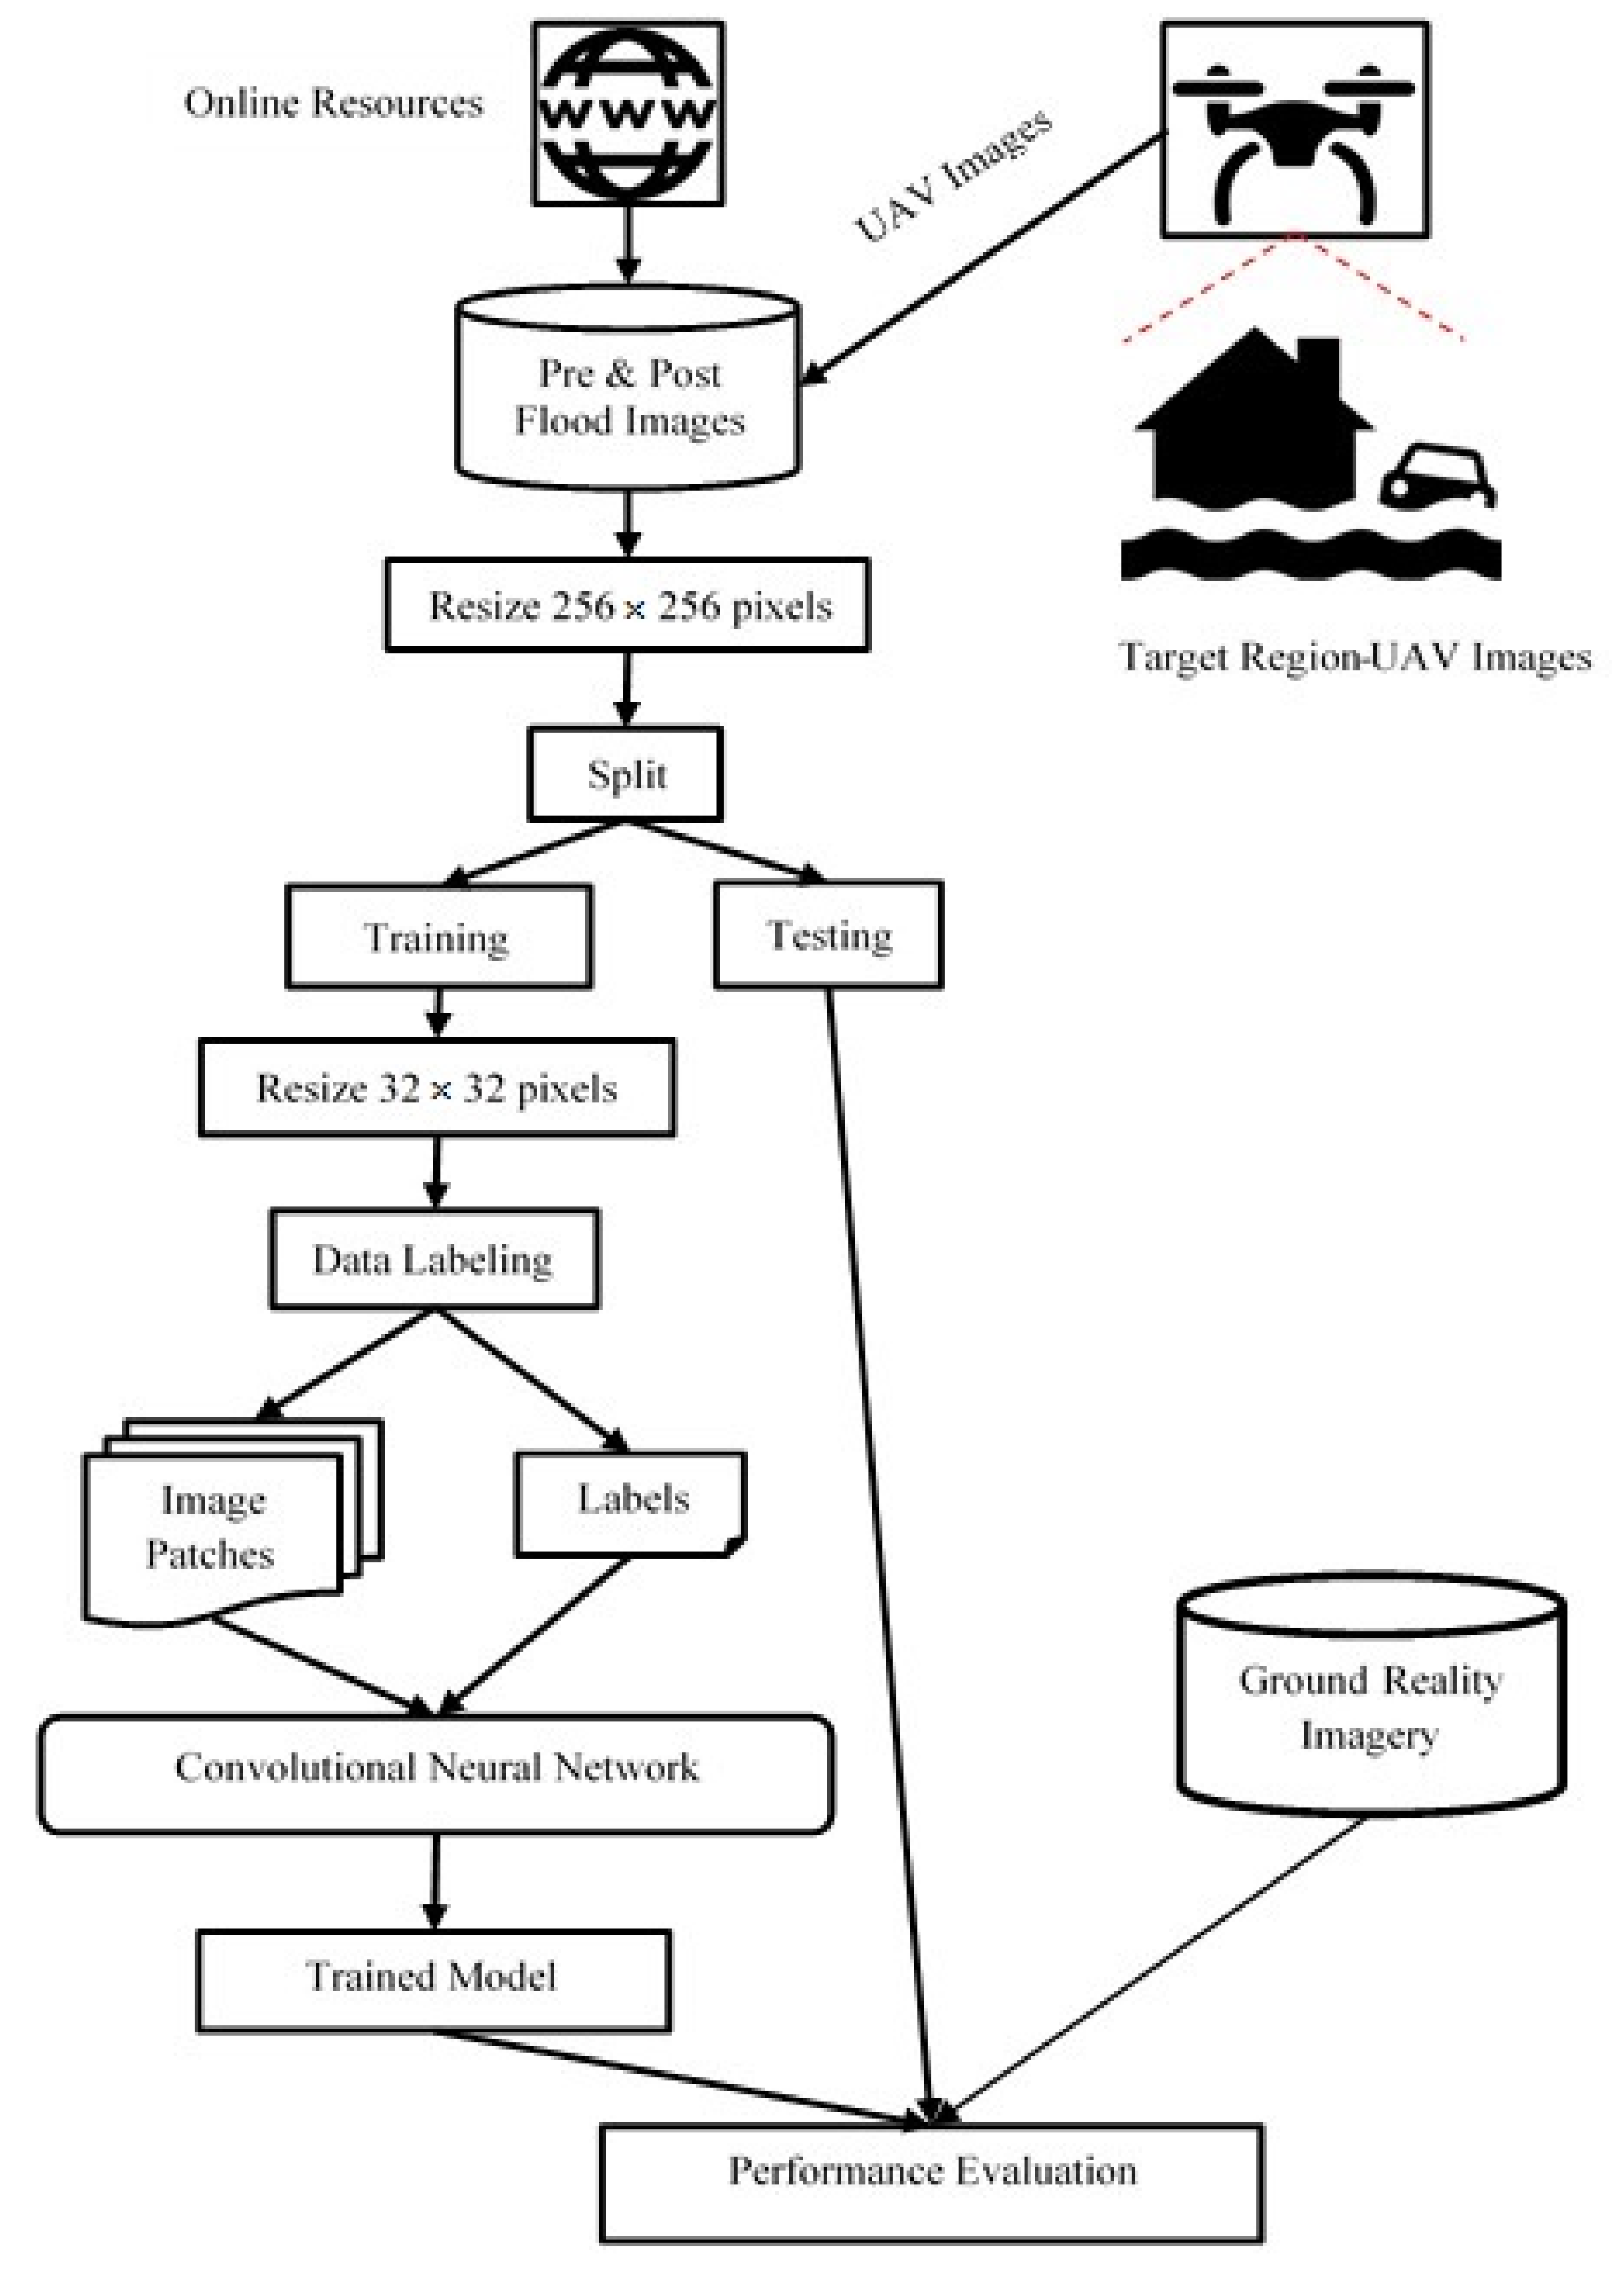
3. Materials and Methods
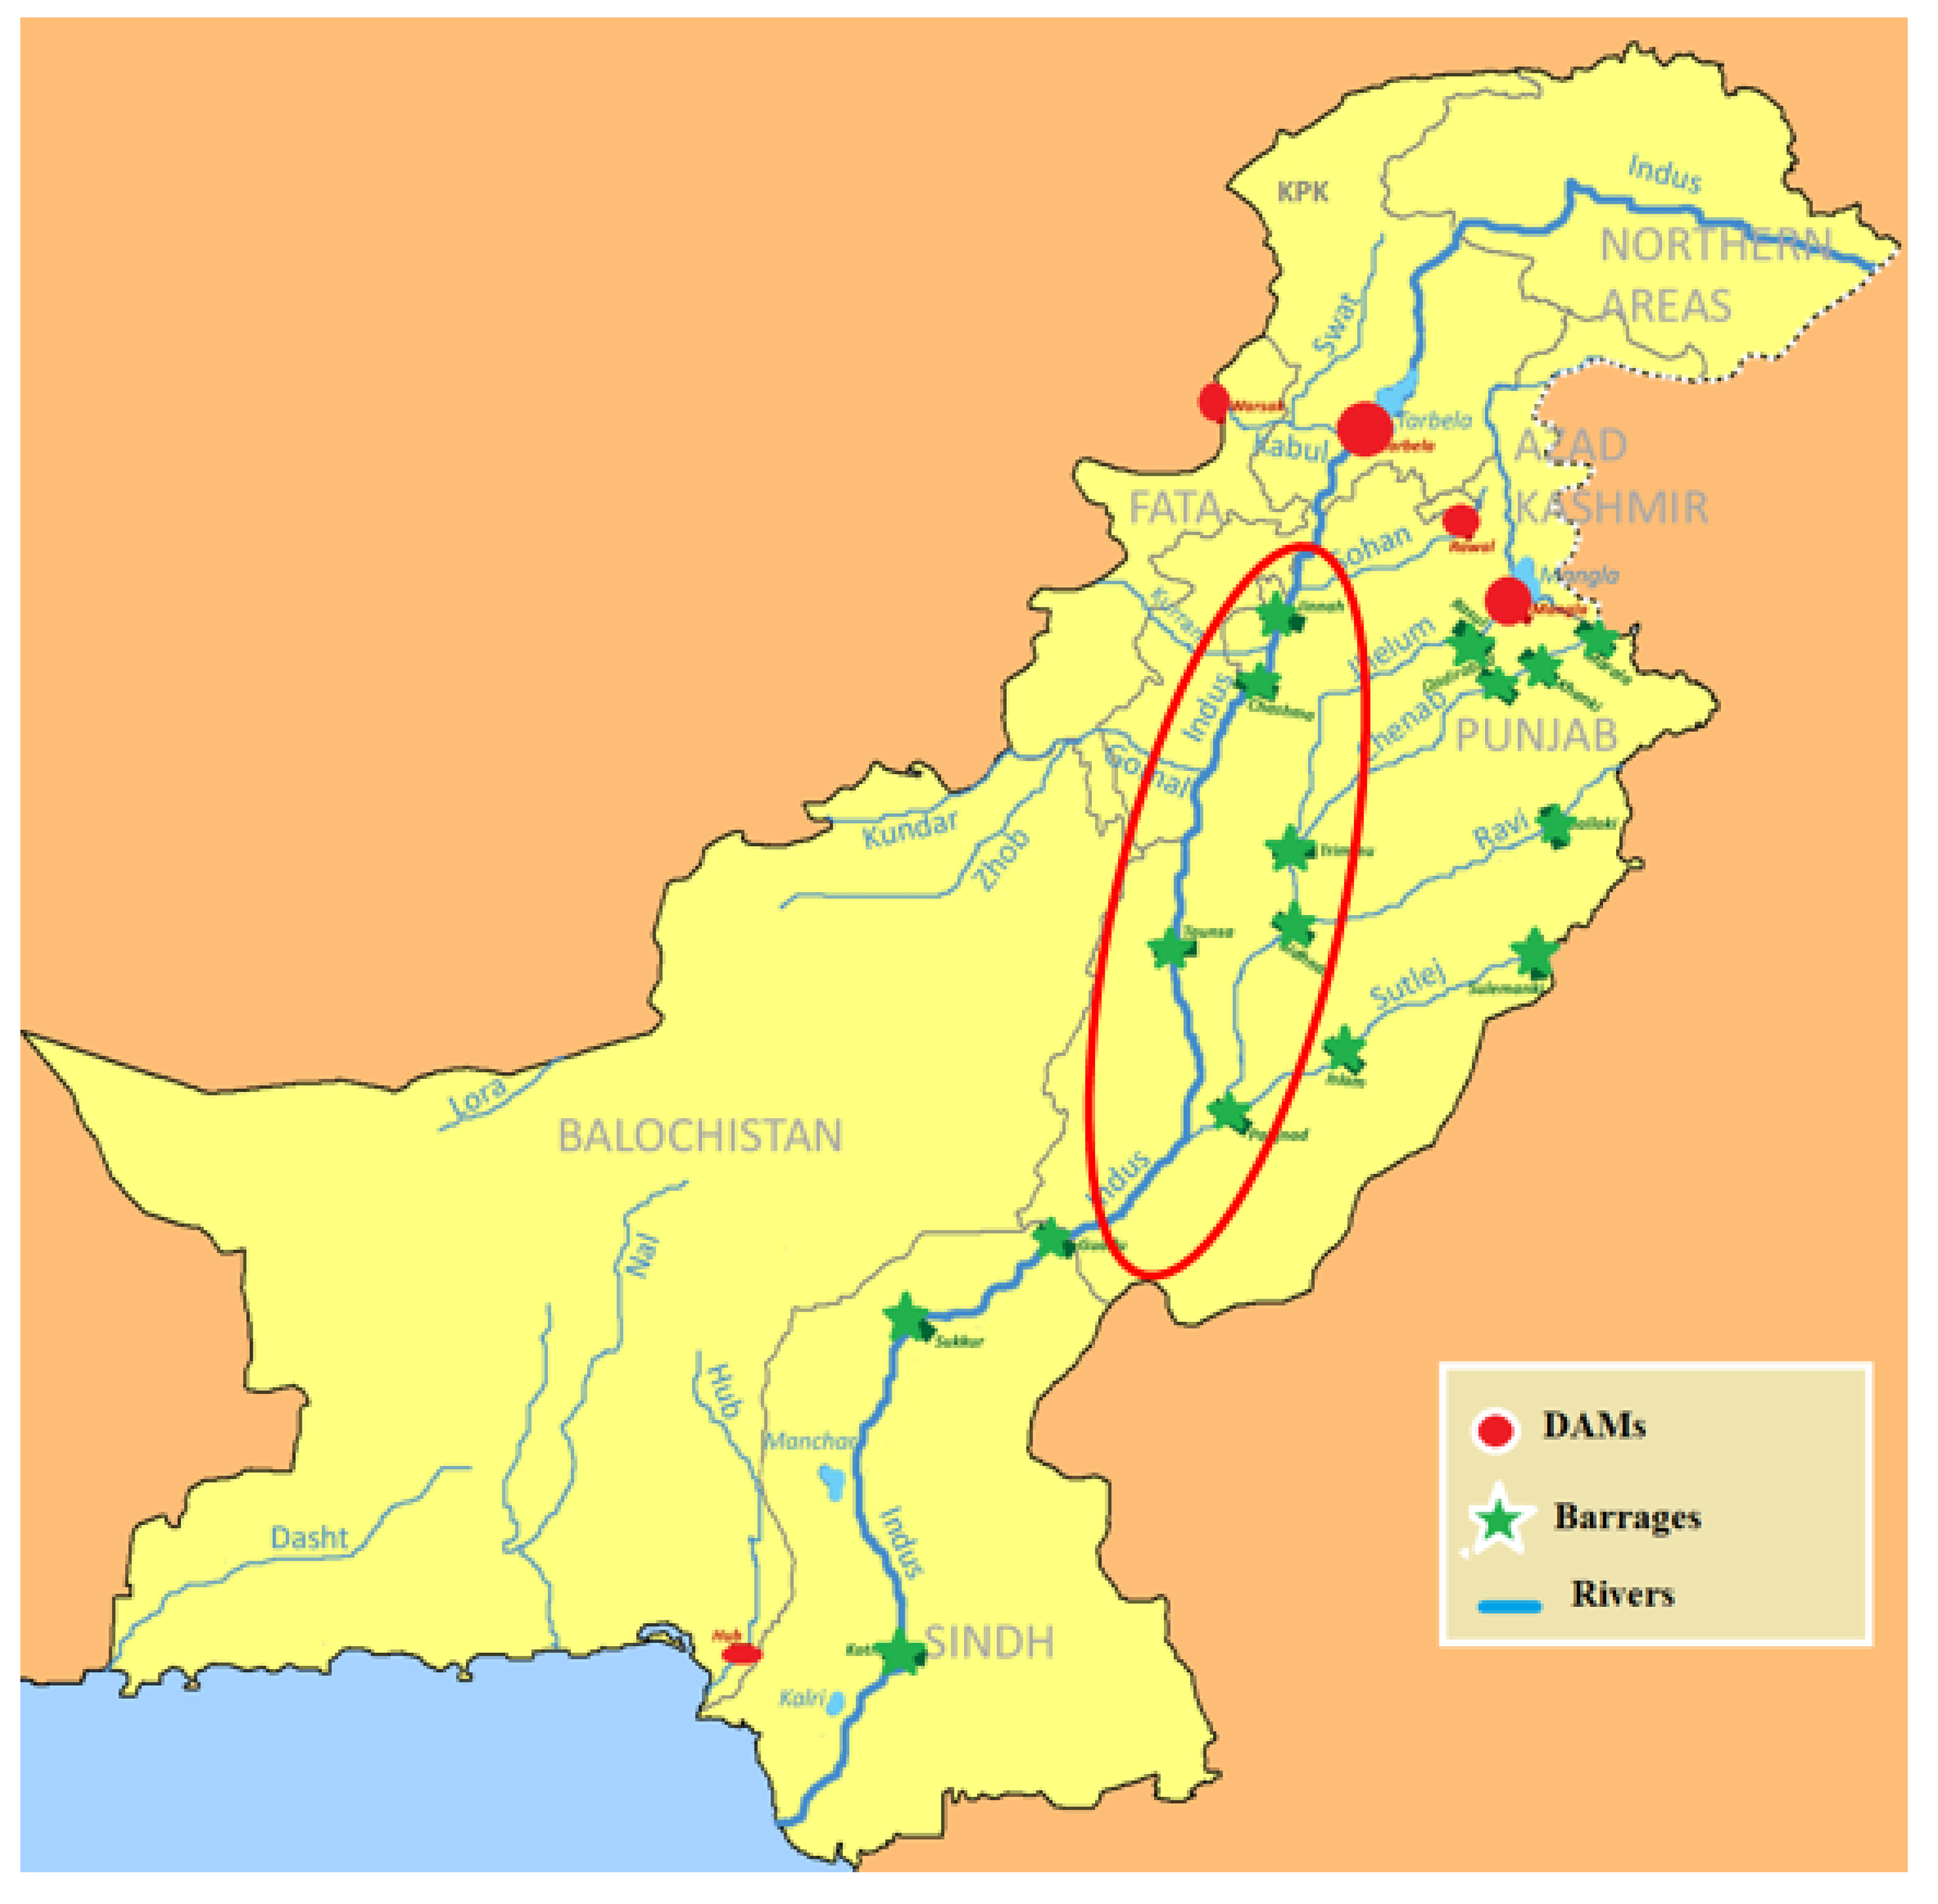
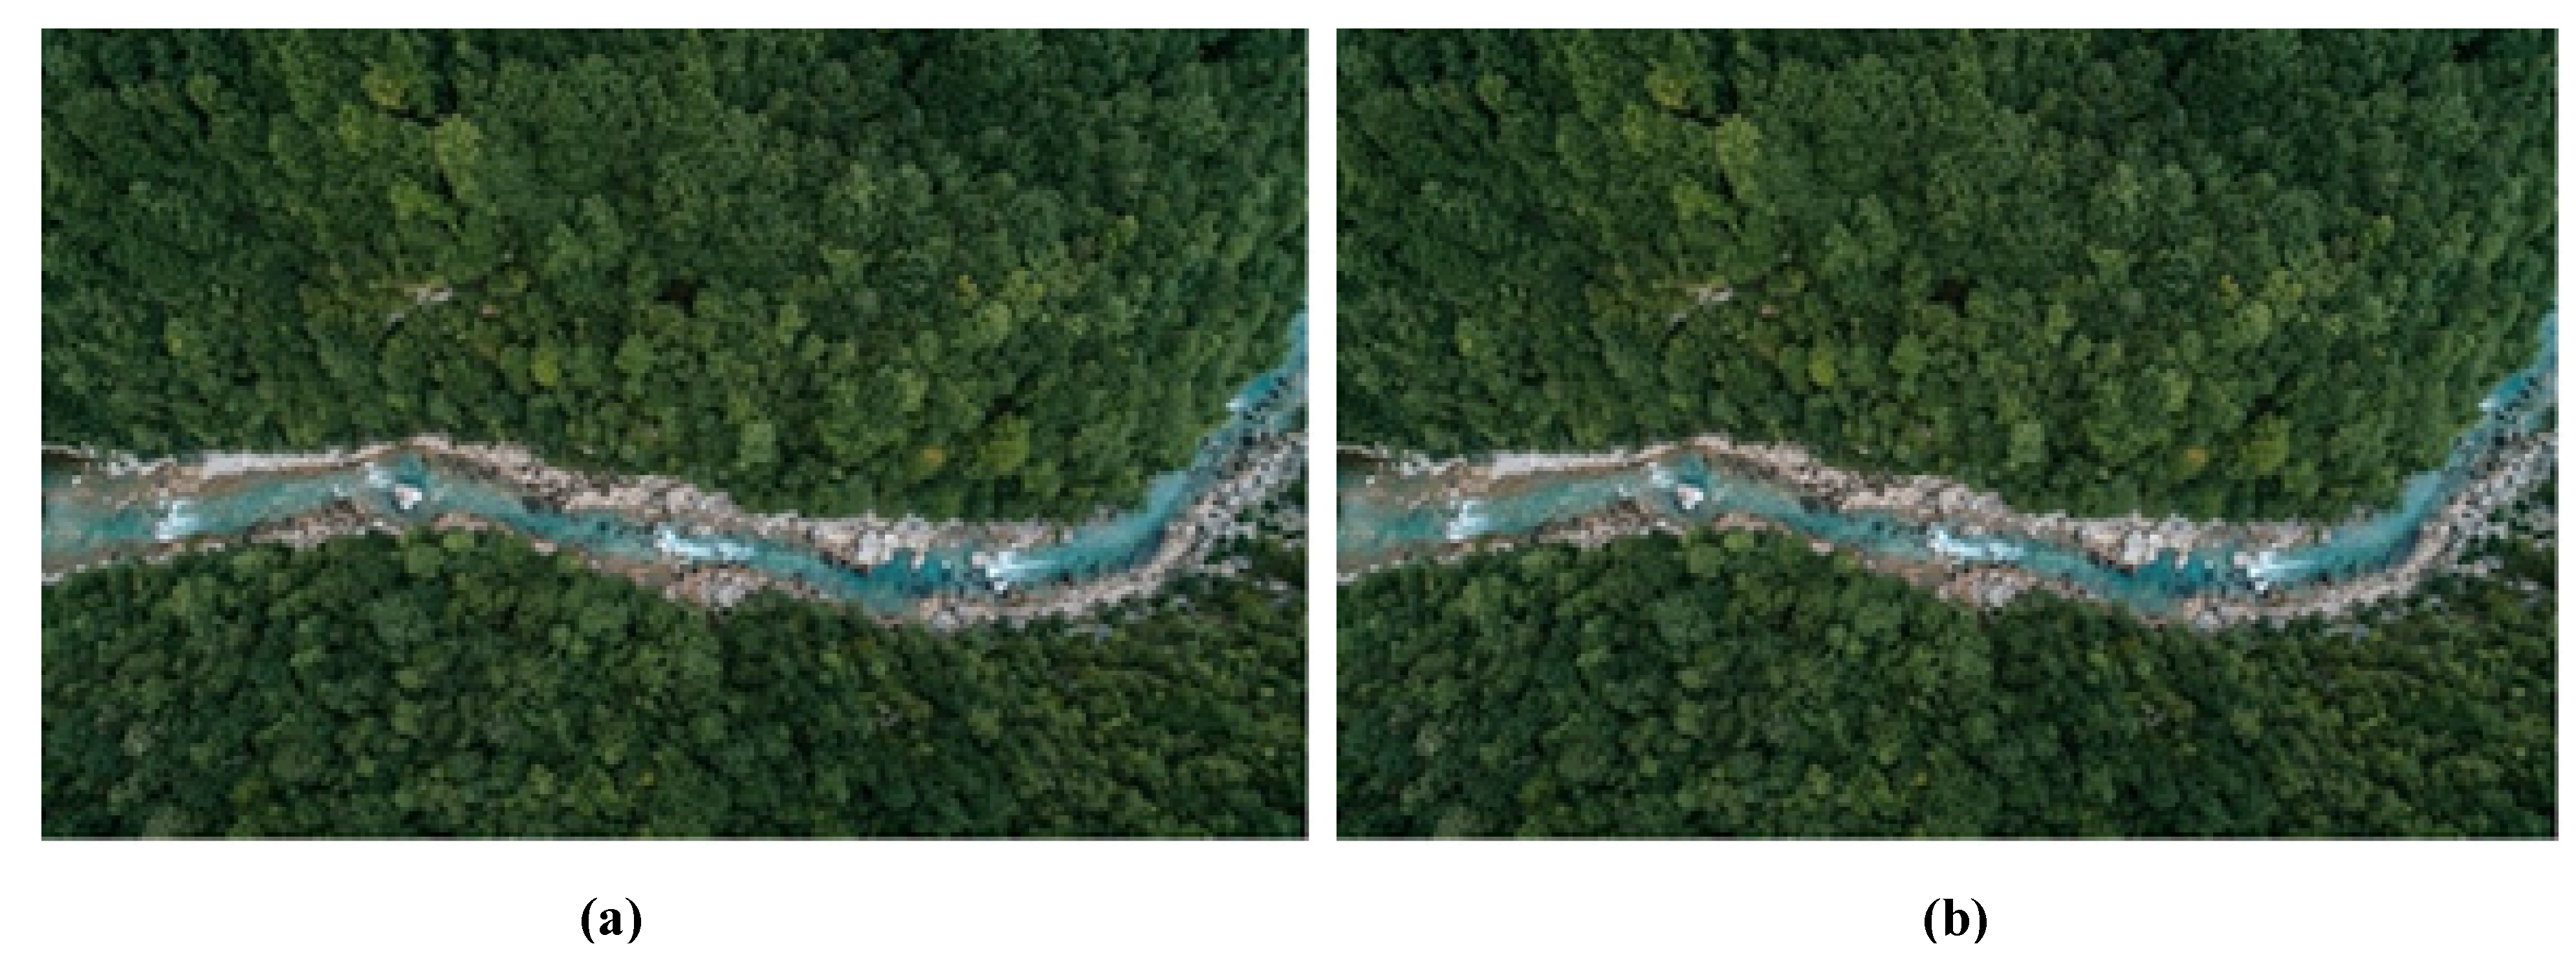
3.1. Data Collection and Target Area
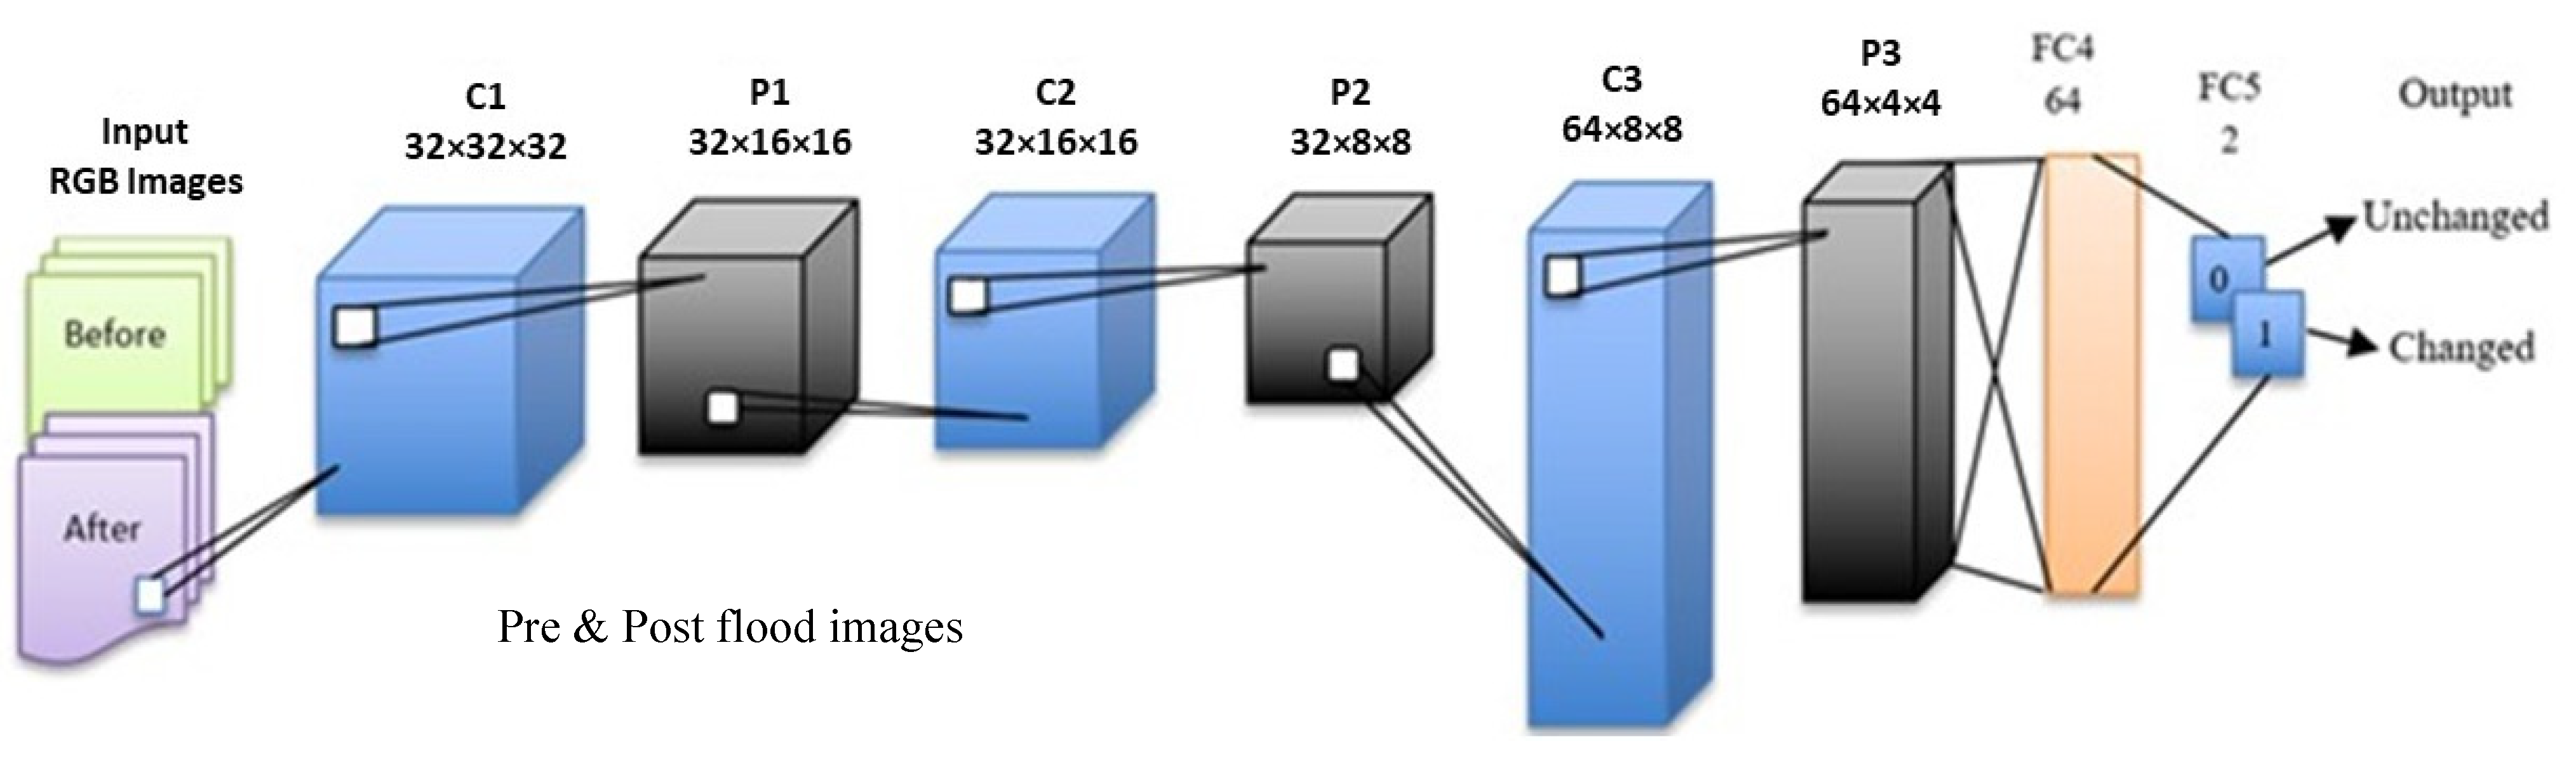
3.2. Experimental Setup
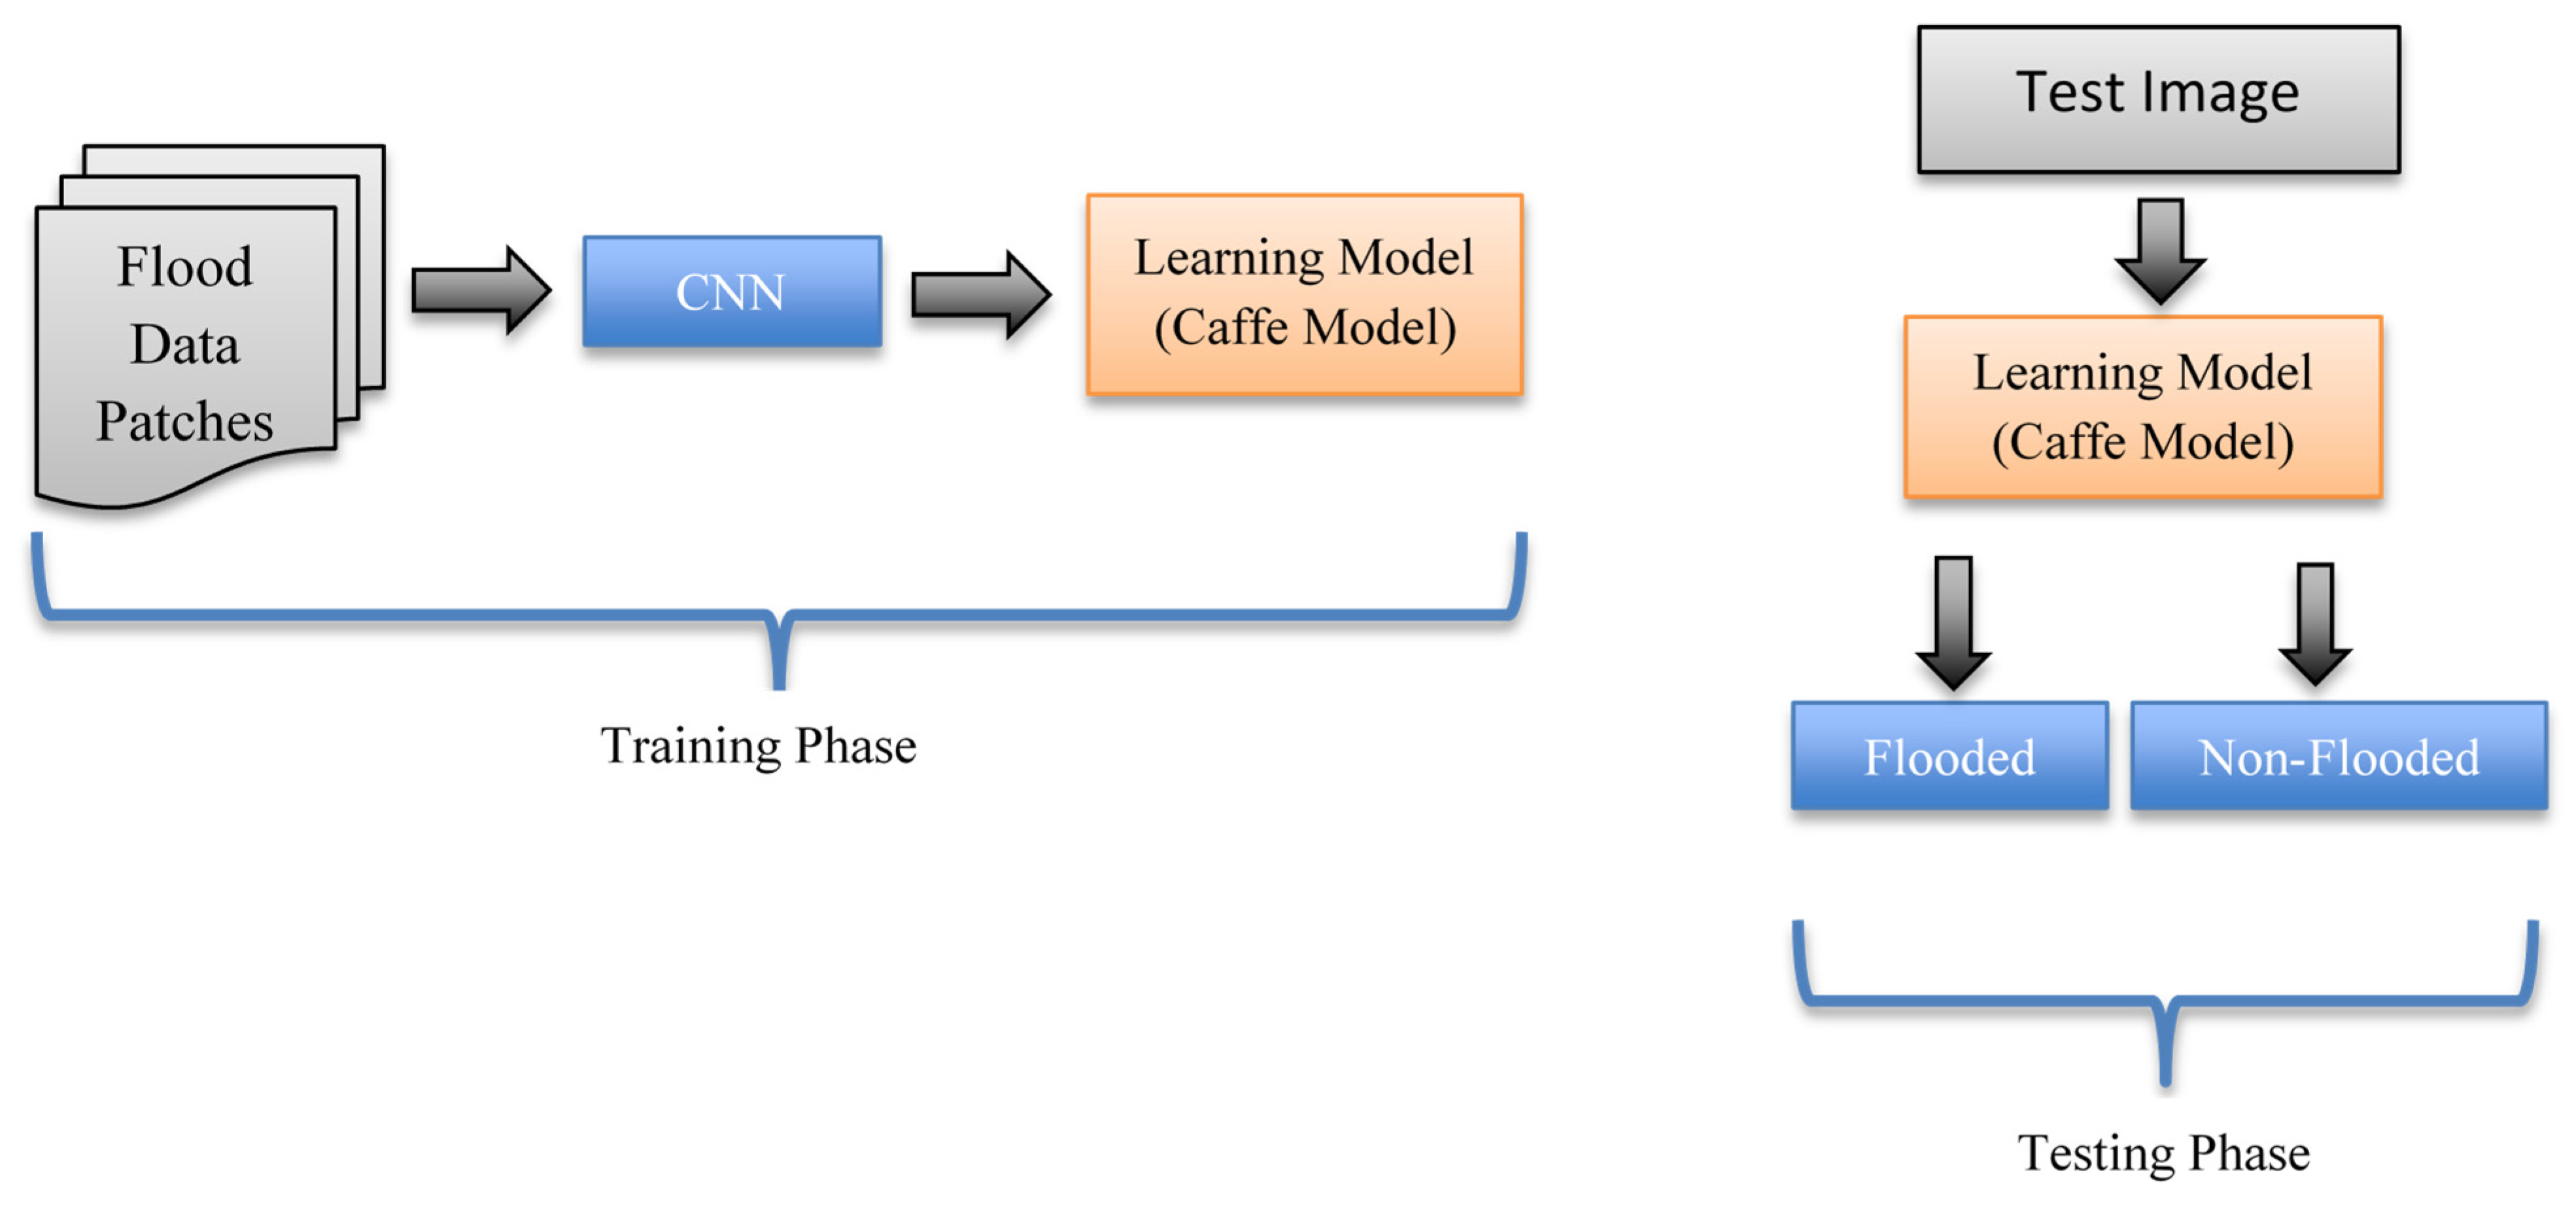
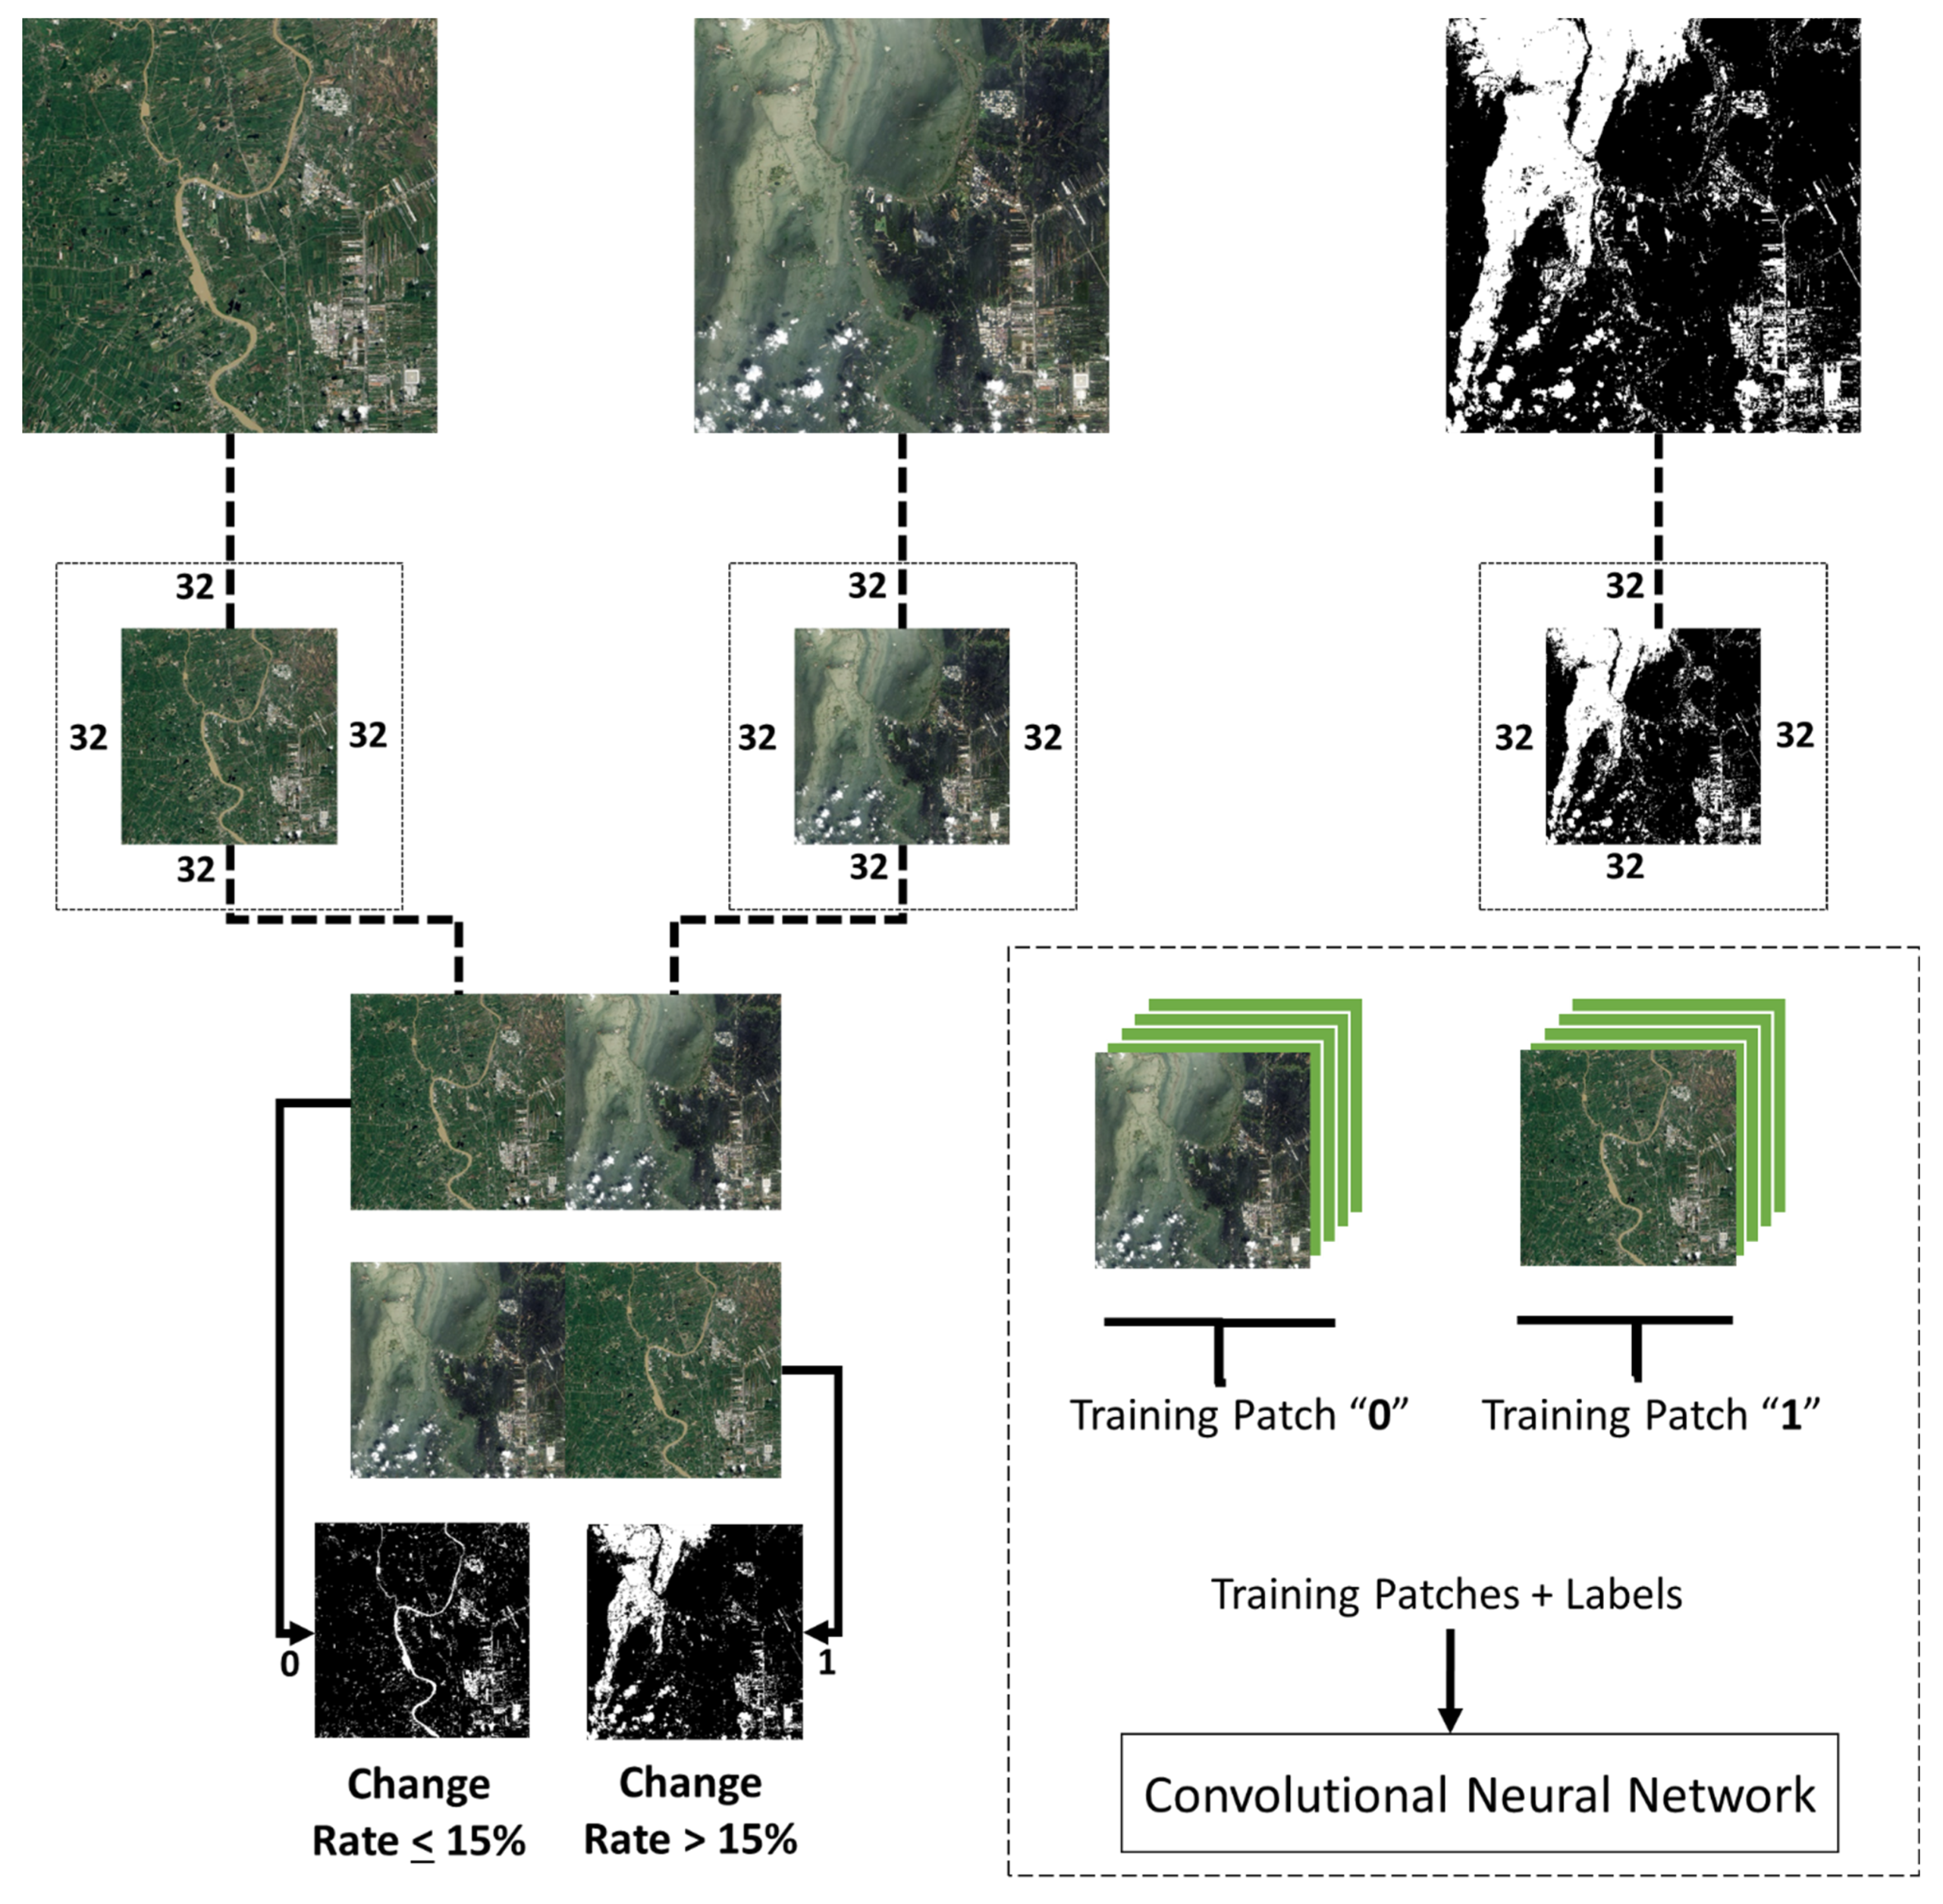
3.3. Training Phase
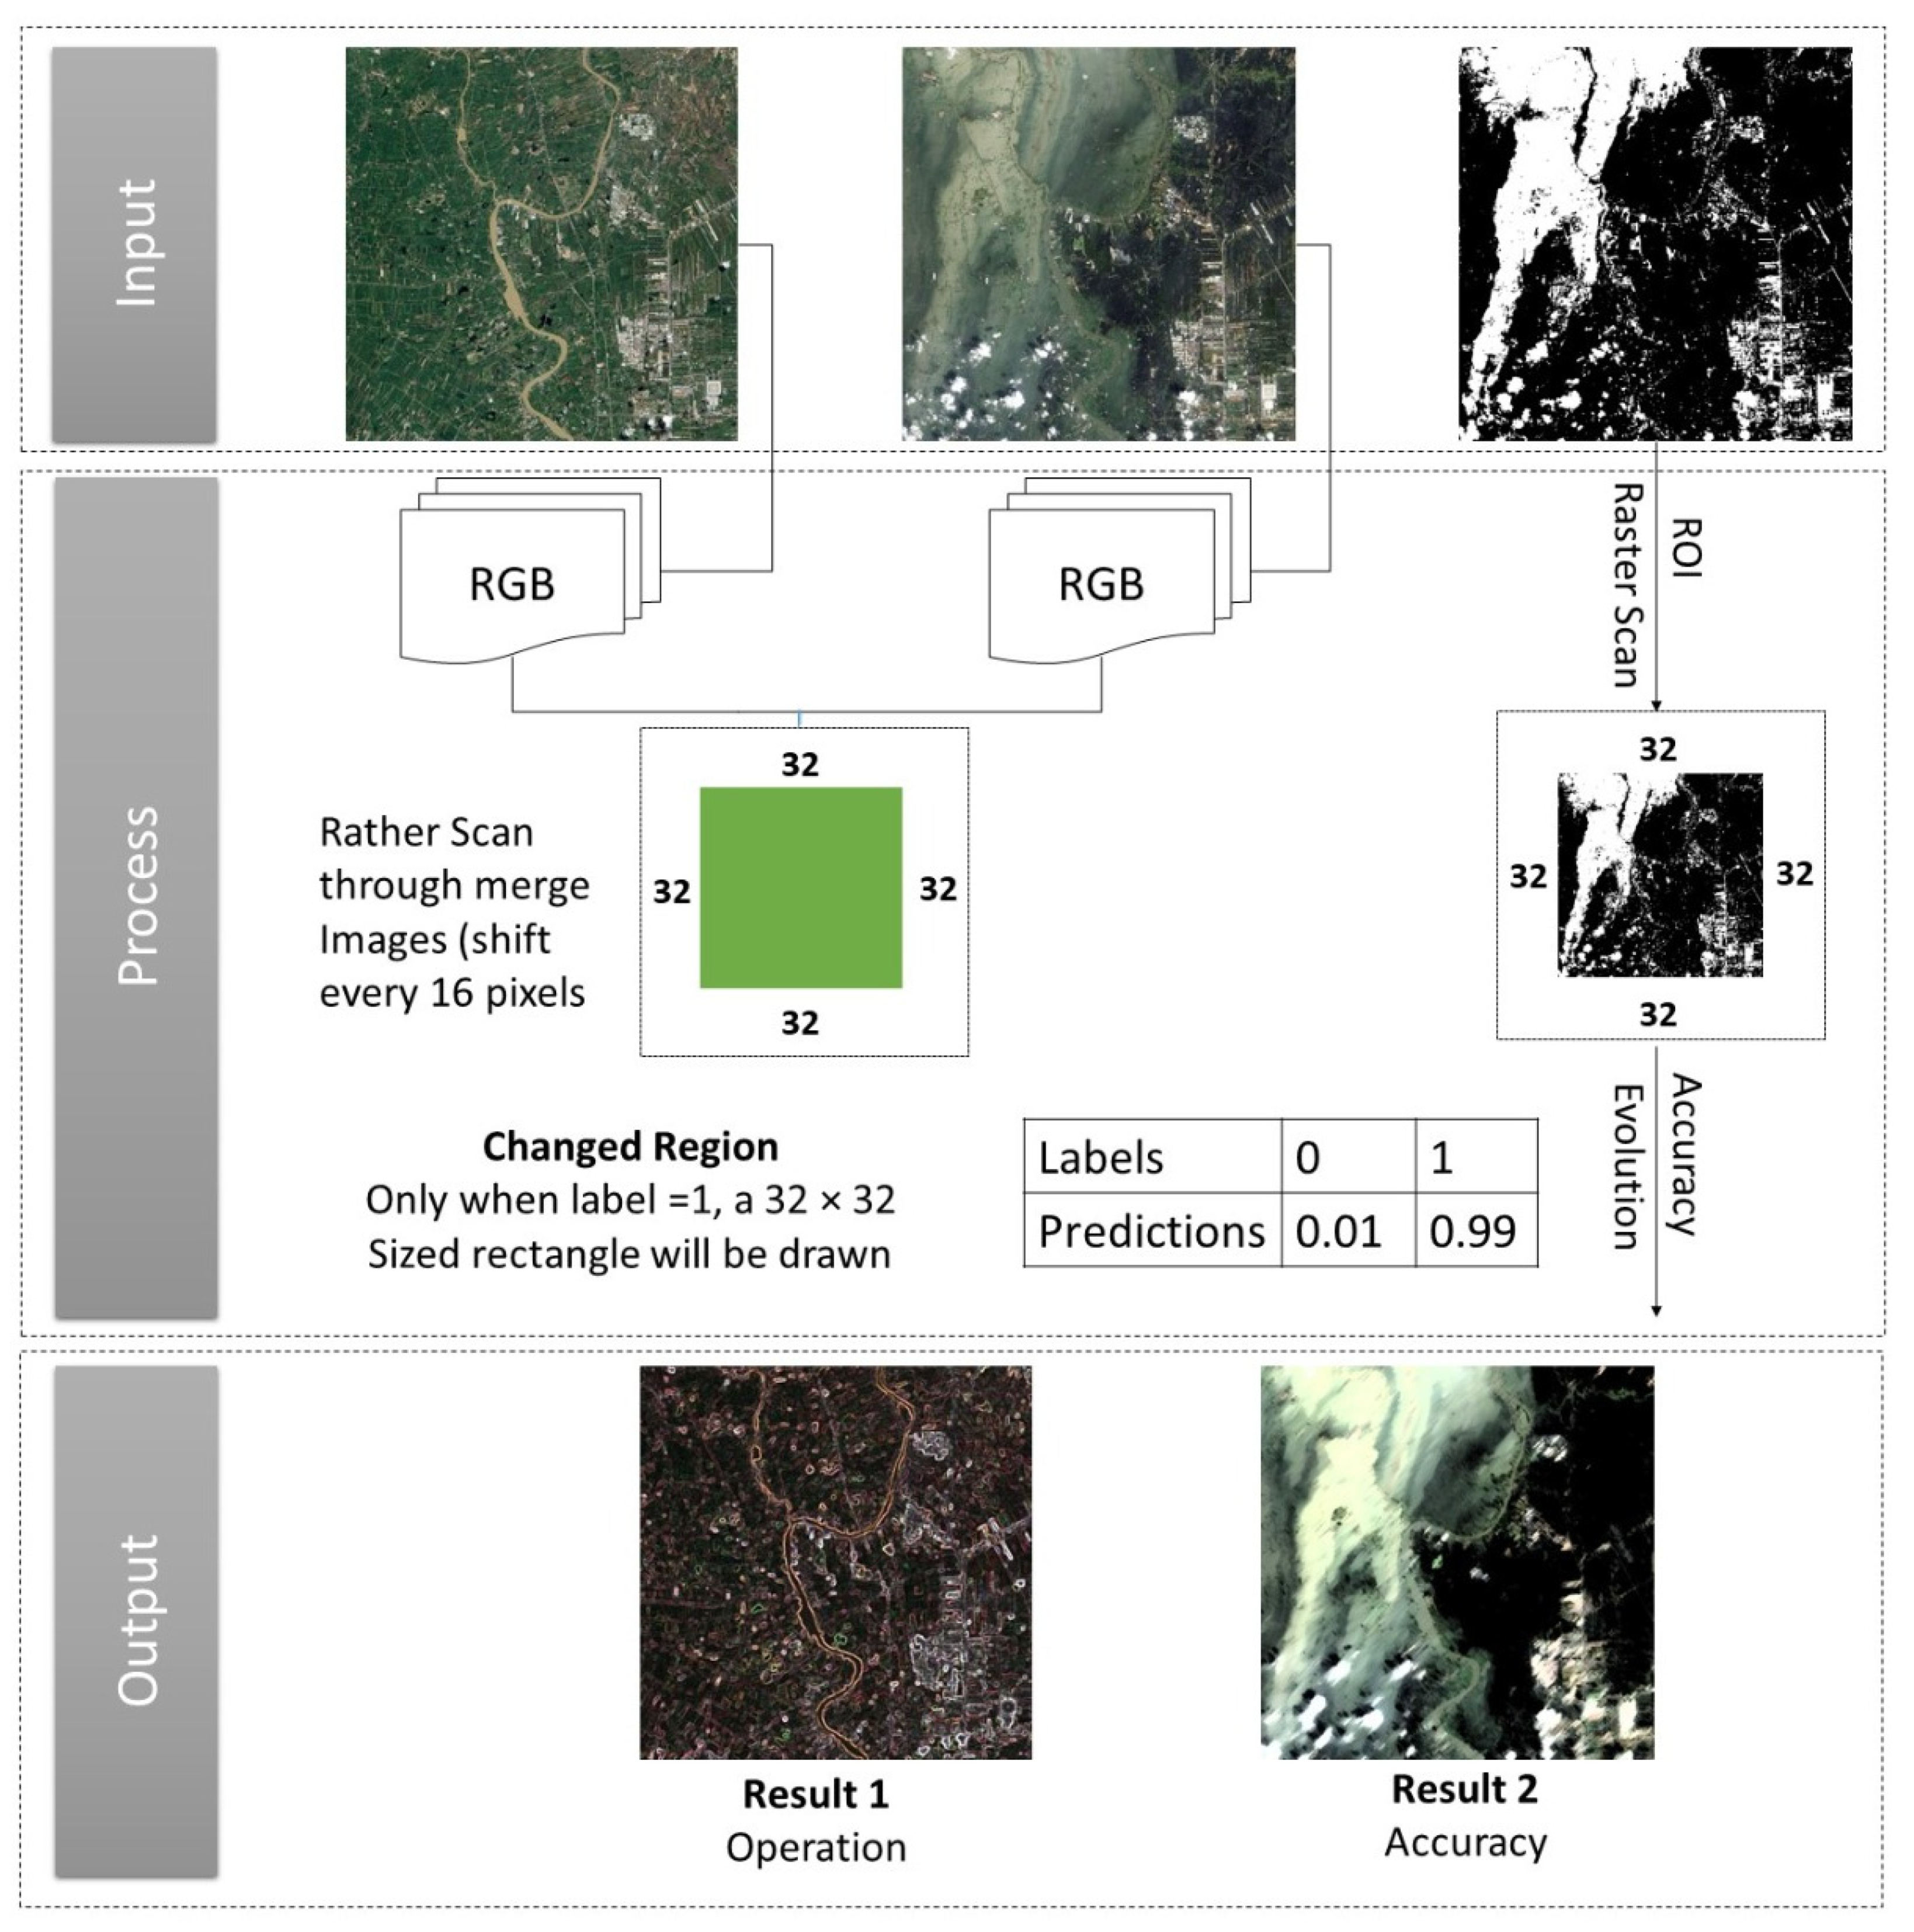
3.4. Testing Phase
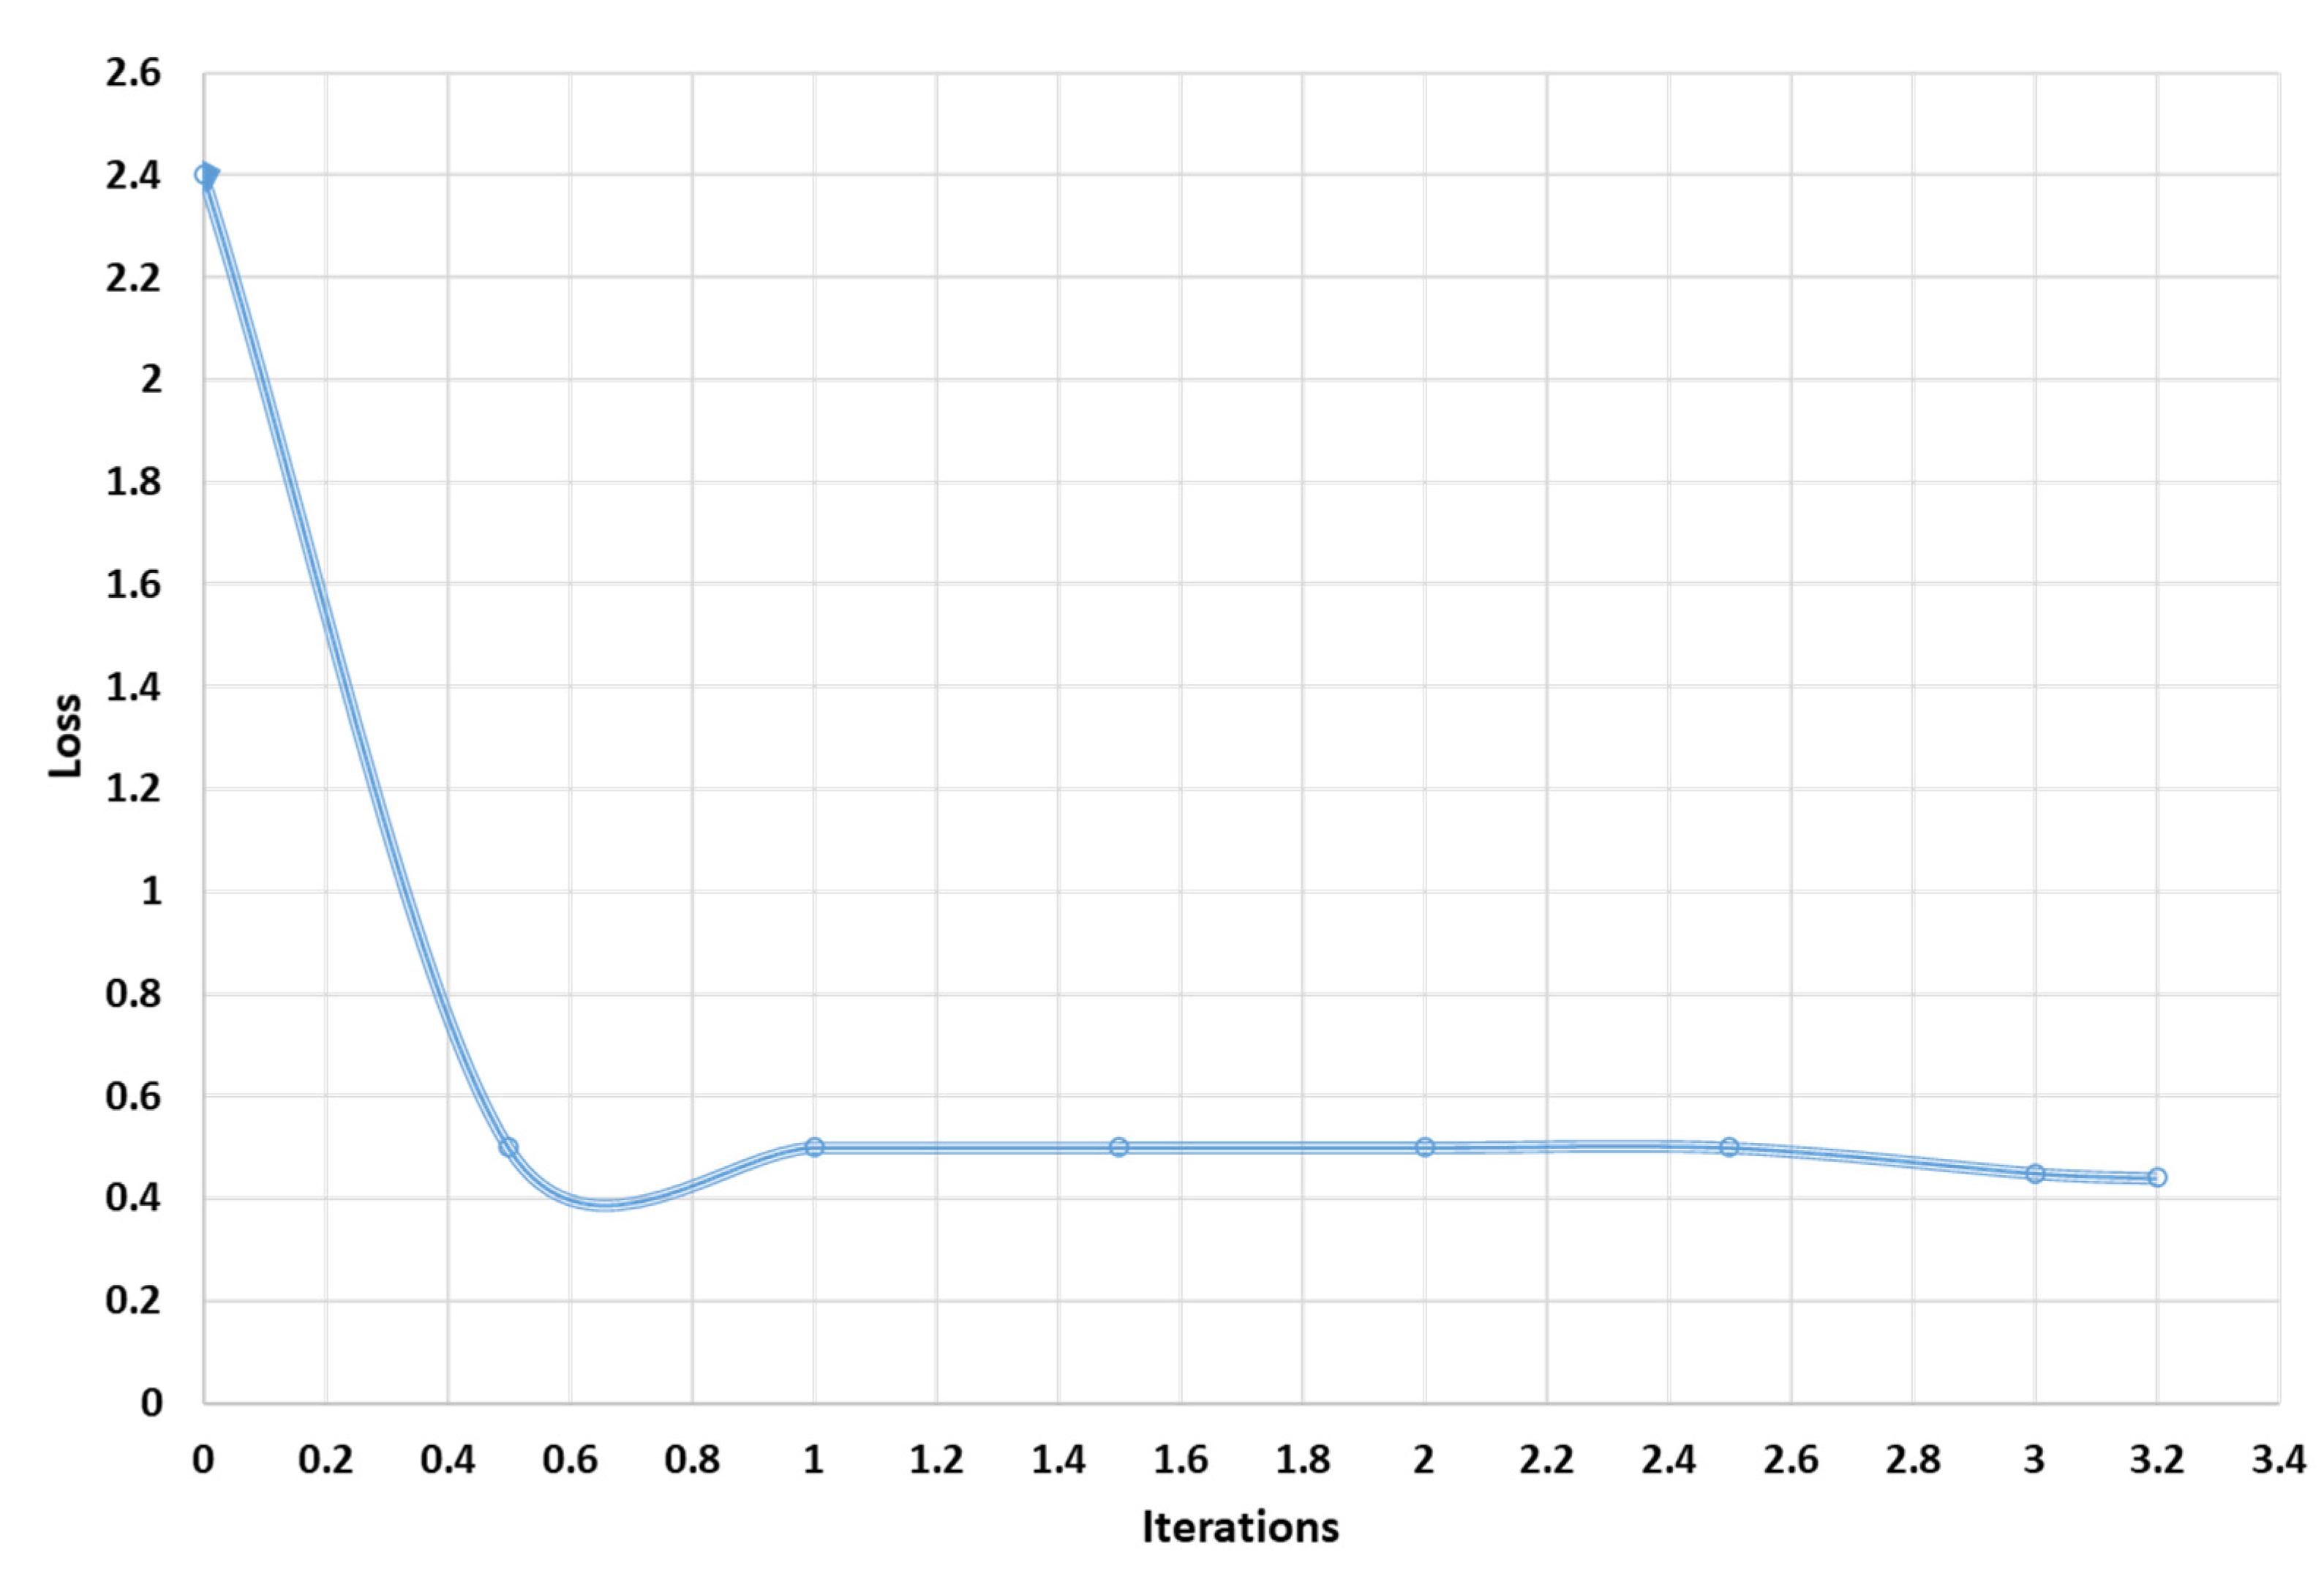
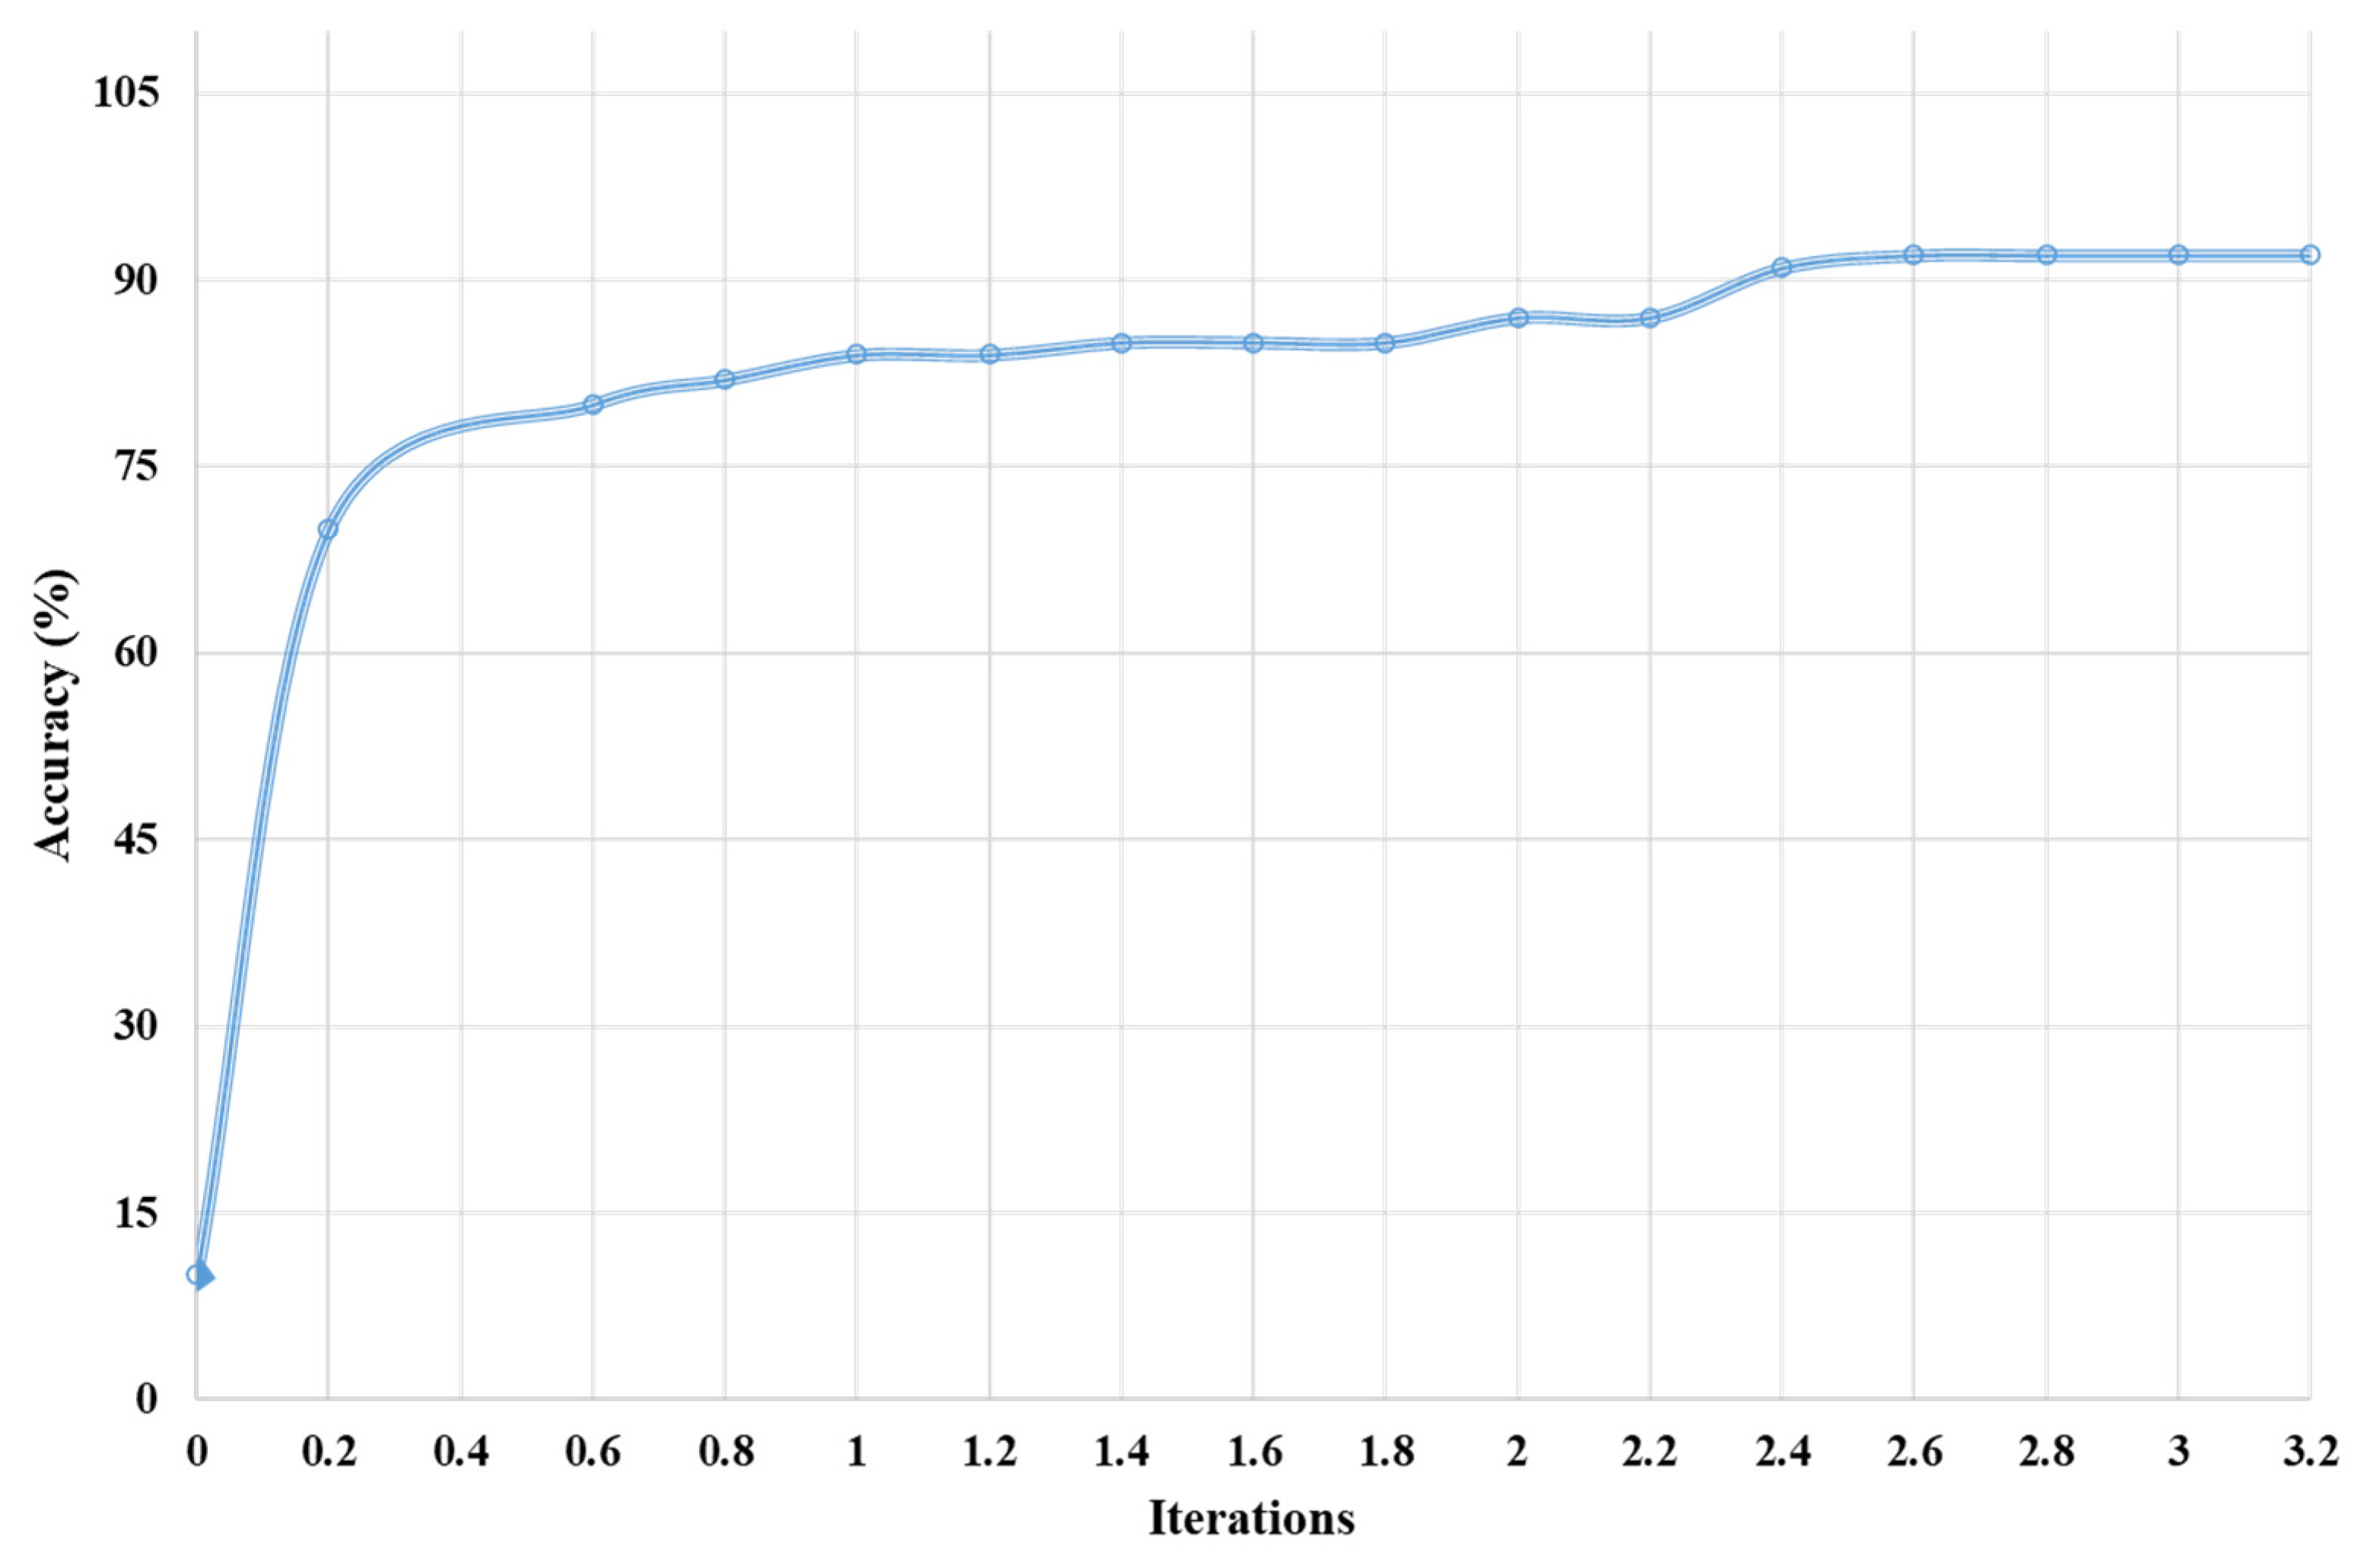
4. Results and Discussions
Training and Testing Rates
5. Conclusions
Author Contributions
Funding
Institutional Review Board Statement
Informed Consent Statement
Data Availability Statement
Conflicts of Interest
References
- Veh, G.; Korup, O.; Walz, A. Hazard from Himalayan glacier lake outburst floods. Proc. Natl. Acad. Sci. USA 2020, 117, 907–912. [Google Scholar] [CrossRef] [PubMed]
- Lim, H.R.; Lim, M.B.B.; Piantanakulchai, M. Determinants of household flood evacuation mode choice in a developing country. Nat. Hazards 2016, 84, 507–532. [Google Scholar] [CrossRef]
- Ritchie, H.; Roser, M. Natural Disasters. Available online: https://ourworldindata.org/natural-disasters (accessed on 19 October 2020).
- Munawar, H.S.; Hammad, A.; Ullah, F.; Ali, T.H. After the flood: A novel application of image processing and machine learning for post-flood disaster management. In Proceedings of the 2nd International Conference on Sustainable Development in Civil Engineering (ICSDC 2019), Jamshoro, Pakistan, 5–7 December 2019. [Google Scholar]
- Munawar, H.S.; Qayyum, S.; Ullah, F.; Sepasgozar, S. Big Data and Its Applications in Smart Real Estate and the Disaster Management Life Cycle: A Systematic Analysis. Big Data Cogn. Comput. 2020, 4, 4. [Google Scholar] [CrossRef] [Green Version]
- Fajardo, J.T.B.; Yasumoto, K.; Ito, M. Content-based data prioritization for fast disaster images collection in delay tolerant network. In Proceedings of the 2014 Seventh International Conference on Mobile Computing and Ubiquitous Networking (ICMU), Institute of Electrical and Electronics Engineers (IEEE). Singapore, 6–8 January 2014; pp. 147–152. [Google Scholar]
- Azeem, M.; Ullah, F.; Thaheem, M.J.; Qayyum, S. Competitiveness in the construction industry: A contractor’s perspective on barriers to improving the construction industry performance. J. Constr. Eng. Manag. Innov. 2020, 3, 193–219. [Google Scholar] [CrossRef]
- Ullah, F.; Sepasgozar, S.M.E. A Study of Information Technology Adoption for Real-Estate Management: A System Dynamic Model. Innov. Prod. Constr. 2019, 469–486. [Google Scholar] [CrossRef]
- Ullah, F.; Sepasgozar, S.M.E.; Wang, C. A Systematic Review of Smart Real Estate Technology: Drivers of, and Barriers to, the Use of Digital Disruptive Technologies and Online Platforms. Sustainability 2018, 10, 3142. [Google Scholar] [CrossRef] [Green Version]
- Munawar, H.S. Image and Video Processing for Defect Detection in Key Infrastructure. Mach. Vis. Insp. Syst. 2020, 1, 159–177. [Google Scholar] [CrossRef]
- Smith, A. 2017 U.S. Billion-Dollar Weather and Climate Disasters: A Historic Year in Context. Available online: https://www.climate.gov/news-features/blogs/beyond-data/2017-us-billion-dollar-weather-and-climate-disasters-historic-year (accessed on 19 October 2020).
- Shrestha, B.B.; Sawano, H.; Ohara, M.; Yamazaki, Y.; Tokunaga, Y. Methodology for Agricultural Flood Damage Assessment. In Recent Advances in Flood Risk Management; IntechOpen: London, UK, 2019. [Google Scholar]
- FAO. Damage and Losses from Climate-Related Disasters in Agricultural Sectors. Available online: http://www.fao.org/3/a-i6486e.pdf (accessed on 25 January 2021).
- FEMA. Flood Safety Awareness and American Red Cross Month. In Stakeholder Toolkit; US Department of Commerce, National Oceanic and Atmospheric Administration; National Weather Service: Washington, DC, USA, 2018. [Google Scholar]
- Felli, F.; Liu, C.; Ullah, F.; Sepasgozar, S. Implementation of 360 videos and mobile laser measurement technologies for immersive visualisation of real estate & properties. In Proceedings of the 42nd AUBEA Conference, Singapore, 26–28 September 2018. [Google Scholar]
- Low, S.; Ullah, F.; Shirowzhan, S.; Sepasgozar, S.M.; Lee, C.L. Smart Digital Marketing Capabilities for Sustainable Property Development: A Case of Malaysia. Sustainability 2020, 12, 5402. [Google Scholar] [CrossRef]
- Ullah, F.; Sepasgozar, P.S.; Ali, T.H. Real estate stakeholders technology acceptance model (RESTAM): User-focused big9 disruptive technologies for smart real estate management. In Proceedings of the 2nd International Conference on Sustainable Development in Civil Engineering (ICSDC 2019), Jamshoro, Pakistan, 5–7 December 2019. [Google Scholar]
- Munawar, H.S.; Maqsood, A. Isotropic surround suppression based linear target detection using hough transform. In Proceedings of the International Conference on Cultural Technologies (ICCT 2017), Chiang Mai, Thailand, 12–14 January 2017; pp. 357–361. [Google Scholar]
- Qayyum, S.; Ullah, F.; Al-Turjman, F.; Mojtahedi, M. Managing smart cities through six sigma DMADICV method: A review-based conceptual framework. Sustain. Cities Soc. 2021, 72, 103022. [Google Scholar] [CrossRef]
- Ullah, F.; Sepasgozar, S.M.; Shirowzhan, S.; Davis, S. Modelling users’ perception of the online real estate platforms in a digitally disruptive environment: An integrated KANO-SISQual approach. Telemat. Inform. 2021, 63, 101660. [Google Scholar] [CrossRef]
- Ullah, F.; Sepasgozar, S.M.; Thaheem, M.J.; Wang, C.C.; Imran, M. It’s all about perceptions: A DEMATEL approach to exploring user perceptions of real estate online platforms. Ain Shams Eng. J. 2021. [Google Scholar] [CrossRef]
- Pan, J.; Yin, Y.; Xiong, J.; Luo, W.; Gui, G.; Sari, H. Deep Learning-Based Unmanned Surveillance Systems for Observing Water Levels. IEEE Access 2018, 6, 73561–73571. [Google Scholar] [CrossRef]
- Atif, S.; Umar, M.; Ullah, F. Investigating the flood damages in Lower Indus Basin since 2000: Spatiotemporal analyses of the major flood events. Nat. Hazards 2021, 1–27. [Google Scholar] [CrossRef]
- Munawar, H.S.; Zhang, J.; Li, H.; Mo, D.; Chang, L. Mining Multispectral Aerial Images for Automatic Detection of Strategic Bridge Locations for Disaster Relief Missions. In Trends and Applications in Knowledge Discovery and Data Mining; Springer: Berlin, Germany, 2019. [Google Scholar]
- Munawar, S.H.; Maqsood, A.; Mustansar, Z. Isotropic surround suppression and Hough transform based target recognition from aerial images. Int. J. Adv. Appl. Sci. 2017, 4, 37–42. [Google Scholar] [CrossRef]
- Qadir, Z.; Ullah, F.; Munawar, H.S.; Al-Turjman, F. Addressing disasters in smart cities through UAVs path planning and 5G communications: A systematic review. Comput. Commun. 2021, 168, 114–135. [Google Scholar] [CrossRef]
- Gebrehiwot, A.; Hashemi-Beni, L.; Thompson, G.; Kordjamshidi, P.; Langan, T.E. Deep Convolutional Neural Network for Flood Extent Mapping Using Unmanned Aerial Vehicles Data. Sensors 2019, 19, 1486. [Google Scholar] [CrossRef] [Green Version]
- Munawar, H.S. Flood Disaster Management: Risks, Technologies, and Future Directions. In Machine Vision Inspection Systems: Image Processing, Concepts, Methodologies and Applications; Wiley: Hoboken, NJ, USA, 2020; Volume 1, pp. 115–146. [Google Scholar]
- Blaschke, T. What’s Wrong with Pixels? Some Recent Developments Interfacing Remote Sens. Gis. 2001, 6, 12–17. [Google Scholar]
- Pradhan, B.; Tehrany, M.S.; Jebur, M.N. A New Semiautomated Detection Mapping of Flood Extent from TerraSAR-X Satellite Image Using Rule-Based Classification and Taguchi Optimization Techniques. IEEE Trans. Geosci. Remote Sens. 2016, 54, 4331–4342. [Google Scholar] [CrossRef]
- Joshi, A.R.; Tarte, I.; Suresh, S.; Koolagudi, S.G. Damage identification and assessment using image processing on post-disaster satellite imagery. In Proceedings of the 2017 IEEE Global Humanitarian Technology Conference (GHTC), Institute of Electrical and Electronics Engineers (IEEE). Seattle, WA, USA, 17–20 October 2017; pp. 1–7. [Google Scholar]
- Rizeei, H.M.; Pradhan, B.; Saharkhiz, M.A. An integrated fluvial and flash pluvial model using 2D high-resolution sub-grid and particle swarm optimization-based random forest approaches in GIS. Complex Intell. Syst. 2019, 5, 283–302. [Google Scholar] [CrossRef] [Green Version]
- Lyu, H.-M.; Shen, S.-L.; Zhou, A.; Yang, J. Perspectives for flood risk assessment and management for mega-city metro system. Tunn. Undergr. Space Technol. 2019, 84, 31–44. [Google Scholar] [CrossRef]
- Ireland, G.; Volpi, M.; Petropoulos, G.P. Examining the Capability of Supervised Machine Learning Classifiers in Extracting Flooded Areas from Landsat TM Imagery: A Case Study from a Mediterranean Flood. Remote Sens. 2015, 7, 3372–3399. [Google Scholar] [CrossRef] [Green Version]
- Sutskever, I.; Hinton, G.E. Deep, Narrow Sigmoid Belief Networks Are Universal Approximators. Neural Comput. 2008, 20, 2629–2636. [Google Scholar] [CrossRef] [PubMed] [Green Version]
- Krizhevsky, A.; Sutskever, I.; Hinton, G. Magenet classification with deep convolutional neural networks. In Proceedings of the Advances in Neural Information Processing Systems, Lake Tahoe, NV, USA, 3–6 December 2012; pp. 1097–1105. [Google Scholar]
- Anuse, A.; Vyas, V. A novel training algorithm for convolutional neural network. Complex Intell. Syst. 2016, 2, 221–234. [Google Scholar] [CrossRef] [Green Version]
- Grossberg, S. Recurrent neural networks. Scholarpedia 2013, 8, 1888. [Google Scholar] [CrossRef]
- Kollias, D.; Tagaris, A.; Stafylopatis, A.; Kollias, S.; Tagaris, G. Deep neural architectures for prediction in healthcare. Complex Intell. Syst. 2018, 4, 119–131. [Google Scholar] [CrossRef] [Green Version]
- Jabbari, A.; Bae, D.-H. Application of Artificial Neural Networks for Accuracy Enhancements of Real-Time Flood Forecasting in the Imjin Basin. Water 2018, 10, 1626. [Google Scholar] [CrossRef] [Green Version]
- Sankaranarayanan, S.; Prabhakar, M.; Satish, S.; Jain, P.; Ramprasad, A.; Krishnan, A. Flood prediction based on weather parameters using deep learning. J. Water Clim. Chang. 2020, 11, 1766–1783. [Google Scholar] [CrossRef]
- Doubleday, J.; McLaren, D.; Chien, S.; Lou, Y. Using Support Vector Machine Learning to Automatically Interpret Modis, Ali, And L-Band Sar Remotely Sensed Imagery For Hydrology, Land Cover, And Cryosphere Applications. In Proceedings of the Workshop on AI and Space, International Joint Conference on Artificial Intelligence, Barcelona, Spain, 16–22 July 2011. [Google Scholar]
- Elsafi, S.H. Artificial Neural Networks (ANNs) for flood forecasting at Dongola Station in the River Nile, Sudan. Alex. Eng. J. 2014, 53, 655–662. [Google Scholar] [CrossRef]
- Anusha, N.; Bharathi, B. Flood detection and flood mapping using multi-temporal synthetic aperture radar and optical data. Egypt. J. Remote Sens. Space Sci. 2020, 23, 207–219. [Google Scholar] [CrossRef]
- Hosseiny, H.; Nazari, F.; Smith, V.; Nataraj, C. A Framework for Modeling Flood Depth Using a Hybrid of Hydraulics and Machine Learning. Sci. Rep. 2020, 10, 1–14. [Google Scholar] [CrossRef]
- Li, Y.; Martinis, S.; Wieland, M. Urban flood mapping with an active self-learning convolutional neural network based on TerraSAR-X intensity and interferometric coherence. ISPRS J. Photogramm. Remote Sens. 2019, 152, 178–191. [Google Scholar] [CrossRef]
- Zhao, G.; Pang, B.; Xu, Z.; Peng, D.; Zuo, D. Urban flood susceptibility assessment based on convolutional neural networks. J. Hydrol. 2020, 590, 125235. [Google Scholar] [CrossRef]
- Basha, E.; Rus, D. Design of early warning flood detection systems for developing countries. In Proceedings of the 2007 International Conference on Information and Communication Technologies and Development, Institute of Electrical and Electronics Engineers (IEEE). Bangalore, India, 15–16 December 2007; pp. 1–10. [Google Scholar]
- Alfieri, L.; Velasco, D.; Thielen, J. Flash flood detection through a multi-stage probabilistic warning system for heavy pre-cipitation events. Adv. Geosci. 2011, 29, 69–75. [Google Scholar] [CrossRef] [Green Version]
- Narayanan, R.; Lekshmy, V.M.; Rao, S.; Sasidhar, K. A novel approach to urban flood monitoring using computer vision. In Proceedings of the Fifth International Conference on Computing, Communications and Networking Technologies (ICCCNT), Hefei, China, 11–13 July 2014; Institute of Electrical and Electronics Engineers (IEEE): Piscataway, NJ, USA, 2014; pp. 1–7. [Google Scholar]
- Mousa, M.; Zhang, X.; Claudel, C. Flash Flood Detection in Urban Cities Using Ultrasonic and Infrared Sensors. IEEE Sens. J. 2016, 16, 7204–7216. [Google Scholar] [CrossRef] [Green Version]
- Wang, Y.; Chen, A.; Fu, G.; Djordjevic, S.; Zhang, C.; Savić, D.A. An integrated framework for high-resolution urban flood modelling considering multiple information sources and urban features. Environ. Model. Softw. 2018, 107, 85–95. [Google Scholar] [CrossRef]
- Smith, L.; Liang, Q.; James, P.; Lin, W. Assessing the utility of social media as a data source for flood risk management using a real-time modelling framework: Assessing the utility of social media for flood risk management. J. Flood Risk Manag. 2017, 10, 370–380. [Google Scholar] [CrossRef]
- Amit, S.N.K.B.; Aoki, Y. Disaster Detection from Aerial Imagery with Convolutional Neural Network. In Proceedings of the 2017 International Electronics Symposium on Knowledge Creation and Intelligent Computing (IES-KCIC), Surabaya, Indonesia, 26–27 September 2017; pp. 239–245. [Google Scholar] [CrossRef]
- Zhao, Y.; Wang, T.; Zhang, S.; Wang, Y. Towards minimum code dissemination delay through UAV joint vehicles for smart city. IET Commun. 2020, 14, 2442–2452. [Google Scholar] [CrossRef]
- Islam, A.; Shin, S.Y. A blockchain-based secure healthcare scheme with the assistance of unmanned aerial vehicle in In-ternet of Things. Comput. Electr. Eng. 2020, 84, 106627. [Google Scholar] [CrossRef]
- Kumar, S.J.; Kumar, S.; Choksi, M.; Zaveri, M.A. Collaborative data acquisition and processing for post disaster manage-ment and surveillance related tasks using UAV-based IoT cloud. Int. J. Ad Hoc Ubiquitous Comput. 2020, 34, 216–232. [Google Scholar] [CrossRef]
- Ejaz, W.; Ahmed, A.; Mushtaq, A.; Ibnkahla, M. Energy-efficient task scheduling and physiological assessment in disaster management using UAV-assisted networks. Comput. Commun. 2020, 155, 150–157. [Google Scholar] [CrossRef]
- Mehallegue, N.; Djellab, M.; Loukhaoukha, K. Efficient Use of UAVs for Public Safety in Disaster and Crisis Management. Wirel. Pers. Commun. 2020, 1–12. [Google Scholar] [CrossRef]
- Kastridis, A.; Kirkenidis, C.; Sapountzis, M. An integrated approach of flash flood analysis in ungauged Mediterranean watersheds using post-flood surveys and Unmanned Aerial Vehicles (UAVs). Hydrol. Processes 2020. [Google Scholar] [CrossRef]
- Liu, W.; Chen, Z.; Zheng, M. An Audio-Based Fault Diagnosis Method for Quadrotors Using Convolutional Neural Network and Transfer Learning. In Proceedings of the 2020 American Control Conference (ACC), Denver, CO, USA, 1–3 July 2020. [Google Scholar]
- Rottondi, C.; Malandrino, F.; Bianco, A.; Chiasserini, C.F.; Stavrakakis, I. Scheduling of emergency tasks for multiservice UAVs in post-disaster scenarios. Comput. Netw. 2021, 184, 107644. [Google Scholar] [CrossRef]
- Khosravi, K.; Panahi, M.; Golkarian, A.; Keesstra, S.D.; Saco, P.M.; Bui, D.T.; Lee, S. Convolutional neural network approach for spatial prediction of flood hazard at national scale of Iran. J. Hydrol. 2020, 591, 125552. [Google Scholar] [CrossRef]
- Ali, H.; Choi, J.-H. A Review of Underground Pipeline Leakage and Sinkhole Monitoring Methods Based on Wireless Sensor Networking. Sustainability 2019, 11, 4007. [Google Scholar] [CrossRef] [Green Version]
- Ahmed, H.; La, H.M.; Tran, K. Rebar detection and localization for bridge deck inspection and evaluation using deep residual networks. Autom. Constr. 2020, 120, 103393. [Google Scholar] [CrossRef]
- Mason, D.C.; Speck, R.; Devereux, B.; Schumann, G.J.P.; Neal, J.C.; Bates, P.D. Flood Detection in Urban Areas Using Ter-raSAR-X. IEEE Trans. Geosci. Remote Sens. 2010, 48, 882–894. [Google Scholar] [CrossRef] [Green Version]
- Di Martino, G.; Iodice, A.; Riccio, D.; Ruello, G. A Novel Approach for Disaster Monitoring: Fractal Models and Tools. IEEE Trans. Geosci. Remote Sens. 2007, 45, 1559–1570. [Google Scholar] [CrossRef]
- Lopez-Fuentes, L.; Van de Weijer, J.; Bolanos, M.; Skinnemoen, H. Multi-modal deep learning approach for flood detection. In Proceedings of the MediaEval 2017 Workshop, Dublin, Ireland, 13–15 September 2017. [Google Scholar]
- Zha, S.; Luisier, F.; Andrews, W.; Srivastava, N.; Salakhutdinov, R. Exploiting Image-trained CNN Architectures for Uncon-strained Video Classification. In Proceedings of the British Machine Vision Conference 2015, Swansea, UK, 7–10 September 2015; British Machine Vision Association: Swansea, UK, 2015; pp. 60.1–60.13. [Google Scholar]
- Ji, S.; Xu, W.; Yang, M.; Yu, K. 3D Convolutional Neural Networks for Human Action Recognition. IEEE Trans. Pattern Anal. Mach. Intell. 2013, 35, 221–231. [Google Scholar] [CrossRef] [PubMed] [Green Version]
- Simonyan, K.; Zisserman, A. Two-stream convolutional networks for action recognition in videos. In Proceedings of the NIPS’14: Proceedings of the 27th International Conference on Neural Information Processing Systems, Montreal, QC, Canada, 8–13 December 2014. [Google Scholar]
- Ye, H.; Wu, Z.; Zhao, R.-W.; Wang, X.; Jiang, Y.-G.; Xue, X. Evaluating Two-Stream CNN for Video Classification. In Proceedings of the 5th ACM on International Conference on Multimedia Retrieval, Association for Computing Machinery (ACM). Shanghai, China, 23–26 June 2015; pp. 435–442. [Google Scholar]
- Sande, V.C.; Jong, D.S.; Roo, D.A. A segmentation and classification approach of IKONOS-2 imagery for land cover mapping to assist flood risk and flood damage assessment. Int. J. Appl. Earth Observ. Geoinf. 2003, 217–229. [Google Scholar] [CrossRef]
- Baatz, M.; Schäpe, A. Multiresolution Segmentation: An Optimization Approach for High Quality Multiscale Image Segmentation. In Angewandte Geographische Informationsverarbeitung; Wichmann Verlag: Karlsruhe, Germany, 2000; pp. 12–23. [Google Scholar]
- Marmanis, D.; Wegner, J.D.; Galliani, S.; Schindler, K.; Datcu, M.; Stilla, U. Semantic Segmentation of Aerial Images with an Ensemble of CNNs. ISPRS Ann. Photogramm. Remote Sens. Spat. Inf. Sci. 2016, 3, 473–480. [Google Scholar] [CrossRef] [Green Version]
- Sherrah, J. Fully Convolutional Networks for Dense Semantic Labelling of High-Resolution Aerial Imagery. arXiv 2016, arXiv:1606.02585. [Google Scholar]
- Fu, G.; Liu, C.; Zhou, R.; Sun, T.; Zhang, Q. Classification for High Resolution Remote Sensing Imagery Using a Fully Convolutional Network. Remote Sens. 2017, 9, 498. [Google Scholar] [CrossRef] [Green Version]
- Nguyen, T.; Han, J.; Park, D.-C. Satellite image classification using convolutional learning. In Proceedings of the 11th International Conference of Numerical Analysis and Applied Mathematics 2013, Rhodes, Greece, 21–27 September 2011; AIP Publishing: Melville, NY, USA, 2013; pp. 2237–2240. [Google Scholar]
- Castelluccio, M.; Poggi, G.; Sansone, C.; Verdoliva, L. Land use classification in remote sensing images by convolutional neural networks. arXiv 2015, arXiv:1508.00092. [Google Scholar]
- Xue, G.; Liu, S.; Ma, Y. A hybrid deep learning-based fruit classification using attention model and convolution autoencoder. Complex Intell. Syst. 2020, 1–11. [Google Scholar] [CrossRef]
- Jozdani, S.E.; Johnson, B.A.; Chen, D. Comparing Deep Neural Networks, Ensemble Classifiers, and Support Vector Machine Algorithms for Object-Based Urban Land Use/Land Cover Classification. Remote Sens. 2019, 11, 1713. [Google Scholar] [CrossRef] [Green Version]
- Ullah, F.; Sepasgozer, S.; Tahmasebinia, F.; Sepasgozar, S.M.E.; Davis, S. Examining the impact of students’ attendance, sketching, visualization, and tutors experience on students’ performance: A case of building structures course in construction management. Constr. Econ. Build. 2020, 20, 3. [Google Scholar] [CrossRef]
- Ahmad, K.; Pogorelov, K.; Riegler, M.; Ostroukhova, O.; Halvorsen, P.; Conci, N.; Dahyot, R. Automatic detection of passable roads after floods in remote sensed and social media data. Signal Process. Image Commun. 2019, 74, 110–118. [Google Scholar] [CrossRef] [Green Version]
- Shabir, O. A Summary Case Report on the Health Impacts and Response to the Pakistan Floods of 2010. PLoS Curr. 2013, 5, 5. [Google Scholar] [CrossRef]
- Cengil, E.; Cinar, A.; Ozbay, E. Image classification with caffe deep learning framework. In Proceedings of the 2017 International Conference on Computer Science and Engineering (UBMK), Antalya, Turkey, 5–8 October 2017; Institute of Electrical and Electronics Engineers (IEEE): Piscataway, NJ, USA, 2017; pp. 440–444. [Google Scholar]
- Georgakopoulos, S.V.; Tasoulis, S.K.; Vrahatis, A.G.; Plagianakos, V.P. Convolutional Neural Networks for Toxic Comment Classification. In Proceedings of the 10th Hellenic Conference on Artificial Intelligence, Patras, Greece, 9–12 July 2018; ACM: New York, NY, USA, 2018; p. 35. [Google Scholar]
- Ahmad, K.; Pogorelov, K.; Riegler, M.; Conci, N.; Halvorsen, P. Social media and satellites: Disaster event detection, linking and summarization. Multimed. Tools Appl. 2019, 78, 2837–2875. [Google Scholar] [CrossRef]


| Technique Used | Focus of the Study | Advantages of the Techniques | Limitation of the Techniques |
|---|---|---|---|
| Deep Neural Network [41] | Flood Prediction | Higher accuracy than traditional ANN. | Dataset is not recent. It contains records from the year 1992 to 2002. Imbalance in data distribution was not considered. |
| Support Vector Machine (SVM) [42] | Flood Plain Mapping | Overall classification accuracy >90% | Presence of noisy data in the training dataset. |
| Artificial Neural Network (ANN) [40,43] | Flood Prediction | Reduced analytical costs as less time are required for analyzing the data | Relatively old data (1965–2003). Use of only one variable for training; suitable in situations where there is a lack of data. |
| Image Segmentation using Thresholding [44] | Flood Detection and Mapping | Identification of inundated areas can be used as key inputs for flood modeling and analysis. | Reduced accuracy in case of hyper-spatial data. |
| Random Forest and Multilayer Perceptron (MLP) Models [45] | Flood Detection & Flood Depth Modeling | Reduced expense (computation time and resources) of large-scale hydraulic models through the integration of machine learning | - Large number of trees makes the processing of the algorithm too slow. - Not practical for real-time predictions and applications. |
| Components | Specifications |
|---|---|
| Hardware | 2-axes Stabilization, EO/IR Lightweight contraction mechanism with shock absorbers, Azimuth angle of N × 360°, tilt between −130°~+90° and maximum angular rate of ≥60°/s |
| EO | Pixel of 1920 × 1080, optical zoom up to 30 times and digital zoom up to 12 times |
| IR | Pixel of 640 × 480, Vanadium oxide sensor, 8 um–12 um spectrum, and 25 mm lens |
| Recording | H.264 Coding TS. Packages |
Publisher’s Note: MDPI stays neutral with regard to jurisdictional claims in published maps and institutional affiliations. |
© 2021 by the authors. Licensee MDPI, Basel, Switzerland. This article is an open access article distributed under the terms and conditions of the Creative Commons Attribution (CC BY) license (https://creativecommons.org/licenses/by/4.0/).
Share and Cite
Munawar, H.S.; Ullah, F.; Qayyum, S.; Khan, S.I.; Mojtahedi, M. UAVs in Disaster Management: Application of Integrated Aerial Imagery and Convolutional Neural Network for Flood Detection. Sustainability 2021, 13, 7547. https://doi.org/10.3390/su13147547
Munawar HS, Ullah F, Qayyum S, Khan SI, Mojtahedi M. UAVs in Disaster Management: Application of Integrated Aerial Imagery and Convolutional Neural Network for Flood Detection. Sustainability. 2021; 13(14):7547. https://doi.org/10.3390/su13147547
Chicago/Turabian StyleMunawar, Hafiz Suliman, Fahim Ullah, Siddra Qayyum, Sara Imran Khan, and Mohammad Mojtahedi. 2021. "UAVs in Disaster Management: Application of Integrated Aerial Imagery and Convolutional Neural Network for Flood Detection" Sustainability 13, no. 14: 7547. https://doi.org/10.3390/su13147547