
Analyzing Prospective Owners’ Choice Decision towards Plug-in Hybrid Electric Vehicles in Urban India: A Stated Preference Discrete Choice Experiment


Civil Engineering Department, Indian Institute of Technology Kharagpur, Kharagpur 721302, India
*
Author to whom correspondence should be addressed.
Sustainability 2021, 13(14), 7725; https://doi.org/10.3390/su13147725
Submission received: 21 May 2021
/
Revised: 7 July 2021
/
Accepted: 7 July 2021
/
Published: 10 July 2021
(This article belongs to the Section Sustainable Transportation)
Abstract
:Plug-in Hybrid Electric Vehicles (PHEVs) can help decarbonize road transport in urban India. To accelerate the diffusion of PHEVs, investigation of commuter preferences towards the attributes of PHEVs is necessary. Therefore, the present study analyzes prospective owners’ choice decisions towards PHEVs in a typical Indian context. A stated preference survey was designed to collect responses from the current owners of conventional vehicles (CVs) in Delhi, India, and Mixed Logit (ML) models were developed to estimate commuters’ Willingness To Pay (WTP) for a set of key PHEV-specific attributes. The decomposition effect of prospective owners’ sociodemographic characteristics and trip characteristics on the mean estimates of random parameters was investigated by developing ML models with heterogeneity. Subsequently, the influence of improvement of each PHEV-specific attribute on prospective owners’ choice probability was investigated by calculating marginal effects. Among the various PHEV-specific attributes considered in the present study, high WTPs are observed for decrease in battery recharging time, reduction in tailpipe emission and increase in electric range. Therefore, an added emphasis on these attributes by vehicle manufacturers is likely to enhance the attractiveness of PHEVs to Indian commuters. The results also highlight the importance of government subsidy for promoting PHEVs in the Indian market. Prospective owners’ income, availability of home-based parking space, and average daily trip length are found to significantly influence the choice decision of Indian commuters towards PHEVs.
1. Introduction
Climate change has emerged as one of the planet’s top issues [1]. It is well-proven in the scientific literature that anthropogenic activities have been the primary source of global warming and the subsequent climate change leading to an increase in Earth’s average temperature [2]. Global warming occurs due to increase in greenhouse gas (GHG) emissions, primarily due to the release of carbon dioxide (CO2) [3]. Due to higher dependency on fossil fuels, the transportation sector is one of the major sources of CO2 emissions [4]. The transportation sector is solely responsible for 23% of global CO2 emissions, where road transport is the primary contributor [5]. Therefore, emissions from road transport pose a significant threat to air quality and human health, especially in urban areas, where major mobility activities take place [6]. In the past trends, the developed countries were the major emitters of CO2 [7]. However, more recently, the share of emissions from developing countries such as India has surpassed those of developed countries, which is evident from the list of top ten emitters, where India ranks third [8].
Rapid urbanization, growing working population, higher purchasing power, and easy availability of car finance options at a reasonable rate of interest are contributing significantly towards the growing share of passenger car ownership, with the demand largely concentrated in urban areas [9,10]. In India, per capita car ownership per 1000 person is expected to grow from 22 in 2018 [11] to 170 by 2040 [8], indicating the subsequent impact of vehicular emissions on the environment. At the same time, India has now replaced Japan as the world’s third largest oil importer after United States (US) and China [12]. India’s dependence on foreign oil exceeded 80% in 2016 [13] and is further expected to increase with the rapidly growing passenger car market. Hence, the increasing dependence on foreign oil can pose significant oil security implications in the country [14]. To address these issues, promotion of cleaner and low-carbon emitting vehicles as an alternative to conventional four-wheelers is necessary for a sustainable urban transportation system [15].
Electric vehicles have received significant global attention due to their strong potential to meet environmental and energy-security objectives [16,17]. The widespread diffusion of electric vehicles could contribute to the sustainability of transportation by reducing dependence on fossil fuels in transport, with the associated benefits of reduction in air pollution and GHG emissions from the transportation sector [18]. For a typical Indian context, the present investigation is carried out with reference to Plug-in Hybrid Electric Vehicles (PHEVs). A plug-in hybrid electric vehicle (PHEV) is a hybrid electric vehicle that operates on a battery capable of powering the vehicle for short distances [19]. This battery can be recharged externally by plugging a charging cable into an external electric power source [20]. From consumers’ perspective, PHEVs not only offer higher fuel economy in the all-electric range but also provide the flexibility of switching to conventional fuels for long-distance travel [21]. PHEVs also produce lower levels of emissions, depending on how often the vehicle is operated in the all-electric mode [22]. If the distance traveled before recharging is always less than the all-electric range, the car never needs to be refueled with conventional fuel, thus producing zero-emission [23]. However, emission reduction largely depends on the mix of sources used to generate electricity [24]. Furthermore, PHEVs use grid electricity to displace nearly 40% to 60% of petroleum consumption, thereby contributing to a significant reduction in oil use [25]. Hence, looking into the benefits to the consumers and environment, PHEVs could be a potential alternative to conventional vehicles (CVs) to decarbonize road transport in urban India.
The Government of India has also recognized the need of promoting electric mobility and formulated a scheme called Faster Adoption and Manufacturing of (Hybrid &) Electric Vehicles in India (FAME India) in 2015 [26]. Under the scheme, about 0.28 million electric vehicles were supported with a total purchase subsidy of approximately USD 48 million. Despite the purchase subsidies, India reached a total share of less than 1% electric four-wheelers in use by 2018 [27]. This necessitates the need to relook at the subsidy policy in India. Moreover, electric vehicle is a new technology to Indian consumers [28], and therefore it is important to evaluate consumer acceptability of this new vehicle technology [29]. Several studies have been conducted in the past to investigate consumer acceptability in various contexts of introducing new technology [30,31,32,33]. However, no prior investigation has been carried out to understand consumer preferences towards PHEVs in the context of an emerging country such as India. Therefore, it is essential to identify the priority attributes, which need necessary improvements by the vehicle manufacturer to enhance commuter benefit towards PHEVs. It is equally important to identify the priority attributes related to PHEVs which need due attention from the government to increase their attractiveness among Indian consumers. The user benefit is influenced by sociodemographic characteristics such as gender, age, education, income, car ownership, etc., and trip characteristics such as trip frequency, trip length, trip purpose, etc. [34]. Therefore, it is also important to identify the sociodemographic and trip characteristics that influence commuters’ perceived benefit to PHEV attributes.
In transport-related studies, user benefit is perceived as a reduction in disutility of travel and is estimated in terms of Willingness To Pay (WTP) for improvement in each non-monetary attribute describing an alternative [34]. The travel behavior models developed by analyzing stated preference (SP) data are extensively used for valuation of the attributes and estimation of WTP values, especially in cases where the alternatives/technologies do not currently exist [5,31,35,36]. The WTP estimates associated with different attributes act as a guideline for researchers and policymakers to select specific improvement strategies [34]. With this background, the present study conducted a detailed travel behavior analysis to investigate improvement strategies for PHEVs by considering prospective owners’ perceived benefit associated with a set of key PHEV-specific attributes in a typical Indian context.
2. Literature Review and Scope of the Research
In this section, a brief review of the existing literature specific to consumers’ willingness to pay for the attributes of electric vehicles is presented. Since the use of electric vehicles is still in its nascent stage, revealed preference data from the actual purchase of electric vehicles is sufficiently low. Hence, the majority of the past studies were based on stated preference (SP) methods, considering the household or the individual as the unit of analysis [34,37]. Table 1 presents an overview of past SP studies on electric vehicles.
Findings from past studies show that consumers’ buying decisions for electric vehicles are substantially influenced by vehicle attributes such as purchase price [38,39], fuel cost [40,41], driving range [42,43], recharging time [40,44], acceleration time [39,45], battery warranty [46,47], and tailpipe emission [38,48,49]. In addition to the vehicle attributes, service attributes such as availability of home-based charging facility [40,50], availability of public charging stations [42,51,52], and service speed of public charging stations [50,51] are also found to strongly influence consumers’ choice decisions to purchase electric vehicles.
There are several sociodemographic, individual and trip characteristics that associate positively with the adoption of electric vehicles. By conducting a German-wide stated preference survey, Hackbarth and Madlener [42] found that consumers who are young, educated, and have access to a parking lot equipped with a socket could be the early adopters of alternative fuel vehicles. Potoglou and Kanaroglou [39] found that high-income consumers have a higher probability of purchasing clean-fuel vehicles as compared to low-income consumers. Hoen and Koetse [44] in their investigation on alternative fuel vehicle preferences of Dutch private car owners reveal that consumers with low annual mileages or those who commence frequent urban trips are more likely to purchase electric vehicles. Attitude towards the environment also strongly influence consumers’ willingness to purchase electric vehicles. Ewing and Sarigollou [38] and Jung et al. [56] found that consumers who are actively concerned about the environment are more willing to purchase clean-fuel vehicles than those who are unconcerned. The symbolic-affective value is also an important attribute influencing the choice of environmentally friendly vehicles. Helveston et al. [45] found that US consumers who rate their vehicle as an important status symbol show positive preference towards PHEVs and Battery Electric Vehicles (BEVs). Electric vehicle knowledge and experience are other attributes that associate positively with the adoption of electric vehicles. Giansoldati et al. [54] found that consumers in Italy with high level of electric vehicle knowledge and experience place less relevance to fast charging station density and have a stronger preference towards electric vehicles as compared to CVs.
Past studies have also emphasized the importance of government policy attributes such as purchase tax relieves or subsidies that minimize the purchase price of electric vehicles to positively influence consumers to purchase electric vehicles [39,46,53,55]. Other influential policy measures include free parking, access to bus lanes, highway high-occupancy vehicle (HOV) lane access, free public charging stations, free licensing policy, personal carbon trading scheme, tradable driving credit scheme, and energy bill discount [46,50,51,55].
The existing literature reports the application of several econometric models such as Multinomial Logit (MNL) model [38,45,53], Nested Multinomial Logit (NMNL) model [39], Latent Class (LC) model [40,47,49], Hierarchical Bayes (HB) method [41], Mixed Logit (ML) model [42,43,52], Multinomial Probit (MNP) model [46], and Hybrid Choice (HC) Model [54,56] to estimate consumers’ willingness to pay (WTP) for electric vehicles and their attributes. The review suggests that MNL and ML models are the two most extensively used models for valuation of electric vehicle attributes. However, the MNL model exhibits the property of Independence of Irrelevant Alternative (IIA), which is too restrictive to allow general substitution pattern [57]. Hence, the ML model, which relaxes the Independently Identically Distributed (IID) assumptions of error terms by allowing unrestricted substitution patterns, and random taste variation across individuals [58] are preferred over MNL models by studies investigating consumer heterogeneity towards electric vehicle adoption.
The review of literature also indicates that the past studies on electric vehicles have been majorly conducted in developed countries such as Canada [38,39], US [40,45,52], Belgium [41], Germany [42], Japan [43], The Netherlands [44], Spain [49], Italy [53,54], Australia [55], South Korea [56] and countries where electric vehicles are already a popular mode of transport such as China [48,50,51]. Due to significant difference in transport and urban characteristics, factors influencing consumer buying behavior towards electric vehicles is likely to vary across different countries and geographical regions [44,59]. Therefore, the stated choice results from different countries may not be directly transferable, and country-specific experiments are necessary. In the Indian context, the findings related to the attributes influencing consumers’ choice decision towards electric vehicles in general and PHEVs in particular are limited. Such findings are important to guide the vehicle manufacturers to bring PHEVs with vehicle attributes that commensurate with prospective owners’ perceived benefit or WTP for such attributes. Furthermore, such findings also provide a basis for the government to formulate policy interventions in terms of subsidy, public charging infrastructure, etc., to make PHEVs a more appealing alternative to Indian commuters.
To fill the research gap, this study aims to analyze prospective owners’ choice decisions towards PHEVs and related attributes in a typical Indian context. A stated preference survey was designed to collect responses from the current owners of CVs (prospective owners of PHEVs) and mixed logit (ML) models were developed to estimate commuters’ perceived benefit associated with a set of key PHEV-specific attributes in terms of willingness to pay estimates. Then, the effect of sociodemographic characteristics and trip characteristics on the mean estimates of random parameter was examined with respect to (1) monthly family income, (2) availability of home-based parking space for charging outlet, and (3) average trip length for a typical commuting trip, and the WTP values were derived by developing ML models considering heterogeneity. Finally, the influence of improvement of each PHEV-specific attribute on prospective owners’ choice probability was investigated by calculating marginal effects. The present investigation was carried out with reference to the capital city of Delhi, India.
3. Experiment Design and Data
The design of experiment includes selection of attributes and their levels, generation of alternatives and choice sets, survey design, and data collection and database development.
3.1. Type of Data and Preference Elicitation Techniques
Typically, there are two types of data paradigms widely used in choice literature: Revealed Preference (RP) data and Stated Preference (SP) data [34,37,60]. RP data represent choices that are made in real market situations and are used for developing demand models [60]. Conversely, SP data represent choices that are made in hypothetical choice settings and are considered advantageous for valuation of attributes [37]. As the focus of the present study is the valuation of the attributes of plug-in hybrid electric vehicles (a mode that has not largely penetrated the market yet), SP data are preferred over RP data for developing behavior models.
The preference elicitation techniques available for SP-based survey may be classified into three categories, namely conjoint rating, ranking, and choice (discrete choice experiment) [37]. Conjoint rating and ranking involve complex choice tasks, whereas in Discrete Choice Experiment (DCE) respondents are asked to choose one alternative from a group of two or more alternatives. Thus, the biggest advantage of DCE is the low cognitive complexity. Moreover, rating and ranking techniques lack a strong theoretical foundation based on economic theory, while DCE provides a framework for estimating the relative marginal disutility of variations in attributes and their potential correlations [60]. Therefore, DCE was used as a preference elicitation technique in the present study.
3.2. Selection of Attributes and Attribute Levels
While designing a SP choice experiment, the number and the level of attributes need to be fixed. Too many attributes may cause cognitive burden on respondents, whereas very few attributes may not describe the alternative adequately [34]. Furthermore, the levels of each attribute must be plausible and actionable to the respondents and constructed in a way that the respondents can make trade-offs between combination of attributes and their levels. Considering these aspects, based on the review of past studies and discussion with subject experts, this study designed SP choice experiment with seven key attributes of PHEVs, namely purchase price [38,39], fuel cost reduction [40,41], electric range [46,47,53], public charging station [42,51], battery recharging time [40,44], battery warranty [46,47] and tailpipe emission [38,48], fixing three levels for each of the seven attributes for discrete choice analysis. The description of the attributes and attribute levels are presented in Table 2. For each attribute, the attribute levels are presented from the base level to improved level. It is important to mention that the driving range of PHEVs consists of both gasoline range and electric range. As consumers are already familiar with the gasoline range of a vehicle, to reduce cognitive complexity, this study considered electric range as the key determinant to indicate the effect of driving range on commuters’ choice of PHEV alternative.
3.3. Generation of Alternatives and Choice Sets
The hypothetical alternatives were designed by using the attributes and their levels selected for the study, and the choice sets were formed by grouping the alternatives. Several “design of experiment (DOE)” techniques are available to generate alternatives and choice sets. In a full factorial design, all the possible combinations of attribute levels are enumerated [37], which is practically impossible to manage in the present study with seven attributes, each with three levels, whereas, in fractional factorial design, the size of the design is considerably reduced, where each respondent is presented with only a subset of full factorial design. The two well-known fractional factorial designs are orthogonal design and efficient design, which select subsets in a way that the attribute level balance is satisfied [34]. The orthogonal design aims to minimize the correlation between the attribute levels in the choice situations. However, orthogonal designs have the limitations of the inability to avoid choice situations in which a certain alternative is clearly more preferred over the others (hence loss of statistical information) [61]. On the contrary, an efficient design not only attempts to minimize the correlation in the data for estimation purposes but also tries to produce the data that generate parameter estimates with the lowest possible standard errors [62]. These standard errors can be predicted by determining the Asymptotic Variance-Covariance (AVC) matrix (the roots of the diagonal of this matrix are the asymptotic standard errors). D-error is the most commonly used efficiency measure, and D-optimality is the commonly used efficiency criteria that seek to maximize the determinant of the asymptotic variance-covariance (AVC) matrix or, in other words, minimize the determinant of the dispersion matrix (D-error). The design with the lowest D-error is called D-optimal design [63,64]. When no prior information is available (not even the sign of the parameters), Dz-error is measured for D-optimal design [64]. Hence, D-optimal design (with Dz error) was used to generate the choice sets in the present study. In the present study, JMP 14 (Statistical Software) [65] was used to design the optimal number of choice sets. An unlabeled D-optimal design generated 30 choice situations which were blocked into five groups with three choice sets in each group. Hence, one questionnaire version contained three choice sets to make the questionnaire non-lengthy for the respondents. In each choice set, generic titles (choice between Alternative 1 and Alternative 2) were used for each alternative and the respondents were asked to make a choice between the two alternatives. Unlabeled experiments are more effective than labeled experiments when the focus is on the valuation of attributes and estimation of willingness to pay values rather than prediction and forecasting [34]. Hence, in this study, an unlabeled discrete choice experiment was designed for WTP estimation. A sample choice set is shown in Table 3.
3.4. Survey Design
The questionnaire survey was divided into four sections. Section 1 collected information on respondents’ planned car ownership and driving habits, such as daily and annual fuel mileage for work trips, trip length for journey to work, trip frequency, etc. Section 2 familiarized respondents with the relevant attributes of PHEVs through attribute description. Section 3 was the core of the questionnaire, which collected stated choice responses from respondents with respect to hypothetical alternatives of PHEVs with varying attribute levels. Section 4 collected information on respondents’ sociodemographic characteristics such as gender, age, education, occupation, monthly family income, and specifics of their place of dwelling such as whether there was availability of home-based parking space for charging outlets. Before fielding the main survey, several rounds of pilot surveys were carried out to (1) identify respondents’ understanding level of the questionnaire, (2) check the adequacy of information provided in the questionnaire, (3) finalize the number of choice sets to be included in each questionnaire considering respondents’ fatigue, (4) calculate the average time taken by the respondents to fill the questionnaire survey, (5) provide training to enumerators, and (6) identify locations to intercept commuters. After incorporating several improvements in response to respondents’ comments and observations from pilot surveys, the questionnaire was ready to be used for the main survey.
3.5. Data Collection and Organization of Data
Using the designed survey instrument, a computer-assisted personal interview [66] was carried out in Delhi during March–April 2019. The survey took place in residential complexes, shopping malls, offices, schools, universities, and colleges. The target population for this study was the current owners of CVs, aged 18 years or older, possessing a valid driving license. The respondents were intercepted following simple random sampling and asked about their plans to purchase a new car and if they consider PHEV as a potential alternative to their CV. Subsequently, respondents who intended to purchase a new vehicle within the next five years and considered PHEV as a potential alternative were interviewed. A total of 1500 respondents were intercepted, and only 550 of them (36.67%) satisfied the above-mentioned criteria and finally participated in the survey. A trained enumerator was assigned to each respondent, who guided him/her through the survey questions. All the data collected were automatically stored in the digital database. To acknowledge participation, each respondent was gifted a pen after the successful completion of the survey. During initial data processing and refinement, the individual survey was removed if responses to some of the questions were incomplete and if respondents took less than 10 min to complete the survey. According to the pilot survey, the respondents required at least 10 min to complete the questionnaire carefully. Hence, only questionnaires completed in 10 min or more were retained. In the end, 415 fully filled questionnaires were available to prepare the final database for model development.
As already mentioned, the target population of the study were the current owners of CVs in Delhi. The study considered investigating the sample representativeness of their intended population in terms of sociodemographic variables. However, this was not feasible because the sociodemographic information regarding the owners of CVs was not available in the Indian census manual 2011 [67] or any other secondary sources. Instead, sociodemographic information of the entire population of Delhi (urban) [67] was used as a reference to compare with the sample data. The descriptive statistics of the sociodemographic variable for the sample and population are presented in Table 4. The sample under-represents female and over-represents educated individuals when compared to the population statistics of Delhi (urban) provided in the census manual. The observed differences in the population and the sample statistics may be attributed to two reasons. First, the population statistics represent all the urban residents of Delhi, but the sample data include only the current owners of CVs. Second, during data collection, a significant number of non-responsive samples were female, who were relatively less interested in being interviewed by enumerators. As a result, the sample observations are relatively skewed with male respondents. The sample, however, almost perfectly reflects the age distribution of population statistics. Due to the absence of information in the Indian Census manual, the other sociodemographic characteristics such as occupation and income distribution could not be compared. However, the sample data collected (415) satisfy the criteria of the minimum sample size (384) required to adequately represent an infinite population. Assuming 95 percent confidence level, the minimum sample size requirement for the present study was estimated as 384 [68]. Accordingly, a database of 1245 refined observations (resulting from the choice of 415 respondents) was used to develop Mixed Logit (ML) models, and estimate willingness to pay (WTP) values.
While organizing the data for model formulation, all the seven quantitative attributes, namely purchase price, fuel cost reduction, electric range, public charging station, battery recharging time, battery warranty, and tailpipe emission were entered on a continuous scale.
4. Model Specification
This section describes the econometric model used to analyze respondents’ stated choice responses for PHEVs. The multinomial logit (MNL) model, which assumes the error terms to be Independently Identically Distributed (IID), has been extensively used by researchers to analyze discrete choice data in past studies [38,69]. However, the property of Independence of Irrelevant Alternative (IIA) derived from the assumption of IID is too restrictive to allow flexible substitution patterns [57]. Also, the model assumes taste homogeneity, i.e., the coefficient of an attribute is the same for all individuals, whereas, in reality, there may be substantial variability in preference of attributes across individuals. As the present study aims to investigate preference heterogeneity of the commuters towards various attributes of PHEVs with respect to sociodemographic characteristics and trip characteristics, the best suited model for this study is the mixed logit (ML) model. The ML model is a highly flexible model that holds the capability to approximate any random utility model [58]. It overcomes the limitations of the MNL model by allowing more general substitution pattern, random taste variation across individuals, and correlation in unobserved factors [60]. The ML probabilities are the integrals of standard logit probabilities over a density of parameters. The choice probability can be expressed in the form of Equation (1):
where is a density function and is the observed portion of the utility, which depends on the parameters β. The mixed logit probability is a weighted average of the logit formula evaluated at different values of , with the weights given by the density . The preference heterogeneity of individuals can be introduced in the ML model through interaction between attributes of the alternatives and individuals’ sociodemographic or trip characteristics [60]. If a decisionmaker n faces a choice among J alternatives, the utility of person n from alternative j is expressed in the ML model as Equation (2), where are observed variables that relate to the alternative and decisionmaker and is the individual-specific parameter vector that varies across individuals both randomly and systematically with observed variables . Thus, when random parameters are assumed to be uncorrelated, the utility function of alternative j for individual n could be expressed as Equation (3):
In case of the kth factor, the random coefficient could be expressed as:
where is the random coefficient for the kth attribute face by individual n. The term accommodates heterogeneity in the mean of the distribution of random parameter. The random vector denotes the random parameter with stochastic properties. For convenience in isolating the model components, is defined as a primitive vector of uncorrelated random variables with known variances. The actual scale factors which provide the unknown standard deviations of the random parameters are then arrayed on the diagonal of the diagonal matrix Σ1/2 [34]. Table 5 presents the description of variables and model parameters of ML model.
In the ML model, the probability of a choice cannot be evaluated analytically because the integral does not take a closed form (unlike MNL model). Hence, the choice probabilities are approximated numerically through simulation using Simulated Maximum Likelihood (SML) estimator [60]. The distributional assumption of the random parameters and number of draws used in the simulation significantly influences model estimation in ML model [34,60]. Bhat [70] showed that non-random and more uniformly distributed sequences, known as “Halton” sequences, reduce the number of draws that are needed for estimation of ML models, thereby reducing the computational time and/or the simulation error associated with a given number of draws as compared to pseudo-random sequences that use random draws. Bhat [71] found that even 125 Halton draws produce less simulation error as compared to 2000 random draws. In this study, a simulated maximum likelihood estimator with 100 Halton draws was used to estimate the model parameters.
The most commonly used distributions for the random parameters in the ML model are normal, triangular, uniform, and lognormal [34]. The normal, triangular, and uniform distribution may give “wrong” sign for some parameters depending on the standard deviation, whereas the use of lognormal distribution may be disadvantageous due to its long upper tail. However, the use of constrained distribution, where standard deviation equals mean, has several advantages over the other distributions. Say, a constrained triangular distribution assures that the sign of the mean is constant throughout the sample. Unlike normal or lognormal distribution, constrained triangular distribution is bounded in nature, which results in early convergence due to less computational time. Most importantly, the estimation of WTP value is simple as the impact of spread is negligible due to constraint. Therefore, the ratio of mean coefficient of any attribute over mean coefficient of cost directly gives WTP unlike with normal or lognormal distributions where standard deviation has a significant effect on WTP [60]. Hence, in this study, the random parameters were assumed to follow a constrained triangular distribution for model estimation.
The overall goodness of fit of a model is determined based on adjusted rho-square (ρ2) [72]. It is one of the most commonly used measure of goodness of fit and is defined as follows:
where LL(1) is the value of the log-likelihood function of the estimated parameters, LL(0) is its value when all the parameters are set equal to zero and K is the number of parameters.
5. Model Results and Discussion
The final database of the discrete choice responses was analyzed by developing mixed logit (ML) model using LIMDEP 10 [73] statistical package. In ML models, all the attributes except “purchase price” were considered random and assumed to follow constrained triangular distribution. Fixing the cost parameter simplifies the estimation of marginal WTP for other attributes, which is obtained by calculating the marginal rate of substitution between the specific attribute of interest, with purchase price typically being in the trade-off, i.e., simply the ratio of the coefficient of a specific attribute and the coefficient of purchase price parameter. Also, the distribution of marginal WTP for an attribute becomes the distribution of attribute’s coefficient [60]. For ML model estimation, 100 Halton draws were used for simulation [70].
The result of the ML model (complete dataset without considering heterogeneity), with coefficient estimates for the attributes and derived WTP values, are reported in Table 6. It may be observed from Table 6 that all the coefficient estimates of ML model are highly statistically significant (i.e., statistical significance at 99% confidence level) and all have expected signs. The adjusted ρ2 value for the model (adjusted ρ2 = 0.2141) indicates that the model is a good fit [34].
As expected, the main vehicle expense factor, i.e., the purchase price, has a negative and highly significant impact on respondents’ stated choices, indicating that the respondents’ disutility strongly increases with the increase in the magnitude of this attribute. Fuel cost reduction enters the model positively, indicating that the disutility to the respondents decreases with an increase in magnitude of fuel saving. Respondents also show positive utility for improvement in electric range, as frequent recharging of the battery is considered time consuming and inconvenient. The public charging station also influences the choice decisions positively, as higher density of charging stations on route reduces the risk of being stranded with an exhausted battery before journey completion. Battery recharging time has a negative and highly significant impact on vehicle choice, where prolongation of charging time increases respondents’ disutility substantially. The influence of battery warranty is highly significant and positively signed, which indicates that the increase in battery warranty strongly decreases the disutility of respondents. Tailpipe emission shows a negative and highly significant impact on PHEV choice, indicating that increase in vehicular emission is strongly disfavored by respondents.
The marginal WTP values from the ML model were obtained by simply dividing the coefficient estimate of the attribute under consideration by the coefficient estimate of purchase price. Table 6 summarizes WTP values of the prospective owners for the key PHEV-specific attributes.
Fuel cost reduction measures commuters’ perceived benefit associated with savings in fuel cost and is estimated in terms of Indian Rupees (INR) per 1% fuel cost reduction. Commuters are willing to pay INR 4216 (USD 59.03) per 1% fuel cost reduction. The finding is in line with Tanaka et al. [43], who reported a WTP value of USD 50 for 1% fuel cost saving. Considering the price of petrol to be INR 73/liter in Delhi at the time of data collection (during March–April 2019), the results indicate that average commuters in Delhi, with annual vehicle kilometer travel of 12,000 km and annual fuel mileage of 14 km per liter of petrol, are willing to accept a payback period of 7 years for an investment in fuel cost saving. The outcome is reasonable because commuters in Indian megacities, on average, possess a vehicle for 5–7 years [74]. The electric range captures commuters’ perception towards improvement in driving range of the battery in PHEVs and is estimated in terms of INR per 1 km increase in electric range. Commuters are willing to pay INR 3351 (USD 46.92) per 1 km increase in electric range, a value comparatively higher than USD 31 found by Ferguson et al. [47], suggesting that the choice of PHEV among prospective owners’ is strongly influenced by its electric range. Public charging station measures commuters’ perceived benefit associated with increase in the density of public charging facility and is estimated in terms of INR per 1% increase in public charging station. The commuters are willing to pay INR 1568 (USD 21.95) per 1% increase in public charging stations. The WTP values obtained for this attribute is substantially lower than WTP values of EUR 45–92 and USD 34–50 reported by Hackbarth and Madlener [42] and Tanaka et al. [43], respectively, indicating that the choice decision of prospective owners’ is not strongly influenced by the density of public charging facility. Battery recharging time captures commuters’ perceived benefit associated with decrease in charging duration and is estimated in terms of INR per 1 h decrease in battery recharging time. The commuters are willing to pay INR 48,541 (USD 679.66) per 1 h reduction in battery recharging time and is identified as an attribute with substantially higher WTP among commuters. The substantially higher WTP estimates indicate that battery recharging time is one of the priority attributes influencing prospective owners’ choice decision towards PHEVs. The results are in line with the study done by Hackbarth and Madlener [42], where consumers are willing to pay in the range of EUR 4.84–9.78 for battery recharging time reduction of 1 min. Battery warranty measures commuters’ perception towards improvement in warranty coverage and is estimated in terms of INR per 1-year increase in battery warranty. Prospective owners are willing to pay INR 31,189 (USD 436.7) per 1-year increase in battery warranty. The finding is in line with Higgins et al. [46], where consumers are willing to pay CAD 710 for additional warranty coverage. Tailpipe emission captures commuters’ perceived benefit associate with reduction in vehicular emission and is estimated in terms of INR per 1% emission reduction. Prospective owners are willing to pay INR 5216 (USD 73.03) per 1% emission reduction. The WTP estimates obtained are relatively higher than the values reported by past studies, where Potoglou and Kanaroglou [39] report Canadian consumers’ WTP values in the range of CAD 1523–3614 for a vehicle with pollution level at 10% of a present-day average car, while Tanaka et al. [43] reported US consumers’ WTP values of USD 29 for 1% emission reduction. The WTP estimates indicate that emission reduction potential of PHEVs strongly influences prospective owners’ choice decision towards PHEVs.
In addition to the development of ML models for complete dataset without considering heterogeneity, the effect of sociodemographic characteristics and trip characteristics on the mean estimates of random parameters were investigated by developing ML models with heterogeneity. The heterogeneity around the mean of random parameter was investigated with respect to sociodemographic characteristics such as monthly family income, availability of home-based parking spaces for charging outlets, and trip characteristics such as average trip length for a typical commuting trip. Furthermore, log-likelihood ratio test (LRT) [34,60] was conducted between estimated models (i.e., the ML models with heterogeneity) and the base comparison model (i.e., the ML model without considering heterogeneity). The null hypothesis for the test was stated as “The estimated model is no better than the base model”. The test statistics used to compare two sets of models: 2*(LL Model 2-LL Model 1) follow Chi-square distribution with degrees of freedom equal to the difference in the number of parameters estimated for the two models. In the present study, the null hypothesis is tested against critical χ2 value at 99% confidence level for “N” (extra parameters estimated for Model 2) degrees of freedom. Table 7 presents the results of log-likelihood ratio test for ML models. Based on LRT results, the null hypothesis is rejected for all the three comparisons between estimated model (ML2-monthly family income heterogeneity, ML3-home-based parking space heterogeneity, ML4-average daily trip length heterogeneity) and the related base model (ML1-without considering heterogeneity), indicating that the parameter richer models, i.e., ML models considering heterogeneity statistically represents the data better than the restricted model, i.e., ML model without considering heterogeneity. The results of the ML model considering heterogeneity with respect to the three variables are discussed separately in the following subsection.
5.1. Monthly Family Income Heterogeneity
Monthly family income is an indicator of respondents’ economic status and it plays a vital role in consumer choice and preferences [34,37]. To investigate the effect of monthly family income on mean estimates of attributes related to PHEVs, the complete dataset was divided into two groups, namely “low income” and “high income”. “Low income” includes respondents with monthly family income less than INR 1,50,000 (USD 2100/month), whereas “high income” includes respondents with monthly family income INR 1,50,000 or more (USD 2100/month). The monthly family income attribute was included in the ML2 model as a separate dummy variable, where “0” represents “low income” and “1” represents “high income”. Coefficient estimates of ML2 model and derived WTP values for the two income groups are presented in Table 8.
It may be seen from Table 8 that all the coefficient estimates of the ML2 model are statistically significant. Also, the adjusted ρ2 value (0.2319) indicates good statistical fit. With respect to monthly family income, a statistically significant decomposition effect is observed on the mean estimates of electric range, public charging station, battery recharging time, and battery warranty. It may be observed from Table 8 that the “high income” group has approximately 2.5 times higher WTP for electric range (INR 5625 per km increase) as compared to the “low income” group (INR 2175 per km increase). For public charging station, the “high income” group is willing to pay two times higher (INR 2375 per 1% increase) as compared to the “low income” group (INR 1125 per 1% increase). The willingness to pay for battery recharging time is about 1.76 times higher (INR 66,150 per 1 h decrease) among the “high income” group as compared to the “low income” group (INR 37,625 per 1 h decrease). Lastly, for battery warranty, the “high income” group is WTP six times higher (INR 79,200 per 1 yr. increase) as compared to the “low income” group (INR 13,350 per 1 yr. increase). However, monthly family income is not found to statistically significantly influence the parameter estimates of fuel cost reduction and tailpipe emission. As a result, the WTP values for improvement in fuel cost reduction and tailpipe emission are found to be similar across high-income and low-income commuters.
Hence, the results indicate that individuals with monthly family income INR 150,000 or more (USD 2100/month) (high-income group) are willing to pay substantially higher for beneficial changes in most of the attributes of PHEV as compared to the individuals with monthly family income less than INR 150,000 (USD 2100/month) (low-income group). The findings are in the same direction as that of Potoglou and Kanaroglou [39], Higgins et al. [46] and Rahmani and Loureiro [49], where high-income individuals, who are less sensitive to purchase price, show higher WTP for improvement in the attributes related to clean-fuel vehicles as compared to low-income individuals. Hence, it could be inferred that improvements in electric range, public charging station, battery recharging time, and battery warranty are likely to enhance the attractiveness of prospective owners with higher monthly family income towards PHEVs in the Indian context.
5.2. Home-based Parking Space Heterogeneity
In order to investigate preference heterogeneity with respect to the availability of home-based parking space for charging outlet, the complete dataset was divided into two groups, namely “HP1” and “HP2”. “HP1” represents individuals who do not possess home-based parking spaces for charging outlets, whereas “HP2” represents individuals who possess home-based parking space for charging outlets. The home-based parking space attribute was included in the ML3 model as a dummy variable, where “0” represents “HP1” and “1” represents “HP2”. Coefficient estimates of ML3 model and derived willingness to pay values for “HP1” and “HP2” are summarized in Table 9. It may be observed from Table 9 that all the coefficient estimates of the ML3 model are statistically significant. Also, the adjusted ρ2 value (0.2201) indicates good statistical fit. In ML3 model, preference heterogeneity with respect to the availability of home-based parking space for charging outlets is observed on mean estimates of public charging station and battery recharging time.
The WTP values presented in Table 9 shows that “HP1” commuters (individuals who do not possess home-based parking spaces for charging outlets) have 3.4 times and 1.88 times higher WTP for 1% increase in public charging station and 1 h reduction in battery recharging time, respectively, as compared to “HP2” commuters (individuals who possess home-based parking spaces for charging outlets), whereas, for all the other attributes, WTP values are statistically indifferent across the two groups. Commuters with absence of home-based parking spaces would have to completely rely on public charging stations to charge their vehicle. Also, as the availability of public charging station is very limited in India [75], the perceived inconvenience associated with waiting in a queue for a long duration to charge the vehicle is expected to be higher among commuters with absence of home-based charging facilities. Hence, commuters with absence of home-based parking space for charging outlets show higher WTP for public charging station and battery recharging time as compared to those who possess home-based parking space for charging outlets. As more than 50% of the commuters do not possess home-based parking spaces for charging outlets (shown in Table 4), providing higher density of public charging stations with fast charging facilities is very crucial to motivate a large group of prospective owners’ towards PHEVs in Delhi, India.
5.3. Average Daily Trip Length Heterogeneity
To investigate preference heterogeneity with respect to trip length, the complete dataset was split into two groups, namely “TL1” and “TL2”. “TL1” represents individuals with an average daily trip length less than 35 km, whereas “TL2” represents individuals with an average daily trip length of 35 km or more. The variable trip length was included in ML4 model as a separate dummy variable, where “0” represents “TL1” and “1” represents “TL2”. Coefficient estimates of ML4 model and derived WTP values for “TL1” and “TL2” are presented in Table 10.
It may be seen from Table 10 that all the coefficient estimates of ML4 model are statistically significant, and the adjusted ρ2 value (0.2189) indicates a good model fit. With respect to average daily trip length, a statistically significant decomposition effect is observed on the mean estimates of fuel cost reduction and electric range. It may be observed from Table 10 that “TL1” commuters have 1.76 times higher WTP for fuel cost reduction (INR 7417 per 1% decrease) as compared to “TL2” commuters (INR 4222 per 1% decrease). As PHEVs use electricity to propel for short distances and gasoline for longer distances, the fuel cost advantages of using such vehicles would be large for those who predominately commute short trips [22]. Therefore, the relatively higher WTP for fuel cost reduction by the commuters with trip length less than 35 km (“TL1” commuters) could be attributed to higher fuel savings that could be attained by majorly driving a PHEV within its electric range. The results of heterogeneity investigation across commuters with different average daily trip lengths also reveal that “TL1” commuters have 2.37 times higher WTP for electric range (INR 5472 per 1 km increase) as compared to “TL2” commuters (INR 2306 per 1 km increase). This may be explained by the short trip commuters’ higher deterrence towards frequent charging of vehicle and higher range anxiety [46]. Long trip commuters are probably more prepared to recharge their vehicle frequently than short trip commuters. Long trip commuters also appear to be more oriented to use conventional fuels beyond available electric range as compared to short trip commuters and, therefore, have lesser range anxiety than short trip commuters. Hence, it could be inferred that a reduction in fuel cost and an improvement in electric range would eventually attract prospective owners’ who predominately commute short trips towards PHEVs in the Indian context.
6. Marginal Effects
The present study considered multiple attributes such as purchase price, fuel cost reduction, electric range, public charging station, battery recharging time, battery warranty, and tailpipe emission to analyze prospective owners’ choice decision towards PHEVs. For improvement in these attributes from one level to another level, the increase in the demand for PHEVs is unlikely to be the same. Therefore, to formulate policy recommendations for vehicle manufacturers or the government, it is important to identify the marginal effect of each improvement strategy on prospective owners’ choice decisions, such that suitable improvement strategies can be selected. Hence, to understand the influence of improvement in each of the PHEV-specific attributes on prospective owners’ choice decisions, a set of alternative hypothetical scenarios were generated by improving the levels of all the attributes from the base scenario. These alternative improvement scenarios were evaluated by considering percentage change in the probability of choosing the improved alternative as compared to the base alternative as the measure of effectiveness. The percentage shift in probability will provide a measure of the relative attractiveness and reduction in disutility corresponding to a particular alternative improvement scenario compared to the base scenario. Therefore, improvements in the levels for the attributes were prioritized based on percentage change in the choice probability. The coefficient estimates of ML model for complete dataset without considering heterogeneity (Table 6) were used as input for evaluation of alternatives. The base scenario was defined with base levels of each attribute: purchase price: INR 1,250,000; fuel cost reduction: 20%; electric range: 30 km; public charging station: 20%; battery recharging time: 7 h; battery warranty: 3 yrs.; tailpipe emission: 75%. It is important to mention that the base level for purchase price represents 25% higher the average price commuters are willing to pay for their next car purchase. Subsequently, a total of 14 alternative scenarios (shown in Table 11) were generated by improving the levels of each attribute at a time and keeping all other attribute levels as fixed as the base scenario. For each case, change in the probability to choose the alternative scenario as compared to base scenario was examined. Considering the ML model coefficients obtained in Table 6, Equation (6) represents the utility equation used to evaluate the alternative scenarios.
First, the utility of the base and alternative improvement scenarios were evaluated. Second, the choice probabilities of alternative scenarios were estimated and, finally, the percentage shift in the probability to choose alternative scenarios compared to the base scenario was obtained. Figure 1 presents the results of the evaluation of alternative scenarios with respect to base scenario.
The results reveal that an increase in the purchase price of PHEVs from INR 1,250,000 (USD 17,502) to INR 1,500,000 (USD 21,003) induces −43% shift, indicating that the probability to choose base scenario is 43% higher than the alternative scenario. A subsequent increase in the purchase price to INR 1,750,000 (USD 24,503) further reduces the choice probability by 30%, leading to −73% shift from the base scenario. Similarly, an increase in the fuel cost savings from 20% to 40% increases the choice probability by 15%. A subsequent increase in the fuel cost saving to 60% eventually increase the choice probability of alternative scenario by 30%. For electric range, improvement in the level from 30 to 60 km increases the choice probability of alternative scenario by 18% as compared to the base scenario. A subsequent improvement in electric range to 90 km increases the choice probability by 36%. Furthermore, an increase in the public charging station from 20% to 60% and a further increase to 100% increase the choice probability by 12% and 23%, respectively. The reduction in battery recharging time from 7 to 3 h increases the choice probability by 34%. A subsequent reduction in charging time to 1 h induces 49% shift in the choice probability, a shift observed to be the highest among all the alternative scenarios considered in the present study. Further analysis reveals that increase in battery warranty from 3 to 5 yrs. increase the choice probability by 12%, and a further increase in warranty coverage to 8 yrs. increases the choice probability by 28%.Lastly, the reduction in tailpipe emission from 75% to 50% increases the choice probability by 24%. A subsequent reduction in tailpipe emission from 75% to 25% induces 45% shift in choice probability relative to the base scenario. The evaluation of alternative improvement scenarios provides useful insights on the relative impact of PHEV-specific attributes on prospective owners’ choice decisions and provides direction for policy implication to increase the attractiveness of PHEVs in the Indian context.
First, battery recharging time is identified as the most important attribute influencing prospective owners’ choice decision towards PHEVs with respect to both WTP estimates and derived marginal effects. The results indicate commuters’ significantly higher WTP for battery recharging time in the range of INR 34,079 to INR 66,150 (USD 477.23 to USD 926.21) derived from the ML models (with and without considering heterogeneity) and highest shift in the choice probability for improvement scenarios with reduced recharging time (34% and 49% shift for reduced battery recharging time of 3 and 1 h, respectively). Therefore, it could be inferred that reduction in the battery recharging time would positively influence a significant proportion of prospective owners to choose PHEVs in the Indian context. Hence, the vehicle manufacturers are recommended to prioritize improving the battery recharging time of future generation PHEVs to make PHEVs a more attractive alternative among prospective owners in India.
Second, tailpipe emission is identified as the second most important attribute influencing prospective owners’ choice decision towards PHEVs based on marginal effects. The commuters show second highest shift in the choice probability for the alternative improvement scenarios with reduced vehicular emissions (24% and 45% shift for reduce vehicular emissions of 50% and 25%, respectively), and also a significantly high WTP estimate of INR 5216 (USD 73.03) for tailpipe emission reduction. Therefore, it could be hypothesized that improvement in the emission reduction potential of PHEVs would have a significant and positive impact on prospective owners’ choice decisions. Hence, it is necessary to improve the tailpipe emission reduction capabilities of future generation PHEVs, to make PHEV a more attractive alternative to Indian commuters.
Third, the number of kilometers traveled on a full battery, i.e., the electric range, is identified as the third most important attribute in terms of marginal effects. The results indicate prospective owners’ third highest shift in the choice probability for alternative scenarios with improved electric range (18% and 36% shift for improved electric range of 60 and 90 km, respectively) and also a high WTP estimate of INR 3351 (USD 46.92) for an increase in electric range. Therefore, it could be assured that an increase in the electric range influences the prospective owners’ choice decisions positively. Hence, the vehicle manufacturers should focus on enhancing the electric range to make new generation PHEVs more attractive to Indian commuters.
Similarly, improvement in the levels of attributes such as fuel cost reduction and battery warranty also induces shift in the choice probability of prospective owners. However, the shift is less as compared to battery recharging time, tailpipe emission, and electric range. The findings show a differential effect of improvement in the levels of the attributes on percentage change in choice probability. Such findings would guide the vehicle manufacturers to focus on improvement of these priority attributes to enhance the attractiveness of PHEVs to Indian commuters.
Findings related to purchase price and public charging station are of interest to the government. The marginal effect shows that prospective owners have strong disutility associated with the purchase price of PHEVs. As the purchase price of PHEVs is much higher as compared to CVs, price is identified as the major deterrent towards the purchase of PHEVs. Level change with respect to the base scenario in Alt-1 and Alt-2 shows that for every INR 100,000 increase in purchase price, disutility increases by approximately 16%. The results indirectly show the role of subsidy and the need for providing higher subsidy to enhance the attractiveness of PHEVs to Indian commuters. Similarly, the results also highlight the important role of deploying public charging stations to increase the choice probability of PHEVs among prospective owners. However, the relative importance of subsidizing the purchase price is much higher than providing public charging facility for promoting PHEVs in the Indian market.
7. Conclusions
The present work brings out several interesting findings which may be used advantageously by vehicle manufacturers and policymakers to make new generation plug-in hybrid electric vehicles (PHEVs) more attractive to Indian commuters. The WTP study and marginal effects clearly indicate that battery recharging time is the most important attribute influencing prospective owners’ choice decision towards PHEVs, followed by tailpipe emission and electric range. Hence, the vehicle manufacturers are recommended to prioritize reducing battery recharging time, improve tailpipe emission reduction capabilities, and increase the electric range to make future generation PHEVs more attractive to Indian commuters. On the other hand, improvements in attributes such as fuel cost reduction and battery warranty have relatively less influence on prospective owners’ choice decisions towards PHEVs. Such findings would guide the vehicle manufacturers to focus on improvement of priority attributes to make PHEVs a more appealing alternative among Indian commuters. Another important finding from the present work is the prospective owners’ strong disutility associated with the purchase price of PHEVs. As the purchase price of PHEVs is much higher as compared to CVs, price is identified as the major bottleneck towards the purchase of PHEVs. Level change with respect to base scenario in Alt-1 and Alt-2 shows that for every INR 100,000 increase in purchase price, disutility increases by approximately 16%. The results indirectly show the role of subsidy and the need for providing higher subsidy to enhance the attractiveness of PHEVs to Indian commuters. Similarly, the results also highlight the important role of deploying public charging stations to increase the choice probability of PHEVs among prospective owners. However, relative importance of subsidizing the purchase price is much higher than providing public charging facility for promoting PHEVs in the Indian market. It is also interesting to note the influence of prospective owners’ sociodemographic characteristics such as monthly family income, availability of home-based parking space for charging outlet, and trip characteristics such as average daily trip length on WTP for PHEV-related attributes. Such information could be used advantageously by the vehicle manufacturers and policymakers for market segmentation and identification of early adopters of PHEVs in the Indian context.
Like any other study, this study also has several limitations. Firstly, during the data collection, all the respondents were asked about their willingness to participate in the survey. This willingness may have induced self-selection bias into the data. The data could be biased with responses from prospective owners with comparatively stronger opinions towards PHEVs. Secondly, the present study investigated the influence of sociodemographic characteristics and trip characteristics on prospective owners’ perception towards PHEVs. However, the impact of commuters’ lifestyle, attitude towards environment, symbolism, familiarity, and experience with PHEVs on preferences for specific PHEV-related attributes were not explored. Therefore, as a future scope of this research, the effect of the aforementioned factors on commuters’ perception towards PHEVs needs to be studied. Thirdly, although WTP estimates derived for the attributes considered in the present study provide lots of insights into prospective owners’ choice decisions towards PHEVs, it also indicates the need for future work to estimate potential demand shift from CVs to PHEVs by developing demand models. Finally, the authors would like to mention that even though the results are case-specific, the findings from the present study are expected to be of interest to vehicle manufacturers and policymakers in other developing countries working on electric mobility as an instrument to promote sustainable urban transportation.
Author Contributions
Conceptualization, B.M.; methodology, R.B. and B.M.; formal analysis, R.B.; investigation, R.B.; resources, B.M.; writing—original draft preparation, R.B.; writing—review and editing, B.M.; visualization, R.B.; supervision, B.M.; project administration, B.M.; funding acquisition, B.M. All authors have read and agreed to the published version of the manuscript.
Funding
This study is a part of project initiated and funded by Ministry of Human Resource Development, Government of India (GoI), Tata Motors Limited, and Ministry of Heavy Industries & Public Enterprises, GoI (Grant No: 35-13/2016-TS.I). The authors are thankful to the supporting organizations for giving the opportunity to undertake the present study.
Institutional Review Board Statement
Not Applicable.
Informed Consent Statement
Not Applicable.
Data Availability Statement
The data used for model development and supporting the findings of this study are available on request from the corresponding author.
Acknowledgments
The authors are thankful to the anonymous respondents for providing complete and useful responses for this study. The authors are also thankful to the editors and anonymous referees of the journal for their valuable comments and suggestions to improve the quality of the manuscript.
Conflicts of Interest
The authors declare no conflict of interest.
References
- Carlucci, F.; Cirà, A.; Lanza, G. Hybrid electric vehicles: Some theoretical considerations on consumption behaviour. Sustainability 2018, 10, 1302. [Google Scholar] [CrossRef] [Green Version]
- Cook, J.; Nuccitelli, D.; Green, S.A.; Richardson, M.; Winkler, B.; Painting, R.; Way, R.; Jacobs, P.; Skuce, A. Quantifying the consensus on anthropogenic global warming in the scientific literature. Environ. Res. Lett. 2013, 8. [Google Scholar] [CrossRef] [Green Version]
- Allen, M.R.; Frame, D.J.; Huntingford, C.; Jones, C.D.; Lowe, J.A.; Meinshausen, M.; Meinshausen, N. Warming caused by cumulative carbon emissions towards the trillionth tonne. Nature 2009, 458, 1163–1166. [Google Scholar] [CrossRef] [PubMed]
- Achtnicht, M. German car buyers’ willingness to pay to reduce CO2 emissions. Clim. Change 2012, 113, 679–697. [Google Scholar] [CrossRef]
- Bera, R.; Maitra, B. Consumer demand and willingness to pay for plug-in hybrid electric vehicles: A case study of Delhi and Kolkata, India. In Proceedings of the Transportation Research Board 100th Annual Meeting, Washington, DC, USA, 21–29 January 2021. [Google Scholar]
- Kobza, J.; Geremek, M. Do the pollution related to high-traffic roads in urbanised areas pose a significant threat to the local population? Environ. Monit. Assess. 2017, 189. [Google Scholar] [CrossRef] [Green Version]
- Herzog, T. World Greenhouse Gas Emissions in 2005; World Resources Institute: Washington, DC, USA, 2009. [Google Scholar]
- IEA Statistics. CO2 Emissions from Combustion Highlights; International Energy Agency: Paris, France, 2017.
- Bera, R.; Maitra, B. Identification of priority areas of improvement for small passenger car segment in Indian market. Vision 2021. [Google Scholar] [CrossRef]
- Bera, R.; Maitra, B. Identification of priority attributes influencing the choice of plug-in hybrid electric vehicle in Indian megacities. J. East. Asia Soc. Transp. Stud. 2019, 13, 678–697. [Google Scholar] [CrossRef]
- Bhowmick, G.; Sahoo, T.; Bhat, A.; Mathur, G.; Gambhir, D. Approach for CO2 Reduction in India’s Automotive Sector (No. 2019-28-2388). SAE Tech. Pap. 2019, 28, 2388. [Google Scholar] [CrossRef]
- Wang, Q.; Li, R. Drivers for energy consumption: A comparative analysis of China and India. Renew. Sustain. Energy Rev. 2016, 62, 954–962. [Google Scholar] [CrossRef]
- Li, S.; Wang, Q. India’s dependence on foreign oil will exceed 90% around 2025—The forecasting results based on two hybridized NMGM-ARIMA and NMGM-BP models. J. Clean. Prod. 2019, 232, 137–153. [Google Scholar] [CrossRef]
- Pardesi, M.S.; Ganguly, S. India and energy security: A foreign policy priority. In Indian Foreign Policy in a Unipolar World; Routledge: New Delhi, India, 2020; pp. 99–127. [Google Scholar]
- Dhar, S.; Pathak, M.; Shukla, P.R. Electric vehicles and India’s low carbon passenger transport: A long-term co-benefits assessment. J. Clean. Prod. 2017, 146, 139–148. [Google Scholar] [CrossRef] [Green Version]
- Lane, B.W.; Dumortier, J.; Carley, S.; Siddiki, S.; Clark-Sutton, K.; Graham, J.D. All plug-in electric vehicles are not the same: Predictors of preference for a plug-in hybrid versus a battery-electric vehicle. Transp. Res. Part D Transp. Environ. 2018, 65, 1–13. [Google Scholar] [CrossRef] [Green Version]
- Higueras-Castillo, E.; Molinillo, S.; Coca-Stefaniak, J.A.; Liebana-Cabanillas, F. Potential Early Adopters of Hybrid and Electric Vehicles in Spain—Towards a Customer Profile. Sustainability 2020, 12, 4345. [Google Scholar] [CrossRef]
- Krupa, J.S.; Rizzo, D.M.; Eppstein, M.J.; Lanute, D.B.; Gaalema, D.E.; Lakkaraju, K.; Warrender, C.E. Analysis of a consumer survey on plug-in hybrid electric vehicles. Transp. Res. Part A Policy Pract. 2014, 64, 14–31. [Google Scholar] [CrossRef]
- Simpson, A. Cost-Benefit Analysis of Plug-In Hybrid Electric Vehicle Technology (No. NREL/CP-540-40485); National Renewable Energy Lab. (NREL): Golden, CO, USA, 2006.
- Zoepf, S.; MacKenzie, D.; Keith, D.; Chernicoff, W. Charging choices and fuel displacement in a large-scale demonstration of plug-in hybrid electric vehicles. Transp. Res. Rec. 2013, 2385, 1–10. [Google Scholar] [CrossRef]
- Axsen, J.; Kurani, K.S. Anticipating plug-in hybrid vehicle energy impacts in California: Constructing consumer-informed recharge profiles. Transp. Res. Part D Transp. Environ. 2010, 15, 212–219. [Google Scholar] [CrossRef] [Green Version]
- Plötz, P.; Funke, S.Á.; Jochem, P. The impact of daily and annual driving on fuel economy and CO2 emissions of plug-in hybrid electric vehicles. Transp. Res. Part A Policy Pract. 2018, 118, 331–340. [Google Scholar] [CrossRef]
- Markel, T.; Simpson, A. Cost-benefit analysis of plug-in hybrid electric vehicle technology. World Electr. Veh. J. 2007, 1, 294–301. [Google Scholar] [CrossRef] [Green Version]
- Bicer, Y.; Dincer, I. Life cycle environmental impact assessments and comparisons of alternative fuels for clean vehicles. Resour. Conserv. Recycl. 2018, 132, 141–157. [Google Scholar] [CrossRef]
- Elgowainy, A.; Burnham, A.; Wang, M.; Molburg, J.; Rousseau, A. Well-to-wheels energy use and greenhouse gas emissions of plug-in hybrid electric vehicles. SAE Int. J. Fuels Lubr. 2009, 2, 627–644. Available online: https://www.jstor.org/stable/26273415 (accessed on 20 December 2020). [CrossRef] [Green Version]
- FAME India. Scheme for Faster Adoption and Manufacturing of (Hybrid &) Electric Vehicles in India; Government of India (GoI): New Delhi, India, 2015.
- IEA. Global EV Outlook: Scaling-Up the Transition to Electric Mobility; International Energy Agency: Paris, France, 2019.
- Goel, S.; Sharma, R.; Rathore, A.K. A Review on Barrier and Challenges of Electric Vehicle in India and Vehicle to Grid Optimisation. Transp. Eng. 2021, 100057. [Google Scholar] [CrossRef]
- Egbue, O.; Long, S. Barriers to widespread adoption of electric vehicles: An analysis of consumer attitudes and perceptions. Energy Policy 2012, 48, 717–729. [Google Scholar] [CrossRef]
- Berrada, J.; Mouhoubi, I.; Christoforou, Z. Factors of successful implementation and diffusion of services based on autonomous vehicles: Users’ acceptance and operators’ profitability. Res. Transp. Econ. 2020, 83, 100902. [Google Scholar] [CrossRef]
- Cartenì, A. The acceptability value of autonomous vehicles: A quantitative analysis of the willingness to pay for shared autonomous vehicles (SAVs) mobility services. Transp. Res. Interdiscip. Persp. 2020, 8, 100224. [Google Scholar] [CrossRef]
- Cartenì, A.; Henke, I.; Molitierno, C.; Di Francesco, L. Strong sustainability in public transport policies: An e-mobility bus fleet application in Sorrento Peninsula (Italy). Sustainability. 2020, 12, 7033. [Google Scholar] [CrossRef]
- Wu, J.; Liao, H.; Wang, J.W. Analysis of consumer attitudes towards autonomous, connected, and electric vehicles: A survey in China. Res. Transp. Econ. 2020, 80, 100828. [Google Scholar] [CrossRef]
- Hensher, D.A.; Rose, J.M.; Greene, W.H. Applied Choice Analysis, 2nd ed.; Cambridge University Press: Cambridge, UK, 2015. [Google Scholar]
- Shin, J.; Bhat, C.R.; You, D.; Garikapati, V.M.; Pendyala, R.M. Consumer preferences and willingness to pay for advanced vehicle technology options and fuel types. Transp. Res. Part C Emerg. Technol. 2015, 60, 511–524. [Google Scholar] [CrossRef] [Green Version]
- Maeng, K.; Jeon, S.R.; Park, T.; Cho, Y. Network effects of connected and autonomous vehicles in South Korea: A consumer preference approach. Res. Transp. Econ. 2020, 100998. [Google Scholar] [CrossRef]
- Louviere, J.J.; Hensher, D.A.; Swait, J.D. Stated Choice Methods: Analysis and Applications; Cambridge University Press: Cambridge, UK, 2000. [Google Scholar]
- Ewing, G.; Sarigöllü, E. Assessing consumer preferences for clean-fuel vehicles: A discrete choice experiment. J. Public Policy Mark. 2000, 19, 106–118. [Google Scholar] [CrossRef]
- Potoglou, D.; Kanaroglou, P.S. Household demand and willingness to pay for clean vehicles. Transp. Res. Part D Transp. Environ. 2007, 12, 264–274. [Google Scholar] [CrossRef]
- Hidrue, M.K.; Parsons, G.R.; Kempton, W.; Gardner, M.P. Willingness to pay for electric vehicles and their attributes. Resour. Energy Econ. 2011, 33, 686–705. [Google Scholar] [CrossRef] [Green Version]
- Lebeau, K.; van Mierlo, J.; Lebeau, P.; Mairesse, O.; Macharis, C. The market potential for plug-in hybrid and battery electric vehicles in Flanders: A choice-based conjoint analysis. Transp. Res. Part D Transp. Environ. 2012, 17, 592–597. [Google Scholar] [CrossRef]
- Hackbarth, A.; Madlener, R. Consumer preferences for alternative fuel vehicles: A discrete choice analysis. Transp. Res. Part D Transp. Environ. 2013, 25, 5–17. [Google Scholar] [CrossRef] [Green Version]
- Tanaka, M.; Ida, T.; Murakami, K.; Friedman, L. Consumers’ willingness to pay for alternative fuel vehicles: A comparative discrete choice analysis between the US and Japan. Transp. Res. Part A Policy Pract. 2014, 70, 194–209. [Google Scholar] [CrossRef]
- Hoen, A.; Koetse, M.J. A choice experiment on alternative fuel vehicle preferences of private car owners in the Netherlands. Transp. Res. Part A Policy Pract. 2014, 61, 199–215. [Google Scholar] [CrossRef]
- Helveston, J.P.; Liu, Y.; Feit, E.M.; Fuchs, E.; Klampfl, E.; Michalek, J.J. Will subsidies drive electric vehicle adoption? Measuring consumer preferences in the US and China. Transp. Res. Part A Policy Pract. 2015, 73, 96–112. [Google Scholar] [CrossRef] [Green Version]
- Higgins, C.D.; Mohamed, M.; Ferguson, M.R. Size matters: How vehicle body type affects consumer preferences for electric vehicles. Transp. Res. Part A Policy Pract. 2017, 100, 182–201. [Google Scholar] [CrossRef]
- Ferguson, M.; Mohamed, M.; Higgins, C.D.; Abotalebi, E.; Kanaroglou, P. How open are Canadian households to electric vehicles? A national latent class choice analysis with willingness-to-pay and metropolitan characterization. Transp. Res. Part D Transp. Environ. 2018, 58, 208–224. [Google Scholar] [CrossRef]
- Nie, Y.; Wang, E.; Guo, Q.; Shen, J. Examining shanghai consumer preferences for electric vehicles and their attributes. Sustainability 2018, 10, 2036. [Google Scholar] [CrossRef] [Green Version]
- Rahmani, D.; Loureiro, M.L. Assessing drivers’ preferences for hybrid electric vehicles (HEV) in Spain. Res. Transp. Econ. 2019, 73, 89–97. [Google Scholar] [CrossRef] [Green Version]
- Qian, L.; Grisolía, J.M.; Soopramanien, D. The impact of service and government-policy attributes on consumer preferences for electric vehicles in China. Transp. Res. Part A Policy Pract. 2019, 122, 70–84. [Google Scholar] [CrossRef] [Green Version]
- Li, L.; Wang, Z.; Chen, L.; Wang, Z. Consumer preferences for battery electric vehicles: A choice experimental survey in China. Transp. Res. Part D Transp. Environ. 2020, 78, 10218. [Google Scholar] [CrossRef]
- Guerra, E.; Daziano, R.A. Electric vehicles and residential parking in an urban environment: Results from a stated preference experiment. Transp. Res. Part D Transp. Environ. 2020, 79, 102222. [Google Scholar] [CrossRef]
- Danielis, R.; Rotaris, L.; Giansoldati, M.; Scorrano, M. Drivers’ preferences for electric cars in Italy. Evidence from a country with limited but growing electric car uptake. Transp. Res. Part A Policy Pract. 2020, 137, 79–94. [Google Scholar] [CrossRef]
- Giansoldati, M.; Rotaris, L.; Scorrano, M.; Danielis, R. Does electric car knowledge influence car choice? Evidence from a hybrid choice model. Res. Transp. Econ. 2020, 80, 100826. [Google Scholar] [CrossRef]
- Gong, S.; Ardeshiri, A.; Rashidi, T.H. Impact of government incentives on the market penetration of electric vehicles in Australia. Transp. Res. Part D Transp. Environ. 2020, 83, 102353. [Google Scholar] [CrossRef]
- Jung, J.; Yeo, S.; Lee, Y.; Moon, S.; Lee, D.J. Factors affecting consumers’ preferences for electric vehicle: A Korean case. Res. Transp. Bus Manag. 2021, 100666. [Google Scholar] [CrossRef]
- Hausman, J.; McFadden, D. Specification tests for the multinomial logit model. J. Econ. Soc. 1984, 1219–1240. [Google Scholar] [CrossRef] [Green Version]
- McFadden, D.; Train, K. Mixed MNL models for discrete response. J. Appl. Econom. 2000, 15, 447–470. [Google Scholar] [CrossRef]
- Huang, Y.; Qian, L.; Tyfield, D.; Soopramanien, D. On the heterogeneity in consumer preferences for electric vehicles across generations and cities in China. Technol. Forecast Soc. Change 2021, 167, 120687. [Google Scholar] [CrossRef]
- Train, K.E. Discrete Choice Methods with Simulation; Cambridge University Press: Cambridge, UK, 2009. [Google Scholar]
- Rose, J.M.; Bliemer, M.C. Stated Preference Experimental Design Strategies; Emerald Group Publishing Limited: Bingley, UK, 2007. [Google Scholar]
- Huber, J.; Zwerina, K. The importance of utility balance in efficient choice designs. J. Mark. Res. 1996, 33, 307–317. [Google Scholar] [CrossRef]
- Burgess, L.; Street, D.J. Optimal designs for choice experiments with asymmetric attributes. J. Stat. Plan. Inference 2005, 134, 288–301. [Google Scholar] [CrossRef]
- Rose, J.M.; Bliemer, M.C.; Hensher, D.A.; Collins, A.T. Designing efficient stated choice experiments in the presence of reference alternatives. Transp. Res. Part B Methodol. 2008, 42, 395–406. [Google Scholar] [CrossRef]
- JMP, Version 14; Statistical Software; SAS Institute: Cary, NC, USA, 2018.
- Baker, R.P.; Bradburn, N.M.; Johnson, R.A. Computer-assisted personal interviewing: An experimental evaluation of data quality and cost. J. Off. Stat. 1995, 11, 413–431. [Google Scholar]
- Ministry of Home Affairs (MHA). Census of India; Government of India (GoI): New Delhi, India, 2011.
- Taherdoost, H. Determining sample size; How to calculate survey sample size. Int. J. Econ. Manag. Syst. 2017, 2, 1–3. Available online: https://ssrn.com/abstract=3224205 (accessed on 11 February 2021).
- McFadden, D. The choice theory approach to market research. Mark. Sci. 1986, 5, 275–297. [Google Scholar] [CrossRef]
- Bhat, C.R. Flexible model structures for discrete choice analysis. In Handbook of Transport Modelling, Handbooks in Transport; Hensher, D.A., Button, K.J., Eds.; Pergamon Press: Oxford, UK, 2000; Volume 1, pp. 71–90. [Google Scholar]
- Bhat, C.R. Quasi-random maximum simulated likelihood estimation of the mixed multinomial logit model. Transp. Res. Part B Methodol. 2001, 35, 677–693. [Google Scholar] [CrossRef] [Green Version]
- Ben-Akiva, M.; Lerman, S.R. Discrete choice analysis: Theory and application to travel demand. In Transportation Studies; MIT Press: Cambridge, MA, USA, 1985. [Google Scholar]
- Greene, W.H. NLOGIT Version 5 Reference Guide; Plainview: New York, NY, USA, 2012. [Google Scholar]
- Menon, A.; Yang, Z.; Bandivadekar, A. Electric Vehicle Guidebook for Indian States; ICCT: New Delhi, India, 2019; Available online: https://theicct.org/sites (accessed on 27 June 2020).
- Rajper, S.Z.; Albrecht, J. Prospects of electric vehicles in the developing countries: A literature review. Sustainability 2020, 12, 1906. [Google Scholar] [CrossRef] [Green Version]
Figure 1.
Percentage shift in the probability to choose alterative scenarios relative to base scenario.
Figure 1.
Percentage shift in the probability to choose alterative scenarios relative to base scenario.


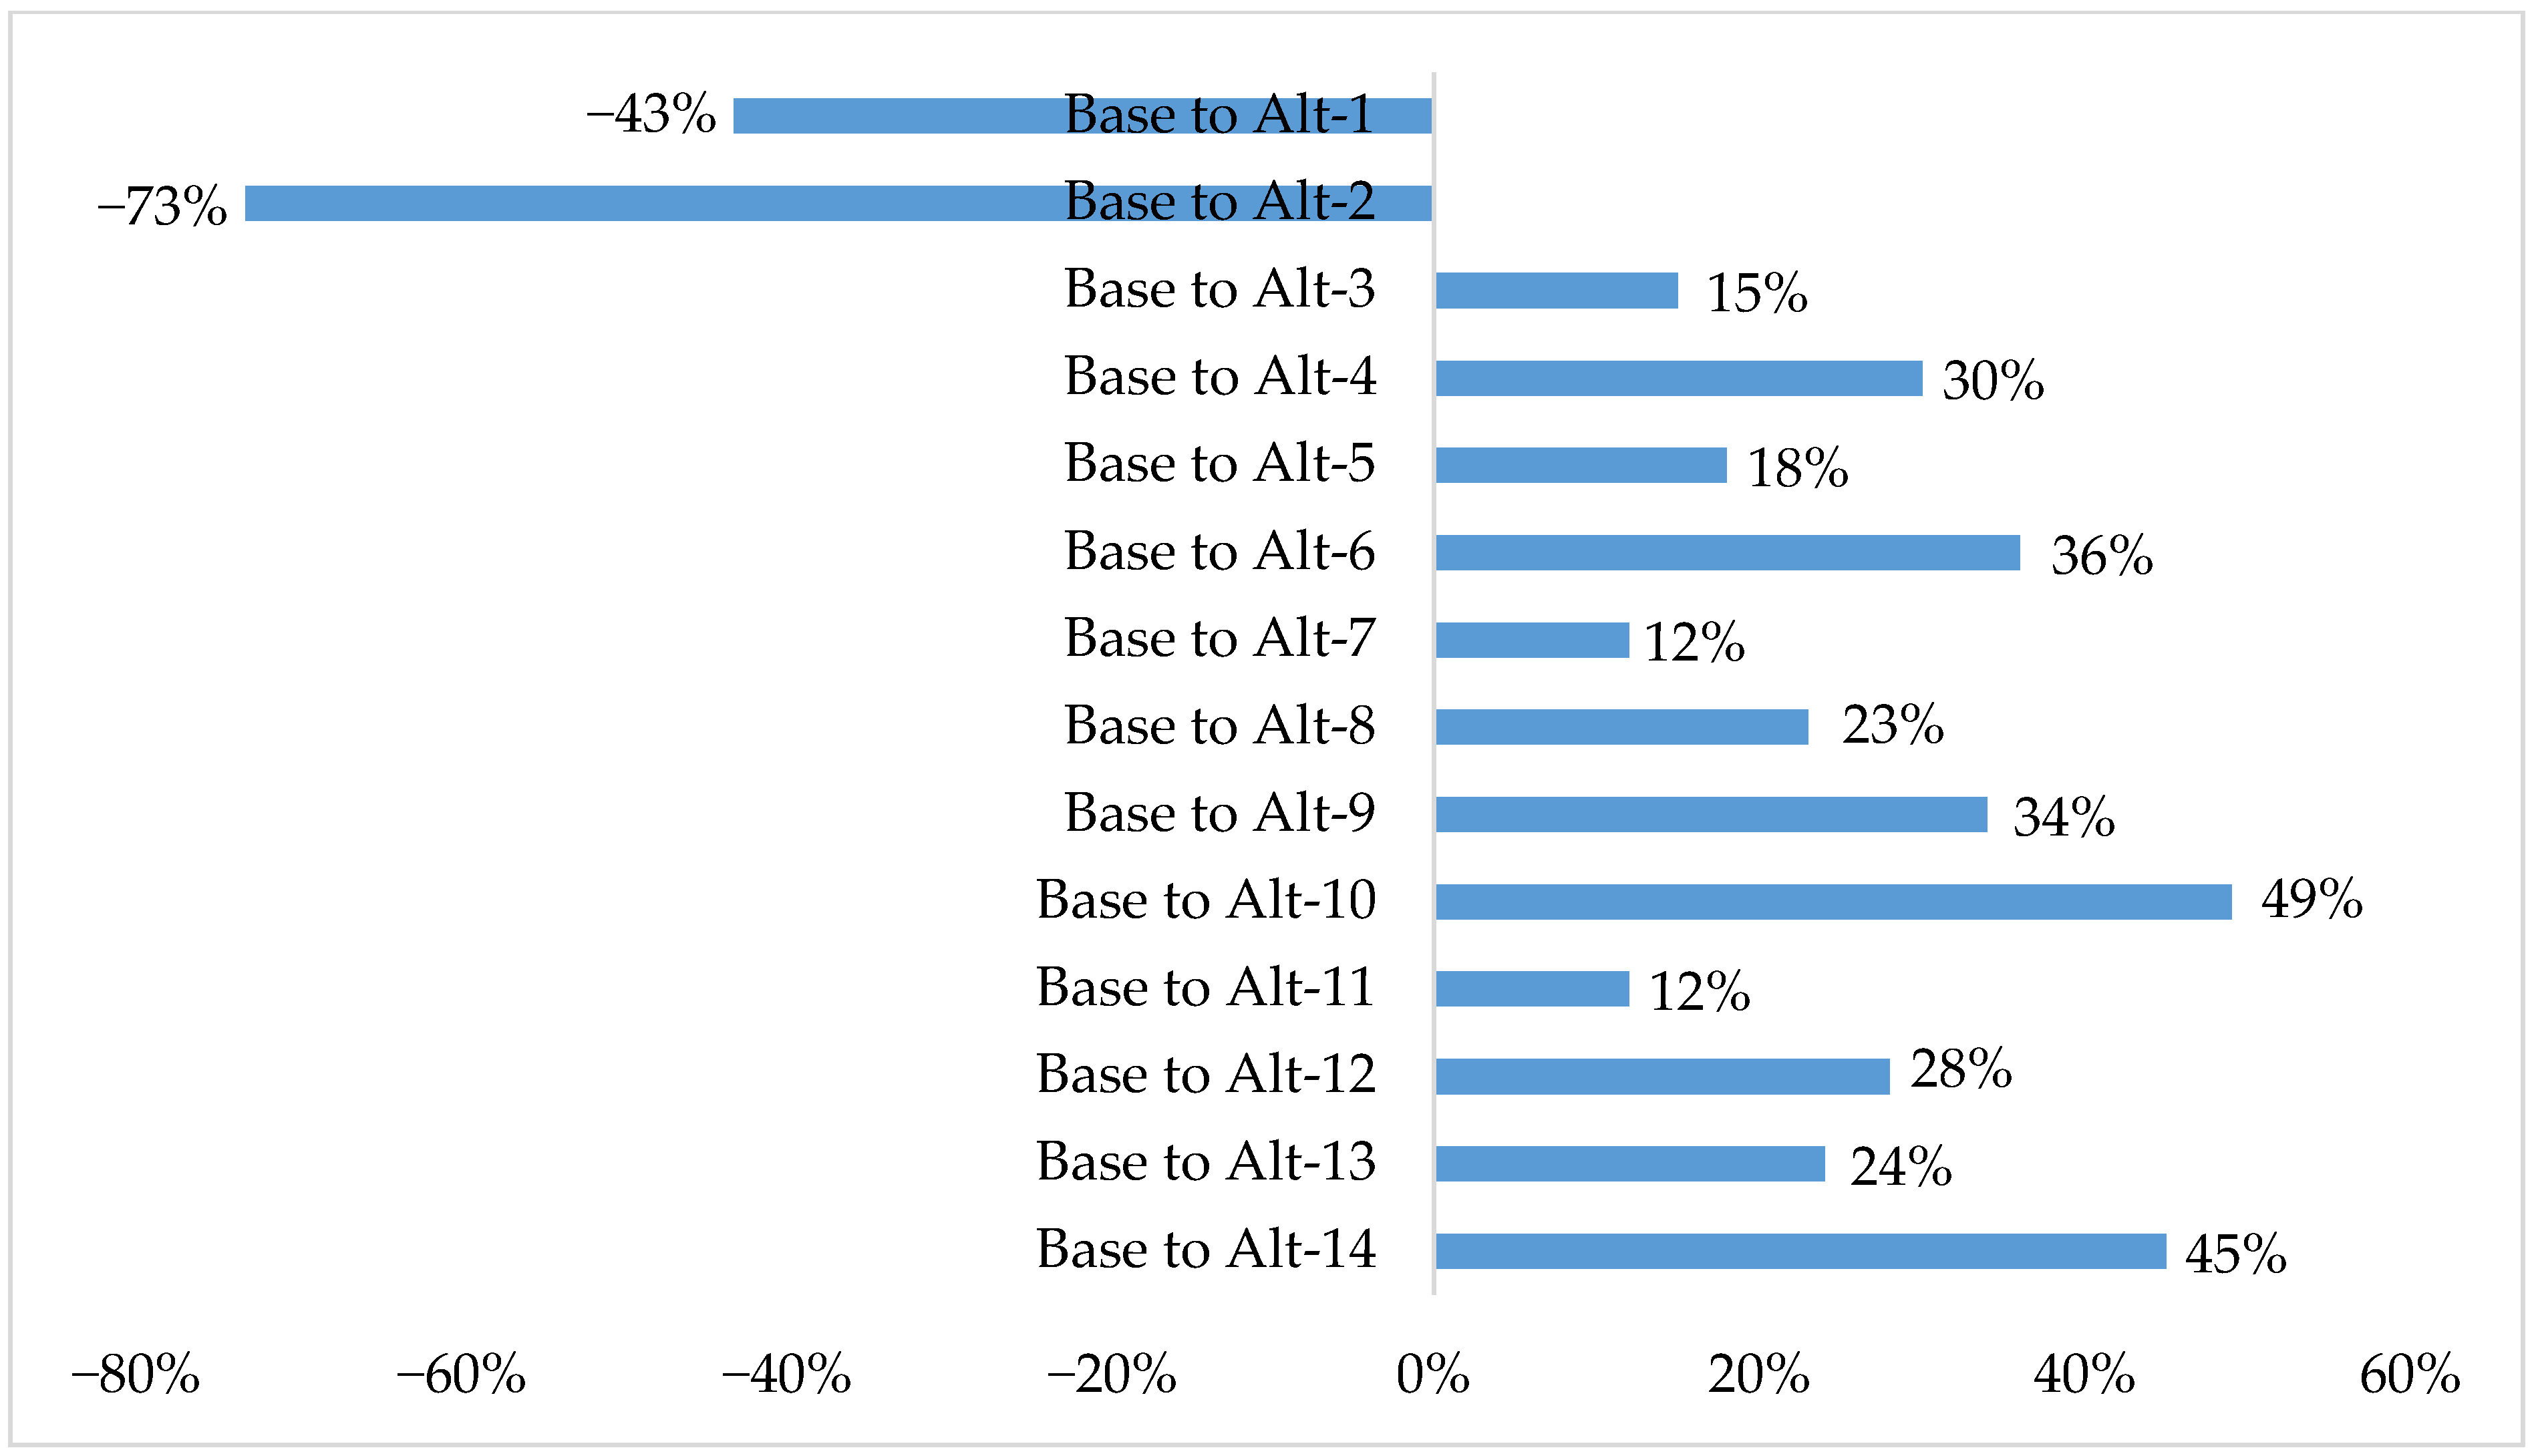
Table 1.
Summary of past SP studies on electric vehicles.
| Study | Country | Econometric Model | List of Attributes Included in the SP Study |
|---|---|---|---|
| Ewing and Sarigollu [38] | Canada | MNL | Price, annual repair and maintenance cost, acceleration, cruising range, refueling rate, pollution level |
| Potoglou and Kanaroglou [39] | Canada | NMNL | Price, fuel type, annual fuel cost, annual maintenance cost, fuel availability, acceleration, incentives, pollution level |
| Hidrue et al. [40] | US | LC | Price, driving range, charging time, fuel cost, acceleration, pollution level |
| Lebeau et al. [41] | Belgium | HB | Purchase costs, annual costs, travel cost for 100 km, environmental performance, refuel or charging infrastructure, driving range, refuel or charging time, maximum speed, brand/image/design/quality |
| Hackbarth and Madlener [42] | Germany | ML | Price, fuel cost per 100 km, driving range, fuel availability, refueling time, recharging time, policy incentives |
| Tanaka et al. [43] | US/Japan | ML | Price, fuel cost, driving range, emission reduction, alternative fuel availability, home plug-in construction fee |
| Hoen and Koetse [44] | The Netherlands | ML | Price, monthly costs, driving range, recharging time, additional detour time |
| Helveston et al. [45] | US/China | MNL and ML | Price, vehicle type, brand, operating cost, fast charging capability, acceleration time |
| Higgins et al. [46] | Canada | MNP | Purchase price, annual maintenance cost, annual fuel cost, acceleration, tailpipe emission, cash incentives, gasoline range, battery range, charging time, battery warranty, fuel availability |
| Ferguson et al. [47] | Canada | MNL and LC | Price, annual fuel cost, annual maintenance cost, gasoline range, battery range, charging station availability, public charging time, home/work charging time, tailpipe emission, battery warranty, acceleration |
| Nie et al. [48] | China | MNL and ML | Driving range, pollution, charging time, maximum speed, fuel cost, price |
| Rahmani and Loureiro [49] | Spain | LC | Price, fuel consumption, CO2 emission, biofuel adaptation |
| Qian et al. [50] | China | ML | Purchase price, annual running cost, driving range, slow/fast charging station availability, availability of home charging facility |
| Li et al. [51] | China | ML and LC | Purchase price, driving range, rapid charging time, normal charging time, battery warranty, cost per 100 km, charging stations |
| Guerra and Daziano [52] | US | ML and LC | Purchase price, driving cost, electric vehicle range, electric vehicle parking, monthly access price, charging time, location, time to find free space |
| Danielis et al. [53] | Italy | MNL and ML | Purchase price, fuel economy, electric vehicle range, petrol car range, fast charging time, refueling distance |
| Giansoldati et al. [54] | Italy | HC | Purchase price, driving range, annual operating cost, % of fuel stations with fast charging stalls |
| Gong et al. [55] | Australia | LC | Price, body type, operating cost, recharge time, electric vehicle range, availability of fast charging station |
| Jung et al. [56] | South Korea | HC | Purchase price, acceleration time, annual maintenance and fuel cost, fueling/fast charging time, operating range, charging stations |
Table 2.
Attributes and attribute levels for SP choice experiment.
| Attribute | Description of the Attribute | Levels |
|---|---|---|
| Purchase price |
| 25% Higher (Base) 50% Higher 75% Higher |
| Fuel cost reduction |
| 20% (Base) 40% 60% |
| Electric range |
| 30 km (Base) 60 km 90 km |
| Public charging station |
| 20% (Base) 60% 100% |
| Battery recharging time |
| 7 h (Base) 3 h 1 h |
| Battery warranty |
| 3 yrs./60,000 km (Base) 5 yrs./1,00,000 km 8 yrs./1,60,000 km |
| Tailpipe emission |
| 75% (Base) 50% 25% |
Table 3.
A sample choice set.
| Choice Set # A1 | ||
|---|---|---|
| Suppose on your next purchase of a new car you were offered with only the following two alternative options of Plug-in Hybrid Electric Vehicle with features shown below. Assuming that the two alternatives are otherwise identical, please indicate the one you would most likely purchase by ticking on the box below the alternative. | ||
| Attribute | Alternative 1 | Alternative 2 |
| Purchase price (compared to reference a) | 50% higher | 25% higher |
| Fuel cost reduction (compared to CVs) | 60% | 40% |
| Electric range | 90 km | 60 km |
| Public charging station (% of existing fuel stations) | 20% | 20% |
| Battery recharging time | 1 h | 7 h |
| Battery warranty | 3 yrs./60,000 km | 5 yrs./100,000 km |
| Tailpipe emission (compared to CVs) | 25% | 75% |
| I would most likely purchase |  |  |
a stated average of lower and upper bound of next car indicated by respondent.
Table 4.
Descriptive statistics of data.
| Variable | User Group | Sample (N = 415) | Sample (%) | Population (%) |
|---|---|---|---|---|
| Gender | Male | 349 | 84 | 54 |
| Female | 66 | 16 | 46 | |
| Age (years) | Less than 35 | 249 | 60 | 66 |
| 35 or above | 166 | 40 | 34 | |
| Education | Up to higher secondary | 237 | 57 | 83 |
| Graduate or higher | 178 | 43 | 17 | |
| Occupation | Service/Job | 271 | 65 | - |
| Business | 64 | 15 | - | |
| Student | 57 | 14 | - | |
| Self-employed | 14 | 3 | - | |
| Others | 9 | 2 | ||
| Monthly family income (INR */month) | Less than 150,000 (USD 2100) | 241 | 58 | - |
| 150,000 or more (USD 2100) | 174 | 42 | - | |
| Car Ownership | 1 | 278 | 67 | - |
| 2 or more | 137 | 33 | - | |
| Availability of home-based parking space for charging outlet | Yes | 195 | 47 | - |
| No | 220 | 53 | - | |
| Average daily trip length (Journey to work) | Less than 35 km | 145 | 53 | - |
| 35 km or more | 270 | 47 | - |
* INR = Indian Rupees. Note: To the authors’ knowledge there is no data available on occupation and income distribution of Delhi (urban) population in Indian Census Manual, 2011 [67].
Table 5.
Description of variables and model parameters of ML model.
| Symbol | Description |
|---|---|
| Probability that individual n chooses alternative i | |
| Observed portion of the utility that relate to individual n and alternative i | |
| Observed portion of the utility that relate to individual n and alternative j | |
| Vector of parameters to be estimated | |
| Density function of parameter vector | |
| Observed variables that relate to individual n and alternative j | |
| Individual-specific parameter vector | |
| Error term that relates to individual n and alternative j | |
| Observed variables that relate to individual n | |
| Primitive vector of uncorrelated random variables with known variances | |
| Random parameter with stochastic properties | |
| Random coefficient for the kth attribute face by individual n | |
| Heterogeneity in the mean of the distribution of random parameter |
Table 6.
Coefficient estimates of ML1 model and derived Willingness to Pay (WTP) values.
| Attributes | ML1 (Complete Dataset without Considering Heterogeneity) | WTP Values |
|---|---|---|
| Random parameter [Coefficient (t-statistics)] | ||
| Fuel cost reduction | 0.0156 *** (5.92) | 4216 |
| Electric range | 0.0124 *** (6.98) | 3351 |
| Public charging station | 0.0058 *** (4.41) | 1568 |
| Battery recharging time | −0.1796 *** (−9.38) | 48,541 |
| Battery warranty | 0.1154 *** (4.08) | 31,189 |
| Tailpipe emission | −0.0193 *** (−7.01) | 5216 |
| Non-random/Fixed parameter [Coefficient (t-statistics)] | ||
| Purchase price # | −0.0037 *** (−12.60) | |
| Goodness of fit | ||
| Log-likelihood function | −671.2427 | |
| Adjusted ρ2 | 0.2141 | |
| Sample size | ||
| Number of Respondents | 415 | |
| Number of Observations | 1245 | |
*** Denotes statistical significance at 99% confidence level. # Purchase price in INR 1000.
Table 7.
Log-likelihood ratio test of ML models.
| Model | 2 (LL Model 2-LL Model 1) | Degrees of Freedom | Null Hypothesis | |
|---|---|---|---|---|
| ML2-ML1 | 37.941 | 13.277 | 4 | Rejected |
| ML3-ML1 | 17.602 | 9.210 | 2 | Rejected |
| ML4-ML1 | 15.451 | 9.210 | 2 | Rejected |
Table 8.
Coefficient estimates of ML2 model and derived WTP values.
| Attributes | ML2 (Monthly Family Income Heterogeneity) | WTP Values | |
|---|---|---|---|
| Low Income | High Income | ||
| Random parameter [Coefficient (t-statistics)] | |||
| Fuel cost reduction | 0.0180 *** (4.81) | 4500 | 4500 |
| Electric range | 0.0087 *** (4.22) | 2175 | 5625 |
| Public charging station | 0.0045 *** (2.71) | 1125 | 2375 |
| Battery recharging time | −0.1505 *** (−6.88) | 37,625 | 66,150 |
| Battery warranty | 0.0534 * (1.69) | 13,350 | 79,200 |
| Tailpipe emission | −0.0191 *** (−5.84) | 4775 | 4775 |
| Non-random/Fixed parameter [Coefficient (t-statistics)] | |||
| Purchase price # | −0.0040 *** (−13.17) | ||
| Heterogeneity around the mean of random parameter | |||
| Fuel cost reduction | |||
| Electric range | 0.0138 *** (3.83) | ||
| Public charging station | 0.0050 * (1.75) | ||
| Battery recharging time | −0.1141 *** (−2.97) | ||
| Battery warranty | 0.2634 *** (4.06) | ||
| Tailpipe emission | |||
| Goodness of fit | |||
| Log-likelihood function | −649.8399 | ||
| Adjusted ρ2 | 0.2319 | ||
| Sample size | |||
| Number of Respondents | 415 | ||
| Number of Observations | 1245 | ||
***, * denote statistical significance at 99%, 95% and 90% confidence level, respectively. # Purchase price in INR 1000. Blank cells indicate statistically insignificant heterogeneity around the mean of random parameter.
Table 9.
Coefficient estimates of ML3 model and derived WTP values.
| Attributes | ML3 (Home-Based Parking Space Heterogeneity) | WTP Values | |
|---|---|---|---|
| HP1 | HP2 | ||
| Random parameter [Coefficient (t-statistics)] | |||
| Fuel cost reduction | 0.0170 *** (3.95) | 4474 | 4474 |
| Electric range | 0.0146 *** (5.82) | 3842 | 3842 |
| Public charging station | 0.0092 *** (4.80) | 2421 | 711 |
| Battery recharging time | −0.2438 *** (−8.49) | 64,158 | 34,079 |
| Battery warranty | 0.1082 *** (2.75) | 28,474 | 28,474 |
| Tailpipe emission | −0.0157 *** (−4.21) | 4132 | 4132 |
| Non-random/Fixed parameter [Coefficient (t-statistics)] | |||
| Purchase price # | −0.0038 *** (−12.52) | ||
| Heterogeneity around the mean of random parameter | |||
| Fuel cost reduction | |||
| Electric range | |||
| Public charging station | −0.0065 ** (−2.38) | ||
| Battery recharging time | 0.1143 *** (3.18) | ||
| Battery warranty | |||
| Tailpipe emission | |||
| Goodness of fit | |||
| Log-likelihood function | −660.0096 | ||
| Adjusted ρ2 | 0.2201 | ||
| Sample size | |||
| Number of Respondents | 415 | ||
| Number of Observations | 1245 | ||
***, ** denotes statistical significance at 99%, 95% and 90% confidence level, respectively. # Purchase price in INR 1000. Blank cells indicate statistically insignificant heterogeneity around the mean of random parameter.
Table 10.
Coefficient estimates of ML4 model and derived WTP values.
| Attributes | ML4 (Average Daily Trip Length Heterogeneity) | WTP Values | |
|---|---|---|---|
| TL1 | TL2 | ||
| Random parameter [Coefficient (t-statistics)] | |||
| Fuel cost reduction | 0.0267 *** (5.46) | 7417 | 4222 |
| Electric range | 0.0197 *** (7.19) | 5472 | 2306 |
| Public charging station | 0.0056 *** (4.25) | 1556 | 1556 |
| Battery recharging time | −0.1720 *** (−6.22) | 47,778 | 47,778 |
| Battery warranty | 0.0997 ** (2.35) | 27,694 | 27,694 |
| Tailpipe emission | −0.0183 *** (−4.84) | 5083 | 5083 |
| Non-random/Fixed parameter [Coefficient (t-statistics)] | |||
| Purchase price # | −0.0036 *** (−12.09) | ||
| Heterogeneity around the mean of random parameter | |||
| Fuel cost reduction | −0.0115 * (−1.88) | ||
| Electric range | −0.0114 *** (−3.27) | ||
| Public charging station | |||
| Battery recharging time | |||
| Battery warranty | |||
| Tailpipe emission | |||
| Goodness of fit | |||
| Log-likelihood function | −661.0849 | ||
| Adjusted ρ2 | 0.2189 | ||
| Sample size | |||
| Number of Respondents | 415 | ||
| Number of Observations | 1245 | ||
***, **, * denotes statistical significance at 99%, 95% and 90% confidence level, respectively. # Purchase price in INR 1000. Blank cells indicate statistically insignificant heterogeneity around the mean of random parameter.
Table 11.
Alternative scenarios considered to study the marginal effects.
| Attributes | Base | Alt-1 | Alt-2 | Alt-3 | Alt-4 | Alt-5 | Alt-6 | Alt-7 | Alt-8 | Alt-9 | Alt-10 | Alt-11 | Alt-12 | Alt-13 | Alt-14 |
|---|---|---|---|---|---|---|---|---|---|---|---|---|---|---|---|
| Purchase price (in INR1000) | 1250 | 1500 | 1750 | 1250 | 1250 | 1250 | 1250 | 1250 | 1250 | 1250 | 1250 | 1250 | 1250 | 1250 | 1250 |
| Fuel cost reduction | 20 | 20 | 20 | 40 | 60 | 20 | 20 | 20 | 20 | 20 | 20 | 20 | 20 | 20 | 20 |
| Electric range | 30 | 30 | 30 | 30 | 30 | 60 | 90 | 30 | 30 | 30 | 30 | 30 | 30 | 30 | 30 |
| Public charging station | 20 | 20 | 20 | 20 | 20 | 20 | 20 | 60 | 100 | 20 | 20 | 20 | 20 | 20 | 20 |
| Battery recharging time | 7 | 7 | 7 | 7 | 7 | 7 | 7 | 7 | 7 | 3 | 1 | 7 | 7 | 7 | 7 |
| Battery warranty | 3 | 3 | 3 | 3 | 3 | 3 | 3 | 3 | 3 | 3 | 3 | 5 | 8 | 3 | 3 |
| Tailpipe emission | 75 | 75 | 75 | 75 | 75 | 75 | 75 | 75 | 75 | 75 | 75 | 75 | 75 | 50 | 25 |
Publisher’s Note: MDPI stays neutral with regard to jurisdictional claims in published maps and institutional affiliations. |
© 2021 by the authors. Licensee MDPI, Basel, Switzerland. This article is an open access article distributed under the terms and conditions of the Creative Commons Attribution (CC BY) license (https://creativecommons.org/licenses/by/4.0/).
Share and Cite
MDPI and ACS Style
Bera, R.; Maitra, B. Analyzing Prospective Owners’ Choice Decision towards Plug-in Hybrid Electric Vehicles in Urban India: A Stated Preference Discrete Choice Experiment. Sustainability 2021, 13, 7725. https://doi.org/10.3390/su13147725
AMA Style
Bera R, Maitra B. Analyzing Prospective Owners’ Choice Decision towards Plug-in Hybrid Electric Vehicles in Urban India: A Stated Preference Discrete Choice Experiment. Sustainability. 2021; 13(14):7725. https://doi.org/10.3390/su13147725
Chicago/Turabian StyleBera, Reema, and Bhargab Maitra. 2021. "Analyzing Prospective Owners’ Choice Decision towards Plug-in Hybrid Electric Vehicles in Urban India: A Stated Preference Discrete Choice Experiment" Sustainability 13, no. 14: 7725. https://doi.org/10.3390/su13147725
Note that from the first issue of 2016, this journal uses article numbers instead of page numbers. See further details here.