
Monitoring System for Tracking a PV Generator in an Experimental Smart Microgrid: An Open-Source Solution


Department of Electrical Engineering, Electronics and Automation, University of Extremadura, Avenida de Elvas, s/n, 06006 Badajoz, Spain
*
Author to whom correspondence should be addressed.
Sustainability 2021, 13(15), 8182; https://doi.org/10.3390/su13158182
Submission received: 7 July 2021
/
Revised: 13 July 2021
/
Accepted: 20 July 2021
/
Published: 22 July 2021
(This article belongs to the Special Issue Innovative Advances in Monitoring, Control, and Management of Microgrids)
Abstract
:Smart grids and smart microgrids (SMGs) require proper monitoring for their operation. To this end, measuring, data acquisition, and storage, as well as remote online visualization of real-time information, must be performed using suitable equipment. An experimental SMG is being deployed that combines photovoltaics and the energy carrier hydrogen through the interconnection of photovoltaic panels, electrolyser, fuel cell, and load around a voltage bus powered by a lithium battery. This paper presents a monitoring system based on open-source hardware and software for tracking the temperature of the photovoltaic generator in such an SMG. In fact, the increases in temperature in PV modules lead to a decrease in their efficiency, so this parameter needs to be measured in order to monitor and evaluate the operation. Specifically, the developed monitoring system consists of a network of digital temperature sensors connected to an Arduino microcontroller, which feeds the acquired data to a Raspberry Pi microcomputer. The latter is accessed by a cloud-enabled user/operator interface implemented in Grafana. The monitoring system is expounded and experimental results are reported to validate the proposal.
1. Introduction
Given the natural availability of renewable energy sources, the gap between generation and consumption is being tackled through decentralization of resources and intense research into energy storage. This motivation has been empowered by the unstoppable growth of information and communications technologies (ICTs), giving birth to the energy networks of the, not-so-far future—the so-called smart grids (SGs). SGs are conceived as modern electric power grids for improved efficiency, reliability, and safety, with smooth integration of renewable and distributed energy sources through automated and distributed controls and modern communications and sensing technologies [1]. In a similar sense, microgrids (MGs) can be defined as groups of energy resources—both renewable and/or conventional—and loads located and interconnected in a physical area that appear as a single entity to the alternating current (AC) electric grid [2]. A small-scale SG, autonomous or grid-tied, is a smart microgrid (SMG) [3]. SMGs are supposed to play a key role in the evolution of SGs, becoming prototypes for SG sites of the future [4].
Particularly, photovoltaic (PV) generators acquire special relevance in SGs and SMGs, due to the fact that they are commonly the main source of renewable energy in this type of system. Wind generators can provide enormous amounts of energy, but still present problems of predictability [5].
With regard to energy storage in SGs and SMGs, in the short term it is common to use batteries [6] or supercapacitors [7]. On the other hand, hydrogen constitutes an energy carrier noted for long-term storage to support renewable energies [8,9,10].
Deploying SMGs is a challenging task that requires power-dispatching decisions as well as proper monitoring of all of the involved parameters [11]. In this regard, the monitoring of SGs and SMGs is a paramount task frequently highlighted in scientific literature [12,13]. For instance, in [12], a remote monitoring platform was developed integrating an industrial controller and an open-source interface in order to continuously track the operation of an SMG based on renewable energy sources and hydrogen. In [13], a comprehensive survey about the visualization of data for the control and monitoring of SGs is presented; in this work, it is asserted that visualization plays a key role in facilitating the tasks of monitoring, analysing, and responding to events in SGs.
In particular, the implementation of distributed monitoring and control systems is noted as one of the main challenges in the SG scenario [14]. Moreover, serious expenses must be devoted to the aforementioned technologies for proper sensing, control, and monitoring. Conventional supervisory systems for microgrids are expensive due to the need for data loggers, controllers, sensors, and other devices [15]. In fact, over the past decade, low-cost solutions have been considered to be a priority, proposing different monitoring and communications systems [16]. In this regard, an ever-growing trend consists ofof using open-source systems for both hardware and software, which facilitate the completion of such tasks through low-cost, easy-to-use, and community-supported tools [17]. As Pereira et al. [18] assert, recent literature about open-source applications shows versatility, applicability, usability, compactness, affordability, and available support from creators and the user community.
In fact, open-source tools are being progressively integrated in advanced scenarios such as the Internet of Things (IoT) [19], big data [20], remote laboratories [21], smart cities [22], the Industrial Internet [23], and SMG monitoring [12,24]. An example of institutional support to open-source systems is FIWARE [25]—a cloud platform of a collaborative nature promoted by the European Commission.
In the context of renewable energy, SGs and SMGs constitute a worthy domain to which to apply open-source technology [17]. The microcontroller Arduino [26] and the microcomputer Raspberry Pi (RPi) [27] are the most illustrative open-source hardware devices today, with thousands of projects on the web.
This paper presents a monitoring system based on open-source hardware and software. This system is devoted to monitoring the temperature of the PV generator of an SMG, using digital temperature sensors connected to an Arduino board. The gathered data are supplied to an RPi microcomputer, where they are recorded in the form of a database. These devices communicate through an Ethernet-based network. The stored information is visualized by a remote online user/operator by means of a web-based interface implemented in Grafana.
1.1. State-of-the-Art
In scientific fields, recent examples of using Arduino and RPi in the energetic context are here described in order to emphasize the interest that these tools generate. Arduino has been profusely applied for measurement tasks. In [28], an Arduino microcontroller was applied to measure hydrogen fuel cells’ voltage, while a graphical user interface (GUI) displayed information to the user. The temperature of PV modules was measured with the inexpensive analogue sensor LM35 and Arduino, to be displayed in an industrial supervisory system in [29]. In [30], a fully functional data logger for PV systems was implemented using Arduino.
To sense photovoltaic-related magnitudes, RPi has been also applied—for instance, in [18], where a cloud-enabled monitoring system was proposed and validated. A database hosted in the cloud is responsible forfor accumulating data gathered by the microcomputer, while a PHP-based web interface feeds information to the user. In this case, the connection between the device for data acquisition and the RPi is performed by means of serial communication, which is less advantageous in comparison with an Ethernet-based network in terms of scalability and wire lengths. The database is hosted in a paid server, which causes an obvious cost as well as dependence on the hosting platform.
Furthermore, we will discuss some research papers dealing with approaches that combine Raspberry Pi and Arduino. In [31], the authors proposed using open-source hardware and software to deploy sensors and actuators oriented towards remote laboratories. In this case, data exchange between the Arduino chip and the RPi is established via USB interface. The information is displayed to the user by means of an interface designed with the open-source authoring tool Easy Java Simulations.
With the focus put on charging electric vehicles and blockchain technology, [32] proposed an architecture where Arduino acts as the sensors’ data acquisition unit, and RPi as a management unit. Their data exchange can be carried out by Wi-Fi or Ethernet; information is logged into a MariaDB database and displayed with a dashboard developed in Angular.
RPi and Arduino were linked via radio in [15] in order to implement a low-cost system devoted to supervising diverse magnitudes of a microgrid, including photovoltaics and wind energy. Retrieved data were stored in a cloud database and accessed by means of a web interface based on HyperText Markup Language version 5 (HTML5). Specifically, the communication between the RPi and the server where the database was hosted (Plesk) was performed via a 3G modem. This linkage has the disadvantages of costs and mobile coverage concerning the wireless connection, as well as dependence on Plesk servers.
For the monitoring of PV facilities, the authors of [16] applied a low-cost solution based on Arduino and RPi, with the former dedicated to collecting electrical and environmental data, and the latter to acting as a gateway. Both devices communicated via radio, and the shared data were stored in a cloud database so as to enable the user to monitor the facility through a web application based on EmonCMS. It must be noted that using the hosting services of this platform has a low annual fee. Consequently, this scheme gives rise to dependence on EmonCMS servers. An issue with EmonCMS is related to the software used to manage the data storage; while Grafana is compatible with a broad variety of database management systems, EmonCMS does not specify the type of data storage. This is a drawback that limits data exchange with other systems.
Indeed, in the market, the OpenEnergyMonitor project [33] develops and sells pre-assembled units based on RPi and Arduino for monitoring electricity, temperature, and humidity.
With respect to the visualization interface, Grafana is an open-source web platform [34] devoted to monitoring and analysing data from IoT devices. It is being used in emerging domains like the IoT [35], and increasingly applied to display real-time data in research approaches. For example, [35] reports the utilization of an RPi for data acquisition with a pyranometer, and for sending such data to a Docker-hosted database (InfluxDB). In this case, Grafana is applied for online visualization of the gathered information. Another application case can be found in [36], where Grafana was used to display time series of temperature, humidity, solar radiation, etc., measured in a building monitored through an open-source proposal. In such a system, the data acquisition device is a customized PCB with various sensors, which sends the collected data via radio to an RPi. The microcomputer acts as a backhaul and gateway, transmitting to a database (InfluxDB) hosted by Docker.
The work in [37] presents a monitoring system for volcanic fumaroles using an Arduino to collect data from sensors whose measurements are sent through RS485 wire to an InfluxDB database in an RPi. The visualization is performed by means of Grafana, which is hosted in a private server.
The system reported in [38] also uses Grafana as a GUI installed in a private server, while a commercial web platform, called UWP 3.0, gathers measurements of a PV plant. In addition, an RPi acts as a gateway between the UWP and a database (InfluxDB) hosted in the aforementioned server.
For purposes of comparison, Table 1 shows a summary of the most relevant features of related publications. The category Communication refers to the data exchange between the data acquisition device and the RPi.
1.2. Contribution of the Work
With respect to Table 1, it must be noted that this manuscript does not present new technology; on the contrary, the proposed system is an aggregation of already existent technologies combined under a different perspective and applied to a challenging facility—a smart microgrid. The goal was to solve the drawbacks or limitations that other similar approaches present, as well as to provide an alternative framework suitable for other facilities. Indeed, the aforementioned papers do not study the operation of the RPi in terms of computational resources, which is essential to determine the feasibility of the approaches. Furthermore, as can be seen in the table, in most of the surveyed previous works, the RPi is used as gateway between the data acquisition device and the external servers where the databases are hosted. However, the monitoring system presented here is the only proposal that uses the RPi to host both the database and the visualization manager (Grafana).
There are a lot of papers dealing with applications of open-source equipment, but many of them are validated under laboratory conditions or for short-term use. However, it is necessary to test and evaluate open-source technologies in an integrated and realistic manner, in order to demonstrate their suitability and functionality.
A noteworthy remark is that the SMG to which the monitoring system is applied was developed within an ongoing research and development (R&D) project that also deals with the development of its digital replica (DR). In this context, there is a need for massive data acquisition and storage, collecting all of the significant variables of the components of the energetic system. The construction of a DR relies on the gathered data, which will be analysed and processed. Therefore, the goal of this paper is to evaluate and encourage the usage of open-source technologies to facilitate the implementation of the SMG, and the associated data management to develop its DR.
The major contributions of this work are as follows:
- A solution fully based on open-source technologies to implement a PV monitoring system is presented. The proposal integrates existent open-source technologies, overcoming the drawbacks of previous works and, additionally, the RPi is responsible forfor hosting the database and the visualization web platform. The latter is a novelty in scientific literature;
- The computational resources of the RPi are also monitored, and experimental results for the operation of the whole SMG are reported. The suitability of the RPi and, consequently, of the monitoring system, is proven for long-term continuous operation;
- The proposal is deployed on a layered hierarchical framework with flexibility and scalability features. Real-time data exchange and online visualization through a user-friendly interface are effectively achieved;
- The monitoring system is entirely functional, with a low-cost nature, and there are no dependencies on software licenses or on external web servers. Further improvements are based on updates to the open-source software and hardware components;
- Successful experimental results are reported together with technological details and requirements in order to make the involved technologies more applicative, contributing to the next step of implementation.
The structure of the rest of the article is as follows: The second section deals with the description of the SMG’s main components, as well as the hardware and software involved. In the third section, the developed monitoring system is expounded, describing the open-source hardware and software entities that comprise it. The achieved experimental results are reported and discussed in the fourth section. Finally, the key conclusions of the research are addressed.
2. Materials and Methods
In this section, firstly, the SMG to which the monitored PV generator belongs is described, paying special attention to the energetic components. The second subsection describes the hardware and software elements used to implement the monitoring system.
2.1. SMG Description
The SMG consists of a direct current (DC) microgrid that integrates photovoltaic energy with hydrogen for islanded operation. It must be emphasized that DC microgrids are gaining popularity due to the fact that most electronic equipment needs DC power input and, hence, energy conversion losses are reduced [39].
With respect to generation, a PV generator is composed of a set of 6 monocrystalline modules, each one consisting of 72 solar cells. Each panel has a nominal voltage of 24 V and a maximum output of 185 W. These modules are connected in pairs in series, and the resulting three pairs are connected in parallel, achieving a total power of around 1100 W. Another generator consists of a polymer electrolyte fuel cell (FC) that converts hydrogen into electricity. An air-fed and air-cooled stack composed of 24 cells, with a maximum power of 500 W, is dedicated to this task.
Before describing the consumption equipment, the energy storage means are expounded. For short-term storage, a lithium-ion battery is used. In particular, a battery of 2.56 kWh and nominal voltage of 51.2 V comprises the DC bus. This type of battery is expected to play a paramount role in energy sustainability, supporting the integration of PV and wind energy for short-term energy storage [40].
On the other hand, the energy carrier hydrogen acts as a means of long-term energy accumulation. As a storage device, a metal hydride canister is used. In fact, the high expenses required for hydrogen storage constitute a persistent obstacle for the large-scale application of hydrogen technology [9]. This device accumulates the hydrogen generated by the electrolyser (EL), and provides it to the FC.
The consumer role is played by two devices: The first is a polymer electrolyte electrolyser, which is fed by the DC bus to generate hydrogen. This hydrogen generator can require up to 540 W, and provides a purity of 99.9999%. The other consumer is a programmable electronic load connected to be supplied by the DC bus; we use a Prodigit Electronics model 32612 (New Taipei City, Taiwan). Different load profiles are configured in this device in order to test the operation of the SMG.
Furthermore, diverse DC–DC converters are required to adapt voltage levels between generation and consumption equipment and the DC bus. A solar charger with maximum power point tracking (MPPT) is used to connect the PV generator and the battery. Additionally, a buck converter is applied to feed the EL from the DC bus, while a boost converter is used to connect the FC to the bus. Figure 1 shows a block diagram depicting the layout of the described components.
2.2. Hardware and Software Components
In this subsection, the different components that comprise the monitoring system are briefly described. At the hardware level, the used devices are described below.
Arduino consists of a prototyping platform devoted to electronics and control applications. An ATmega microcontroller is provided with circuitry for sensors and actuator connections as well as means of communication, all assembled in a printed circuit board (PCB). Moreover, the so-called shields are expansion modules that provide additional functionality, such as connection of 4–20 mA sensors, data recording, advanced communication (Ethernet, ZigBee, etc.), data storage, and so forth. This open-source platform was originally designed and manufactured in Italy in 2005.
In particular, the Arduino MEGA 2560 R3 board model is based on an ATmega2560 microcontroller; it includes 54 digital input/output (I/O) ports and 16 analogue inputs. A model W5100 shield provides Ethernet connectivity, and is mounted over the main board. This shield is connected to the microcontroller via the serial peripheral interface (SPI) bus.
RPi is a card-sized microcomputer developed in 2012 by the Raspberry Pi Foundation of Cambridge University, with educational orientation. This initial goal was extended to a great number of applications due to the advantages in terms of low cost, full customization, and excellent scalability [16]. This single-board computer provides huge computation resources, and has the ability to connect to sensors and actuators. Concerning wired communications, it includes the so-called general purpose input/output (GPIO) pins, which can be configured as input or output, as well as supporting communications protocols such as serial, inter-integrated circuit (I2C), and SPI. Ethernet and USB ports are also available. For wireless linkage, Bluetooth and Wi-Fi can be used.
The model 3 version B has been selected for the purposes of this research. A 1.2 GHz Broadcom quad-core processor and a random-access memory (RAM) of 1 GB are the main features of this model; moreover, USB 2.0 and 100 base Ethernet ports are mounted on it. In addition, for the proposal, an SD card hosts the Linux-based operating system (OS) of the RPi, while a flash drive is used for data backup.
A DC–DC converter is required to provide a stable and accurate supply of 5.3 V to the RPi; the LM2596 DC–DC step-down module is used. A DS3231 AT24C32 IIC real-time clock is used to establish the interval for data acquisition; additionally, it is used to obtain the proper time and date in case of losing connection to the Internet.
To avoid issues with self-heating in RPi, a mechanical ventilation system is included for cooling; it consists of a fan which, together with a passive cooling system (a heatsink), keeps the temperature of the board in a proper range.
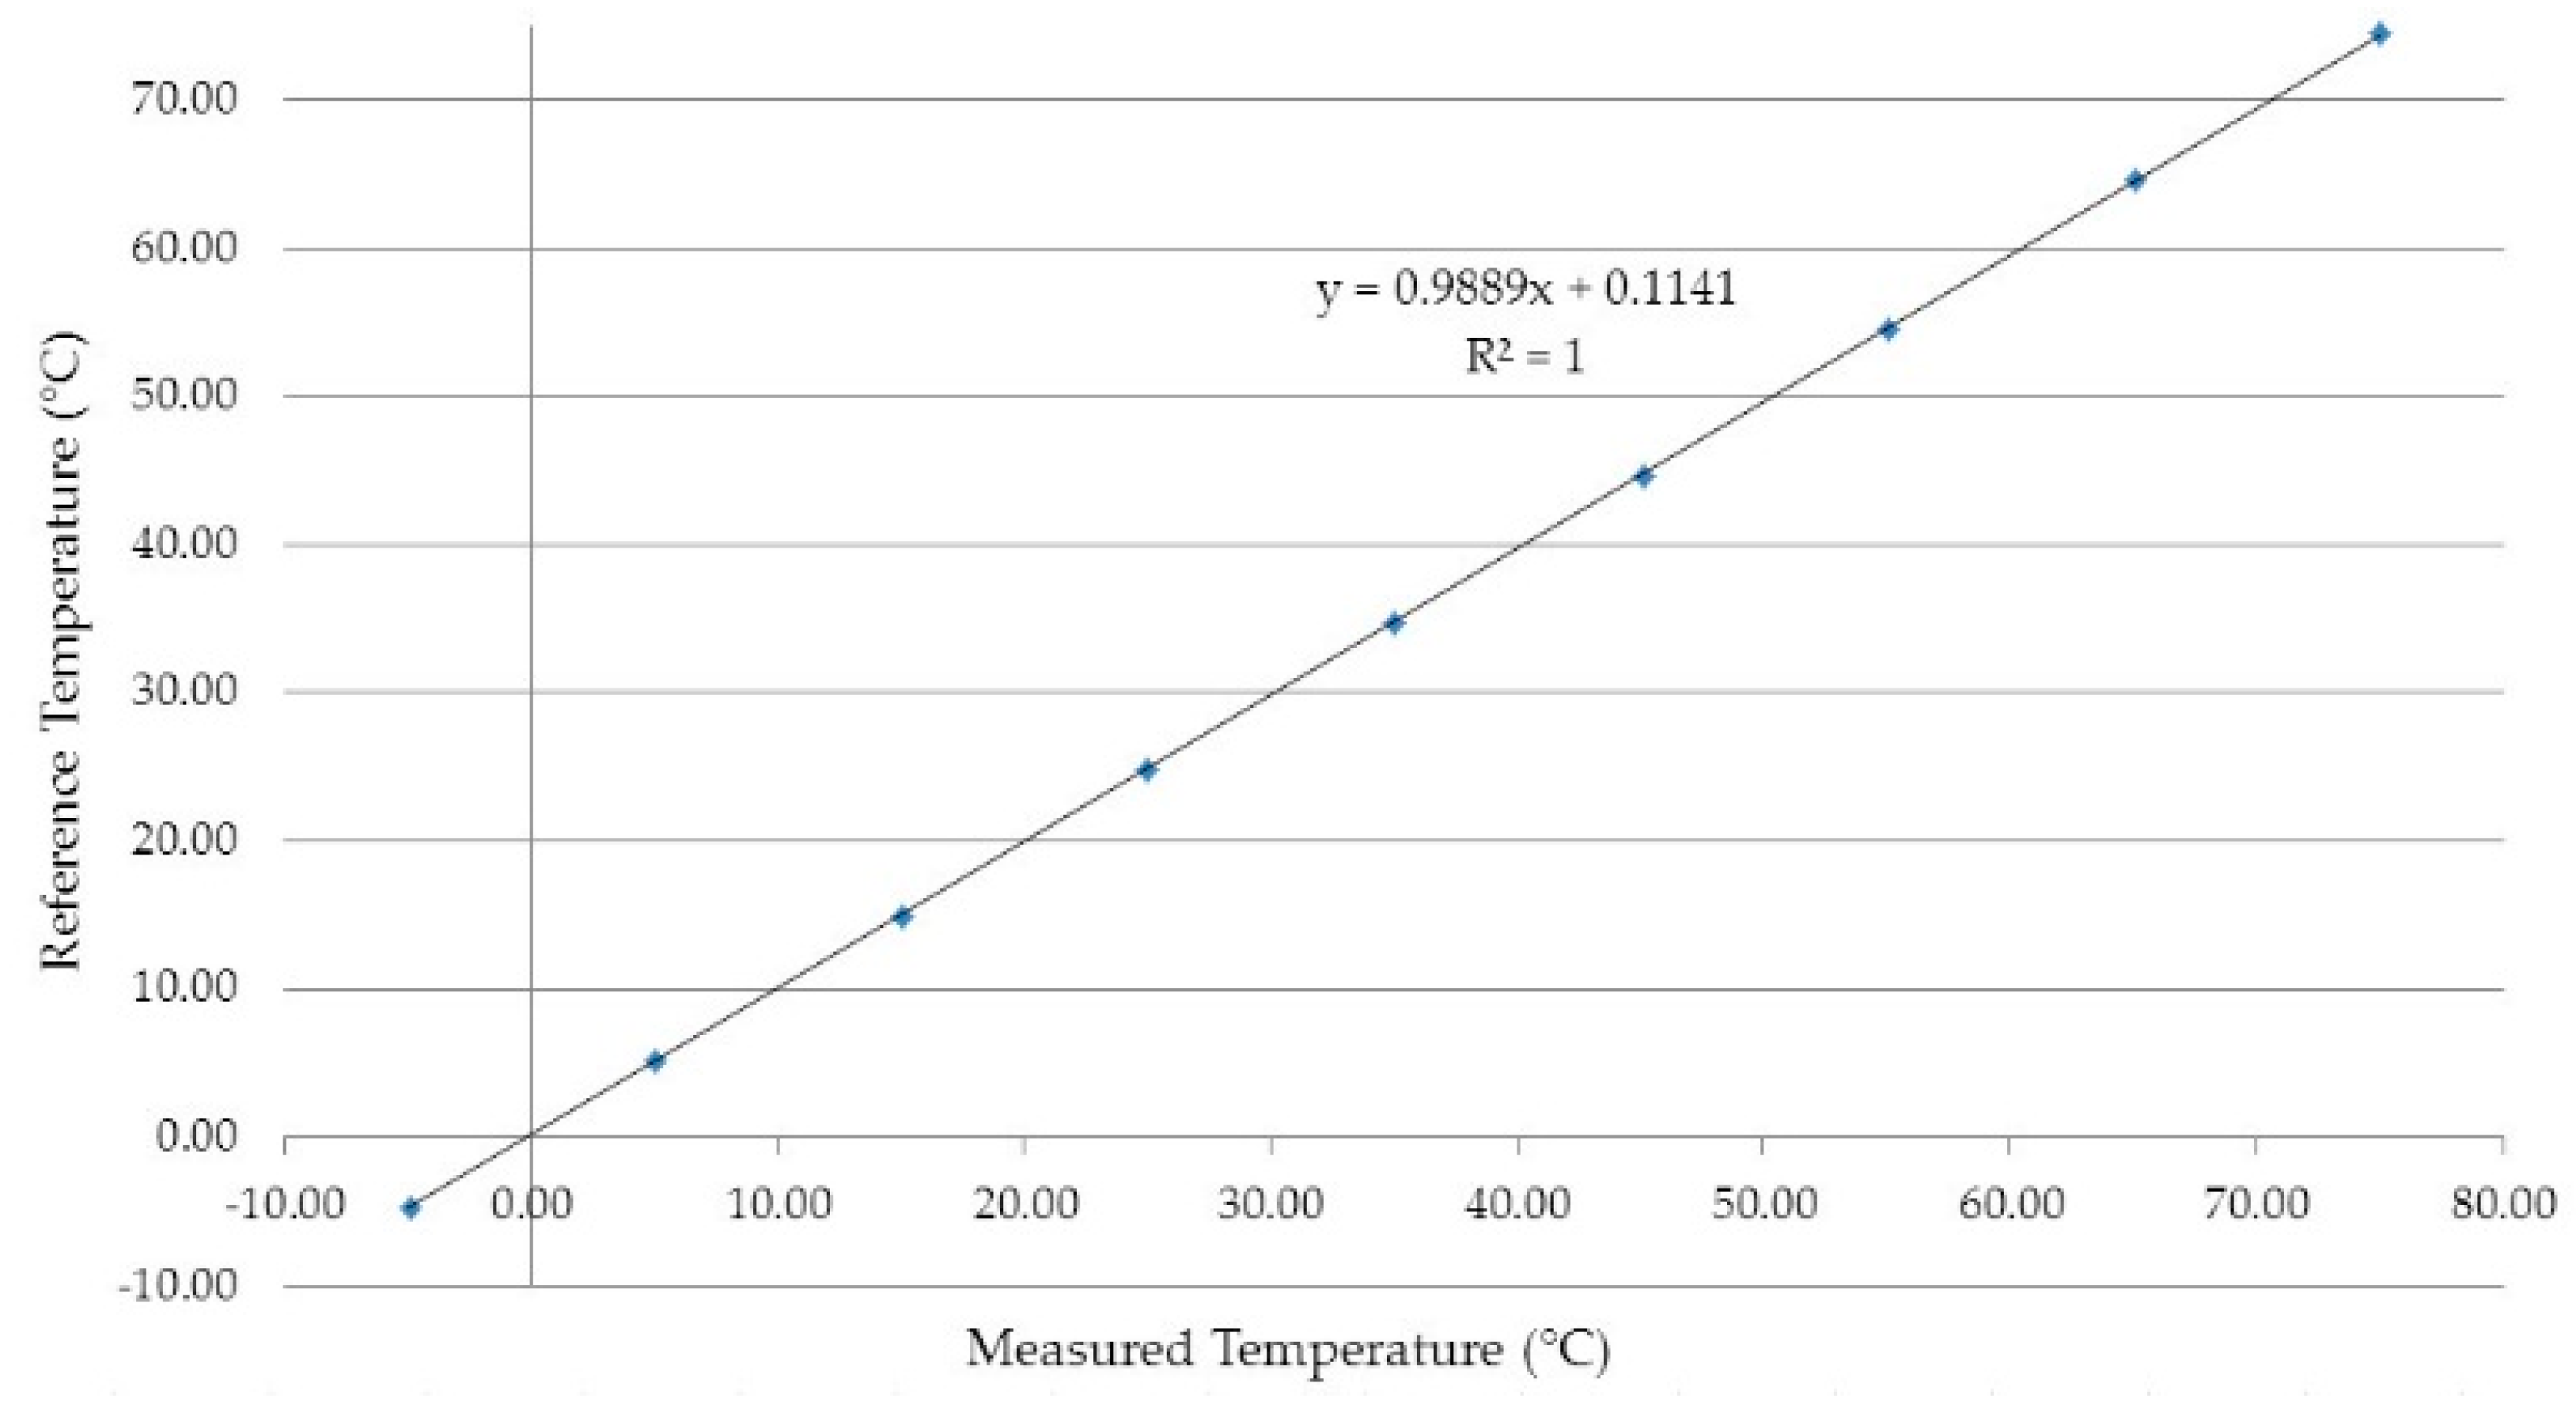
Relating to sensing tasks, in order to monitor the PV panels, digital temperature sensors are used. In the presented system, the temperature of the PV modules is measured using DS18B20 sensors from Maxim Integrated (San Jose, CA, USA) [41]. This device is a low-cost and easy-to-use digital sensor typically used for Arduino-related developments, which has been previously reported in scientific literature [42,43,44,45]. This probe consists of a digital temperature sensor that communicates with a master unit, a microcontroller, or a microprocessor, using a single digital pin, i.e., over a 1-Wire bus. This sensor measures from −55 °C to 125 °C, with a ±0.5 °C accuracy over a temperature range from −10 °C to 85 °C. The supply voltage ranges between 3.3 V and 5.0 V, and provides a 9-bit to 12-bit resolution. The data wire of the sensor bus is connected to a digital input port of the Arduino. These sensors were calibrated in the laboratory using accurate temperature calibration equipment—the 518 dry-block calibrator by Fluke (Eindhoven, the Netherlands, Europe). The sensors were studied in a temperature range from −5 °C to 75 °C. A reference temperature probe—the Fluke 1560 Black Stack—was used for comparison. All of the sensors show stable and linear behaviour, so the calibration results are used in the Arduino code to adjust the measurement signal given by each sensor. As a proof of concept, the calibration results of a sensor are depicted in Figure 2, where the temperature measured by the sensor is plotted with the corresponding reference temperature.
An Ethernet switch is used to connect the Arduino and the RPi, as well as to provide connectivity for remote visualization through the Grafana web interface. In particular, the Netgear GS308 unmanaged gigabit Ethernet switch was chosen; it includes 8 ports, and enables a transfer speed of up to 1 Gbit/s.
Concerning the open-source software, the following packages are involved: To program the Arduino device, the so-called integrated development environment (IDE) open-source package is used; this consists of a cross-platform application written in a simplified version of the C++ language, which can manage any Arduino board. It is executed via a PC, to which the microcontroller is linked through the universal serial bus (USB). Moreover, the libraries Ethernet, OneWire, and DallasTemperature are used to program the Arduino sketch for the developed monitoring system.
LAMP stands for the stack Linux, Apache, MariaDB, PHP, which provide an OS, a web server, a database management system using Structured Query Language (SQL), and a programming language, respectively. This set comprises the technologies commonly used to develop web applications, and is suitable to run on an RPi. These packages were not initially designed to work together; however, their joint usage provides a set of suitable and low-cost solutions.
The OS of the RPi is Raspbian, which is based on a Linux distribution named Debian. There are two versions: one with a graphic environment (Raspbian Buster with desktop), and another version with only a command line interface (Raspbian Buster Lite); The latter has been chosen for the purposes of this study.
Grafana provides a general-purpose dashboard as well as a graph composer to build GUIs in a flexible and easy-to-use manner. Moreover, this platform can access databases using a wide range of compatible database management systems (MariaDB, MySQL, Microsoft SQL server, InfluxDB, PostgreSQL, etc.). Grafana runs as a web application—so there is no need to install packages in the client side—and enables access from devices like personal computers (PCs), tablets, or smartphones.
3. Proposed Monitoring System
Before describing the open-source monitoring system, it is necessary to expound the conceptual framework that supports such a system. This conceptual framework is divided into five functional layers.
Figure 3 depicts this five-tier topology, conceived to integrate open-source hardware and software to deploy the monitoring system. The lower layer is the so-called ‘sensing layer’, composed of sensors placed in the physical asset devoted to sensing and measuring the variables required for monitoring purposes. In the present case, this layer hosts a set of temperature sensors placed in the PV panels of the SMG. The ‘data acquisition layer’ includes data acquisition devices to which sensors are connected, responsible for conditioning and processing the output signals of such sensors. An Arduino microcontroller implements this layer in the proposal of the paper. The third functionality is implemented by the ‘data storage layer’, which is in charge of accumulating the information received from the previous layer in a structured manner, mainly through databases. MariaDB (based on MySQL) is the database management system chosen for recording the information retrieved by the Arduino. In addition, this software is hosted by an RPi microcomputer. The top level corresponds to the ‘data visualization and analytics layer’, and comprises software applications dedicated to displaying real-time information to the user/operator for the proper tracking of the physical facility. The database of the data storage layer is queried by the entities of this level. For the developed system, Grafana is dedicated to this task, enabling online access to the sensed magnitudes by means of a web browser.
Finally, the ‘network communication layer’ covers the data exchange through the network between the previous layers—except for the sensing layer, because the sensing nodes are directly linked to the data acquisition device (Arduino). Specifically, an Ethernet-based network is used for communication between the RPi and Arduino boards. Transmission control protocol/Internet protocol (TCP/IP) is used for identification and information exchange over this network.
As can be observed, this framework is not specifically oriented to open-source equipment, but it can accommodate both proprietary and open-source technologies—a hybrid approach.
From the authors’ viewpoint, using the servers owned by service providers—for example, Docker, or other hosting platforms—creates dependencies, so an independent system is preferable. In other words, hosting in one’s own servers implies a total control of administration aspects, even isolating from failure events due to external factors (network connectivity or server crashes). For this reason, in the present solution, the Grafana package has been installed in the RPi itself in order to eliminate the dependence on cloud servers owned by Grafana. This also allows the creation of backup copies, both locally and remotely (cloud), which prevents data loss if there are communication failures, and makes the system more reliable [46]. The computational capabilities of the RPi allow the performance of both functionalities, and further new versions of this device increase these capabilities.
This proposal uses wired Ethernet communication due to the fact that it provides a more stable data exchange in comparison with wireless options. Interference due to building/constructive structures and cyber security vulnerabilities are reduced or eliminated using a wired linkage. As pointed out in [18], wireless technologies are preferred for decentralized systems, whereas Ethernet-based networks are a suitable alternative for centralized systems. Nevertheless, wired means can be easily changed by wireless connectivity in the proposed monitoring system. In the case of Arduino, a chip with on-board wireless capability, or a shield, can be configured without altering the rest of the system. Indeed, the RPi has embedded wireless connectivity. This transition towards wireless communication would not alter the proposed monitoring system—only the so-called network communication layer.
Figure 4 schematically portrays the proposed monitoring system applied to the panels of the PV generator, in accordance with the previous framework, but also illustrating the physical distribution of the components.
As Pereira et al. [18] assert, most of the data acquisition and monitoring systems for plants involving renewable energies are implemented in LabVIEW running on a PC, so only local monitoring is possible. Moreover, expensive licenses are required along with commercial data acquisition equipment. These limitations must be overcome in order to stimulate the real implementation of SMGs. To avoid the limitation of local monitoring, the developed system provides networked access from ubiquitous locations; this way, any user/operator of the facility can easily observe the most relevant information of the SMG’s status in real time, through a user-friendly interface.
At the first stage, the developed system is devoted to monitoring the temperature of the PV generator, but scalable to the other variables of the PV generator and elements of the SMG, such as the electrolyser and the fuel cell.
The flowcharts shown in Figure 5 portray the steps carried out for the operation of the monitoring system. Once the microcontroller is running (Figure 5a), it waits for an interrupt signal generated by the real-time clock. This signal indicates that the sensors’ data acquisition must be performed. To this aim, Arduino cyclically polls the sensors over the bus and receives the measurement. The following step consists of sending the retrieved data through the network, to the database hosted by the RPi. This information is made available for the remote user, whereas the Arduino returns to a waiting state until the next interrupt.
To enable the user/operator to visualize information about the PV generator (Figure 5b), a connection to the Grafana server is established via a web browser. The user has the ability to choose one of the available dashboards. Next, said dashboard queries the database for the corresponding registries. Consequently, a graphical chart is depicted in the interface, and the user is able to view time series and/or real-time numerical values in a user-friendly and responsive manner.
Using an Ethernet-based network to interconnect the nodes facilitates the replacement or addition of devices, especially given the fact that this kind of network is the prevalent trend for information technology (IT) and automation systems, as well as for IoT-enabled equipment [47,48].
The digital temperature sensors can be directly read by an RPi, simplifying the monitoring system, in a certain sense. However, using an Arduino for data acquisition objectives allows the abstraction of the database hosted in the RPi from the particular nature of the data source. In addition, using an Arduino facilitates the connection of other sensors that would require additional circuitry to be measured by the RPi. Moreover, including the data acquisition layer (Arduino) provides modularity and flexibility for introducing changes or repairs without the need to alter the data storage layer.
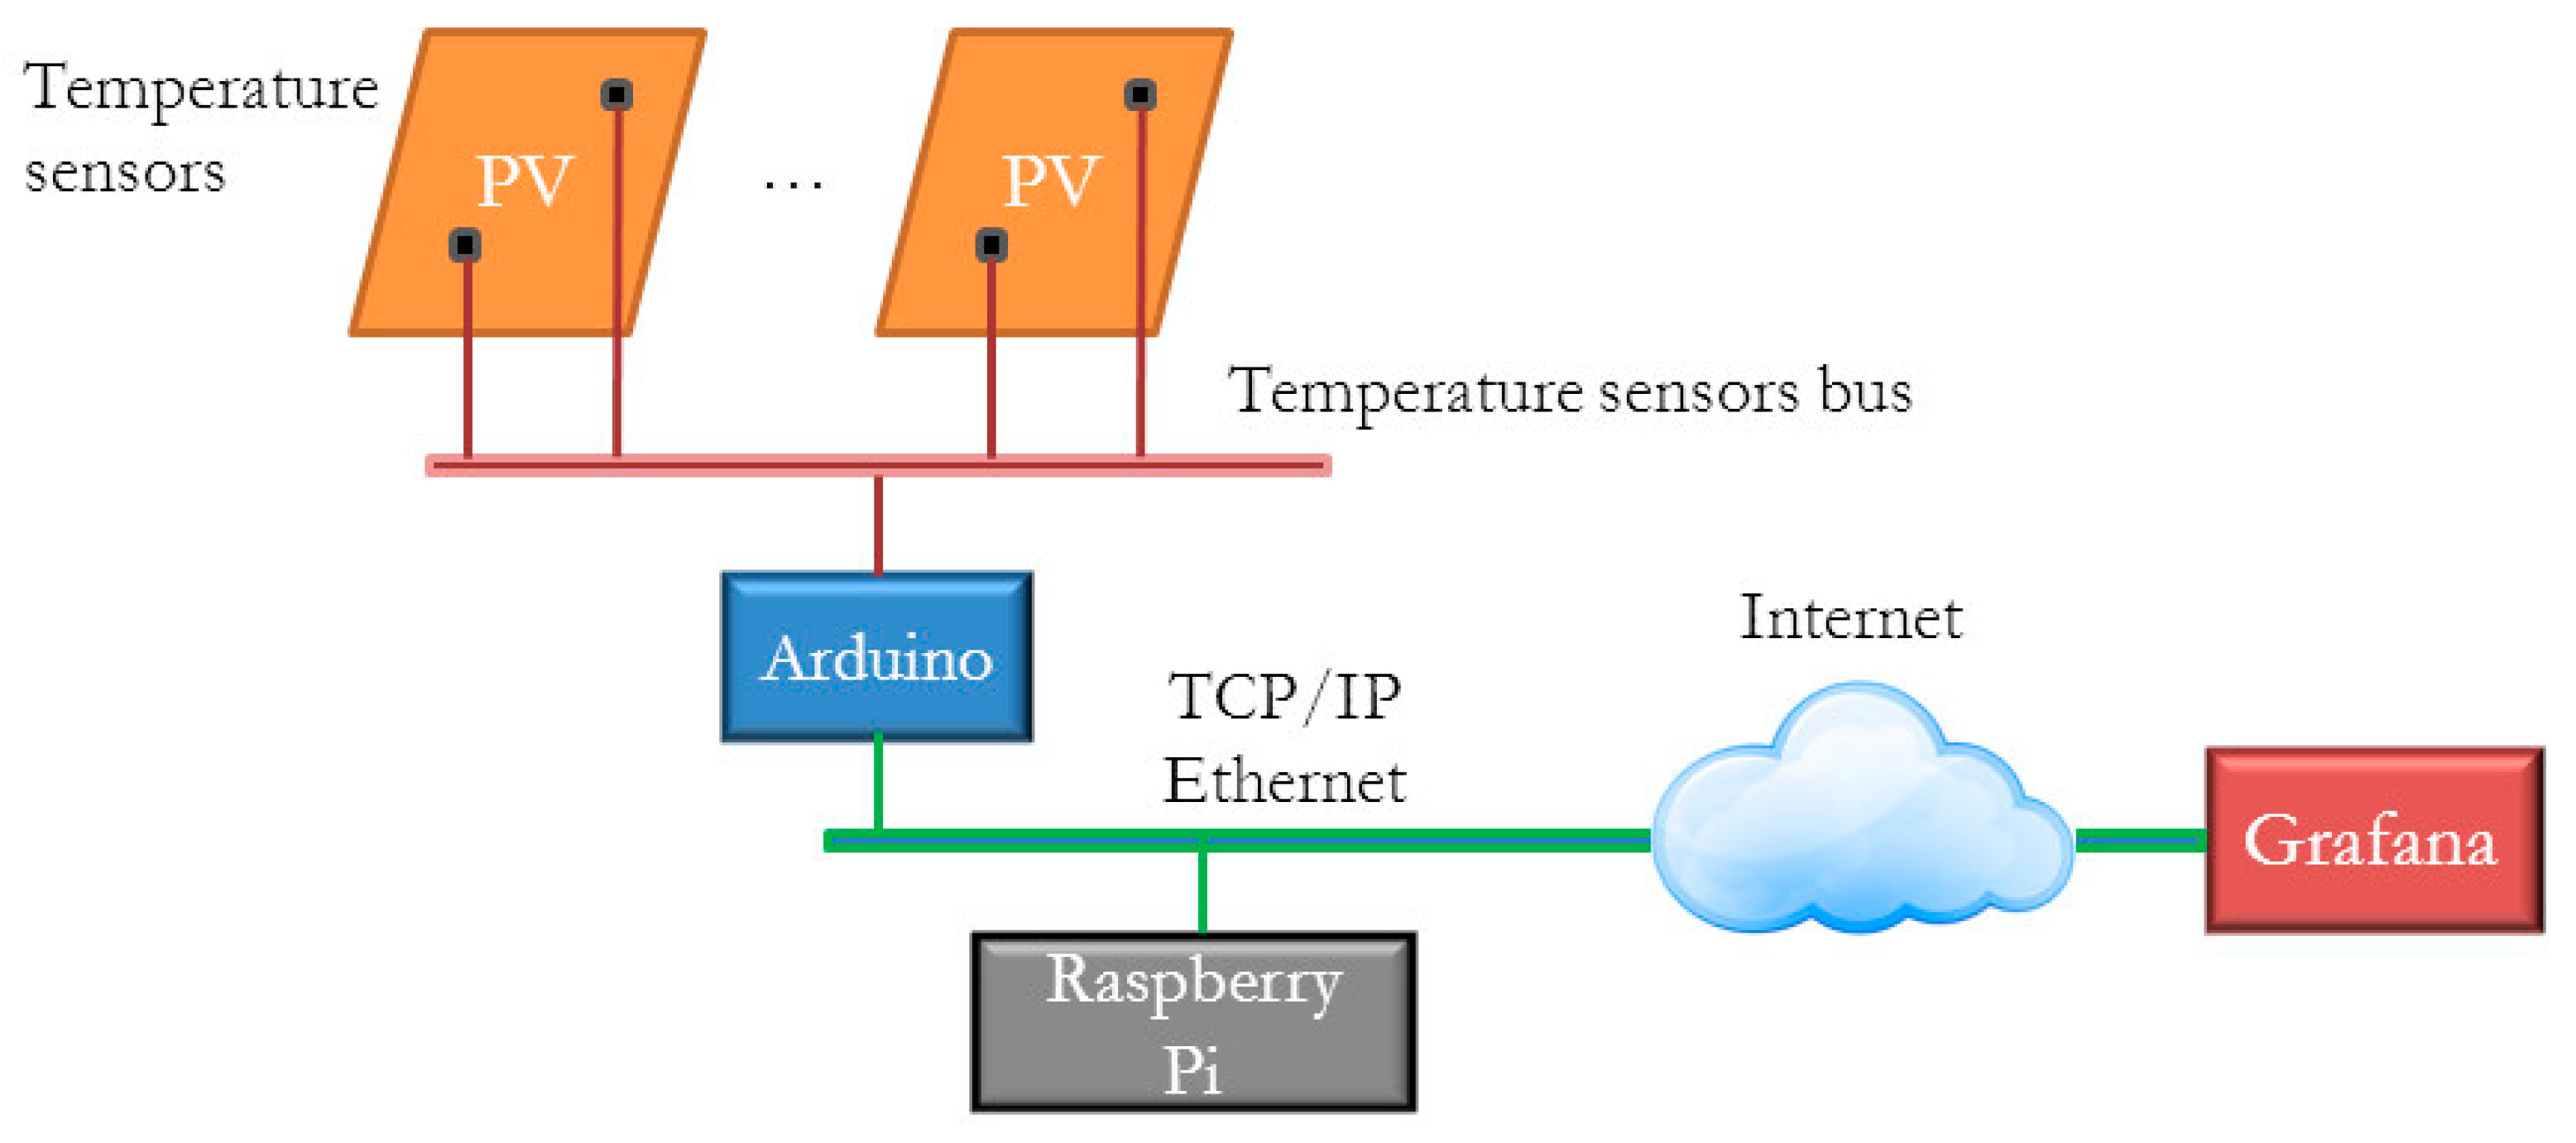
The scheme in Figure 6 depicts the interconnection of the involved devices. The RPi and the Arduino are linked through Ethernet, but this connection has not been included, because of its simplicity, in order to provide a more clear description of the rest of the connections. On the one hand, the 1-Wire bus of the 12 digital temperature sensors is observed on the right side of the image. The data from these sensors (yellow wire) are fed to a digital input port of the Arduino board for processing. Concerning the potentiometer, it acts as pull-up resistor for the sensors, and has been adjusted to 2.75 kΩ due to the distance between the sensors and the Arduino. The real-time clock is linked to the RPi through I2C GPIO pins. Another observable device is the DC–DC converter required for 5.3 V supply of the RPi, as mentioned in Section 2.2. Additionally, the fan for mechanical cooling of the RPi is continuously working, supplied with 5 V.
4. Results and Discussion
The achieved experimental results are reported in this section in order to show the feasibility of the developed monitoring system. Furthermore, the corresponding discussion is conducted in the second subsection.
4.1. Results
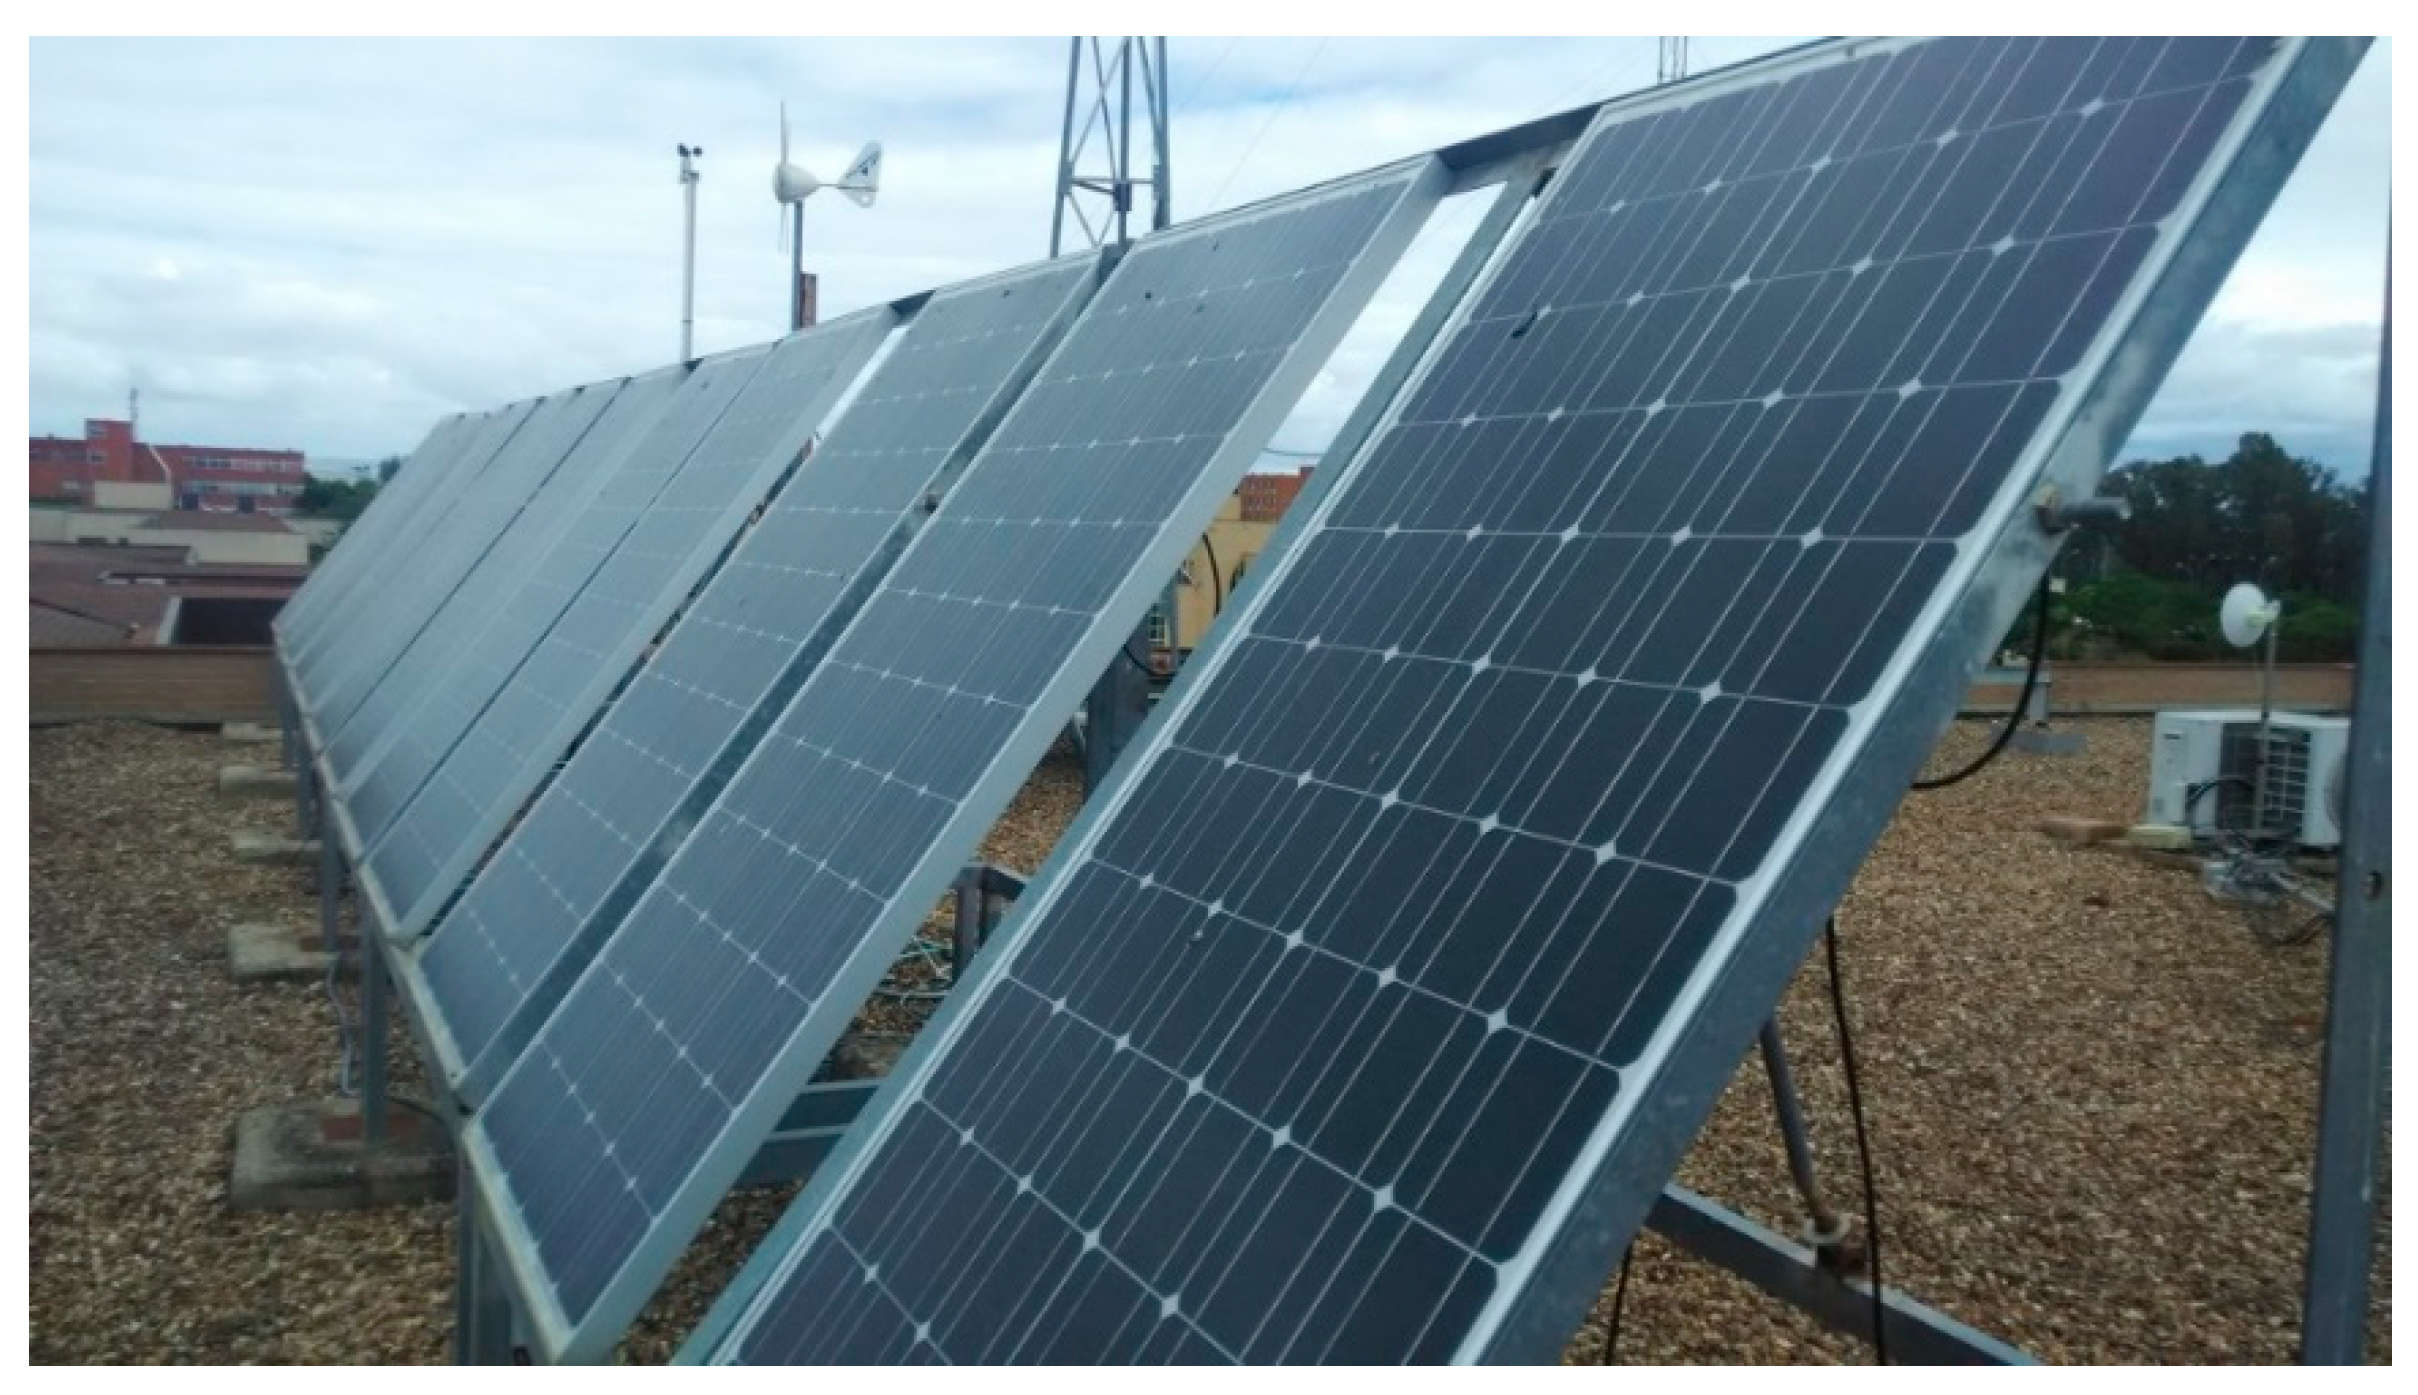
The PV generator of the SMG was mounted on the flat roof of the Industrial Engineering School of the University of Extremadura (Figure 7), while the rest of the equipment was placed in a laboratory.
The temperature sensors adhere to the back side of each PV panel. In particular, two sensors measure the temperature at two different points on each panel (see Figure 8). Thus, a total of 12 temperature sensors are connected to the sensor bus, sharing data with the Arduino board. Thermal grease is used as interface between the sensor and the panel, preventing air gaps and facilitating thermal conductivity. Finally, adhesive tape is responsible for fixing the sensor to the panel in a robust manner.
Figure 9 shows the experimental setup, where the used open-source components are interconnected. The main components of the proposed monitoring system are assembled on a perforated metal sheet. Other mounted elements of the SMG include the MPPT charger, and a human–machine interface (HMI) devoted to visualising the charging parameters of the battery and the PV generator in situ.
With regard to the storage of data from the sensors, in Figure 10 the aspect of the database devoted to the PV generator can be observed. The following fields have been defined: the identifier of the sample, the timestamp (including milliseconds), and the sensed temperatures (12 signals). As can be observed, the sample time is 1 min. This sampling time is enough to track the evolution of the measured variables. Nevertheless, if required, this time interval can be modified.
It must be remarked that, given the importance of the handled information, in order to prevent data losses, a backup strategy was implemented. In particular, a backup copy of the database is made every day at 2:00 p.m., by means of a flash drive. Moreover, for redundancy, an additional copy of the database is programmed every day at 2:30 p.m. through the Google Drive cloud. Note that all of the copies are compressed for better utilization of the storage devices.
The presented monitoring system was working autonomously from October 2019 to October 2020, as can be observed in Figure 11. Some out of range values are appreciated—for instance, in November 2019 or March 2020—due to hardware and software adjustments of the sensors. There are also certain intervals without data, as a consequence of hardware disconnections, as well as power outages caused by common tasks related to the maintenance of the laboratory infrastructure and the research. Nevertheless, it can be proven that the RPi was working in a stable manner over the long-term period. Even during the COVID-19 pandemic, the system was operating autonomously, without data losses.
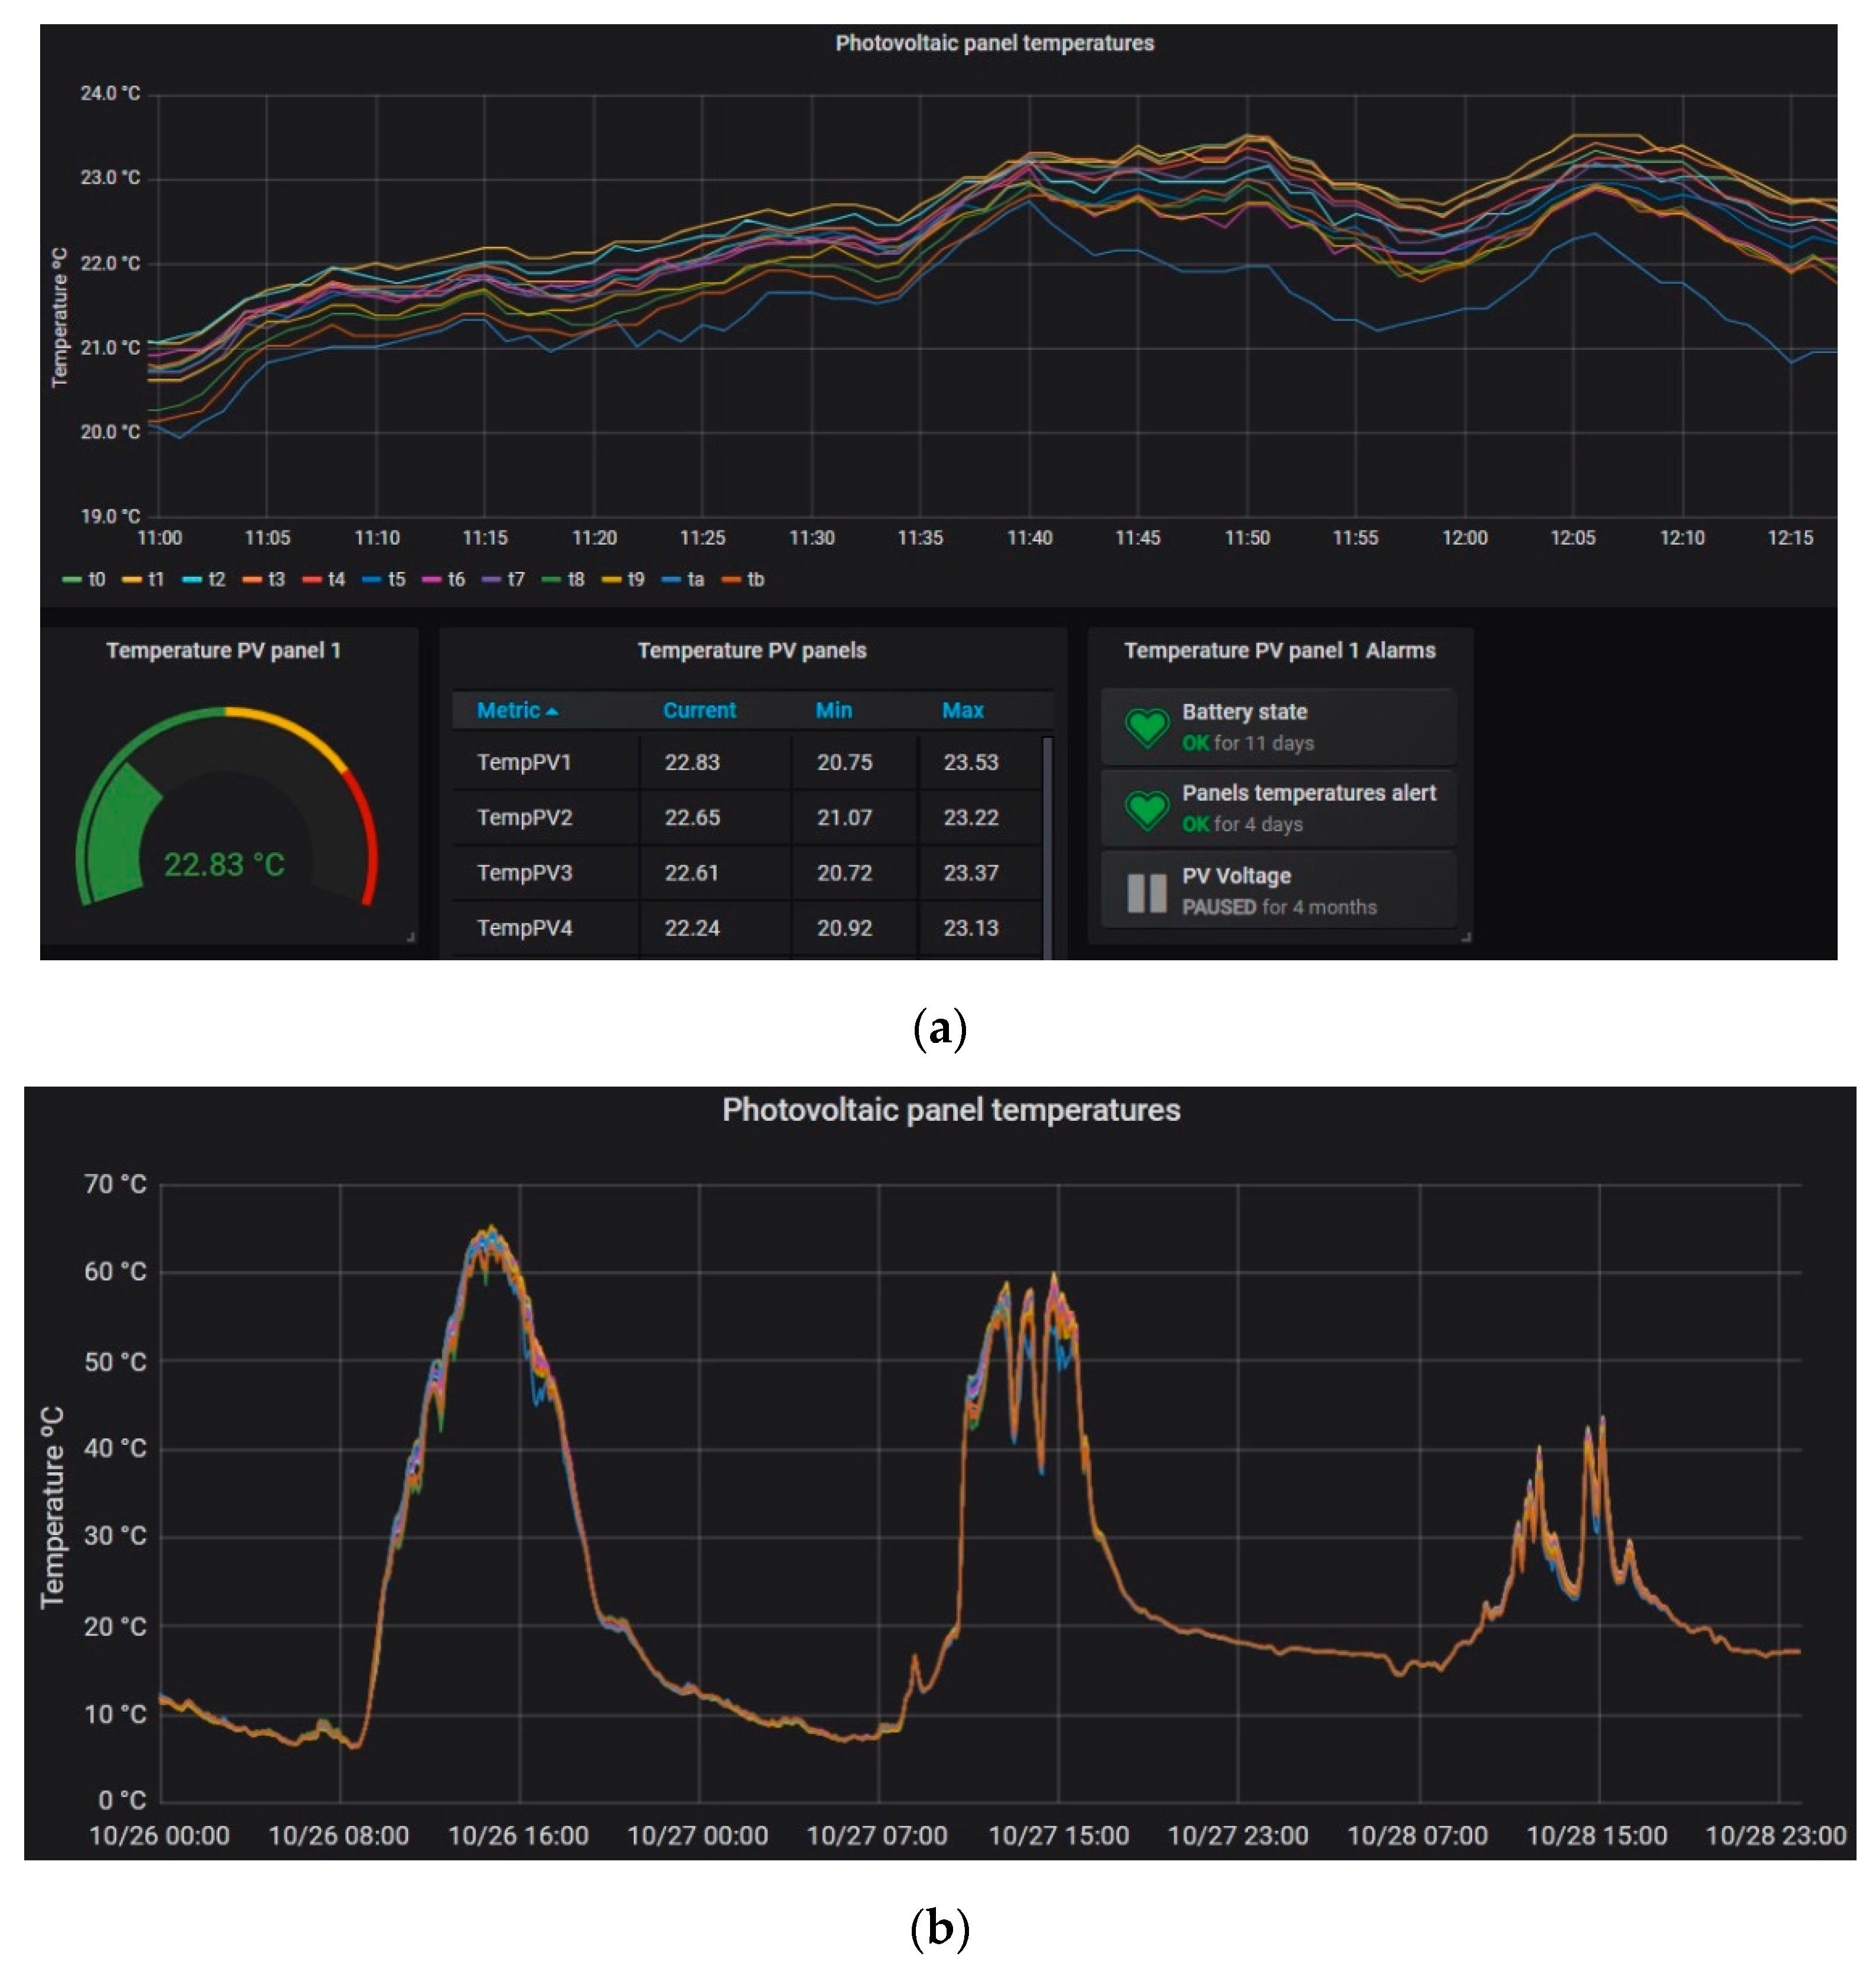
Figure 12a depicts the GUI implemented with Grafana, where time series as well as numerical values can be seen. This system has been designed to provide a user-friendly interface, and to display real-time information in an intuitive manner. The evolution of the temperatures sensed in the PV panels is seen for each sensor over a period of 1 h. As can be observed, all of the values are similar, and present the same trend. An appreciable detail is that the temperature of the last panel is lower than the rest, due to the fact that it is placed on the edge of the building; therefore, it is more exposed to wind currents, which make its temperature lower. In addition, a table shows the instantaneous values of the first sensor of each panel, as well as its minimum and maximum values during the selected interval. This way, the user/operator can see the status of the SMG at a glance.
The user can choose the time interval to view the collected data during a period of interest, as well as apply zoom for detailed visualizations. An example of detailed display is seen in Figure 12b, where only the evolution of the sensed temperatures is observed over 3 days in October 2019. In this figure, the evolution of the temperature can be observed over three consecutive days, in which the weather conditions gradually changed from sunny to cloudy.
As can be seen, the differences in the measured temperatures increase when there is power generation. This phenomenon is mainly due to the incident irradiance, which directly heats the panels. Other causes of differences in the measured temperatures are related to the circulation of electric current through the PV cells, constructive deviations, degradation (hot spots), shading, and so forth. Nevertheless, exhaustive analysis of the temperatures of the PV panels is beyond the scope of this paper.
An alarm has been created to detect temperatures beyond a common range, indicating some problem, such as disconnections or other anomalous functioning. The alarm can be observed in Figure 12a through a small, green-coloured heart placed in the lower part of the Grafana dashboard. Other graphical options are available for inclusion in the GUI, but for the purposes of this work, it has been kept simple and effective.
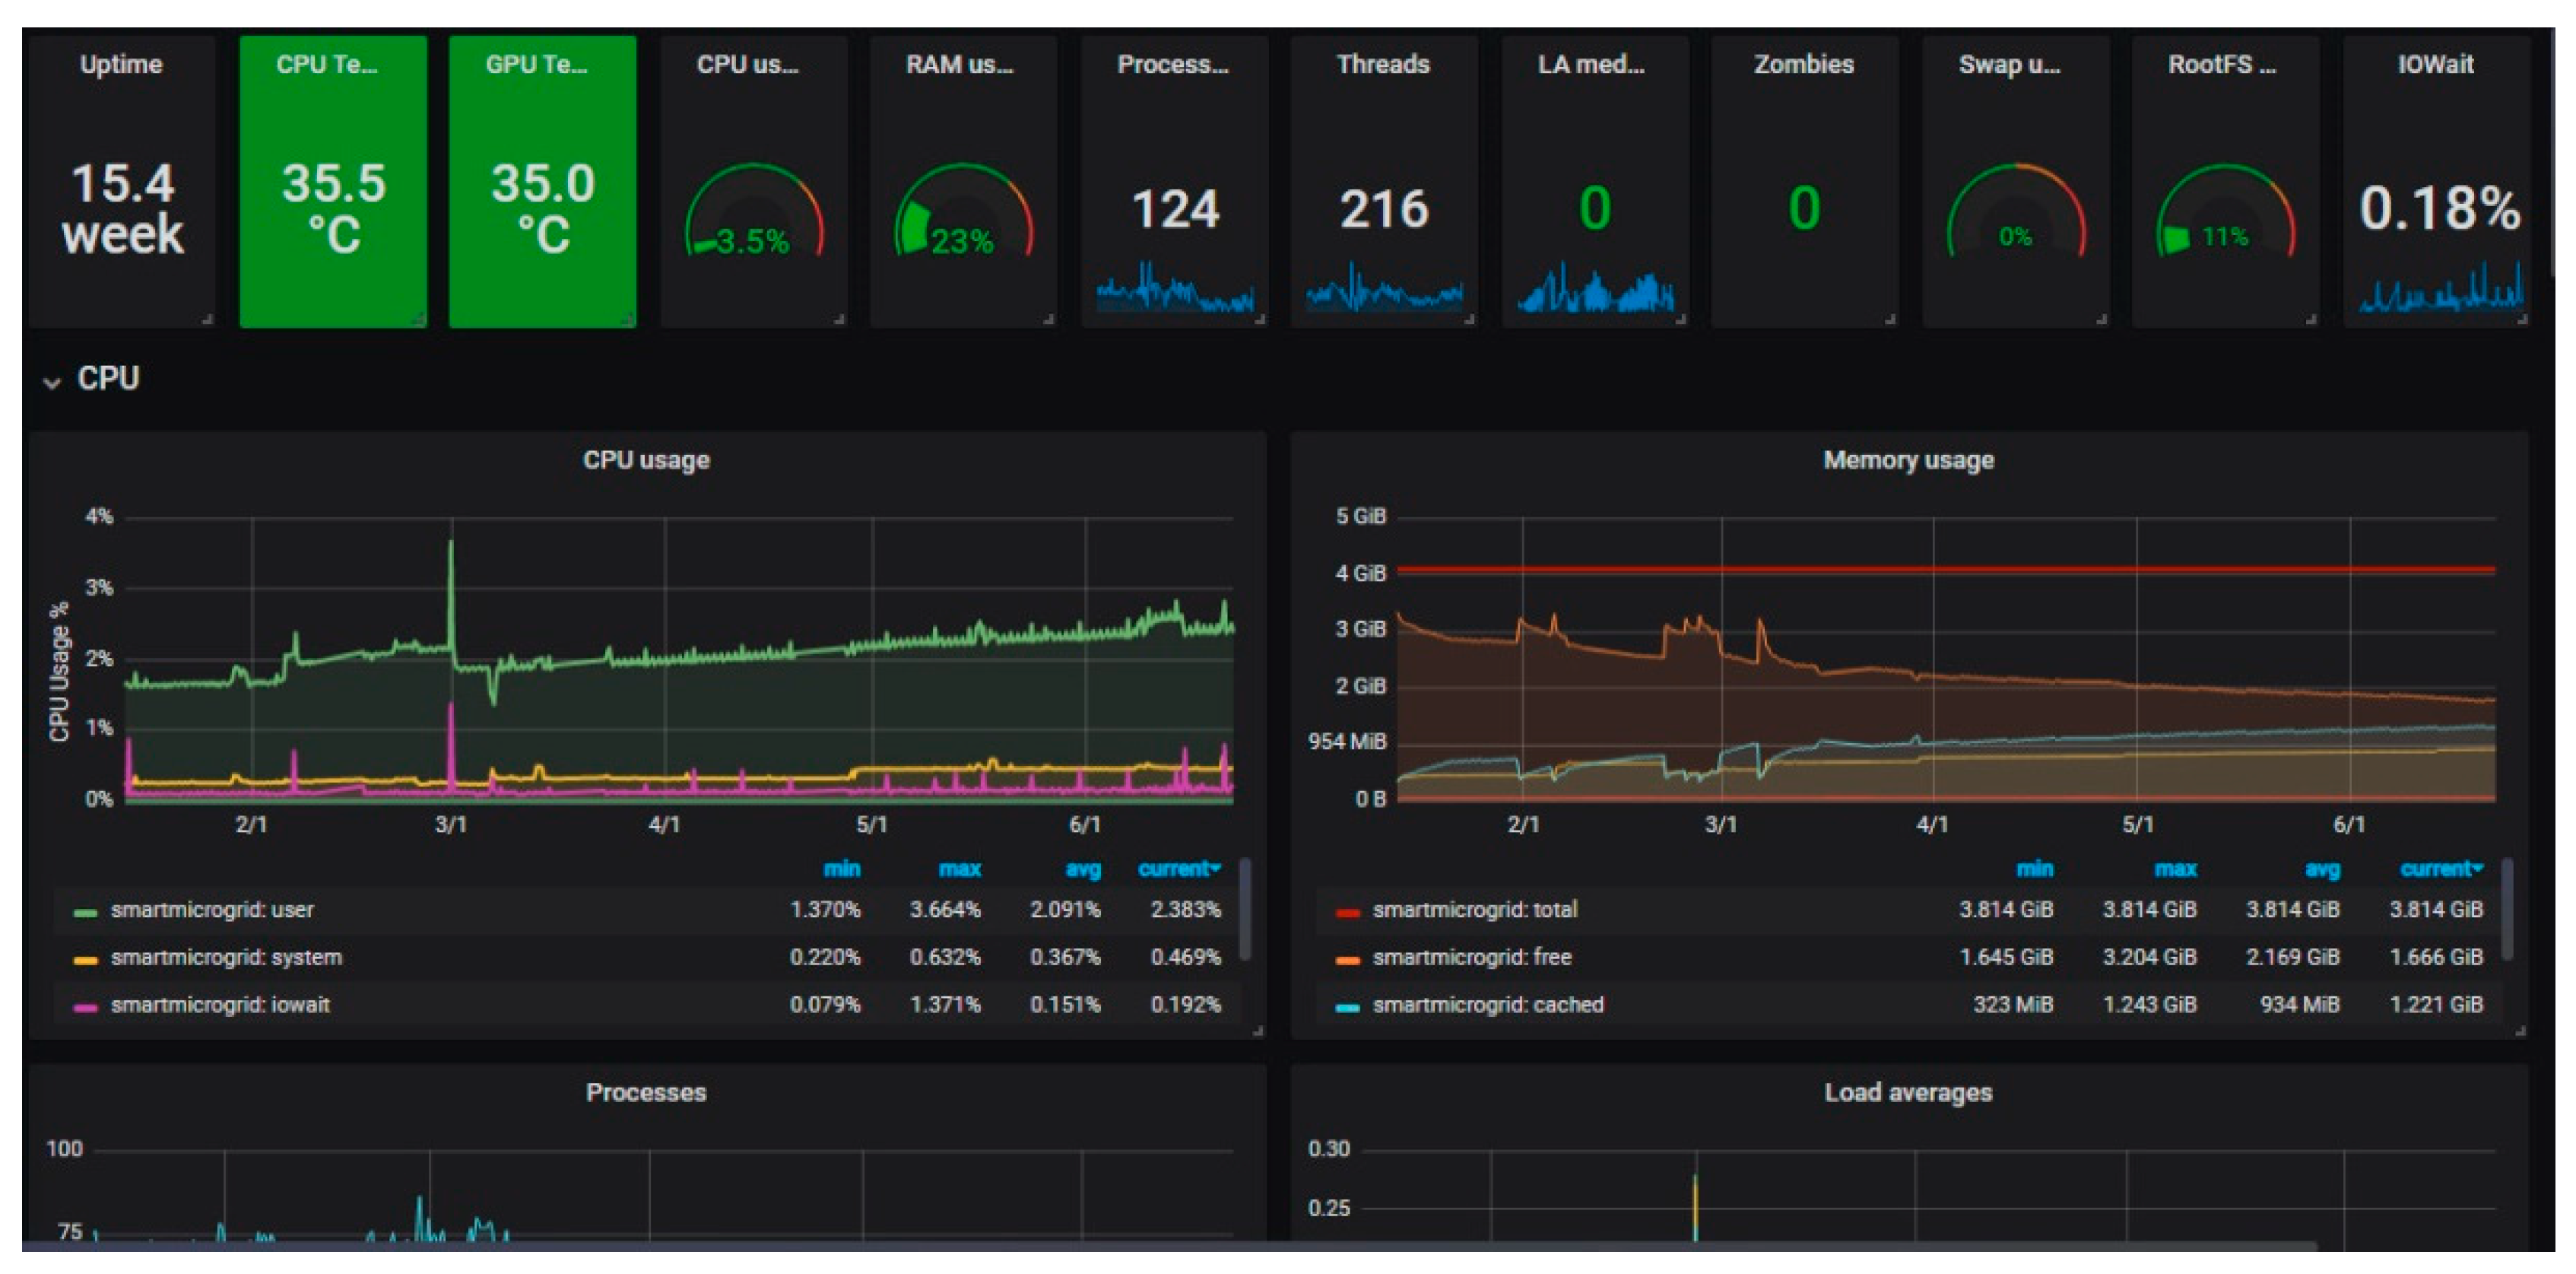
Grafana can also be used to monitor the behaviour and health status of the RPi—for instance, its central processing unit (CPU) load, temperature, memory usage, and network statistics can be plotted and intuitively observed by the user/operator. To this purpose, a dashboard was also designed, based on Telegraf [49], and installed in the RPi in order to evaluate its ability to manage the data storage and visualization of the PV generator. This dashboard is shown in Figure 13, with which the user/operator can see at a glance the status and the utilization of computational resources of the RPi.
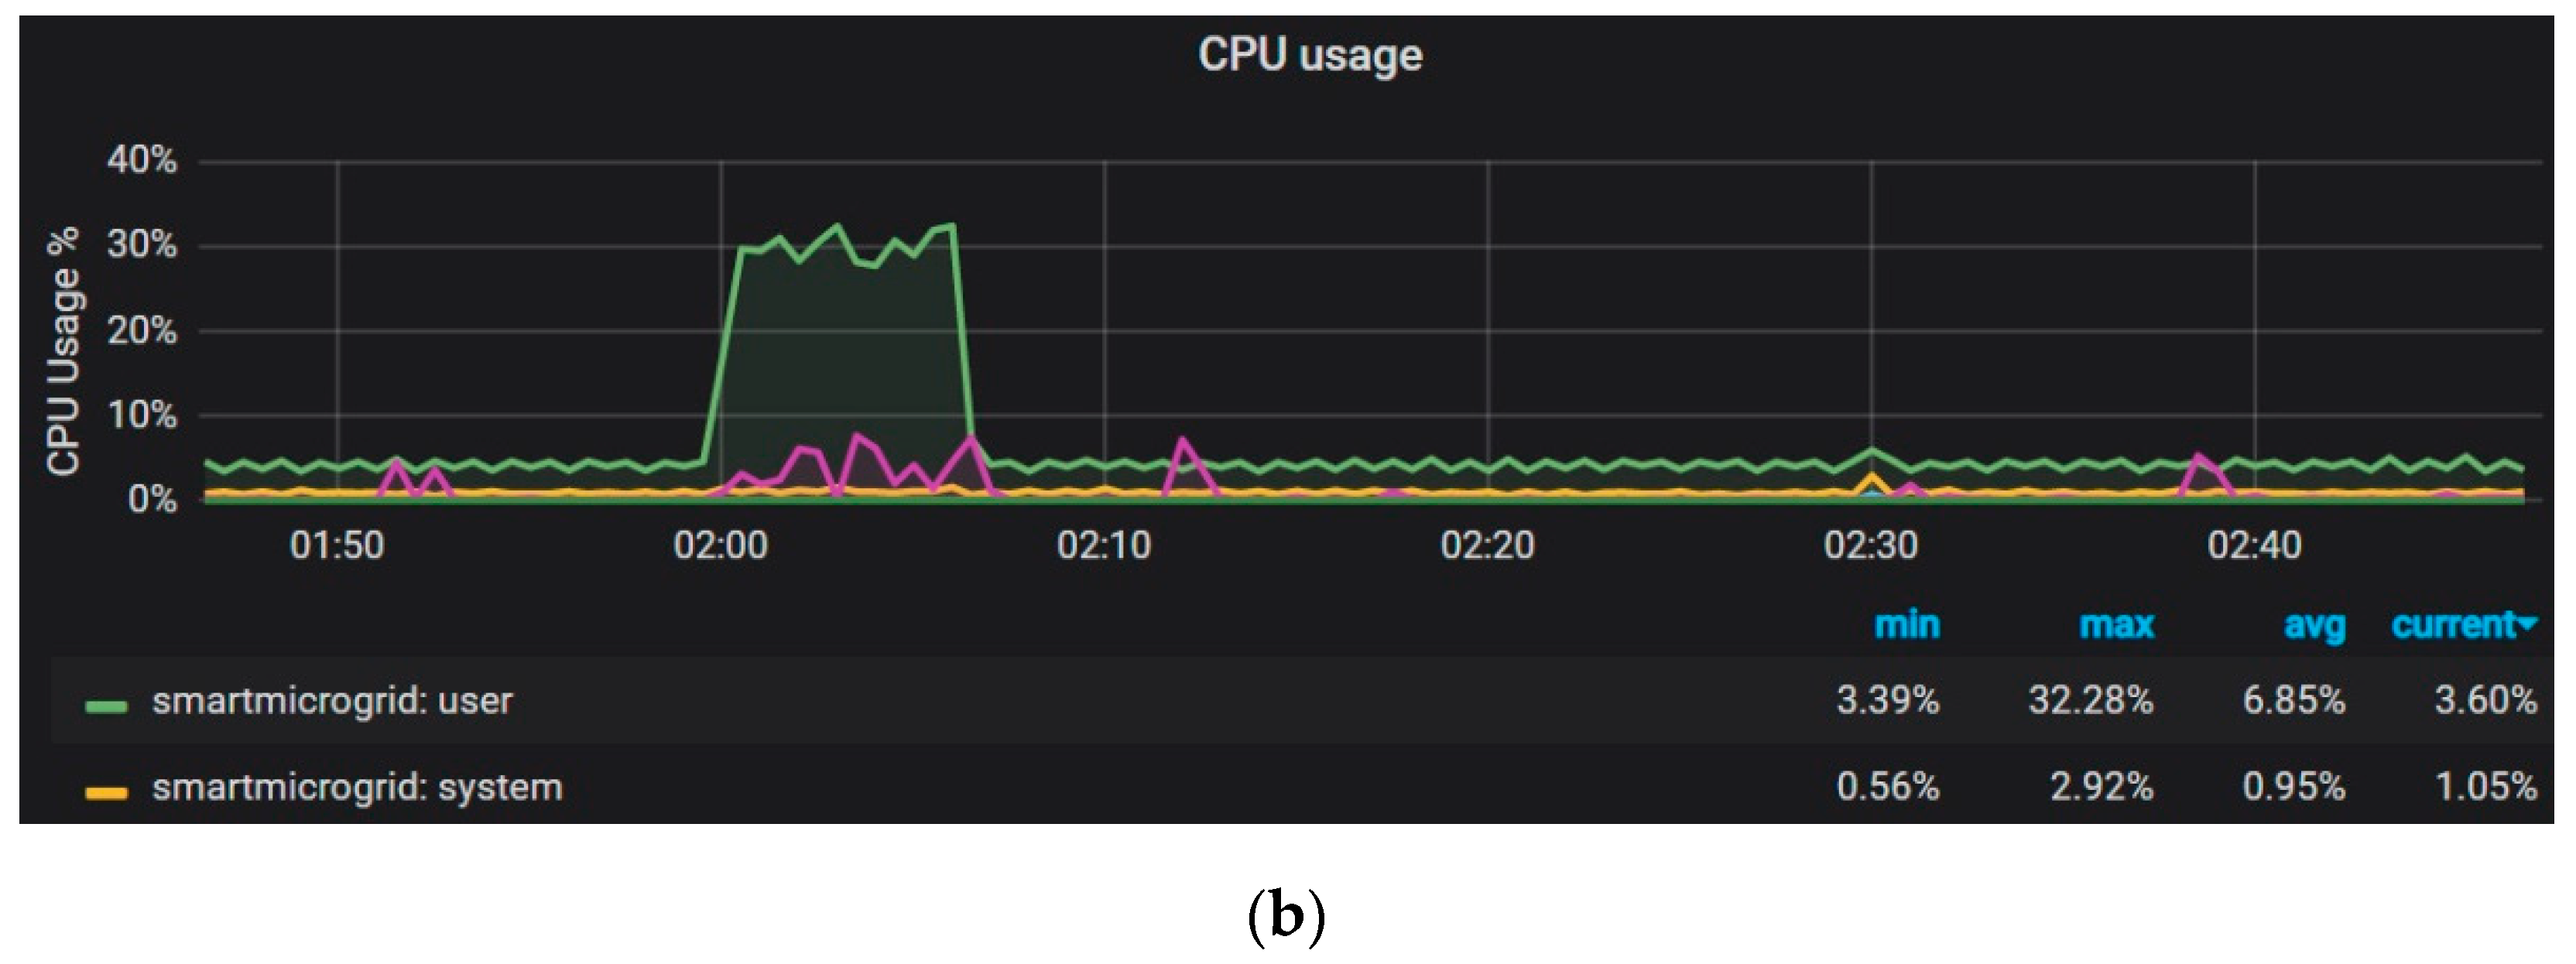
For this device, the most relevant parameters are the CPU load and the temperature; thus, the obtained measurements in this regard are now discussed. Concerning the former, Figure 14a shows that the average CPU usage is 5.99%, with sporadic increases due to accesses to web services, such as the Grafana dashboards, or the database management through PHP, causing peaks of a maximum of 27% usage. During the night, the database backup in the flash drive is created at 2:00 a.m., which gives rise to a maximum value of 32% of CPU usage, as can be seen in Figure 14b.
Overheating can be an issue in RPi, so passive and active cooling methods are required. In the present case, both methods are applied—namely, an aluminium heatsink and a fan are mounted on the RPi for cooling. For assessment of the RPi’s performance, measurements of the temperature of the CPU and the GPU are displayed in the monitoring dashboard, as can be observed in Figure 14. The highest temperature that the CPU reached was 42 °C. It must be remarked that this value is lower than that reported in previous literature; for instance, in [50], the maximum temperature reached by an RPi CPU was 60 °C.
Figure 15 shows the progress of the most representative magnitudes recorded over 3 consecutive days in October 2019; namely, the temperature of one PV panel (red), the power generated by the PV panels (green, dashed line), and the state of charge (SoC, blue) of the battery are depicted. The electronic load was configured to demand a constant current during these days. In particular, the load was programmed to request 2.5 A during the first two days, whereas for the third day, 1 A was delivered to this device due to the cloudy conditions. Only the measured temperature of a panel is illustrated (TempPV1a in figures). The rest of the measured temperatures are of the same order and follow the same tendency, so including them would not enrich the information shown.
In the same sense as for Figure 12, these days have been selected due to the fact that the weather conditions progressively changed from sunny to cloudy. The trend of the sensed temperature is coherent with environmental variations (see Figure 15a).
Relevant information can be obtained from the analysis of these results; for instance, Figure 15b shows that the power delivered by the PV panels is coherent with the curve of the battery’s SoC. The current fed to the battery causes the increase in its SoC, while supplying the load during the night—or in periods without solar contribution—involves its discharge (decrease in SoC). During these days, the solar power varied depending on the aforementioned weather conditions, and on the power demanded by the battery and the load. On the third day, the cloudy conditions caused rapid variations in the power generated by the PV panels, as well as in the sensed temperature.
The current demanded by the load was manually changed in order to avoid in-depth discharges of the battery. Data about voltage and current of the PV generator and the SoC of the battery are available from the MPPT charger and the HMI; that is, the integration of this equipment complements the information obtained, thus enriching the monitoring and measurement system.
Figure 15c shows all of the commented variables for the first day, for a better illustration. During this sunny day, the SoC grew from a value of around 50%, up to 100%. The battery enters a floating state once the SoC has reached its maximum value (100%); consequently, the PV generator is mainly required to supply the load. This situation is especially observable in the curve, because the battery reaches full charge (SoC of 100%) during the middle hours of the day, and the power from the PV panels suddenly decreases.
4.2. Discussion
The proposed system has been validated for the purpose of monitoring a PV generator integrated with hydrogen equipment in the form of an SMG. The monitoring system consists of open-source hardware and software responsible for sensing, data acquisition, and visualization.
The experimental results demonstrate proper measurements and visualization during operation of the SMG. All of the measured temperatures are coherent, and present the same trend under different conditions, such as sunny and rainy days. The influence of the charge and discharge processes of the battery can also be observed in the PV power generation and the associated temperature variations.
The cloud-enabled access to the monitored variables promotes the online remote tracking of the facility in a ubiquitous manner. In this sense, the monitoring GUI has been designed to be intuitive and user-friendly, taking advantage of the built-in features of Grafana.
A noteworthy remark is that Grafana is mounted in the RPi, so there is no dependence on external servers. This feature provides freedom to the developer, who can implement the monitoring system anywhere, from an isolated local area network (LAN) to a wide area network (WAN). According to Table 1 in the Introduction, this is a remarkable feature, given the fact that none of the previous works has developed this configuration.
In this sense, it has been proven that the RPi has enough computational resources to manage both data storage and visualization. A dashboard to monitor such resources has been developed and implemented, showing low CPU usage and proper temperature. Consequently, using an RPi for this purpose is a feasible approach.
Furthermore, as pointed out in [29], research efforts are still needed in order to ensure the stable operation of open-source technology when critical equipment is involved. In this sense, the long-term period over which the proposed solution has been continuously working, and its successful operation, proves its suitability to be applied for monitoring purposes in an SMG.
It must be remarked that the presented solution is flexible, modular, and scalable. These are desirable characteristics to carry out research tasks where a number of changes and modifications are continuously required to test different algorithms, measurements, or other parameters. For example, the amount of digital temperature sensors can be easily increased in order to study the temperature distribution in the PV panels for diagnostic and/or prognostic purposes. Their connection in bus and the easy-to-use characteristics of the associated software configuration facilitate such extension.
The low-cost nature of the proposal lies in the inexpensive budget required for its implementation. To begin with, all of the relevant software packages (i.e., IDE, LAMP, Grafana) are freely available on the Internet. On the other hand, hardware elements have very low costs, as can be observed in Table 2, where the expenses of all of the required entities are listed. The overall expenditure for our monitoring system is lower than EUR 150. Indeed, all of these components can be bought from different manufacturers, so the consumer is not beholden to a single supplier, which is another benefit of open-source systems [51]. A remarkable observation is that the cost of a proprietary monitoring framework, considering both software licenses and hardware equipment, is around EUR 10,000. Therefore, the proposal also implies an economic advantage by reducing the budget required to deploy an SMG.
Concerning such a budget, an issue to mention is that for facilities involving energy storage systems—such as SMGs—not only initial acquisition costs, but also maintenance and warranty expenses, efficiency losses, end of life, and disposal costs must be considered [52].
Using open-source technology brings several benefits, such as the abovementioned low cost, general ease –of use, and availability of public information via the Internet. Another advantage consists of the control that the user acquires over the system, e.g., the configurability of the developments is much greater than that of proprietary equipment. In addition, new releases of both hardware and software contribute to enhancing the capabilities of the system.
Some disadvantages of open-source solutions must be also mentioned. The first is related to the lack of technical support, i.e., there is no technical service for the client if there are unsolved issues.
The open-source nature does not necessarily imply ease of use, which is a common feature of this type of resource. For instance, configuring certain software environments requires significant programming expertise. In particular, configuring the RPi involves knowledge about programming as well as communication networks. This issue is not a drawback in itself, but must be taken into account when designing and maintaining complex facilities such as SMGs.
5. Conclusions
This paper has presented a monitoring system based on open-source hardware (Arduino, RPi) and software (IDE, LAMP, Grafana) for tracking the operation of a PV generator in an SMG.
The RPi hosts both the database and the visualization management systems, which constitutes a novelty in the literature. It has been proven that this microcomputer has enough computational resources to handle the involved signals, and can operate in a stable manner for several months. The achieved results demonstrate the feasibility and capabilities of the proposed monitoring system.
The experimental validation consists of sensing and monitoring the temperature of a set of PV panels with a network of sensors connected to an Arduino. The RPi is responsible for retrieving and storing the acquired signals, being visualized online through a Grafana GUI. The remote user accomplishes a real-time tracking of the main magnitudes of the PV generator via an easy-to-use web interface. Additionally, the evolution of the power provided by the PV generator and the battery SoC over several days has been expounded, along with the measured temperatures demonstrating a proper behaviour.
The open-source nature of the monitoring system provides advantages such as inexpensive elements, deep control over the configuration of the hardware and software, scalability, and ease of use. The presented solution is envisioned to foster the utilization of open-source technologies for advanced scenarios, and to contribute to the real deployment of SGs and SMGs.
Concerning future research directions, once the monitoring system has been validated for the PV generator, it can be applied to the rest of subsystems of the SMG. Specifically, a set of sensors and Arduino boards will be devoted to integrating other measurements in the hydrogen-related devices. Moreover, the generated database will be used for analysing the SMG’s behaviour and performance. Development of a DR of the SMG through artificial intelligence methods and the acquired data will also be conducted.
Author Contributions
Conceptualization, J.M.P., I.G., and A.J.C.; methodology, I.G. and A.J.C.; validation, J.M.P. and A.J.C.; investigation, I.G. and A.J.C.; data curation, J.M.P. and A.J.C.; writing—original draft preparation, J.M.P. and I.G.; writing—review and editing, I.G. and A.J.C.; supervision, A.J.C. All authors have read and agreed to the published version of the manuscript.
Funding
Project co-financed by European Regional Development Funds FEDER and by the Junta de Extremadura (IB18041).
Institutional Review Board Statement
Not applicable.
Informed Consent Statement
Not applicable.
Data Availability Statement
Not applicable.
Conflicts of Interest
The authors declare no conflict of interest.
Abbreviations
The following abbreviations are used in this manuscript:
| AC | Alternating current |
| CPU | Central processing unit |
| DC | Direct current |
| DR | Digital replica |
| EL | Electrolyser |
| FC | Fuel cell |
| GPIO | General purpose input/output |
| GUI | Graphical user interface |
| HTML | HyperText Markup Language |
| I2C | Inter-integrated circuit |
| I/O | Input/output |
| IDE | Integrated development environment |
| IoT | Internet of Things |
| IT | Information technology |
| LAN | Local area network |
| OS | Operating system |
| PC | Personal computer |
| PCB | Printed circuit board |
| PLC | Programmable logic controller |
| PV | Photovoltaic |
| R&D | Research and development |
| RAM | Random-access memory |
| RPi | Raspberry Pi |
| SG | Smart grid |
| SMG | Smart microgrid |
| SoC | State of charge |
| SPI | Serial peripheral interface |
| SQL | Search Query Language |
| TCP/IP | Transmission control protocol/Internet protocol |
| USB | Universal serial bus |
| WAN | Wide area network |
References
- Kilic, N.; Gungor, V.C. Analysis of low power wireless links in smart grid environments. Comput. Netw. 2013, 57, 1192–1203. [Google Scholar] [CrossRef]
- Zubieta, L.E. Are microgrids the future of energy? DC microgrids from concept to demonstration to deployment. IEEE Electrif. Mag. 2016, 4, 37–44. [Google Scholar] [CrossRef]
- Koohi-Kamali, S.; Rahim, N.A. Coordinated control of smart microgrid during and after islanding operation to prevent under frequency load shedding using energy storage system. Energy Convers. Manag. 2016, 127, 623–646. [Google Scholar] [CrossRef]
- Lidula, N.W.A.; Rajapakse, A.D. Microgrids research: A review of experimental microgrids and test systems. Renew. Sustain. Energy Rev. 2011, 15, 186–202. [Google Scholar] [CrossRef]
- Yue, C.-D.; Liu, C.-C.; Tu, C.-C.; Lin, T.-H. Prediction of Power Generation by Offshore Wind Farms Using Multiple Data Sources. Energies 2019, 12, 700. [Google Scholar] [CrossRef] [Green Version]
- Alsaidan, I.; Alanazi, A.; Gao, W.; Wu, H.; Khodaei, A. State-Of-The-Art in Microgrid-Integrated Distributed Energy Storage Sizing. Energies 2017, 10, 1421. [Google Scholar] [CrossRef] [Green Version]
- Arkhangelski, J.; Roncero-Sánchez, P.; Abdou-Tankari, M.; Vázquez, J.; Lefebvre, G. Control and Restrictions of a Hybrid Renewable Energy System Connected to the Grid: A Battery and Supercapacitor Storage Case. Energies 2019, 12, 2776. [Google Scholar] [CrossRef] [Green Version]
- Kharel, S.; Shabani, B. Hydrogen as a Long-Term Large-Scale Energy Storage Solution to Support Renewables. Energies 2018, 11, 2825. [Google Scholar] [CrossRef] [Green Version]
- Abe, J.O.; Popoola, A.P.I.; Ajenifuja, E.; Popoola, O.M. Hydrogen energy, economy and storage: Review and recommendation. Int. J. Hydrogen Energy 2019, 44, 15072–15086. [Google Scholar] [CrossRef]
- Maggio, G.; Nicita, A.; Squadrito, G. How the hydrogen production from RES could change energy and fuel markets: A review of recent literature. Int. J. Hydrogen Energy 2019, 44, 11371–11384. [Google Scholar] [CrossRef]
- Calderón, A.J.; González, I.; Portalo, J.M.; Calderón, M. Contributing to sustainable deployment of renewable energies-based Smart Micro-Grid through the integration of Open-Source Technology. In Proceedings of the 8 International Congress of Energy and Environment Engineering and Management (8ICEEEM), Porto, Portugal, 2–4 September 2019. [Google Scholar]
- González, I.; Calderón, A.J.; Andújar, J.M. Novel Remote Monitoring Platform for RES-Hydrogen based Smart Microgrid. Energy Convers. Manag. 2017, 148, 489–505. [Google Scholar] [CrossRef]
- Sánchez-Hidalgo, M.A.; Cano, M.D. A survey on visual data representation for smart grids control and monitoring. Sustain. Energy Grids Netw. 2018, 16, 351–369. [Google Scholar] [CrossRef]
- Ferreira, A.; Ferreira, A.; Cardin, O.; Leitão, P. Extension of holonic paradigm to smart grids. IFAC-PapersOnLine 2015, 48, 1099–1104. [Google Scholar] [CrossRef]
- Vargas-Salgado, C.; Aguila-Leon, J.; Chiñas-Palacios, C.; Hurtado-Pérez, E. Low-cost web-based Supervisory Control and Data Acquisition system for a microgrid testbed: A case study in design and implementation for academic and research applications. Heliyon 2019, 5, e02474. [Google Scholar] [CrossRef] [Green Version]
- Paredes-Parra, J.M.; Mateo-Aroca, A.; Silvente-Niñirola, G.; Bueso, M.C.; Molina-García, Á. PV Module Monitoring System Based on Low-Cost Solutions: Wireless Raspberry Application and Assessment. Energies 2018, 11, 3051. [Google Scholar] [CrossRef] [Green Version]
- González, I.; Calderón, A.J.; Calderón, M.; González, J.F. Survey about the Utilization of Open Source Arduino for Control and Measurement Systems in Advanced Scenarios. Application to Smart Micro-Grid and its Digital Replica. In Proceedings of the 16th International Conference on Informatics in Control, Automation and Robotics, Prague, Czech Republic, 29–31 July 2019. [Google Scholar]
- Pereira, R.I.S.; Dupont, I.M.; Carvalho, P.C.M.; Jucá, S.C.S. IoT embedded linux system based on Raspberry Pi applied to real-time cloud monitoring of a decentralized photovoltaic plant. Measurement 2018, 114, 286–297. [Google Scholar] [CrossRef]
- Fisher, R.; Ledwaba, L.; Hancke, G.; Kruger, C. Open Hardware: A Role to Play in Wireless Sensor Networks? Sensors 2015, 15, 6818–6844. [Google Scholar] [CrossRef] [Green Version]
- Syafrudin, M.; Fitriyani, N.L.; Li, D.; Alfian, G.; Rhee, J.; Kang, Y.-S. An Open Source-Based Real-Time Data Processing Architecture Framework for Manufacturing Sustainability. Sustainability 2017, 9, 2139. [Google Scholar] [CrossRef] [Green Version]
- Chacon, J.; Saenz, J.; Torre, L.; Diaz, J.M.; Esquembre, F. Design of a Low-Cost Air Levitation System for Teaching Control Engineering. Sensors 2017, 17, 2321. [Google Scholar] [CrossRef] [PubMed] [Green Version]
- Costa, D.G.; Duran-Faundez, C. Open-Source Electronics Platforms as Enabling Technologies for Smart Cities: Recent Developments and Perspectives. Electronics 2018, 7, 404. [Google Scholar] [CrossRef] [Green Version]
- Martinez, B.; Vilajosana, X.; Kim, I.H.; Zhou, J.; Tuset-Peiró, P.; Xhafa, A.; Poissonnier, D.; Lu, X. I3Mote: An Open Development Platform for the Intelligent Industrial Internet. Sensors 2017, 17, 986. [Google Scholar] [CrossRef] [PubMed] [Green Version]
- Nguyen, T.-T.-Q.; Debusschere, V.; Bobineau, C.; Giap, Q.; Hadjsaid, N. Smartlog –A declarative language for distributed programming in smart grids. Comput. Electr. Eng. 2019, 80, 106499. [Google Scholar] [CrossRef]
- FIWARE Platform Homepage. Available online: https://www.fiware.org/ (accessed on 15 May 2021).
- Arduino Homepage. Available online: www.arduino.cc (accessed on 30 May 2021).
- Raspberry Pi Homepage. Available online: http://www.raspberrypi.org (accessed on 15 May 2021).
- Calderón, A.J.; González, I.; Calderón, M.; Segura, F.; Andújar, J.M. A New, Scalable and Low Cost Multi-Channel Monitoring System for Polymer Electrolyte Fuel Cells. Sensors 2016, 16, 349. [Google Scholar] [CrossRef] [Green Version]
- González, I.; Calderón, A.J. Integration of open source hardware Arduino platform in automation systems applied to Smart Grids/Micro-Grids. Sustain. Energy Technol. Assess. 2019, 36, 100557. [Google Scholar] [CrossRef]
- Fuentes, M.; Vivar, M.; Burgos, J.M.; Aguilera, J.; Vacas, J.A. Design of an accurate, low-cost autonomous data logger for PV system monitoring using Arduino™ that complies with IEC standards. Sol. Energy Mater. Sol. Cells 2014, 130, 529–543. [Google Scholar] [CrossRef]
- Mejías, A.; Herrera, R.S.; Márquez, M.A.; Calderón, A.J.; González, I.; Andújar, J.M. Easy Handling of Sensors and Actuators over TCP/IP Networks by Open Source Hardware/Software. Sensors 2017, 17, 94. [Google Scholar] [CrossRef] [Green Version]
- Martins, J.P.; Ferreira, J.C.; Monteiro, V.; Afonso, J.A.; Afonso, J.L. IoT and Blockchain Paradigms for EV Charging System. Energies 2019, 12, 2987. [Google Scholar] [CrossRef] [Green Version]
- OpenEnergyMonitor Homepage. Available online: https://openenergymonitor.org/ (accessed on 20 May 2021).
- Grafana Homepage. Available online: https://grafana.com/ (accessed on 2 May 2021).
- Voicu, V.; Petreus, D.; Etz, R. Data Acquisition System for Solar Panels. In Proceedings of the 42nd International Spring Seminar on Electronics Technology (ISSE), Wroclaw, Poland, 15–19 May 2019. [Google Scholar] [CrossRef]
- Ali, A.S.; Coté, C.; Heidarinejad, M.; Stephens, B. Elemental: An Open-Source Wireless Hardware and Software Platform for Building Energy and Indoor Environmental Monitoring and Control. Sensors 2019, 19, 4017. [Google Scholar] [CrossRef] [PubMed] [Green Version]
- Catalan, L.; Araiz, M.; Aranguren, P.; Padilla, G.D.; Hernandez, P.A.; Perez, N.M.; Garcia de la Noceda, C.; Albert, J.F.; Astrain, D. Prospects of Autonomous Volcanic Monitoring Stations: Experimental Investigation on Thermoelectric Generation from Fumaroles. Sensors 2020, 20, 3547. [Google Scholar] [CrossRef]
- Gimeno-Sales, F.J.; Orts-Grau, S.; Escribá-Aparisi, A.; González-Altozano, P.; Balbastre-Peralta, I.; Martínez-Márquez, C.I.; Gasque, M.; Seguí-Chilet, S. PV Monitoring System for a Water Pumping Scheme with a Lithium-Ion Battery Using Free Open-Source Software and IoT Technologies. Sustainability 2020, 12, 10651. [Google Scholar] [CrossRef]
- Howlader, A.M.; Matayoshi, H.; Sepasi, S.; Senjyu, T. Design and Line Fault Protection Scheme of a DC Microgrid Based on Battery Energy Storage System. Energies 2018, 11, 1823. [Google Scholar] [CrossRef] [Green Version]
- Zubi, G.; Dufo-López, R.; Carvalho, M.; Pasaoglu, G. The lithium-ion battery: State of the art and future perspectives. Renew. Sustain. Energy Rev. 2018, 89, 292–308. [Google Scholar] [CrossRef]
- Sensor DS18B20 Product Information. Available online: https://www.maximintegrated.com/en/products/sensors/DS18B20.html (accessed on 2 October 2019).
- Carrasco, M.; Laudani, A.; Lozito, G.M.; Mancilla-David, F.; Riganti Fulginei, F.; Salvini, A. Low-Cost Solar Irradiance Sensing for PV Systems. Energies 2017, 10, 998. [Google Scholar] [CrossRef]
- Cabezas, J.; Sánchez-Rodríguez, T.; Gómez-Galán, J.A.; Cifuentes, H.; González Carvajal, R. Compact Embedded Wireless Sensor-Based Monitoring of Concrete Curing. Sensors 2018, 18, 876. [Google Scholar] [CrossRef] [PubMed] [Green Version]
- Liu, F.; Cheng, Z.; Jia, P.; Zhang, B.; Liu, X.; Hu, R. Impact of Thermal Control Measures on the Imaging Quality of an Aerial Optoelectronic Sensor. Sensors 2019, 19, 2753. [Google Scholar] [CrossRef] [PubMed] [Green Version]
- Rebaudo, F.; Benoist, R. Low-cost automatic temperature monitoring system with alerts for laboratory rearing units. MethodsX 2019, 6, 2127–2133. [Google Scholar] [CrossRef] [PubMed]
- Melo, G.C.G.d.; Torres, I.C.; Araújo, Í.B.Q.d.; Brito, D.B.; Barboza, E.d.A. A Low-Cost IoT System for Real-Time Monitoring of Climatic Variables and Photovoltaic Generation for Smart Grid Application. Sensors 2021, 21, 3293. [Google Scholar] [CrossRef] [PubMed]
- Wollschlaeger, M.; Sauter, T.; Jasperneite, J. The Future of Industrial Communication. Automation Networks in the Era of the Internet of Things and Industry 4.0. IEEE Ind. Electron. Mag. 2017, 11, 17–27. [Google Scholar] [CrossRef]
- González, I.; Calderón, A.J.; Portalo, J.M. Innovative Multi-Layered Architecture for Heterogeneous Automation and Monitoring Systems: Application Case of a Photovoltaic Smart Microgrid. Sustainability 2021, 13, 2234. [Google Scholar] [CrossRef]
- Grafana Dashboard for Monitoring System Metrics Based on Telegraf. Available online: https://grafana.com/grafana/dashboards/928 (accessed on 2 June 2021).
- Corral-García, J.; González-Sánchez, J.-L.; Pérez-Toledano, M.-Á. Evaluation of Strategies for the Development of Efficient Code for Raspberry Pi Devices. Sensors 2018, 18, 4066. [Google Scholar] [CrossRef] [Green Version]
- Aghenta, L.O.; Iqbal, M.T. Low-Cost, Open Source IoT-Based SCADA System Design Using Thinger.IO and ESP32 Thing. Electronics 2019, 8, 822. [Google Scholar] [CrossRef] [Green Version]
- Baxter, I.; Gyuk, R.; Byrne, H.; Chalamala, B.R. Engineering energy-storage projects: Applications and financial aspects (viewpoint). IEEE Electrif. Mag. 2018, 6, 4–12. [Google Scholar] [CrossRef]
Figure 1.
Scheme of the photovoltaic-based SMG.

Figure 2.
Temperature sensor calibration results.

Figure 3.
Topology of the conceptual framework to deploy the monitoring system.

Figure 4.
Block diagram of the developed monitoring system.

Figure 5.
Flowchart of the steps conducted by (a) the Arduino for data acquisition and transmission, and (b) for the visualization of real-time information via the Grafana dashboard.
Figure 5.
Flowchart of the steps conducted by (a) the Arduino for data acquisition and transmission, and (b) for the visualization of real-time information via the Grafana dashboard.

Figure 6.
Scheme of connections of the sensors bus, the Arduino, and the RPi.

Figure 7.
Photograph of the PV modules on the roof.

Figure 8.
Digital temperature sensors placed on the PV panel.

Figure 9.
Experimental setup of the monitoring system’s components in the laboratory.

Figure 10.
Database in MariaDB for PV temperature monitoring.

Figure 11.
Visualization of PV temperatures from October 2019 to October 2020.

Figure 12.
Grafana GUI displaying real-time measurements and time series of the PV generator: (a) overview of the GUI for one hour of data; (b) detailed view of temperatures over 3 days.
Figure 12.
Grafana GUI displaying real-time measurements and time series of the PV generator: (a) overview of the GUI for one hour of data; (b) detailed view of temperatures over 3 days.

Figure 13.
Dashboard to monitor the RPi computational resources.

Figure 14.
CPU usage monitored by Grafana: (a) during web access; (b) during nightly backup of the database.
Figure 14.
CPU usage monitored by Grafana: (a) during web access; (b) during nightly backup of the database.


Figure 15.
Evolution of (a) sensed temperature and PV power over 3 days; (b) PV power and SoC of the battery over 3 days; and (c) temperature, SoC, and PV power during a sunny day.
Figure 15.
Evolution of (a) sensed temperature and PV power over 3 days; (b) PV power and SoC of the battery over 3 days; and (c) temperature, SoC, and PV power during a sunny day.


Table 1.
Main features of related publications.
| Work | Data Acquisition | Data Storage (Server/Database) | Communication | Visualization Software | Sensors |
|---|---|---|---|---|---|
| 15 | Arduino | Plesk/CloudDB | Radio | Web SCADA (HTML5) | Temperature, voltage, current, relative humidity, anemometer, irradiance |
| 16 | Arduino | Unspecified | Radio | EmonCMS | Temperature, voltage, current, relative humidity, irradiance |
| 18 | SanUSB | External server/MySQL | Serial | Web Monitor (PHP) | Temperature, voltage, current, irradiance, relative humidity |
| 28 | Arduino | PC/LabVIEW data base | Serial | LabVIEW | Voltage |
| 29 | Arduino | PC/LabVIEW data base | Ethernet | LabVIEW | Temperature |
| 30 | Arduino | Arduino/SD card | Not applicable | Not applicable | Temperature, voltage, current, irradiance, |
| 35 | RPi | Docker/InfluxDB | Not applicable | Grafana | Pyranometer |
| 36 | Custom PCB | Docker/InfluxDB | Radio | Grafana | Temperature, relative humidity, irradiance, CO2, pressure, etc. |
| 37 | Arduino | RPi/InfluxDB | RS485 | Grafana | Humidity, temperature, soil moisture |
| 38 | UWP 3.0 | Server/InfluxDB | Modbus | Grafana | Temperature, voltage, current, irradiance |
| Present work | Arduino | RPi/MariaDB | Ethernet | Grafana | Temperature |
Table 2.
Costs associated with the used open-source hardware and software.
| Element | QTY | Cost (EUR) |
|---|---|---|
| Grafana | 1 | Free |
| Arduino MEGA | 1 | <20 |
| IDE | 1 | Free |
| Raspberry Pi | 1 | <40 |
| LAMP | 1 | Free |
| DS18B20 sensors | 12 | <6 |
| SD card | 1 | <6 |
| Flash drive | 1 | <8 |
| Ethernet Switch | 1 | <50 |
| Ancillary devices (wires, resistors, etc.) | 1 | <30 |
| Total: | <150 |
Publisher’s Note: MDPI stays neutral with regard to jurisdictional claims in published maps and institutional affiliations. |
© 2021 by the authors. Licensee MDPI, Basel, Switzerland. This article is an open access article distributed under the terms and conditions of the Creative Commons Attribution (CC BY) license (https://creativecommons.org/licenses/by/4.0/).
Share and Cite
MDPI and ACS Style
Portalo, J.M.; González, I.; Calderón, A.J. Monitoring System for Tracking a PV Generator in an Experimental Smart Microgrid: An Open-Source Solution. Sustainability 2021, 13, 8182. https://doi.org/10.3390/su13158182
AMA Style
Portalo JM, González I, Calderón AJ. Monitoring System for Tracking a PV Generator in an Experimental Smart Microgrid: An Open-Source Solution. Sustainability. 2021; 13(15):8182. https://doi.org/10.3390/su13158182
Chicago/Turabian StylePortalo, José María, Isaías González, and Antonio José Calderón. 2021. "Monitoring System for Tracking a PV Generator in an Experimental Smart Microgrid: An Open-Source Solution" Sustainability 13, no. 15: 8182. https://doi.org/10.3390/su13158182
Note that from the first issue of 2016, this journal uses article numbers instead of page numbers. See further details here.