
A Hybrid MCDM Model Combining DANP and PROMETHEE II Methods for the Assessment of Cybersecurity in Industry 4.0

Faculty of Economics and Engineering of Transport, Maritime University of Szczecin, 11 Pobożnego Str., 70-507 Szczecin, Poland
Sustainability 2021, 13(16), 8833; https://doi.org/10.3390/su13168833
Submission received: 7 June 2021
/
Revised: 31 July 2021
/
Accepted: 5 August 2021
/
Published: 7 August 2021
(This article belongs to the Special Issue Digital Transformation and Its Opportunities for Sustainable Manufacturing)
Abstract
:IT technologies related to Industry 4.0 facilitate the implementation of the framework for sustainable manufacturing. At the same time, Industry 4.0 integrates IT processes and systems of production companies with IT solutions of cooperating companies that support a complete manufactured product life cycle. Thus, the implementation of sustainable manufacturing implies a rapid increase in interfaces between IT solutions of cooperating companies. This, in turn, raises concerns about security among manufacturing company executives. The lack of a recognized methodology supporting the decision-making process of choosing the right methods and means of cybersecurity is, in effect, a significant barrier to the development of sustainable manufacturing. As a result, the propagation of technologies in Industry 4.0 and the implementation of the sustainable manufacturing framework in companies are slowing down significantly. The main novelty of this article, addressing the above deficiencies, is the creation, using the combined DEMATEL and ANP (DANP) and PROMETHEE II methods, of a ranking of the proposed three groups of measures, seven dimensions and twenty criteria to be implemented in companies to ensure cybersecurity in Industry 4.0 and facilitate the implementation of the sustainable production principles. The contribution of Industry 4.0 components and the proposed cybersecurity scheme to achieve the Sustainable Development goals, reducing the carbon footprint of companies and introducing circular economy elements was also indicated. Using DANP and PROMETHEE II, it can be concluded that: (i) the major criterion of cybersecurity in companies is validation and maintaining electronic signatures and seals; (ii) the most crucial area of cybersecurity is network security; (iii) the most significant group of measures in this regard are technological measures.
1. Introduction
The implementation of IT technologies related to Industry 4.0 in companies also facilitates the implementation of the framework for sustainable manufacturing. However, Industry 4.0 covers not only production companies, but also connects cooperating companies that process order, production, distribution, sales, service and recycling sequentially. In this context, the possibility to integrate the processes, products and IT systems of the sustainable manufacturing process participants is additionally essential for modern production. In the era of developing strategies of sustainable manufacturing and Industry 4.0 manufacturing companies strive to digitize business processes in no time. As a result, the amount of information processed both in the internal IT systems of manufacturing companies and sent to external business to business solutions between cooperating companies is growing rapidly. This process, however, causes concerns of the management of production companies regarding the security of their databases, e.g., information on contractors, orders, know-how and production recipes.
At the same time, literature studies show that among all the characteristics of digital production, relatively little research is dedicated to security, and it is the least recognized area of Industry 4.0 and sustainable manufacturing. Therefore, the problem concerning the lack of a proper definition of methods and ways of implementing cybersecurity measures is a significant barrier slowing down the introduction of sustainable development principles in companies and production processes. Simultaneously, many researchers are now calling for a direct link and mutual penetration of digital technologies emanating from Industry 4.0 with the principles of sustainable manufacturing. Such integration makes production systems increasingly environmentally friendly, as well as more socially and economically beneficial. Jamval at al. [1] state that Industry 4.0 facilitates the implementation of sustainable manufacturing both directly and indirectly and claim that non-optimized supply chains are the main barriers to the introduction of sustainable development in the latest production technologies related to Industry 4.0. Sustainable manufacturing introduces the possibility of producing economically effective short series of non-standard products in factories closest to the order recipients. This, in turn, reduces the need for storage space, transport distances, greenhouse gas emissions and pollution [2,3,4,5]. Industry 4.0 technologies can increase the environmental efficiency of circular economy processes in the field of recycling, reusing, redesigning and regeneration by providing the necessary information about the condition of the product and error detection [6]. Moreover, they reduce production waste generating, which is an integral part of sustainable production. Thus, the development of technology in the field of Industry 4.0 has a direct impact on sustainable manufacturing [7]. Kaivo-oja at al. [8] notice that sustainable Industry 4.0 and sustainable manufacturing should be built concurrently.
Sustainable manufacturing is linked to Industry 4.0, which includes a vast number of technologies. Attempts to define them were presented by Rüßmann [9] and Wee [10]. They identified the same set of technologies. In their view, the components of the fourth industrial revolution cover nine areas: Industrial Internet of Things [11,12,13], Cybersecurity [14,15,16], Autonomous robots [17], Additive Manufacturing [18,19], Optimization & Simulation [20,21], Horizontal and Vertical System Integration [22,23], Cloud Computing [24,25], Big Data Analysis [26,27] and Augmented Reality [28,29]. Each of the above nine Industry 4.0 areas can contribute to sustainable manufacturing. For example, failure to take into account the principles of cybersecurity in manufacturing companies may result in cybercriminals taking control of the production IT systems and maintenance systems along with critical infrastructure. As a result, there may be an uncontrolled emission of pollutants into the air, leakages and discharges of waste into water reservoirs as well as damage to the health of employees. Falsification of the data transmitted between the participants of the Industry 4.0 process, e.g., between an ordering party and a manufacturer, may cause disruptions in supplies, starting the production of unsolicited products, increasing the amount of waste and energy consumption, and redundant transport.
Industry 4.0 is currently facing a number of new challenges [30] including remote work of employees [31]. Until now, it has usually covered back-office employees. Currently, it is a feasible mode of work also available for production workers. This enables progressive robotization, numerical prototyping, remote quality control capabilities, reducing the necessary human staff, as well as the dissemination of cloud programming. At the same time, it is another impetus to increase the amount of processed and stored data [32]. Recruiting technically skilled workers in increasingly digitized companies poses another challenge [33]. People from the next, younger and younger age groups are entering the labour market, whose needs and expectations should be taken into account by any company in order to effectively implement the new Industry 4.0 technologies and maintain the continuity of production. Another challenge is the lack of interoperability [34] of components, products and systems. Industry 4.0 naturally introduces agile methods of operation, however, the lack of interoperability makes it difficult for companies to implement innovations and even change suppliers.
As the COVID-19 virus has spread around the world, sustainable manufacturing, Industry 4.0, and technologies related to them can be an essential tool for an economic recovery, driving the shift to sustainable production. However, the measurement of Industry 4.0 is difficult due to the lack of a unified definition of this term and data, and methods for its measurement [35]. Despite this, companies at different levels of maturity and readiness for sustainable manufacturing should implement modern technologies referring to it, now and in the after COVID-19 period, along with the growing interest in sustainable development.
Enyoghasi et al. [36] point out that among the above nine features there is a research gap in the area of cybersecurity for modern and sustainable manufacturing. Corallo et al. [37], based on a review of the latest literature, also indicate the lack of positions indicating to companies the specific and necessary solutions in the field of cybersecurity and notice the existence of gaps in the methods of assessing the impact of cybersecurity on the development of Industry 4.0.
Esmaeilian at al. [38] summarize that there is a lack of scientific research on the topic of sustainable manufacturing, Industry 4.0 and cybersecurity methods. Additionally, compared to other areas, there is a limited number of articles devoted to cybersecurity in sustainable manufacturing and Industry 4.0 issues [39]. It is the least recognized area of sustainable development. Therefore, there is a need for detailed research to explore the possibilities of developing a sustainable production strategy by increasing the level of cybersecurity. Often these concepts are treated separately in the literature. Yadev et al. [40] stated that one of the Industry 4.0 technologies that contributes to sustainable development in the context of production is cybersecurity management. The same postulates are made by Gmelin et al. [41] and Xu et al. [42]. Blockchain digital security technology is utilized by sustainable manufacturing to increase data cybersecurity in supply chains and the manufacturing process. The same mechanism can be used to analyse indicators related to sustainability, including the use of illegal production resources in the production process and illegal work by stakeholders [38]. Moreover, the blockchain security technology used in the industry may contribute to the popularization of green behaviour among the Industry 4.0 participants and reduce operating costs by minimizing the use of paper.
Standards, recommendations, and catalogues of good practice published by international organizations, government agencies or recognized associations can directly support companies in implementing cybersecurity solutions. However, they are often solutions dedicated to selected industries, with the preference for critical infrastructure protection. Cybersecurity of networks and information in the European Union is the subject of the NIS EU Directive 2016/1148 [43]. The implementation of these solutions in the Member States should increase national and Community capabilities to protect basic digital services. The European Network and Information Security Agency (ENISA) and the European Cyber Security Organization (ESCO) have successively published further standards in the field of industrial cybersecurity [44,45]. More well-known cybersecurity guides published by local regulators include the ANNSI publication set [46,47,48] by the French Network and Information Security Agency (ANNSI) and the Industrial Control System Security Compendium [49] by the German Federal Office for Information Security (BSI). The ANNSI and ICS guides are intended for the management of industrial companies and contain sets of good cybersecurity practices and define the necessary hardware, organizational and personnel resources, as well as audit methods for the implemented cybersecurity solutions. The US federal agency, the National Institute of Standards and Technology (NIST) has issued a group of guides NIST 800-53 [50]. Similar to them, the ISO/IEC 27000:2018 [51] standards were published by a non-governmental organization, the International Organization for Standardization (ISO). These both globally recognized groups of regulations introduce over a dozen sets of cybersecurity structures, the implementation of which in the company ensures that a good number of important requirements in the field of security management are covered. Increasing cybersecurity in industrial control and automation systems can be achieved by applying the ISA/IEC 62443 [52] series of standards published by the International Society of Automation (ISA) and the International Electrotechnical Commission (IEC). In addition to the regulatory solutions presented above, companies can use other approaches and methods as guides to facilitate the implementation of cybersecurity solutions. One of them is risk assessment.
Cybersecurity effectiveness assessment can be conducted parallelly with risk assessment in industrial systems [53]. Although both analyses have different goals, risk assessment helps to locate and assess cybersecurity threats [54]. An additional advantage of such a combined analysis is the ability to focus security operations on potential sources of security threats highlighted in the risk analysis [55].
Another way to implement the cybersecurity solutions and assess the current security status of industrial companies is the DevOps methodology [56] and the related agile methodology [57] taken from software production. Both approaches can be used in the implementation and subsequent maintenance of security mechanisms. The methodologies are based on the phases: development planning, testing new solutions, ongoing service, flexible implementation of new versions and constant monitoring of correctness and performance.
To choose the best cybersecurity solutions that fit the nature of activities of companies, methods for evaluating these solutions are helpful. In the work of Leszczyna [58], based on an extensive review of the literature, it was found that although cybersecurity issues have been known for decades and there are many methods of their assessment, there are only a small number of articles that systematically review these methods of assessment. Particular attention was paid to the possibility of the practical application of the analysed methods. The vast majority of published works reviewing cybersecurity assessment methods are not of practical use. They include only preliminary, pilot or hypothetical solutions in the field of cybersecurity. Often, there are also no in-depth descriptions of the methods used or their application requires unique support tools. It is also worth paying attention to the possibility of testing IT solutions in the field of cybersecurity based on uniform criteria. The review of available solutions indicates over 70 tools to support testing [59].
Most of the items in the literature are based on theoretical research. Lots of research studies on sustainability and Industry 4.0 are conducted in a general manner, without examining the mutual influence of the most important elements: a product, systems, production processes and cybersecurity on improving the sustainable production process. As aforementioned, with the growing popularity of sustainable manufacturing and Industry 4.0 processes, the amount of information sent between participants in these processes is increasing, which, equally, makes companies increase concerns about the cybersecurity of important databases and the final slowdown in the pace of implementing the principles of sustainable development in manufacturing companies. Therefore, to counteract this phenomenon, it is necessary to develop a set of cybersecurity measures and criteria, the introduction of which will halt this unfavourable trend and become a driving force for the further development of sustainable manufacturing.
It is difficult for the participants of sustainable Industry 4.0 processes to determine the best way to ensure the company’s cybersecurity, supported processes and data exchange, as well as the best implementation strategy for individual cybersecurity groups. As a result, a bad decision may be made and resources may be misallocated. The introduction of new solutions in companies usually means various organizational changes and new ways of handling processes, additionally, the emergence of new technologies. The implementation of cybersecurity solutions entails the occurrence of similar changes as mentioned above.
In this paper, three groups of measures have been proposed to describe the cybersecurity sphere: operational, technological, and organizational. In this context, the research questions raised in this article arise: what should the order of implementation of these groups be? Which of them is in fact the most significant? The article also proposes seven cybersecurity areas containing twenty criteria. They should be taken into account when implementing a security mechanism. Another research question is which of these parameters and areas are the most vital? In view of the above questions, a hypothesis to be verified can be put forward: the sphere of technological solutions is the most essential group of cybersecurity measures in the scope of processes in Industry 4.0. Research questions were addressed in Section 3. Cybersecurity, a Sustainable Manufacturing Driving Force’ and 5. Results and Discussion’. The hypothesis was verified in Section 5.
The implementation of security solutions is costly and time-consuming in technology. Finding answers to the questions posed and verification of the hypothesis may allow modern manufacturing companies to correctly allocate human and technical resources and reduce the risk of making a mistake when implementing cybersecurity solutions for the needs of Industry 4.0 processes.
Despite the fact that the scientific articles contain examples of the use of hybrid multi-criteria decision methods in the area of Industry 4.0, the gap in this respect is indisputable. In principle, there are no articles on the subject of the sustainable Industry 4.0 production proposing a three-tier cybersecurity scheme covering groups of measures, dimensions and security criteria, as well as developing an evaluation of the elements of this scheme using the DANP-PROMETHEE II method. This article fills this gap.
This work contributes to the literature by providing: (i) a proposal for a cybersecurity structure divided into three groups of measures, seven dimensions and twenty criteria necessary to be implemented to achieve sustainable manufacturing under Industry 4.0, and (ii) a ranking of individual elements of this cybersecurity structure obtained by using the hybrid methodology of the combined DANP (DEMATEL and ANP) and PROMETHEE II methods.
The remainder of the article is organized as follows: Section 2 describes the Industry 4.0 digital support for sustainable production with an example of its use. Section 3 presents cybersecurity as a driving force for sustainable manufacturing with the structure of the proposed division of cybersecurity elements and their impact on sustainable development. Section 4 describes the connected DANP and PROMETHEE II methodologies used to evaluate the proposed safety parameters. Section 5 presents the evaluation of the criteria, dimensions, and groups of cybersecurity measures using both methodologies. The last section presents concluding remarks and an industry recommendation.
2. Sustainable Manufacturing Support by Digital Technologies of Industry 4.0
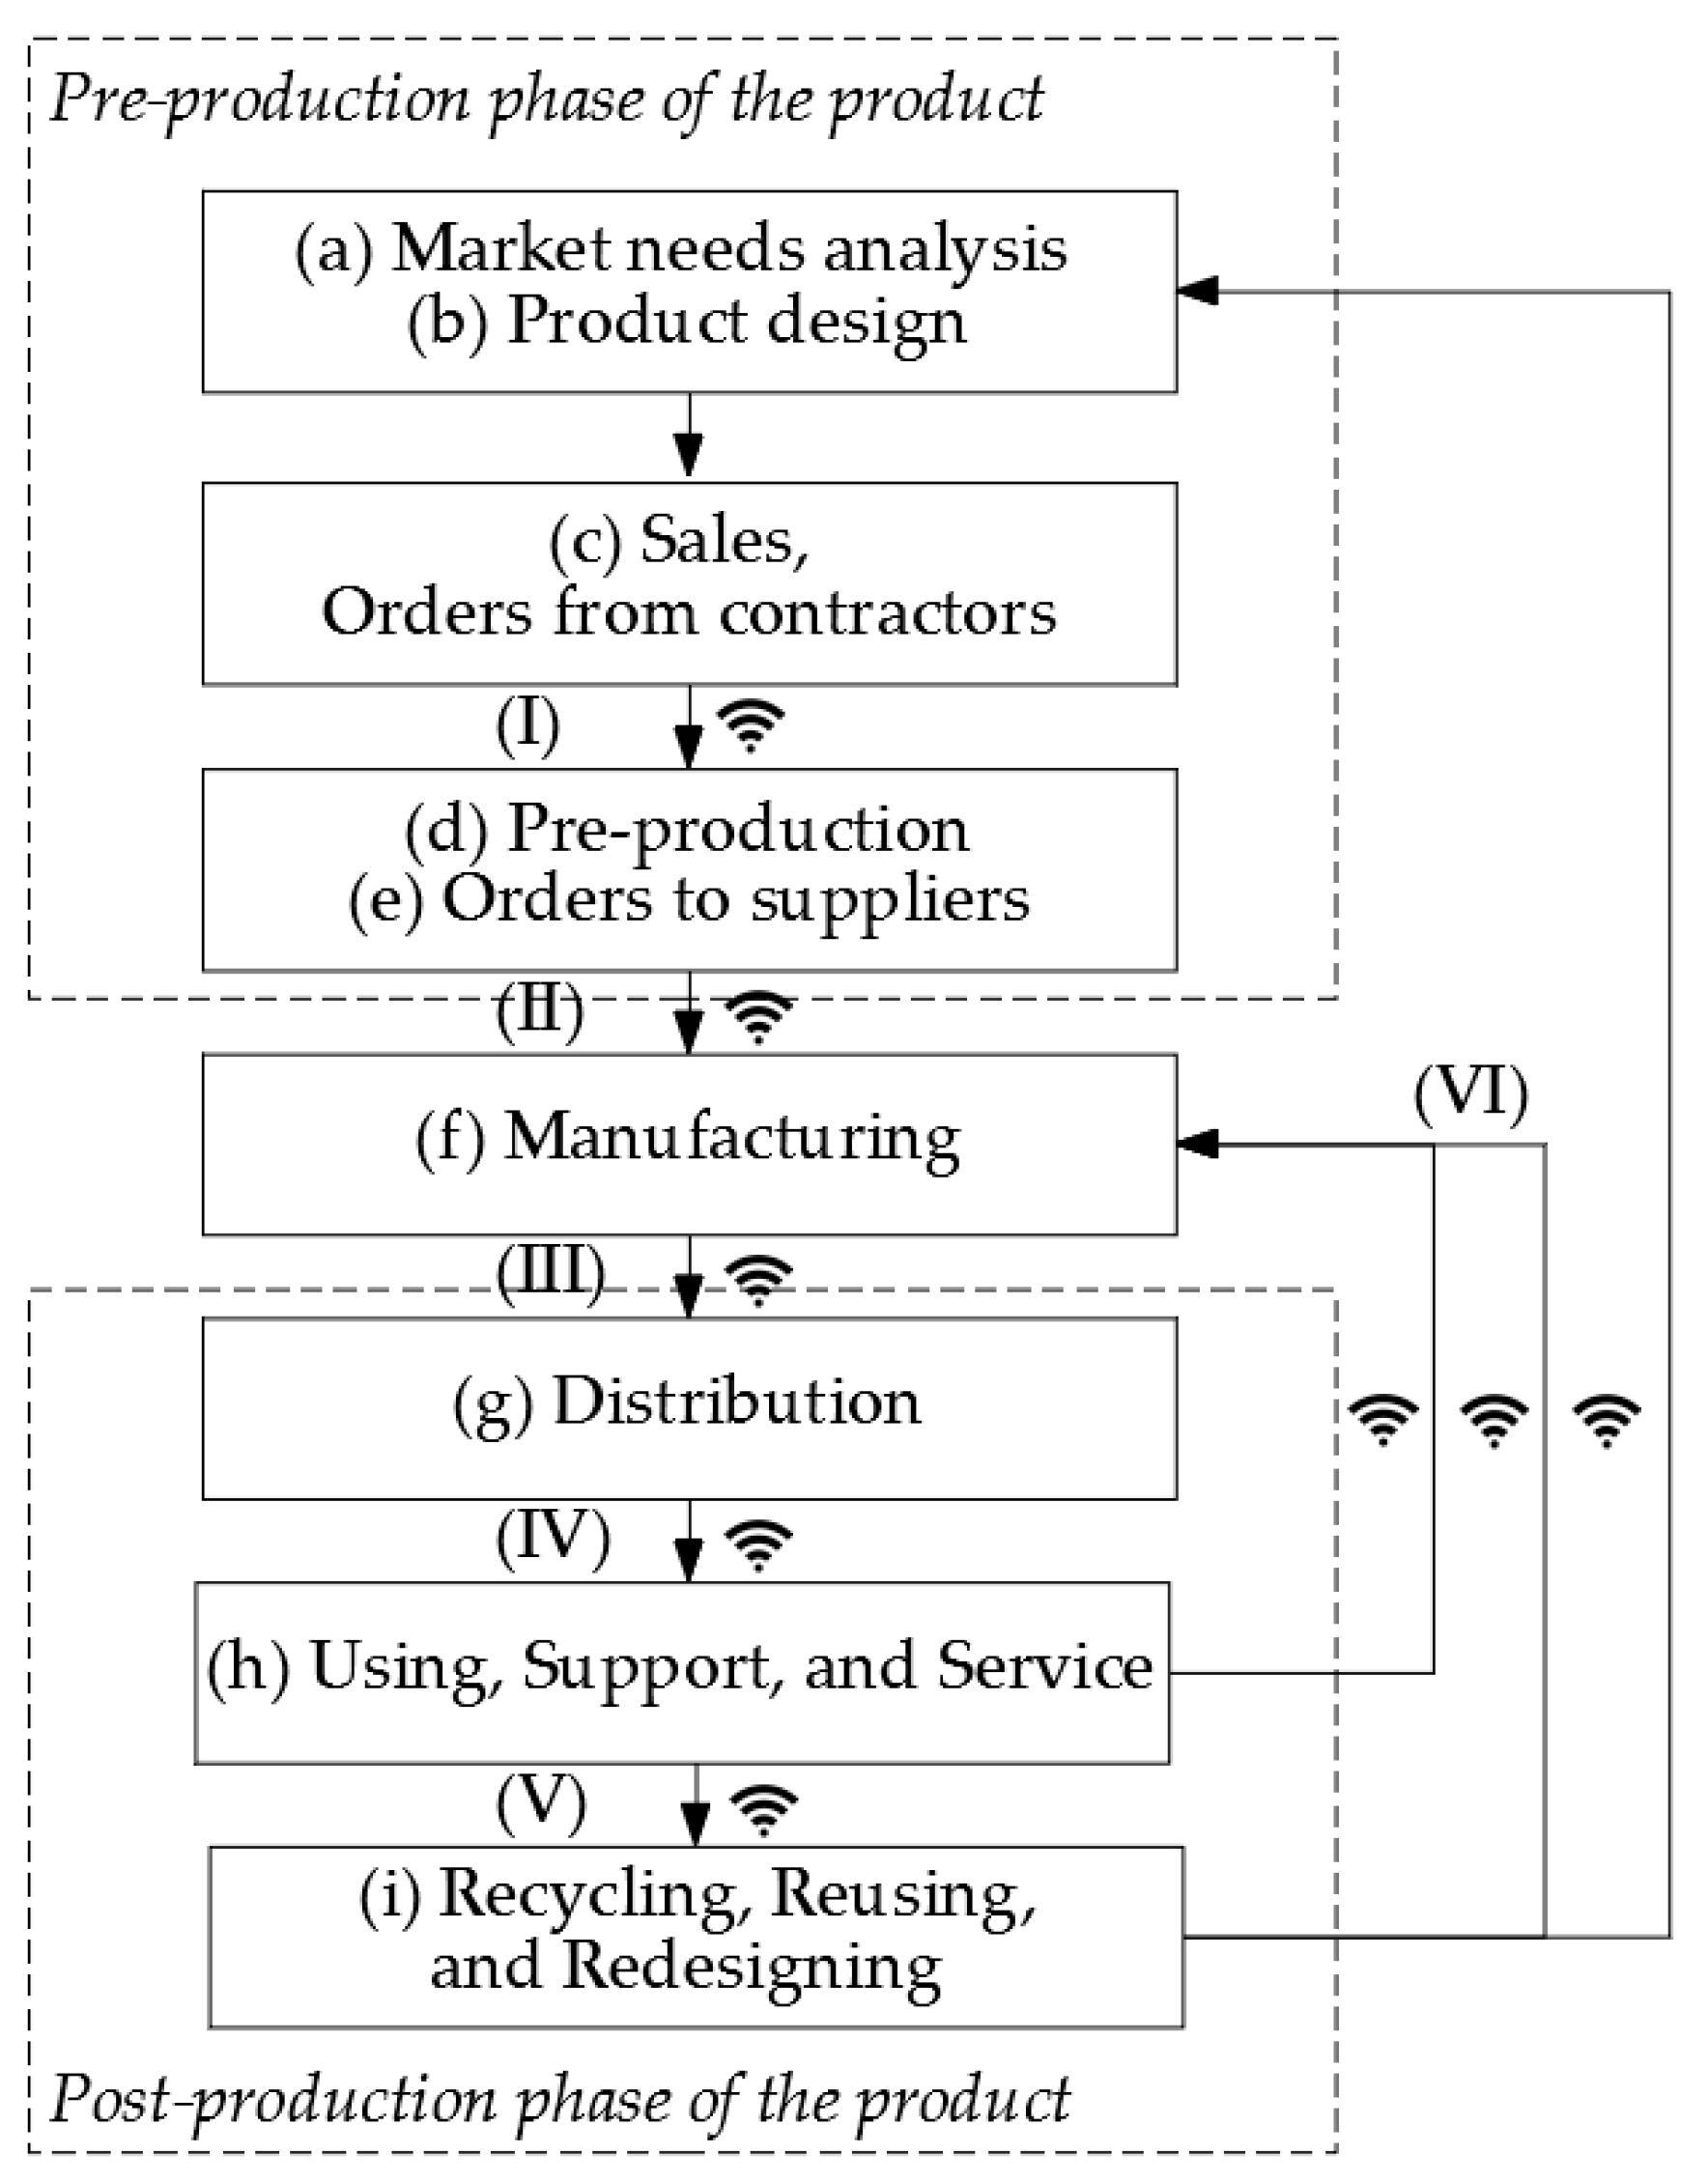
The example of digital data exchange between the participants of the Industry 4.0 processes presented in this section was based on the Polish company Nowy Styl. It is the largest manufacturer of office chairs in Central and Eastern Europe and one of the largest in Europe and, at the same time, one of the largest manufacturers of chairs installed in stadiums around the world. An example of the company’s potential is a prestigious contract for the supply of seats for the new stadiums built for the 2022 FIFA World Cup in Qatar. The company has production plants in several countries, including fully automated ones, and intensively implements the Industry 4.0 solutions so that items are produced in an environmentally friendly and effective manner, as well as tailored to the preferences of customers. Figure 1 shows the processes of digital data exchange between process participants within Industry 4.0. Six of these data exchange steps are marked as (I)–(VI). It is worth noting that in the absence of the implementation of one of the stages (I)–(VI), the company may run the original classic production and service processes. On the other hand, such an evolutionary approach enables companies to gradually reach the full implementation of Industry 4.0 solutions. At Nowy Styl, the Industry 4.0 solutions were implemented in stages (II)–(VI). The missing stage (I), however, is crucial to fully exploit the possibilities of modern production. Remote order placement by the contractor, combined with data exchange (I) between the ordering party and the manufacturer, in the era of Industry 4.0 enables, in theory, direct and remote start of the production process. However, in practice, the main obstacles are: the lack of integration of IT solutions owned by individual parties to the process, the lack of support by ERP/MRP systems of the Industry 4.0 solutions, the operation of ERP/MRP applications owned by the parties in various operating systems (e.g., Microsoft Windows IoT, Linux, macOS and Android), as well as the lack of a coherent cybersecurity mechanism accepted by the parties that guarantees the integrity and non-repudiation of the origin of the data. Below, partly based on the business processes occurring in the described company, a generalized sustainable production process is presented, which can be an example for companies that would like to take advantage of the opportunities offered by the Industry 4.0 solutions.
A generalized chain of activities: pre-production, proper production and post-production is presented in Figure 1. The introduction of sustainable production processes requires a comprehensive use of Industry 4.0 technologies. The mass data transfer occurring at each stage (a)–(i) is characteristic and the communication between the IT systems of the process participants: the ordering party, component supplier, producer, distributor, recipient and service, and the need for cybersecurity these transmissions. The symbol of wireless transmission in Figure 1 means encrypted and protected data transfer over the Internet.
In the first stage (a) presented in Figure 1, companies conduct market needs research and on this basis, new products are designed (b). Subsequently, as a result of sales activities (c), an order for a product from a contractor or customer is placed via the business-to-business cloud platform. In the era of Industry 4.0, production orders can also be generated directly by cyber-physical systems. Physical shortages of goods in a warehouse or store, registered with the use of cyber-physical systems (e.g., a photocell recording the achievement of a defined minimum state) may result in the automatic creation of a digital (cyber) production order. Based on this real-time data and big data analysis of rotation and order history, the production volume is defined in such a way as to avoid unnecessary waste and wastage of components, and thus increased use of resources. In line with the principles of carbon neutrality and sustainable energy consumption, the production schedule is adjusted to maximize the use of renewable energy obtained from energy exchanges. Based on the big data analysis of aggregated orders, the production plant to which the order is directed is determined. The plant that is geographically closest to the majority of recipients is selected. Thus, production plants produce for the needs of local societies, the support of which is at the heart of the idea of sustainable development. Local production also means optimizing the location of warehouses close to major logistics hubs, while reducing warehouse space and thus minimizing energy consumption, which lowers the carbon footprint of companies. In the ERP/MRP system, a flexible production process is prepared (d) with automatic reservation of devices, materials and manpower and the adjustment of the production technique, which is energy and material-efficient and aims to minimize water consumption. At the same time, thanks to the cloud-based integration of the ERP systems and B2B portals, orders for components that are missing for production are automatically placed at the geographically closest suppliers (e). Production procedures, quantity and types of products are established. On this basis, electronic job cards with information about individual operations to be performed are generated for individual employees. In the case of people with a similar level of qualifications, the ERP system, based on a defined competency matrix, evenly distributes tasks between individual employees, so that there are no clear disproportions in the workload. It is an element of sustainable work that supports a good lifestyle and fairness among people. The possibility of a holistic approach to effective production management is a significant advantage of Industry 4.0 in the context of sustainable production. The warehouse system uses automatic locking mechanisms for components intended for production. As a result, at the commencement of production (f), there is no shortage of materials, of which the surplus of deliveries increases road traffic and environmental pollution. The manufactured goods are stored in the finished goods warehouse and blocked according to orders for individual recipients.
Augmented reality technology supports employees in accepting and issuing goods from the warehouse and loading goods onto means of transport according to the FIFO/LIFO method. The ERP system of a production company is integrated with smart house solutions in the warehouse. The warehouses are equipped with systems to reduce energy consumption for lighting, with motion sensors and maximizing the use of natural daylight owing to the adapted building architecture. Heating uses renewable energy sources, and electricity comes from photovoltaic panels, making the location of the warehouse independent of the local technical infrastructure. The data, which flows through cyber-physical systems to the ERP system, about the situation in dispersed warehouses is assessed using big data analysis to determine the most energy-efficient so-called warehouse operation scenes. The constant exchange of data on stock levels between the IT systems of the manufacturer and the ordering company enables effective distribution planning (g). In such a case, direct distribution of goods from the producer’s finished goods warehouse to the recipient’s warehouse is often used, omitting the intermediaries, which is consistent with the sustainability assumptions and applied in the case of additive manufacturing. It is important to introduce an effective return process to the packaging manufacturer in accordance with reverse logistics with the constant cooperation of contractors. On the manufacturer’s premises, autonomous vehicles powered by renewable energy are often used for internal transport. External transport is carried out using multimodal transport, along with intelligent route planning and integration with the ITS systems to help minimize the journeys of heavy vehicles through highly urbanized areas. Intelligent management of vans also includes forecasting and monitoring pollutant emissions and guiding drivers to maintain an eco-friendly driving style with the reduction of CO2 emissions and fuel consumption, also through the integration with intelligent parking lots. When the products reach end-users, their technical condition is monitored thanks to the cyber-physical systems and IoT (h). As a result, the products are sent to inspections at the right time, preventing premature wear and replacement. In the event of a failure, service and complaint processes are carried out. Modern solutions in this area, in line with the idea of sustainable development, introduce remote handling of these events through online portals. The information architecture in such web solutions is focused on the good of the client, minimizing their effort to report the event and obtain a high level of satisfaction. In turn, the manufacturer increases work efficiency by automating online applications. The coupling of the recipient’s and manufacturer’s IT systems, including online service portals, enables remote diagnosis of the technical condition and a remote decision to replace the product with a new one without the need for additional transport with the shipment of the advertised product, which reduces the manufacturer’s carbon footprint. Based on the information obtained by the manufacturer from product users or product parameters read directly by the cyber-physical systems, companies can determine the causes of dominant failures and redesign manufactured products to increase the level of recycling, reusing, and redesigning (i) in accordance with the principles of reuse and circular economy. It should be emphasized that the above example illustrates the strong relationship of Industry 4.0 digital technologies with the principles of sustainable development in the area of proper production and the related to it pre-production and post-production stages, concerning intensive data exchange via the Internet. At each stage, companies participating in the described process are exposed to cybercrimes, which, especially in the case of production companies, are a significant threat to the natural environment. It may not only cause the possibility of losing control of production systems, discontinuation production increasing material losses, energy consumption and pollution generation, but it also may lead to uncontrolled discharge of pollutants into water or air. In addition to environmental threats, manufacturing companies in the era of connecting the IT solutions to the Internet are exposed to leakage of contractor data and sensitive information from employee files, which may affect the quality and comfort of the life of the local community from which employees are recruited. Additionally, companies may lose production recipes, know-how and solutions protected by patents. Serious threats to cybersecurity-related to the digitization of production processes were presented by Lezzi et al. [39]. In the face of such threats and the absence of a uniform cybersecurity assessment standard, the management staff are relatively reluctant to implement the Industry 4.0 solutions, which, as indicated in the example above, also directly restricts or even inhibits the development of the sustainable manufacturing strategy. Moreover, in the absence of a uniform method ensuring cybersecurity under Industry 4.0, it occurs that production companies paradoxically introduce redundant solutions that contradict the philosophy of sustainability. This happens since to connect their own IT environments with the solutions of contractors, companies often unnecessarily install the IT production systems on redundant servers, separated from the internal IT architecture. As a result, cooperating contractors connect through external portals based on additional servers, which require additional employee service and increase energy consumption. It is worth noting that the introduction of a new server means, for cybersecurity reasons, the necessity to introduce another server to which data is replicated as a backup copy.
3. Cybersecurity, a Sustainable Manufacturing Driving Force
Cybersecurity in the context of sustainable development can be considered from two perspectives. In the first perspective, it is a comprehensive digital solution, the introduction of which enables manufacturing companies to implement digital technologies of Industry 4.0. As individual Industry 4.0 technologies facilitate the introduction of the principles of sustainable development in production, as a result cybersecurity is a factor driving sustainable production. In the second perspective, the contribution of individual components of the cybersecurity structure can be considered. They are presented in Table 1 for three groups of measures and in Table 2 for seven levels of cybersecurity, for the issues of sustainable production in the era of digital transformation. Small and medium-sized manufacturing companies do not usually have the resources to invest in adequate cybersecurity protection. However, even large companies that have the means to remove vulnerabilities do not often know where to start and how to direct their efforts to maximize the effects in this area. Knowing what damage to sustainable development can be caused by cyber-attacks, there is an urgent need to determine the implementation methodology and areas of cybersecurity to reduce the risk associated with the use of digital technologies of the Industry 4.0 era in manufacturing companies.
3.1. The Impact of Three Groups of Cybersecurity Measures (A1–A3) on Sustainable Development
Table 1 presents a proposal to group remedial measures, the introduction of which in manufacturing companies should result in effective control of the cybersecurity area in the sustainable Industry 4.0 circulation. These three groups are operational, technological and organizational measures, marked with codes A1–A3.
The growing interest in new technologies in manufacturing companies is not accompanied by an increase in the demand for security in a given area. In the era of Industry 4.0 [60,61,62], companies are already starting to plan activities in the area of artificial intelligence [63], internet of things [64] or cyber-physical systems [65]. At the same time, however, as for safety priorities, manufacturing companies are still focusing primarily on issues related to the ongoing protection and the performance of their duties. Actions aimed at ensuring cohesion between technological processes and the security of the organization’s functions are much less popular. Thus, it can be concluded that cybersecurity in manufacturing companies is not an integral element in the process of implementing new technologies [37]. Technological progress is accelerating. Therefore, the use of methods from the past decades to fight the challenges of the present times seriously threatens the IT security of manufacturing companies [39]. Cybersecurity is the resistance of information systems to actions violating the confidentiality, integrity, availability and authenticity of the processed data or related to the services offered by these systems. The concept of cybersecurity is related, among others, to the protection of information processing in the ERP/MRP systems [66,67]. Cybersecurity threats can be divided into external and internal ones [68]. An increasing percentage of threats to the company’s IT security results from internal factors, e.g., through deliberate or accidental disclosure of sensitive data by the company’s employees. The greatest challenge in protecting against external threats is the need to constantly adapt to more frequent and sophisticated attack methods. It is worth emphasizing that enterprises are more and more often obliged by law to implement appropriate solutions in the field of cybersecurity because an incident that cannot be prevented may have a critical impact on many other areas of the organization’s operations, including its customers, partners and contractors. Ensuring an appropriate level of IT security for a manufacturing company is a complex process. It is not enough to install a good antivirus program on company computers.
3.2. The Impact of Seven Cybersecurity Dimensions (D1–D7) on Sustainable Development
Based on the literature review, a list of twenty cybersecurity criteria grouped in seven dimensions (D1–D7) in Table 2 is compiled.
3.2.1. Trust Services—D1 Dimension
Trust services include an electronic signature, electronic seal, electronic time stamp, and registered electronic delivery [69,70,71,72]. These solutions increase the security and credibility of electronic documents (e.g., orders from contractors, orders for components for production, material lists, production orders, material collection evidence, evidence of product transfer to the warehouse, worksheets, instruction cards, product safety certificates, warranty documents, waybills, invoices and contracts.), especially in the case of remote work, which has become more and more common. In the context of sustainability, these solutions are characterized by IT interoperability ensuring their operation on multiple platforms and in many operating systems as well as support regarding access via the Internet and on mobile platforms. In addition, trust service guarantees on electronic documents reduce the carbon footprint of companies by limiting business trips to sign paper documents in person and sending paper versions of documents, as well as the digitization of management and production control processes.
This contributes to the ‘paperless company’ philosophy and reduces the archival space of these documents and maintenance costs, which reduces direct business costs together with the consumption and waste of paper and has a positive impact on the conservation of natural resources.
On the other hand, ‘Validation and maintaining electronic signatures and seals’ [73,74] enable a continuous renewal of the validity of electronic trust services and the files, electronic documents, and backup copies signed with them after their expiry date. Thus, in the context of sustainability, they introduce the philosophy of reusing from the circular economy in the digital sphere of cybersecurity. The expiration of electronic signatures, which are also used in the digital production control process, may in extreme cases immobilize the current activity of a company and cause an extraordinary decrease in work efficiency and increase in resource consumption.

Table 2.
Cybersecurity dimensions and countermeasures in the framework of Sustainable Manufacturing and Industry 4.0.
Table 2.
Cybersecurity dimensions and countermeasures in the framework of Sustainable Manufacturing and Industry 4.0.
| Cybersecurity Dimension | Cybersecurity Dimension Code | Criterion | Criterion Code | Reference |
|---|---|---|---|---|
| Trust services | D1 | Electronic signature, Electronic seal, and Electronic time stamp | C11 | [69,70,71,72] |
| Validation and maintaining electronic signatures and seals | C12 | [73,74] | ||
| Recorded Electronic Delivery | C13 | [75,76] | ||
| Encryption | D2 | Authentication of online B2B portals; X.509/TLS/SSL protocols | C21 | [77,78,79,80,81] |
| Blockchain technology | C22 | [82,83,84,85] | ||
| Network security | D3 | Adequate technical security of a company network | C31 | [86,87] |
| Optimal network and server architecture | C32 | [88] | ||
| Monitoring and analysis of security incidents | C33 | [89] | ||
| Application security | D4 | Database security | C41 | [90] |
| Establishment of an efficient backup system | C42 | [91] | ||
| Vulnerability scan; Source code analysis to look for software weaknesses | C43 | [92] | ||
| Software updates | C44 | [93] | ||
| Endpoint security | D5 | Appropriate techniques for securing workstations and mobile devices | C51 | [94] |
| Antivirus and antimalware | C52 | [95] | ||
| Penetration testing to find vulnerabilities | C53 | [96] | ||
| Access control | D6 | Establishing a VPN secure remote connection with the corporate server | C61 | [97] |
| Regular training of employees in the field of cybersecurity | C62 | [98] | ||
| Creating rules for managing access to corporate data; User authentication | C63 | [99] | ||
| Cyberattacks | D7 | Intrusion Prevention System and Intrusion Detection System with algorithms to real-time detect the malicious attacks | C71 | [100] |
| Firewall, Gateway, and Proxy | C72 | [101] |
3.2.2. Encryption—D2 Dimension
The authentication of business to business (B2B) web portals of companies participating in the production chain processes is performed using the X.509 certificate. This encryption technique is also used to establish secure VPN connections between contractors. X.509 is an extremely effective solution, and at the same time it does not degrade the efficiency of the company’s IT environment without increasing the carbon footprint. Another technological solution that enables effective data encryption is a blockchain. In the context of sustainable development, its unique IT interoperability is used. It is employed for a multi-platform connection of reporting and data monitoring systems in extensive networks of supply chains of participants in the production process [38]. Indicators related to sustainable development are also reported and analysed, including the use of illegal resources and production materials along with illegal work among contractors. As with trust services, it can reduce paper consumption by securing its digital substitutes, contributing to the conservation of natural resources.
3.2.3. Network Security—D3 Dimension
The production area is particularly vulnerable to attacks due to closed nature of control systems, often using outdated IT technologies. Combining them with the open modern ERP/MRP management systems opens them up to network cyberattacks. Network connectivity has opened the boundaries of industrial systems that were usually closed, making it necessary to control the operation of industrial communication channels and information flowing through the network, especially in wireless extensions of the industrial IT architecture. As a result, unexpectedly, the implementation of modern Industry 4.0 technologies directly accelerates the technical degradation of a machine park.
In the context of sustainability, constant development of software improvements to threat capture algorithms extends the time of using older machinery in manufacturing companies and introduces the philosophy of reusing from the circular economy in the area of IT equipment and production machinery as well as redesigning in the area of software. In the field of IT, solutions related to control systems and network security have the highest priorities and high budgets in companies [87]. These activities prove that companies understand the importance and principles of the proper functioning of safety and control systems. Currently there is an unprecedented increase in the scale of various types of attacks on company networks [102], which can lead to downtime in manufacturing companies, reduce the efficiency of work with the over-scheduled retooling of stopped machines, increase the company’s carbon footprint through excessive energy consumption at the restart and an increased number of losses of material and defective products resulting from an emergency stop of a production line. A properly planned and implemented network cybersecurity architecture thus creates an efficient defence system that facilitates the development of sustainability. In manufacturing companies, networks and control systems are constantly exposed to cybersecurity threats. IT and security departments in companies are responsible for identifying these threats and implementing appropriate solutions. Although the work connected with it is usually repetitive, a large part of it involves the final analysis of data, previously aggregated using big data, by analysts and corporate security departments. In the context of sustainability, the widest possible automation of these activities is expected, which increases the effectiveness of the work of the people involved [103].
3.2.4. Application Security—D4 Dimension
To ensure the stable operation of IT systems in production companies and the security of corporate data, it is necessary to implement a system of effective backup copies and software updates. These issues have a direct impact on increasing a company’s carbon footprint through increased demand for computing power and thus increased energy consumption by servers. Work efficiency also diminishes as a result of extraordinary activities performed by employees. Backup copies are made online in real-time or periodically: daily, weekly and monthly. In practice, this process means a simultaneous launch of several servers that increase energy consumption, which, together with additional infrastructure, are among the most energy-consuming technical devices. The primary working ‘master’ server transmits data to the backup ‘slave’ server, which in modern server rooms replicates the data to another ‘slave’ backup server. It should be remembered that the operation of each server is supported by constantly active, additional power backup systems. Such a solution allows manufacturing companies to be resistant to some cyber threats, but at the same time causes an increased demand for computing power, which is inextricably linked with increased energy consumption. In addition to storing data on interconnected servers’ disks, backup copies are stored simultaneously on external durable media in rooms with appropriate temperature and humidity. Maintaining this infrastructure also increases a company’s carbon footprint.
A modern approach to cybersecurity issues enables the reduction of this carbon footprint by the optimal organization of the cybersecurity process, including copy handling (software and hardware RAID arrays). IT analysts often ‘oversize’ the IT architecture involved in supporting data backups within cybersecurity systems, thus directly increasing a company’s carbon footprint. This phenomenon is analogous to that observed among designers who ‘oversize’ structures by using additional elements to strengthen the system or by increasing the thickness of the elements above the standard. In addition to data archiving, production companies also have the process of versioning important files, i.e., keeping their subsequent versions. This has a direct impact on increasing the volume of information covered by the above backup mechanism. Versioning is especially important when creating new products and their digital prototypes as well as simulations using the finite element method, which also requires significant computing power. Appropriate parameterization of the RAID array allows companies to significantly reduce the duplication of copies of the security and a carbon footprint while maintaining the same level of cybersecurity.
3.2.5. Endpoint Security—D5 Dimension
Ensuring end-user cybersecurity has a direct impact on the sustainability sphere of manufacturing companies. With massive remote work of production company’s employees, the IT devices they use may be a source of cyber incidents. After infecting the internal IT environment, control systems may in this case shut down production lines, causing unplanned downtime, reducing employee efficiency, increasing production waste, water and energy consumption, a company’s carbon footprint as a result of pre-planned control startups. The issue of employee device security was often marginalized as IT equipment was protected by the corporate network (D3 dimension) and application (D4 dimension) security solutions. However, along with the parallel acceleration of the implementation of remote work and Industry 4.0 solutions, home networks that employees use to work remotely using insufficiently secured personal devices have become the target for cybercriminals. This practice will increase with the expansion of remote work and overload in corporate IT departments, which may result in errors in the form of misconfigured servers or unintentional opening of databases [94]. Mid-size manufacturing companies with small IT departments and implemented Industry 4.0 elements are the most vulnerable to attacks, as the rush transition of employees to work remotely from home creates many vulnerabilities that encourage attacks on corporate resources.
It is worth noting that concerning social sustainability, in the event of failures and downtime in production caused by threats in the area of cybersecurity, the satisfaction contentment and job satisfaction of employees drops drastically as well as the image of the company in the local community from which employees are recruited. In the absence of a strictly defined cybersecurity policy, employees begin to feel uncomfortable at work, expecting further incidents, the source of which may be the IT tools they use.
3.2.6. Access Control—D6 Dimension
The human factor is one of the most important causes that threaten the security of the IT environment in manufacturing companies. In the context of sustainability, this means that the awareness of threats, education and training scheme for both production employees and IT departments are becoming important features of the effective use of people, processes and technologies in the area of industrial systems security. Particular emphasis should be placed on solutions to cybersecurity problems related to employees, while not giving up the defence against threats related to technologies used in manufacturing companies [97]. The ‘human factor’ is a broad category of risk that includes external and internal actors, and a broad spectrum of activities: from the unplanned (accidental) to planned (malicious) ones [98]. Cyber-security breaches by those inside a manufacturing organization are potentially the most worrying. Protection against internal factors in the IT space is particularly difficult. Even the most advanced technical security measures may prove to be ineffective if a manufacturing company does not conduct cybersecurity training for its employees.
3.2.7. Cyberattacks—D7 Dimension
Manufacturing companies that have already applied the principles of sustainability in their operations can also apply them in the digital world. In this approach, digital files and databases collected by enterprises create digital data environments with their equivalent in the natural environment. In the case of cyberattacks, data leakage occurs, which, like its counterpart in the real world, causes contamination of the IT environment, namely the disclosure of sensitive company data. To prevent this, companies should implement a sustainable methodology of various methods of protection against cyberattacks. Companies should introduce intrusion prevention systems and intrusion detection systems with algorithms to real-time detect malicious attacks. The systems should have loaded parameters of the carbon footprint of a company’s fixed assets. In the event of an emergency, algorithms developed using big data analysis should shut down the infected IT areas and production machines to protect the area of direct production and maintain the preferred carbon footprint pattern. Firewalls, gateways and proxies should be a complementary group of security solutions against cyber-attacks [101,104].
4. Solution Methodology
4.1. Multiple-Criteria Decision-Methods (MCDM)
The MCDM methods are used to evaluate a variety of, also interacting, criteria based on expert estimates, and to rank the importance of the proposed alternative solutions [105,106,107,108]. The criteria to be assessed can be qualitative or quantitative. Criteria based on qualitative variables are assumed to depend on experts and may be subjective, while quantitative criteria are independent of experts. Several different approaches can be used to transform qualitative to quantitative variables that are consistent with the MCDM methods, including ranking and scoring systems. In this approach, in the decision-making process, qualitative criteria are transformed quantitatively owing to the sets of indicators designed by groups of experts [109]. There are a big number of different methods of solving problems with the use of MCDM known in the literature, also as a part of security issues within critical industrial infrastructure [110,111,112,113].
The advantage of using an expert opinion is their knowledge in their areas of expertise acquired over a long time. Nevertheless, conventional methods of priority analysis do not take into account the roles of experts or the opinions of many experts as input. Meanwhile, a wide number of studies use the expertise of a single expert, or the analysis of multiple experts, taking mean values, which leads to unreliable results. It is worth highlighting an important problem with the expert judgment since his opinion may be driven by personal experiences. Ambiguous methods of assigning importance to criteria may create uncertainty in the results. Thus, the subjectivity of the input parameters automatically influences the quality of decision analysis results.
It is also worth noting that errors related to an expert group decision making can occur when experts use a similar method to evaluate alternatives. When making decisions, it is difficult to determine which problem needs to be addressed and what decision needs to be made. Expert judgments including criteria for alternative solutions have a large impact on the final result of the analysis, and this, in turn, has an impact on the decisions made. Hence, the use of an advanced analytical method removing bias in the opinions of experts and the input data is crucial. An appropriate scientific method that could enable experts to evaluate the various parameters of IT security cannot be readily adopted, especially, when the field of expertise overlaps with different areas of knowledge and experts come from different parts of the industry.
Considering the complexity of cybersecurity, it is necessary to research the development of innovative methods of analysing the interdependence and importance of individual elements. Therefore, it is vital to apply a method that goes beyond traditional decision-making methods involving different experts. The adopted method should capture relevant data as well as enable the interpretation of complex issues understandably.
Based on the literature review, it can be noticed that no previous papers discuss the concepts of cybersecurity in the sustainable Industry 4.0 using MCDM methods. Since some studies deal with IT security in general, they are usually limited and do not allow the best method of data security to be selected from the available alternatives. By taking into account the gaps in knowledge in the previous articles, this paper proposes a hybrid method of decision-making. The proposed decision-making method is the combination of DANP and PROMETHEE II. It allows the assessment of interdependencies and the importance of cybersecurity parameters and their prioritization. The article proposes a two-stage methodology. DANP is used to analyse, evaluate and rank cybersecurity criteria and dimensions in Stage 1. On this basis, the ranking of the best groups of cybersecurity measures is built using PROMETHEE II in Stage 2.
4.2. DANP
DANP is a combination of the MCDM methods [114]. The DANP method assumes that the considered sets of criteria may show close interdependencies with each other, which may serve as a basis for determining the global weight of each criterion. Included in the DANP framework, the DEMATEL method enables the evaluation of complex structures and the analysis of structural models that take into account cause-effect interrelationships [115]. In turn, the ANP method enables an even more extensive and comprehensive assessment of priorities in the decision-making process and the construction of their ranking [116]. The DANP has been used in a variety of research areas, such as the assessment of the competitiveness of the service industry [117], measurement of corporate sustainability indicators [118] or evaluating supply chain performance [119].
4.3. PROMETHEE II
The PROMETHEE methodology was developed as part of the MCDM methods [120]. The PROMETHEE method uses the mechanism of subjective evaluations and enables the determination of rankings and preferences in the decision-making process [121]. It is especially useful and widely used in a variety of decision-making scenarios within IT and business. The method has undergone many modifications and improvements from the PROMETHEE I to PROMETHEE VI method [122]. PROMETHEE algorithm is flexible and allows it to be adapted to meet specific, individual requirements in the evaluation process using integrated methods. Typically this methodology is used when evaluating relatively simple decisions. It is most useful in combination with other MCDM methods, especially the combination of ANP and PROMETHEE [123]. PROMETHEE II allows you to build a vector ranking of alternatives. This makes it the most frequently used variant in the PROMETHEE family of methods [124]. The assumption of the PROMETHEE II method is based on the comparison of pairs of alternative solutions for each adopted criterion which enables the alternatives to be prioritized. The PROMETHEE II method also fulfils its role in assessing decision criteria with different dimensions. As a result, it allows the construction of decision matrices to ensure effective decision-making.
4.4. Individual Steps in the Method of the Integrated DANP and PROMETHEE II
This section presents how the DANP and PROMETHEE II methods are integrated to solve the cybersecurity issue in the information flow process within companies participating in the modern production process in the Sustainable Manufacturing era.
The next stages of the hybrid MCDM method, presented in the article, combining three methods in practice (DEMATEL, ANP and PROMETHEE II), are shown below.
- Step 1.
- The list of dimensions and criteria for cybersecurity
In the beginning, the group of n experts is formed. They establish a list of dimensions, k criteria and measures for cybersecurity that are to be analysed.
- Step 2.
- The first survey questionnaire
Each expert completes two questionnaires (for DANP and PROMETHEE II) consisting of the assessed sets of criteria and proposed groups of measures. The experts have appropriate knowledge and experience in the field they evaluate. The first survey questionnaire is in the DANP method where the ratings are 0 to 4, ‘0′ means no impact, ‘1′ is a very low impact, ‘2′ is a low impact, ‘3′ is a high impact and ‘4′ is a very high impact. Then the values of mutual interactions within pairs of all the criteria are determined. It is assumed that each of the k criteria may influence another criterion, but it cannot influence itself. Finally, n partitive initial direct influence matrices were created by each m-th expert:
where is the assessment provided by the m-th expert regarding the degree to which criterion i affects a criterion j. A group of partial matrices is made.
- Step 3.
- Direct influence matrix Z
Matrix aggregation results in a direct influence matrix given by:
- Step 4.
- Normalized direct influence matrix X
Normalized direct influence matrix X is obtained by using Equation (3):
while s can be calculated through Equation (4):
- Step 5.
- Total relations matrix T
Total relations matrix is obtained by:
while:
and the sum of the items of at least one row or column equals one. It guarantees .
- Step 6.
- The vectors R and C
The vectors R and C representing the sum of the rows and the sum of the columns from the matrix T are obtained by (7) and (8):
and:
where is the i-th row sum in the matrix T. It presents the sum of direct and indirect effects dispatching from parameter i to the other ones. Similarly, is the j-th column sum in the matrix T. It presents the effects that parameter j is receiving from all the other ones. Let and . The relation indicator is obtained. It reflects a net influence. Similarly, the relation vector illustrates the net effect that the factor contributes to the analysed system.
The position indicator is calculated. The position vector reflects the total effect of each factor on the system and illustrates the importance of the criteria in the analysed system. As for , the value of stands for that criterion i influences other criteria as well as the system. Likewise, the value indicates that other criteria influence criterion i.
- Step 7.
- Plotting the data set of
Based on matrix, the influential network map can be plotted in layout.
- Step 8.
- The results analysis
The level of correlations among criteria should be determined. The position of each criterion in the diagram provides information about its significance or level of dependency with other criteria.
- Step 9.
- Normalized total relations matrix
Normalized total relations matrix is obtained by:
where:
A threshold value (e.g., the arithmetic mean of ) must be established. Its exceeding by elements of the matrix helps to determine those of them which have the strongest influence on the others. This enables to establish significant relationships among criteria while ignoring less important ones.
- Step 10.
- Final DANP matrix
The final DANP matrix is obtained by raising to a large power . In this way, it achieves convergence. As a result, a total priority vector is obtained including the weights
for each criterion.
- Step 11.
- Aggregation of the second survey questionnaire
The second survey questionnaire is in the PROMETHEE II method. It is used to evaluate each alternative measure concerning the criteria selected in Step 1 of this process. Ratings from 1 to 5 are used, where ‘1′ is the worst alternative, ‘2′ a bad alternative, ‘3′ a fair alternative, ‘4′ a good alternative, and ‘5′ the best alternative.
Then, the results of this survey questionnaire are aggregated using (2) from Step 3.
- Step 12.
- Deviation function in PROMETHEE II
The deviations are obtained from pairwise comparisons and using Equation (12). A difference in the assessment of experts concerning a criterion j is obtained:
- Step 13.
- Preference function for criteria
According to [119] the preference function of each criterion is determined. Six types of preference function are suggested. Type 1: Usual Criterion. It is a type without any threshold value. Type 2: Quasi-Criterion. It is used for qualitative criteria with a single indifference threshold. Type 3: Criterion with Linear Preference. It is used for quantitative criteria with linear preference up to a preference threshold. Type 4: Level Criterion. It is used for qualitative criteria with two parameters: an indifference threshold and a preference threshold. Type 5: Criterion with Linear Preference and Indifference Area. It is used for quantitative criteria with two parameters: an indifference threshold and a preference threshold. Type 6: Gaussian Criterion, the preference is obtained with the normal distribution in statistics.
Based on the characteristics of criteria from Step 1, the preference functions and measures (from Table 2) in Table 3 are assigned.
- Step 14.
- Parameter values for criteria
For all preference functions and criteria, the parameter value is assigned. For Type 1: Usual Criterion no parameter value is expected. For Type 2: Quasi-Criterion, a parameter value of 0–2 is assumed. The value of 0 specifies neutrality on the less likely use of alternatives for such a criterion. The value of 2 specifies neutrality on the likelihood of alternatives to be used for such a criterion. For Type 3: Criterion with Linear Preference, the parameter value of 0–2 is also assumed.
The value of 0 specifies preference on alternatives concerning such a criterion. The value of 2 specifies preference on the likelihood of alternatives to be used for such a criterion. The most frequently selected parameter value for each type of a criterion was adopted for the analysis.
- Step 15.
- Aggregation of the preference function
Aggregation of the preference function is determined by:
where is the preference function, the weight of relative importance of the -th criterion determined in Step 10 and is the number of criteria assumed in Step 1.
- Step 16.
- Outranking flows for alternatives
In PROMETHEE II alternatives produce a positive or negative outranking flow. The entering flow shows the weakness of the measures and can be obtained by:
The leaving flow shows the strength of the measures. It is obtained through:
The net outranking flow for each measure is shown in Equation (16):
- Step 17.
- Final ranking of measures
Based on net outranking flow, the final ranking of measures is assumed. The higher net outranking flow means preferred measure.
5. Results and Discussion
This unit presents the results based on the integrated DANP and PROMETHEE II method in the assessment of cybersecurity in the sustainable Industry 4.0 sphere. To appoint the cybersecurity dimensions and criteria shown in Table 2, twenty-one expert interviews are executed. Twelve of the experts have deep knowledge in the technological sphere of cybersecurity, the next six are experts in the field of Industry 4.0. The last three are experts in both sustainable manufacturing and cybersecurity. Seven cybersecurity dimensions and twenty criteria presented in Table 2 were established for further analysis. These dimensions and criteria can be used as a guide in assessing cybersecurity in sustainable manufacturing and Industry 4.0.
5.1. DANP Stage
The experts assess interactions between pairs of all criteria by using a 5-grade scale (from 0 to 4). The example of a filled questionnaire is presented in Table A1 in Appendix A. In this method, zero elements on the diagonal of the matrix mean that the assessed criteria do not affect themselves. The remaining elements are non-zero values. The higher the value, the greater the influence of one criterion on the other. Based on Equation (1), twenty-one partitive initial direct influence matrices are received. Matrix aggregation (2) results in a direct influence matrix Z (Table A2 in Appendix A). Next, based on Equation (3), normalized direct influence matrix X (Table A3 in Appendix A) is obtained. Depending on Equation (5), total relations matrix T (Table A4 in Appendix A) is formulated. The matrix T can be viewed as a set of two submatrices. The first one is a submatrix based on the seven cybersecurity dimensions, the second one is a submatrix based on twenty criteria. Table 4 presents the two indicators and determined based on Equations (7) and (8) as well as the relation and position indicators.
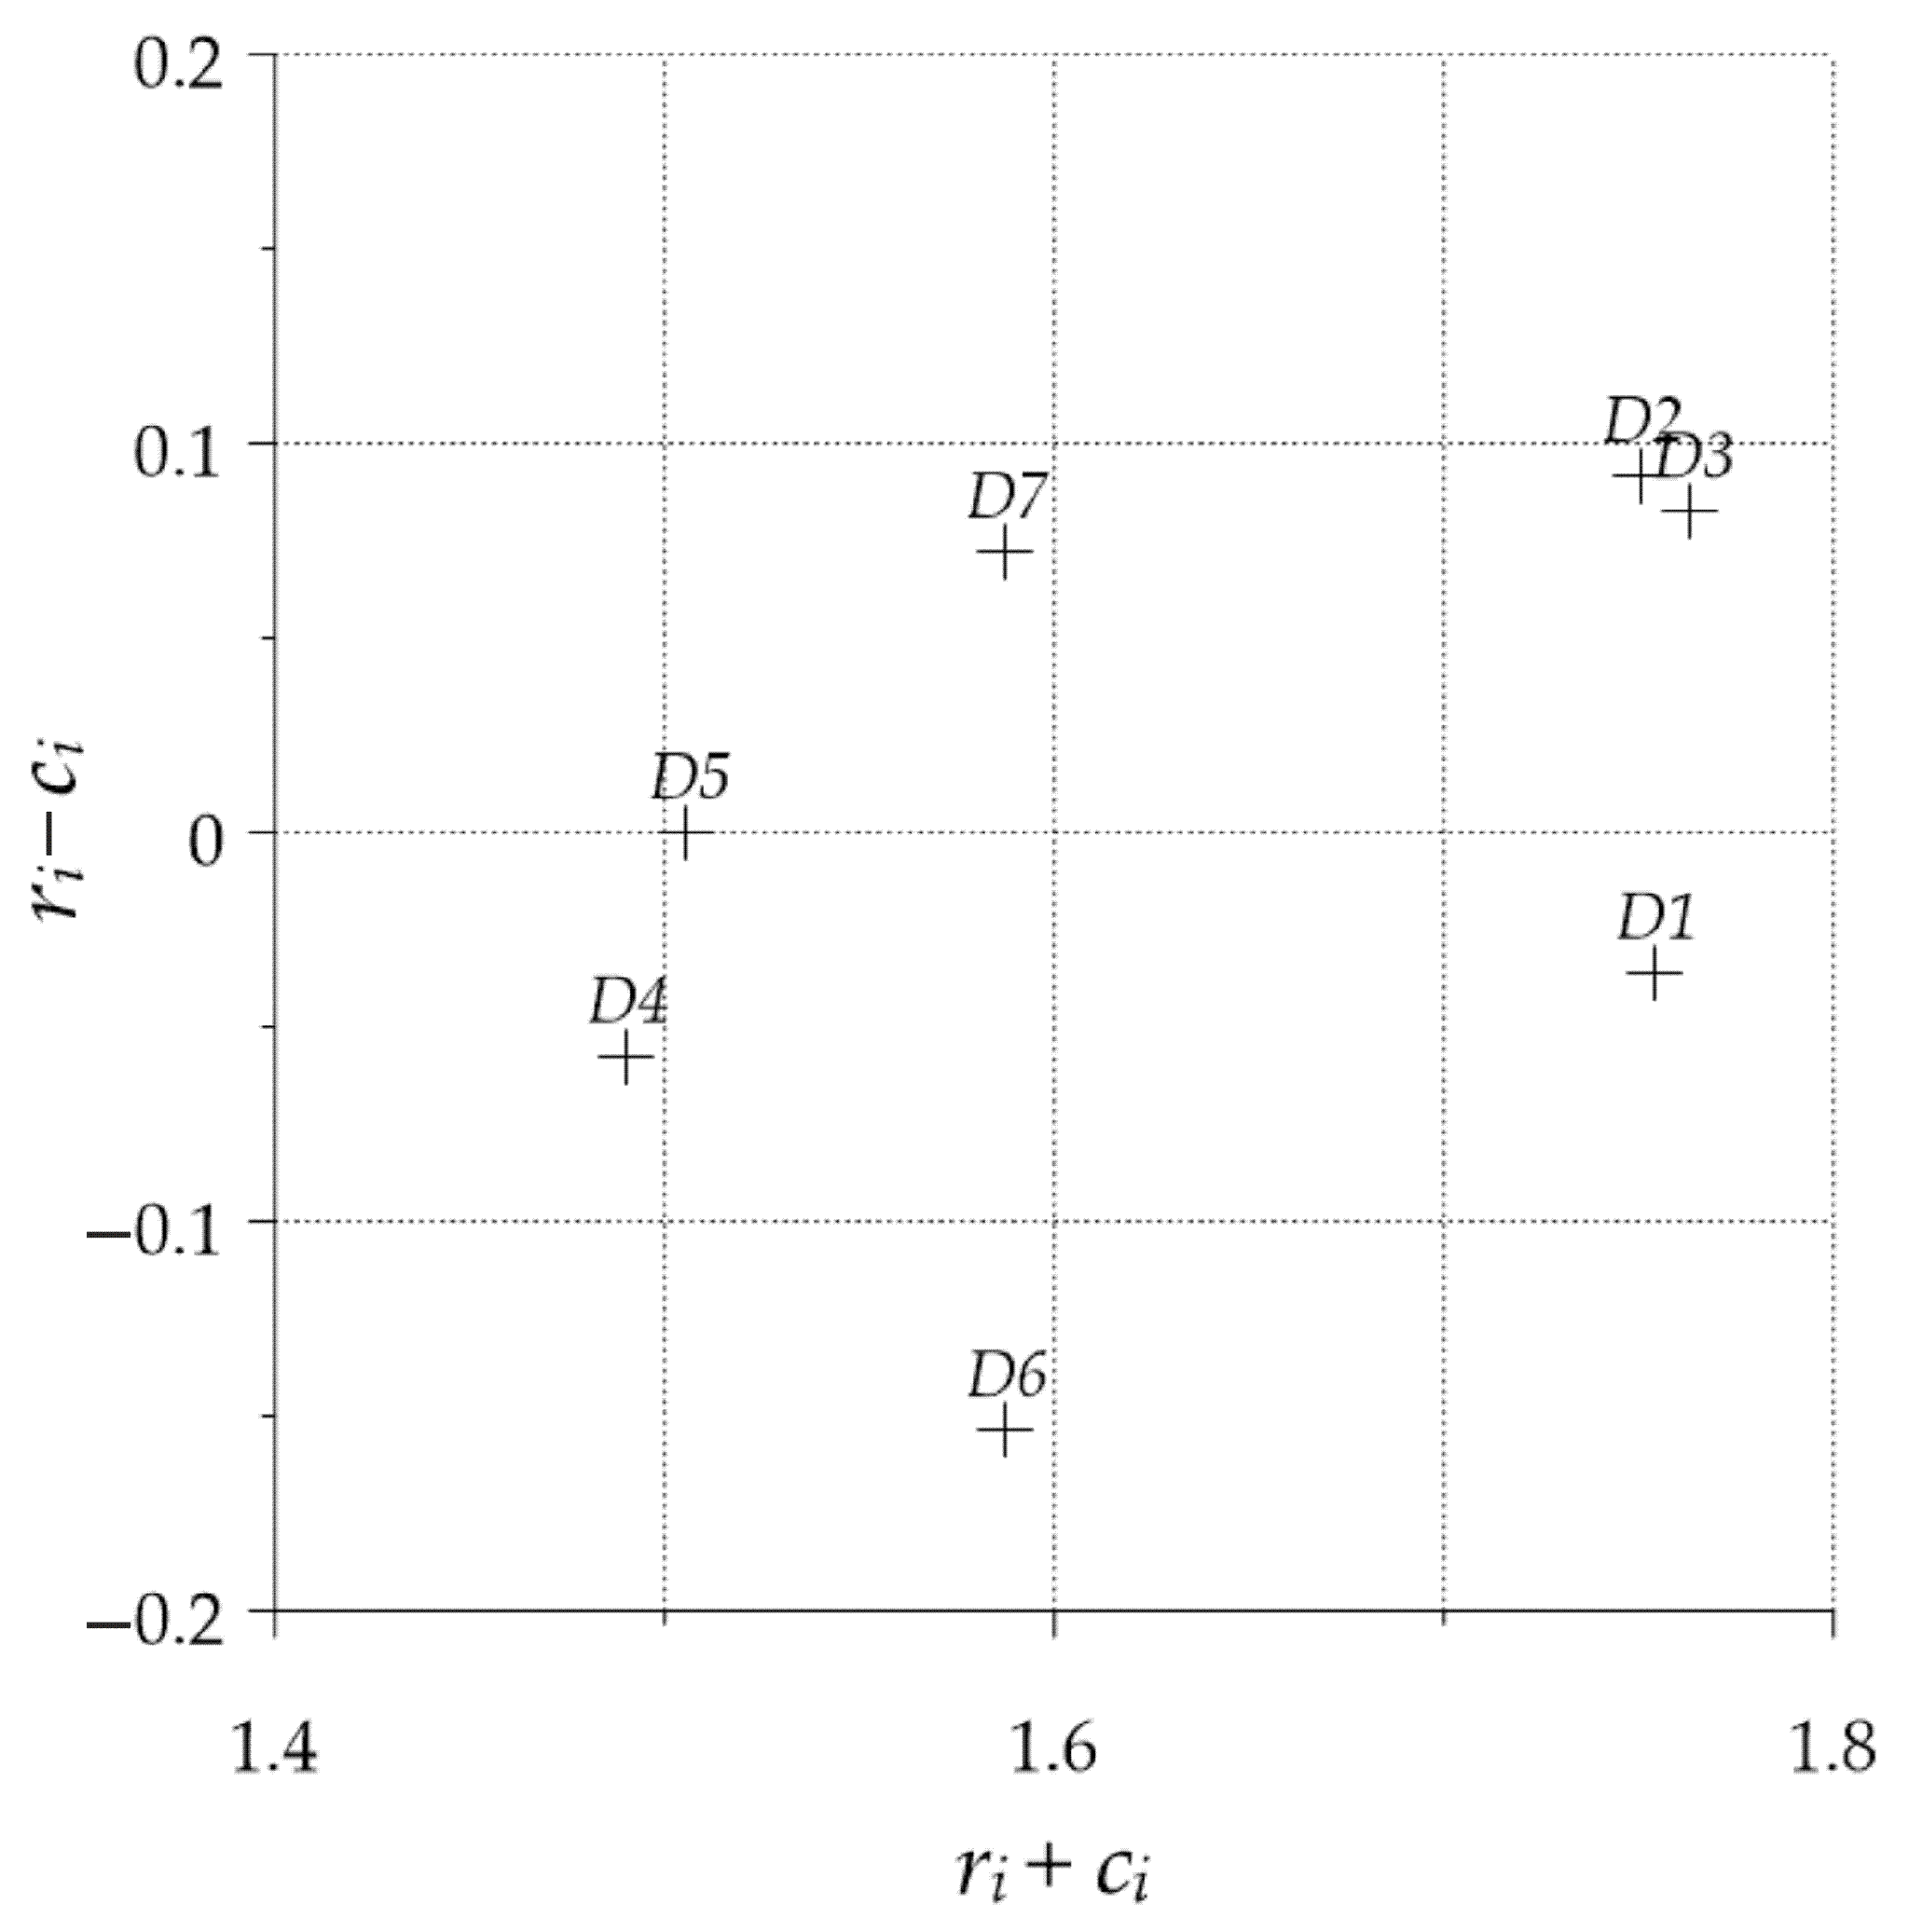
The relation diagram of can be plotted (Figure 2) for the seven dimensions from Table 5. The position indicator identifies the importance of each criterion. The respective relation indicator is used to classify cause-effect criteria.
The positive value of this indicator proves that the given cause criterion influences the other criteria. A negative value means that the effect criterion is influenced by the others.
In Figure 2, the dimension D3 (Network security) has the highest value of the position indicator . It reflects the dimension priority among the others marked bold in Table 4. This dimension is the most strongly interconnected with the other dimensions as well as the most important out of the presented seven ones. The dimension D4 (Application security) shows the lowest level of this rate. All dimensions ranked in order of descending importance: D3 (Network security), D1 (Trust services), D2 (Encryption), D7 (Cyberattacks), D6 (Access control), D5 (Endpoint security), and D4 (Application security) are presented. The relation indicator reflects the influence of the analysed dimension on the other dimensions.
In Figure 2, the dimension D2 (Encryption) shows the highest positive value of the relation indicator . It means that this dimension has the most causative impact on other ones.
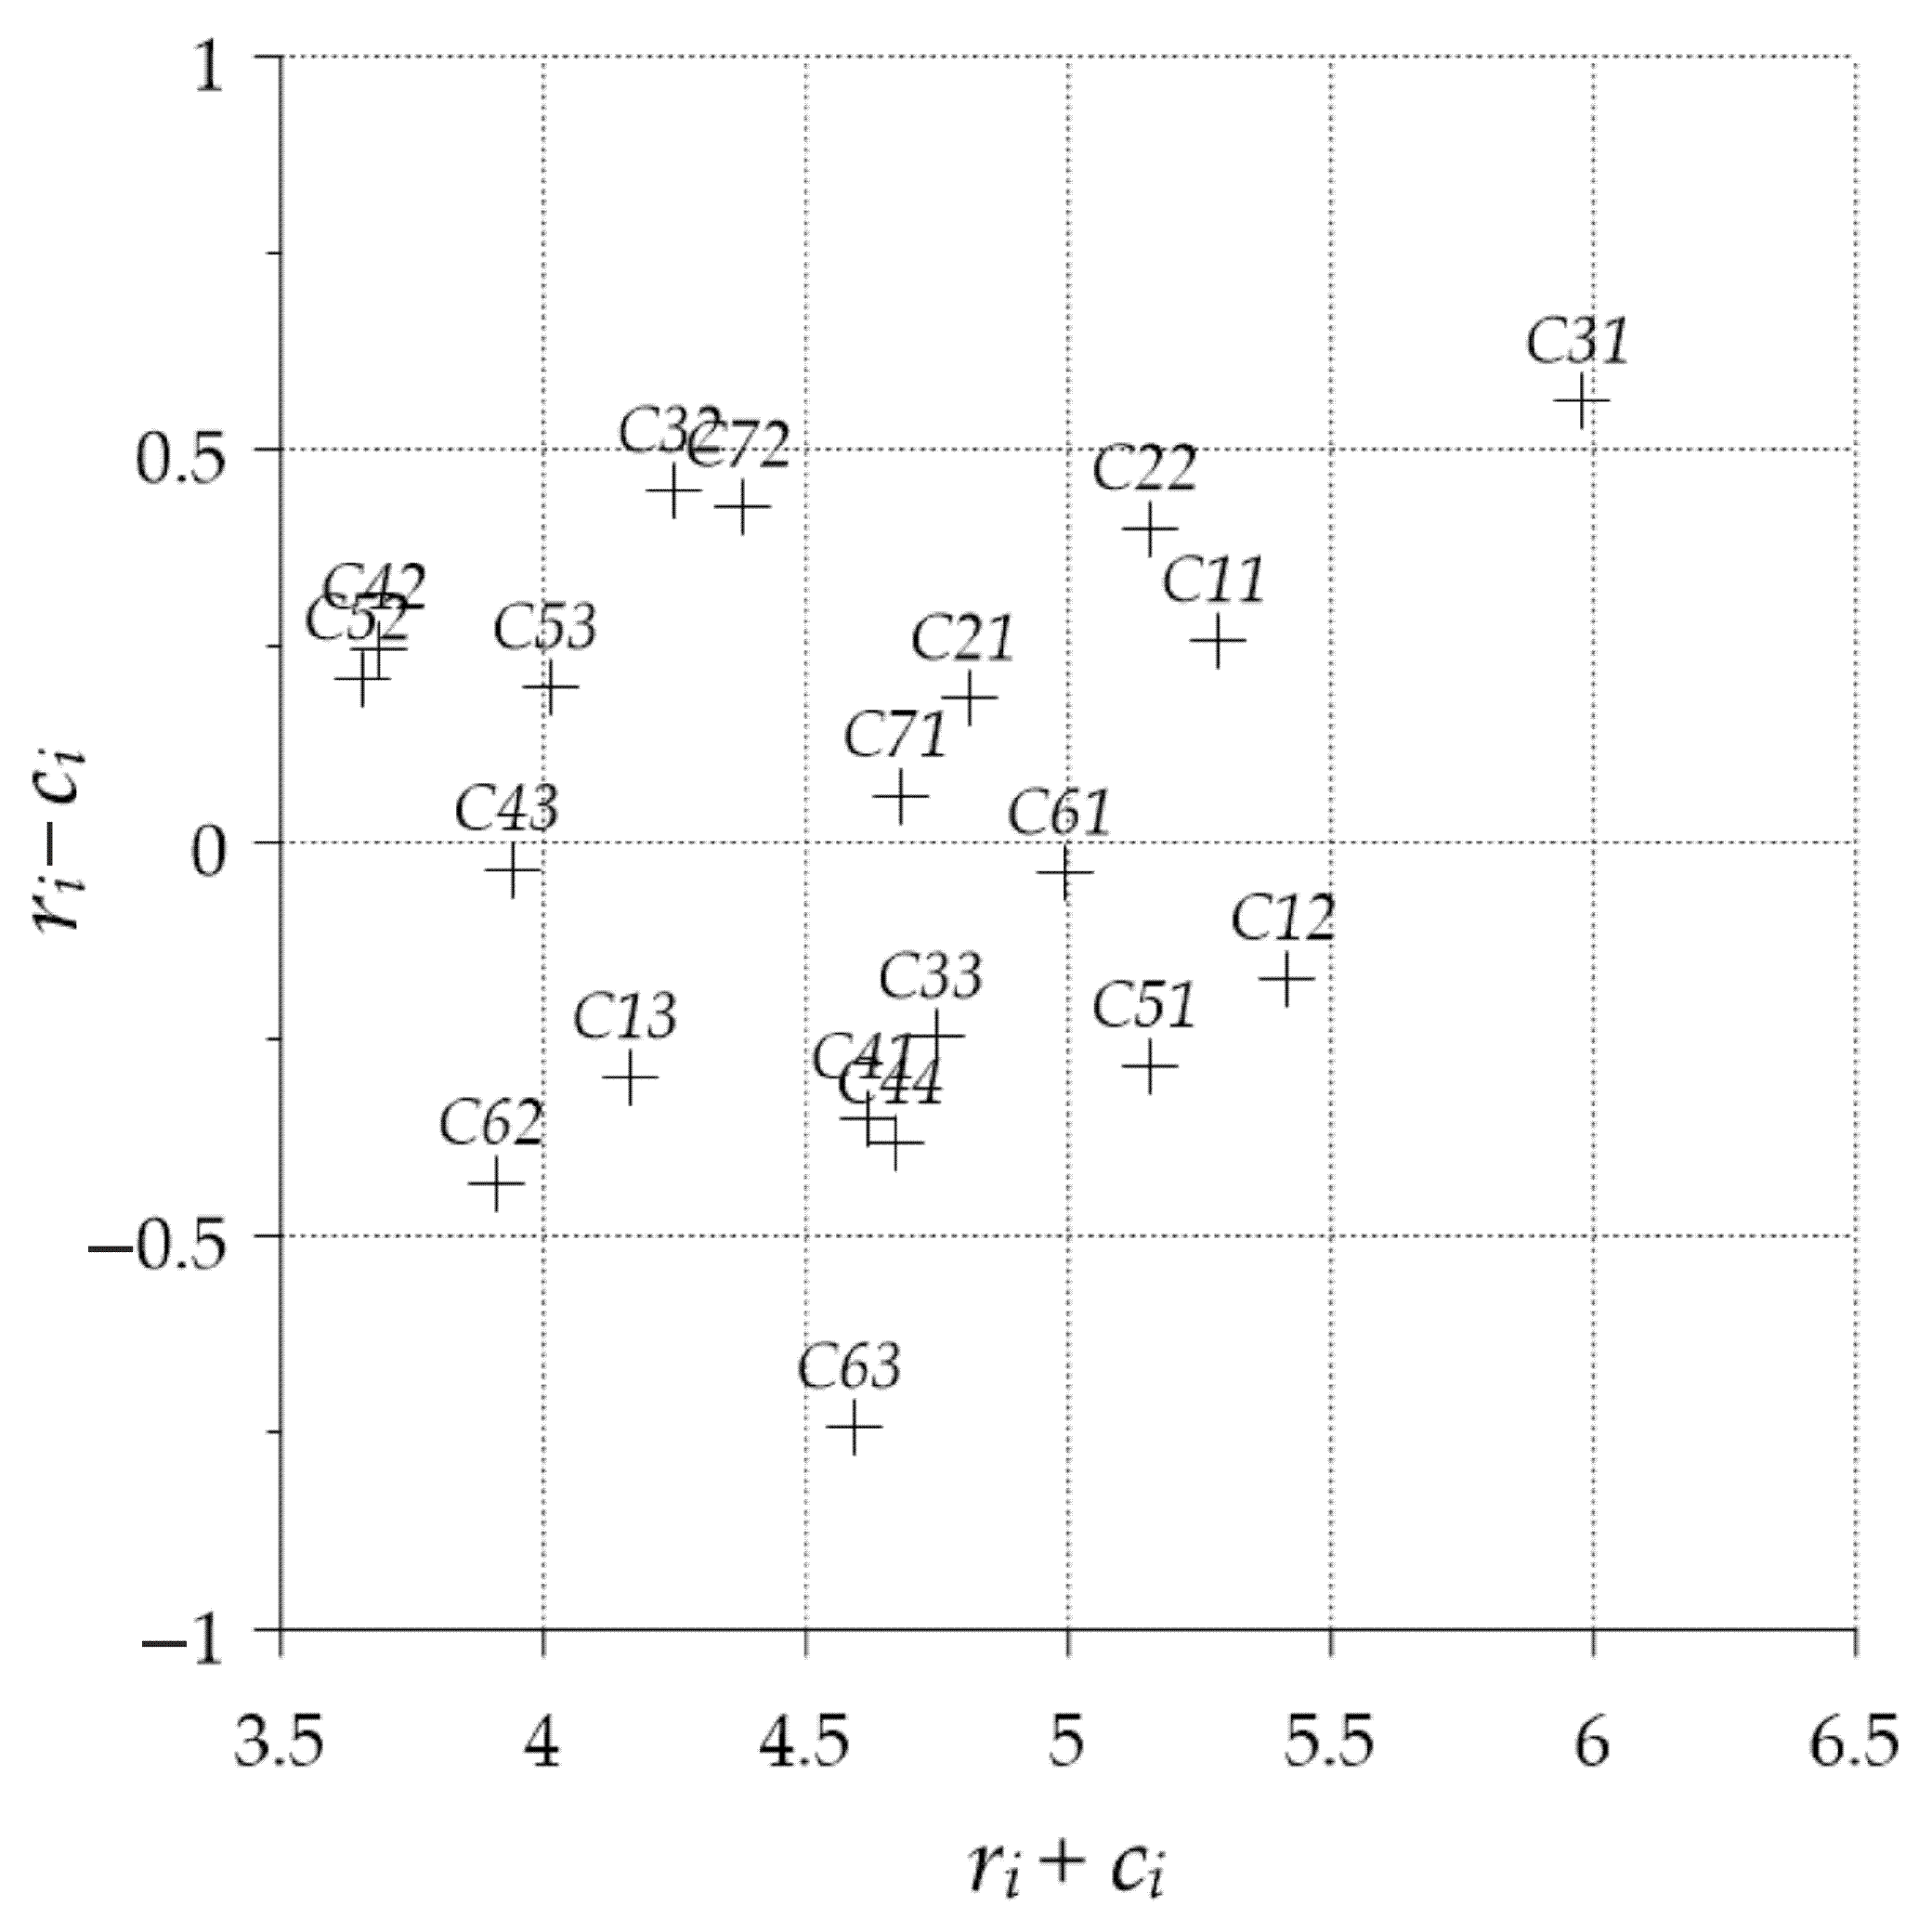
The dimension D6 (Access control) shows the lowest negative value of this rating. This dimension is the greatest recipient of the influence of the others. Based on the assessments of the experts, D2 (Encryption), D3 (Network security), D7 (Cyberattacks), and D5 (Endpoint security) are classified as causal dimensions. As regards, D1 (Trust services), D4 (Application security), and D6 (Access control) are effect dimensions. Thus, the relation diagram of can be plotted (Figure 3) for the twenty criteria from Table 4. In Figure 3, the highest value of the position indicator has the criterion C31 (Adequate technical security of a company network), from the dimension D3 (Network security). It holds a privileged important position in comparison with the others and it is the most crucial criterion in the cybersecurity sphere. On the other hand, the criterion C52 (Antivirus and antimalware), from the dimension D5 (Endpoint security), has the lowest value of this indicator.
The analysis shows the following order of importance of the criteria: C31 (Adequate technical security of a company network), C12 (Validation and maintaining electronic signatures and seals), C11 (Electronic signature, Electronic seal, and Electronic time stamp), C51 (Appropriate techniques for securing workstations and mobile devices), C22 (Blockchain technology), C61 (Establishing a VPN secure remote connection with the corporate server), C21 (Authentication of online B2B portals; X.509/TLS/SSL protocols), C33 (Monitoring and analysis of security incidents), C71 (Intrusion Prevention System and Intrusion Detection System with algorithms to real-time detect the malicious attacks), C44 (Software updates), C41 (Database security), C63 (Creating rules for managing access to corporate data; User authentication), C72 (Firewall, Gateway, and Proxy), C32 (Optimal network and server architecture), and C13 (Recorded Electronic Delivery). The above criteria with the highest value of the position indicator must be taken into account when determining the methods of cybersecurity protection in manufacturing companies. Experts found the remaining criteria: C53 (Penetration testing to find vulnerabilities), C43 (Vulnerability scan; Source code analysis to look for software weaknesses), C62 (Regular training of employees in the field of cybersecurity), C42 (Establishment of an efficient backup system), and C52 (Antivirus and antimalware) less important than those mentioned above. Regarding the relation indicator , the criterion C31 (Adequate technical security of a company network), from the dimension D3 (Network security), with the highest positive value of this criterion, has the strongest impact on the other criteria. Concurrently, the criterion C63 (Creating rules for managing access to corporate data; User authentication), from the dimension D6 (Access control), with the highest negative value of the relation indicator, is the biggest receiver of the impact of the others. Based on the positive value of relation indicator, C31 (Adequate technical security of a company network), C32 (Optimal network and server architecture), C72 (Firewall, Gateway, and Proxy), C22 (Blockchain technology), C11 (Electronic signature, Electronic seal, and Electronic time stamp), C42 (Establishment of an efficient backup system), C52 (Antivirus and antimalware), C53 (Penetration testing to find vulnerabilities), C21 (Authentication of online B2B portals; X.509/TLS/SSL protocols), and C71 (Intrusion Prevention System and Intrusion Detection System with algorithms to real-time detect the malicious attacks) are classified as causal criteria. As for C43 (Vulnerability scan; Source code analysis to look for software weaknesses), C61 (Establishing a VPN secure remote connection with the corporate server), C12 (Validation and maintaining electronic signatures and seals), C33 (Monitoring and analysis of security incidents), C51 (Appropriate techniques for securing workstations and mobile devices), C13 (Recorded Electronic Delivery), C41 (Database security), C44 (Software updates), C62 (Regular training of employees in the field of cybersecurity), and C63 (Creating rules for managing access to corporate data; User authentication) are classified as effect criteria. The next step of the DANP methodology is the determination of the normalized total relations matrix based on (9). This is presented in Table A5 in Appendix A. The individual elements of the matrix express the exerted and received the influence of the criteria on each other. The higher the value of an element in a matrix, the greater the influence it has on the other elements. For example, the value of the C42 element influence on C11 is 0.0492, and the C43 element influence on C11 is 0.0570. In practice, this means that C43 has a greater influence on C11 than C42. The threshold value of 0.05 was used in the analysis. Items with a value greater than the threshold are marked bold in Table A5 in Appendix A. The C13 (Recorded Electronic Delivery) on C12 (Validation and maintaining electronic signatures and seals) has the greatest influence with the value of 0.0701. Then, matrix is raised to a high power until it converges and becomes a stable DANP matrix which determines the importance of each criterion. Based on (11), the priority vector in Table 5 shows the final weights of cybersecurity criteria.
The crucial criteria, with the greatest value of criteria weight are: C12 (Validation and maintaining electronic signatures and seals) and C31 (Adequate technical security of a company network) which are marked bold in Table 5.
In the next step, this vector is used in the PROMETHEE II method to rank measures for cybersecurity issues.
5.2. PROMETHEE II Stage
In the PROMETHEE II stage, the second survey questionnaire is completed by the same group of experts to achieve the ranking of measures in cybersecurity (ratings from 1 to 5). Table 6 shows the aggregated rating of the second questionnaire.
These expert assessments indicate to what extent particular criteria affect the proposed alternative cybersecurity measures. For example, countermeasure C11 (Electronic signature, Electronic seal, and Electronic time stamp), out of the three A1–A3 measures, has the greatest impact on the alternative A2 (Technological measure), which then has the evaluation value of 4.1905.
Next, based on Equation (12) and using the threshold, the deviation of measures is obtained and presented in Table 7. The table column difference results are used to determine how one measure is more favourable than another for a given criterion. A positive value of the difference means that the first measure is more favourable than the second one in the difference. For example, when comparing in Table 7 for the C11 criterion, the difference between A2 and A1 can be found with a positive deviation of 1.0476. Also, for C12, the difference between A2 and A1 is positive and amounts to 1.9524. Therefore, for both criteria, the alternative A2 is more preferable to A1. In addition, the alternative A2 compared to A1 is preferred to C12 to a greater extent than to C11.
Thus, based on the preference function for each criterion (Table 3), the relationship between the parameter value and the deviations of the pair of alternatives for measures (Table 7) are obtained after establishing a collective expert judgment based on the parameter value for each criterion.
The value of a parameter depends on the type of a criterion (either qualitative or quantitative) and the parameter under consideration.
Determining the parameter value for each type of preference function was performed in accordance with the definition of the individual preference function.
Table 3 shows the preference functions for each criterion. No parameter value is required for the criteria that are classified as Usual Criteria (Type 1). The values 0–2 is required for Quasi-Criterion (Type 2). The value of 0 specifies neutrality on the less likely use of measures for such a criterion. The value of 2 specifies neutrality on the likelihood of measures to be used for such a criterion. Considering Type 3—Criterion with Linear Preference, also the parameter value 0–2 is required. The value of 0 specifies the preference of measures concerning such a criterion. The value of 2 specifies the preference of the likelihood of measures to be used for such a criterion.
Determining the parameter value is created by an expert group and specified in Table 8. Finally, in Table 8 for each criterion, the parameter values for chosen preference functions are related to the deviation of each pair of measures.
Thus, based on the three: (13), the weights from the DANP matrix (Table 5) showing the importance of cybersecurity criteria, and the preference functions for each pair of measures from Table 8, the aggregated preference functions are obtained and specified in Table 9. The results are used for the assessment of measures.
The next step involves the calculation of the entering, leaving and net flows. The final rank of measures in Table 10 is presented. The net flow score for a given measure reflects its importance among other measures. The strength of measures is obtained by the leaving flow while the weakness of measures is shown by the entering flow. A higher net flow of a measure is preferred. Based on the PROMETHEE II method, the final order of validity of the measures was obtained in the form of A2 (Technological measures), A3 (Organizational measures) and A1 (Operational measures) to ensure cybersecurity among the participants of the information flow under Sustainable Manufacturing and Industry 4.0. The above analysis shows that the sphere of technological solutions (A2) is the most significant. The hypothesis formulated in section ‘1. Introduction’ and subjected to verification has been confirmed.
The staff of the IT departments ensure that the IT equipment, also in the field of cybersecurity issues, is always in the best condition and includes the latest solutions.
It should be noted that the first three of the most important criteria connected with the A2 sphere hold, respectively, the 1st (C12), 3rd (C51), 5th (C11) positions in the criteria list with the highest influential weights in Table 5. That is C12 (Validation and maintaining electronic signatures and seals), C51 (Appropriate techniques for securing workstations and mobile devices), and C11 (Electronic signature, Electronic seal, and Electronic time stamp).
As a result of the analysis, it was determined that the C12 parameter is the most important factor influencing the IT security and information flow in companies participating in the sustainable Industry 4.0 cycle.
Let us recall, the validation of electronic signature guarantees that it has been done correctly. The use of validation is essential and ensures the cybersecurity of the entities in the process flow of Industry 4.0.
As for maintaining the electronic signature, it extends the reliability of an electronic signature beyond the technical validity period.
The maintaining service may, in particular, be used in accepting manufacturing statements and commitments with a higher risk and long-term or valuable liabilities.
Another preferred alternative is the organizational sphere (A3). This alternative is difficult to implement as it requires the IT staff to constantly follow and improve well-defined procedures.
The first three of the most important criteria connected with the A3 sphere hold the 2nd (C31), 4th (C63), 6th (C44) positions in the criteria list with the highest influential weights in Table 5, where C31 is Adequate technical security of a company network, C63 means Creating rules for managing access to corporate data; User authentication, and C44 is Software updates.
The least preferred alternative is the sphere of operational activities (A1). This means, predominantly, constant monitoring of the right operation and stability of the applied solutions.
As regards the first three of the most important criteria connected with the A1 sphere, they hold the 8ht (C33), 12th (C71), 15th (C43) positions in the criteria list with the highest influential weights in Table 5, where C33 means Monitoring and analysis of security incidents, C71 is Intrusion Prevention System and Intrusion Detection System with algorithms to real-time detect the malicious attacks and finally C43 is Vulnerability scan; Source code analysis to look for software weaknesses.
It is worth noticing that the A3 area covering current operational activities is only the third in the ranking. This should be confirmed during the implementation of security issues within companies participating in manufacturing flow.
The sequence of implementing individual security issues in companies, resulting from the analysis, should be followed. Firstly, it is necessary to determine the type and scope of technological solutions to be applied that will comprehensively cover all IT areas and ensure their security. Then, depending on the selected solutions, procedures and regulations for employees should be developed. These ought to include routine work, training systems, and emergency procedures. Only on this basis should the daily operational work of system users and administrators involved in ensuring IT security be implemented.
6. Conclusions
The combination of the idea of sustainable development, digital transformation of Industry 4.0 and cybersecurity has a positive impact on sustainable manufacturing. Along with the growing popularity of sustainable production and Industry 4.0 processes, the amount of information sent throughout the lifecycle of manufactured products between companies participating in these processes increases.
This enhances concerns of manufacturing companies’ management boards about the cybersecurity of important databases. As a result, the pace of implementing the principles of sustainable development in manufacturing companies is slowing down. To counteract this phenomenon, it is necessary to develop cybersecurity principles covering both the processed information and the IT environments used, the introduction of which will become the driving force for the further development of sustainable manufacturing.
The example of digital data exchange between the participants in the production process presented in Section 2 indicates that the absence of a coherent cybersecurity mechanism accepted by the parties guaranteeing the integrity and undeniability of the origin of received and sent data is a direct limitation of the dissemination of the modern Industry 4.0 technologies.
On the other hand, this is counteracted by the specific guide-template of a set of criteria, areas and groups of cybersecurity measures proposed in the article, which, together with their ranking and the indicated order of implementation, as well as the hybrid MCDM method of assessing the security scheme, can be directly applied in any manufacturing company.
Implementing security solutions is always costly and usually time-consuming. The article allows the management of a manufacturing company to properly allocate funds and reduce the risk of making a mistake when implementing cybersecurity solutions within Industry 4.0.
The article proposes a cybersecurity structure divided into seven dimensions, twenty criteria and three groups of measures in the field of cybersecurity in areas used by companies for the purposes of sustainable manufacturing and sustainable Industry 4.0. Another research value and novelty of the article is the simultaneous utilization of the hybrid method supporting decision-making processes based on the DEMATEL-based ANP (DANP) and PROMETHEE II methods for the assessment of the proposed cybersecurity structure in sustainable manufacturing and Industry 4.0 and to create a ranking of its elements.
Based on DANP, the relationship and position indicators for each of the seven dimensions and twenty criteria of cybersecurity were obtained, along with the ranking of the importance of criteria. Subsequently, the results obtained from DANP were used in PROMETHEE II to determine the ranking of measures.
The analysis reveals that the most important security assessment criteria are: C12 (Validation and maintaining electronic signatures and seals) and C31 (Adequate technical security of a company network). In turn, the most crucial dimension of cybersecurity is D3 (Network security), while the most significant group of measures in this regard is A2 (Technological measures). It means that the hypothesis posed in section ‘1. Introduction’ and subject to verification has been confirmed.
The influence of the A2 technological group of measures on sustainable development in terms of production consists in the possibility of reducing a company’s carbon footprint, energy consumption and improving energy efficiency by ensuring that cybersecurity software and hardware are always in the best condition and contain the latest solutions. As a result, the implementation of measures from the A2 group is a process towards achieving Sustainable Development Goal 7—affordable, reliable, sustainable and modern energy.
In turn, the area of D3 (Network security) recommends a constant development of software improvements to the algorithms that capture cyber threats. This extends the time of using older machinery in manufacturing companies and introduces the philosophy of reuse from the circular economy in the area of IT equipment and production machinery as well as redesigning in the area of software. Another recommendation in this area is the widest possible automation of the cybersecurity data analysis, previously aggregated with the use of big data, by analysts and corporate security departments, which increases the efficiency of the work of the people involved.
The criterion C12 (Validation and maintaining electronic signatures and seals) introduces the philosophy of reuse from the circular economy to the digital sphere of cybersecurity. Losing the validity of electronic signatures functioning in the digital production control process may lead to the immobilization of the company’s production activity, and thus cause a decrease in work efficiency and an increase in resource consumption.
On the other hand, failure to implement the C31 criterion (Adequate technical security of a company network) may lead to downtime in production companies, which in turn leads to a reduction in work efficiency, forces over-planned retooling of stopped machines, increases a company’s carbon footprint by excessive energy consumption during restarting and an increased number of material losses and defective products resulting from an emergency stop of the production line.
The presented methodology is relatively easy to apply in practice. The rankings of cybersecurity criteria and groups of measures can be treated by manufacturing companies as guidelines during the process of implementing cybersecurity solutions. The integration of the two methods has proved to be valuable in assessing cybersecurity. This is possible by establishing the importance of the various criteria. Besides, owing to this, it is plausible to support the decision-making process regarding the choice of measures to ensure high cybersecurity in the IT within manufacturing companies. This could pave the way for future work to do research involving the use of other methods for ranking cybersecurity measures. Extending the framework of this methodology for assessing available dimensions, criteria and group of measures may also be useful for other issues.
Funding
This paper was funded under the grant No 1/S/KZiL/21 ‘Implementation of sustainable supply chain systems in the conditions of the new economy’ financed from the subsidy of the Ministry of Education and Science for statutory activities.
Data Availability Statement
Data is contained within the article.
Conflicts of Interest
The author declares no conflict of interest.
Appendix A
Table A1.
Example of assessment interactions between pairs of all criteria.
| C11 | C12 | C13 | C21 | C22 | C31 | C32 | C33 | C41 | C42 | C43 | C44 | C51 | C52 | C53 | C61 | C62 | C63 | C71 | C72 | |
|---|---|---|---|---|---|---|---|---|---|---|---|---|---|---|---|---|---|---|---|---|
| C11 | 0 | 4 | 4 | 4 | 4 | 2 | 2 | 2 | 3 | 2 | 2 | 3 | 3 | 2 | 2 | 4 | 2 | 4 | 1 | 1 |
| C12 | 4 | 0 | 4 | 4 | 4 | 4 | 1 | 1 | 2 | 1 | 2 | 3 | 3 | 1 | 2 | 3 | 3 | 3 | 2 | 1 |
| C13 | 3 | 3 | 0 | 3 | 3 | 1 | 0 | 0 | 1 | 1 | 2 | 1 | 2 | 1 | 1 | 1 | 2 | 3 | 1 | 1 |
| C21 | 4 | 4 | 4 | 0 | 4 | 4 | 1 | 1 | 1 | 1 | 2 | 2 | 4 | 1 | 2 | 3 | 1 | 3 | 3 | 2 |
| C22 | 4 | 4 | 4 | 4 | 0 | 4 | 2 | 1 | 4 | 4 | 2 | 4 | 4 | 1 | 3 | 2 | 3 | 3 | 2 | 2 |
| C31 | 4 | 4 | 4 | 3 | 4 | 0 | 4 | 4 | 4 | 3 | 3 | 4 | 4 | 2 | 3 | 3 | 3 | 4 | 4 | 3 |
| C32 | 1 | 2 | 1 | 3 | 3 | 3 | 0 | 3 | 4 | 1 | 1 | 2 | 2 | 2 | 1 | 4 | 1 | 3 | 4 | 3 |
| C33 | 1 | 3 | 2 | 3 | 3 | 3 | 3 | 0 | 3 | 1 | 3 | 4 | 3 | 2 | 2 | 3 | 4 | 4 | 4 | 3 |
| C41 | 1 | 2 | 1 | 2 | 2 | 3 | 3 | 3 | 0 | 4 | 2 | 2 | 2 | 1 | 2 | 3 | 3 | 3 | 3 | 1 |
| C42 | 1 | 1 | 1 | 1 | 1 | 3 | 3 | 1 | 4 | 0 | 1 | 3 | 1 | 1 | 2 | 1 | 2 | 2 | 1 | 1 |
| C43 | 2 | 3 | 1 | 2 | 1 | 4 | 3 | 3 | 4 | 1 | 0 | 2 | 1 | 1 | 2 | 1 | 1 | 2 | 1 | 1 |
| C44 | 2 | 3 | 1 | 2 | 1 | 3 | 2 | 1 | 3 | 2 | 2 | 0 | 3 | 3 | 1 | 1 | 3 | 2 | 4 | 2 |
| C51 | 4 | 4 | 1 | 2 | 2 | 3 | 2 | 3 | 1 | 1 | 3 | 3 | 0 | 3 | 3 | 4 | 2 | 3 | 1 | 1 |
| C52 | 1 | 1 | 1 | 1 | 1 | 2 | 1 | 3 | 1 | 1 | 1 | 3 | 3 | 0 | 1 | 3 | 3 | 2 | 4 | 2 |
| C53 | 1 | 2 | 1 | 3 | 2 | 3 | 2 | 3 | 2 | 2 | 4 | 3 | 3 | 3 | 0 | 3 | 1 | 2 | 2 | 1 |
| C61 | 3 | 3 | 3 | 3 | 4 | 3 | 3 | 2 | 4 | 2 | 2 | 1 | 3 | 3 | 2 | 0 | 3 | 4 | 2 | 2 |
| C62 | 2 | 2 | 2 | 1 | 1 | 3 | 1 | 2 | 3 | 2 | 1 | 2 | 3 | 2 | 1 | 2 | 0 | 2 | 1 | 1 |
| C63 | 3 | 3 | 2 | 2 | 2 | 3 | 1 | 1 | 1 | 1 | 1 | 2 | 2 | 1 | 1 | 3 | 3 | 0 | 1 | 1 |
| C71 | 1 | 1 | 1 | 2 | 2 | 3 | 1 | 4 | 4 | 1 | 2 | 4 | 3 | 1 | 3 | 3 | 2 | 3 | 0 | 4 |
| C72 | 1 | 2 | 2 | 2 | 2 | 3 | 3 | 4 | 3 | 2 | 2 | 2 | 3 | 1 | 2 | 3 | 2 | 2 | 3 | 0 |
Table A2.
Direct influence matrix Z.
| C11 | C12 | C13 | C21 | C22 | C31 | C32 | C33 | C41 | C42 | C43 | C44 | C51 | C52 | C53 | C61 | C62 | C63 | C71 | C72 | |
|---|---|---|---|---|---|---|---|---|---|---|---|---|---|---|---|---|---|---|---|---|
| C11 | 0 | 3.905 | 3.810 | 3.857 | 3.476 | 2.476 | 2.143 | 2.048 | 2.619 | 2.191 | 2.048 | 3.286 | 2.905 | 2.191 | 2.238 | 3.571 | 2.476 | 3.524 | 1.238 | 1.476 |
| C12 | 3.571 | 0 | 3.714 | 3.381 | 3.762 | 3.429 | 1.476 | 1.286 | 1.857 | 1.286 | 1.714 | 2.952 | 3.191 | 1.762 | 2.048 | 3.143 | 2.714 | 3.238 | 2.381 | 1.143 |
| C13 | 3.143 | 3.238 | 0 | 3.048 | 3.286 | 1.238 | 1.381 | 1.381 | 1.286 | 1.429 | 1.762 | 1.143 | 1.905 | 1.286 | 1.191 | 1.286 | 1.810 | 2.714 | 1.191 | 1.381 |
| C21 | 3.524 | 3.571 | 3.619 | 0 | 3.714 | 3.571 | 1.286 | 1.714 | 1.191 | 1.238 | 1.571 | 1.714 | 3.571 | 1.143 | 1.286 | 2.714 | 1.238 | 3.143 | 3.048 | 2.143 |
| C22 | 3.762 | 3.857 | 3.571 | 3.381 | 0 | 3.381 | 1.714 | 3.381 | 3.524 | 1.286 | 2.048 | 3.571 | 3.524 | 1.381 | 2.619 | 1.905 | 2.952 | 1.238 | 1.905 | 2.048 |
| C31 | 3.857 | 3.429 | 3.524 | 3.286 | 3.381 | 0 | 3.524 | 3.429 | 3.857 | 2.762 | 2.714 | 3.524 | 3.429 | 1.905 | 2.714 | 3.048 | 2.714 | 3.762 | 3.429 | 2.857 |
| C32 | 1.143 | 2.191 | 1.286 | 2.619 | 3.191 | 2.762 | 0 | 2.762 | 3.619 | 1.286 | 1.381 | 1.286 | 1.905 | 1.571 | 1.143 | 3.619 | 1.286 | 2.905 | 3.762 | 3.048 |
| C33 | 1.286 | 3.238 | 1.905 | 1.238 | 1.286 | 1.191 | 1.762 | 0 | 1.143 | 0.952 | 2.905 | 3.571 | 2.905 | 1.619 | 1.714 | 1.714 | 3.524 | 3.857 | 3.429 | 3.095 |
| C41 | 1.191 | 2.048 | 1.381 | 1.810 | 1.762 | 2.714 | 3.048 | 2.667 | 0 | 3.619 | 1.571 | 1.857 | 1.619 | 1.286 | 1.619 | 2.714 | 1.571 | 2.619 | 2.905 | 1.286 |
| C42 | 1.381 | 1.286 | 1.143 | 1.191 | 1.143 | 3.048 | 2.952 | 3.524 | 3.619 | 0 | 1.381 | 3.286 | 1.571 | 1.191 | 2.048 | 1.571 | 1.476 | 1.714 | 1.286 | 1.286 |
| C43 | 2.238 | 3.238 | 1.429 | 1.571 | 1.381 | 3.524 | 1.143 | 2.952 | 3.048 | 1.191 | 0 | 1.714 | 1.476 | 1.381 | 1.762 | 1.286 | 1.238 | 1.857 | 1.381 | 1.429 |
| C44 | 2.429 | 3.048 | 1.286 | 1.762 | 1.286 | 2.619 | 1.810 | 1.238 | 3.143 | 1.905 | 1.571 | 0 | 3.238 | 1.286 | 1.286 | 1.476 | 2.762 | 1.619 | 3.571 | 1.857 |
| C51 | 3.714 | 3.762 | 1.143 | 1.714 | 1.762 | 2.714 | 1.619 | 3.524 | 1.286 | 1.381 | 3.048 | 2.667 | 0 | 2.905 | 2.714 | 3.429 | 1.857 | 2.619 | 1.143 | 1.714 |
| C52 | 1.286 | 1.762 | 1.238 | 1.286 | 1.286 | 1.286 | 1.143 | 2.905 | 1.429 | 1.238 | 1.238 | 3.048 | 2.952 | 0 | 0.952 | 2.762 | 2.667 | 1.619 | 3.524 | 2.095 |
| C53 | 1.476 | 1.571 | 1.286 | 2.810 | 1.714 | 2.619 | 1.571 | 2.857 | 1.857 | 1.619 | 3.524 | 2.952 | 2.667 | 1.476 | 0 | 2.905 | 1.143 | 1.571 | 1.571 | 1.381 |
| C61 | 3.048 | 2.952 | 3.143 | 2.810 | 3.381 | 2.619 | 1.143 | 1.714 | 3.571 | 1.714 | 1.571 | 1.476 | 3.095 | 2.714 | 1.762 | 0 | 1.238 | 3.571 | 1.810 | 2.143 |
| C62 | 2.476 | 1.238 | 1.714 | 1.191 | 2.095 | 2.857 | 1.191 | 1.286 | 1.143 | 1.571 | 1.476 | 1.571 | 2.619 | 1.857 | 1.238 | 1.571 | 0 | 1.762 | 1.238 | 1.286 |
| C63 | 3.095 | 3.143 | 2.048 | 1.714 | 1.571 | 2.810 | 1.476 | 1.191 | 1.191 | 1.238 | 1.429 | 1.857 | 2.048 | 1.714 | 1.286 | 1.857 | 2.905 | 0 | 1.143 | 1.191 |
| C71 | 1.571 | 1.381 | 0.952 | 1.762 | 1.905 | 2.857 | 1.381 | 3.619 | 3.762 | 1.476 | 1.571 | 3.429 | 2.905 | 1.143 | 2.905 | 2.905 | 1.571 | 3.048 | 0 | 3.524 |
| C72 | 1.238 | 2.238 | 2.095 | 1.810 | 2.048 | 2.619 | 3.191 | 3.524 | 3.286 | 1.905 | 1.810 | 1.762 | 2.619 | 1.381 | 2.191 | 3.048 | 2.381 | 2.429 | 2.905 | 0 |
Table A3.
Normalized direct influence matrix X.
| C11 | C12 | C13 | C21 | C22 | C31 | C32 | C33 | C41 | C42 | C43 | C44 | C51 | C52 | C53 | C61 | C62 | C63 | C71 | C72 | |
|---|---|---|---|---|---|---|---|---|---|---|---|---|---|---|---|---|---|---|---|---|
| C11 | 0 | 6.386 | 6.231 | 6.308 | 5.685 | 4.050 | 3.505 | 3.349 | 4.283 | 3.583 | 3.349 | 5.374 | 4.751 | 3.583 | 3.660 | 5.841 | 4.050 | 5.763 | 2.025 | 2.414 |
| C12 | 5.841 | 0 | 6.075 | 5.530 | 6.153 | 5.608 | 2.414 | 2.103 | 3.037 | 2.103 | 2.804 | 4.829 | 5.218 | 2.882 | 3.349 | 5.140 | 4.439 | 5.296 | 3.894 | 1.869 |
| C13 | 5.140 | 5.296 | 0 | 4.984 | 5.374 | 2.025 | 2.259 | 2.259 | 2.103 | 2.337 | 2.882 | 1.869 | 3.115 | 2.103 | 1.947 | 2.103 | 2.960 | 4.439 | 1.947 | 2.259 |
| C21 | 5.763 | 5.841 | 5.919 | 0 | 6.075 | 5.841 | 2.103 | 2.804 | 1.947 | 2.025 | 2.570 | 2.804 | 5.841 | 1.869 | 2.103 | 4.439 | 2.025 | 5.140 | 4.984 | 3.505 |
| C22 | 6.153 | 6.308 | 5.841 | 5.530 | 0 | 5.530 | 2.804 | 5.530 | 5.763 | 2.103 | 3.349 | 5.841 | 5.763 | 2.259 | 4.283 | 3.115 | 4.829 | 2.025 | 3.115 | 3.349 |
| C31 | 6.308 | 5.608 | 5.763 | 5.374 | 5.530 | 0 | 5.763 | 5.608 | 6.308 | 4.517 | 4.439 | 5.763 | 5.608 | 3.115 | 4.439 | 4.984 | 4.439 | 6.153 | 5.608 | 4.673 |
| C32 | 1.869 | 3.583 | 2.103 | 4.283 | 5.218 | 4.517 | 0 | 4.517 | 5.919 | 2.103 | 2.259 | 2.103 | 3.115 | 2.570 | 1.869 | 5.919 | 2.103 | 4.751 | 6.153 | 4.984 |
| C33 | 2.103 | 5.296 | 3.115 | 2.025 | 2.103 | 1.947 | 2.882 | 0 | 1.869 | 1.558 | 4.751 | 5.841 | 4.751 | 2.648 | 2.804 | 2.804 | 5.763 | 6.308 | 5.608 | 5.062 |
| C41 | 1.947 | 3.349 | 2.259 | 2.960 | 2.882 | 4.439 | 4.984 | 4.361 | 0 | 5.919 | 2.570 | 3.037 | 2.648 | 2.103 | 2.648 | 4.439 | 2.570 | 4.283 | 4.751 | 2.103 |
| C42 | 2.259 | 2.103 | 1.869 | 1.947 | 1.869 | 4.984 | 4.829 | 5.763 | 5.919 | 0 | 2.259 | 5.374 | 2.570 | 1.947 | 3.349 | 2.570 | 2.414 | 2.804 | 2.103 | 2.103 |
| C43 | 3.660 | 5.296 | 2.337 | 2.570 | 2.259 | 5.763 | 1.869 | 4.829 | 4.984 | 1.947 | 0 | 2.804 | 2.414 | 2.259 | 2.882 | 2.103 | 2.025 | 3.037 | 2.259 | 2.337 |
| C44 | 3.972 | 4.984 | 2.103 | 2.882 | 2.103 | 4.283 | 2.960 | 2.025 | 5.140 | 3.115 | 2.570 | 0 | 5.296 | 2.103 | 2.103 | 2.414 | 4.517 | 2.648 | 5.841 | 3.037 |
| C51 | 6.075 | 6.153 | 1.869 | 2.804 | 2.882 | 4.439 | 2.648 | 5.763 | 2.103 | 2.259 | 4.984 | 4.361 | 0 | 4.751 | 4.439 | 5.608 | 3.037 | 4.283 | 1.869 | 2.804 |
| C52 | 2.103 | 2.882 | 2.025 | 2.103 | 2.103 | 2.103 | 1.869 | 4.751 | 2.337 | 2.025 | 2.025 | 4.984 | 4.829 | 0 | 1.558 | 4.517 | 4.361 | 2.648 | 5.763 | 3.427 |
| C53 | 2.414 | 2.570 | 2.103 | 4.595 | 2.804 | 4.283 | 2.570 | 4.673 | 3.037 | 2.648 | 5.763 | 4.829 | 4.361 | 2.414 | 0 | 4.751 | 1.869 | 2.570 | 2.570 | 2.259 |
| C61 | 4.984 | 4.829 | 5.140 | 4.595 | 5.530 | 4.283 | 1.869 | 2.804 | 5.841 | 2.804 | 2.570 | 2.414 | 5.062 | 4.439 | 2.882 | 0 | 2.025 | 5.841 | 2.960 | 3.505 |
| C62 | 4.050 | 2.025 | 2.804 | 1.947 | 3.427 | 4.673 | 1.947 | 2.103 | 1.869 | 2.570 | 2.414 | 2.570 | 4.283 | 3.037 | 2.025 | 2.570 | 0 | 2.882 | 2.025 | 2.103 |
| C63 | 5.062 | 5.140 | 3.349 | 2.804 | 2.570 | 4.595 | 2.414 | 1.947 | 1.947 | 2.025 | 2.337 | 3.037 | 3.349 | 2.804 | 2.103 | 3.037 | 4.751 | 0 | 1.869 | 1.947 |
| C71 | 2.570 | 2.259 | 1.558 | 2.882 | 3.115 | 4.673 | 2.259 | 5.919 | 6.153 | 2.414 | 2.570 | 5.608 | 4.751 | 1.869 | 4.751 | 4.751 | 2.570 | 4.984 | 0 | 5.763 |
| C72 | 2.025 | 3.660 | 3.427 | 2.960 | 3.349 | 4.283 | 5.218 | 5.763 | 5.374 | 3.115 | 2.960 | 2.882 | 4.283 | 2.259 | 3.583 | 4.984 | 3.894 | 3.972 | 4.751 | 0 |
All the values in Table A3 are multiplied by 100.
Table A4.
Total relations matrix T.
| C11 | C12 | C13 | C21 | C22 | C31 | C32 | C33 | C41 | C42 | C43 | C44 | C51 | C52 | C53 | C61 | C62 | C63 | C71 | C72 | |
|---|---|---|---|---|---|---|---|---|---|---|---|---|---|---|---|---|---|---|---|---|
| C11 | 1.102 | 1.814 | 1.566 | 1.599 | 1.572 | 1.548 | 1.140 | 1.365 | 1.456 | 1.076 | 1.167 | 1.580 | 1.620 | 1.084 | 1.160 | 1.622 | 1.317 | 1.686 | 1.178 | 1.067 |
| C12 | 1.606 | 1.152 | 1.505 | 1.481 | 1.564 | 1.629 | 0.996 | 1.201 | 1.290 | 0.901 | 1.076 | 1.479 | 1.606 | 0.982 | 1.097 | 1.504 | 1.305 | 1.585 | 1.291 | 0.977 |
| C13 | 1.263 | 1.355 | 0.691 | 1.181 | 1.237 | 1.016 | 0.780 | 0.952 | 0.934 | 0.734 | 0.869 | 0.939 | 1.118 | 0.720 | 0.761 | 0.958 | 0.940 | 1.221 | 0.867 | 0.799 |
| C21 | 1.552 | 1.656 | 1.452 | 0.915 | 1.515 | 1.598 | 0.936 | 1.227 | 1.148 | 0.858 | 1.020 | 1.251 | 1.611 | 0.855 | 0.954 | 1.398 | 1.045 | 1.530 | 1.347 | 1.096 |
| C22 | 1.676 | 1.808 | 1.527 | 1.529 | 1.031 | 1.681 | 1.087 | 1.579 | 1.594 | 0.949 | 1.182 | 1.636 | 1.718 | 0.960 | 1.229 | 1.381 | 1.395 | 1.353 | 1.290 | 1.162 |
| C31 | 1.867 | 1.947 | 1.675 | 1.681 | 1.727 | 1.365 | 1.505 | 1.781 | 1.846 | 1.300 | 1.424 | 1.814 | 1.899 | 1.168 | 1.386 | 1.742 | 1.519 | 1.931 | 1.692 | 1.440 |
| C32 | 1.097 | 1.358 | 1.023 | 1.248 | 1.362 | 1.415 | 0.693 | 1.343 | 1.474 | 0.834 | 0.936 | 1.121 | 1.291 | 0.873 | 0.883 | 1.479 | 0.994 | 1.432 | 1.431 | 1.205 |
| C33 | 1.081 | 1.467 | 1.061 | 0.987 | 1.019 | 1.135 | 0.927 | 0.851 | 1.036 | 0.741 | 1.140 | 1.422 | 1.394 | 0.856 | 0.932 | 1.137 | 1.308 | 1.517 | 1.327 | 1.165 |
| C41 | 1.013 | 1.234 | 0.949 | 1.042 | 1.058 | 1.318 | 1.108 | 1.244 | 0.831 | 1.131 | 0.900 | 1.128 | 1.147 | 0.771 | 0.887 | 1.250 | 0.961 | 1.294 | 1.219 | 0.866 |
| C42 | 0.968 | 1.050 | 0.848 | 0.886 | 0.895 | 1.290 | 1.053 | 1.306 | 1.323 | 0.532 | 0.827 | 1.279 | 1.070 | 0.711 | 0.898 | 1.012 | 0.898 | 1.087 | 0.928 | 0.813 |
| C43 | 1.114 | 1.352 | 0.912 | 0.954 | 0.942 | 1.361 | 0.766 | 1.209 | 1.220 | 0.718 | 0.604 | 1.041 | 1.057 | 0.739 | 0.857 | 0.967 | 0.862 | 1.110 | 0.925 | 0.822 |
| C44 | 1.215 | 1.392 | 0.941 | 1.042 | 0.995 | 1.312 | 0.921 | 1.028 | 1.314 | 0.878 | 0.905 | 0.837 | 1.402 | 0.778 | 0.846 | 1.078 | 1.147 | 1.145 | 1.317 | 0.947 |
| C51 | 1.528 | 1.644 | 1.038 | 1.148 | 1.176 | 1.437 | 0.963 | 1.471 | 1.132 | 0.861 | 1.228 | 1.373 | 1.027 | 1.111 | 1.140 | 1.479 | 1.120 | 1.419 | 1.052 | 1.009 |
| C52 | 0.952 | 1.106 | 0.851 | 0.880 | 0.903 | 1.008 | 0.743 | 1.195 | 0.966 | 0.706 | 0.789 | 1.230 | 1.276 | 0.517 | 0.726 | 1.178 | 1.070 | 1.055 | 1.240 | 0.928 |
| C53 | 1.058 | 1.170 | 0.931 | 1.186 | 1.039 | 1.291 | 0.864 | 1.256 | 1.102 | 0.813 | 1.201 | 1.279 | 1.301 | 0.797 | 0.619 | 1.264 | 0.886 | 1.120 | 1.004 | 0.865 |
| C61 | 1.453 | 1.543 | 1.360 | 1.334 | 1.443 | 1.442 | 0.912 | 1.220 | 1.490 | 0.933 | 1.008 | 1.201 | 1.522 | 1.086 | 1.010 | 0.963 | 1.034 | 1.576 | 1.159 | 1.081 |
| C62 | 1.075 | 0.958 | 0.877 | 0.817 | 0.970 | 1.170 | 0.703 | 0.878 | 0.850 | 0.713 | 0.772 | 0.933 | 1.142 | 0.762 | 0.715 | 0.926 | 0.586 | 0.995 | 0.811 | 0.734 |
| C63 | 1.248 | 1.327 | 1.004 | 0.971 | 0.972 | 1.243 | 0.796 | 0.918 | 0.921 | 0.709 | 0.816 | 1.043 | 1.136 | 0.790 | 0.772 | 1.043 | 1.105 | 0.796 | 0.862 | 0.769 |
| C71 | 1.161 | 1.244 | 0.962 | 1.114 | 1.154 | 1.432 | 0.928 | 1.477 | 1.493 | 0.874 | 0.986 | 1.456 | 1.447 | 0.815 | 1.156 | 1.373 | 1.049 | 1.454 | 0.852 | 1.274 |
| C72 | 1.125 | 1.382 | 1.150 | 1.139 | 1.202 | 1.410 | 1.205 | 1.475 | 1.434 | 0.940 | 1.025 | 1.211 | 1.413 | 0.860 | 1.053 | 1.409 | 1.176 | 1.379 | 1.315 | 0.740 |
All the values in Table A4 are multiplied by 10.
Table A5.
Normalized total relations matrix .
| C11 | C12 | C13 | C21 | C22 | C31 | C32 | C33 | C41 | C42 | C43 | C44 | C51 | C52 | C53 | C61 | C62 | C63 | C71 | C72 | |
|---|---|---|---|---|---|---|---|---|---|---|---|---|---|---|---|---|---|---|---|---|
| C11 | 3.975 | 6.546 | 5.649 | 5.770 | 5.672 | 5.586 | 4.111 | 4.926 | 5.251 | 3.881 | 4.212 | 5.698 | 5.843 | 3.909 | 4.186 | 5.850 | 4.753 | 6.084 | 4.250 | 3.849 |
| C12 | 6.124 | 4.391 | 5.737 | 5.647 | 5.964 | 6.212 | 3.797 | 4.577 | 4.920 | 3.437 | 4.103 | 5.639 | 6.125 | 3.743 | 4.182 | 5.734 | 4.977 | 6.044 | 4.923 | 3.725 |
| C13 | 6.532 | 7.007 | 3.577 | 6.109 | 6.400 | 5.256 | 4.032 | 4.923 | 4.833 | 3.794 | 4.494 | 4.855 | 5.782 | 3.726 | 3.936 | 4.953 | 4.861 | 6.315 | 4.483 | 4.132 |
| C21 | 6.216 | 6.635 | 5.818 | 3.666 | 6.069 | 6.401 | 3.748 | 4.916 | 4.598 | 3.435 | 4.084 | 5.012 | 6.454 | 3.424 | 3.823 | 5.602 | 4.185 | 6.127 | 5.397 | 4.392 |
| C22 | 6.036 | 6.513 | 5.498 | 5.506 | 3.714 | 6.055 | 3.915 | 5.687 | 5.742 | 3.416 | 4.258 | 5.892 | 6.186 | 3.459 | 4.425 | 4.972 | 5.023 | 4.872 | 4.647 | 4.186 |
| C31 | 5.708 | 5.952 | 5.122 | 5.140 | 5.281 | 4.173 | 4.602 | 5.446 | 5.643 | 3.973 | 4.353 | 5.547 | 5.805 | 3.572 | 4.237 | 5.327 | 4.643 | 5.905 | 5.173 | 4.401 |
| C32 | 4.670 | 5.780 | 4.353 | 5.311 | 5.797 | 6.024 | 2.951 | 5.716 | 6.273 | 3.550 | 3.986 | 4.772 | 5.494 | 3.716 | 3.759 | 6.295 | 4.232 | 6.096 | 6.094 | 5.130 |
| C33 | 4.806 | 6.517 | 4.714 | 4.387 | 4.527 | 5.046 | 4.118 | 3.784 | 4.606 | 3.295 | 5.064 | 6.317 | 6.195 | 3.803 | 4.141 | 5.054 | 5.814 | 6.742 | 5.895 | 5.176 |
| C41 | 4.745 | 5.778 | 4.445 | 4.880 | 4.957 | 6.171 | 5.191 | 5.824 | 3.891 | 5.298 | 4.215 | 5.285 | 5.374 | 3.610 | 4.155 | 5.856 | 4.502 | 6.061 | 5.708 | 4.054 |
| C42 | 4.921 | 5.340 | 4.311 | 4.501 | 4.550 | 6.557 | 5.351 | 6.638 | 6.724 | 2.703 | 4.205 | 6.503 | 5.437 | 3.613 | 4.565 | 5.144 | 4.562 | 5.524 | 4.718 | 4.133 |
| C43 | 5.704 | 6.924 | 4.670 | 4.882 | 4.823 | 6.970 | 3.921 | 6.189 | 6.246 | 3.674 | 3.091 | 5.330 | 5.410 | 3.785 | 4.388 | 4.953 | 4.413 | 5.682 | 4.734 | 4.209 |
| C44 | 5.666 | 6.491 | 4.388 | 4.862 | 4.641 | 6.118 | 4.295 | 4.795 | 6.130 | 4.098 | 4.223 | 3.904 | 6.538 | 3.629 | 3.944 | 5.027 | 5.350 | 5.343 | 6.141 | 4.418 |
| C51 | 6.272 | 6.749 | 4.263 | 4.715 | 4.827 | 5.900 | 3.953 | 6.040 | 4.646 | 3.534 | 5.043 | 5.637 | 4.218 | 4.561 | 4.680 | 6.074 | 4.597 | 5.828 | 4.317 | 4.144 |
| C52 | 4.928 | 5.725 | 4.403 | 4.554 | 4.672 | 5.217 | 3.845 | 6.186 | 4.999 | 3.657 | 4.087 | 6.367 | 6.606 | 2.677 | 3.758 | 6.100 | 5.538 | 5.462 | 6.417 | 4.803 |
| C53 | 5.028 | 5.558 | 4.423 | 5.634 | 4.938 | 6.135 | 4.103 | 5.969 | 5.237 | 3.865 | 5.706 | 6.078 | 6.182 | 3.784 | 2.941 | 6.007 | 4.208 | 5.321 | 4.772 | 4.111 |
| C61 | 5.868 | 6.228 | 5.490 | 5.386 | 5.824 | 5.822 | 3.681 | 4.925 | 6.014 | 3.766 | 4.069 | 4.851 | 6.143 | 4.384 | 4.077 | 3.888 | 4.176 | 6.362 | 4.681 | 4.366 |
| C62 | 6.182 | 5.511 | 5.046 | 4.700 | 5.579 | 6.728 | 4.046 | 5.049 | 4.890 | 4.099 | 4.439 | 5.365 | 6.567 | 4.383 | 4.110 | 5.327 | 3.372 | 5.722 | 4.667 | 4.220 |
| C63 | 6.486 | 6.895 | 5.218 | 5.047 | 5.051 | 6.462 | 4.139 | 4.769 | 4.785 | 3.687 | 4.243 | 5.421 | 5.902 | 4.105 | 4.011 | 5.423 | 5.741 | 4.137 | 4.478 | 3.999 |
| C71 | 4.898 | 5.249 | 4.060 | 4.702 | 4.869 | 6.042 | 3.913 | 6.233 | 6.301 | 3.686 | 4.158 | 6.145 | 6.105 | 3.440 | 4.875 | 5.792 | 4.426 | 6.133 | 3.596 | 5.376 |
| C72 | 4.679 | 5.749 | 4.782 | 4.736 | 4.999 | 5.865 | 5.013 | 6.134 | 5.963 | 3.911 | 4.264 | 5.037 | 5.876 | 3.579 | 4.380 | 5.859 | 4.892 | 5.734 | 5.471 | 3.078 |
All the values in Table A5 are multiplied by 100.
References
- Jamwal, A.; Agrawal, R.; Sharma, M.; Kumar, V.; Kumar, S. Developing A sustainability framework for Industry 4.0. Procedia CIRP 2021, 98, 430–435. [Google Scholar] [CrossRef]
- Bai, C.; Dallasega, P.; Orzes, G.; Sarkis, J. Industry 4.0 technologies assessment: A sustainability perspective. Int. J. Prod. Econ. 2020, 229, 107776. [Google Scholar] [CrossRef]
- Cochran, D.S.; Rauch, E. Sustainable Enterprise Design 4.0: Addressing Industry 4.0 Technologies from the Perspective of Sustainability. Procedia Manuf. 2020, 51, 1237–1244. [Google Scholar] [CrossRef]
- Holubčík, M.; Koman, G.; Soviar, J. Industry 4.0 in Logistics Operations. Transp. Res. Procedia 2021, 53, 282–288. [Google Scholar] [CrossRef]
- Ghobakhloo, M.; Fathi, M.; Iranmanesh, M.; Maroufkhani, P.; Morales, M.E. Industry 4.0 ten years on: A bibliometric and systematic review of concepts, sustainability value drivers, and success determinants. J. Clean. Prod. 2021, 302, 127052. [Google Scholar] [CrossRef]
- Blömeke, S.; Rickert, J.; Mennenga, M.; Thiede, S.; Spengler, T.S.; Herrmann, C. Recycling 4.0—Mapping smart manufacturing solutions to remanufacturing and recycling operations. Procedia CIRP 2020, 90, 600–605. [Google Scholar] [CrossRef]
- Nascimento, D.L.M.; Alencastro, V.; Quelhas, O.L.G.; Caiado, R.G.G.; Garza-Reyes, J.A.; Rocha-Lona, L.; Tortorella, G. Exploring Industry 4.0 technologies to enable circular economy practices in a manufacturing context: A business model proposal. J. Manuf. Technol. Manage. 2019, 30, 607–627. [Google Scholar] [CrossRef]
- Kaivo-Oja, J.; Knudsen, M.S.; Lauraéus, T. Reimagining Finland as a manufacturing base: The nearshoring potential of Finland in an industry 4.0 perspective. Bus. Manage. Econ. Eng. 2018, 16, 65–80. [Google Scholar] [CrossRef]
- Rüßmann, M.; Lorenz, M.; Gerbert, P.; Waldner, M.; Justus, J.; Engel, P.; Harnisch, M. Industry 4.0: The Future of Productivity and Growth in Manufacturing Industries. BCG 2015, 1, 1–14. [Google Scholar]
- Wee, D.; Kelly, R.; Cattel, J.; Breunig, M. Industry 4.0-how to navigate digitization of the manufacturing sector. MBB 2015, 1, 1–62. [Google Scholar] [CrossRef]
- Tan, Y.S.; Ng, Y.T.; Low, J.S.C. Internet-of-Things Enabled Real-time Monitoring of Energy Efficiency on Manufacturing Shop Floors. Procedia CIRP 2017, 61, 376–381. [Google Scholar] [CrossRef]
- Aly, M.; Khomh, F.; Yacout, S. What Do Practitioners Discuss about IoT and Industry 4.0 Related Technologies? Characterization and Identification of IoT and Industry 4.0 Categories in Stack Overflow Discussions. Internet Things Cyber Phys. Syst. 2021, 14, 100364. [Google Scholar] [CrossRef]
- Manavalan, E.; Jayakrishna, K. A review of Internet of Things (IoT) embedded sustainable supply chain for industry 4.0 requirements. Comput. Ind. Eng. 2019, 127, 925–953. [Google Scholar] [CrossRef]
- Iaiani, M.; Tugnoli, A.; Bonvicini, S.; Cozzani, V. Analysis of Cybersecurity-related Incidents in the Process Industry. Reliab. Eng. Syst. Saf. 2021, 209, 107485. [Google Scholar] [CrossRef]
- Kiss, M.; Breda, G.; Muha, L. Information security aspects of Industry 4.0. Procedia Manuf. 2019, 32, 848–855. [Google Scholar] [CrossRef]
- Wu, D.; Ren, A.; Zhang, W.; Fan, F.; Liu, P.; Fu, X.; Terpenny, J. Cybersecurity for digital manufacturing. J. Manuf. Syst. 2018, 48, 3–12. [Google Scholar] [CrossRef]
- Gao, Z.; Wanyama, T.; Singh, I.; Gadhrri, A.; Schmidt, R. From Industry 4.0 to Robotics 4.0—A Conceptual Framework for Collaborative and Intelligent Robotic Systems. Procedia Manuf. 2020, 46, 591–599. [Google Scholar] [CrossRef]
- Ashima, R.; Haleem, A.; Bahl, S.; Javaid, M.; Mahla, S.K.; Singh, S. Automation and manufacturing of smart materials in additive manufacturing technologies using Internet of Things towards the adoption of industry 4.0. Mater. Today Proc. 2021, in press. [Google Scholar] [CrossRef]
- Dilberoglu, U.M.; Gharehpapagh, B.; Yaman, U.; Dolen, M. The Role of Additive Manufacturing in the Era of Industry 4.0. Procedia Manuf. 2017, 11, 545–554. [Google Scholar] [CrossRef]
- Amjad, M.S.; Rafique, M.Z.; Khan, M.A. Leveraging Optimized and Cleaner Production through Industry 4.0. Sustain. Prod. Consum. 2021, 26, 859–871. [Google Scholar] [CrossRef]
- Teerasoponpong, S.; Sopadang, A. A simulation-optimization approach for adaptive manufacturing capacity planning in small and medium-sized enterprises. Expert Syst. Appl. 2021, 168, 114451. [Google Scholar] [CrossRef]
- Anbalagan, A.; Moreno-Garcia, C.F. An IoT based industry 4.0 architecture for integration of design and manufacturing systems. Mater. Today Proc. 2020, in press. [Google Scholar] [CrossRef]
- Singh, H. Big data, industry 4.0 and cyber-physical systems integration: A smart industry context. Mater. Today Proc. 2020, in press. [Google Scholar] [CrossRef]
- Gupta, S.; Meissonier, R.; Drave, V.A.; Roubaud, D. Examining the impact of Cloud ERP on sustainable performance: A dynamic capability view. Int. J. Inf. Manage. 2020, 51, 102028. [Google Scholar] [CrossRef]
- Javied, T.; Huprich, S.; Franke, J. Cloud based Energy Management System Compatible with the Industry 4.0 Requirements. IFAC Pap. 2019, 52, 171–175. [Google Scholar] [CrossRef]
- Azeem, M.; Haleem, A.; Bahl, S.; Javaid, M.; Suman, R.; Nandan, D. Big data applications to take up major challenges across manufacturing industries: A brief review. Mater. Today Proc. 2021, in press. [Google Scholar] [CrossRef]
- Sahal, R.; Breslin, J.G.; Ali, M.I. Big data and stream processing platforms for Industry 4.0 requirements mapping for a predictive maintenance use case. J. Manuf. Syst. 2020, 54, 138–151. [Google Scholar] [CrossRef]
- Gattullo, M.; Scurati, G.W.; Fiorentino, M.; Uva, A.M.; Ferrise, F.; Bordegoni, M. Towards augmented reality manuals for industry 4.0: A methodology. Rob. Comput. Integr. Manuf. 2019, 56, 276–286. [Google Scholar] [CrossRef]
- Masood, T.; Egger, J. Augmented reality in support of Industry 4.0—Implementation challenges and success factors. Rob. Comput. Integr. Manuf. 2019, 58, 181–195. [Google Scholar] [CrossRef]
- Adamik, A.; Nowicki, M. Barriers of creating competitive advantage in the age of Industry 4.0-conclusions from international experience. In Contemporary Challenges in Cooperation and Coopetition in the Age of Industry 4.0; Zakrzewska-Bielawska, A., Staniec, I., Eds.; Springer International Publishing: Cham, Switzerland, 2020; pp. 3–42. [Google Scholar] [CrossRef]
- Masoni, R.; Ferrise, F.; Bordegoni, M.; Gattullo, M.; Uva, A.E.; Fiorentino, M.; Carrabba, E.; Donato, M.D. Supporting Remote Maintenance in Industry 4.0 through Augmented Reality. Procedia Manuf. 2017, 11, 1296–1302. [Google Scholar] [CrossRef]
- Faheem, M.; Butt, R.A.; Ali, R.; Raza, B.; Ngadi, M.A.; Gungor, V.C. CBI4.0: A cross-layer approach for big data gathering for active monitoring and maintenance in the manufacturing industry 4.0. J. Ind. Inf. Integr. 2021, 24, 100236. [Google Scholar] [CrossRef]
- Kagermann, H. Change through digitization—Value creation in the age of industry 4.0. In Management of Permanent Change; Albach, H., Meffert, H., Pinkwart, A., Eds.; Springer Gabler: Wiesbaden, Germany, 2015; pp. 23–45. [Google Scholar] [CrossRef]
- Burns, T.; Cosgrove, J.; Doyle, F. A Review of Interoperability Standards for Industry 4.0. Procedia Manuf. 2019, 38, 646–653. [Google Scholar] [CrossRef]
- Lepore, D.; Micozzi, A.; Spigarelli, F. Industry 4.0 Accelerating Sustainable Manufacturing in the COVID-19 Era: Assessing the Readiness and Responsiveness of Italian Regions. Sustainability 2021, 13, 2670. [Google Scholar] [CrossRef]
- Enyoghasi, C.; Badurdeen, F. Industry 4.0 for sustainable manufacturing: Opportunities at the product, process, and system levels. Resour. Conserv. Recycl. 2021, 166, 105362. [Google Scholar] [CrossRef]
- Corallo, A.; Lazoi, M.; Lezzi, M. Cybersecurity in the context of industry 4.0: A structured classification of critical assets and business impacts. Comput. Ind. 2020, 114, 103165. [Google Scholar] [CrossRef]
- Esmaeilian, B.; Sarkis, J.; Lewis, K.; Behdad, S. Blockchain for the future of sustainable supply chain management in Industry 4.0. Resour. Conserv. Recycl. 2020, 163, 105064. [Google Scholar] [CrossRef]
- Lezzi, M.; Lazoi, M.; Corallo, A. Cybersecurity for Industry 4.0 in the current literature: A reference framework. Comput. Ind. 2018, 103, 97–110. [Google Scholar] [CrossRef]
- Yadav, G.; Kumar, A.; Luthra, S.; Garza-Reyes, J.A.; Kumar, V.; Batista, L. A framework to achieve sustainability in manufacturing organisations of developing economies using industry 4.0 technologies’ enablers. Comput. Ind. 2020, 122, 103280. [Google Scholar] [CrossRef]
- Gmelin, H.; Seuring, S. Achieving sustainable new product development by integrating product life-cycle management capabilities. Int. J. Prod. Econ. 2014, 154, 166–177. [Google Scholar] [CrossRef]
- Xu, W.; Shao, L.; Yao, B.; Zhou, Z.; Pham, D.T. Perception data-driven optimization of manufacturing equipment service scheduling in sustainable manufacturing. Int. J. Ind. Manuf. Syst. Eng. 2016, 41, 86–101. [Google Scholar] [CrossRef]
- Directive (EU) 2016/1148 of the European Parliament and of the Council of 6 July 2016 Concerning Measures for a High Common Level of Security of Network and Information Systems across the Union. Available online: https://eur-lex.europa.eu/legal-content/EN/TXT/PDF/?uri=CELEX:32016L1148&from=EN (accessed on 7 June 2021).
- European Network and Information Security Agency (ENISA). Protecting Industrial Control Systems—Annex III: ICS Security Related Standards, Guidelines and Policy Documents. Available online: https://www.enisa.europa.eu/publications/annex-iii/at_download/fullReport (accessed on 7 June 2021).
- European Cyber Security Organisation (ECS). State of the Art Syllabus—Overview of Existing Cybersecurity Standards and Certification Schemes. Available online: http://www.ecs-org.eu/documents/uploads/state-of-the-art-syllabus-v1.pdf (accessed on 7 June 2021).
- The French Network and Security Agency (ANSSI). Cybersecurity for Industrial Control Systems: Managing Cybersecurity for Industrial Control Systems. Available online: https://www.ssi.gouv.fr/uploads/2014/01/Managing_Cybe_for_ICS_EN.pdf (accessed on 7 June 2021).
- The French Network and Security Agency (ANSSI). Cybersecurity for Industrial Control Systems: Classification Method and Key Measures. Available online: https://www.ssi.gouv.fr/uploads/2014/01/industrial_security_WG_Classification_Method.pdf (accessed on 7 June 2021).
- The French Network and Security Agency (ANSSI). Cybersecurity for Industrial Control Systems: Detailed Measures. Available online: https://www.ssi.gouv.fr/uploads/2014/01/industrial_security_WG_detailed_measures.pdf (accessed on 7 June 2021).
- Federal Office for Information Security (BSI). ICS Security Compendium. Available online: https://www.bsi.bund.de/SharedDocs/Downloads/EN/BSI/ICS/ICS-Security_compendium.pdf?__blob=publicationFile&v=1 (accessed on 7 June 2021).
- National Institute of Standards and Technology (NIST). NIST Special Publication 800-53. Revision 5. Security and Privacy Controls for Information Systems and Organizations. Available online: https://nvlpubs.nist.gov/nistpubs/SpecialPublications/NIST.SP.800-53r5.pdf (accessed on 7 June 2021). [CrossRef]
- International Organization for Standardization (ISO). ISO 27000: 2018. Available online: https://standards.iso.org/ittf/PubliclyAvailableStandards/index.html (accessed on 7 June 2021).
- International Society of Automation (ISA). An Overview of ISA/IEC 62443 Standards Security of Industrial Automation and Control Systems. Available online: https://gca.isa.org/hubfs/ISAGCA%20Quick%20Start%20Guide%20FINAL.pdf (accessed on 7 June 2021).
- Qassim, Q.S.; Jamil, N.; Daud, M.; Patel, A.; Ja’affar, N. A review of security assessment methodologies in industrial control systems. Inf. Comput. Secur. 2019, 27, 47–61. [Google Scholar] [CrossRef]
- Großmann, J.; Seehusen, F. Combining security risk assessment and security testing based on standards. In Risk Assessment and Risk-Driven Testing; Seehusen, F., Felderer, M., Eds.; Springer International Publishing: Cham, Switzerland, 2015; Volume 9488, pp. 18–33. [Google Scholar] [CrossRef]
- Felderer, M.; Zech, P.; Breu, R.; Büchler, M.; Pretschner, A. Model-based security testing: A taxonomy and systematic classification. Softw. Test. Verif. Reliab. 2016, 26, 119–148. [Google Scholar] [CrossRef]
- Jansen, C.; Jeschke, S. Mitigating risks of digitalization through managed industrial security services. AI Soc. 2018, 33, 163–173. [Google Scholar] [CrossRef]
- Rindell, K.; Ruohonen, J.; Holvitie, J.; Hyrynsalmi, S.; Leppänen, V. Security in agile software development: A practitioner survey. Inf. Softw. Technol. 2021, 131, 106488. [Google Scholar] [CrossRef]
- Leszczyna, R. Review of cybersecurity assessment methods: Applicability perspective. Comput. Secur. 2021, 108, 102376. [Google Scholar] [CrossRef]
- Bertoglio, D.D.; Zorzo, A.F. Overview and open issues on penetration test. J. Braz. Comput. Soc. 2017, 23, 1–16. [Google Scholar] [CrossRef] [Green Version]
- Aheleroff, S.; Xu, X.; Lu, Y.; Aristizabal, M.; Valencia, Y. IoT-enabled smart appliances under industry 4.0: A case study. Adv. Eng. Inform. 2020, 43, 101043. [Google Scholar] [CrossRef]
- Lee, J.; Azamfar, M.; Singh, J. A blockchain enabled Cyber-Physical System architecture for Industry 4.0 manufacturing systems. Manuf. Lett. 2019, 20, 34–39. [Google Scholar] [CrossRef]
- Liu, X.L.; Wang, W.M.; Guo, H.; Barenji, A.V.; Li, Z.; Huang, G.G. Industrial blockchain based framework for product lifecycle management in industry 4.0. Robot C. Int. Manuf. 2020, 63, 101897. [Google Scholar] [CrossRef]
- Ribeiro, J.; Lima, R.; Eckhardt, T.; Paiva, S. Robotic Process Automation and Artificial Intelligence in Industry 4.0—A Literature review. Procedia Comput. Sci. 2021, 181, 51–58. [Google Scholar] [CrossRef]
- Malik, P.K.; Sharma, R.; Singh, R.; Gehlot, A.; Satapathy, S.C.; Alnumay, W.S.; Pelusi, D.; Ghosh, U.; Nayak, J. Industrial Internet of Things and its Applications in Industry 4.0: State of The Art. Comput. Commun. 2021, 166, 125–139. [Google Scholar] [CrossRef]
- Pivoto, D.G.S.; Almeida, L.F.F.; Righi, R.R.; Rodrigues, J.J.P.C.; Lugli, A.B.; Alberti, A.M. Cyber-physical systems architectures for industrial internet of things applications in Industry 4.0: A literature review. J. Manuf. Syst. 2021, 58, 176–192. [Google Scholar] [CrossRef]
- Johnson, L. (Ed.) Chapter 12—Cybersecurity framework. In Security Controls Evaluation, Testing, and Assessment Handbook, 2nd ed.; Academic Press: Cambridge, UK, 2020; pp. 537–548. [Google Scholar] [CrossRef]
- Bullock, J.A.; Haddow, G.D.; Coppola, D.P. Chapter 8—Cybersecurity and critical infrastructure protection. In Introduction to Homeland Security, 6th ed.; Bullock, J.A., Haddow, G.D., Eds.; Butterworth-Heinemann: Oxford, UK, 2021; pp. 425–497. [Google Scholar] [CrossRef]
- Sancho, J.C.; Caro, A.; Ávila, M.; Bravo, A. New approach for threat classification and security risk estimations based on security event management. Future Gener. Comput. Syst. 2020, 113, 488–505. [Google Scholar] [CrossRef]
- Andrianova, V. Electronic signature key storage. Procedia Comput. Sci. 2018, 145, 59–63. [Google Scholar] [CrossRef]
- Dumortier, J.; Vandezande, N. Trust in the proposed EU regulation on trust services? Comput. Law Secur. Rev. 2012, 28, 568–576. [Google Scholar] [CrossRef]
- Mason, S. Documents signed or executed with electronic signatures in English law. Comput. Law Secur. Rev. 2018, 34, 933–945. [Google Scholar] [CrossRef]
- Polanski, P.P. Towards the single digital market for e-identification and trust services. Comput. Law Secur. Rev. 2015, 31, 773–781. [Google Scholar] [CrossRef]
- Hyla, T.; Pejaś, J. Long-term verification of signatures based on a blockchain. Comput. Electr. Eng. 2020, 81, 106523. [Google Scholar] [CrossRef]
- Leitold, H.; Posch, R.; Rössler, T. Reconstruction of electronic signatures from eDocument printouts. Comput. Secur. 2010, 29, 523–532. [Google Scholar] [CrossRef]
- Porcedda, M.G. Patching the patchwork: Appraising the EU regulatory framework on cyber security breaches. Comput. Law Secur. Rev. 2018, 34, 1077–1098. [Google Scholar] [CrossRef]
- Wibbeling, S.; Schneiders, F. Research Project ePOD@Home: Electronic Proof of Delivery at Point of Delivery. In Efficiency and Logistics. Lecture Notes in Logistics, 1st ed.; Clausen, U., Hompel, M., Eds.; Springer: Berlin/Heidelberg, Germany, 2013; pp. 99–108. [Google Scholar]
- Chang, H.H.; Chen, S.W. Consumer perception of interface quality, security, and loyalty in electronic commerce. Inf. Manag. 2009, 46, 411–417. [Google Scholar] [CrossRef]
- Hawanna, V.; Kulkarni, V.Y.; Rane, R.A.; Mestri, P.; Panchal, S. Risk Rating System of X.509 Certificates. Procedia Comput. Sci. 2016, 89, 152–161. [Google Scholar] [CrossRef] [Green Version]
- Mourtzis, D.; Angelopoulos, J.; Panopoulos, N. A survey of digital B2B platforms and marketplaces for purchasing industrial product service systems: A conceptual framework. Procedia CIRP 2021, 97, 331–336. [Google Scholar] [CrossRef]
- Oppliger, R.; Hauser, R.; Basin, D. SSL/TLS session-aware user authentication revisited. Comput. Secur. 2008, 27, 64–70. [Google Scholar] [CrossRef] [Green Version]
- Schubert, P.; Legner, C. B2B integration in global supply chains: An identification of technical integration scenarios. J. Strat. Inf. Syst. 2011, 20, 250–267. [Google Scholar] [CrossRef]
- Bhushan, B.; Sinha, P.; Sagayam, K.K.; Andrew, J. Untangling blockchain technology: A survey on state of the art, security threats, privacy services, applications and future research directions. Comput. Electr. Eng. 2021, 90, 106897. [Google Scholar] [CrossRef]
- Mohanta, B.K.; Jena, D.; Panda, S.S.; Sobhanayak, S. Blockchain technology: A survey on applications and security privacy Challenges. Internet Things 2019, 8, 100107. [Google Scholar] [CrossRef]
- Wu, H.; Zheng, G. Electronic evidence in the blockchain era: New rules on authenticity and integrity. Comput. Law Secur. Rev. 2020, 36, 105401. [Google Scholar] [CrossRef]
- Rolinck, M.; Gellrich, S.; Bode, C.; Mennenga, M.; Cerdas, F.; Friedrichs, J.; Herrmann, C. A Concept for Blockchain-Based LCA and its Application in the Context of Aircraft MRO. Procedia CIRP 2021, 98, 394–399. [Google Scholar] [CrossRef]
- Chapman, P. Defending against insider threats with network security’s eighth layer. Comput. Fraud Secur. 2021, 2021, 8–13. [Google Scholar] [CrossRef]
- Zhang, J. Distributed network security framework of energy internet based on internet of things. Sustain. Energy Technol. Assess 2021, 44, 101051. [Google Scholar] [CrossRef]
- Priyadarsini, M.; Bera, P. Software defined networking architecture, traffic management, security, and placement: A survey. Comput. Netw. 2021, 192, 108047. [Google Scholar] [CrossRef]
- Ahmadian, M.M.; Shajari, M.; Shafiee, M.A. Industrial control system security taxonomic framework with application to a comprehensive incidents survey. Int. J. Crit. Infrastruct. Prot. 2020, 29, 100356. [Google Scholar] [CrossRef]
- Harrington, J.L. (Ed.) Chapter 23—Database Security. In Relational Database Design and Implementation, 4th ed.; Morgan Kaufmann: Burlington, VT, USA, 2016; pp. 471–495. [Google Scholar] [CrossRef]
- Saxena, A.; Claeys, D.; Bruneel, H.; Walraevens, J. Analysis of the age of data in data backup systems. Comput. Netw. 2019, 160, 41–50. [Google Scholar] [CrossRef]
- Hanif, H.; Nasir, M.H.M.N.; Razak, M.F.A.; Firdaus, A.; Anuar, N.B. The rise of software vulnerability: Taxonomy of software vulnerabilities detection and machine learning approaches. J. Netw. Comput. Appl. 2021, 179, 103009. [Google Scholar] [CrossRef]
- Berhe, S.; Maynard, M.; Khomh, F. Software Release Patterns When is it a good time to update a software component? Procedia Comput. Sci. 2020, 170, 618–625. [Google Scholar] [CrossRef]
- Yang, L.; Wei, T.; Zhang, F.; Ma, J. SADUS: Secure data deletion in user space for mobile devices. Comput. Secur. 2018, 77, 612–626. [Google Scholar] [CrossRef]
- Hunter, L.E.; Khan, A.A.; Taylor, J.; Stanger, J.; Shimonski, R.J. Chapter 2—Designing a Managed Antivirus Infrastructure. In Configuring Symantec AntiVirus Enterprise Edition, 2nd ed.; Hunter, L.E., Khan, A.A., Eds.; Syngress: Burlington, VT, USA, 2003; pp. 41–75. [Google Scholar] [CrossRef]
- McKinnel, D.R.; Dargahi, T.; Dehghantanha, A.; Choo, K.K.R. A systematic literature review and meta-analysis on artificial intelligence in penetration testing and vulnerability assessment. Comput. Electr. Eng. 2019, 75, 175–188. [Google Scholar] [CrossRef]
- Shinder, T.W. (Ed.) Chapter 6—Creating Remote Access and Site-to-Site VPNs with ISA Firewalls. In Dr. Tom Shinder’s ISA Server 2006 Migration Guide, 1st ed.; Syngress: Burlington, VT, USA, 2006; pp. 353–434. [Google Scholar]
- Alshaikh, M. Developing cybersecurity culture to influence employee behavior: A practice perspective. Comput. Secur. 2020, 98, 102003. [Google Scholar] [CrossRef]
- Leonard, L.C. Chapter One—Web-Based Behavioral Modeling for Continuous User Authentication (CUA). In Advances in Computers, 1st ed.; Memon, A.M., Ed.; Elsevier: Amsterdam, The Netherlands, 2017; pp. 1–44. [Google Scholar] [CrossRef]
- Fuchsberger, A. Intrusion Detection Systems and Intrusion Prevention Systems. Inf. Secur. Tech. Rep. 2005, 10, 134–139. [Google Scholar] [CrossRef]
- Reid, F. (Ed.) 7—Securing a Network: Firewalls, Proxy Servers, and Routers. In Network Programming in .NET, 1st ed.; Digital Press: Amsterdam, The Netherlands, 2004; pp. 195–208. [Google Scholar] [CrossRef]
- Akbanov, M.; Vassilakis, V.G.; Logothetis, M.D. Ransomware detection and mitigation using software-defined networking: The case of WannaCry. Comput. Electr. Eng. 2019, 76, 111–121. [Google Scholar] [CrossRef]
- Sundaramurthy, S.C.; Bardas, A.; Case, J.; Ou, X.; Wesch, M.; Mchugh, J.; Siva, R. A Human Capital Model for Mitigating Security Analyst Burnout. Elev. Symp. Usable Priv. Secur. SOUPS 2015, 1, 347–359. [Google Scholar]
- Qamar, A.; Karim, A.; Chang, V. Mobile malware attacks: Review, taxonomy & future directions. Future Gener. Comput. Syst. 2019, 97, 887–909. [Google Scholar] [CrossRef]
- Bongo, M.F.; Alimpangog, K.M.S.; Loar, J.F.; Montefalcon, J.A.; Lanndon, A. Ocampo, An application of DEMATEL-ANP and PROMETHEE II approach for air traffic controllers’ workload stress problem: A case of Mactan Civil Aviation Authority of the Philippines. J. Air Transp. Manag. 2018, 68, 198–213. [Google Scholar] [CrossRef]
- Tan, T.; Mills, G.; Papadonikolaki, E.; Liu, Z. Combining multi-criteria decision making (MCDM) methods with building information modelling (BIM): A review. Autom. Constr. 2021, 121, 103451. [Google Scholar] [CrossRef]
- Torbacki, W. Multi-criteria decision method for choosing ERP cloud systems in Industry 4.0 era. Multi. Asp. Prod. Eng. 2019, 2, 435–446. [Google Scholar] [CrossRef] [Green Version]
- Govindan, K.; Kannan, D.; Shankar, M. Evaluation of green manufacturing practices using a hybrid MCDM model combining DANP with PROMETHEE. Int. J. Prod. Res. 2015, 53, 6344–6371. [Google Scholar] [CrossRef]
- Mulliner, E.; Malys, N.; Maliene, V. Comparative analysis of MCDM methods for the assessment of sustainable housing affordability. Omega 2016, 59, 146–156. [Google Scholar] [CrossRef]
- Huang, C.N.; Liou, J.J.H.; Chuang, Y.C. A method for exploring the interdependencies and importance of critical infrastructures. Knowl. Based Syst. 2014, 55, 66–74. [Google Scholar] [CrossRef]
- Laugé, A.; Hernantes, J.; Sarriegi, J.M. Critical infrastructure dependencies: A holistic, dynamic and quantitative approach. Int. J. Crit. Infrastruct. Prot. 2015, 8, 16–23. [Google Scholar] [CrossRef]
- Sharma, M.; Sehrawat, R.; Daim, T.; Shaygan, A. Technology assessment: Enabling Blockchain in hospitality and tourism sectors. Technol. Forecast. Soc. Chang. 2021, 169, 120810. [Google Scholar] [CrossRef]
- Chou, J.S.; Ongkowijoyo, C.S. Hybrid decision-making method for assessing interdependency and priority of critical infrastructure. Int. J. Disaster Risk Reduct. 2019, 39, 101134. [Google Scholar] [CrossRef]
- Hsu, C.C.; Liou, J.J.H. An outsourcing provider decision model for the airline industry. J. Air Transp. Manag. 2013, 28, 40–46. [Google Scholar] [CrossRef]
- Gabus, A.; Fontela, E. World Problems, an Invitation to Further Thought within the Framework of Dematel; Battelle Geneva Research Centre: Geneva, Switzerland, 1972. [Google Scholar]
- Saaty, T. Fundamentals of the Analytic Network Process-dependence and Feedback in Decision-making with a Single Network. J. Syst. Sci. Syst. Eng. 2004, 13, 129–157. [Google Scholar] [CrossRef]
- Tsai, P.H. Strategic evaluation criteria to assess competitiveness of the service industry in Taiwan. J. Policy Model. 2020, 42, 1287–1309. [Google Scholar] [CrossRef]
- Rao, S.H. A hybrid MCDM model based on DEMATEL and ANP for improving the measurement of corporate sustainability indicators: A study of Taiwan High Speed Rail. Res. Transport. Bus. Manag. 2021, 100657, in press. [Google Scholar] [CrossRef]
- Sufiyan, M.; Haleem, A.; Khan, S.; Khan, M.I. Evaluating food supply chain performance using hybrid fuzzy MCDM technique. Sustain. Prod. Consum. 2019, 20, 40–57. [Google Scholar] [CrossRef]
- Brans, J.P.; Vinke, P. A preference ranking organization method (the PROMETHEE method for multiple criteria decision making). Manag. Sci. 1985, 31, 647–656. [Google Scholar] [CrossRef] [Green Version]
- Kabir, G.; Sadiq, R.; Tesfamariam, S. A review of multi-criteria decision-making methods for infrastructure management. Struct. Infrastruct. Eng. 2014, 10, 176–210. [Google Scholar] [CrossRef]
- Brans, J.P. The space of freedom of the decision maker modelling the human brain. Eur. J. Oper. Res. 1996, 92, 593–602. [Google Scholar] [CrossRef]
- Kilic, H.; Zaim, S.; Delen, D. Selecting “The Best” ERP system for SMEs using a combination of ANP and PROMETHEE methods. Expert Syst. Appl. 2015, 42, 2343–2352. [Google Scholar] [CrossRef]
- Abedi, M.; Torabi, S.A.; Norouzi, G.H.; Hamzeh, M.; Elyasi, G.R. PROMETHEE II: A knowledge-driven method for copper exploration. Comput. Geosci. 2012, 246, 55–263. [Google Scholar] [CrossRef]
Figure 1.
Digital data exchange between the systems of Industry 4.0 participants.

Figure 2.
Casual diagram for seven dimensions of cybersecurity.

Figure 3.
Casual diagram for twenty criteria of cybersecurity.

Table 1.
Impact of groups of cybersecurity measures on sustainability development.
| Code | Group of Cybersecurity Measures | Impact on Sustainable Development |
|---|---|---|
| A1 | Operational | Constant monitoring of the right operation and stability of the applied cybersecurity solutions. The lack of stable operation of cybersecurity monitoring systems and related production management systems is a factor that distorts sustainable development. In the event of finding various violations, unstable operation of systems, in extreme cases, there may be an automatic disconnection of production lines, the need to rearm machines, test start-ups, waste of materials, energy and water, the increase in the number of production waste and the disruption of supply chains. |
| A2 | Technological | Constant ensuring the IT cybersecurity software and equipment to be always in the best condition and include the latest solutions. On the IT market, successive versions of software dedicated to cybersecurity for the industry are using more and more precisely the possibilities of parallel and multithreaded operation of multi-core processors. Only due to the latest software versions, is the same computing power of servers generated with a significant reduction in energy consumption and the improvement of energy efficiency. It is a process in the field of Sustainable Development Goal 7—affordable, reliable, sustainable and modern energy. Server rooms in production companies, working in a continuous mode, are huge consumers of electricity. Actions towards carbon neutrality are performed not only by software. The design of the latest servers also allows increasing the computing power obtained from a single server. Thus, it reduces the need for companies to purchase more servers, limits the server room space, lowers the energy consumption needed to power this type of rooms and equipment, and minimizes the amount of human work spent on managing this infrastructure. It is worth noting that server rooms contain extensive installations: multiple power lines and power generators, air conditioning systems with anti-dust air filters, inert gas fire extinguishing systems with early fire detection sensors, independent Internet lines, access control systems to rooms with telemonitoring. Therefore, the possibility of limiting this infrastructure owing to the use of the latest servers contributes to the reduction of the company’s carbon footprint and is a move towards carbon neutrality. Additional benefits in this respect are obtained in the case of a production company switching to the cloud mode with software rental in the SaaS mode in external server rooms. In this case, many systems and companies work on each of the efficient servers, which also reduces the company’s carbon footprint. |
| A3 | Organizational | Constant tracking and improvement of cybersecurity procedures. Each occurrence of an IT failure and cybersecurity breach in manufacturing companies should be thoroughly analysed and earlier procedures should be modified. It is also worth paying attention to the social nature of violations of cybersecurity procedures in manufacturing companies in the context of sustainable social behaviour and social interactions. The moment when such an incident occurs is related to both attempts to remove it and to search for the reasons for its occurrence, also among the staff. This leads to social tensions and divisions among employees at the same level as well as between the management and employees directly employed in production. As a consequence, a noticeable level of satisfaction of individual groups of employees is decreasing in companies. Therefore, improving existing cybersecurity procedures also contributes to sustainable development. |
Table 3.
Preference functions and measures for criteria.
| Criterion | Criterion Code | Preference Function | Type | Unit | Measure |
|---|---|---|---|---|---|
| Electronic signature, Electronic seal, and Electronic time stamp | C11 | Type 3 | Quantitative | Number of used types | A2 |
| Validation and maintaining electronic signatures and seals | C12 | Type 2 | Qualitative | - | A2 |
| Recorded Electronic Delivery | C13 | Type 3 | Quantitative | Percentage | A2 |
| Authentication of online B2B portals; X.509/TLS/SSL | C21 | Type 3 | Quantitative | Number of used types | A2 |
| Blockchain technology | C22 | Type 1 | Quantitative | - | A2 |
| Adequate technical security of a company network | C31 | Type 2 | Qualitative | - | A3 |
| Optimal network and server architecture | C32 | Type 2 | Qualitative | - | A3 |
| Monitoring and analysis of security incidents | C33 | Type 3 | Qualitative | Number of incidents per time unit | A1 |
| Database security | C41 | Type 2 | Quantitative | Percentage | A3 |
| Establishment of an efficient backup system | C42 | Type 2 | Qualitative | - | A3 |
| Vulnerability scan; Source code analysis to look for software weaknesses | C43 | Type 2 | Qualitative | - | A1 |
| Software updates | C44 | Type 3 | Quantitative | Number of updates per time unit | A3 |
| Appropriate techniques for securing workstations and mobile devices | C51 | Type 2 | Qualitative | - | A2 |
| Antivirus and antimalware | C52 | Type 3 | Quantitative | Number of used types | A2 |
| Penetration testing to find vulnerabilities | C53 | Type 3 | Quantitative | Number of tests per time unit | A1 |
| Establishing a VPN secure remote connection with the corporate server | C61 | Type 2 | Qualitative | - | A2 |
| Regular training of employees in the field of cybersecurity | C62 | Type 3 | Quantitative | Number of training hours | A3 |
| Creating rules for managing access to corporate data; User authentication | C63 | Type 2 | Qualitative | - | A3 |
| Intrusion Prevention System and Intrusion Detection System with algorithms to real-time detect the malicious attacks | C71 | Type 1 | Quantitative | - | A1 |
| Firewall, Gateway, and Proxy | C72 | Type 3 | Quantitative | Number of used solutions | A2 |
Table 4.
, submatrices, the position and relation indicators.
| D1 | 0.8590 | 0.8948 | 1.7538 | -0.0358 | C11 | 2.7718 | 2.5153 | 5.2871 | 0.2565 |
| C12 | 2.6228 | 2.7957 | 5.4185 | −0.1729 | |||||
| C13 | 1.9332 | 2.2322 | 4.1654 | −0.2990 | |||||
| D2 | 0.9211 | 0.8293 | 1.7503 | 0.0918 | C21 | 2.4963 | 2.3133 | 4.8097 | 0.1830 |
| C22 | 2.7766 | 2.3776 | 5.1542 | 0.3990 | |||||
| D3 | 0.9230 | 0.8404 | 1.7634 | 0.0826 | C31 | 3.2708 | 2.7101 | 5.9809 | 0.5607 |
| C32 | 2.3490 | 1.9023 | 4.2513 | 0.4467 | |||||
| C33 | 2.2501 | 2.4975 | 4.7477 | −0.2474 | |||||
| D4 | 0.7163 | 0.7737 | 1.4899 | −0.0574 | C41 | 2.1351 | 2.4852 | 4.6203 | −0.3501 |
| C42 | 1.9672 | 1.7199 | 3.6872 | 0.2473 | |||||
| C43 | 1.9531 | 1.9875 | 3.9406 | −0.0344 | |||||
| C44 | 2.1438 | 2.5253 | 4.6691 | −0.3815 | |||||
| D5 | 0.7529 | 0.7528 | 1.5057 | 0.0001 | C51 | 2.4355 | 2.7194 | 5.1549 | −0.2839 |
| C52 | 1.9317 | 1.7234 | 3.6552 | 0.2083 | |||||
| C53 | 2.1047 | 1.9078 | 4.0125 | 0.1969 | |||||
| D6 | 0.7167 | 0.8703 | 1.5871 | −0.1536 | C61 | 2.4768 | 2.5163 | 4.9931 | −0.0395 |
| C62 | 1.7384 | 2.1715 | 3.9100 | −0.4331 | |||||
| C63 | 1.9240 | 2.6684 | 4.5924 | −0.7444 | |||||
| D7 | 0.8297 | 0.7574 | 1.5872 | 0.0723 | C71 | 2.3702 | 2.3107 | 4.6808 | 0.0595 |
| C72 | 2.4041 | 1.9759 | 4.3801 | 0.4282 |
Table 5.
Aggregated rating of criteria from DANP matrix.
| Criterion | Priority Vector |
|---|---|
| C11 | 5.5125 |
| C12 | 6.0933 |
| C13 | 4.8358 |
| C21 | 5.0210 |
| C22 | 5.1718 |
| C31 | 5.9150 |
| C32 | 4.1314 |
| C33 | 5.3755 |
| C41 | 5.3424 |
| C42 | 3.7526 |
| C43 | 4.3223 |
| C44 | 5.4631 |
| C51 | 5.9023 |
| C52 | 3.7699 |
| C53 | 4.1433 |
| C61 | 5.4467 |
| C62 | 4.7314 |
| C63 | 5.7801 |
| C71 | 5.0026 |
| C72 | 4.2869 |
All the values in Table 5 are multiplied by 100.
Table 6.
Aggregated rating of measures in PROMETHEE II.
| Criterion | A1 | A2 | A3 |
|---|---|---|---|
| C11 | 3.1429 | 4.1905 | 2.6190 |
| C12 | 2.5238 | 4.4762 | 3.3810 |
| C13 | 3.1905 | 4.1429 | 2.9523 |
| C21 | 2.8571 | 4.0476 | 2.5714 |
| C22 | 2.9048 | 4.0952 | 3.1429 |
| C31 | 2.6667 | 3.2857 | 4.4286 |
| C32 | 3.1905 | 2.7143 | 3.9524 |
| C33 | 4.4310 | 2.8571 | 3.0476 |
| C41 | 2.9048 | 2.3810 | 3.6190 |
| C42 | 3.2857 | 3.1905 | 3.5238 |
| C43 | 3.8571 | 3.0476 | 2.8095 |
| C44 | 3.1429 | 3.2381 | 3.5714 |
| C51 | 3.9048 | 4.4310 | 3.2381 |
| C52 | 2.8571 | 3.7619 | 2.4762 |
| C53 | 3.4762 | 3.2857 | 3.1429 |
| C61 | 3.1429 | 3.4286 | 3.0952 |
| C62 | 2.4286 | 2.9048 | 3.3810 |
| C63 | 3.0476 | 2.9048 | 4.2857 |
| C71 | 3.3810 | 3.2381 | 2.8095 |
| C72 | 2.7619 | 3.5238 | 3.3810 |
Table 7.
Deviation of measures in PROMETHEE II.
| Criterion | A1–A2 | A1–A3 | A2–A1 | A2–A3 | A3–A1 | A3–A2 |
|---|---|---|---|---|---|---|
| C11 | −1.0476 | 0.5239 | 1.0476 | 1.5715 | −0.5239 | −1.5715 |
| C12 | −1.9524 | −0.8572 | 1.9524 | 1.0952 | 0.8572 | −1.0952 |
| C13 | −0.9524 | 0.2382 | 0.9524 | 1.1906 | −0.2382 | −1.1906 |
| C21 | −1.1905 | 0.2857 | 1.1905 | 1.4762 | −0.2857 | −1.4762 |
| C22 | −1.1904 | −0.2381 | 1.1904 | 0.9523 | 0.2381 | −0.9523 |
| C31 | −0.6190 | −1.7619 | 0.6190 | −1.1429 | 1.7619 | 1.1429 |
| C32 | 0.4762 | −0.7619 | −0.4762 | −1.2381 | 0.7619 | 1.2381 |
| C33 | 1.5739 | 1.3834 | −1.5739 | −0.1905 | −1.3834 | 0.1905 |
| C41 | 0.5238 | −0.7142 | −0.5238 | −1.2381 | 0.7142 | 1.2380 |
| C42 | 0.0952 | −0.2381 | −0.0952 | −0.3333 | 0.2381 | 0.3333 |
| C43 | 0.8095 | 1.0476 | −0.8095 | 0.2381 | −1.0476 | −0.2381 |
| C44 | −0.0952 | −0.4285 | 0.0952 | −0.3333 | 0.4285 | 0.3333 |
| C51 | −0.5262 | 0.6667 | 0.5262 | 1.1929 | −0.6667 | −1.1929 |
| C52 | −0.9048 | 0.3809 | 0.9048 | 1.2857 | −0.3809 | −1.2857 |
| C53 | 0.1905 | 0.3333 | −0.1905 | 0.1428 | −0.3333 | −0.1428 |
| C61 | −0.2857 | 0.0477 | 0.2857 | 0.3333 | −0.0477 | −0.3333 |
| C62 | −0.4762 | −0.9524 | 0.4762 | −0.4762 | 0.9524 | 0.4762 |
| C63 | 0.1428 | −1.2381 | −0.1428 | −1.3809 | 1.2381 | 1.3809 |
| C71 | 0.1429 | 0.5715 | −0.1429 | 0.4286 | −0.5715 | −0.4286 |
| C72 | −0.7619 | −0.6191 | 0.7619 | 0.1428 | 0.6191 | −0.1428 |
Table 8.
Preference functions for each pair of measures.
| Criterion | Parameter Value | A1–A2 | A1–A3 | A2–A1 | A2–A3 | A3–A1 | A3–A2 |
|---|---|---|---|---|---|---|---|
| C11 | 1 | 0 | 0.5239 | 1 | 1 | 0 | 0 |
| C12 | 1 | 0 | 0 | 1 | 1 | 0 | 0 |
| C13 | 2 | 0 | 0.1191 | 0.4762 | 0.5953 | 0 | 0 |
| C21 | 1 | 0 | 0.2857 | 1 | 1 | 0 | 0 |
| C22 | 0 | 0 | 0 | 1 | 1 | 1 | 0 |
| C31 | 1 | 0 | 0 | 0 | 0 | 1 | 1 |
| C32 | 1 | 0 | 0 | 0 | 0 | 0 | 1 |
| C33 | 1 | 1 | 1 | 0 | 0 | 0 | 0.1905 |
| C41 | 1 | 0 | 0 | 0 | 0 | 0 | 1 |
| C42 | 1 | 0 | 0 | 0 | 0 | 0 | 0 |
| C43 | 1 | 0 | 1 | 0 | 0 | 0 | 0 |
| C44 | 1 | 0 | 0 | 0.0952 | 0 | 0.4285 | 0.3333 |
| C51 | 1 | 0 | 0 | 0 | 1 | 0 | 0 |
| C52 | 1 | 0 | 0.3809 | 0.9048 | 1 | 0.3809 | 0 |
| C53 | 1 | 0.1905 | 0.3333 | 0 | 0.1428 | 0 | 0 |
| C61 | 1 | 0 | 0 | 0 | 0 | 0 | 0 |
| C62 | 1 | 0 | 0 | 0.4762 | 0 | 0.9524 | 0.4762 |
| C63 | 1 | 0 | 0 | 0 | 0 | 1 | 1 |
| C71 | 0 | 1 | 1 | 0 | 1 | 0 | 0 |
| C72 | 2 | 0 | 0 | 0.3810 | 0.0714 | 0.3100 | 0 |
Table 9.
Aggregated preference functions in PROMETHEE II.
| Criterion | Weights | A1–A2 | A1–A3 | A2–A1 | A2–A3 | A3–A1 | A3–A2 |
|---|---|---|---|---|---|---|---|
| C11 | 5.5125 | 0 | 2.8880 | 5.5125 | 5.5125 | 0 | 0 |
| C12 | 6.0933 | 0 | 0 | 6.0933 | 6.0933 | 0 | 0 |
| C13 | 4.8358 | 0 | 0.5759 | 2.3028 | 2.8788 | 0 | 0 |
| C21 | 5.0210 | 0 | 1.4345 | 5.021 | 5.0210 | 0 | 0 |
| C22 | 5.1718 | 0 | 0 | 5.1718 | 5.1718 | 5.1718 | 0 |
| C31 | 5.9150 | 0 | 0 | 0 | 0 | 5.915 | 5.915 |
| C32 | 4.1314 | 0 | 0 | 0 | 0 | 0 | 4.1314 |
| C33 | 5.3755 | 5.3755 | 5.3755 | 0 | 0 | 0 | 1.0240 |
| C41 | 5.3424 | 0 | 0 | 0 | 0 | 0 | 5.3424 |
| C42 | 3.7526 | 0 | 0 | 0 | 0 | 0 | 0 |
| C43 | 4.3223 | 0 | 4.3223 | 0 | 0 | 0 | 0 |
| C44 | 5.4631 | 0 | 0 | 0.5201 | 0 | 2.3409 | 1.8209 |
| C51 | 5.9023 | 0 | 0 | 0 | 5.9023 | 0 | 0 |
| C52 | 3.7699 | 0 | 1.4360 | 3.4110 | 3.7699 | 1.4360 | 0 |
| C53 | 4.1433 | 0.7893 | 1.3810 | 0 | 0.5917 | 0 | 0 |
| C61 | 5.4467 | 0 | 0 | 0 | 0 | 0 | 0 |
| C62 | 4.7314 | 0 | 0 | 2.2531 | 0 | 4.5062 | 2.2531 |
| C63 | 5.7801 | 0 | 0 | 0 | 0 | 5.7801 | 5.7801 |
| C71 | 5.0026 | 5.0026 | 5.0026 | 0 | 5.0026 | 0 | 0 |
| C72 | 4.2869 | 0 | 0 | 1.6333 | 0.3061 | 1.3289 | 0 |
All the values in Table 9 are multiplied by 100.
Table 10.
Ranking of cybersecurity measures in PROMETHEE II.
| Code | Group of Cybersecurity Measures | Ranking | |||
|---|---|---|---|---|---|
| A1 | Operational | 0.3358 | 0.5840 | −0.2482 | 3 |
| A2 | Technological | 0.7217 | 0.3743 | 0.3474 | 1 |
| A3 | Organizational | 0.5275 | 0.6267 | −0.0992 | 2 |
Publisher’s Note: MDPI stays neutral with regard to jurisdictional claims in published maps and institutional affiliations. |
© 2021 by the author. Licensee MDPI, Basel, Switzerland. This article is an open access article distributed under the terms and conditions of the Creative Commons Attribution (CC BY) license (https://creativecommons.org/licenses/by/4.0/).
Share and Cite
MDPI and ACS Style
Torbacki, W. A Hybrid MCDM Model Combining DANP and PROMETHEE II Methods for the Assessment of Cybersecurity in Industry 4.0. Sustainability 2021, 13, 8833. https://doi.org/10.3390/su13168833
AMA Style
Torbacki W. A Hybrid MCDM Model Combining DANP and PROMETHEE II Methods for the Assessment of Cybersecurity in Industry 4.0. Sustainability. 2021; 13(16):8833. https://doi.org/10.3390/su13168833
Chicago/Turabian StyleTorbacki, Witold. 2021. "A Hybrid MCDM Model Combining DANP and PROMETHEE II Methods for the Assessment of Cybersecurity in Industry 4.0" Sustainability 13, no. 16: 8833. https://doi.org/10.3390/su13168833
Note that from the first issue of 2016, this journal uses article numbers instead of page numbers. See further details here.