
Model Supporting Development Decisions by Considering Qualitative–Environmental Aspects


Faculty of Mechanical Engineering and Aeronautics, Rzeszow University of Technology, al. Powstancow Warszawy Rzeszow 12, 35-959 Rzeszow, Poland
*
Author to whom correspondence should be addressed.
Sustainability 2021, 13(16), 9067; https://doi.org/10.3390/su13169067
Submission received: 7 July 2021
/
Revised: 29 July 2021
/
Accepted: 3 August 2021
/
Published: 13 August 2021
(This article belongs to the Topic Industrial Engineering and Management)
Abstract
:Dynamic changes in customers’ expectations and unfavorable climate changes have generated the need to consider such aspects in the process of creating new products and the modernization of existing products. Simultaneously including customers’ expectations and environmental impact is a key element of the sustainable development of products. Enterprises attempt, within their awareness and possibilities, to apply the idea of sustainability; they do this more or less methodically. As such, an instrument to support decision-making in the area of product development is still needed because it would both be desirable for customers and have less of a negative effect on the natural environment. The purpose of this study was to develop a model that supports decision-making in the development of products while considering sustainability. The model determines the key criteria of the product, criteria states (current and future), and their positive correlations (e.g., achieving high levels of product quality and no (or a reduction in) destructive impact on the environment). To reduce the fuzzy decision-making environment, multiplicative decision methods with the fuzzy Saaty scale were implemented. These methods were the fuzzy analytic hierarchy process (FAHP) and the fuzzy technique for order of preference by similarity to ideal solution (FTOPSIS). The model is able to support qualitative–environment decisions in the development of any product.
1. Introduction
In well-developed enterprises, improving product quality while simultaneously taking care of the natural environment is important. It mainly manifests itself as customer-orientated product development [1,2,3] and concerns the customization of products to customers’ expectations while also considering reductions of the negative impacts of these products on the natural environment [4,5]. This requires the development of products that are safe for the environment (ecological) and simultaneously satisfactory in terms of quality [6,7,8,9,10]. The product quality level—the level of product compliance with customers’ expectations, referring only to the specific intended use of the product—is determined for this purpose. From a pro-environment standpoint, the quality level should include environmental aspects, i.e., the consideration of all organization activities and products that can impact the environment [11]. However, the dynamics of the market, including the industrialization of enterprises (Industry 4.0) [12,13], have generated the need for the sustainable development of products ahead of the competition [1]. This requires the prediction of product quality level and its possible impact on the natural environment. Accordingly, acquiring customers’ expectations (their guesswork and desires) based on their opinion of existing products is beneficial [3]. This allows for a more precise expression of customers’ expectations and reduces negative environmental aspects. Various instruments are used for this purpose, but it remains a challenge to anticipate a product that is both qualitatively and environmentally satisfactory.
A review of the literature on the subject indicates that previous research has been concerned with predicting the product quality level and impact of the product on the environment. However, a single model for simultaneously predicting the product quality level while considering the product’s impact on the natural environment is lacking. For example, the authors of [14] predicted the quality level of solder paste printing (SPP). This prediction was supported by a neural network based on wavelets; it was shown that applying a multidimensional neural network supported the efficiency of the printing process. In addition, it was shown that applying a multidimensional neural network can prevent print defects and determine how often the printer needs to be cleaned. Decision support with a neural network was also used by the authors of [15], in which the subject of analysis was wood. In this case, the quality of wood was predicted by considering its density, stiffness, and localization. Neural networks (which use machine learning) have also been applied to support micro-injection molding, in which the reflection quality is analyzed while also considering other criteria, e.g., sensitivity, profitability, and reliability [16]. As a result, it was shown that the presented model was 84% accurate in predicting quality. Another example was [17], in which customer decisions were supported by predicting changes in their decisions based on the quality and price of the product. Specifications dependent on customer choice (importance, focus, and relative thinking) and the decoy effect were compared, and it was determined that the decoy effect was similarly important to the price and quality of the product. The authors of [18] showed that decisions about predicting the time of designing a new product were supported, depending on the complexity of the product and the prototypes produced. However, these studies did not include environmental aspects. In this context, for example, the prediction of primary reaction networks of various components of agricultural waste was supported. The used components were elements for the production of biofuels [19]. It was possible to support the decision regarding the prediction of the quality of biofuels being product-friendly for the environment. In turn, in [20], the prediction of organization finance results based on product quality and organization ecological strategy was supported. It was shown that the acceptance of a green strategy maintains financial profitability by simultaneously concentrating on product quality. In [21], decisions regarding the influence of quality of briquettes and lumps of charcoal in creating potentially harmful emissions during barbecues were supported; for this purpose, reflected light microscopy was used, and the obtained results could be used to predict whether these products were harmful.
Nevertheless, product quality was not predicted to simultaneously achieve satisfactory levels for the customer and be environmentally beneficial. The need for this analysis was also mentioned by the authors of [22], in which the prediction of product quality in cold stores by gas sensors was supported. However, in the aforementioned article, the authors noted how important it is to realize studies in order to predict the negative impact of this sensor on product quality.
It has been shown that the product quality level can be predicted [14,15,16,17,18]. In addition, the impact of products on the natural environment can be predicted [19,20,21,22]. However, a model that allows for the prediction of pro-quality decisions while simultaneously considering qualitative and environmental aspects is lacking. In this context, pro-quality decisions are predicted decisions that match customers’ expectations regarding product quality level while being environmentally friendly. The lack of such a model is considered a gap.
Hence, the purpose of this analysis was to develop a model to predict beneficial pro-quality decisions from a design point, while also considering environmental aspects. As part of the analysis, two hypotheses were assumed.
Hypothesis 1 (H1).
It is possible to predict a product that is environmentally friendly and has a quality level satisfactory for customers; this prediction is realized based on the positive correlations of qualitative and environmental criteria.
Hypothesis 2 (H2).
It is possible to support a choice of the best product based on qualitative and environmental criteria by connecting survey research, the FAHP method, the FTOPSIS method, and the correlational technique.
In order to verify assumed hypotheses, the model was subjected to non-destructive testing (NDT) with popularly applied, harmful fluorescent penetrants.
2. Model
A model for predicting pro-quality decisions while considering qualitative–environmental aspects in two phases was developed. The first phase of the model is defining the quality and environmental criteria of the product expected by the customers. In this phase, key product criteria, i.e., criteria that have an impact on product quality level and the natural environment, are verified. The results of the first phase of the model are positive correlations of qualitative and environmental criteria, i.e., criteria that allow for the achievement of satisfactory product quality while being environmentally friendly. This ensures that many product criteria are initially reduced to criteria that are favorable to both quality and the environment. Thus, product selection can be properly thought out, more precise, satisfying for customers, and made with consideration for the environment. The second phase of the model consists of verifying the products in terms of positive correlations of qualitative and environmental criteria.
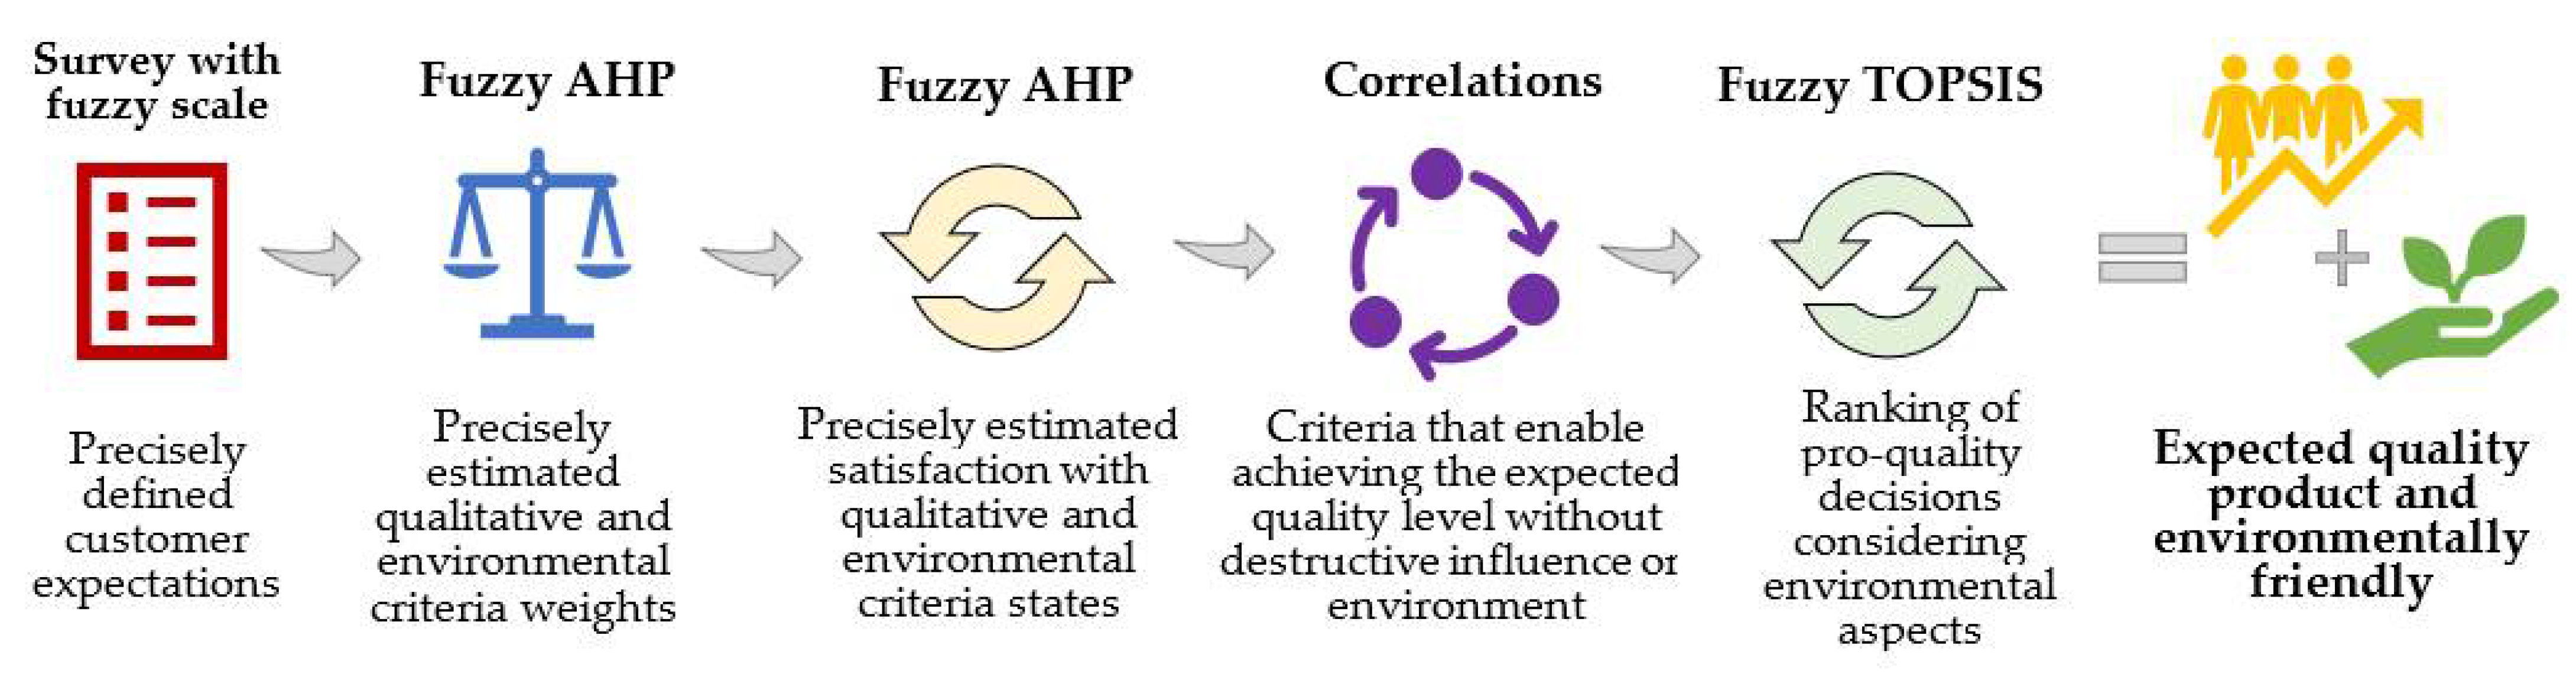
In the model, multiple-criteria decision-making methods (MCDMs) are implemented. These are frequently used and combined methods, i.e., fuzzy analytic hierarchy process (FAHP) [23,24] and fuzzy technique for order of preference by similarity to ideal solution (FTOPSIS) [25]. A graphical justification of the choice of these methods is shown in Figure 1.
These methods were integrated into the model because they are preferred for making multiple-criteria decisions [8,26,27,28]. The effectiveness of combining these methods for decision support has been previously confirmed [8,29,30,31]. The FAHP method was used to determine the importance and satisfaction of product criteria. The reason for using the FAHP method was to reduce inconsistencies and imprecision when determining customers’ expectations, which could be done with a fuzzy Saaty scale [32]. Additionally, the FAHP method is an uncomplicated and effective technique to solve multiple decision problems. This method successfully copes with fuzzy and uncertainty, therefore supporting making decisions with many criteria of varying importance. In the FAHP method, it is possible to verify any kind of criteria, e.g., objective, subjective, quantitative, or qualitative. Additionally, fuzzy decisions in the FAHP are sufficient for prediction. By using the FAHP method, it is possible to precisely determine the weights and qualities of criteria and then to order them in a single ranking. Additionally, the FAHP method allows for accuracy in the results of small sample sizes, including 5–9 customers and (in extreme cases) even one client [8,29,30,31]. Additionally, this method seemed to be the most advantageous, because it is effective in connection with the FTOPSIS method. In turn, the choice of the FTOPSIS method resulted from the analysis of different criteria states (i.e., benefit and cost criteria sufficiency, as in the FTOPSIS method). Therefore, the FTOPSIS method was used to predict quality level values resulting from the positive correlations of qualitatively–environmental criteria. This method predicts the ranking (order) of product attribute state changes, which are favorable in terms of quality while simultaneously considering the environment. The FTOPSIS method was also chosen because it was assumed that customers’ expectations are acquired based on possible criteria modifications, and the FTOPSIS method allows for the determination of product quality in terms of benefits (more is better) and costs (less is better) [25,27,28].
In the proposed model, it is important to distinguish between multi-criteria continuous and discrete problems. In the case of a multi-criteria continuous problem, a feasible set is defined by a set of constraints. This means that there is an infinite number of decision alternatives. However, in practical scenarios, this set is finite, whereas in multi-criteria discrete problems (as with the presented model), the feasible set is explicitly defined. In discrete problems, there is a finite set of decision variants and a finite set of criteria. On their basis, a decision is made.
The characteristics of the model are discussed next.
Stage 1. Selecting Subject of Analysis
The selection of the subject of analysis is unrestricted. For example, it can be a popular product with a negative impact on the natural environment [33,34,35]. The choice of product can be made by considering sales trends and product life phase, among other factors.
Stage 2. Determining the Purpose of Analysis
The aim should be to predict pro-quality product selection while considering care for the environment, so the selection of a product that is favorable in terms of both quality and the environment should be based on positive correlations of qualitative and environmental criteria, i.e., the expected quality criterion state that allows one to achieve the expected environment criterion state (reduction of the negative impact on environment). For this purpose, one can use the SMART method (Specific, Measurable, Achievable, Relevant, and Time-bound) [33].
Stage 3. Selection of Criteria
The criteria should refer to the product that is selected in the second stage of the model. Two groups of criteria should be determined. The first group is qualitative criteria, which characterize the product in terms of its user’s characteristics. The second group is environmental criteria, which refer to the product’s impact on the natural environment. The number of qualitative and environmental criteria is unrestricted. According to the authors of [33,36,37,38], it is beneficial to select a total of approximately 14–25 criteria (attributes). According to [34,36], the fewer criteria, the better. The choice of criteria can be done during brainstorming (BM) and using product catalogues [39].
Stage 4. Determination of Criteria States
At this stage, the product criteria states should be determined. The initial purpose of this is to determine the expected product criteria (qualitative and environmental). It consists of determining current and modified states for all criteria selected in the third stage. One current state and at least one modified state must be specified for each criterion. According to [7], the total number of current and modified state values for one criterion must be a maximum of 72. A current state is a criterion state that actually characterizes the product. A modified (future) state is a criterion state that could be characterize the product. The states should be determined by description, visualization [40], parameters (values), or ranges of values. To determine states of product criteria, one can use a product catalogue (specification). It is recommended to use BM or include the enterprises’ production capacity, the results of previous improvement actions, historical data, or customer feedback on the product [41].
Stage 5. Acquisition of Customers’ Expectations
At this stage, it is necessary to acquire customers’ expectations regarding the importance of product criteria (from the third stage) and satisfaction with the states of these criteria (from the fourth stage). Customers’ expectations are processed in the next stages of the model. Customers’ expectations can acquired by popularly used survey research [1,42,43,44]. In the survey, the Saaty scale (from 1 to 9) [45,46,47] is used, and it is converted to the fuzzy Saaty scale (triangular fuzzy number) in the next stages of the model. We chose the Saaty scale because of its effectiveness in reducing uncertain and imprecise customer expectations. Fuzzy numbers are implemented as part of fuzzy set theory and consist of a set of real numbers with a convex and continuous membership function of bounded support. Fuzzy numbers can be applied to precisely represent the linguistic scale while considering the uncertainty of customer decisions. An advantage of survey research with a fuzzy Saaty scale is the proven effectiveness of research conducted among a relatively small number of customers [48,49,50,51,52]. According to [51,52,53], precise results can be achieved even in groups comprising just 5–9 experts. It was shown that the research sample does not have to be statistically representative, and for testing, it is enough to obtain expectations from just one customer [49,50]. A description of the ten-stage Saaty scale is shown in Table 1.
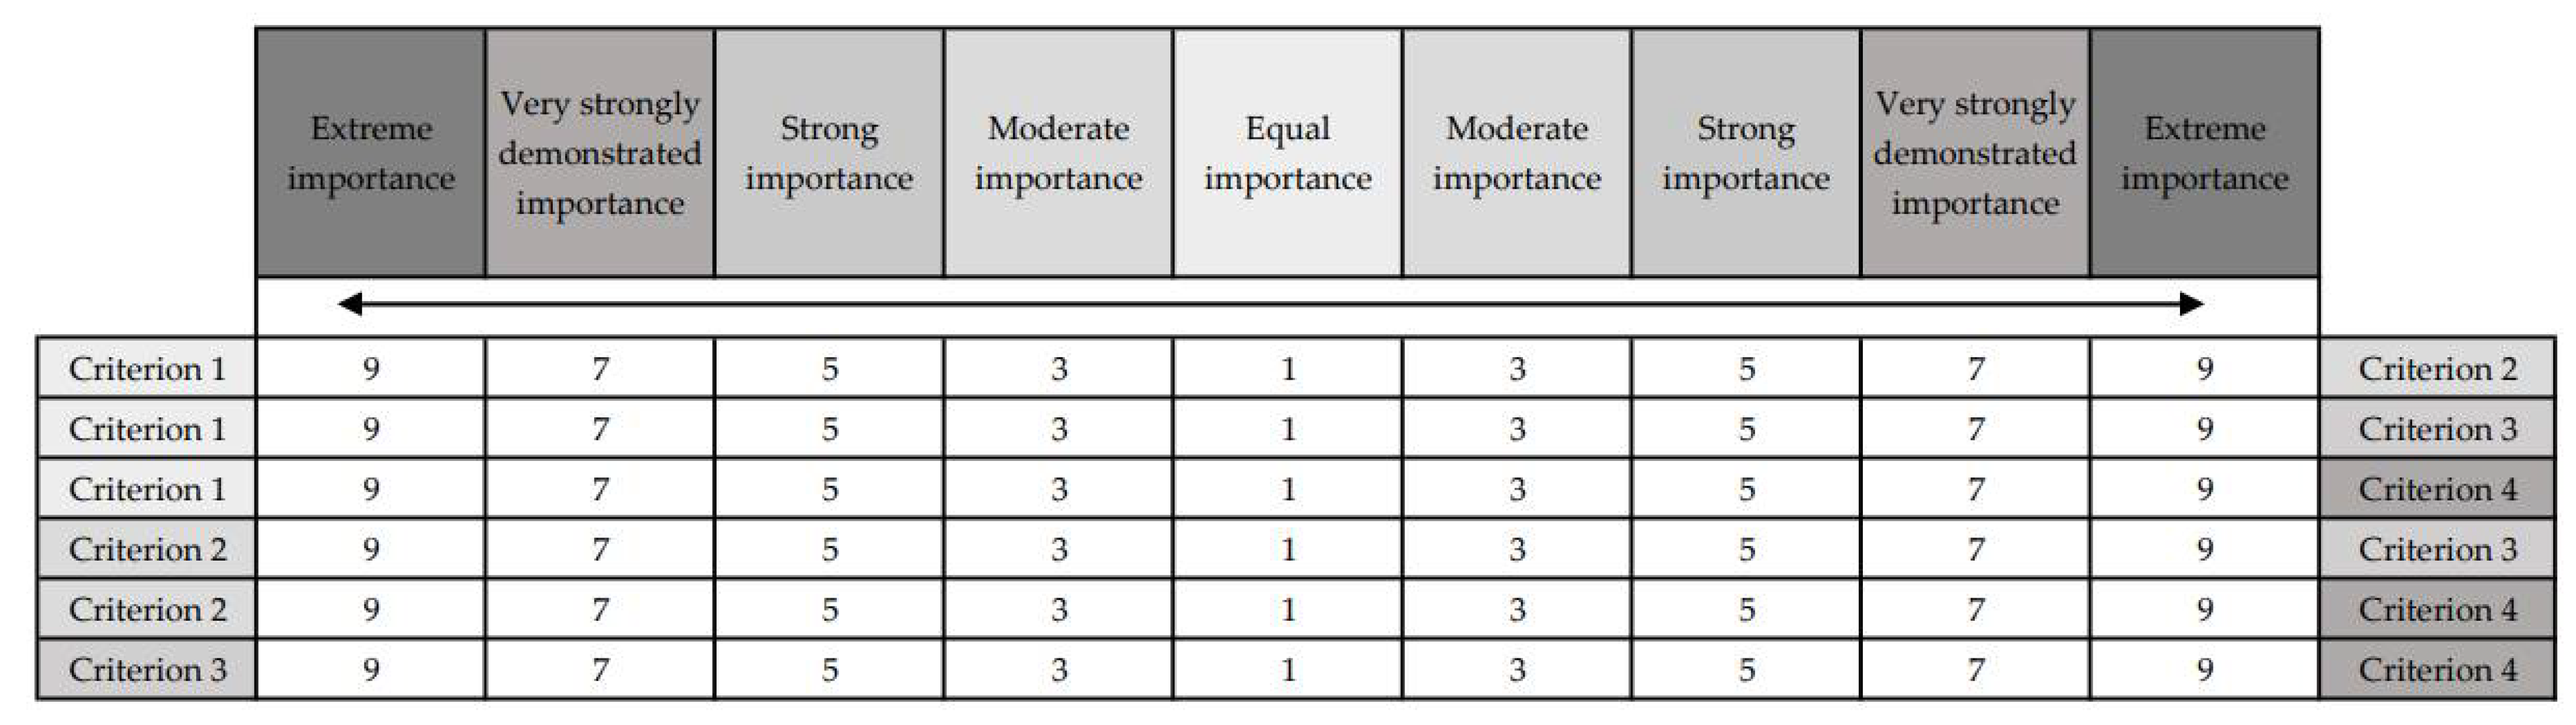
The survey should be allowed to compare all criteria in pairs. As the fuzzy Saaty scale is not popular and could be tough for customers to understand, it is preferred to use the traditional, ten-stage Saaty scale in the survey. However, to reduce the uncertainty and imprecision of assessments in the next stages of the model, these assessments are translated to a fuzzy Saaty scale (triangular fuzzy numbers). An example of a survey for four criteria is shown in Figure 4.
The survey should be developed in five main phases:
- Phase 1: Assessment of the importance relationship of any kind of criterion. The first stage of the survey comprises the assessment of the relationship between a product’s quality and impact on the natural environment. This requires the determination of which criterion is more important for the customer, i.e., product quality or environmental impact. Results from this phase of the survey are processed in the sixth stage of the model.
- Phase 2: Assessment of the relationship between qualitative criteria. The second phase of the survey comprises the assessment of the relationship between qualitative criteria (determined in the third stage of the model). This requires the determination of which criterion is more important to the customer in terms of expected product quality. The importance of qualitative criteria is significance (weight) for customers of the given criterion. Results from this phase of the survey re processed in the sixth stage of the model.
- Phase 3: Assessment of the importance relationship of environmental criteria. The third phase of the survey comprises the assessment of the importance of relationship between environmental criteria (determined in the third stage of the model). This requires the determination of which environmental criterion is more important to the customer. The importance of the environmental criterion is significant (weight) for customers due to its potentially negative environmental impacts. Results from this phase of the survey are processed in the sixth stage of the model.
- Phase 4: Assessment of satisfaction with qualitative criterion states. The fourth phase of the survey comprises the assessment of the satisfaction of the qualitative criterion states (determined in the fourth stage of the model). With the help of these assessments, it is possible to determine the direction of product change so that it meets customer expectations in terms of quality. Results from this phase of the survey are processed in the seventh stage of the model.
- Phase 5: Assessment of the satisfaction of the environmental criterion states. The fifth phase of the survey comprises the assessment of the satisfaction of environmental criterion states (determined in the fourth stage of the model). With the help of these assessments, it is possible to determine the direction of product change so that it meets customer expectations in terms of the environment. This requires assessments of environmental criteria states in terms of their negative impact on the natural environment. Results from this phase of the survey are processed in the seventh stage of the model.
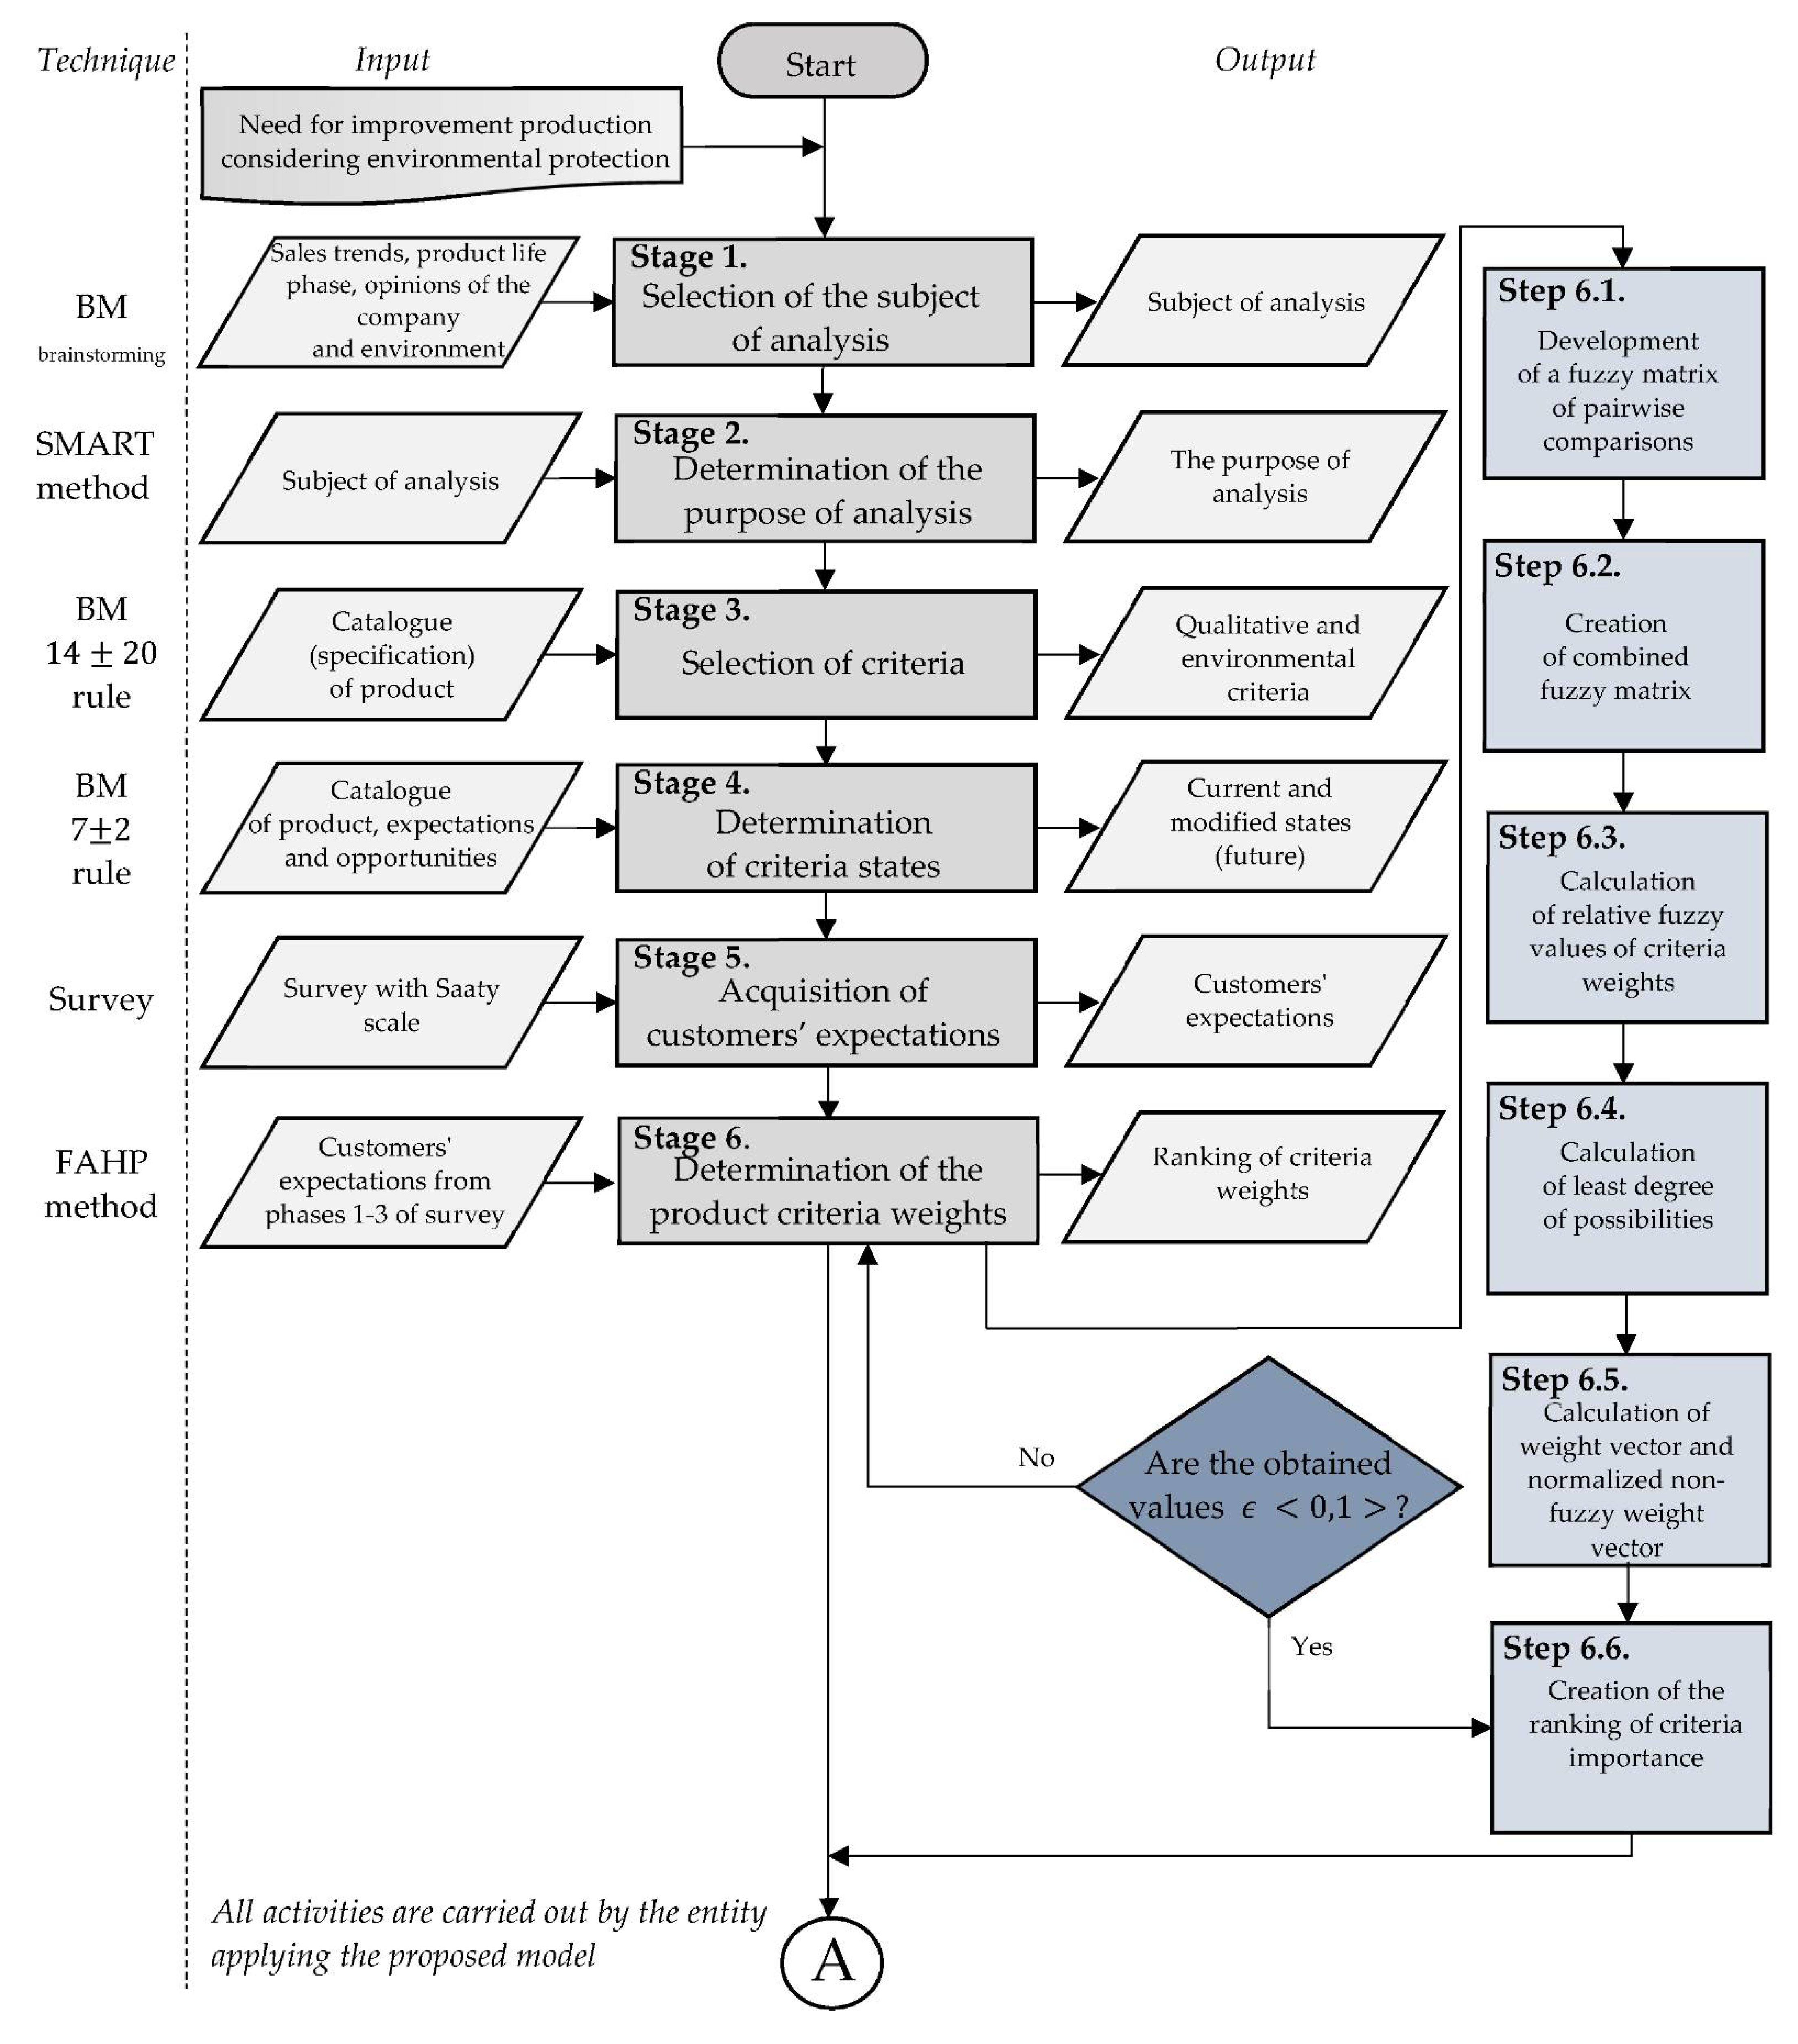
Stage 6. Determining the Product Criteria Weights
This stage relies on determining the weights (importance) of product criteria and their rankings. The FAHP method is used to calculate these weights. The weights of qualitative and environmental criteria are separately determined. The product criteria weights are determined based on assessments of criteria weights obtained from customers (phases I, II, and III of the survey). If expectations were met with the traditional Saaty scale, it is necessary to convert these results for the fuzzy Saaty scale according to Table 1. It is recommended to use Excel with the Vertical Search function for this. Then, it is possible to realize the six main steps of the model.
Step 6.1. Development of a Fuzzy Matrix of Pairwise Comparisons
It is necessary to develop a fuzzy matrix of pairwise comparisons to clarify ambiguities arising from the product criterion weight relationship assessments. To do so, triangular fuzzy numbers in a pairwise comparison matrix, i.e., A = [aij] (1), must be considered [8,23,26]:
There are always values equal to 1 on the diagonal and their reciprocal values under the diagonal [55]. After developing a fuzzy matrix of pairwise comparisons, it is necessary to create a combined fuzzy matrix.
Step 6.2. Creation of Combined Fuzzy Matrix
The criteria importance relationship values are compiled in a combined fuzzy matrix, which is a single decision fuzzy matrix. According to [8,26], this matrix can be created via Formula (2):
is the minimum value on the left end,
is the geometric mean of the median of all triangular fuzzy numbers. Additionally,
is the minimum value on the right end, where is the value obtained after multiple comparisons of the opinions of experts in relation to the ith assessing element and the jth assessing element, and is the Tth expert.
Then, it is necessary to calculate the relative fuzzy values of criteria weights.
Step 6.3. Calculation of Relative Fuzzy Values of Criteria Weights
The relative fuzzy values of criteria weights are calculated by normalizing the average values in a row. Following [8,23,26,55], the fuzzy weight values from the combined fuzzy matrix can be calculated with Formula (3):
where i, j = 1 ~ n,a_ij is the triangular fuzzy number located at row i, j is a column in the pariwise comparison matrix, and Wi is the fuzzy weight of row i.
Next,
In this step, the sum of values for each row in the fuzzy combined matrix is calculated. The values of the sum are normalized as part of the calculation of fuzzy numbers. Then, the least degree of possibility is calculated in the next stage.
Step 6.4. Calculation of Least Degree of Possibility
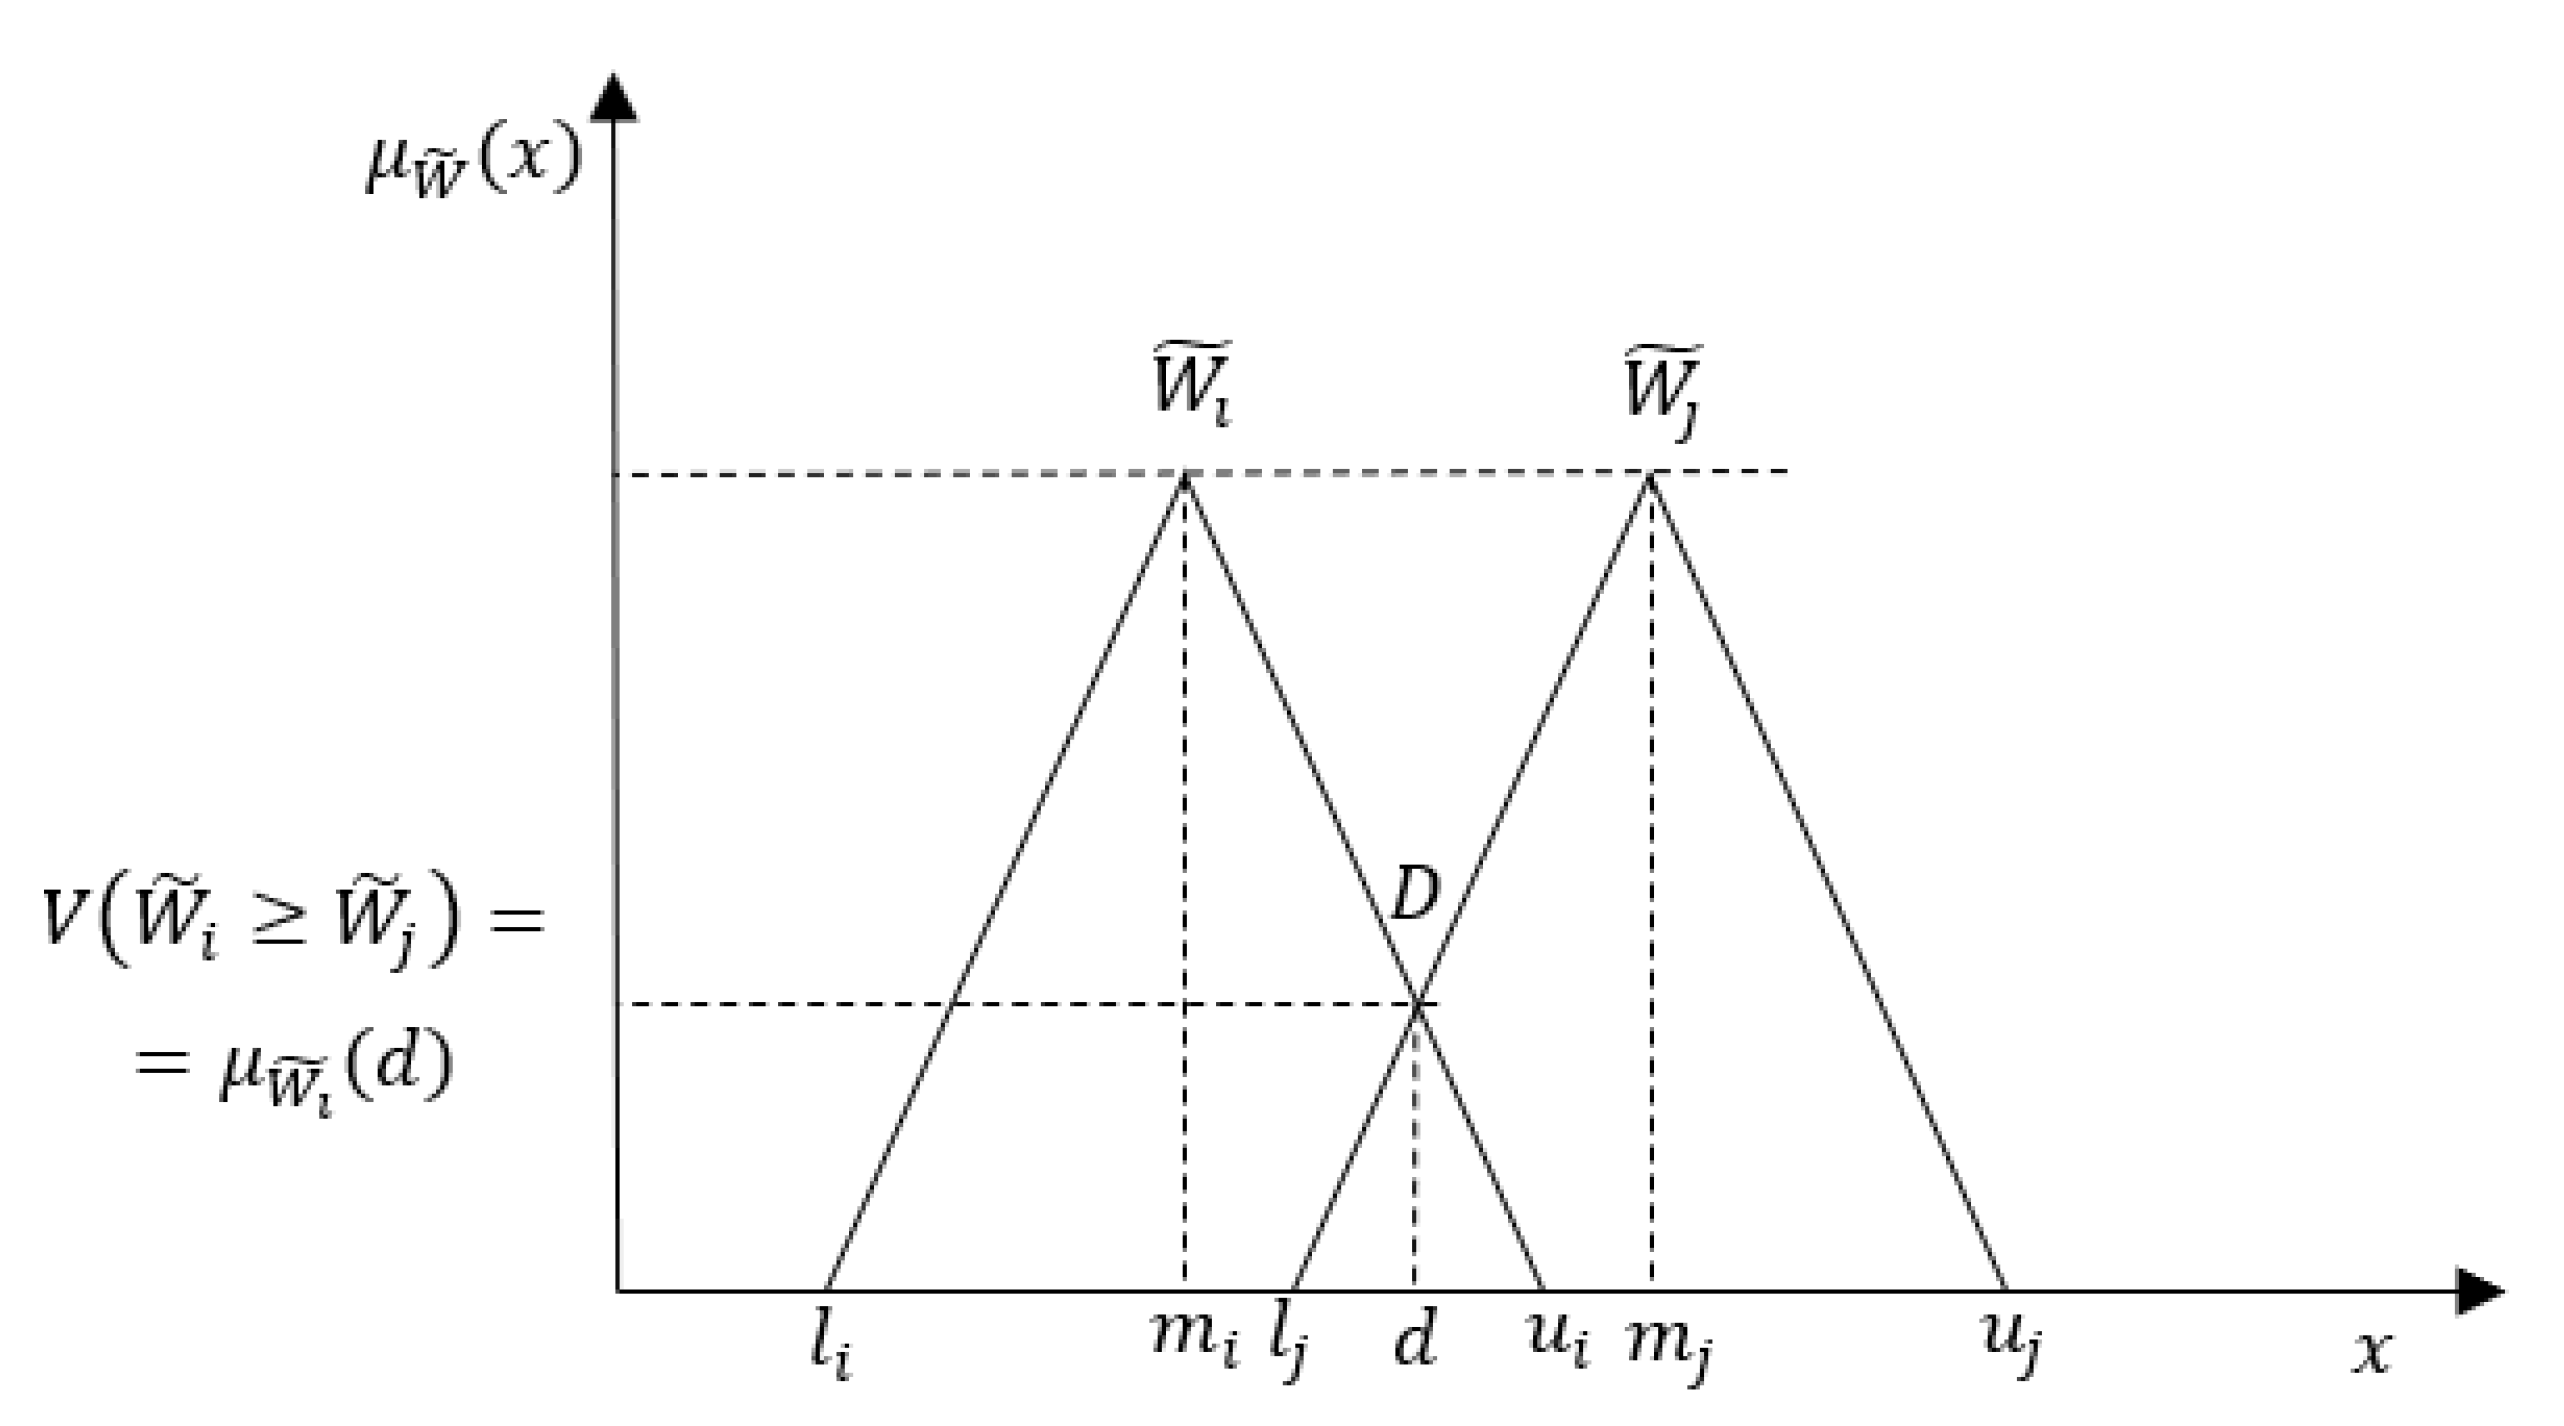
In order to calculate the least degree of possibility, it is necessary to assume that fuzzy number is greater than or equal to fuzzy number using Formula (4) [8,23,26,56]:
where and are two fuzzy numbers. In turn, is the degree of belonging d to as shown in Figure 5.
Then, in order to determine the least degree of possibility, i.e., , of fuzzy number in reference to the other fuzzy numbers, one can use Formula (5) [4,8,23,26,56]:
Step 6.5. Calculation of the Weight Vector and Normalized Non-Fuzzy Weight Vector
The weight vector is determined by all least degrees of possibility (n), which were determined in step 6.4. Following [4,8], the weight vector can be calculated with Formula (6):
After that, it is possible to create a ranking of criteria importance.
Step 6.6. Creating the Ranking of Criteria Importance
The ranking of criteria importance (weights) is created based on the normalized non-fuzzy weight vector values. The maximum value is the maximum weight, and it is the most important criterion. The minimum value is the minimum weight, and it is the least important criterion.
After this step, three separate rankings of criteria importance are obtained. The first ranking determines which criterion, i.e., product’s quality impact on the natural environment, is more important for the customer. The second ranking is a ranking of weights (importance) of qualitative criteria. The third ranking is a ranking of weights (importance) of environmental criteria.
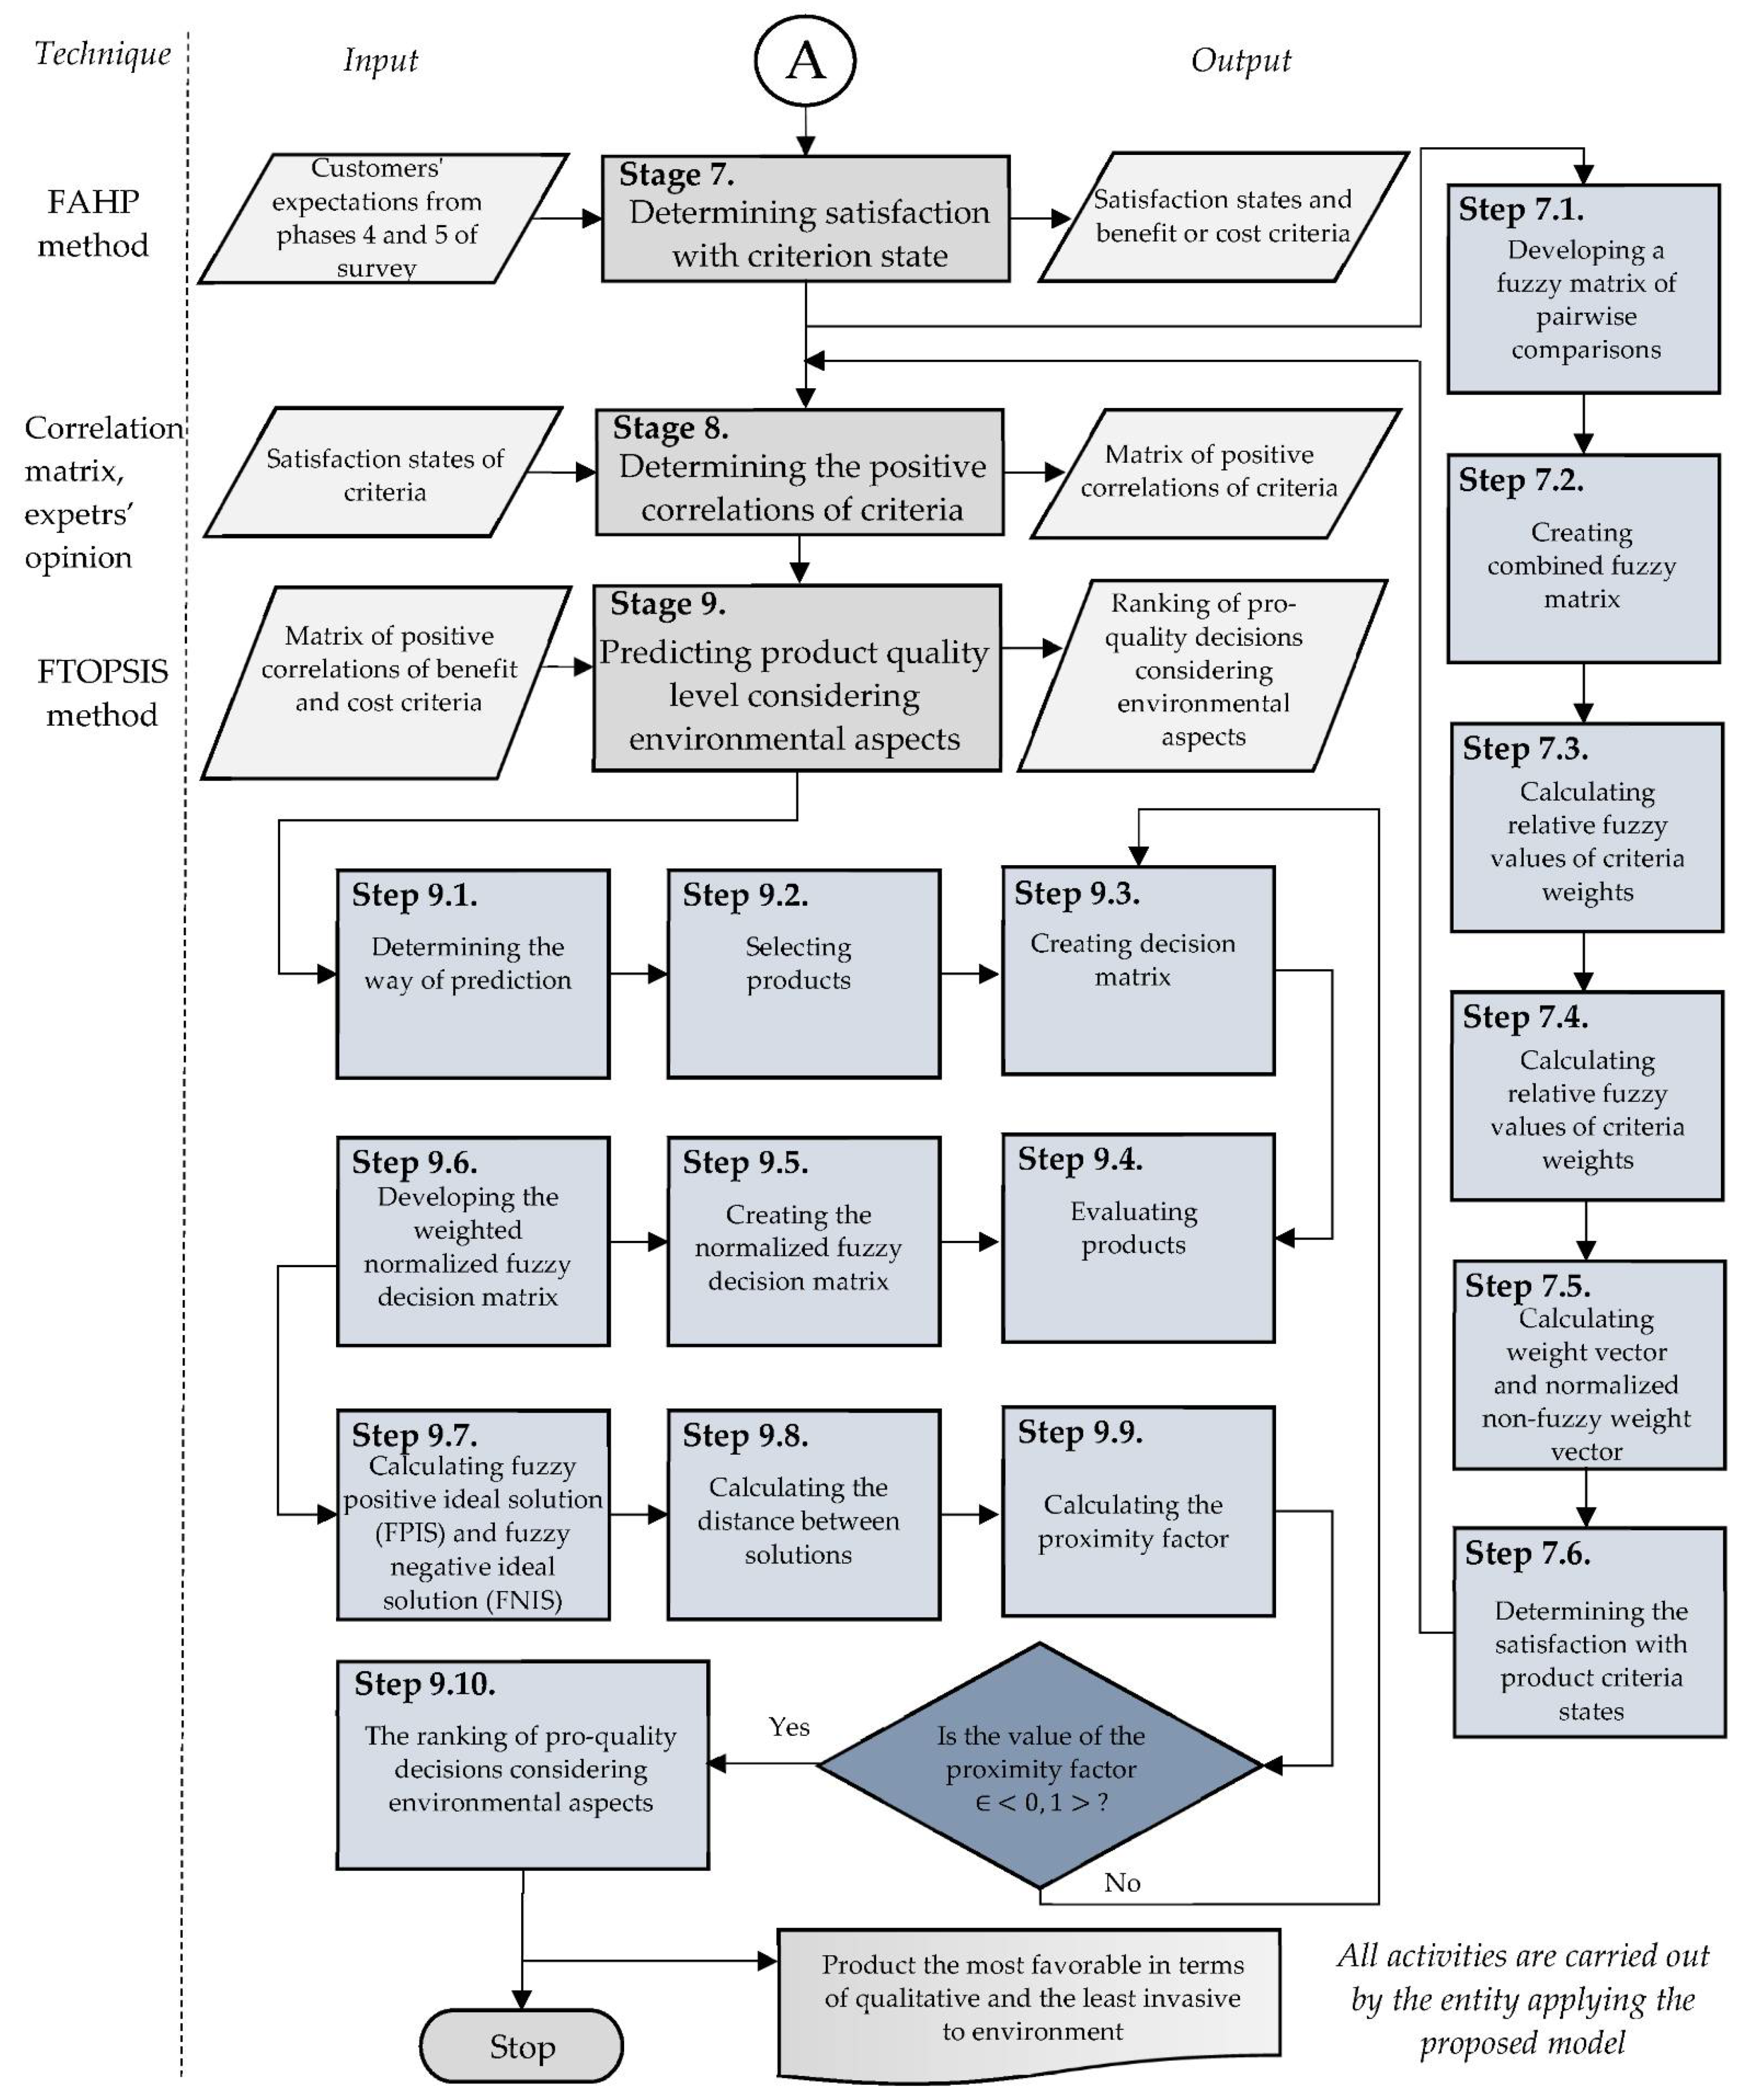
Stage 7. Determining Satisfaction with Criterion State
The aim of this stage is to determine satisfaction with criteria states. It is necessary to separately determine satisfaction with qualitative and environmental criteria. The purpose of this stage is to identify so-called benefit and cost criteria. It is necessary for the next stages of the proposed model, e.g., while using the FTOPSIS method. For benefit criteria, more is better. For cost criteria, less is better [4,9,25,27]. Satisfaction with criterion state is determined by applying the FAHP method to the survey results (fifth stage of the model).
Step 7.1. Development of a Fuzzy Matrix of Pairwise Comparisons
The development of a fuzzy matrix of pairwise comparisons clarifies ambiguities arising from product criteria state assessments. This clarification can be accomplished by noting triangular fuzzy numbers in a fuzzy matrix of pairwise comparison, as shown in Formula (1) from step 6.1.
Step 7.2. Creation of Combined Fuzzy Matrix
The combined fuzzy matrix is created by applying Formula (2) to the assessments of satisfaction with product criteria states from step 6.2.
Step 7.3. Calculation of Relative Fuzzy Values of Criteria Weights
The relative fuzzy values of criteria weights are calculated via the normalization of the average value in a row. For this purpose, Formula (3) is used (from step 6.3).
Step 7.4. Calculation of Least Degree of Possibility
In order to calculate the least degree of possibility, it is necessary to use Formula (4) and assume that fuzzy number is greater than or equal to fuzzy number , as shown in step 6.4. Then, Formula (5) (from step 6.4) can be used to determine the least degree of possibility of of fuzzy number against other fuzzy numbers .
Step 7.5. Calculation of Weight Vector and Normalized Non-Fuzzy Weight Vector
The weight vector and normalized non-fuzzy weight vector of product criteria states can be determined with Formulas (6)–(8), as shown in step 6.5.
Step 7.6. Determining the Satisfaction with Product Criteria States
In this step, the criteria and their states should be compiled into a single table. Each state should be described by a normalized, non-fuzzy weight vector value. In this step, the benefit and cost criteria, i.e., sufficient criteria for the FTOPSIS methodology, are determined. The maximum and minimum values of the state of a given criterion are the most and least favorable states, respectively. All criteria should only be described by satisfactory states, i.e., states that are most favorable for customers. Subsequently, when verifying the condition of a criterion, which criteria are benefit and cost should be determined. The benefit criterion is the criterion that is the most satisfactory (according to the principle, the more the better) and has the largest state. The cost criterion is the criterion that is the most satisfactory (according to the principle, the less the better) and has the smallest state. Determining satisfaction with product criteria states is used in the next stages of the proposed model.
Stage 8. Determining the Positive Correlations of Qualitative and Environmental Criteria
Next is determining the positive correlations between qualitative and environmental criteria. This requires the determination of whether the satisfactory state of a qualitative criterion will have a positive correlation with the satisfactory state of an environmental criterion. This ensures the definition of criteria that should be followed by the customer in the pro-quality selection of products while considering qualitative–environmental aspects. The positive correlations of qualitative and environmental criteria allow for the achievement of satisfactory product quality levels while being environmentally friendly.
In one pairwise comparison matrix, both quality and environmental criteria should be considered. These criteria should only be described by the most favorable states (i.e., states determined by the maximum values from step 7.6). The most satisfactory states refer to an increase in the level of product quality while reducing the negative impacts on the environment. The correlation of qualitative and environmental criteria is determined by an expert on a scale from −2 to 2, where −2 is a strong negative correlation, −1 is a negative correlation, 0 is an imperceptible correlation, 1 is a positive correlation, and 2 is a strong positive correlation. A negative or strong negative correlation is granted for pair of criteria in which it is not possible to simultaneously achieve the expected quality level without a destructive impact on the natural environment (and vice versa). A positive or strong positive correlation is granted for a pair of criteria in which it is possible to simultaneously achieve the expected quality level without a destructive impact on the natural environment (and vice versa). After determining criteria correlation, it is necessary to predict the product quality level while considering environmental aspects, as shown in the next stage of the proposed model.
Stage 9. Predicting product quality level considering environmental aspects
This stage comprises the prediction of quality level values resulting from strong or positive correlations of qualitative–environmental criteria (determined in the eighth stage of the model). This requires the prediction of the ranking (order) of product quality levels while simultaneously considering the environment. The prediction of quality level while considering environmental aspects is supported by the FTOPSIS method. This stage is comprises ten main steps.
Step 9.1. Determining the Way of Prediction
It is necessary to assume that this process predicts product quality level values resulting from positive correlations of qualitative and environmental criteria. This requires the prediction of ranking products, the values of which indicate pro-quality product selection while considering the environment.
Step 9.2. Selection of Products
Products should be selected in reference to the subject of analysis (determined in the second stage of the model). The number of products, which could be those that the model user is currently using or considering to use, is unlimited.
Step 9.3. Creation of Decision Matrix
The creation of decision matrix Mij. is intended to collect and process data, and it is written according to the following assumptions:
- All strong positive qualitative and environmental criteria correlations (determined in the eighth stage of the model) are included; if there is a lack of strong positive correlations, it is only necessary to include positive correlations.
- The benefit and cost types of criteria (determined in the seventh stage of the model) are included.
- The weights of criteria (calculated in the third stage of the model) are included.
- The names of all products selected in step 9.2 are included.
After creating and filling out the decision matrix, it is necessary to evaluate the products.
Step 9.4. Evaluation of Products
The evaluation of products is done with the decision matrix Mij prepared in step 9.3. All products are assessed against all strongly positively correlated or positively correlated qualitative and environmental criteria (defined in the eighth stage of the model). The products are assessed with the fuzzy Saaty scale (as shown in Table 1) by an entity using the proposed model or by a team collected of T members. The fuzzy assessment of Tth expert for product Ai and criterion Cj is calculated with Formula (9) [48]:
The assessments of products should be compiled in a combined, single decision matrix ). According to the authors of [8,26], this matrix can be created with Formula (10):
whereis the minimum value on the left end,
is the geometric mean of the median of all triangular fuzzy numbers, and
k is the minimum value on the right end,
where is the value obtained after multiple comparisons of the opinions of experts in relation to the ith assessing element and the jth assessing element; T is the Tth expert.
Then, the normalized fuzzy decision matrix is created.
Step 9.5. Creating the Normalized Fuzzy Decision Matrix
The normalized fuzzy decision matrix is created based on the combined decision matrix developed in step 9.4. In this step, it is necessary to develop a matrix that considers both the benefit and cost types of criteria (determined in step 7.3). For this purpose, Formulas (11) and (12) can be used [29,30,31,48]:
where a, b, and c are fuzzy numbers; i is a criterion denoted as 1, 2, 3, … n; and j is a product denoted as j—1, 2, 3, …, n.
Step 9.6. Developing the Weighted Normalized Fuzzy Decision Matrix
The weighted normalized fuzzy decision matrix = is created based on the normalized fuzzy decision matrix developed in step 9.5. At this stage, it is necessary to include the weights of the criteria (calculated in the third stage of the model). According to [27,28,30,31], one can use Formula (13):
where represents the values of normalized fuzzy decision matrix, represents the fuzzy value of criterion weight, i represents a criterion, j represents a product, and i and j can be denoted as 1, 2, 3, …, n.
Step 9.7. Calculating Fuzzy Positive Ideal Solution (FPIS) and Fuzzy Negative Ideal Solution (FNIS)
At this stage, the fuzzy positive ideal solution (FPIS, A*) and fuzzy negative ideal solution (FNIS, A−) are calculated. For this purpose, Formulas (14) and (15) are used [48]:
where are the values of the weighted normalized fuzzy decision matrix, is the third value of the fuzzy number, and is the first value of fuzzy number.
Hence, it is necessary to calculate the distance between solutions.
Step 9.8. Calculating the Distance between Solutions
Following [29,30,31], it was assumed that the distance between solutions could be calculated with Formulas (16)–(18):
where a, b, and c are fuzzy numbers, and are values of the weighted normalized fuzzy decision matrix.
Next, it is possible to calculate the proximity factor.
Step 9.9. Calculating the Proximity Factor
The proximity factor CCi is calculated based on the distance between solutions (calculated in step 9.8.) with Formula (13) [27,28,29,30,31,48]:
where are the values of the distance between solutions and i comprises 1, 2, 3,…, n.
Next, it is necessary to create a ranking.
Step 9.10. The Ranking of Pro-Quality Decisions Considering Environmental Aspects
In this step, it is necessary to create the ranking of pro-quality decisions while considering environmental aspects. The ranking is created based on proximity factor CCi values calculated in step 9.9. The values should be ordered from maximum to minimum. The maximum value of the proximity factor is the first position in the ranking, i.e., the most favorable product. The last position in the ranking is the least favorable product. Based on ranking, it is possible to make a pro-quality choice regarding a product while considering environmental aspects, that is, a product that will be satisfactorily beneficial in terms of quality and environmental friendliness. Based on results, it is possible to predict which product allows for the achievement of customer expectations regarding quality level and environmental friendliness.
3. Test of the Model
The proposed model was verified as part of an initial, non-destructive test (NDT) of fluorescent penetrants, which were chosen because they are appropriate for our subject of analysis: a service-production enterprise localized in Poland. This enterprises uses a large amount of penetrants, which negatively impact the environment. Hence, this enterprise was looking for an instrument that would help to select a penetrant that was environmentally friendly and had a satisfactory quality level.
For the test of the model, we made the following assumptions:
- There were unlimited potential types of products, e.g., products used or considered for use.
- The number of products to verify was unlimited.
- Weights of criteria were determined by the FAHP method based on the customers’ expectations obtained from survey phases I, II, and III.
- Satisfaction with criteria states was determined by the FAHP method based on the customers’ expectations obtained from survey phases IV and V.
- The positive correlations of qualitative and environmental criteria were determined with a pairwise comparison matrix on a scale from −2 to 2 (where −/+2 represents a strong unfavorable/favorable correlation, −/+1 represents an unfavorable/favorable correlation, and 0 represents no correlation).
- The prediction of quality level considering environmental aspects was supported by the FTOPSIS method, and the following analysis included both strong positive and negative correlations (grade 2); when there was a lack of correlations, it was necessary to only include positive correlations (grade 1).
The initial test of the model with these assumptions is presented next.
4. Results
In the first stage of the model, the subject of analysis was selected. The initial NDT model test considered fluorescent penetrants. These products were chosen because of their widespread use [10,57,58] and negative impact on the natural environment [55,59,60,61].
In the second stage of the model, the purpose was determined to be predicting the pro-quality choice of products while considering potential impacts on the environment.
In the third stage of the model, the criteria of fluorescent penetrants were selected. Seven qualitative criteria were selected:
- Sensitivity level, i.e., that which allows one to identify different defect sizes and thus make it possible to reduce possibilities for incorrect acceptance or non-compatibility.
- Penetration time, i.e., the total time of product immersion in penetrant.
- Time of washing the product after penetration, i.e., the total time needed to precisely clean the penetrant from the product; and after this time, the product can be used.
- Time of drying the product after penetration, i.e., the total time needed to precisely dry the product; after this time, the product can be used.
- Time of waiting for the research results, i.e., the total time needed to collect results from penetration testing; after this time, it is possible to accept or reject the product.
- Penetrant viscosity, which concerns the ability of the fluid to transfer momentum between layers moving at different speeds; this is one of the most important penetrant attributes.
- Penetrant density, i.e., the ratio of the mass of a given amount of penetrant to the volume of the product occupied by the penetrant.
Eight environmental criteria were used:
- Health, i.e., the degree which the penetrant affects human health, as health is the main criterion included in NFPA and HMIS systems (0–4 scale, where 0 represents no threat to human health and 4 represents a high human health risk with a small amount of penetrant).
- Combustibility, i.e., the ability of penetrants to sustain fire (fluorescent penetrants have a flash point not exceeding 93 °C), as combustibility is the main criterion included in NFPA and HMIS systems (0–4 scale, where 0 represents a non-flammable penetrant and 4 represents an immediately flammable penetrant).
- Reactivity, i.e., the ability to react with other chemical compounds under certain conditions; this criterion is significant, especially in highly fluorescent penetrants, and reactivity is the main criterion included in NFPA and HMIS systems (i.e., 0–4 scale, where 0 represents a non-reactive penetrant and 4 represents a penetrant with the capability for immediate reactivation).
- Petroleum (light hydrotreated), i.e., a liquid mineral composed of a mixture of natural gaseous, liquid, and solid hydrocarbons, as well as slight admixtures of nitrogen, oxygen, sulfur, and inorganic pollutants; in this case, it was lightly hydrotreated and thus had density of less than 0.878 g/cm3.
- Refined oil, i.e., oil obtained via extraction with strong chemicals at high temperatures; it enables the largest possible amount long-term storage.
- Petroleum (heavy aromatic), i.e., a liquid mineral that is composed of a mixture of natural gaseous, liquid, and solid hydrocarbons, as well as slight admixtures of nitrogen, oxygen, sulfur, and inorganic pollutants; in this case, it had a density above 0.884 g/cm3 and was aromatic.
- Boiling point, i.e., the temperature at which the pressure of the resulting vapor is equal to the ambient pressure, which results in the vaporization of the entire volume of the penetrant.
- Flash point, i.e., the minimum ignition temperature of the penetrant.
These criteria were selected through BM after the verification of the catalogues (specification) of fluorescent penetrants and a literature review of the subject (which is shown in [55]). The differences between criteria values resulted from their specifications and were determined by experts from the NFPA (National Fire Protection Association) [62] or HMIS (Hazardous Materials Identification System) as part of assessments of the harmfulness of products [63].
In the fourth stage of the model, all fluorescent penetrant criteria (qualitative and environmental) states were determined based on the catalogues of fluorescent penetrants (Table 2).
Next, in accordance with the fifth stage of the model, a survey with the Saaty scale was developed to obtain customer’s expectations. The survey was developed in five main phases (as is shown in the fifth step of the model). The sample was considered to be representative in terms of the testing character of the proposed model, and its precision when used with the FAHP method has been proven for small research samples, e.g., from 5 to 9 customers [49,50,51,52,53].
According to the sixth stage of the model, the customers’ expectations were processed to determine the qualitative and environmental criteria weights. Firstly, all assessments in the traditional Saaty scale were translated to a fuzzy Saaty scale. As shown in step 6.1, all customers’ assessments were juxtaposed in a fuzzy matrix of pairwise comparisons. As presented in step 6.2, fuzzy matrices of comparisons in pairs were sequentially combined into one matrix to assess the weight of the qualitative criteria (results from the second phase of the survey) and another matrix to assess the weight of the environmental criteria (results from the third phase of the survey); see Table 3 and Table 4, respectively.
Next, according to steps 6.3. and 6.4., the relative fuzzy values of criteria weights and the least degrees of possibility were calculated (Table 5).
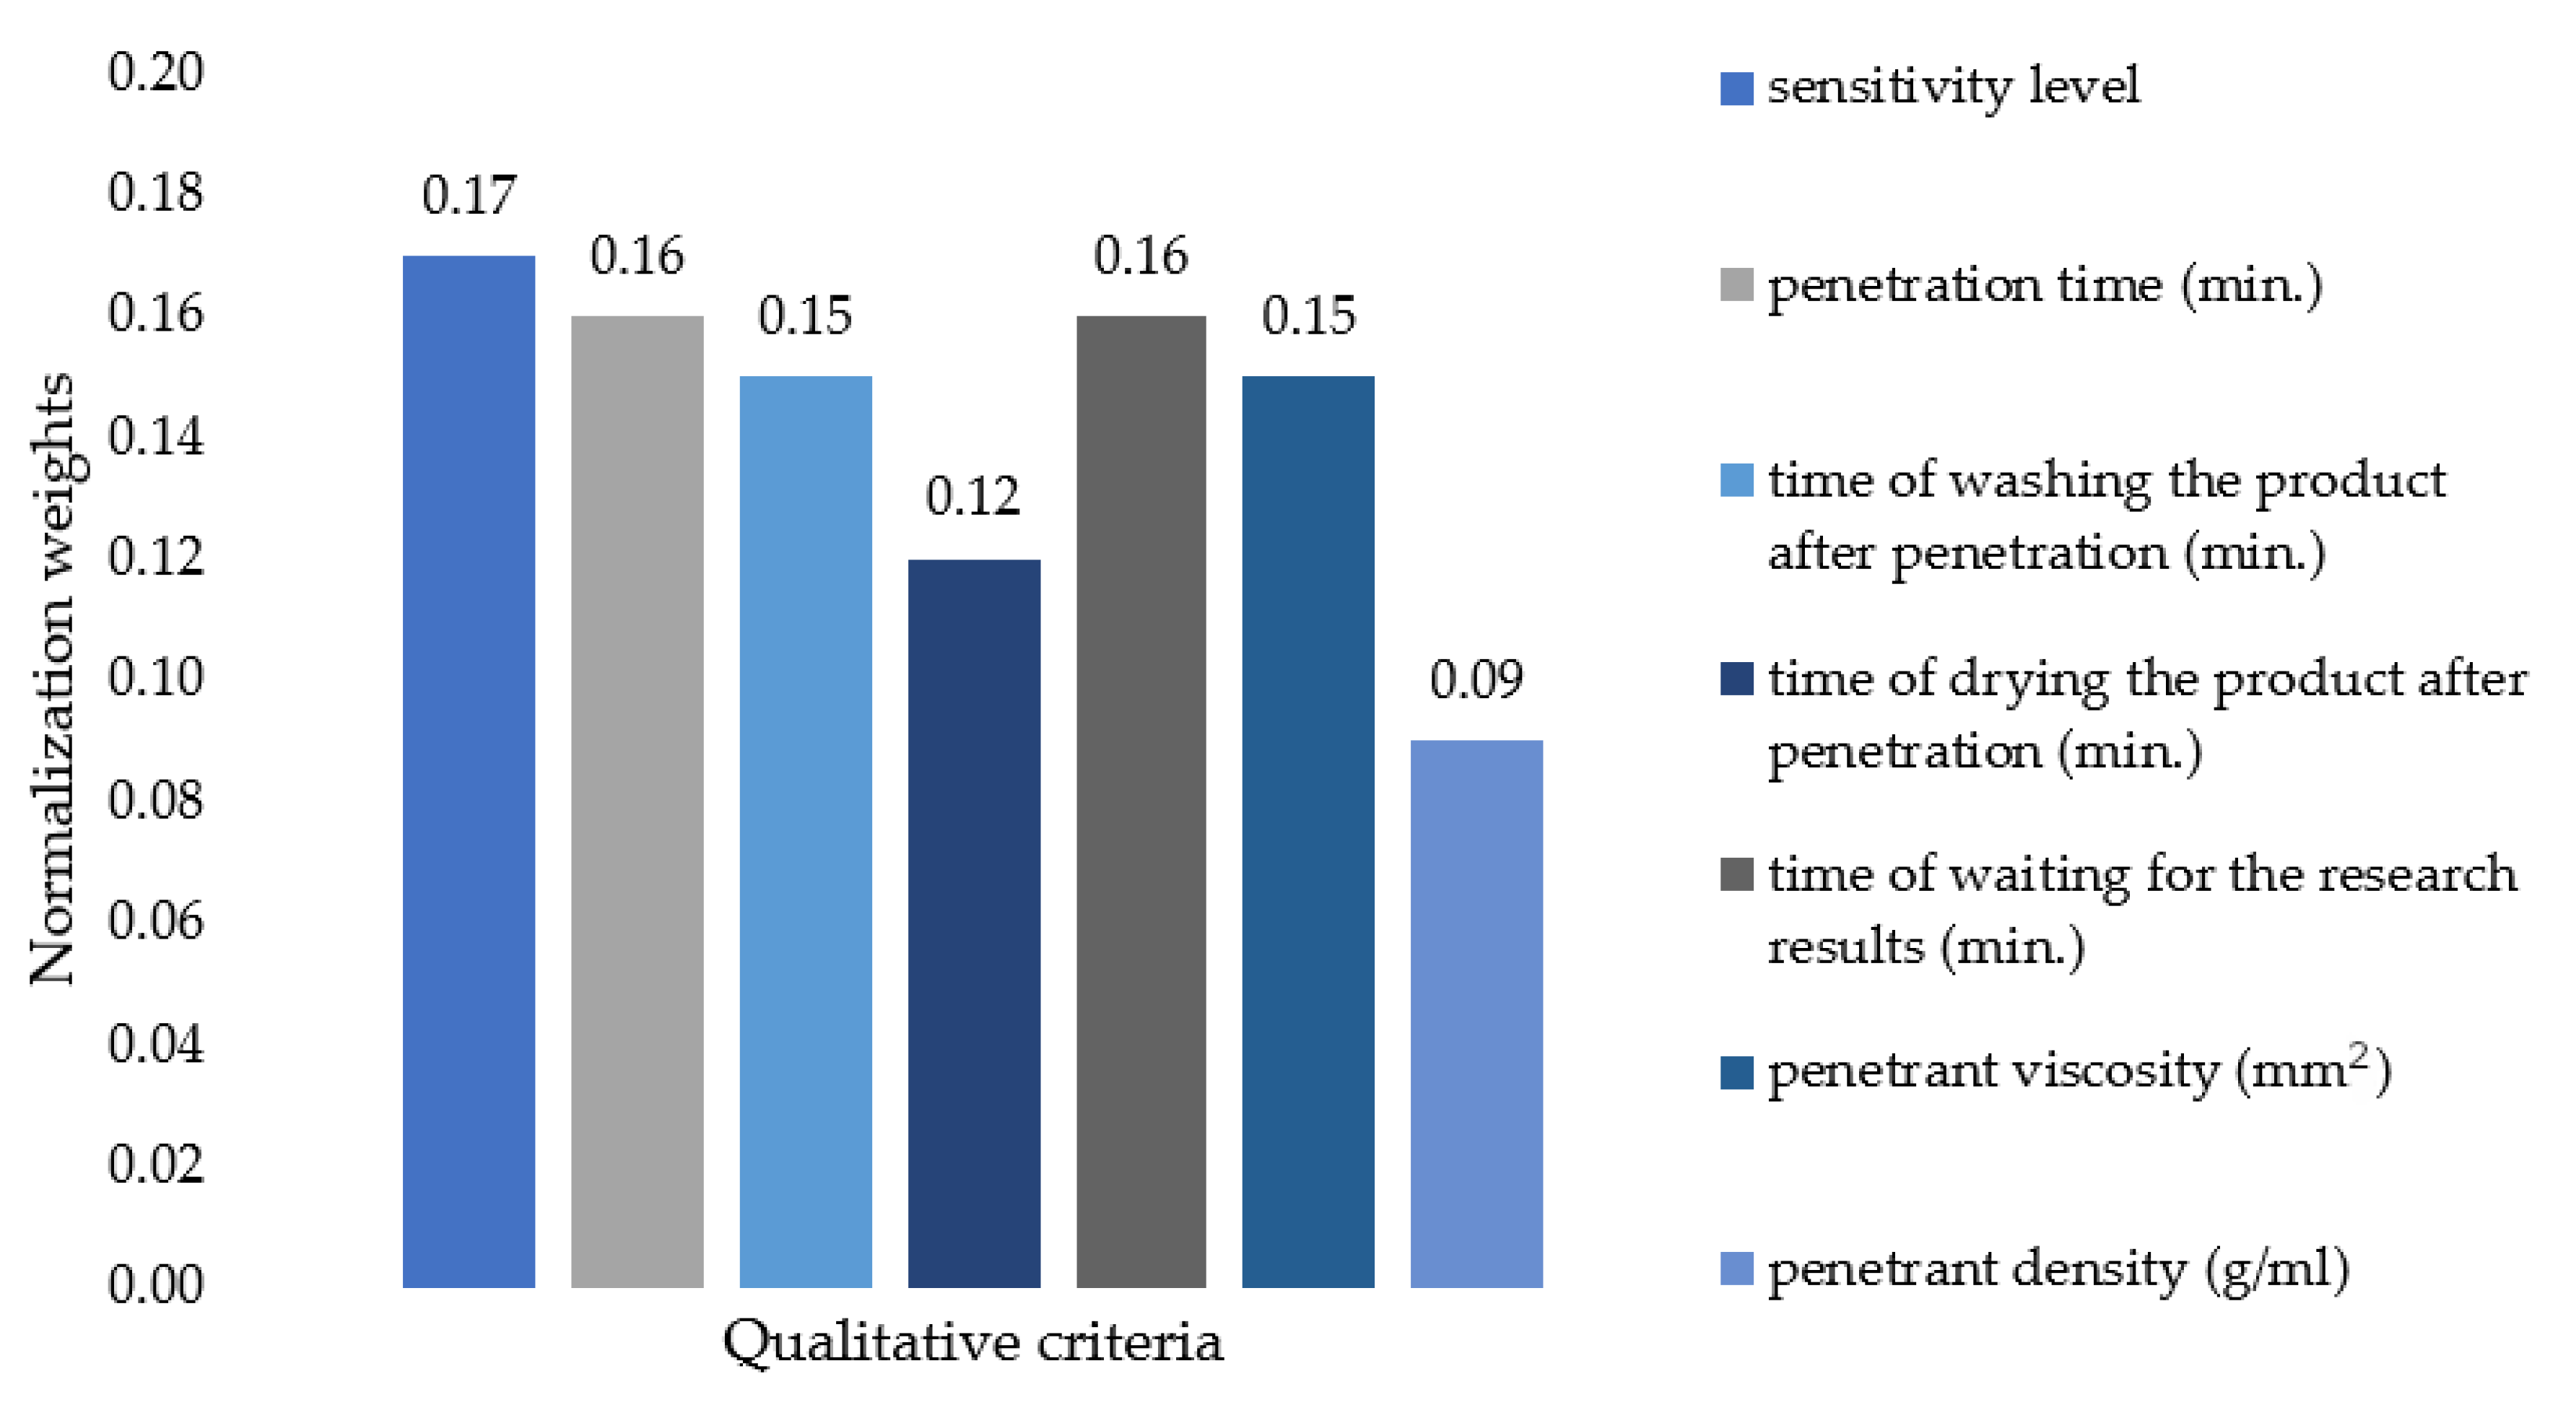
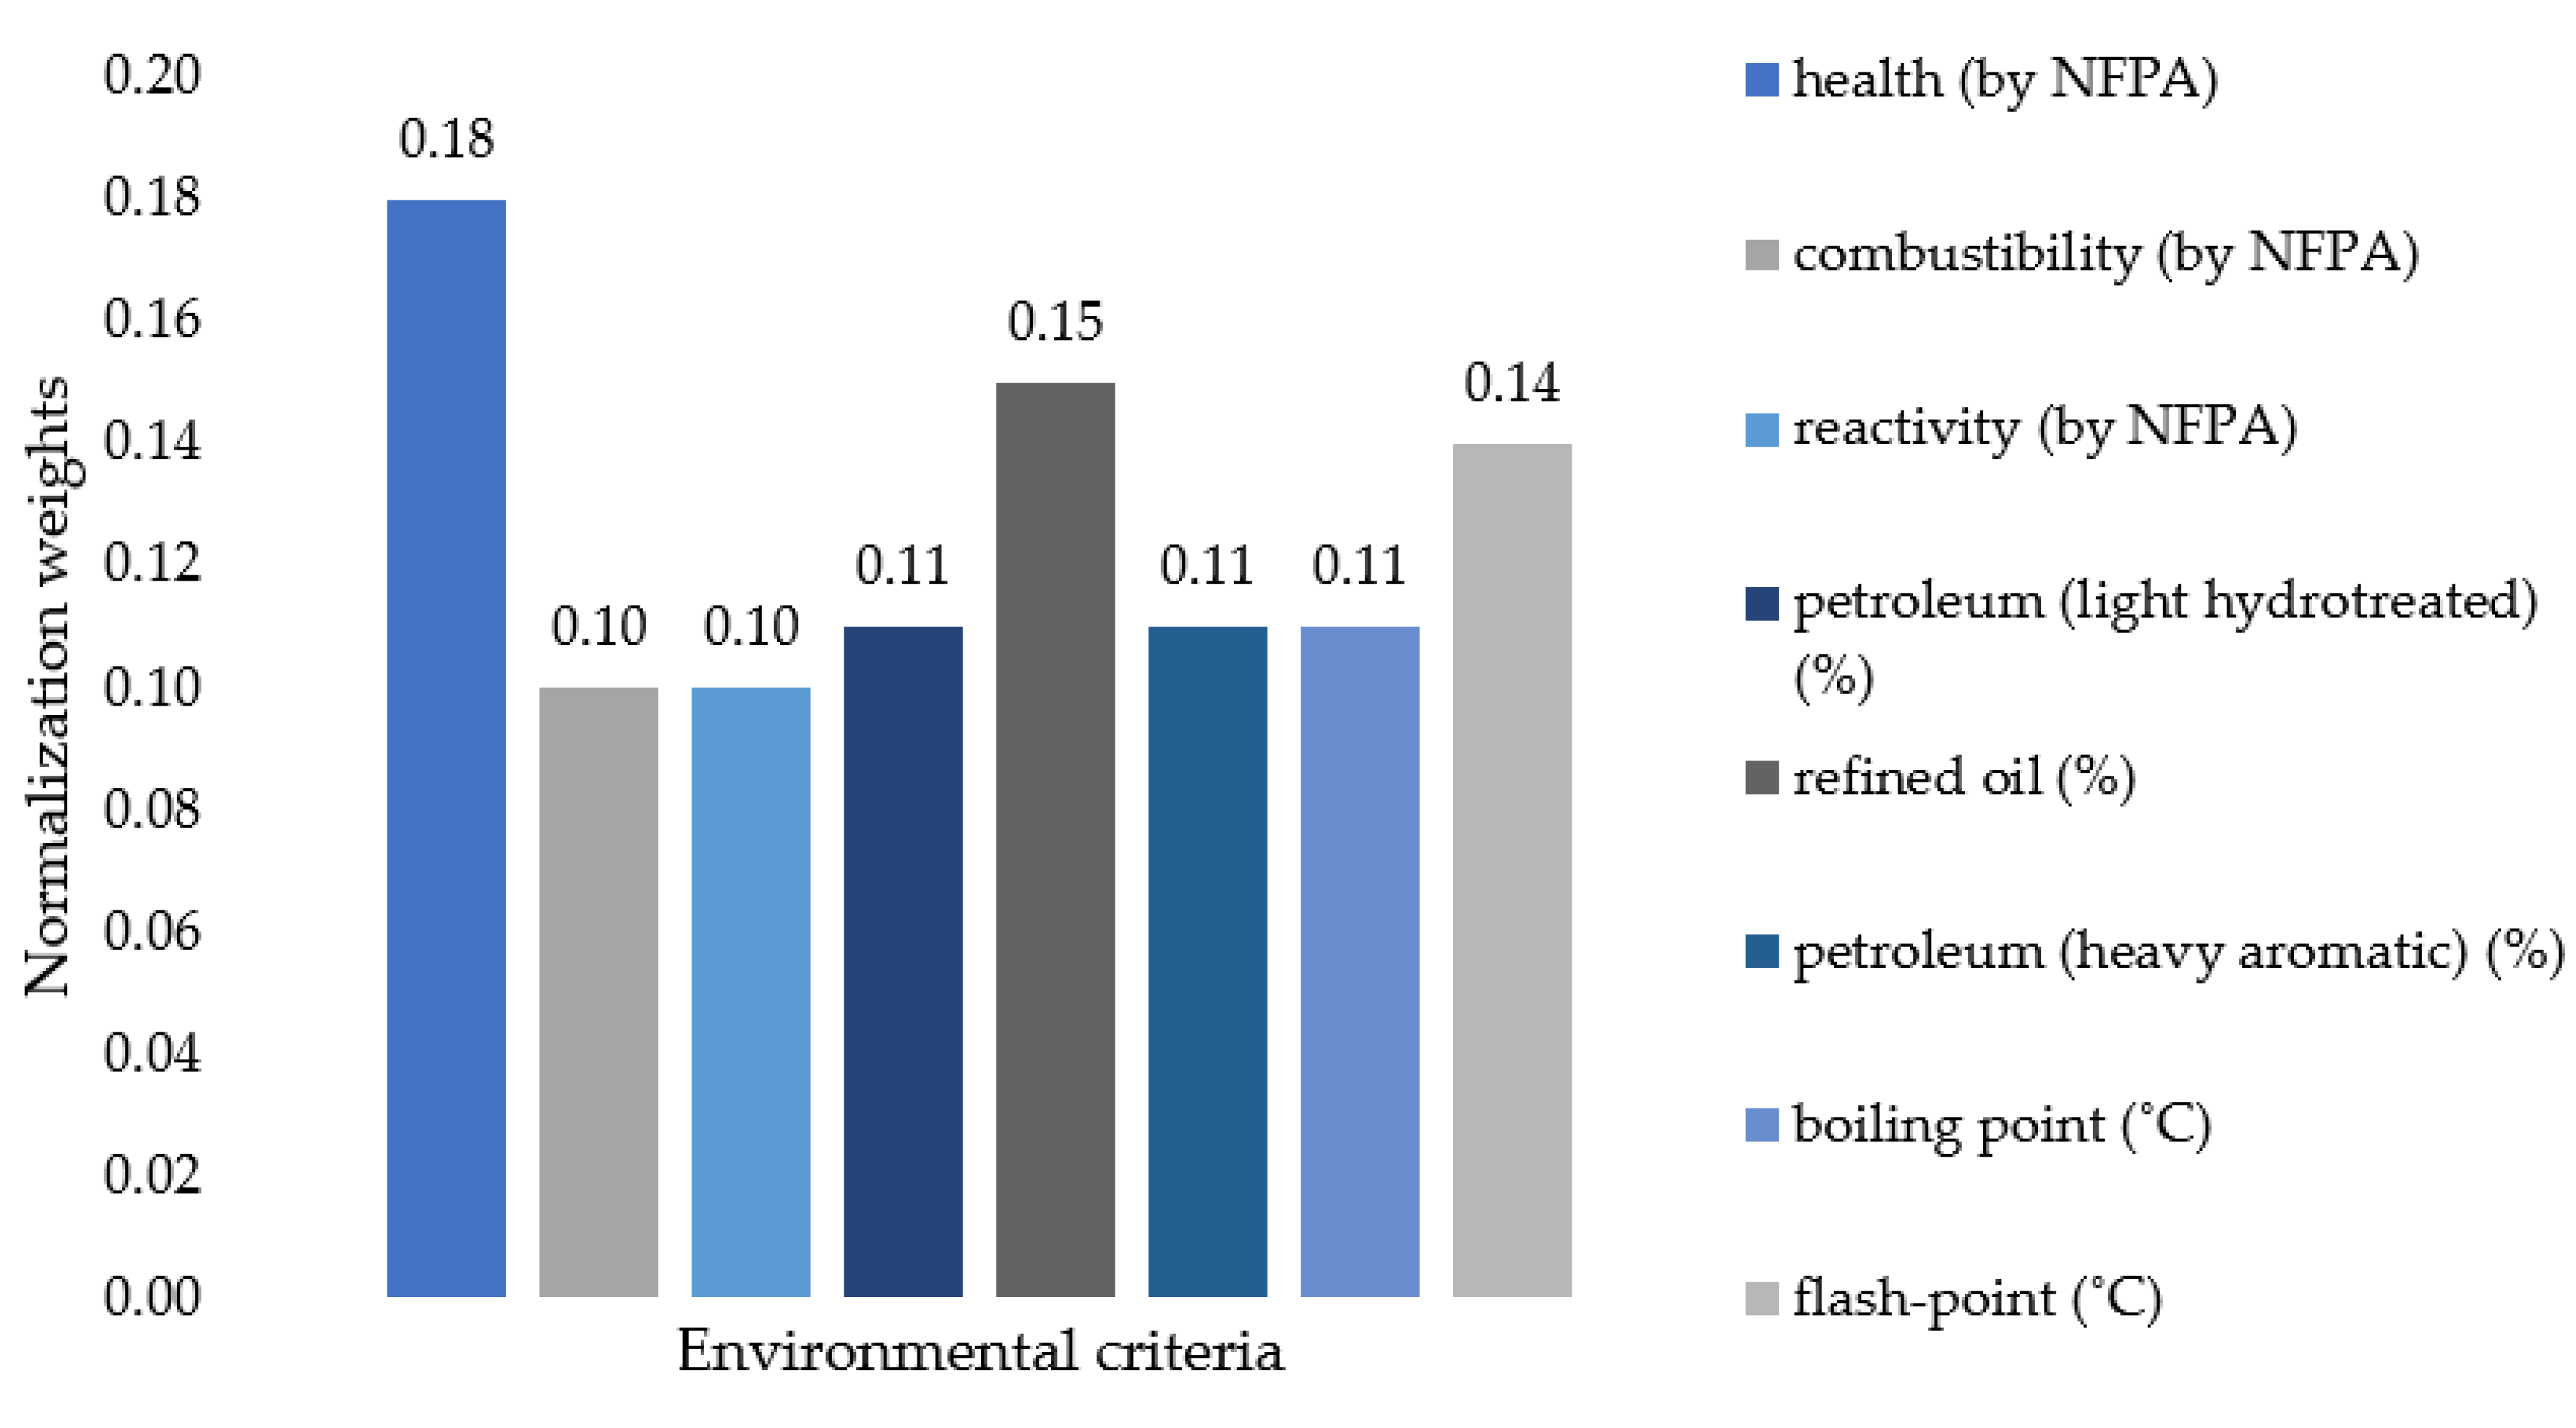
Then, as shown in step 6.5, the weights of the normalized non-fuzzy vectors for qualitative and environmental criteria were calculated. Based on these values, a ranking of the importance (weights) of criteria was created (according to step 6.6). Results are shown in Table 6 and Figure 6 and Figure 7.
It was found that the most important qualitative criterion was the sensitivity level of penetrants (0.17 weight—the first position in the ranking), followed by penetration time and time of waiting for the research results (0.16 weight—the second position in the ranking). The least important criterion was the density of the penetrant (0.09 weight—the last position in the ranking). On the other hand, in the group of environmental criteria, the most important criterion was health (0.18 weight—the first position in the ranking), followed by refined oil (0.11 weight—the second position in the ranking) and then combustibility and reactivity (0.10 weight).
According to the seventh stage of the model, satisfaction with criterion state was determined. The FAHP method was again used. At this stage, the analysis was based on the survey results from survey phases IV and V. Initially, all assessments in the traditional Saaty scale were translated to a fuzzy Saaty scale. As shown in step 7.1, all customers’ assessments were juxtaposed in a fuzzy matrix of pairwise comparisons. As presented in step 7.2, fuzzy matrices of comparisons in pairs were sequentially combined into one matrix of assessments of satisfaction with the qualitative criteria (results from survey phase IV) and another combined matrix of assessments of satisfaction with environmental criteria (results from survey phase V). A fragment of the developed matrices is shown in Table 7.
Then, as shown in steps 7.3. and 7.4., the relative fuzzy values of satisfaction with qualitative and environmental criteria states, as well as the least degree of possibility, were calculated (Table 8 and Table 9).
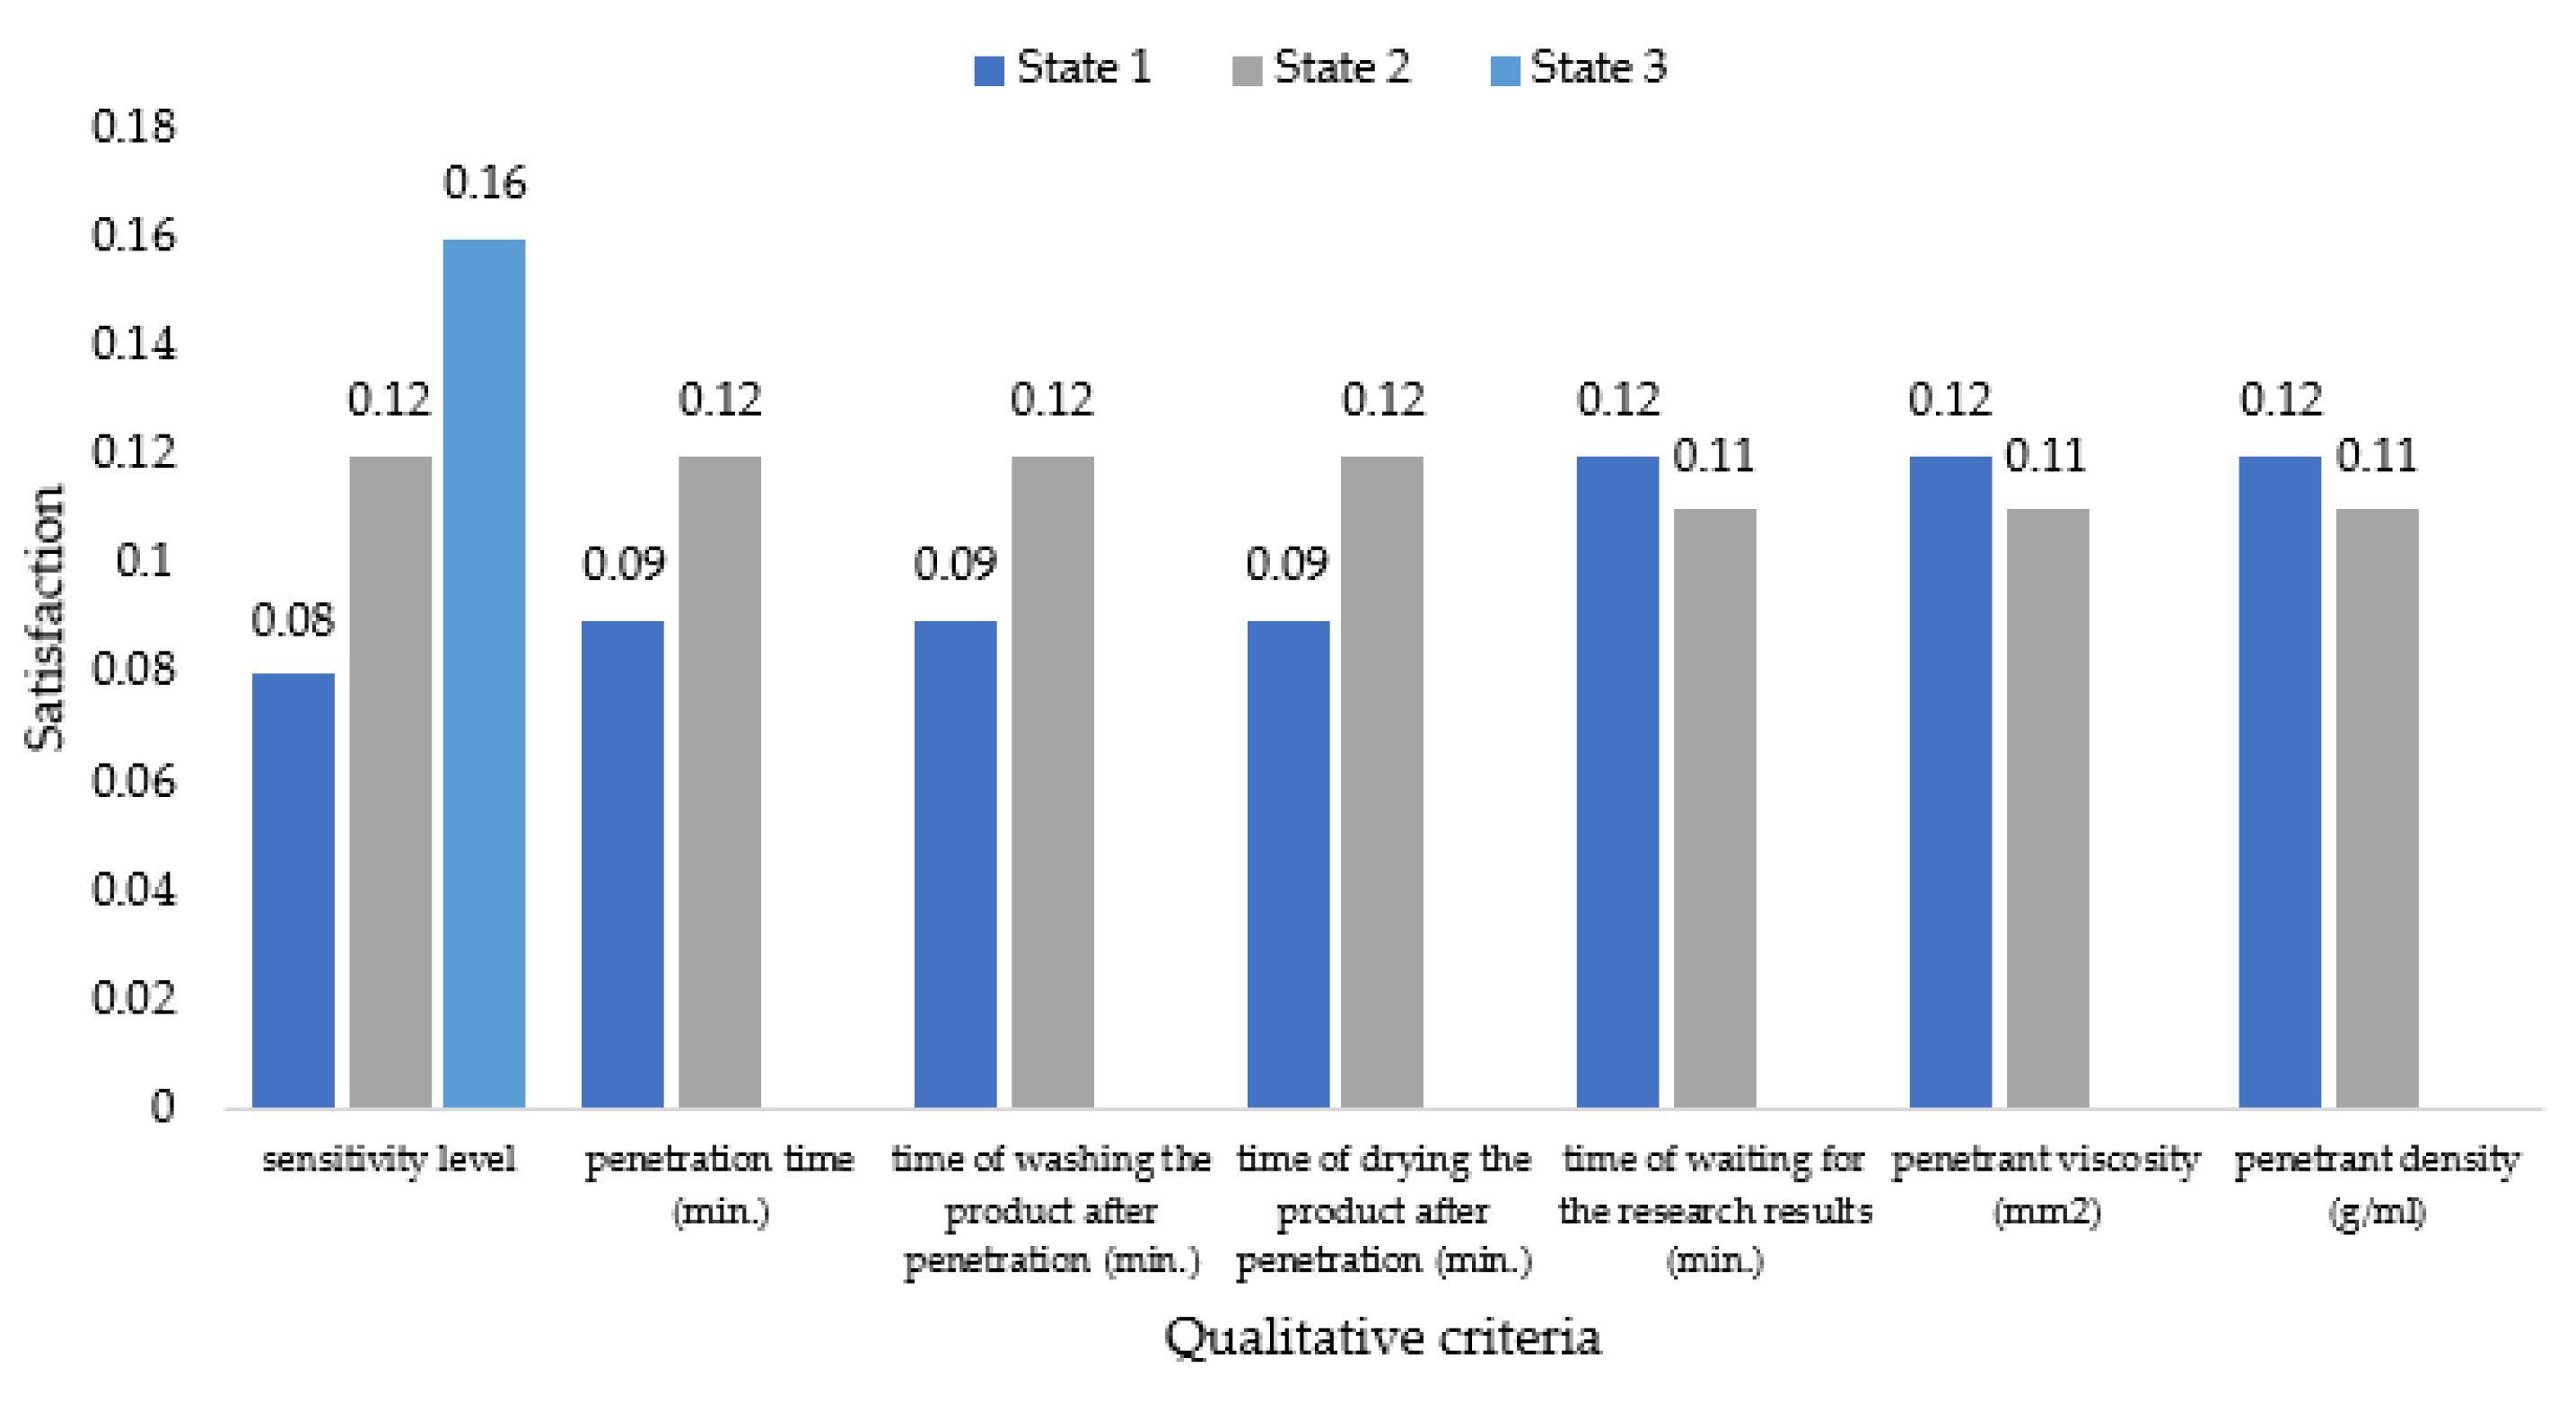
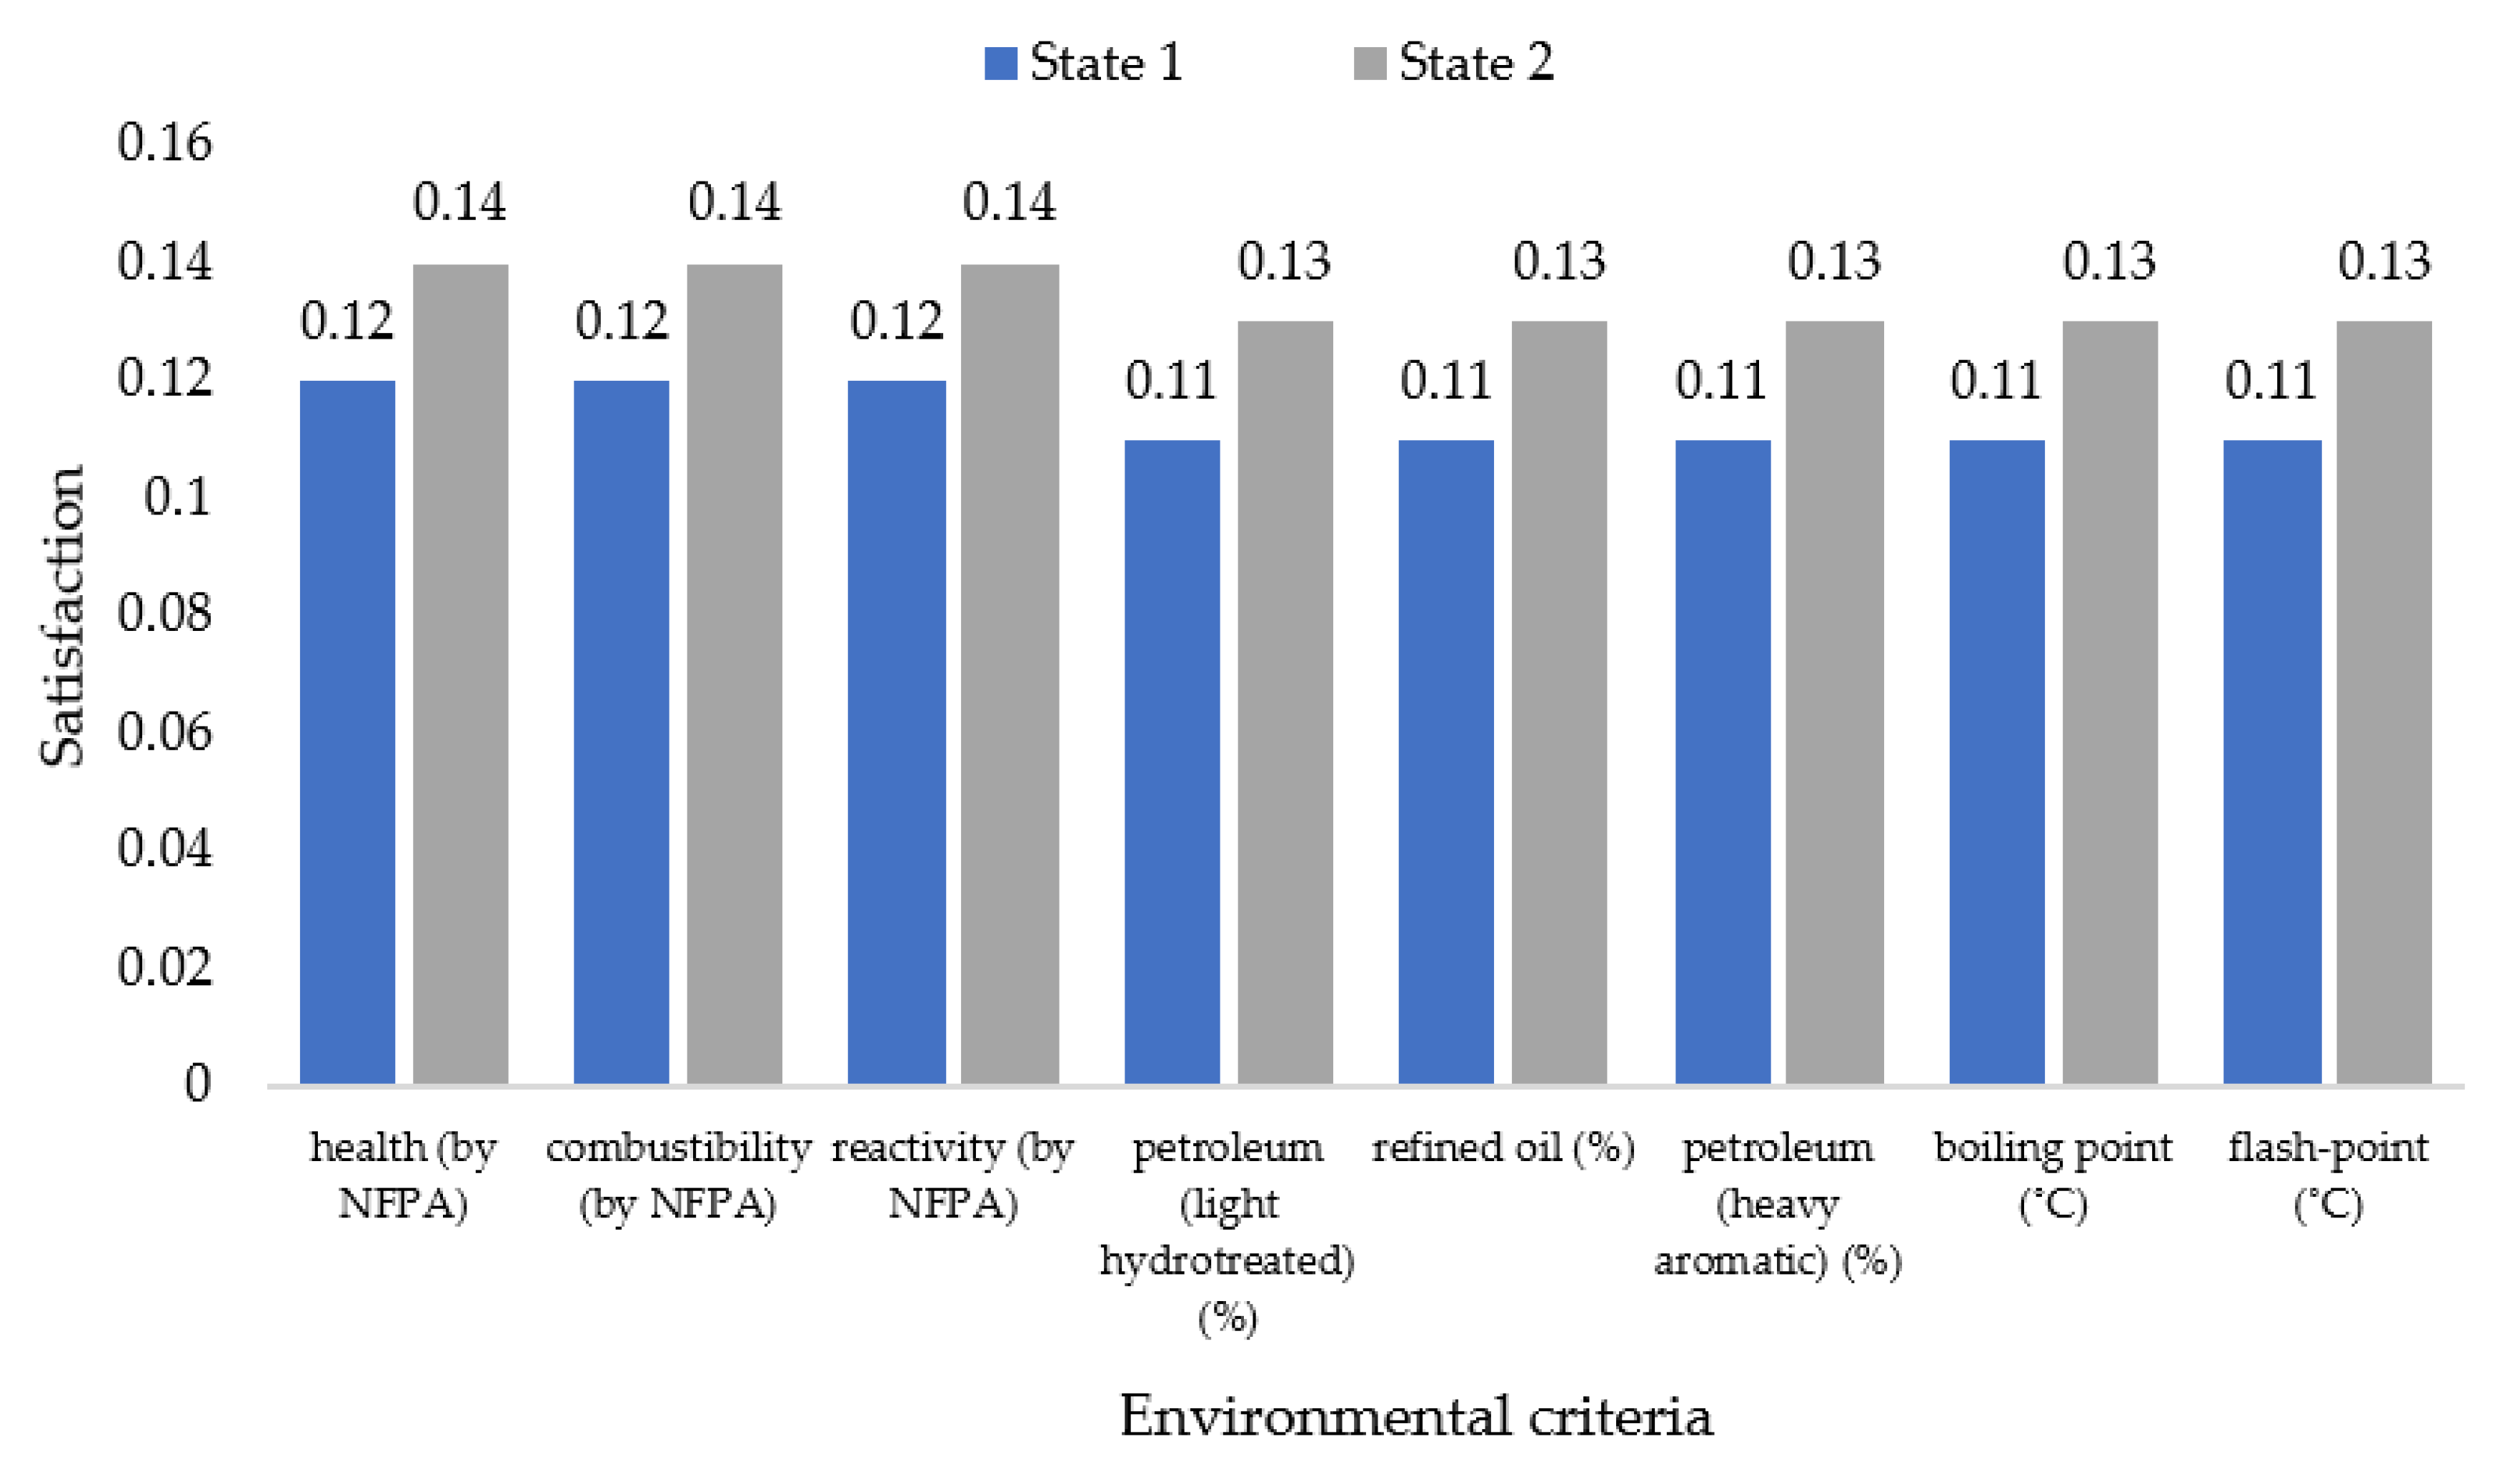
Next, as shown in step 7.5, the weight vector and normalized non-fuzzy weight vector for qualitative and environmental criteria were calculated. According to step 7.6, the satisfaction with qualitative and environmental product criteria states were determined. Results are shown in Table 10 and Table 11, Figure 8 and Figure 9.
After analysis supported by the FAHP method, it was shown that customers were satisfied with a high penetrant sensitivity level (benefit criteria—more is better). For the following criteria, greater satisfaction was demonstrated for shorter times: penetration, washing, and drying, i.e., cost criteria—less is better. It was expected that the time of waiting for the research results would be longer (benefit criterion—more is better). Additionally, there was more satisfaction with bigger density and viscosity values (benefit criteria—more is better). For environmental criteria, satisfaction was shown when the product had an NFPA value below 1 for health, reactivity, and combustibility (cost criteria—more is better). The customer was also determined to have greater satisfaction with a product when it had lower petroleum content (light hydrotreated), refined oil, petroleum (heavy aromatic), boiling point, and flash point values (cost criteria—less is better).
Then, as is shown in the eighth stage of the model, the positive correlations of qualitative and environmental criteria were determined. At this stage, only satisfactory states of criteria were included. The results are shown in Table 12.
We found four strong positive correlations of qualitative and environmental criteria, i.e., time of drying the product after penetration and combustibility, time of washing the product after penetration and petroleum (light hydrotreated), refined oil, and petroleum (heavy aromatic). Based on these correlations, the ninth stage of the model, in which we used the FTOPSIS method to predict product quality levels while considering environmental aspects.
For step 9.1, we determined our method to predict product quality values through the use of positively correlated qualitative and environmental criteria.
According to step 9.2, we selected the products to be verified through non-destructive testing. We selected the following five fluorescent penetrants for the analysis: HM-406 (Sherwin Incorporated), ZL-2C (Magnaflux), FP-922 (Met-L-Chek), NM-403 (Sherwin Incorporated), and ZL27A (Magnaflux). These penetrants were generally characterized by their accompanying safety data sheets. Based on the needs of analysis, the penetrants were marked at random as P1–P5.
According to steps 9.3 and 9.4, the products were evaluated in terms of strong positive correlations of qualitative and environmental criteria in a decision matrix; the results are shown in Table 13.
Next, according to step 9.5, the normalized fuzzy decision matrix was created (Table 14).
Then, as shown in step 9.6, the weighted normalized fuzzy decision matrix was developed. Based on this matrix, as in step 9.7, the fuzzy positive ideal solution (FPIS) and fuzzy negative ideal solution (FNIS) were calculated (Table 15).
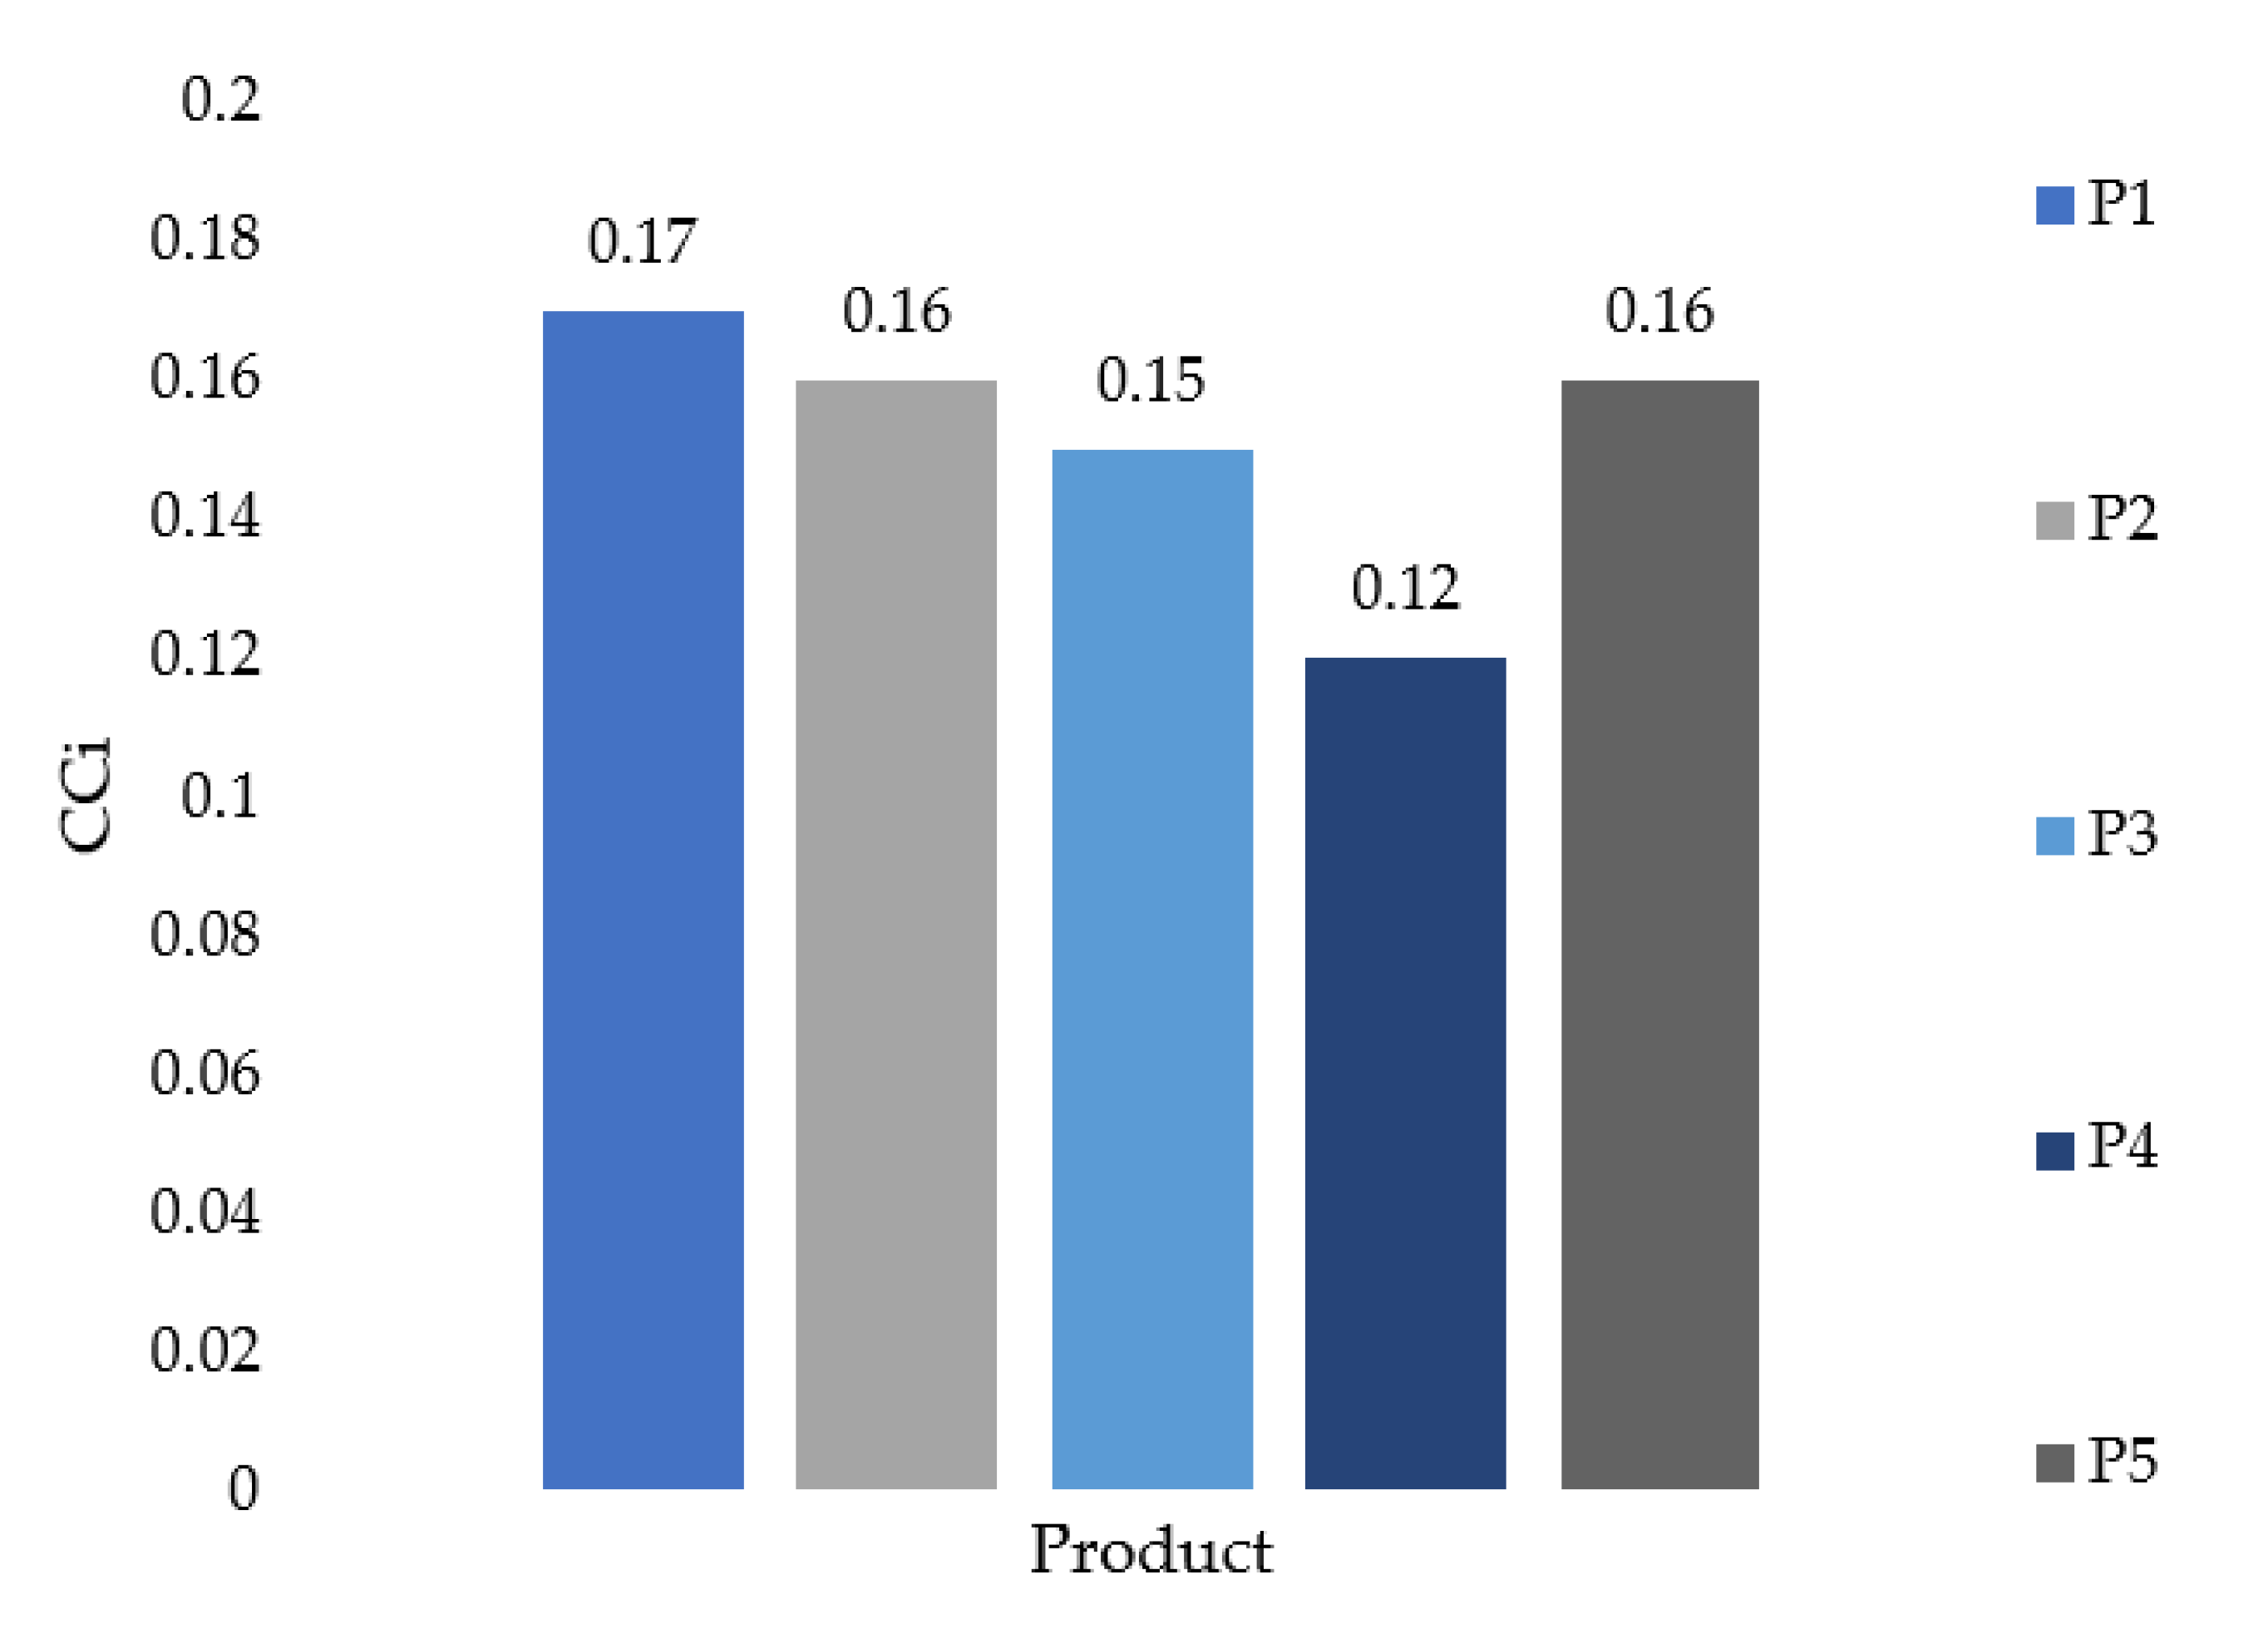
According to steps 9.8–9.10, the distance between solutions and proximity factors were calculated. Then, the ranking of pro-quality decisions while considering environmental aspects was created. Results are shown in Table 16 and Figure 10.
According to our ranking, the pro-quality choice of products while considering environmental aspect was achieved. It was found that the most favorable product was the penetrant named P3, for which the proximity factor was equal to 0.71. This penetrant was found to provide the expected level of quality and had the least negative impact on the natural environment.
5. Discussion
The development of enterprises and dynamically changing customer expectations are generating increased production, the main goal of which is to achieve customer satisfaction [1,8,9]. In this context, it is important to predict customers’ expectations and the environmental impacts resulting from these expectations [3,10]. This process seems to be indispensable for reducing unfavorable climate changes, which have increased with the development of production (Industry 4.0) [12,13]. Hence, it is necessary to propose a model for the prediction of pro-quality decisions while considering sustainable development.
The purpose of this analysis was to develop a model to predict beneficial pro-quality decisions from a design point while considering environmental aspects. The main idea of the model was to integrate multi-criteria decision methods (FAHP and FTOPSIS) in order to determine key product criteria that have beneficial impacts on quality level and the natural environment. These criteria allow for the achievement of a satisfying product quality level while being environmentally friendly. Then, a prediction regarding which product is the most qualitatively advantageous and the least environmentally invasive can be made.
In our analysis, we used NDT for fluorescent penetrants. The test of the model showed that it was possible to verify the assumed hypotheses. It was concluded that it is possible to predict the expected criteria of a product (qualitative and environmental) to achieve satisfy product quality levels while reducing negative impacts on the natural environment. It was additionally concluded that it is possible to support pro-quality decisions while considering environmental aspects by verifying products based on expected and positive correlation product criteria (qualitative and environmental).
Possible benefits of the proposed model include the following:
- Predicting a product that satisfies customers in terms of quality and environmental friendliness.
- Thoughtfully selecting key qualitative product criteria, i.e., those important for customer satisfaction.
- Thoughtfully selecting key environmental product criteria, i.e., those beneficial for customers and the environment.
- Predicting customers’ satisfaction with product criterion states.
- Predicting the direction of product development.
- Designing products with the least possible negative impacts on the environment.
- Sustainably developing existing products.
- Predicting products based on small numbers of customers.
- Supporting organizations in making pro-quality decisions while considering environmental aspects.
Additionally, the proposed model has business benefits:
- The model is low-cost and uses effective multi-criteria decision methods (FAHP and FTOPSIS).
- It can improve the decision-making process for selecting or designing a product.
- It is possible to only concentrate on criteria that simultaneously impact customer satisfaction and are not destructive to the environment.
- It is possible to support organization in planning activities.
- The model can predict sustainable development of products before the competition.
The advantage of the proposed method of developing the survey to obtain customers’ expectations is that it allows for a pairwise comparison of all product categories and, thus, accurate assessments and reduced customer subjectivity.
In turn, the main limitations of the proposed model are its time-consuming calculations, the need to analyze extensive matrices for a large number of criteria, and a lack of resistance to changing customer expectations over time.
As part of future analysis, it is planned to implement the model in software. Additionally, it is planned to verify the model with an example of another kind of product and analyze a bigger sample size.
6. Conclusions
The sustainable development of products while considering customers’ expectations and environmental aspects is the main action of a successful organization. However, a turbulent environment, changes in customers’ expectations, and negative climate changes make it difficult to achieve satisfactory and environmentally friendly products. Therefore, the purpose of this analysis was to develop a model to predict beneficial pro-quality decisions from a design point of view while considering environmental aspects. The model was based on decision methods that additionally reduce uncertainty and imprecision in customers’ assessments. These methods were the FAHP (fuzzy analytic hierarchy process) and the FTOPSIS (fuzzy technique for order of preference by similarity to ideal solution). The proposed model was verified via the NDT of fluorescent penetrants. An analysis of qualitative and environmental criteria was conducted. The qualitative criteria were sensitivity level, penetration time, time of washing the product after penetration, time of drying the product after penetration, time of waiting for the research results, penetrant viscosity, and penetrant density. The environmental criteria were health, combustibility, reactivity, petroleum (light hydrotreated), refined oil, petroleum (heavy aromatic), boiling point, and flash point. Criteria were characterized by current and hypothetical states. The customers’ expectations were obtained with a survey and the Saaty scale. These expectations were processed with the FAHP method to determine the weights of qualitative and environmental criteria, as well as to determine satisfaction with the state of these criteria. Subsequently, four strongly positively correlated qualitative and environmental criteria were defined. The correlations were obtained for time of drying the product after penetration and combustibility, the time of washing the product after penetration and petroleum (light hydrotreated), refined oil, and petroleum (heavy aromatic). Based on these correlations, the product quality level was predicted while considering environmental aspects using the FTOPSIS method. These analyzed penetrants were HM-406 (Sherwin Incorporated), ZL-2C (Magnaflux), FP-922 (Met-L-Chek), NM-403 (Sherwin Incorporated), and ZL27A (Magnaflux). These penetrants were verified only for strong positive correlations, i.e., criteria that allow for a satisfying quality level and do not adversely affect the environment. As a result, it was concluded that the most advantageous penetrant was P3 (with a proximity coefficient of 0.71). It was predicted that using this penetrant allows for the expected quality level and environmental friendliness.
Author Contributions
Conceptualization, D.S. and A.P.; methodology, A.P.; formal analysis, D.S.; writing—original draft preparation, D.S.; writing—review and editing, A.P.; visualization, D.S.; supervision, A.P. Both authors have read and agreed to the published version of the manuscript. All authors have read and agreed to the published version of the manuscript.
Funding
This research received no external funding.
Institutional Review Board Statement
Not applicable.
Informed Consent Statement
Not applicable.
Data Availability Statement
Not applicable.
Conflicts of Interest
The authors declare no conflict of interest.
References
- Siwiec, D.; Pacana, A. A Pro-Environmental Method of Sample Size Determination to Predict the Quality Level of Products Considering Current Customers’ Expectations. Sustainability 2021, 13, 5542. [Google Scholar] [CrossRef]
- Zheng, P.; Xu, X.; Xie, S. A weighted interval rough number based method to determine relative importance ratings of customer requirements in QFD product planning. J. Intell. Manuf. 2019, 30, 3–16. [Google Scholar] [CrossRef]
- Pacana, A.; Ulewicz, R. Analysis of causes and effects of implementation of the quality management system compliant with ISO 9001. Pol. J. Manag. Stud. 2020, 21, 283–296. [Google Scholar] [CrossRef]
- Sofyalioğlu, Ç.; Öztürk, Ş. Application of grey relational analysis with fuzzy AHP to FMEA method. Doğuş Üniversitesi Derg. 2012, 13, 114–130. [Google Scholar] [CrossRef]
- Ostasz, G.; Czerwinska, K.; Pacana, A. Quality management of aluminum pistons with the use of quality control points. Manag. Syst. Prod. Eng. 2020, 28, 771–773. [Google Scholar] [CrossRef] [Green Version]
- Turisová, R.; Pačaiová, H.; Kotianová, Z.; Nagyová, A.; Hovanec, M.; Korba, P. Evaluation of eMaintenance Application Based on the New Version of the EFQM Model. Sustainability 2021, 13, 3682. [Google Scholar] [CrossRef]
- Mentel, U.; Hajduk-Stelmachowicz, M. Does standardization have an impact on innovation activity in different countries? Probl. Perspect. Manag. 2020, 18, 486–503. [Google Scholar] [CrossRef]
- Ulewicz, R.; Siwiec, D.; Pacana, A.; Tutak, M.; Brodny, J. Multi-Criteria Method for the Selection of Renewable Energy Sources in the Polish Industrial Sector. Energies 2021, 14, 2386. [Google Scholar] [CrossRef]
- Doni, P.; Norfaridatul, A.; Hayder, A. The awareness of environmentally friendly products: The impact of green advertising and green brand image. Manag. Sci. Lett. 2020, 10, 1961–1968. [Google Scholar] [CrossRef]
- Pacana, A.; Siwiec, D.; Bednarova, L. Analysis of the incompatibility of the product with fluorescent method. Metallurgija 2019, 58, 337–340. [Google Scholar]
- Gazda, A.; Pacana, A.; Malindžák, D. Study on improving the quality of stretch film by Taguchi method. Przem Chem. 2013, 92, 980–982. [Google Scholar]
- Pishdar, M.; Danesh Shakib, M.; Antucheviciene, J.; Vilkonis, A. Interval Type-2 Fuzzy Super SBM Network DEA for Assessing Sustainability Performance of Third-Party Logistics Service Providers Considering Circular Economy Strategies in the Era of Industry 4.0. Sustainability 2021, 13, 6497. [Google Scholar] [CrossRef]
- Ada, N.; Kazancoglu, Y.; Sezer, M.D.; Ede-Senturk, C.; Ozer, I.; Ram, M. Analyzing Barriers of Circular Food Supply Chains and Proposing Industry 4.0 Solutions. Sustainability 2021, 13, 6812. [Google Scholar] [CrossRef]
- Wang, H.; Lu, H.; Alelaumi, S.M.; Yoon, S.W. A wavelet-based multi-dimensional temporal recurrent neural network for stencil printing performance prediction. Robot. Comput.-Integr. Manuf. 2021, 71, 102129. [Google Scholar] [CrossRef]
- Balasso, M.; Hunt, M.; Jacobs, A.; O’Reilly-Wapstra, J. Characterisation of wood quality of Eucalyptus nitens plantations and predictive models of density and stiffness with site and tree characteristics. For. Ecol. Manag. 2021, 491, 118992. [Google Scholar] [CrossRef]
- Gulcur, M.; Whiteside, B. A study of micromanufacturing process fingerprints in micro-injection molding for machine learning and Industry 4.0 applications. Int. J. Adv. Manuf. Technol. 2021, 115, 1943–1954. [Google Scholar] [CrossRef]
- Apffelstaedt, A.; Mechtenberg, L. Competition for Context-Sensitive Consumers. Manag. Sci. 2021, 67, 2828–2844. [Google Scholar] [CrossRef]
- Solarte, B.; Ruben, D.; Macedo, B.; Sanderson, C. Exploring product complexity and prototype lead = times to predict new product development cycle-times. Int. J. Prod. Econ. 2021, 235, 108077. [Google Scholar] [CrossRef]
- He, S.; Wang, J.; Cheng, Z.; Dong, H.; Yan, B.; Chen, G. Synergetic effect and primary reaction network of corn cob and cattle manure in single and mixed hydrothermal liquefaction. J. Anal. Appl. Pyrolysis 2021, 155, 105076. [Google Scholar] [CrossRef]
- Olayeni, A.; Ogbo, A.; Okwo, H.; Chukwu, B.; Ifediora, C.; Ezenwakwelu, C. Green Strategy Effect on Financial and Environmental Performance: A Mediation Analysis of Product Wuality. Sustainability 2021, 13, 2115. [Google Scholar] [CrossRef]
- Jelonek, Z.; Drobniak, A.; Mastalerz, M.; Jelonek, I. Environmental implications of the quality of charcoal briquettes and lump charcoal used for grilling. Sci. Total Environ. 2020, 747, 141267. [Google Scholar] [CrossRef] [PubMed]
- Wang, X.; Feng, H.; Chen, T.; Zhao, S.; Zhang, J.; Zhang, X. Gas sensor technologies and mathematical modelling for quality sensing in fruit and vegetable cold chains: A review. Trends Food Sci. Technol. 2021, 110, 483–492. [Google Scholar] [CrossRef]
- Chang, D.-Y. Applications of the extent analysis method on fuzzy AHP. Eur. J. Oper. Res. 1996, 95, 649–655. [Google Scholar] [CrossRef]
- Saaty, R.W. The analytic hierarchy process—What it is and how it is used. Math. Model. 1987, 9, 161–176. [Google Scholar] [CrossRef] [Green Version]
- Hwang, C.-L.; Yoon, K. Multiple Attribute Decision Making. Methods and Applications A State-of-the-Art Survey; Springer: Berlin/Heidelberg, Germany; New York, NY, USA, 1981. [Google Scholar] [CrossRef]
- Tsai, H.-C.; Lee, A.-S.; Lee, H.-N.; Chen, C.-N.; Liu, Y.-C. An Application of the Fuzzy Delphi Method and Fuzzy AHP on the Discussion of Training Indicators for the Regional Competition, Taiwan National Skills Competition, in the Trade of Joinery. Sustainability 2020, 12, 4290. [Google Scholar] [CrossRef]
- Chen, C.-T. Extensions of the TOPSIS for group decision-making under fuzzy environment. Fuzzy Sets Syst. 2000, 114, 1–9. [Google Scholar] [CrossRef]
- Jahanshahloo, G.R.; Hosseinzadeh, L.; Izadikhah, M. Extension of the TOPSIS method for decision-making problems with fuzzy data. Appl. Math. Comput. 2006, 181, 1544–1551. [Google Scholar] [CrossRef]
- Kusumawardani, R.P.; Agintiara, M. Application of Fuzzy AHP-TOPSIS Method for Decision Making in Human Resource Manager Selection Process. Procedia Comput. Sci. 2015, 72, 638–646. [Google Scholar] [CrossRef] [Green Version]
- Esmaili-Dooki, A.; Bolhasani, P.; Fallah, M. An Integrated Fuzzy AHP and Fuzzy TOPSIS Approach for Ranking and Selecting the Chief Inspectors of Bank: A Case Study. J. Appl. Res. Ind. Eng. 2016, 4, 8–23. [Google Scholar] [CrossRef]
- Basahel, A.; Yaylan, O. Using Fuzzy AHP and Fuzzy TOPSIS Approaches for Assessing Safety Conditions at Worksites In Construction Industry. Int. J. Saf. Secur. Eng. 2016, 6, 728–745. [Google Scholar] [CrossRef]
- Saaty, T. A scaling method for priorities in hierarchical structures. J. Math. Psychol. 1997, 15, 234–281. [Google Scholar] [CrossRef]
- Lawlor, K.B.; Hornyak, M.J. Smart Goals: How the Application of Smart Goals Can Contribute to Achievement of Student Learning Outcomes. Dev. Bus. Simul. Exp. Learn. 2012, 39, 259–267. [Google Scholar]
- Turisova, R. A Generalization of Traditional Kano Model for Customer Requirements Analysis. Qual. Innov. Prosper.-Kval. Inovacia Prosper. 2015, 19, 59–73. [Google Scholar] [CrossRef]
- Wang, Y.; Tseng, M.M. Identifying Emerging Customer Requirements in an Early Design Stage by Applying Bayes Factor-Based Sequential Analysis. IEEE Trans. Eng. Manag. 2014, 61, 129–137. [Google Scholar] [CrossRef]
- Xie, M.Q.; Jiang, Q.Q.; Cheng, W.P.; Ma, X.X. Determining the Importance Ratings of Customer Requirements of Automotive Clutch Based on Quality Function Deployment. In Proceedings of the 2016 International Conference on Mechanics Design, Manufacturing And Automation (MDM 2016), Suzhou, China, 14–15 May 2016; pp. 379–386. [Google Scholar]
- Hansen, E.; Bush, R.J. Understanding customer quality requirements—Model and application. Ind. Mark. Manag. 1999, 28, 119–130. [Google Scholar] [CrossRef]
- Huang, Y.M. On the general evaluation of customer requirements during conceptual design. J. Mech. Des. 1999, 121, 92–97. [Google Scholar] [CrossRef]
- Roder, B.; Heidl, M.J.; Birkhofer, H. Pre-Acquisition Clustering Of Requirements—Helping Customers To Realize What They Want. In Proceedings of the 19th International Conference on Engineering Design (ICED13), Design for Harmonies, Volume 7: Human Behaviour in Design, Seoul, Korea, 19–22 August 2013. [Google Scholar]
- Mu, E.; Pereyra-Rojas, M. Practical Decision Making. In Springer Briefs in Operations Research, Appendix A: Practical Questions Related to AHP Modeling; Springer Nature: Basel, Switzerland, 2017; pp. 105–106. [Google Scholar]
- Jiao, J.X.; Chen, C.H. Customer requirement management in product development: A review of research issues. Concurr. Eng.-Res. Appl. 2006, 14, 173–185. [Google Scholar] [CrossRef]
- Ali, A.; Hafeez, Y.; Hussain, S.; Yang, S. Role of Requirement Prioritization Technique to Improve the Quality of Highly-Configurable Systems. IEEE Access 2020, 8, 27549–27573. [Google Scholar] [CrossRef]
- Chen, C.H.; Khoo, L.P.; Yan, W. Evaluation of multicultural factors from elicited customer requirements for new product development. Res. Eng. Des. Theory Appl. Concurr. Eng. 2003, 14, 119–130. [Google Scholar] [CrossRef]
- Lee, C.H.; Chen, C.H.; Lin, C.Y.; Li, F.; Zhao, X.J. Developing a Quick Response Product Configuration System under Industry 4.0 Based on Customer Requirement Modelling and Optimization Method. Appl. Sci. 2019, 9, 5004. [Google Scholar] [CrossRef] [Green Version]
- Li, Z.; Tian, H. Research on Fuzzy Hierarchy Optimization Model of Product Family Parameters Based on Flexible Design of Clothing. IOP Conf. Ser. Mater. Sci. Eng. 2019, 573, 012002. [Google Scholar] [CrossRef]
- Aoyama, K.; Matshuda, N.; Koga, T. A Design Method of Product Family for Unpredictable Customer Requirements Using Fuzzy Sets. In NEW World Situation: New Directions in Concurrent Engineering; Springer: London, UK, 2010. [Google Scholar] [CrossRef]
- Guo, C.; Liu, Y.; Tian, P.; Hou, S. Fuzzy comprehensive evaluation method of the importance ratings of customers’ requirements. Adv. Intell. Soft Comput. 2010, 66, 361–373. [Google Scholar]
- Nadaban, S.; Dzitac, S.; Dzitac, I. Fuzzy TOPSIS: A General View. Procedia Comput. Sci. 2016, 91, 823–831. [Google Scholar] [CrossRef] [Green Version]
- Soh, S.H.S. A decision model for evaluating third-party logistics providers using fuzzy analytic hierarchy process. Afr. J. Bus. Manag. 2010, 4, 339–349. [Google Scholar]
- Baby, S. AHP modeling for multicriteria decision-making and to optimise strategies for protecting coastal landscape resources. Int. J. Innov. Manag. Technol. 2013, 4, 218–227. [Google Scholar] [CrossRef] [Green Version]
- Chan, F.T.S.; Kumar, N. Global supplier development considering risk factors using fuzzy extended AHP-based approach. Omega 2007, 35, 417–431. [Google Scholar] [CrossRef]
- Wang, L.; Chu, J.; Wu, J. Selection of optimum maintenance strategies based on a fuzzy analytic hierarchy process. Int. J. Prod. Econ. 2007, 107, 151–163. [Google Scholar] [CrossRef]
- Gawilk, R. Stratification of research target group and selection of experts for AHP-based decision making model. Stud. Mater. Misc. Oeconomicae 2016, 20, 193–200. [Google Scholar]
- Harputlugil, T. Analytic Hierarchy Process (AHP) as an Assessment Approach for Architectural Design: Case Study of Ar-chitectural Design Studio. Int. J. Archit. Plan. 2018, 6, 217–245. [Google Scholar] [CrossRef] [Green Version]
- Pacana, A.; Siwiec, D.; Bednárová, L. Method of Choice: A Fluorescent Penetrant Taking into Account Sustainability Criteria. Sustainability 2020, 12, 5854. [Google Scholar] [CrossRef]
- Pacana, A.; Czerwińska, K.; Bednarova, L. Discrepancies analysis of casts of diesel engine piston. Metalurgija 2018, 57, 324–326. [Google Scholar]
- D’Angelo, G.; Palmieri, F. Knowledge elicitation based on genetic programming for non destructive testing of critical aerospace systems. Future Gener. Comput. Syst. 2020, 102, 633–642. [Google Scholar] [CrossRef]
- Shipway, N.J.; Huthwaite, P.; Lowe, M.J.S.; Barden, T.J. Performance Based Modifications of Random Forest to Perform Automated Defect Detection for Fluorescent Penetrant Inspection. J. Nondestruct. Eval. 2019, 38, 1–11. [Google Scholar] [CrossRef] [Green Version]
- Kutman, M.K.; Muftuler, F.B.; Harmansah, C.; Guldu, O.K. Use of Bacteria as Fluorescent Penetrant for Penetrant Testing (PT). J. Nondestruct. Eval. 2020, 39, 1–6. [Google Scholar] [CrossRef]
- Daneshvar, K.; Dogan, B. Application of quantum dots as a fluorescent-penetrant for weld crack detection. Mater. High Temp. 2010, 27, 179–182. [Google Scholar] [CrossRef]
- Ralph, M.F.; La, M.; Isadore, P. Dye Penetrant for Surfaces Subsequently Contacted by Liquid Oxygen. U.S. Patent 3,567,651, 2 March 1971. Available online: https://patents.google.com/patent/US3567651A/en (accessed on 4 July 2021).
- National Fire Protection Association. Available online: https://www.nfpa.eu/ (accessed on 4 July 2021).
- Hazardous Materials Identification System (HMIS). Available online: https://www.chemsafetypro.com/Topics/USA/Hazardous_Materials_Identification_System_HMIS.html (accessed on 4 July 2021).
Figure 1.
Graphical justification of choosing the methods in the proposed model. Own study.

Figure 2.
Model supporting pro-quality decisions while considering environmental aspects—part 1. Own study.
Figure 2.
Model supporting pro-quality decisions while considering environmental aspects—part 1. Own study.

Figure 3.
Model supporting pro-quality decisions while considering environmental aspects—part 2. Own study.
Figure 3.
Model supporting pro-quality decisions while considering environmental aspects—part 2. Own study.

Figure 4.
Example of a survey to compare criteria in pairs in the Saaty scale. Own study based on [54].
Figure 4.
Example of a survey to compare criteria in pairs in the Saaty scale. Own study based on [54].

Figure 5.
Determination of the coordinates of the intersection points and . Own study based on [4,8].

Figure 6.
Ranking of qualitative criteria weights obtained with the FAHP method. Own study.

Figure 7.
Ranking of environmental criteria weights obtained with the FAHP method. Own study.

Figure 8.
Ranking of satisfaction with qualitative criteria states obtained by using the FAHP method. Own study.
Figure 8.
Ranking of satisfaction with qualitative criteria states obtained by using the FAHP method. Own study.

Figure 9.
Ranking of satisfaction with environmental criteria states obtained by using the FAHP method. Own study.
Figure 9.
Ranking of satisfaction with environmental criteria states obtained by using the FAHP method. Own study.

Figure 10.
Ranking of pro-quality decisions while considering environmental aspects. Own study.


Table 1.
Ten-stage Saaty scale. Own study based on [32].
Table 1.
Ten-stage Saaty scale. Own study based on [32].
| Linguistic Value | ||
|---|---|---|
| Extreme importance | 9 | 7.9.9 |
| Very strongly demonstrated importance | 7 | 5.7.9 |
| Strong importance | 5 | 3.5.7 |
| Moderate importance | 3 | 1.3.5 |
| Equal importance | 1 | 1.2.3 |
Table 2.
States of fluorescent penetrants in a group of qualitative and environmental states.
| Group of Criteria | Product Criterion | State 1 | State 2 | State 3 |
|---|---|---|---|---|
| Qualitative | Sensitivity level | Low | Average | High |
| Penetration time | >10 min | <10 min | ||
| Time of washing the product after penetration | >15 min | <15 min | ||
| Time of drying the product after penetration | >10 min | <10 min | ||
| Time of waiting for the research results | >10 min | <10 min | ||
| Penetrant viscosity | >8.5 mm2 | <8.5 mm2 | ||
| Penetrant density | >0.88 g/mL | <0.88 g/mL | ||
| Environmental | Health (by NFPA) | >1 | <1 | |
| Combustibility (by NFPA) | >1 | <1 | ||
| Reactivity (by NFPA) | >1 | <1 | ||
| Petroleum (light hydrotreated) | >30–50% | <30–50% | ||
| Refined oil | >20–30% | <20–30% | ||
| Petroleum (heavy aromatic) | >1–10% | <1–10% | ||
| Boiling point | >231 °C | <231 °C | ||
| Flash point | >93.3 °C | <93.3 °C |
Table 3.
Combined matrix of qualitative criteria weights. Own study.
| Qualitative Criteria | Sensitivity Level | Penetration Time (min | Time of Washing the Product after Penetration (min) | Time of Drying the Product after Penetration (min) | Time of Waiting for the Research Results (min) | Penetrant Viscosity (mm2) | Penetrant Density (m/mL) |
|---|---|---|---|---|---|---|---|
| Sensitivity level | 1.0; 1.0; 1.0 | 0.2; 4.6; 9.0 | 0.1; 3.9; 9.0 | 0.1; 3.5; 9.0 | 0.1; 3.6; 9.0 | 0.2; 4.9; 9.0 | 1.0; 5.4; 9.0 |
| Penetration time (min) | 0.1; 0.8; 5.0 | 1.0; 1.0; 1.0 | 0.1; 3.8; 9.0 | 1.0; 4.3; 9.0 | 0.1; 2.6; 9.0 | 0.1; 3.3; 9.0 | 0.1; 3.8; 9.0 |
| Time of washing the product after penetration (min) | 0.1; 1.4; 7.0 | 0.1; 0.9; 7.0 | 1.0; 1.0; 1.0 | 0.1; 1.9; 7.0 | 0.1; 1.7; 9.0 | 0.1; 2.7; 9.0 | 0.1; 3.0; 9.0 |
| Time of drying the product after penetration (min) | 0.1; 7.0; 9.0 | 0.1; 0.4; 1.0 | 0.1; 2.1; 9.0 | 1.0; 1.0; 1.0 | 0.1; 1.3; 7.0 | 0.1; 2.6; 9.0 | 0.1; 2.5; 9.0 |
| time of waiting for the research results (min) | 0.1; 1.9; 7.0 | 0.1; 1.7; 9.0 | 0.1; 3.7; 9.0 | 0.1; 3.3; 9.0 | 1.0; 1.0; 1.0 | 0.1; 4.5; 9.0 | 0.1; 4.5; 9.0 |
| Penetrant viscosity (mm2) | 0.1; 0.6; 5.0 | 0.1; 1.2; 9.0 | 0.1; 2.0; 9.0 | 0.1; 1.7; 9.0 | 0.1; 0.8; 7.0 | 1.0; 1.0; 1.0 | 1.0; 2.6; 9.0 |
| Penetrant density (g/mL) | 0.1; 0.3; 1.0 | 0.1; 1.2; 9.0 | 0.1; 1.9; 9.0 | 0.1; 1.3; 7.0 | 0.1; 1.1; 9.0 | 0.1; 0.7; 1.0 | 1.0; 1.0; 1.0 |
Table 4.
Combined matrix of environmental criteria weights. Own study.
| Environmental Criteria | Health (by NFPA) | Combustibility (by NFPA) | Reactivity (by NFPA) | Petroleum (Light Hydrotreated) (%) | Refined Oil (%) | Petroleum (Heavy Aromatic) (%) | Boiling Point (°C) | Flash Point (°C) |
|---|---|---|---|---|---|---|---|---|
| Health (by NFPA) | 1.0; 1.0; 1.0 | 3.0; 7.9; 9.0 | 3.0; 7.2; 9.0 | 3.0; 7.9; 9.0 | 0.1; 6.0; 9.0 | 3.0; 6.8; 9.0 | 1.0; 7.4; 9.0 | 0.1; 6.7; 7.0 |
| Combustibility (by NFPA) | 0.1; 0.1; 0.3 | 1.0; 1.0; 1.0 | 0.1; 1.6; 9.0 | 0.1; 1.3; 7.0 | 0.1; 2.5; 9.0 | 0.1; 2.3; 9.0 | 0.2; 3.6; 9.0 | 0.2; 2.6; 5.0 |
| Reactivity (by NFPA) | 0.1; 0.1; 0.3 | 0.1; 1.9; 9.0 | 1.0; 1.0; 1.0 | 0.1; 1.8; 9.0 | 0.1; 2.3; 9.0 | 0.1; 0.1; 7.0 | 0.1; 1.9; 9.0 | 0.1; 2.7; 5.0 |
| Petroleum (light hydrotreated) (%) | 0.1; 0.1; 0.3 | 0.1; 2.8; 9.0 | 0.1; 2.4; 9.0 | 1.0; 1.0; 1.0 | 0.1; 2.6; 9.0 | 0.1; 2.2; 9.0 | 0.1; 2.4; 9.0 | 0.1; 2.2; 7.0 |
| Refined oil (%) | 0.1; 9.0; 9.0 | 0.1; 2.1; 9.0 | 0.1; 2.2; 9.0 | 0.1; 1.6; 7.0 | 1.0; 1.0; 1.0 | 0.1; 1.0; 5.0 | 0.1; 2.2; 9.0 | 0.1; 3.0; 7.0 |
| Petroleum (heavy aromatic) (%) | 0.1; 0.2; 0.3 | 0.1; 2.7; 9.0 | 0.1; 3.6; 9.0 | 0.1; 2.7; 9.0 | 0.2; 3.7; 9.0 | 1.0; 1.0; 1.0 | 0.1; 4.2; 9.0 | 0.1; 4.7; 7.0 |
| Boiling point (°C) | 0.1; 0.1; 1.0 | 0.1; 0.8; 5.0 | 0.1; 2.1; 9.0 | 0.1; 3.0; 9.0 | 0.1; 3.0; 9.0 | 0.1; 1.4; 9.0 | 1.0; 1.0; 1.0 | 0.1; 1.7; 5.0 |
| Flash point (°C) | 0.1; 0.7; 0.7 | 0.1; 1.1; 5.0 | 0.1; 1.5; 9.0 | 0.1; 1.7; 7.0 | 0.1; 1.9; 9.0 | 0.1; 1.1; 9.0 | 0.1; 1.5; 7.0 | 1.0; 1.0; 1.0 |
Table 5.
Relative fuzzy values of weights of qualitative and environmental criteria. Own study.
| Qualitative Criteria | Fuzzy Geometric Mean Value | Environmental Criteria | Fuzzy Geometric Mean Value |
|---|---|---|---|
| Sensitivity level | 0.26; 3.47; 6.58 | Health (by NFPA) | 1.03; 5.56; 6.63 |
| Penetration time (min) | 0.22; 2.39; 6.05 | Combustibility (by NFPA) | 0.17; 1.41; 4.08 |
| Time of washing the product after penetration (min) | 0.15; 1.67; 5.90 | Reactivity (by NFPA) | 0.15; 1.24; 4.08 |
| Time of drying the product after penetration (min) | 0.16; 1.41; 4.63 | Petroleum (light hydrotreated) | 0.16; 1.51; 4.39 |
| Time of waiting for the research results (min) | 0.15; 2.59; 6.34 | Refined oil | 0.15; 1.60; 5.97 |
| Penetrant viscosity (mm2) | 0.21; 1.27; 5.83 | Petroleum (heavy aromatic) | 0.16; 2.05; 4.39 |
| Penetrant density (g/mL) | 0.15; 0.93; 3.39 | Boiling point | 0.15; 1.22; 4.49 |
| - | - | Flash point | 0.15; 1.25; 5.78 |
Table 6.
Ranking of importance (weights) of qualitative and environmental criteria. Own study.
| Group | Criteria | Fuzzy Weights | Normalization Weights | Ranking |
|---|---|---|---|---|
| Qualitative | Sensitivity level | 0.01; 0.25; 4.98 | 0.17 | 1 |
| Penetration time (min) | 0.01; 0.17; 4.58 | 0.16 | 2 | |
| Time of washing the product after penetration (min) | 0.00; 0.12; 4.47 | 0.15 | 3 | |
| Time of drying the product after penetration (min) | 0.00; 0.10; 3.51 | 0.12 | 4 | |
| Time of waiting for the research results (min) | 0.00; 0.19; 4.81 | 0.16 | 2 | |
| Penetrant viscosity (mm2) | 0.01; 0.09; 4.42 | 0.15 | 3 | |
| Penetrant density (g/mL) | 0.00; 0.7; 2.57 | 0.09 | 5 | |
| Environmental | Health (by NFPA) | 0.03; 0.35; 3.13 | 0.18 | 1 |
| Combustibility (by NFPA) | 0.00; 0.09; 1.93 | 0.10 | 5 | |
| Reactivity (by NFPA) | 0.00; 0.08; 1.93 | 0.10 | 5 | |
| Petroleum (light hydrotreated) (%) | 0.00; 0.10; 2.08 | 0.11 | 4 | |
| Refined oil (%) | 0.00; 0.10; 2.82 | 0.15 | 2 | |
| Petroleum (heavy aromatic) (%) | 0.00; 0.13; 2.08 | 0.11 | 4 | |
| Boiling point (°C) | 0.00; 0.08; 2.12 | 0.11 | 4 | |
| Flash point (°C) | 0.00; 0.08; 2.74 | 0.14 | 3 |
Table 7.
Fragment of combined matrix for assessments of satisfaction with qualitative and environmental criteria. Own study.
Table 7.
Fragment of combined matrix for assessments of satisfaction with qualitative and environmental criteria. Own study.
| Qualitative Criteria | Low Sensitivity Level | Average Sensitivity Level | High Sensitivity Level | Penetration Time <10 min |
|---|---|---|---|---|
| Low sensitivity level | 1.00; 1.00; 1.00 | 0.11; 0.14; 0.33 | 0.11; 0.11; 0.14 | 1.00; 1.00; 1.00 |
| Average sensitivity level | 3.00; 7.44; 9.00 | 1.00; 1.00; 1.00 | 0.11; 0.13; 0.33 | 1.00; 1.00; 1.00 |
| High sensitivity level | 7.00; 9.00; 9.00 | 0.11; 7.13; 9.00 | 1.00; 1.00; 1.00 | 1.00; 1.00; 1.00 |
| Penetration time > 10 min | 1.00; 1.00; 1.00 | 1.00; 1.00; 1.00 | 1.00; 1.00; 1.00 | 0.11; 0.14; 0.33 |
| Environmental criteria | Health < 1 (by NFPA) | Combustibility < 1 (by NFPA) | Reactivity < 1 (by NFPA) | Petroleum (light hydrotreated) < 30–50% |
| Health (by NFPA) | 0.11; 2.09; 9.00 | 1.00; 1.00; 1.00 | 1.00; 1.00; 1.00 | 1.00; 1.00; 1.00 |
| Combustibility (by NFPA) | 1.00; 1.00; 1.00 | 0.11; 0.68; 7.00 | 1.00; 1.00; 1.00 | 1.00; 1.00; 1.00 |
| Reactivity (by NFPA) | 1.00; 1.00; 1.00 | 1.00; 1.00; 1.00 | 0.11; 0.67; 7.00 | 1.00; 1.00; 1.00 |
| Petroleum (light hydrotreated) > 30–50% | 1.00; 1.00; 1.00 | 1.00; 1.00; 1.00 | 1.00; 1.00; 1.00 | 0.11; 0.18; 1.00 |
Table 8.
Relative fuzzy values of satisfaction with qualitative criteria. Own study.
| Qualitative Criteria | State 1 | Fuzzy Geometric Mean Value | State 2 | Fuzzy Geometric Mean Value | State 3 | Fuzzy Geometric Mean Value |
|---|---|---|---|---|---|---|
| Sensitivity level | Low | 0.06; 0.07; 0.10 | Average | 0.09; 0.11; 0.16 | High | 0.10; 0.18; 0.23 |
| Penetration time | >10 min | 0.08; 0.09; 0.12 | <10 min | 1.13; 1.25; 1.28 | ||
| Time of washing the product after penetration | >15 min | 0.08; 0.09; 0.12 | <15 min | 0.78; 1.23; 1.28 | ||
| Time of drying the product after penetration | >10 min | 0.08; 0.09; 0.12 | <10 min | 1.13; 1.25; 1.28 | ||
| Time of waiting for the research results | >10 min | 0.08; 0.12; 0.18 | <10 min | 0.78; 1.22; 1.28 | ||
| Penetrant viscosity | >8.5 mm2 | 0.08; 0.12; 0.18 | <8.5 mm2 | 0.78; 1.19; 1.28 | ||
| Penetrant density | >0.88 g/mL | 0.08; 0.12; 0.18 | <0.88 g/mL | 0.78; 1.16; 1.28 |
Table 9.
Relative fuzzy values of satisfaction with environmental criteria. Own study.
| Environmental Criteria | State 1 | Fuzzy Geometric Mean Value | State 2 | Fuzzy Geometric Mean Value |
|---|---|---|---|---|
| Health (by NFPA) | >1 | 0.76; 1.10; 1.32 | <1 | 0.76; 1.28; 1.32 |
| Combustibility (by NFPA) | >1 | 0.76; 0.95; 1.28 | <1 | 0.78; 1.27; 1.32 |
| Reactivity (by NFPA) | >1 | 0.76; 0.95; 1.28 | <1 | 0.78; 1.28; 1.32 |
| Petroleum (light hydrotreated) | >30–50% | 0.76; 0.80; 1.00 | <30–50% | 1.00; 1.26; 1.32 |
| refined oil | >20–30% | 0.76; 0.80; 1.00 | <20–30% | 1.00; 1.26; 1.32 |
| Petroleum (heavy aromatic) | >1–10% | 0.76; 0.80; 1.00 | <1–10% | 1.00; 1.28; 1.32 |
| Boiling point | >231 °C | 0.76; 0.81; 1.00 | <231 °C | 1.00; 1.26; 1.32 |
| Flash point | >93.3 °C | 0.76; 0.96; 1.15 | <93.3 °C | 0.78; 1.25; 1.32 |
Table 10.
Satisfaction with product qualitative criteria states. Own study.
| Qualitative Criteria | State 1 | Satisfaction | State 2 | Satisfaction | State 3 | Satisfaction |
|---|---|---|---|---|---|---|
| Sensitivity level | Low | 0.08 | Average | 0.12 | High | 0.16 |
| Penetration time | >10 min | 0.09 | <10 min | 0.12 | ||
| Time of washing the product after | >15 min | 0.09 | <15 min | 0.12 | ||
| penetration | >10 min | 0.09 | <10 min | 0.12 | ||
| Time of drying the product after | >10 min | 0.12 | <10 min | 0.11 | ||
| penetration | >8.5 mm2 | 0.12 | <8.5 mm2 | 0.11 | ||
| Time of waiting for the research results | >0.88 g/mL | 0.12 | <0.88 g/mL | 0.11 |
Table 11.
Satisfaction with product environmental criteria states. Own study.
| Environmental Criteria | State 1 | Satisfaction | State 2 | Satisfaction |
|---|---|---|---|---|
| Health (by NFPA) | >1 | 0.12 | <1 | 0.14 |
| Combustibility (by NFPA) | >1 | 0.12 | <1 | 0.14 |
| Reactivity (by NFPA) | >1 | 0.12 | <1 | 0.14 |
| Petroleum (light hydrotreated) | >30–50% | 0.11 | <30–50% | 0.13 |
| Refined oil | >20–30% | 0.11 | <20–30% | 0.13 |
| Petroleum (heavy aromatic) | >1–10% | 0.11 | <1–10% | 0.13 |
| Boiling point | >231 °C | 0.11 | <231 °C | 0.13 |
| Flash point | >93.3 °C | 0.11 | <93.3 °C | 0.13 |
Table 12.
Positive correlations of qualitative and environmental criteria. Own study.
| Environmental Criteria | Health (by NFPA) | Combustibility (by NFPA) | Reactivity (by NFPA) | Petroleum (Light Hydrotreated) | Refined Oil | Petroleum (Heavy Aromatic) | Boiling Point | Flash Point | |
|---|---|---|---|---|---|---|---|---|---|
| Qualitative criteria | State | <1 | <1 | <1 | <30–50% | <20–30% | <1–10% | <231 °C | <93.3 °C |
| Sensitivity level | High | 1 | |||||||
| Penetration time | <10 min | −2 | 1 | 1 | 1 | −1 | −1 | ||
| Time of washing the product after | <15 min | −1 | 2 | 2 | 2 | ||||
| penetration | <10 min | 2 | −1 | −1 | 1 | 1 | |||
| Time of drying the product after | >10 min | 1 | −1 | −1 | −1 | ||||
| penetration | >8.5 mm2 | 1 | 1 | 1 | 1 | 1 | |||
| Time of waiting for the research results | >0.88 g/mL | 1 | 1 | 1 | 1 | 1 |
Table 13.
Combined matrix of product ratings in terms of strongly correlated qualitative and environmental criteria. Own study.
Table 13.
Combined matrix of product ratings in terms of strongly correlated qualitative and environmental criteria. Own study.
| Strongly Positive Correlated Criteria | Time of Drying the Product after Penetration (min) | Combustibility (by NFPA) | Time of Washing the Product after Penetration (min) | Petroleum (Light Hydrotreated) (%) | Refined Oil(%) | Petroleum (Heavy Aromatic) (%) | |
|---|---|---|---|---|---|---|---|
| Type of criterion | Cost | Cost | Cost | Cost | Cost | Cost | |
| Fuzzy criterion weight | 0.00; 0.10; 3.51 | 0.00; 0.09; 1.93 | 0.00; 0.12; 4.47 | 0.00; 0.10; 2.08 | 0.00; 0.10; 2.82 | 0.00; 0.13; 2.08 | |
| Product | P1 | 3.00; 5.00; 7.00 | 2.00; 1.00; 5.00 | 2.00; 2.00; 5.00 | 4.00; 3.00; 7.00 | 5.00; 4.00; 7.00 | 4.00; 4.00; 7.00 |
| P2 | 1.00; 3.00; 5.00 | 3.00; 1.00; 5.00 | 2.00; 2.00; 5.00 | 4.00; 3.00; 5.00 | 5.00; 4.00; 9.00 | 4.00; 3.00; 7.00 | |
| P3 | 1.00; 3.00; 7.00 | 2.00; 2.00; 5.00 | 2.00; 1.00; 5.00 | 3.00; 1.00; 5.00 | 7.00; 5.00; 9.00 | 2.00; 1.00; 5.00 | |
| P4 | 3.50; 7.00; 2.00 | 2.00; 2.00; 5.00 | 3.00; 2.00; 5.00 | 3.00; 1.00; 5.00 | 3.00; 3.00; 7.00 | 2.00; 1.00; 3.00 | |
| P5 | 3.00; 4.00; 7.00 | 3.00; 2.00; 5.00 | 3.00; 2.00; 7.00 | 2.00; 2.00; 7.00 | 3.00; 2.00; 7.00 | 4.00; 3.00; 7.00 | |
Table 14.
Normalized fuzzy decision matrix for strongly positive correlated criteria. Own study.
| Strongly Positive Correlated Criteria | Time of Drying the Product after Penetration (min) | Combustibility (by NFPA) | Time of Washing the Product after Penetration (min) | Petroleum (Light Hydrotreated) (%) | Refined Oil (%) | Petroleum (Heavy Aromatic) (%) | |
|---|---|---|---|---|---|---|---|
| Type of criterion | cost | cost | cost | cost | cost | cost | |
| Fuzzy criterion weight | 0.00; 0.10; 3.51 | 0.00; 0.09; 1.93 | 0.00; 0.12; 4.47 | 0.00; 0.10; 2.08 | 0.00; 0.10; 2.82 | 0.00; 0.13; 2.08 | |
| Product | P1 | 0.14; 0.20; 0.33 | 0.40; 2.00; 1.00 | 0.40; 1.00; 1.00 | 0.29; 0.67; 0.50 | 0.43; 0.75; 0.60 | 0.29; 0.50; 0.50 |
| P2 | 0.20; 0.33; 1.00 | 4.00; 2.00; 0.67 | 0.40; 1.00; 1.00 | 0.40; 0.67; 0.50 | 0.33; 0.75; 0.60 | 0.29; 0.67; 0.50 | |
| P3 | 0.14; 0.33; 1.00 | 0.40; 1.00; 1.00 | 0.40; 2.00; 1.00 | 0.40; 2.00; 0.67 | 0.33; 0.60; 0.43 | 0.40; 2.00; 1.00 | |
| P4 | 0.14; 0.29; 0.33 | 0.40; 1.00; 1.00 | 0.40; 1.00; 0.67 | 0.40; 2.00; 0.67 | 0.43; 1.00; 1.00 | 0.67; 2.00; 1.00 | |
| P5 | 0.14; 0.25; 0.33 | 0.40; 1.00; 0.67 | 0.29; 1.00; 0.67 | 0.29; 1.00; 1.00 | 0.43; 1.50; 1.00 | 0.29; 0.67; 0.50 | |
Table 15.
Weighted normalized fuzzy decision matrix for strongly correlated criteria. Own study.
| Strongly Positive Correlated Criteria | Time of Drying the Product after Penetration(min) | Combustibility (by NFPA) | Time of Washing the Product after Penetration (min) | Petroleum (Light Hydrotreated) (%) | Refined Oil (%) | Petroleum (Heavy Aromatic) (%) | |
|---|---|---|---|---|---|---|---|
| Type of criterion | Cost | Cost | Cost | Cost | Cost | Cost | |
| Fuzzy criterion weight | 0.00; 0.10; 3.51 | 0.00; 0.09; 1.93 | 0.00; 0.12; 4.47 | 0.00; 0.10; 2.08 | 0.00; 0.10; 2.82 | 0.00; 0.13; 2.08 | |
| Product | P1 | 0.00; 0.02; 1.17 | 0.00; 0.18; 1.93 | 0.00; 0.12; 4.47 | 0.00; 0.07; 1.04 | 0.00; 0.08; 1.69 | 0.00; 0.07; 1.04 |
| P2 | 0,00; 0.03; 3.51 | 0.00; 0.18; 1.29 | 0.00; 0.12; 4.47 | 0.00; 0.07; 10.4 | 0.00; 0.08; 1.69 | 0.00; 0.09; 1.04 | |
| P3 | 0.00; 0.03; 3.51 | 0.00; 0.09; 1.93 | 0.00; 0.24; 4.47 | 0.00; 0.20; 1.39 | 0.00; 0.06; 1.21 | 0.00; 0.26; 2.08 | |
| P4 | 0.00; 0.03; 1.17 | 0.00; 0.09; 1.93 | 0.00; 0.12; 2.98 | 0.00; 0.20; 1.39 | 0.00; 0.10; 2.82 | 0.00; 0.26; 2.08 | |
| P5 | 0.00; 0.03; 1.17 | 0.00; 0.09; 1.29 | 0.00; 0.12; 2.98 | 0.00; 0.10; 2.08 | 0.00; 0.15; 2.82 | 0.00; 0.09; 1.04 | |
| FPIS | 0,00; 0.03; 3.51 | 0.00; 0.18; 1.93 | 0.00; 0.24; 4.47 | 0.00; 0.10; 2.08 | 0.00; 0.15; 2.82 | 0.00; 0.26; 2.08 | |
| FNIS | 0.00; 0.02; 1.17 | 0.00; 0.09; 1.29 | 0.00; 0.12; 2.98 | 0.00; 0.07; 1.04 | 0.00; 0.06; 1.21 | 0.00; 0.07; 1.04 | |
Table 16.
Results of pro-quality decisions while considering environmental aspects obtained by FTOPSIS. Own study.
Table 16.
Results of pro-quality decisions while considering environmental aspects obtained by FTOPSIS. Own study.
| Product | Ranking | |||
|---|---|---|---|---|
| P1 | 3.28 | 1.51 | 0.32 | 5 |
| P2 | 2.30 | 2.55 | 0.53 | 2 |
| P3 | 1.39 | 3.41 | 0.71 | 1 |
| P4 | 2.70 | 2.13 | 0.44 | 3 |
| P5 | 3.20 | 1.55 | 0.33 | 4 |
Publisher’s Note: MDPI stays neutral with regard to jurisdictional claims in published maps and institutional affiliations. |
© 2021 by the authors. Licensee MDPI, Basel, Switzerland. This article is an open access article distributed under the terms and conditions of the Creative Commons Attribution (CC BY) license (https://creativecommons.org/licenses/by/4.0/).
Share and Cite
MDPI and ACS Style
Siwiec, D.; Pacana, A. Model Supporting Development Decisions by Considering Qualitative–Environmental Aspects. Sustainability 2021, 13, 9067. https://doi.org/10.3390/su13169067
AMA Style
Siwiec D, Pacana A. Model Supporting Development Decisions by Considering Qualitative–Environmental Aspects. Sustainability. 2021; 13(16):9067. https://doi.org/10.3390/su13169067
Chicago/Turabian StyleSiwiec, Dominika, and Andrzej Pacana. 2021. "Model Supporting Development Decisions by Considering Qualitative–Environmental Aspects" Sustainability 13, no. 16: 9067. https://doi.org/10.3390/su13169067
Note that from the first issue of 2016, this journal uses article numbers instead of page numbers. See further details here.