
Investigating the Determinants of Credit Spread Using a Markov Regime-Switching Model: Evidence from Banks in Taiwan


1
International Bachelor Degree Program in Finance, National Pingtung University of Science and Technology, 1, Shuefu Road, Neipu Pingtung 912, Taiwan
2
Department of Commerce Automation and Management, National Pingtung University, 51, Minsheng E. Rd., Pingtung City 900, Taiwan
*
Author to whom correspondence should be addressed.
Sustainability 2021, 13(17), 9535; https://doi.org/10.3390/su13179535
Submission received: 4 July 2021
/
Revised: 17 August 2021
/
Accepted: 20 August 2021
/
Published: 24 August 2021
(This article belongs to the Section Economic and Business Aspects of Sustainability)
Abstract
:In this study, we investigate the determinants of credit spread using a Markov regime-switching model. We consider corporate governance variables and credit risk to analyze the determinants of credit spread. The corporate governance mechanism is an indicator of company sustainability, and credit spread is the main factor in profits obtained by banks. However, the relationship between credit spread and corporate governance is seldom discussed. We focus on loans from banks in Taiwan between 2000 and 2019 and apply a Markov regime-switching model, which is superior to other models in capturing different effects in various regimes. We specify two regime types: corporate governance and credit risk regimes. Furthermore, we consider four aspects of corporate governance: firm ownership structure, board structure, deviation, and information environment. In this study, the determinants of credit spread are investigated more thoroughly than in previous studies. Moreover, in this study, we examine the effects of monetary policy and economic status on credit spread using a Markov regime-switching model; such models are not employed to their full extent in related studies of credit spread. Empirical results indicate that credit spread has different effects in various regimes. Thus, understanding the determinants of credit spread in different regimes is crucial for financial analysts, investors, economic policymakers, and banks. Consequently, we expect that this study can improve the management and measurement of credit risk and be of value to financial institutions.
1. Introduction
Recently, credit risk management has played a major role in bank administration and has been a major topic of concern for banks and other financial intermediaries. According to the Basel Capital Accord, banks are required to develop an effective credit review process to measure the credit risk of their loans. In the past 10 years, major developments in financial markets have led to a more sophisticated approach to credit risk management. Numerous banks apply credit spreads to assess credit risk, credit rationing, and macroeconomic effects in financial markets. Generally, changes in credit market conditions occur prior to considerable changes in the stock market and the economy as a whole. Credit spread in the credit market has experienced considerable growth in the past two decades and it is expected to grow rapidly in the next few years. Therefore, an understanding of the determinants of credit spread is particularly vital and can assist banks in extracting more precise information about loans and detecting when borrowers face financial difficulty.
Several explanations might elucidate credit spread. Some studies employed macroeconomic and financial variables as candidate proxies to measure determinants of credit spread [1,2,3,4]. For example, Collin-Dufresne and Goldstein [5] followed the structural form model to predict credit spreads. Campbell and Taksler [6] suggested that credit spreads increase in conditions of equity volatility. Van Landschoot [7] contended that credit spreads strongly depend on the rating and maturity of a bond. Maalaoui Chun et al. [8] used the equity index return volatility to investigate credit spread changes.
Conversely, Chava et al. [9] and Klock et al. [10] found that firms with superior corporate governance are associated with lower debt financing costs. A firm’s information environment considerably affects its credit spreads [11,12,13]. Lu et al. [14] examined the relationship between information asymmetry and credit spreads on corporate bonds. Zhou et al. [15] found that sound corporate governance is associated with lower credit spreads on corporate bonds. Corporate social responsibility can reduce credit spreads significantly [16].
Several adverse economic events, including the Asian currency crisis in 1997, the Enron scandal in 2001, the WorldCom scandal of 2002, and the series of 2004 financial scandals involving publicly listed Taiwanese companies (such as Procomp Informatics, NAFCO, Summit Computers, Infodisc, and ABIT Computers), were all results of failed corporate governance. Acts of embezzlement and financial misinformation committed by senior executives not only resulted in stock market devaluations but also undermined investors’ confidence in the capital market. Corporate governance is an indicator of a company’s sustainability. Thus, a firm’s corporate governance is expected to significantly affect its credit and loan rate. The purpose of this study is to examine the influence of corporate governance on bank loan credit spread. The relationships between corporate governance variables and credit spreads of bank loans are seldom discussed.
This study focuses on loan markets in Taiwan from 2000 to 2019. The difference between the loan rate and risk-free rate is credit spread, which is a key indicator for assessing credit risk. Hence, different credit spreads of different borrowers indicate the relative debt risk. We divide this study sample into two categories. The first category was used to explore whether banks belong to financial holding companies. In Taiwan, the Financial Holding Company Act was signed into law in June 2001. A financial holding company is a bank holding company that offers nonbanking financial services. The second category was used to explore whether banks are controlled by the government bodies. In Taiwan, bank privatization did not begin until 1998. However, the development of bank privatization was rapid after the Asian crisis, and four government banks were privatized in January 1998. Although some government banks were privatized, these banks are still majority-controlled by the government. Thus, we divide the sample into two categories: whether banks belong to financial holding companies and whether banks are controlled by the government. First, we use the two groups to investigate the determinants of banks’ credit spread. Then, we consider the effects of monetary policy and economic status on determinants of credit spread.
For the methodology, we apply a Markov regime-switching model; such models are more flexible than are single-regime models. Empirical studies of credit spread determinants are based on a single-regime regression model over the entire sample period. Only Maalaoui Chun et al. [8] used a Markov regime-switching model to analyze the dynamics of credit spreads in bonds, and they discovered that a single-regime model cannot fully capture the phenomenon of credit spread determinants. Regime-switching models are a critical class of financial time series models that can incorporate the structural changes associated with economic and financial conditions. These parameters are functions of a Markov chain and key model features. The first conception of Markov regime-switching models is credited to Quandt [17]. Goldfeld and Quandt [18] later introduced a particularly useful version of these models and applied it to housing markets. Hamilton [19] was the first to apply regime-switching models in economics and econometrics, discovering regime shifts from positive to negative growth rates in real GNP for postwar business cycles in the United States. Moreover, regime-switching models are applied in finance. Hamilton and Lin [20] suggested that economic recessions are a critical factor explaining pivotal economic moments. Pliska [21] and Elliott et al. [22] applied regime-switching for short-rate models. Elliott and Hinz [23] did so for analyzing portfolios. Naik [24], Guo [25], and Elliott et al. [26] did so for option valuation. Elliott et al. [27] did so for volatility estimation. In this study, we use a Markov regime-switching model to assess determinants of credit spreads and the effects of monetary policy and economic status on determinants of credit spread.
The interaction between good practices of corporate governance and credit spread has not been extensively analyzed, and the effect of monetary policy and economic status on credit spread has not been studied in depth. This study offers three contributions. First, we analyze determinants of credit spreads involved with bank loans based on credit risk and corporate governance, topics which are seldom discussed in the literature. For example, some researchers [3,4,28,29] used macroeconomic factors to examine credit spread. The impacts of corporate governance on credit spreads are rarely discussed. Although Zhou et al. [15] examined the effects of corporate governance on credit spreads, they considered some variables of corporate governance. In this study, we employ four aspects of corporate governance that are more comprehensive than those found in the literature. Second, we apply the Markov regime-switching model, which precisely capture determinants and changes in credit spreads of banks loans. Most studies of credit spread determinants apply linear regression model, i.e., single-regime regression model, such as those of Collin-Dufresne and Goldstein [5] and Zhou et al. [15]. However, we find that corporate governance effects are different in high and low regimes. Consistent with Maalaoui Chun et al. [8], we find that the Markov regime-switching model is more appropriate than previous studies. The model can capture hidden effects in different regimes and increase explanatory power. Finally, we investigate how credit spread changes affected by monetary policy and economic status. De Moraes et al. [30] indicated that monetary policy has positive effects on credit spreads. However, they did not consider different effects across different regimes. For different regimes, we find that monetary policy and economic status have different effects on credit spread. We believe this study can help managers improve loan decision making and investors can manage their financing cost more efficiently. Furthermore, for policymakers, they have to consider the impacts of different regimes when they want to formulate policies.
This article consists of five sections. In Section 1, we provide an overall description of the research background, purpose, and content. In Section 2, we describe the determinants of credit spread. In Section 3, we describe the research period, sample source, and methodology. In Section 4, we provide an analysis of the empirical results. In Section 5, we offer the findings and a conclusion.
2. Determinants of Credit Spread
2.1. Credit Spread Definition
For banks, credit spread can be an indicator of the profitability or risk premium related to a lender providing a loan to an individual borrower. The credit spread accounts for the maturity, liquidity, credit risk, and creditworthiness of borrowers. In this study, credit spread is defined as the difference between the loan rate and risk-free rate.
2.2. Determinants of Credit Spread
In Taiwan, some listed companies, including Procomp Informatics, NAFCO, Summit Computers, Infodisc, and ABIT Computers went bankrupt as a result of failed corporate governance. International organizations such as the Organization for Economic Co-operation and Development and World Bank have emphasized corporate governance as a means of improving financial transparency and restoring investor confidence in corporate financial statements. In Taiwan in 2002, the Financial Supervisory Commission issued a new decree for listed companies to improve their corporate governance mechanisms. Corporate governance pertains to the manner in which a company’s activities are managed and supervised. A company with good corporate governance can prevent and minimize agency conflicts so that investor and shareholder interests are addressed reasonably and fairly.
Researchers [11,12,13] have suggested that a firm’s information environment significantly affects its credit spread. Zhou et al. [31] suggested that robust corporate governance may help reduce the credit spreads of corporate bonds, arguing that corporate governance plays a crucial role in reducing agency conflicts between management and stakeholders and in reducing credit spread. Effective corporate governance promotes the sustainability of the company. In general, we expect that banks will reduce the credit spreads of firms with good corporate governance by improving firms’ performance or reducing risk. The relationship between credit spreads and corporate governance will be further illustrated by the following four aspects. Therefore, in the following sections, we consider four aspects of corporate governance: a firm’s (A) ownership structure, (B) board structure, (C) deviation, and (D) information environment.
2.2.1. Ownership Structure (Aspect A)
Ownership structure is determined by the company shareholding ratio, such as the holdings of major shareholders. Goergen and Renneboog [32] revealed that the shareholding ratio of directors and supervisors affects company cash flow—the larger the proportion of shares held by directors and supervisors, the more efficient the company supervision and the fewer errors there are in managers’ investment decisions. Pindado and Torre [33] suggested that when the level of equity held by directors and supervisors is higher, investment decision making is more efficient. The proportion of shares held by directors and supervisors is significantly and positively correlated to their management performance. Jensen and Meckling [34] also reported that when directors and supervisors own a greater proportion of shares, they review managers’ investment decisions carefully, and thus the investment decisions do not deviate from the principle of maximizing shareholder value.
Agrawal and Mandelker [35] contended that when a company’s equity ownership is concentrated among major shareholders or institutional investors, managers are subject to more stringent supervision. However, Dahlquist and Robertsson [36] suggested that the preference for foreign investment is lower when equity concentration is higher. In other words, foreign investors prefer companies with dispersed equity. Claessens et al. [37] reported that if managers are major shareholders or if the major shareholders’ control right is greater than the cash flow right, the goals of major shareholders may be opposite to those of minority shareholders. La Porta et al. [38] observed that in countries with poor shareholder protection, the main problem arising from ineffective corporate governance is the conflict between large and small shareholders.
Fama and Jensen [39] argued that managers often make investment decisions that harm shareholders’ wealth to maximize their own interests. Jensen and Ruback [40] provided the “entrenchment hypothesis”, that is, when a manager’s shareholding ratio is high, the investment losses are borne by shareholders. Managers have incentive to gain profits. However, some studies suggest that when the ratio of managers’ shareholding increases, no conflict occurs between managers and shareholders, and managers do not make investment decisions detrimental to shareholders. For example, Jensen and Meckling [34] discussed “the convergence of interest hypothesis”, contending that the higher is the equity held by the manager, the greater is the consistency between the interests of the manager and shareholders. Fuerst and Kang [41] observed that the higher is a general manager’s shareholding ratio, the lower is the prevalence of agency problems, which thereby improves the company’s operating performance. Furthermore, Zhou et al. [15] also found the negative relation between shareholding ratio of manager and credit spreads.
The practice of share collateral has become a global phenomenon in capital market. The directors and supervisors can pledge their shares as collateral to borrow funds. Some studies [2,42,43,44] indicated that the director pledge ratio has a significant negative impact on firm performance and may lead to financial crisis. As mentioned in the previous section, we apply four variables as proxies for this first aspect of ownership structure, which are summarized as follows:
A1: the shareholding ratio of directors and supervisors
A2: the shareholding ratio of major shareholders
A3: the shareholding ratio of management
A4: the percentage of shares collateralized or pledged by directors and supervisors.
2.2.2. Board Structure (Aspect B)
Fama and Jensen [39] suggested that a company’s board has two functions: decision making management (e.g., management of operations, investment, and financing) and decision making control (e.g., supervising the behavior of managers and the quality of financial reporting). Several studies indicated that having independent directors can reduce agency problems between managers and shareholders or other interested parties and improve the decision making quality of the board of directors [45,46,47]. Williamson [48] proposed the “substitute hypothesis,” which suggests that the ratio of independent directors on the board of directors should be sufficiently high to avoid large shareholders infringing on the interests of small shareholders. In addition, the independent directors should themselves have sufficient incentive to meticulously oversee financial reporting and accounting disclosures to maintain their professional reputational capital [49].
The board of directors is a key component of the corporate governance mechanism. The responsibility of the board of directors is to supervise managers. The supervision effect of the board of directors influences a company’s performance and operations. The size of the board is a central factor in corporate governance. In summary, the size of the board should be appropriate to fulfill its functions.
Bacon [50] concluded that large-scale boards are more efficient than small ones because directors have diverse knowledge, prior experience, technological proficiency, and views on business decisions. Zahra and Pearce [51] suggested that a large board is a characteristic of a sophisticated organization that can avoid the malpractices caused by collusion between managers and board members and have high board supervisory effectiveness. Zhou et al. [15] indicated negative effects of board size on credit spreads. It means that a large board of directors can fulfill a supervisory function. Moreover, the board of directors can be more neutral in evaluating and monitoring managers.
However, Jensen [52] found that a larger board size leads to poor efficiency due to communication problems; effective decision making is difficult when a board is large. Yermack [53] surveyed the data of 452 listed companies in the United States from 1984 to 1991 to measure company performance based on Tobin’s q, discovering that members of a small board size can more effectively supervise managers than can members of a large board; hence, board size and company performance are negatively correlated. In summary, we apply two variables, defined as follows, as the proxies for evaluating board structure (aspect B):
B1: The percentage of independent directors, which is measured by independent director seats relative to total board seats.
B2: The number of board members, including ordinary directors, managing directors, and independent directors.
2.2.3. Deviation (Aspect C)
The authors of some studies [38,54,55] concluded that a shareholder is more likely to gain control rights at the expense of minority shareholders when the deviation between its control and its cash flow rights is greater, thereby creating agency conflicts. Chen et al. [56] suggested that share collateralization is a source of a deviation in the relationship between cash flow rights (cash dividends) and control rights (voting rights); although the shareholders pledge their shares as collateral, they still maintain control rights (voting rights). However, the after ex-dividend stock price falls as a result of cash dividends. In other words, if the value of collateralized shares falls, cash flow rights may be lost due to share collateral value losses. Lee and Yeh [43] reported that the probability of a financial crisis in the next year is higher when the deviation between voting rights and cash flow rights is greater. Lee et al. [44] reported that collateralization of director or supervisor shareholdings has a positive relationship with the deviation between cash flow rights and ownership control rights. We expect these variables have effects on credit spreads through improving or deteriorating firms’ performance and risk. Consequently, we apply three deviation-related variables as follows:
C1: Deviation between earnings control and ownership control
C2: Deviation between earning control and board seat control
C3: Deviation between ownership control and board seat control
2.2.4. Information Environment (Aspect D)
Financial information transparency is a practice of effective corporate governance. Li [57] emphasized the importance of in improving the disclosure of reliable information in effective corporate governance. Yu [13] found that companies with better information disclosure have lower credit spreads. Lu et al. [14] and Zhou et al. [15] all supported the notion that information asymmetry has a negative impact on credit spreads. Some studies find that corporate governance and information transparency are related. The basic principle of sound corporate governance is that information transparency must be honest, reliable, and transparent. Diamond and Verrecchia [58] and Black et al. [59] both concluded that corporate information disclosure and transparency can reduce the financing cost of capital and can used as an indicator of corporate governance quality.
Given this conception of corporate governance and the importance of transparency, verification of the causal relationship is warranted. Hence, the following variables can be formulated as follows:
D1: Dummy variable equal to one if financial statements are restated in the current year and zero otherwise.
D2: Number of CPA changes in three years.
D3: Dummy variable equal to one for producing financial projections or zero otherwise.
2.2.5. Credit Risk and Credit Spread
Most related studies use credit risk to investigate credit spreads. Aside from an investigation of corporate governance, this study uses credit default risk to investigate credit spreads. For example, the structural form models, as formulated by Black and Scholes [60] and Merton [61], are used to derive determinants of credit spreads. The structural form model assumes that the firm value process follows a geometric Brownian motion under certain stylized assumptions and has a fixed default threshold equal to the face value of promised payments. Furthermore, the basic Merton model is subsequently extended by removing one or more of Merton’s assumptions [5,62,63,64,65,66,67].
The reduced form model makes no assumptions regarding the capital structure of borrowers. Calibration of the credit risk for reduced form models is applied with respect to ratings agencies’ data. Many researchers [68,69,70,71,72] used credit ratings as a basis for assessing credit risk. Their key purpose is to provide a simple qualitative classification of the solidity, solvency, and prospects of a debt issuer. Van Landschoot [7] ascertained that credit spreads strongly depend on the rating and maturity of a bond. The rating data are composite Moody’s and Standard & Poors ratings. Hung et al. [73] employed the rating data of Taiwan, Taiwan Corporate Credit Risk Index (TCRI), to evaluate credit risk of corporate bond in Taiwan. Huang and Kuo [74] also used the rating data of Taiwan, TCRI, to analyze relation between firms’ rating and credit spreads. They found that if the borrower’s risk increases, banks will increase the lending spreads. On the contrary, the banks will reduce the credit spreads when the borrower’s credit rating is upgraded. Ratings are increasingly crucial because pending new banking regulations will use ratings as a key input for calculating banks’ capital requirements. Hence, in this study, ratings data are used to assess credit spread.
3. Methodology
3.1. Markov Regime-Switching Model
First, we introduce credit spread regressions with a single regime. The single-regime model herein is a multivariate regression model. That is, we interpret the aforementioned determinants of credit spread as independent variables to explain the dependent variable, credit spread. Then, we construct a regression based on the Markov regime-switching model.
The single-regime regression model is as follows:
where denotes the credit spread of loan i in period t. is a constant, is k independent variables, and refers to the random error term. The independent variables are credit risk and corporate governance. Regarding corporate governance, we consider four aspects: the firm’s (A) ownership structure, (B) board structure, (C) deviation, and (D) information environment. For credit risk, we use the Taiwan Corporate Credit Risk Index (TCRI) as the proxy. For ownership structure (aspect A), we adopt four variables: shareholding ratio of directors and supervisors, shareholding ratio of major shareholders, shareholding ratio of management, and percentage of shares collateralized or pledged by directors and supervisors. The board structure aspect (aspect B) has two variables: percentage of independent directors and the number of board members. The deviation aspect (aspect C) has three variables: the deviation between earnings control and ownership control, the deviation between earning control and board seat control, and the deviation between ownership control and board seat control. Finally, the information environment aspect (aspect D) has three variables: whether financial statements are restated, the number of CPA changes in three years, and whether financial projections are produced.
Following Hamilton [19], we consider that is affected by two unobservable regimes as
where Because St cannot be observed directly, a Markov chain must be used to facilitate calculation. The realized value of the random variable St can be defined by the two-regime (i = 0, 1 and j = 0, 1) Markov chain transition probability matrices and as follows:
where , i, j = 0, 1. The probability of an realized value is decided by the regimes generated by the previous transaction day (t–1). Hence, the probability value of the regime 0 (or 1) from the current transaction day to the next transaction day is (or ).
We apply the log-likelihood function to assess parameters, as follows:
The density probability function is defined as follows:
We estimate the unknown parameters in Equation (4) using the maximum log-likelihood function via EM algorithm, which is proposed by Hamilton [75].
3.2. Effects of Monetary Policy and Economic Status
We investigate the effects of monetary policy and economic status on credit spreads. We consider regime specifications from two aspects: monetary policy and economic status regime. We describe the two regime specifications as follows.
- Monetary policy regime
We adopt M2 as the measure of monetary resources that include all elements of M1 as well as “near money.”
- 2.
- Economic status regime
The leading indicator is a measurement of changes of economic status. In general, leading indicators are used to predict economic changes.
First, we estimate the Markov regime-switching model on data regarding changes in money supply and the leading indicator to reveal the monetary policy and economic status regimes, respectively. Consistent with Maalaoui Chun et al. [8], the dummy variable is set as equal to one or zero according to whether the smoothed probability is above or below the cutoff point of 0.5. We analyze the effects of monetary policy and economic status regarding the aspects of corporate governance and credit risk. In the example of ownership structure (aspect A), the equation is as follows:
where dv is a dummy variable. We assume the monetary policy and economic status follow a Markov process and that whether the dummy variable equals one or zero is in accordance with the smoothed probability of monetary policy or economic status being above or below the cutoff point of 0.5. Thus, Equation (5) is nonlinear as
In Low-regime:
In High-regime:
4. Empirical Results and Analysis
4.1. Data
In this study, we selected 24 banks in Taiwan as the sample and extracted quarterly data for the 20 years from 2000 through 2019. The details of these banks are summarized in Table A1 in the Appendix A. All data are sourced from the Taiwan Economic Journal (TEJ). Some data are removed due to insufficient size or incompleteness.
For credit spread, most studies [7,73] defined credit spread is the difference between the yield on a risky bond and the yield on a risk-free bond. Compared with previous studies that focused on credit spreads of bonds, this study is focused on banks’ credit spreads. However, the characteristics of bank loans are not the same as those of bonds. In general, bonds have certain maturity date, but the maturity date of bank loans is more complicated than that of bonds. For example, borrowers often apply for early repayment or rollover loan transactions or change of loan content, so the maturity date of bank loans will be uncertain. Therefore, the treatment of credit spreads is a little different from previous studies. This study uses the treasury bill’s interest rate closest to the lending date as the risk-free rate. Then, we employ differences between the loan rate and risk–free rate as credit spreads. The loan rates are obtained from the long- and short-term bank loan database of the TEJ, which contains records pertaining to debts of all corporations in Taiwan, including names of lenders and borrowers, rates of debt, and debt issuance dates. We could obtain detailed information on bank loans from this database. Since the sample of this study is medium- and long-term loans, the short-term loans and incomplete data are deleted.
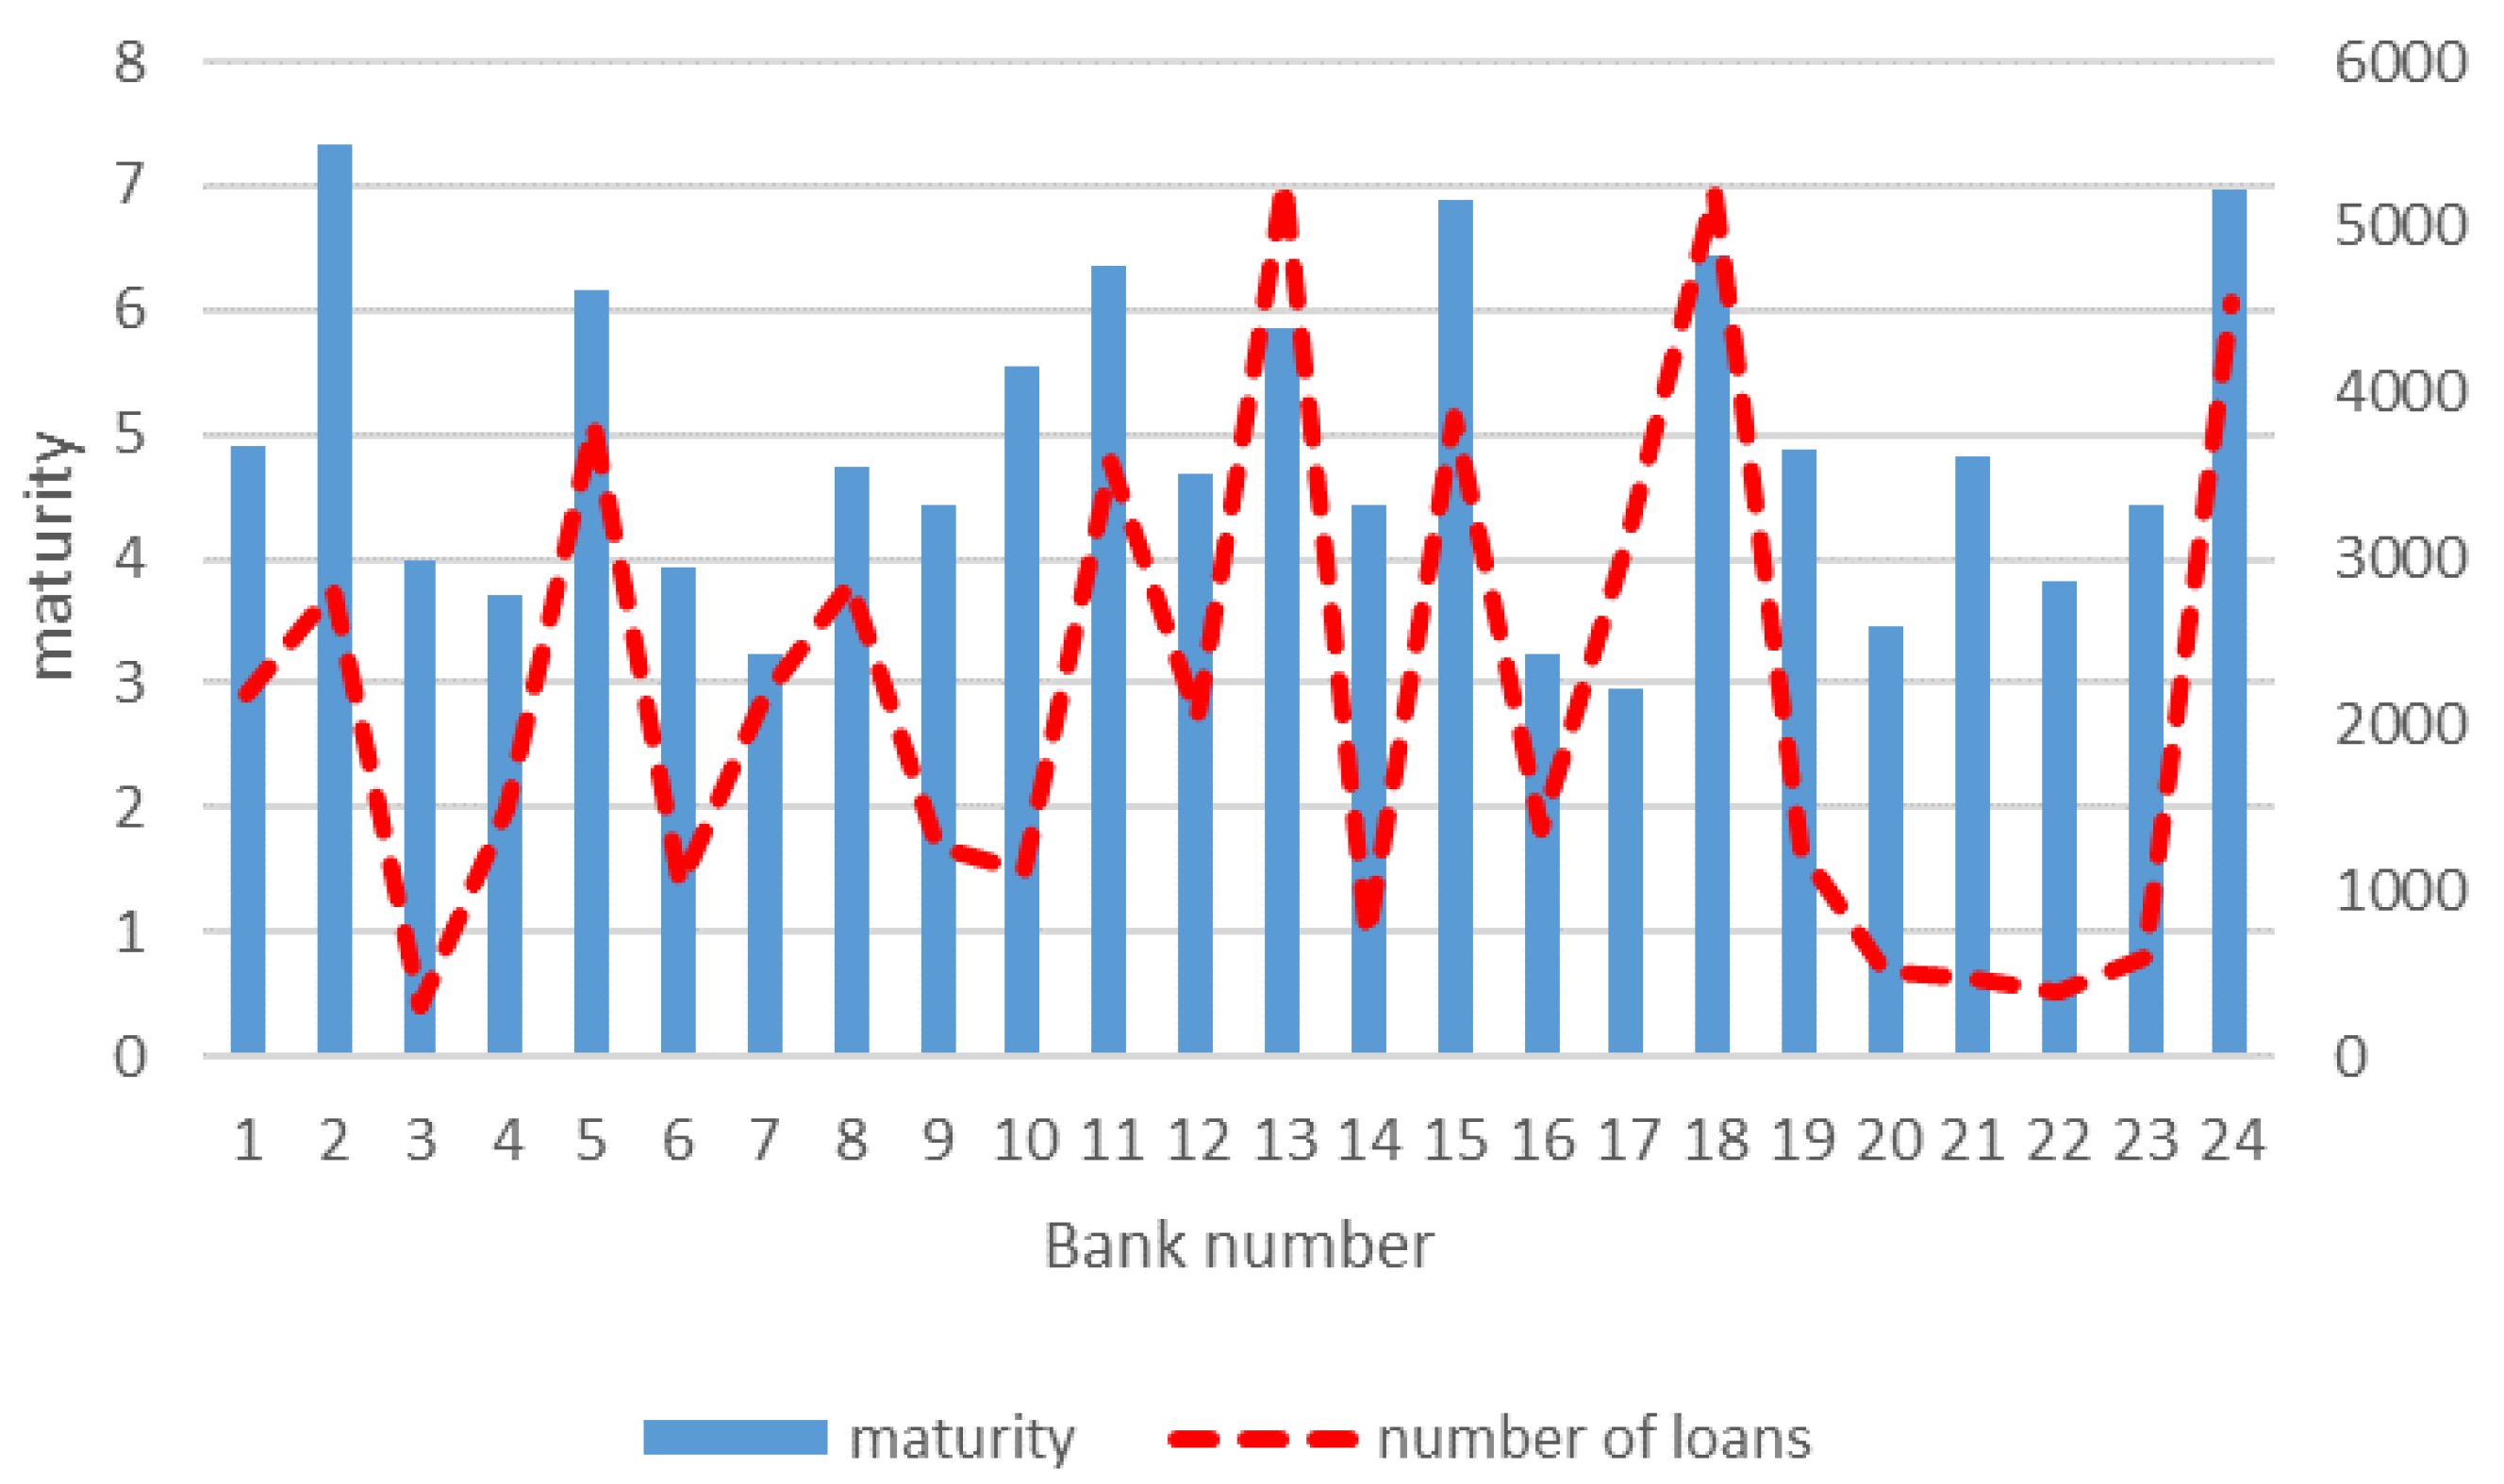
Figure 1 summarizes the average maturity of loans and the number of loans for 24 banks. The left vertical axis represents the average maturity and the right vertical axis is the number of loans. The bar graph and dotted line mean the maturity and number of loans, respectively. The average maturity for these banks is about five years. The longest average maturity is over seven years for Bank 2. Bank 17 has the shortest average maturity of approximately three years. Since the size of the bank and the time of establishment are different, there are differences in the number of loans from various banks. For example, Bank 18 is a long-established and large-scale bank in Taiwan; thus, it has a larger number of lenders. However, Bank 22 is one of the small commercial banks in Taiwan, so the number of loans is relatively small.
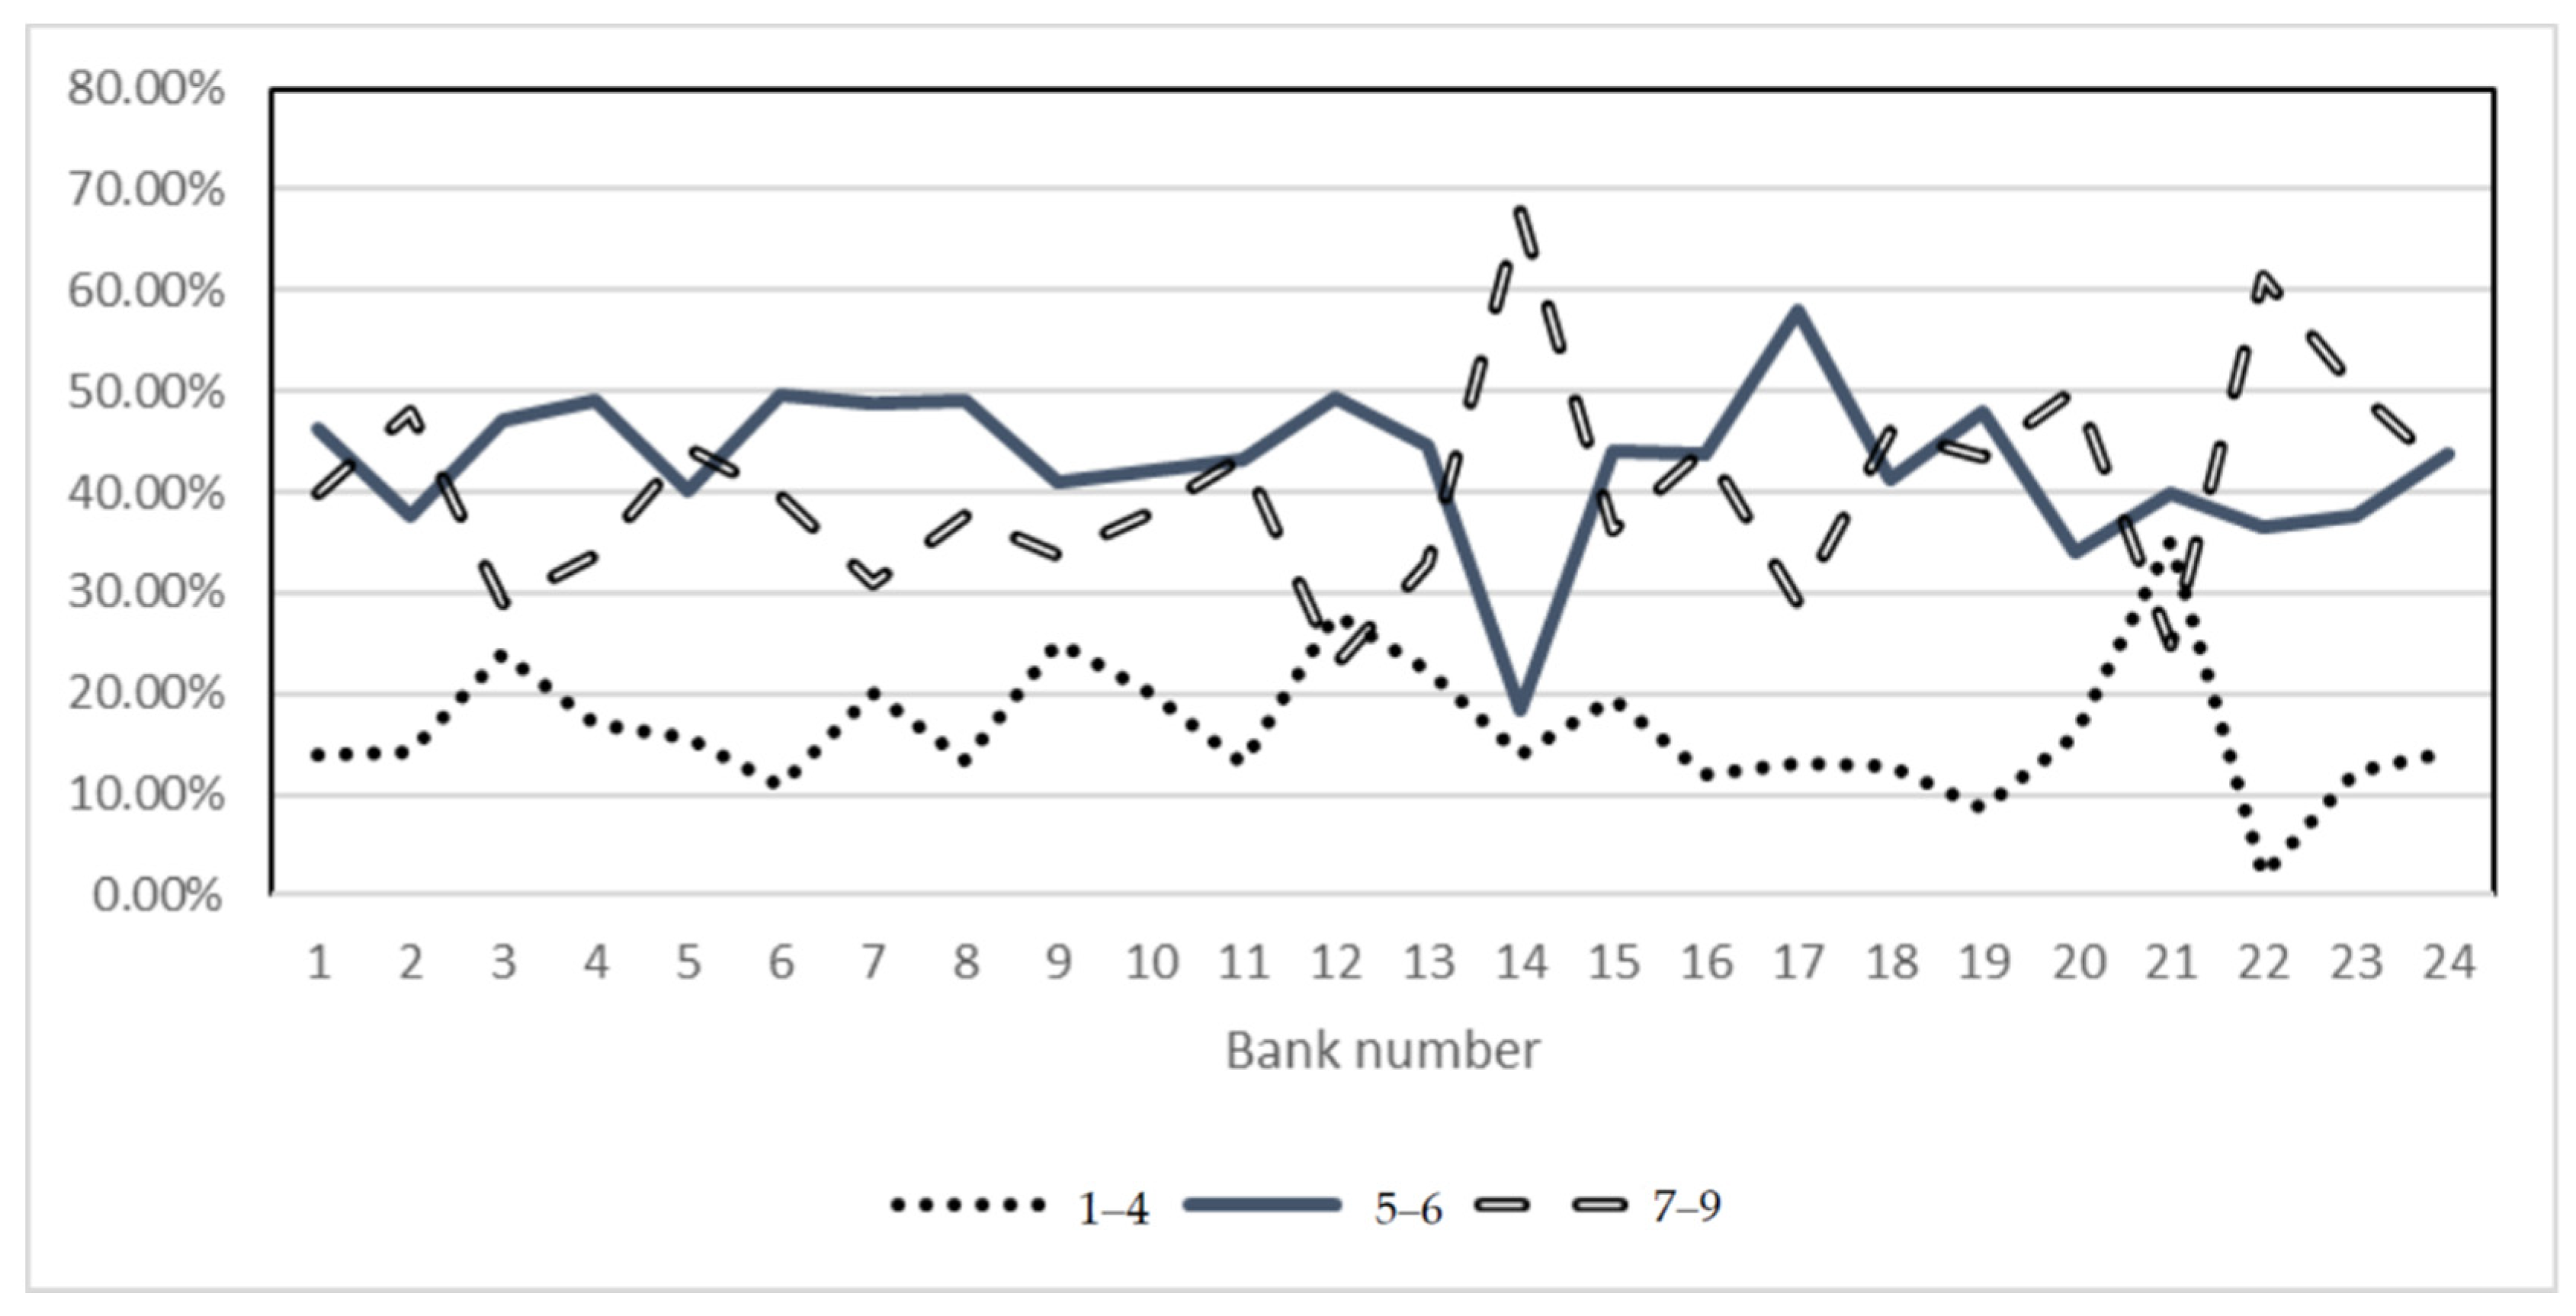
Since this study investigate borrowers’ credit risk, this study applies TCRI as the proxy of borrowers’ credit risk. TCRI is obtained from TEJ (Taiwan Economic Journal), which is the largest local financial information company in Taiwan. TCRI only gives ratings to public offering companies but excludes the banking and securities industries. It is the main indicator for banks to make loans. TCRI measures borrowers’ credit ratings from their available accounting data and other publicly available information. The TEJ applies numerical ratings from 1 to 9 as well as a potential D class for each borrower. The ratings pertain to default risk and the likelihood of payment for each borrower. A rating of 1 is generally considered to represent the lowest rating in terms of default risk, a rating of 9 represents the riskiest borrowers, and the rating class D denotes a default borrower. Following the TEJ, a risk rating of 1–4 indicates low risk, 5–6 indicates medium risk, and 7–9 indicates high risk. Hence, we adopt TCRI as the proxy for default risk. The rating distribution of 24 banks is shown in Figure 2. According to TEJ, Figure 2 has three groups: low risk (rating 1–4), medium risk (rating 5–6), and high risk (rating 7–9). The vertical axis is the percentage of the grade to all borrowers’ ratings. Compared with other banks, the borrowers of Bank 14, Union Bank, are more concentrated in high risk rating class, exceeding 60%. Compared to other banks, borrowers of Bank 21, The Export–Import Bank of the Republic of China, are more likely to be in the low risk rating. The reason is that Bank 21 is a government controlled bank and has a more conservative lending strategy.
To discuss the effect of monetary policy, we apply the monetary aggregate M2 as an indicator for monetary policy. M2 is a measure of the money supply that includes all elements of M1, such as cash and checking deposits. Near money refers to savings deposits, money market securities, mutual funds, and other time deposits. M2 is a broader money classification, which comprises the sum of currency outside banks, demand deposits other than those held by central government, and the time, savings, and foreign currency deposits of residential sectors (other than the central government). Heryán and Taeremes [76] applied the monetary aggregate M2 as the measurement for monetary policy.
To discuss the effects of economic status, we use the trend-adjusted index of the composite coincident index to represent the economic status. The data are from the Council for Economic Planning and Development (CEPD) in Taiwan. The CEPD is responsible for drafting overall plans for national economic development, evaluating development projects, coordinating the economic policymaking activities of ministries and agencies, and monitoring the implementation of development projects, measures, and programs.
4.2. Empirical Results
4.2.1. Single-Regime Regression Model
First, this study shows the correlation coefficients of 12 corporate governance variables in Table 1. In general, a correlation coefficient that exceeds 0.7 in absolute terms is called high correlation. From this table, we find that the absolute values of correlation coefficients do not exceed 0.7, which is not highly correlated. Thus, multicollinearity problems can be avoided during regression analysis.
Then, we calculate the parameters based on the single-regime regression model, which is detailed in Table 2. We use two rules to classify the sample. The first pertains to whether the sample belongs to a financial holding company. For the first classification method, the results are shown in the third and fourth columns of Table 2. The second classification method explores whether a bank is controlled by the government bodies; the relevant results are listed in the fifth and sixth columns of Table 2. We observe that most aspects of corporate governance (aspects A–D) and credit risk have significant effects on credit spread, except for the component pertaining to financial statements being restated (D3). Because Taiwan’s banking industry is strictly supervised by the government, banks offer fewer restated financial statements.
For aspect A, we find that most results are consistent with previous studies. For example, the shareholding ratio of directors and supervisor has a significant and negative sign for all groups. Investment decision making is more efficient when the shareholding ratio of directors and supervisors is higher [32,33,34]. Thus, the banks charge low credit spreads. Similar results are also found in the shareholding ratio of major shareholders. The results are consistent with those of Agrawal and Mandelker [35]. However, the shareholding ratio of management is positive and has significant effects on credit spreads. This is consistent with the “entrenchment hypothesis” of Jensen and Ruback [40], but it is inconsistent with the “convergence of interest hypothesis” of Jensen and Meckling [34].
For aspect B, the percentage of independent directors and the number of board members have significantly negative effects on credit spreads. This is in line with the “substitute hypothesis” of Williamson [48]. The ratio of independent directors can reduce the agency problem and improve a firm’s performance. Thus, the banks reduce credit spreads.
For aspect C, this study finds that the deviation between earnings control and ownership control has a significant positive effect on credit spread. This finding is consistent with those of related studies that indicate that if the deviation between ownership control rights and earnings control rights increases, the agency problem will become more serious [55,77,78,79,80]. Thus, banks charge high credit spreads for borrowers with higher deviation of earnings control and ownership control. However, results of the other two deviations are not all significant and not consistent with previous studies.
For aspect D, we find that only the variable, whether company produce financial projections, has a significantly positive effect on credit spread. It means that financial projections do not contribute to decreasing financing costs and banks will still charge high credit spreads. Lee et al. [44] found a negative relationship between information disclosure and firms’ performance. On the contrary, the results are inconsistent with those of related studies [58,59] that indicate information disclosure can reduce financial cost. However, results of the other two variables are not all significant and inconsistent with previous studies.
4.2.2. Markov Regime-Switching Model
Because the single-regime model is similar to an ordinary least squares regression model, the estimated coefficient is the concept of average. Therefore, we extend the single-regime model to a two-regime model in the form of a Markov regime-switching model, and the estimated coefficients are shown in Table 3, Table 4, Table 5, Table 6 and Table 7. To observe the influence of two regimes in each aspect, Table 3, Table 4, Table 5, Table 6 and Table 7 detail such two regimes for each corporate governance aspect.
In Table 3, the credit risk is observed to have a significant and positive effect on credit spread in both low and high regime scenarios for all groups. As credit risk increases, the bank charges a higher credit spread to ensure profitability and security. This finding is consistent with the finding of Van Landschoot [7]. In this study, we employed the TCRI rating score as the proxy of credit risk. The value of the TCRI rating class is between 1 and 9, and D is default. A small number means better ratings, and thus better creditworthiness. From Table 3, we find that for a firm with high TCRI rating score, the high credit spread will be charged. In other words, banks increase credit spread if the borrower with high TCRI rating scores.
In Table 4, we specify the regime in terms of ownership structure. Different opinions exist regarding ownership structure and credit spreads are related to whether banks belong to a financial holding company. If banks belong to a financial holding company, they will charge a high credit spread for companies’ ownership structures in high regime. However, for the second question—whether banks are controlled by the government bodies—we obtain different results. When borrowers borrow from banks with low ownership structures in a low-regime setting, banks charge a high credit spread. Comparing Table 2 and Table 4, only the results of banks not belonging to financial holding companies in high regime are consistent with Table 2. Not all other groups are consistent with Table 2. For example, in low regime, banks belong to a financial holding company violate the “entrenchment hypothesis” of Jensen and Ruback [40]. Instead, they will follow the “convergence of interest hypothesis” of Jensen and Meckling [34]. Therefore, the Markov regime-switching model can capture the hidden effects and managers adjust their lending decision based in different regimes.
Table 5 specifies the regimes in terms of board structures. For the second question—whether banks are controlled by the government bodies—the view of board structure is the same. However, banks have different views on independent directors in high and low regimes. In related studies, independent directors are considered to be beneficial to a company’s performance, and the results are found for the second category in low regime [45,46,47]. However, in high regime, results are inconsistent with related studies. This result implies that independent directors will lose their supervisory function in a high regime. Then, banks charge high credit spreads. Furthermore, we show for banks owned and not owned by financial holding companies that banks’ managers have differing views on ratio of independent directors in the high regime scenario. For banks owned by financial holding companies, the independent directors are observed to have positive effects on credit spreads. However, for banks not owned by financial holding companies, the independent directors are negatively related to credit spreads. The results are consistent with the “substitute hypothesis” of Williamson [48]. Overall, it is beneficial to use the Markov regime-switching model to account determinants of credit spreads in different regimes.
Table 6 specifies the regimes in the context of deviation. The deviation between earnings control and ownership control is positive and significant for all cases. Our results are consistent with related studies, such as that of Lee et al. [44], in which it is reported that deviation is higher when there is greater serious agency conflict. Thus, banks charges high credit spreads to compensate for uncertainty. Comparing Table 2 and Table 6, we determine that the single single-regime model cannot fully measure the effects of the other two deviations, whereas the Markov regime-switching model can capture hidden effects. As Maalaoui Chun et al. [8] stated, the regime-switching model is beneficial for investigating determinants of credit spreads in different regimes.
Table 7 specifies the regimes in relation to a firm’s information environment. As far as different categories are concerned, our results indicate that some findings are consistent with related studies while others are inconsistent. Regardless of whether a bank belongs to a financial holding company, their decision on credit spreads is approximately the same in low regime. The results are consistent with Lee et al. [44], who find that information disclosure has a negative effect on firms’ performance, such as ROA and ROE. For such cases, banks charge high credit spreads. However, for the second category, different regimes of a firm’s information environment are marked by different decisions of banks’ managers on credit spreads. For government-controlled banks, results in low regime are consistent with those of Lee et al. [44]. On the contrary, results of high regime have different signs relative to results of low regime. Results are consistent with those of Diamond and Verrecchia [58], Black et al. [59], and Li [57].
Overall, the Markov regime-switching model can help us to find the hidden effects in different regimes. Furthermore, the model can enhance explanatory power of effects of corporate governance and credit risk on determinants of credit spreads. As Maalaoui Chun et al. [8] stated, the model is better than the single-regime model to investigate determinants of credit spreads.
4.2.3. Effects of Monetary Policy and Economic Status
First, we compare the two-regime models with a single-regime model using the likelihood ratio test. The null and alternative hypotheses are the single-regime model and Markov regime-switching model, respectively. The test result is detailed in Table 8; we find that the Markov regime-switching model is superior to single-regime models. The test result is consistent with that of Maalaoui Chun et al. [8].
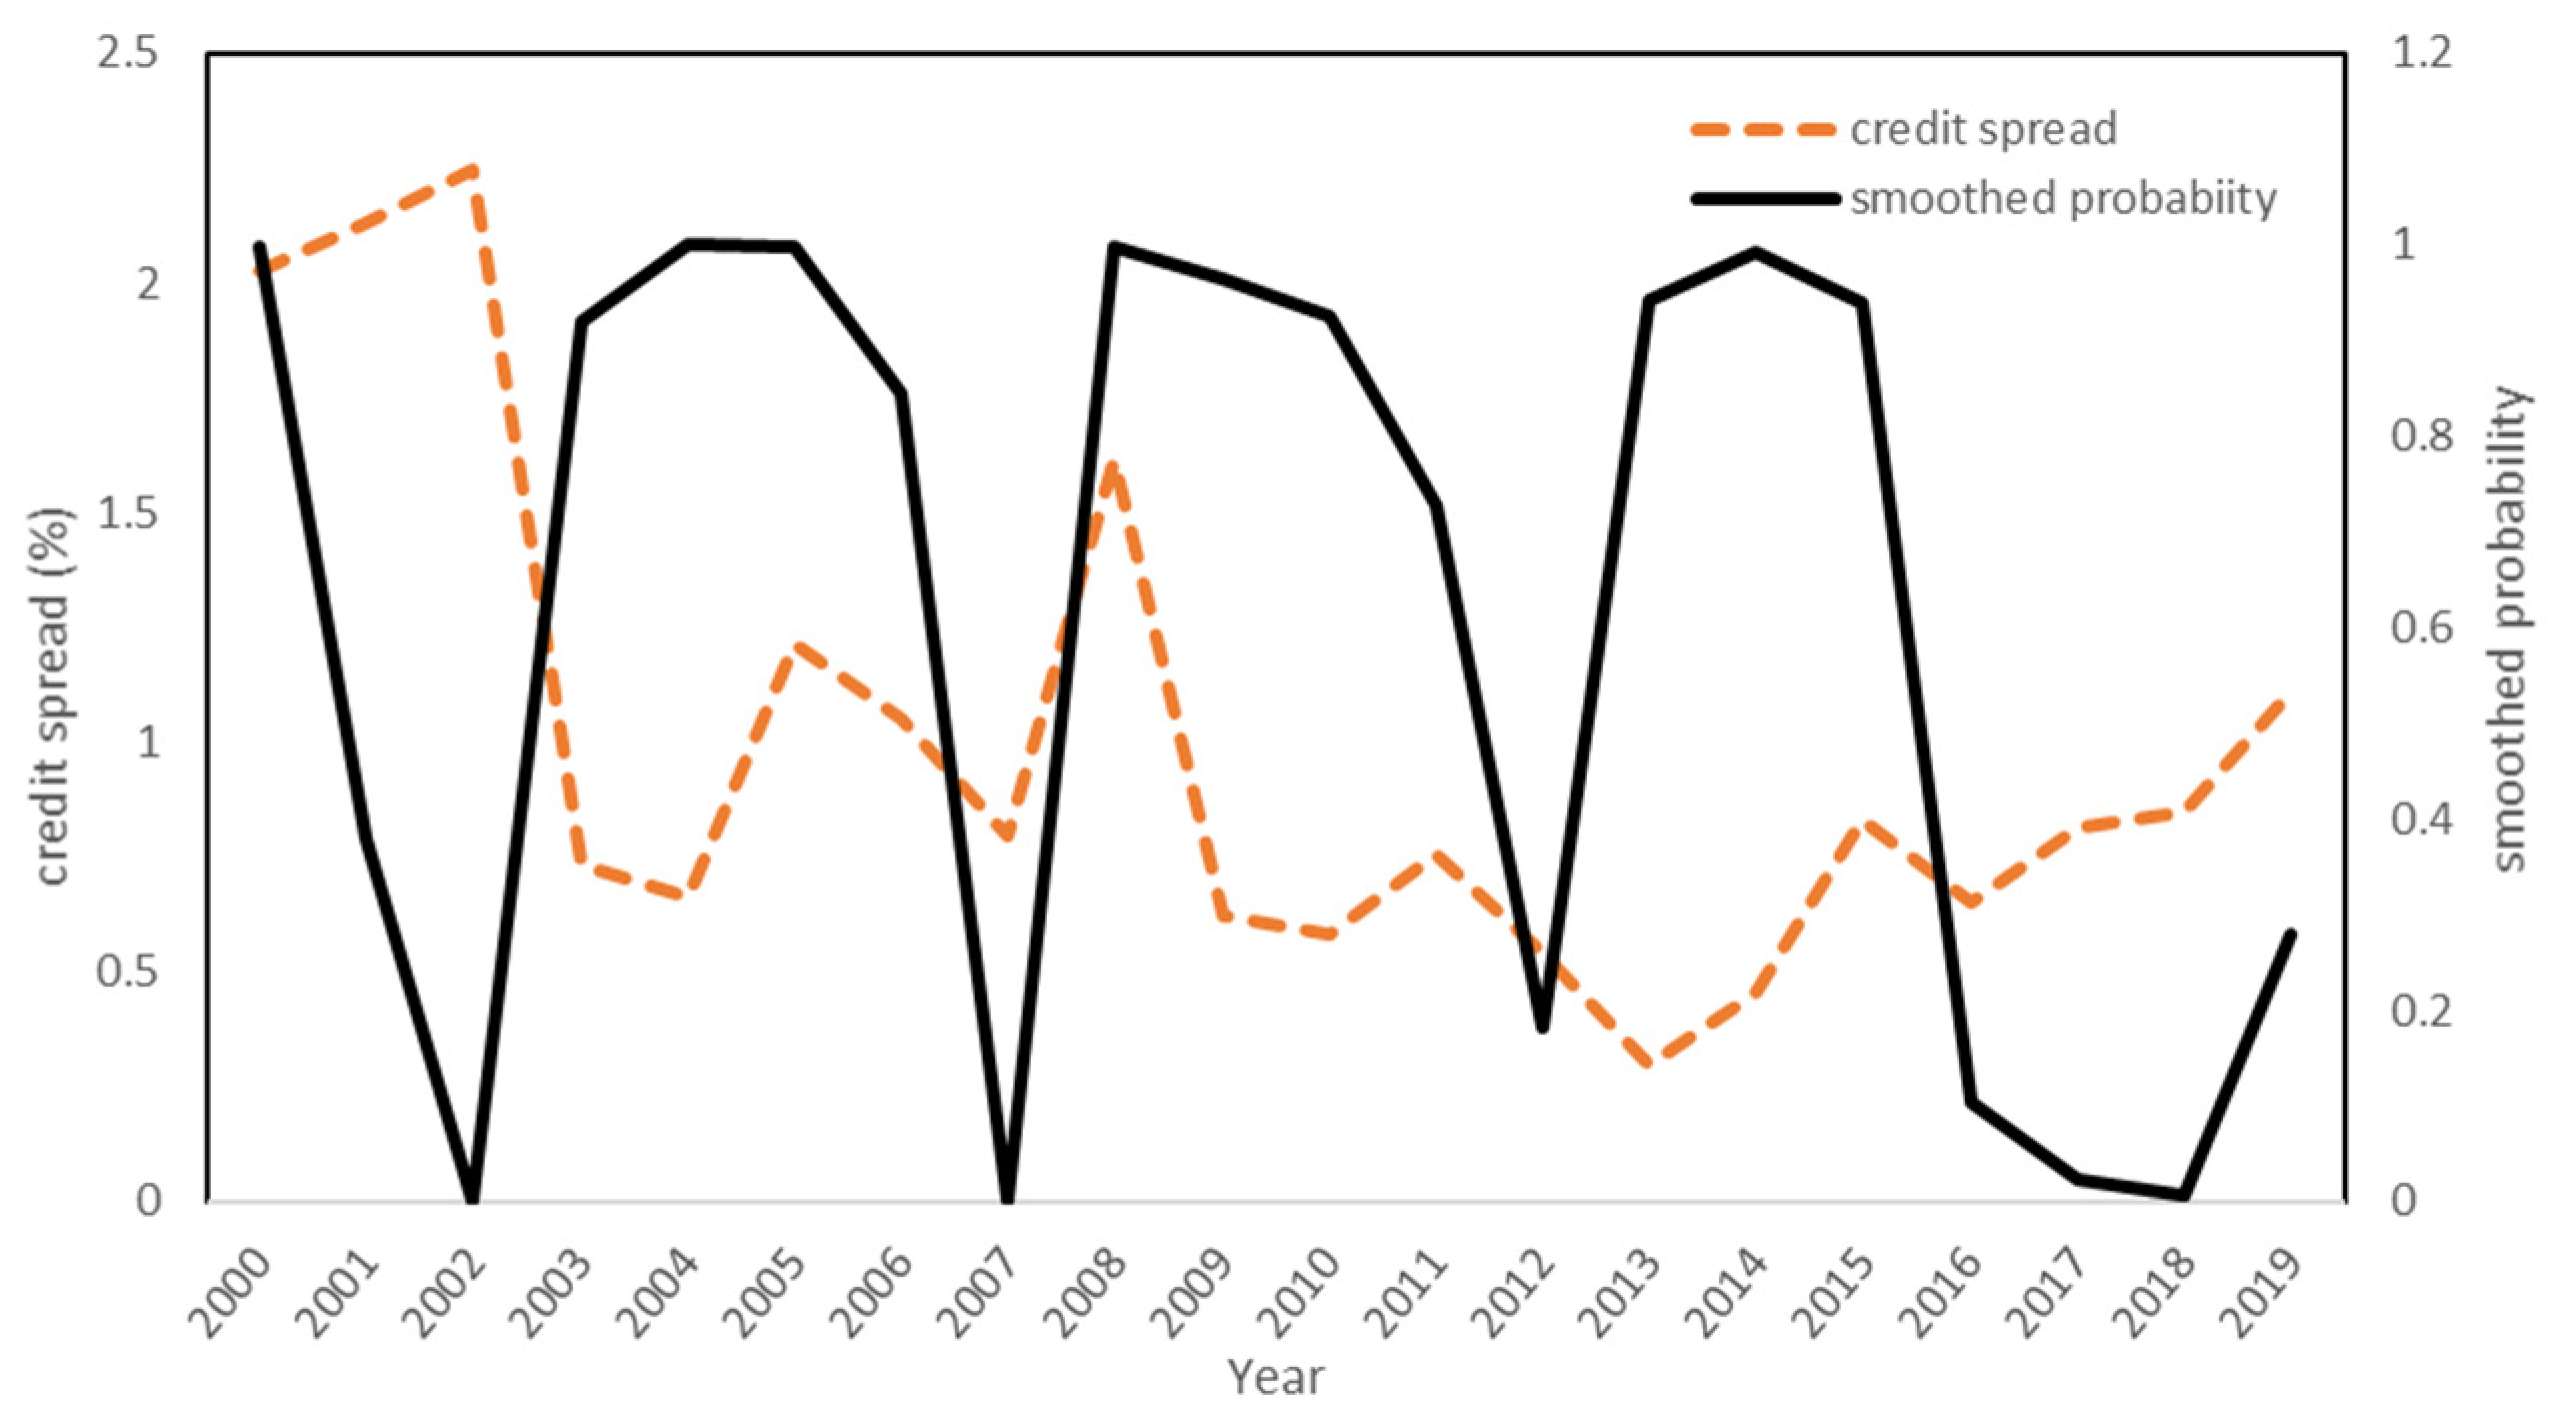
Thus, we employ a dummy variable to investigate whether the Markov regime-switching model is more suitable for capturing the effects of monetary policy and economic status on determinants of credit spread. The dummy variable equals one when the smoothed probability of the Markov process is above the cutoff point of 0.5 that is called high regime. Otherwise, it is zero that is called low regime. Figure 3 shows the time series for smoothed probability of monetary policy and credit spread. The credit spread is the average of the credit spreads of 24 banks. The financial crisis, also known as the subprime mortgage crisis, originated in the United States due to the collapse of the United States’ housing market and the decline in liquidity in the global financial market in 2007. In 2008, the financial crisis began to get out of control and began to spread to countries around the world, also known as the financial tsunami. In response to the financial crisis in 2008, central banks around the world have implemented the “quantitative easing” monetary policy and the regime is transferred. We also observe the credit spreads increase after the financial crisis. In September 2012, the central banks of Europe, the United States, and Japan implemented quantitative easing monetary policies, resulting in inflation and asset bubbles. Therefore, the obvious state transition can be found from Figure 4.
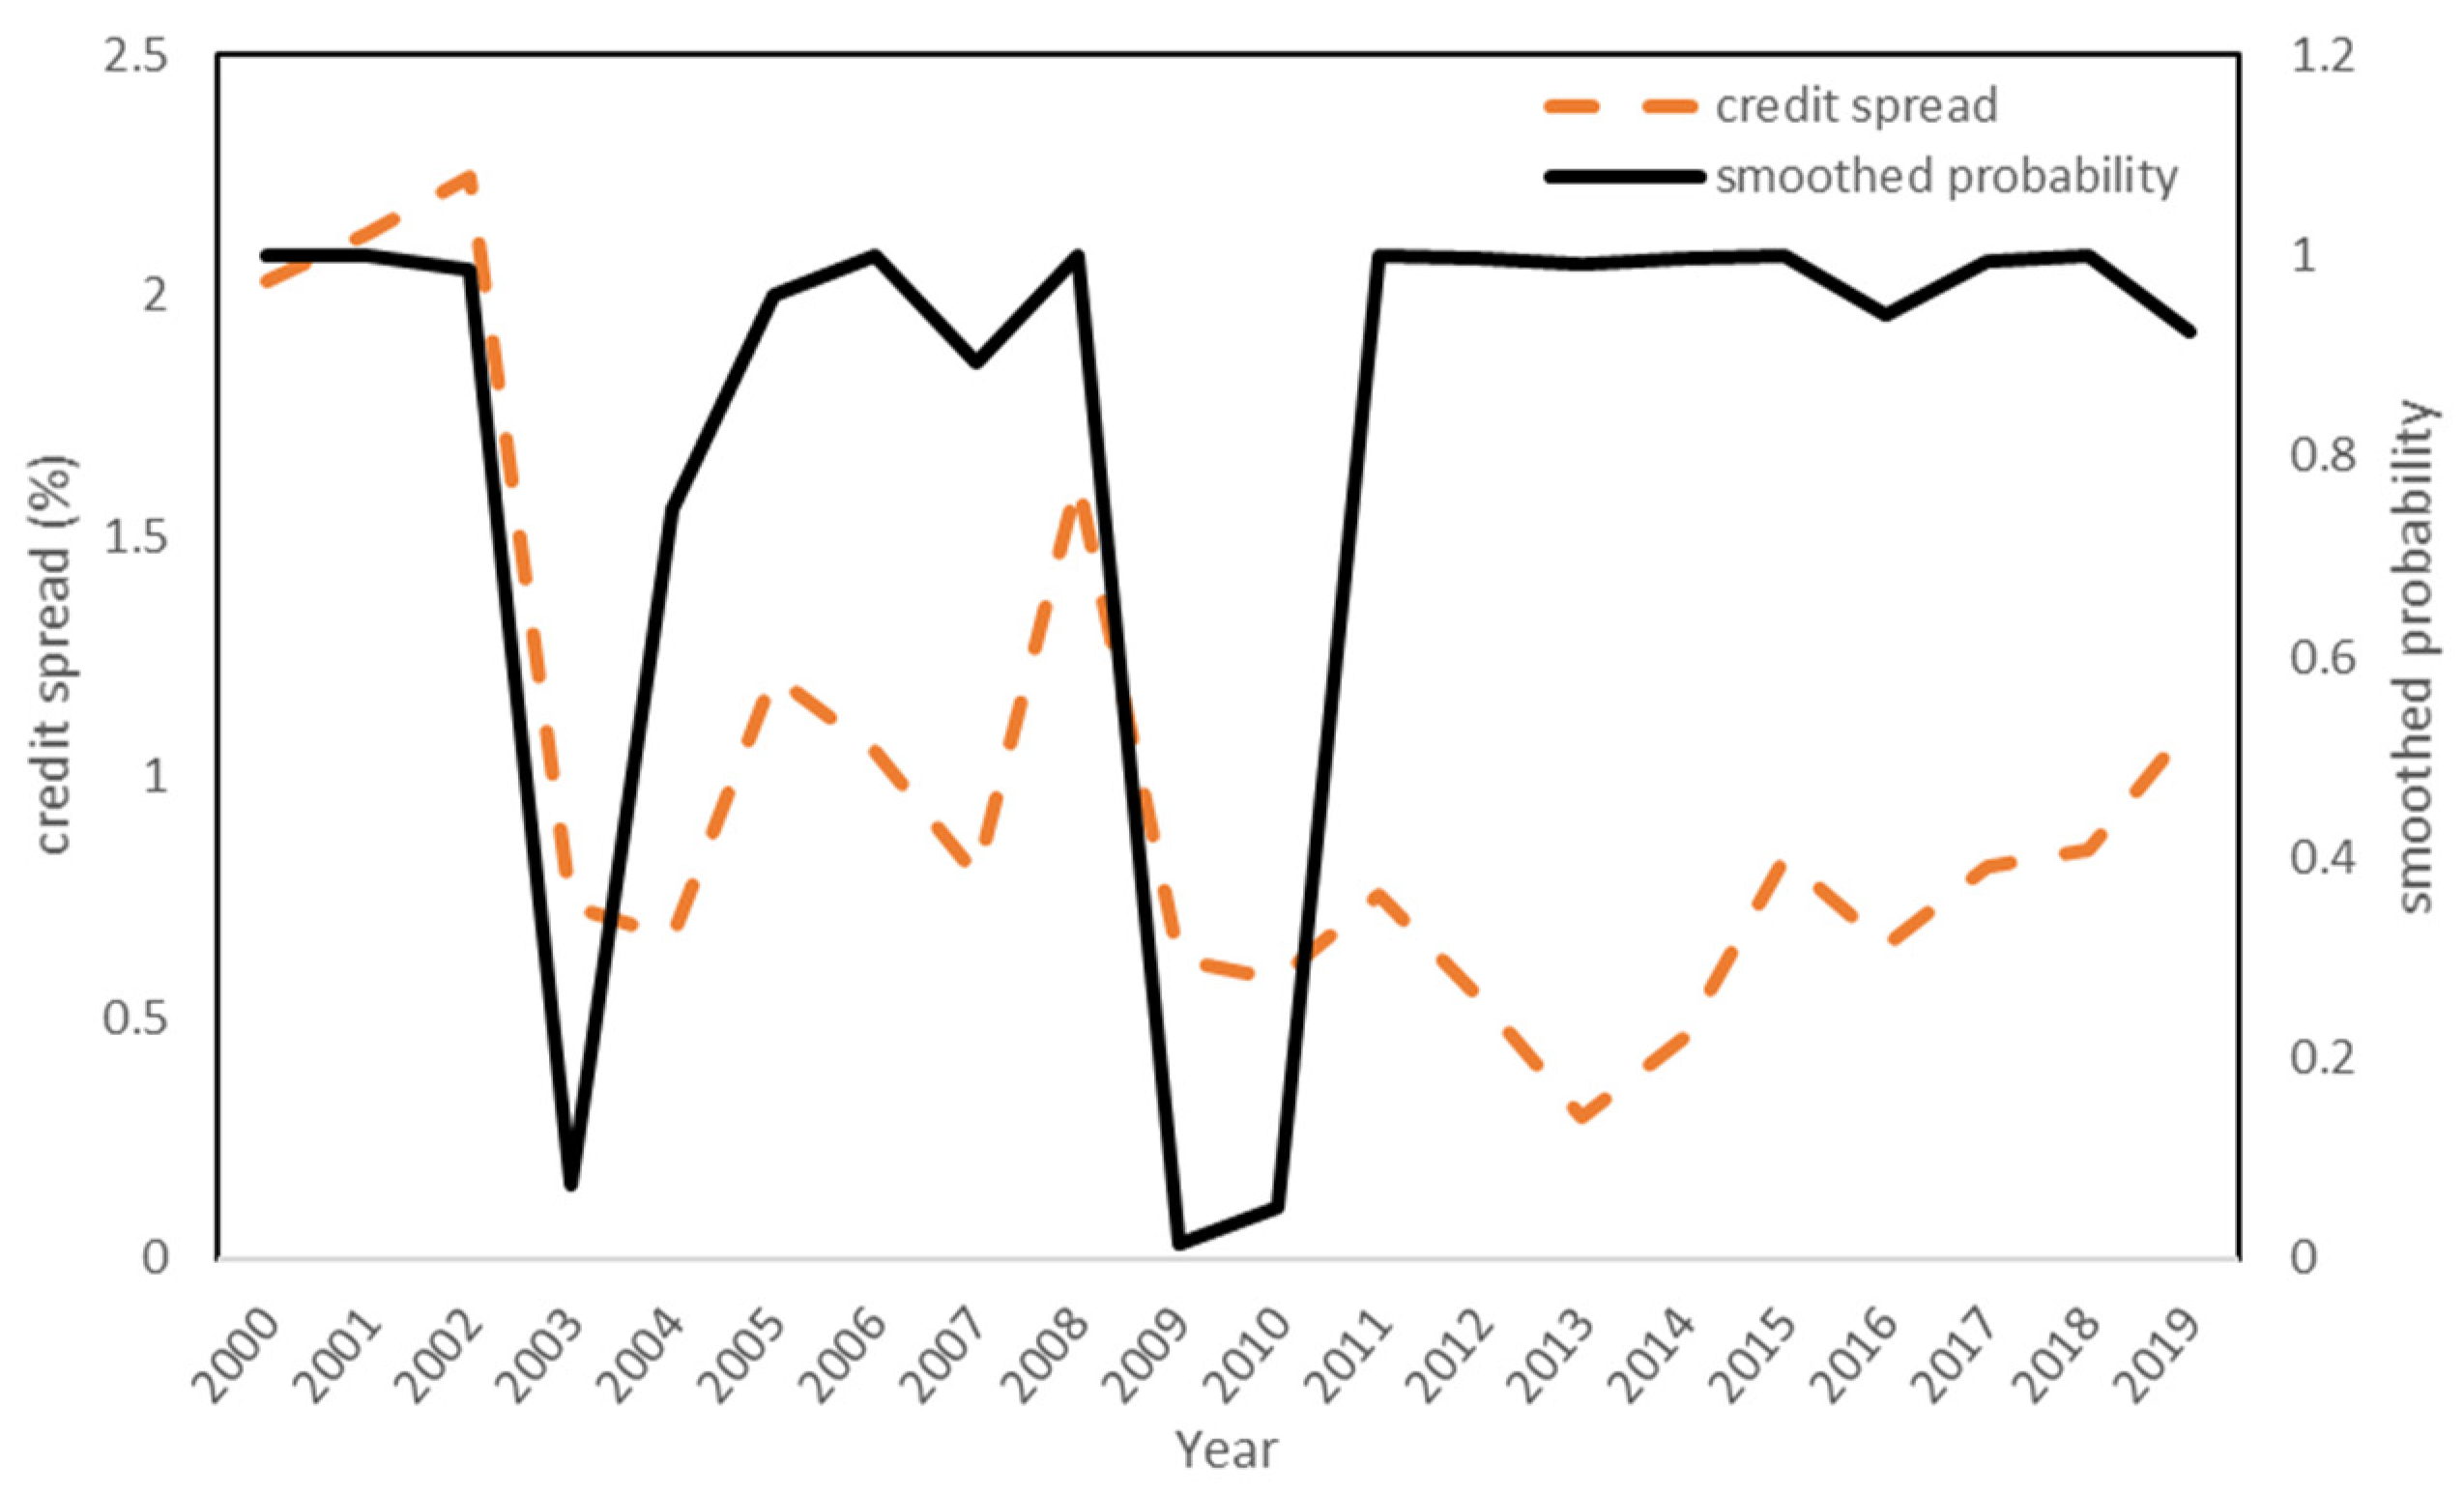
This study explores the effects of economic status. The smoothed probability of economic status and credit spread is presented in Figure 4. During the sample period, there are two important financial events that led to state transit to another state. In 2001, affected by the bubble of the Information and Communication Technology (ICT) industry in the United States, the status of the international economy turned into recession. The 9/11 terrorist attacks in the United States on 11 September 2001 caused another global economic recession. Taiwan is also in a business recession, and the economic cycle has reached the trough. Both import and export industries have also declined significantly. Thus, the regime transfers to another regime. The increase in credit spread is also influenced by regime switching. The International Monetary Fund (IMF) identified the financial crisis in 2008 as the worst economic and financial crisis since the Great Depression (1929–1933), and it is generally regarded as the second worst recession in economic history. Therefore, the financial crisis in 2008 led to a business recession and credit spread increase during this period. Finally, the COVID-19 pandemic occurred at the end of 2019, leading to economic recession, and governments around the world have adopted quantitative easing monetary policies to enhance the economy. For Figure 3 and Figure 4, the regime of monetary and economic status will be transferred to another regime.
Then, we use a Wald test to perform restricted testing. All test results are shown in Table 9, Table 10, Table 11, Table 12 and Table 13, which outline the effects of monetary policy and economic status on determinants of credit spread for every aspect in our study. The final two rows of Table 9, Table 10, Table 11, Table 12 and Table 13 relate to restricted tests of the null hypothesis (H0) that monetary policy and economic status have no effects on credit spreads and the alternative hypothesis (H1) that monetary policy and economic status have such effects. All test results significantly reject the null hypothesis, H0. This is in line with the results of De Moraes et al. [30], who determined that monetary policy has significant effects on credit spreads. Furthermore, Guha and Hiris [81] found that spreads of bonds are closely related to economic fluctuations. However, instead of employing corporate bond spreads, we focus on the credit spread of bank loans.
The Markov regime-switching model described herein can capture different effects of monetary policy and economic status in high- and low-regime situations. Table 9, Table 10, Table 11, Table 12 and Table 13 show the effects of monetary policy and economic status on determinants of credit spreads based on credit risk and four aspects of corporate governance. Considering the data on banks not belonging to financial holding companies in Table 9, we observe that economic status has different effects on credit risk in high- and low-regime scenarios and thus has different effects on credit spreads. As effects of monetary policy are concerned, all credit risk has a significant and positive impacts for credit spreads. However, this study uses credit risk of the reduced form model, which is different from the model used by Collin-Dufresne et al. [5]. Results of this study are consistent with those of Van Landschoot [7], who used a similar measurement of credit risk as was used in this study.
The effects based on aspect A, ownership structure, is shown in Table 10. For the first category, whether banks belong to financial holding companies, we find that effects of monetary policy in low regime are most consistent with related studies [34,37,40,44]. However, for high regime, the effects of monetary policy on determinants of credit spread are inconsistent with previous studies. It means that banks’ managers must review and adjust lending decisions in different regime.
Table 11 shows the effects that regime has on board structure. In low regime, most coefficients are negative and significant for two categories. Similar results were also found in related studies [48,51]. However, in high regime, the effects for determinants of credit spread are not all in line with previous studies.
The effects that regime is set for deviation is shown in Table 12. As far as deviation variables are concerned, not all variables appear to be significant. The results are inconsistent with related studies. Table 13 indicate that the effects based on regime for firm’s information environment. After considering regimes of monetary policy and economic status, many terms appear to be significant. Specially, for effects of monetary policy in low regime, most coefficients are significant and negative. It means that the information disclosure improves firms’ performance [44,57] and banks reduce credit spreads.
Overall, the Markov regime-switching model is more suitable than the single-regime model for describing the effects of monetary policy and economic status on credit spreads. The policymakers must consider the effects of different regimes when formulating policies. Then, the goal of the policy can be effectively achieved. In addition to supervising and managing their corporate governance mechanisms, investors must also pay attention to effects of monetary policy and economic status in different regimes.
5. Conclusions and Discussion
In this study, we investigated the determinants of banks’ credit spread using a Markov regime-switching model across different regimes in relation to corporate governance and credit risk. We employed bank loans in Taiwan from 2000–2019. Specially, we divided the sample into two categories: whether banks belong to financial holding companies and whether banks are controlled by government bodies. The classification method can help banks’ managers, investors, and policymakers make decision efficiently.
With the first contribution, we examined the interaction between corporate governance and credit spread, an issue that was not extensively discussed previously. Corporate governance has been emphasized strongly since the Asian financial crisis in 1997. The corporate governance mechanism is an indicator of a company’s sustainable development. Credit spreads are the main source of profit for banks. Thus, this is an important issue to investigate regarding the effects of corporate governance on banks’ credit spreads.
Second, in this study, we applied the Markov regime-switching model to capture high- and low-regime situations, which is more effectively than the models used in related studies. For the test results, we find that the Markov regime-switching model is superior to single-regime model. Comparing empirical results of single-regime model and Markov regime-switching model, we found that the latter captures the hidden effects in other regime and increases explanatory power for effects of corporate governance on credit spreads. For example, most variables of aspect C, deviation, have insignificant effects on credit spreads in a single-regime model, while we capture the hidden effects based on the Markov regime-switching model. Most interesting, we found that the corporate governance variables have different effects on credit spread in low- and high-regime scenarios. For example, for the banks that belong to financial holding companies, we found that results follow entrenchment hypothesis in low regime while they become to follow a convergence of interest hypothesis in high regime.
Finally, the effects of monetary policy and economic status on credit spread are investigated in depth elsewhere. We found that the policy and economic effects are different in the two regime types. For example, for all groups, most coefficients are negative and significant in low regime. However, in high regime, some effects for determinants of credit spread appear to be positive. For market participants, such as banks’ managers, they must review and adjust lending decisions in different regime. The policymakers must pay attention to effects in different regimes when they make policies. If they accurately observe differences of effects between low and high regimes, they will be able to achieve policy goals.
Besides considering borrowers’ credit risk, managers must consider borrowers’ corporate governance in different regimes. They must comprehensively consider the impact of every aspect of corporate governance in different regimes. For low regimes and high regimes, managers should conduct lending decision making differently. Relative to previous studies that consider market factors and macroeconomic factors, the influence of corporate governance will help managers make more efficient lending decisions.
In this study, we define credit spreads as difference between the loan rate and risk-free rate. For banks, the loan rate is their profit, but for investors, this rate is their cost. If banks charge high credit spreads, the investors must pay a high cost to obtain loans. The monetary policy and economic status in different regimes also have different effects on credit spreads. Thus, for investors, they must note their corporate governance and effects of monetary policy and economic status to decrease their lending cost. Since the Markov regime-switching model has higher explanatory power than single-regime model, the investors can plan their financing cost base on this model.
For policymakers, if they want to achieve effective policy effects, the Markov regime-switching model is superior to single-regime models. During economic recessions, such as the Asian financial crisis in 1997, the financial crisis in 2008, and the COVID-19 pandemic, financial markets and institutions have different responses and performances than those during economic expansions. Thus, the Markov regime-switching model can capture effects of two regimes, which is beneficial for policy making and achievement.
For future research studies, we propose to expand the number of regimes. This study uses two regimes: low and high regime. If more regimes are considered in the model, researchers may find interesting and different results. Furthermore, in this study, the proxy of credit risk is TCRI, which is a corporate credit rating system, established by TEJ. The range of rating classes is from 1 to 9. In general, companies with a rating class of 4 or less are considered to have low credit risk. By contrast, companies with a rating class of 7 or higher are considered high credit risk. The future research studies can divide sample base on TCRI to observe results across different rating classes.
Author Contributions
Conceptualization, S.-L.L.; methodology, S.-L.L. and K.-J.L.; validation, S.-L.L.; formal analysis, S.-L.L.; investigation, S.-L.L. and K.-J.L.; resources, S.-L.L. and K.-J.L.; data curation, S.-L.L. and K.-J.L.; writing—original draft preparation, S.-L.L. and K.-J.L.; writing—review and editing, S.-L.L. Both authors have read and agreed to the published version of the manuscript.
Funding
This research was funded by the Ministry of Science and Technology (MOST), grant number MOST 105-2410-H-020-001.
Data Availability Statement
Not applicable.
Conflicts of Interest
The authors declare no conflict of interest.
Appendix A

Table A1.
Description of sample.
| Bank Number | Bank Name | Financial Holding Company | Government Controlled Bank |
|---|---|---|---|
| 1 | The Shanghai Commercial & Savings Bank, Ltd. | ||
| 2 | Land Bank of Taiwan | * | |
| 3 | China Citic Bank Corporation Limited | * | |
| 4 | Yuanta Commercial Bank | * | |
| 5 | First Commercial Bank | * | * |
| 6 | JihSun International Commercial Bank Co., Ltd. | * | |
| 7 | Taishin International Bank Co., Ltd. | * | |
| 8 | E.SUN Commercial Bank | * | |
| 9 | Bank SinoPac Co., Ltd. | * | |
| 10 | Cathay United Bank | * | |
| 11 | Chang Hwa Commercial Bank, Ltd. | * | |
| 12 | Taipei Fubon Commercial Bank Co., Ltd. | * | |
| 13 | Mega Financial Holding Company Ltd. | * | * |
| 14 | Union Bank of Taiwan Co., Ltd. | ||
| 15 | Bank of Taiwan | * | * |
| 16 | Public Bank Berhad | ||
| 17 | O-Bank | ||
| 18 | Taiwan Cooperative Bank | * | * |
| 19 | Standard Chartered Bank (Taiwan) Limited | ||
| 20 | King’s Town Bank Co., Ltd. | ||
| 21 | The Export-Import Bank of the Republic of China | * | |
| 22 | Hwatai Bank | ||
| 23 | Sunny Commercial Bank | ||
| 24 | Hua Nan Commercial Bank, Ltd. |
Note—The symbol “*” means this bank belongs to financial holding company or this bank is controlled by the government.
References
- Tang, D.Y.; Yan, H. Macroeconomic conditions, firm characteristics, and credit spreads. J. Financ. Serv. Res. 2006, 29, 177–210. [Google Scholar] [CrossRef]
- Chen, Y.; Hu, S.Y. The controlling shareholder’s personal leverage and firm performance. Appl. Econ. 2007, 39, 1059–1075. [Google Scholar] [CrossRef]
- David, A. Inflation uncertainty, asset valuations, and the credit spreads puzzle. Rev. Financ. Stud. 2008, 21, 2487–2534. [Google Scholar] [CrossRef] [Green Version]
- Tang, D.Y.; Yan, H. Market conditions, default risk and credit spreads. J. Bank. Financ. 2010, 34, 743–753. [Google Scholar] [CrossRef] [Green Version]
- Collin-Dufresne, P.; Goldstein, R.S. Do credit spreads reflect stationary leverage ratios? J. Financ. 2001, 56, 1929–1957. [Google Scholar] [CrossRef]
- Campbell, J.; Taksler, B. Equity volatility and corporate bond yields. J. Financ. 2003, 58, 2321–2350. [Google Scholar] [CrossRef] [Green Version]
- Van Landschoot, A. Determinants of the Euro Term Structure of Credit Spreads; Working Paper; European Central Bank: Frankfurt am Main, Germany, 2004. [Google Scholar]
- Maalaoui Chun, C.; Dionne, G.; Francois, P. Credit spread changes within switching regimes. J. Bank. Financ. 2014, 49, 41–55. [Google Scholar] [CrossRef]
- Chava, S.; Dierker, M.; Livdan, D.; Purnanandam, A. Do shareholder rights affect the cost of bank loans? Rev. Financ. Stud. 2009, 22, 2973–3004. [Google Scholar] [CrossRef]
- Klock, M.; Mansi, S.A.; Maxwell, W.F. Does corporate governance matter to bondholders? J. Financ. Quant. Anal. 2005, 40, 693–719. [Google Scholar] [CrossRef]
- Duffie, D.; Lando, D. Term Structures of Credit Spreads with Incomplete Accounting Information. J. Econom. Soc. 2001, 69, 633–664. [Google Scholar] [CrossRef] [Green Version]
- Mansi, S.A.; Maxwell, W.F.; Miller, D.P. Does Auditor Quality and Tenure Matter to Investors? Evidence from the Bond Market. J. Account. Res. 2004, 42, 755–793. [Google Scholar] [CrossRef]
- Yu, F. Accounting Transparency and the Term Structure of Credit Spread. J. Financ. Econ. 2005, 75, 53–84. [Google Scholar] [CrossRef]
- Lu, C.W.; Chen, Y.K.; Liao, H.H. Information uncertainty, informational asymmetry and corporate bond yield spreads. J. Bank. Financ. 2010, 34, 2265–2279. [Google Scholar] [CrossRef]
- Zhou, H.; Zhou, C.; Lin, W.; Li, G. Corporate governance and credit spreads on corporate bonds: An empirical study in the context of China. China J. Account. Stud. 2017, 5, 1–2. [Google Scholar] [CrossRef]
- Zhou, H.; Li, G.; Lin, W. Corporate social responsibility and credit spreads—An empirical study in Chinese context. Ann. Econ. Financ. 2016, 17, 79–103. [Google Scholar]
- Quandt, R.E. The estimation of the parameters of a linear regression system obeying two separate regimes. J. Am. Stat. Assoc. 1958, 53, 873–880. [Google Scholar] [CrossRef]
- Goldfeld, S.M.; Quandt, R.E. A Markov model for switching regressions. J. Econom. 1973, 1, 3–15. [Google Scholar] [CrossRef]
- Hamilton, J.D. A new approach to the economic analysis of nonstationary time series and business cycle. Econometrica 1989, 57, 357–384. [Google Scholar] [CrossRef]
- Hamilton, J.D.; Lin, G. Stock Market Volatility and the Business Cycle. J. Appl. Econom. 1996, 11, 574–593. [Google Scholar] [CrossRef]
- Pliska, S.R. Introduction to Mathematical Finance: Discrete Time Models; Blackwell Publishers: Oxford, UK, 1997. [Google Scholar]
- Elliott, R.J.; Hunter, W.C.; Jamieson, B.M. Financial signal processing. Int. J. Theor. Appl. Financ. 2001, 4, 567–584. [Google Scholar] [CrossRef]
- Elliott, R.J.; Hinz, J. A method for portfolio choice. Appl. Stoch. Models Bus. Ind. 2002, 19, 1–11. [Google Scholar] [CrossRef]
- Naik, V. Option valuation and hedging strategies with jumps in the volatility of asset returns. J. Financ. 1993, 48, 1969–1984. [Google Scholar] [CrossRef]
- Guo, X. Information and option pricings. Quant. Financ. 2001, 1, 38–44. [Google Scholar] [CrossRef]
- Elliott, R.J.; Chan, L.; Siu, T.K. Option pricing and Esscher transform under regime switching. Ann. Financ. 2005, 1, 423–432. [Google Scholar] [CrossRef]
- Elliott, R.J.; Hunterb, W.C.; Jamieson, B.M. Drift and volatility estimation in discrete time. J. Econ. Dyn. Control 1998, 22, 209–218. [Google Scholar] [CrossRef]
- Chen, H. Macroeconomic conditions and the puzzles of credit spreads and capital structure. J. Financ. 2010, 65, 2171–2212. [Google Scholar] [CrossRef]
- Bhamra, H.S.; Kuehn, L.A.; Strebulaev, I.A. The levered equity risk premium and credit spreads: A unified framework. Rev. Financ. Stud. 2010, 23, 645–703. [Google Scholar] [CrossRef]
- De Moraes, C.; Barroso, G.; Nicolay, R. Monetary Policy and Credit Spread: A New Risk-Taking Channel. Empir. Econ. Lett. 2018, 17, 1497–1506. [Google Scholar]
- Zhou, H.; Lin, W.; Li, G.; Wang, H. Informational Asymmetry and Pricing of Corporate Bond Credit Risks: An Empirical Study Based on Chinese Corporate Bonds Issued during 2008–2011. Account. Res. 2012, 12, 32–38. (In Chinese) [Google Scholar]
- Goergen, M.; Renneboog, L. Insider control by large investor groups and managerial disciplining in listed Belgian companies. Manag. Financ. 2000, 26, 22–41. [Google Scholar] [CrossRef]
- Pindado, J.; De La Torre, C. Effect of ownership structure on underinvestment and overinvestment: Empirical evidence from Spain. Account. Financ. 2009, 49, 363–383. [Google Scholar] [CrossRef]
- Jensen, M.; Meckling, W. Theory of the firm: Managerial behavior, agency costs, and capital structure. J. Financ. Econ. 1976, 3, 305–360. [Google Scholar] [CrossRef]
- Agrawal, A.; Mandelker, G. Large shareholders and the monitoring of managers: The case of antitakeover charter amendments. J. Financ. Quant. Anal. 1990, 25, 143–161. [Google Scholar] [CrossRef]
- Dahlquist, M.; Robertsson, G. Direct foreign ownership, institutional investors, and firm characteristics. J. Financ. Econ. 2001, 59, 413–440. [Google Scholar] [CrossRef]
- Claessens, S.; Djankov, S.; Lang, L. The separation of ownership and control in East Asian corporations. J. Financ. Econ. 2000, 58, 81–112. [Google Scholar] [CrossRef]
- La Porta, R.; Lopez-De-Silanes, F.; Shleifer, A. Corporate ownership around the world. J. Financ. 1999, 54, 471–571. [Google Scholar] [CrossRef]
- Fama, E.F.; Jensen, M.C. Separation of Ownership and Control. J. Law Econ. 1983, 26, 301–325. [Google Scholar] [CrossRef]
- Jensen, M.C.; Ruback, R.S. The market for corporate control: The scientific evidence. J. Financ. Econ. 1983, 11, 5–50. [Google Scholar] [CrossRef]
- Fuerst, O.; Kang, S.-H. Corporate governance, expected operating performance, and pricing. Corp. Ownersh. Control 2004, 1, 13–30. [Google Scholar] [CrossRef]
- Kao, L.; Chiou, J.R.; Chen, A. The Agency Problems, Firm Performance and Monitoring Mechanisms: The Evidence from Collateralized shares in Taiwan. Corp. Gov. An. Int. Rev. 2004, 12, 389–401. [Google Scholar] [CrossRef]
- Lee, T.S.; Yeh, Y.H. Corporate Governance and Financial Distress: Evidence from Taiwan. Corp. Gov. An. Int. Rev. 2004, 12, 378–388. [Google Scholar] [CrossRef]
- Lee, K.J.; Lu, S.L.; Lin, C.Y. Effect of Share Collateralization by Directors/Supervisors on Control Rights, Risk, and Performance: Application to the Taiwan Market. INFOR Inf. Syst. Oper. Res. 2019, 57, 454–476. [Google Scholar] [CrossRef]
- Weisbach, M.S. Outside directors and CEO turnover. J. Financ. Econ. 1988, 20, 43l–460. [Google Scholar] [CrossRef]
- Byrd, J.; Hickman, K. Do outside directors monitor managers? Evidence from tender offer bids. J. Financ. Econ. 1992, 32, 195–221. [Google Scholar] [CrossRef]
- Brickley, J.; Coles, J.; Terry, R. The board of directors and the enactment of poison pills. J. Financ. Econ. 1994, 35, 371–390. [Google Scholar] [CrossRef]
- Williamson, O.E. Corporate governance. Yale Law J. 1984, 93, 1197–1230. [Google Scholar] [CrossRef]
- Shivdasani, A. Board composition, ownership structure and hostile takeovers. J. Account. Econ. 1993, 16, 167–198. [Google Scholar] [CrossRef]
- Bacon, J. Corporate Directorship Practices: Membership and Committees of the Board; The Conference Board: New York, NY, USA, 1973. [Google Scholar]
- Zahra, S.A.; Pearce, J.A. Boards of Directors and Corporate Financial Performance: A Review and Integrative Model. J. Manag. 1989, 15, 291–334. [Google Scholar] [CrossRef]
- Jensen, M.C. The Modern Industrial Revolution, Exit, and the Failure of Internal Control Systems. J. Financ. 1993, 48, 831–880. [Google Scholar] [CrossRef]
- Yermack, D. Higher market valuation with a small board of director. J. Financ. Econ. 1996, 40, 186–211. [Google Scholar] [CrossRef]
- Shleifer, A.; Vishny, R. A Survey of Corporate Governance. J. Financ. 1997, 52, 737–783. [Google Scholar] [CrossRef]
- Claessens, S.; Djankov, S.; Fan, J.P.H.; Lang, L.H.P. Disentangling the incentive and entrenchment effects of large shareholdings. J. Financ. 2002, 57, 2741–2771. [Google Scholar] [CrossRef]
- Chen, L.; Lesmond, D.A.; Wei, J.Z. Corporate yield spreads and bond liquidity. J. Financ. 2007, 62, 119–149. [Google Scholar] [CrossRef]
- Li, L.I. L’offre d’information volontaire par internet et le gouvernement des entreprises françaises. Financ. Contrôle Strat. 2010, 13, 101–137. [Google Scholar]
- Diamond, D.; Verrecchia, R. Disclosure, liquidity and the cost of capital. J. Financ. 1991, 46, 1325–1359. [Google Scholar] [CrossRef]
- Black, B.S.; Jang, H.; Kim, W. Does Corporate Governance Matter? Evidence from the Korean Market; Working Paper; Stanford Law School: Stanford, CA, USA; Korea University: Seoul, Korea; KDI School of Public Policy and Management: Sejong City, Korea, 2002. [Google Scholar]
- Black, F.; Scholes, M. The pricing of options and corporate liabilities. J. Political Econ. 1973, 81, 637–653. [Google Scholar] [CrossRef] [Green Version]
- Merton, R.C. On the pricing of corporate debt: The risk structure of interest rates. J. Financ. 1974, 29, 449–470. [Google Scholar]
- Black, F.; Cox, J.C. Valuing corporate securities: Some effects of bond indenture provisions. J. Financ. 1976, 31, 351–367. [Google Scholar] [CrossRef]
- Kim, I.J.; Ramaswamy, K.; Sundaresan, S. The Valuation of Corporate Fixed Income Securities; Working Paper; University of Pennsylvania: Philadelphia, PA, USA, 1989. [Google Scholar]
- Lando, D. Three Essays on Contingent Claims Pricing. Ph.D. Thesis, Cornell University, Ithaca, NY, USA, 1994. [Google Scholar]
- Hull, J.; White, A. The impact of default risk on the prices of options and other derivative securities. J. Bank. Financ. 1995, 19, 299–322. [Google Scholar] [CrossRef]
- Longstaff, F.A.; Schwartz, E. A simple approach to valuing risky fixed and floating rate debt. J. Financ. 1995, 50, 789–821. [Google Scholar] [CrossRef]
- Leland, H.; Toft, K.B. Optimal capital structure, endogenous bankruptcy, and the term structure of credit spreads. J. Financ. 1996, LI, 987–1019. [Google Scholar] [CrossRef]
- Jarrow, R.A.; Turnbull, S.M. Pricing derivatives on financial securities subject to credit risk. J. Financ. 1995, 50, 53–86. [Google Scholar] [CrossRef]
- Jarrow, R.A.; Lando, D.; Turnbull, S.M. A Markov model for the term structure of credit risk spreads. Rev. Financ. Stud. 1997, 10, 481–523. [Google Scholar] [CrossRef] [Green Version]
- Lando, D. On Cox processes and credit risky securities. Rev. Deriv. Res. 1998, 2, 99–120. [Google Scholar] [CrossRef]
- Duffie, D. Defaultable Term Structure Models with Fractional Recovery of Par; Graduate School of Business, Stanford University: Palo Alto, CA, USA, 1998. [Google Scholar]
- Duffie, D.; Singleton, K.J. An econometric model of the term structure of interest-rate swap yields. J. Financ. 1999, 52, 1287–1321. [Google Scholar] [CrossRef]
- Hung, K.; Duan, C.W.; Yang, C.W. Rating, Credit Spread, and Pricing Risky Debt: Empirical Study on Taiwan’s Security Market. Ann. Econ. Financ. 2006, 2, 405–424. [Google Scholar]
- Huang, C.L.; Kuo, B.Y. The Impact of Credit Rating, Ownership and Relationships on Loan Spreads-Taiwan’s Evidence. Asian J. Financ. Account. 2014, 6, 19–52. [Google Scholar] [CrossRef]
- Hamilton, J.D. Analysis of time series subject to changes in regime. J. Econom. 1990, 45, 39–70. [Google Scholar] [CrossRef]
- Heryan, T.; Tzeremes, P.G. The bank lending channel of monetary policy in EU countries during the global financial crisis. Econ. Model. 2017, 67, 10–22. [Google Scholar] [CrossRef]
- Johnson, S.; La Porta, R.; Lopez-De-Silanes, F.; Shleifer, A. Tunneling. Am. Econ. Rev. 2000, 90, 22–27. [Google Scholar] [CrossRef]
- Fan, J.P.H.; Wong, T.J. Corporate ownership structure and the informativeness of accounting earnings in East Asia. J. Account. Econ. 2002, 33, 401–425. [Google Scholar] [CrossRef] [Green Version]
- Du, J.; Dai, Y. Ultimate corporate ownership structures and capital structures: Evidence from East Asian economies. Corp. Gov. An. Int. Rev. 2005, 13, 60–71. [Google Scholar] [CrossRef]
- Conyon, M.J.; He, L. Executive compensation and corporate governance in China. J. Corp. Financ. 2011, 17, 1158–1175. [Google Scholar] [CrossRef] [Green Version]
- Guha, D.; Hiris, L. The aggregate credit spread and the business cycle. Int. Rev. Financ. Anal. 2020, 11, 219–227. [Google Scholar] [CrossRef]
Figure 1.
The maturity and number of loans. Note—Please refer to Table A1 in the Appendix A for the bank name corresponding to the bank number.
Figure 1.
The maturity and number of loans. Note—Please refer to Table A1 in the Appendix A for the bank name corresponding to the bank number.

Figure 2.
The rating distribution. Note—Please refer to Table A1 in the Appendix A for the bank name corresponding to the bank number.
Figure 2.
The rating distribution. Note—Please refer to Table A1 in the Appendix A for the bank name corresponding to the bank number.

Figure 3.
Smoothed probability of monetary policy and credit spread.

Figure 4.
Smoothed probability of economic status and credit spread.

Table 1.
Correlation coefficients.
| A1 | A2 | A3 | A4 | B1 | B2 | C1 | C2 | C3 | D1 | D2 | D3 | |
|---|---|---|---|---|---|---|---|---|---|---|---|---|
| A1 | 1.000 | |||||||||||
| A2 | –0.283 (0.000) *** | 1.000 | ||||||||||
| A3 | –0.026 (0.000) *** | –0.045 (0.000) *** | 1.000 | |||||||||
| A4 | –0.144 (0.000) *** | –0.045 (0.000) *** | –0.116 (0.000) *** | 1.000 | ||||||||
| B1 | –0.079 (0.000)*** | 0.102 (0.000) *** | 0.052 (0.000) *** | –0.165 (0.000) *** | 1.000 | |||||||
| B2 | 0.072 (0.000)*** | –0.187 (0.000) *** | –0.079 (0.000) *** | 0.046 (0.000) *** | 0.100 (0.000) *** | 1.000 | ||||||
| C1 | –0.187 (0.000) *** | 0.197 (0.000) *** | –0.245 (0.000) *** | 0.044 (0.000) *** | –0.043 (0.000) *** | –0.158 (0.000) *** | 1.000 | |||||
| C2 | 0.266 (0.000) *** | 0.359 (0.000) *** | –0.083 (0.000) *** | –0.158 (0.000) *** | 0.202 (0.000) *** | –0.148 (0.000) *** | 0.473 (0.000) *** | 1.000 | ||||
| C3 | 0.461 (0.000) *** | 0.277 (0.000) *** | 0.004 (0.367) | –0.203 (0.000) *** | 0.239 (0.000) *** | –0.107 (0.000) *** | 0.038 (0.000) *** | 0.541 (0.000) *** | 1.000 | |||
| D1 | 0.035 (0.000) *** | –0.048 (0.000) *** | –0.031 (0.000) *** | 0.035 (0.000) *** | –0.021 (0.000) *** | 0.057 (0.000) *** | 0.042 (0.000) *** | –0.005 (0.288) | –0.025 (0.000) *** | 1.000 | ||
| D2 | –0.001 (0.757) | 0.006 (0.162) | 0.011 (0.012) ** | 0.021 (0.000) *** | 0.008 (0.064) * | –0.011 (0.012) ** | 0.011 (0.013) ** | –0.009 (0.040) ** | –0.011 (0.009) *** | 0.136 (0.000) *** | 1.000 | |
| D3 | –0.006 (0.135) | –0.095 (0.000) *** | 0.050 (0.000) *** | 0.034 (0.000) *** | –0.097 (0.000) *** | 0.034 (0.000) *** | –0.009 (0.043) ** | –0.051 (0.000) *** | –0.065 (0.000) *** | 0.003 (0.552) | –0.039 (0.000) *** | 1.000 |
Note: 1. A1 is the shareholding ratio of directors and supervisors, A2 is the shareholding ratio of major shareholders, A3 is the shareholding ratio of the management, A4 is the percentage of shares collateralized or pledged by directors and supervisors, B1 is the percentage of independent directors, B2 is the number of board members, C1 is the deviation between earnings control and ownership control, C2 is the deviation between earning control and board seat control, C3 is the deviation between owner-ship control and board seat control, D1 means whether financial statements are restated, D2 is the number of CPA changes in three years, and D3 means whether producing financial projections. 2. The number in parentheses is p-value. 3. *, **, and *** are denoted significant at the 10%, 5%, and 1% levels, respectively.
Table 2.
Estimated results for the single-regime regression model.
| Category | Financial Holding Company | Government-Controlled Bank | |||
|---|---|---|---|---|---|
| Aspect | FH | Non-FH | Gov-Controlled | Non-Gov-Controlled | |
| Constant | −0.606(0.000) *** | −0.582(0.000) *** | −0.439(0.000) *** | −0.800(0.000) *** | |
| A | A1 | −0.291(0.000) *** | −0.248(0.000) *** | −0.331(0.000) *** | −0.212(0.000) *** |
| A2 | −0.568(0.000) *** | −0.661(0.000) *** | −0.536(0.000) *** | −0.552(0.000) *** | |
| A3 | 1.066(0.000) *** | 1.993(0.000) *** | 1.043(0.000) *** | 1.341(0.000) *** | |
| A4 | 0.243(0.000) *** | 0.244(0.000) *** | 0.309(0.000) *** | 0.217(0.000) *** | |
| B | B1 | −0.057(0.000) *** | −0.061(0.000) *** | −0.070(0.000) *** | −0.047(0.000) *** |
| B2 | −0.011(0.000) *** | −0.020(0.000) *** | −0.017(0.000) *** | −0.012(0.000) *** | |
| C | C1 | 0.112(0.000) *** | 0.257(0.000) *** | 0.174(0.000) *** | 0.174(0.000) *** |
| C2 | −0.089(0.012) ** | −0.035(0.481) | −0.194(0.000) *** | −0.007(0.838) | |
| C3 | 0.037(0.223) | 0.027(0.494) | 0.115(0.016) ** | −0.020(0.449) | |
| D | D1 | 0.013(0.251) | 0.007(0.633) | 0.017(0.248) | 0.009(0.477) |
| D2 | 0.017(0.084) * | 0.006(0.669) | 0.006(0.624) | 0.019(0.075) * | |
| D3 | 0.299(0.000) *** | 0.328(0.000) *** | 0.322(0.000) *** | 0.296(0.000) *** | |
| Risk | 0.270(0.000) *** | 0.268(0.000) *** | 0.248(0.000) *** | 0.291(0.000) *** | |
Note: FH means the group of banks that belong to the financial holding company. Non-FH means the group of banks that do not belong to the financial holding company. Gov-controlled means the group of banks that are controlled by the government. Non-gov-controlled means the group of banks that are not controlled by the government. There are four aspects of corporate governance. “A” represents the first aspect, ownership structure. “B” represents the second aspect, board structure. “C” represents the third aspect, deviation. Finally, “D” represents the fourth aspect, the firm’s information environment. The aspect A includes four variables: A1 is the shareholding ratio of directors and supervisors, A2 is the shareholding ratio of major shareholders, A3 is the shareholding ratio of the management, and A4 is the percentage of shares collateralized or pledged by directors and supervisors. The aspect B includes two variables: B1 is the percentage of independent directors and B2 is the number of board members. The aspect C includes three variables: C1 is the deviation between earnings control and ownership control, C2 is the deviation between earning control and board seat control, and C3 is the deviation between ownership control and board seat control. The aspect D includes three variables: D1 means whether financial statements are restated, D2 is the number of CPA changes in three years, and D3 means whether producing financial projections. The number in parentheses is p-value. *, **, and *** are denoted significant at the 10%, 5%, and 1% levels, respectively.
Table 3.
Determinants of credit spread (regime specification is credit risk).
| Dependent Variables | Financial Holding Company | Government-Controlled Bank | |||||||
|---|---|---|---|---|---|---|---|---|---|
| FH | Non-FH | Gov-Controlled | Non-Gov Controlled | ||||||
| Risk-Low | 0.197(0.000) *** | --- | 0.203(0.000) *** | --- | 0.377(0.000) *** | --- | 0.376(0.000) *** | --- | |
| Risk-High | --- | 0.501(0.000) *** | --- | 0.360(0.000) *** | --- | 0.210(0.000) *** | --- | 0.215(0.000) *** | |
| Constant | −0.558(0.000) *** | −0.469(0.000) *** | −0.821(0.000) *** | −0.671(0.000) *** | |||||
| A | A1 | −0.264(0.000) *** | −0.285(0.000) *** | −0.290(0.000) *** | −0.282(0.000) *** | ||||
| A2 | −0.030(0.447) | −0.206(0.000) *** | 0.033(0.423) | −0.071(0.059) * | |||||
| A3 | 0.600(0.000) *** | 0.517(0.012) ** | 0.272(0.135) | 0.419(0.005) *** | |||||
| A4 | 0.076(0.000) *** | 0.101(0.000) *** | 0.083(0.001) *** | 0.016(0.473) | |||||
| B | B1 | 0.019(0.000) *** | 0.011(0.007) *** | 0.012(0.001) *** | 0.018(0.000) *** | ||||
| B2 | −0.017(0.000) *** | −0.018(0.000) *** | −0.005(0.011) ** | −0.013(0.000) *** | |||||
| C | C1 | 0.200(0.000) *** | 0.149(0.000) *** | 0.282(0.00) *** | 0.150(0.000) *** | ||||
| C2 | −0.182(0.000) *** | −0.062(0.085) * | −0.289(0.000) *** | −0.098(0.000) *** | |||||
| C3 | 0.113(0.000) *** | 0.047(0.117) | 0.177(0.000) *** | 0.071(0.002) *** | |||||
| D | D1 | 0.016(0.050) * | −0.011(0.250) | 0.005(0.566) | 0.004(0.639) | ||||
| D2 | 0.048(0.000) *** | 0.034(0.000) *** | 0.008(0.339) | 0.033(0.000) *** | |||||
| D3 | −0.018(0.037) ** | −0.029(0.037) ** | −0.084(0.000) *** | −0.038(0.001) *** | |||||
Note: FH means the group of banks that belong to the financial holding company. Non-FH means the group of banks that do not belong to the financial holding company. Gov-controlled means the group of banks that are controlled by the government. Non-gov-controlled means the group of banks that are not controlled by the government. “A” represents the first aspect, ownership structure. “B” represents the second aspect, board structure. “C” represents the third aspect, deviation. Finally, “D” represents the fourth aspect, the firm’s information environment. The aspect A includes four variables: A1 is the shareholding ratio of directors and supervisors, A2 is the shareholding ratio of major shareholders, A3 is the shareholding ratio of the management, and A4 is the percentage of shares collateralized or pledged by directors and supervisors. The aspect B includes two variables: B1 is the percentage of independent directors and B2 is the number of board members. The aspect C includes three variables: C1 is the deviation between earnings control and ownership control, C2 is the deviation between earning control and board seat control, and C3 is the deviation between ownership control and board seat control. The aspect D includes three variables: D1 means whether financial statements are restated, D2 is the number of CPA changes in three years, and D3 means whether producing financial projections. This table assumes that the aspect credit risk follows the Markov regime-switching process. “Risk—low” means the low regime of aspect—credit risk. “Risk—high” means the high regime of aspect credit risk. The number in parentheses is p-value. *, **, and *** are denoted significant at the 10%, 5%, and 1% levels, respectively.
Table 4.
Determinants of credit spread (regime specification is ownership structure).
| Dependent Variables | Financial Holding Company | Government-Controlled Bank | |||||||
|---|---|---|---|---|---|---|---|---|---|
| FH | Non-FH | Gov-Controlled | Non-Gov-Controlled | ||||||
| A–Low | A1 | −0.374(0.000) *** | --- | 0.965(0.000) *** | --- | 0.665(0.000) *** | --- | 1.126(0.000) *** | --- |
| A2 | −0.165(0.000) *** | --- | 1.182(0.000) *** | --- | 1.083(0.000) *** | --- | 1.135(0.000) *** | --- | |
| A3 | −0.349(0.013) ** | --- | 6.034(0.000) *** | --- | 4.521(0.000) *** | --- | 4.677(0.000) *** | --- | |
| A4 | −0.055(0.005) *** | --- | 0.861(0.000) *** | --- | 1.199(0.000) *** | --- | 0.966(0.000) *** | --- | |
| A–High | A1 | --- | 0.943(0.000) *** | --- | −0.361(0.000) *** | --- | −0.389(0.000) *** | --- | −0.365(0.000) *** |
| A2 | --- | 1.110(0.000) *** | --- | −0.312(0.000) *** | --- | −0.198(0.000) *** | --- | −0.169(0.000) *** | |
| A3 | --- | 4.591(0.000) *** | --- | 0.133(0.533) | --- | −0.443(0.021) ** | --- | 0.089(0.579) | |
| A4 | --- | 1.171(0.000) *** | --- | 0.048(0.112) | --- | −0.008(0.740) | --- | –0.053(0.022) ** | |
| Constant | −0.620(0.000) *** | −0.481(0.000) *** | −0.495(0.000) *** | −0.696(0.000) *** | |||||
| B | B1 | 0.011(0.000) *** | 0.008(0.040) ** | 0.001(0.831) | 0.015(0.000) *** | ||||
| B2 | −0.011(0.000) *** | −0.018(0.000) *** | −0.014(0.000) *** | −0.012(0.000) *** | |||||
| C | C1 | 0.128(0.000) *** | 0.136(0.000) *** | 0.131(0.000) *** | 0.144(0.000) *** | ||||
| C2 | −0.153(0.000) *** | −0.056(0.117) | −0.169(0.000) *** | −0.098(0.000) *** | |||||
| C3 | 0.107(0.000) *** | 0.040(0.185) | 0.113(0.000) *** | 0.066(0.004) *** | |||||
| D | D1 | 0.005(0.479) | −0.012(0.217) | 0.003(0.708) | 0.001(0.844) | ||||
| D2 | 0.017(0.007) *** | 0.031(0.001) *** | 0.005(0.507) | 0.032(0.000) *** | |||||
| D3 | 0.006(0.631) | −0.007(0.648) | 0.050(0.001) *** | −0.022(0.063) * | |||||
| Risk | 0.217(0.000) *** | 0.217(0.000) *** | 0.208(0.000) *** | 0.230(0.000) *** | |||||
Note: FH means the group of banks that belong to the financial holding company. Non-FH means the group of banks that do not belong to the financial holding company. Gov-controlled means the group of banks that are controlled by the government. Non-gov-controlled means the group of banks that are not controlled by the government. There are four aspects of corporate governance. “A” represents the first aspect, ownership structure. “B” represents the second aspect, board structure. “C” represents the third aspect, deviation. Finally, “D” represents the fourth aspect, the firm’s information environment. The aspect A includes four variables: A1 is the shareholding ratio of directors and supervisors, A2 is the shareholding ratio of major shareholders, A3 is the shareholding ratio of the management, and A4 is the percentage of shares collateralized or pledged by directors and supervisors. The aspect B includes two variables: B1 is the percentage of independent directors and B2 is the number of board members. The aspect C includes three variables: C1 is the deviation between earnings control and ownership control, C2 is the deviation between earning control and board seat control, and C3 is the deviation between ownership control and board seat control. The aspect D includes three variables: D1 means whether financial statements are restated, D2 is the number of CPA changes in three years, and D3 means whether producing financial projections. This table assumes that the aspect A follows the Markov regime-switching process. “A—low” means the low regime of aspect A. “A—high” means the high regime of aspect A. The number in parentheses is p-value. *, **, and *** are denoted significant at the 10%, 5%, and 1% levels, respectively.
Table 5.
Determinants of credit spread (regime specification is board structure).
| Dependent Variables | Financial Holding Company | Government-Controlled Bank | |||||||
|---|---|---|---|---|---|---|---|---|---|
| FH | Non-FH | Gov-Controlled | Non-Gov-Controlled | ||||||
| B–Low | B1 | 0.004(0.188) | --- | 0.017(0.000) *** | --- | −0.098(0.000) *** | --- | -0.054(0.000) *** | --- |
| B2 | −0.025(0.000) *** | --- | −0.027(0.000) *** | --- | 0.062(0.000) *** | --- | 0.070(0.000) *** | --- | |
| B–High | B1 | --- | 0.053(0.002) *** | --- | −0.080(0.000) *** | --- | 0.012(0.001) *** | --- | 0.022(0.000) *** |
| B2 | --- | 0.183(0.000) *** | --- | 0.067(0.000) *** | --- | −0.024(0.000) *** | --- | −0.021(0.000) *** | |
| Constant | −0.538(0.000) *** | −0.449(0.000) *** | −0.469(0.000) *** | −0.651(0.000) *** | |||||
| A | A1 | −0.242(0.000) *** | −0.258(0.000) *** | −0.301(0.000) *** | −0.252(0.000) *** | ||||
| A2 | −0.172(0.000) *** | −0.223(0.000) *** | −0.121(0.003) *** | −0.091(0.016) ** | |||||
| A3 | 0.420(0.007) *** | 0.555(0.008) *** | 0.039(0.832) | 0.488(0.001) *** | |||||
| A4 | 0.152(0.000) *** | 0.107(0.000) *** | 0.089(0.000) *** | 0.015(0.496) | |||||
| B | C1 | 0.157(0.000) *** | 0.139(0.000) *** | 0.143(0.000) *** | 0.145(0.000) *** | ||||
| C2 | −0.136(0.000) *** | −0.060(0.095) * | −0.178(0.000) *** | −0.098(0.000) *** | |||||
| C3 | 0.072(0.006) *** | 0.033(0.276) | 0.113(0.000) *** | 0.057(0.012) ** | |||||
| C | D1 | 0.020(0.018) ** | −0.012(0.230) | 0.005(0.547) | 0.001(0.932) | ||||
| D2 | 0.043(0.000) *** | 0.034(0.000) *** | 0.006(0.495) | 0.035(0.000) *** | |||||
| D3 | −0.002(0.977) | −0.018(0.205) | 0.050(0.001) *** | −0.025(0.037) ** | |||||
| Risk | 0.226(0.000) *** | 0.217(0.000) *** | 0.207(0.000) *** | 0.229(0.000) *** | |||||
Note: FH means the group of banks that belong to the financial holding company. Non-FH means the group of banks that do not belong to the financial holding company. Gov-controlled means the group of banks that are controlled by the government. Non-gov-controlled means the group of banks that are not controlled by the government. There are four aspects of corporate governance. “A” represents the first aspect, ownership structure. “B” represents the second aspect, board structure. “C” represents the third aspect, deviation. Finally, “D” represents the fourth aspect, the firm’s information environment. The aspect A includes four variables: A1 is the shareholding ratio of directors and supervisors, A2 is the shareholding ratio of major shareholders, A3 is the shareholding ratio of the management, and A4 is the percentage of shares collateralized or pledged by directors and supervisors. The aspect B includes two variables: B1 is the percentage of independent directors and B2 is the number of board members. The aspect C includes three variables: C1 is the deviation between earnings control and ownership control, C2 is the deviation between earning control and board seat control, and C3 is the deviation between ownership control and board seat control. The aspect D includes three variables: D1 means whether financial statements are restated, D2 is the number of CPA changes in three years, and D3 means whether producing financial projections. This table assumes that the aspect B follows the Markov regime-switching process. “B—low” means the low regime of aspect B. “B—high” means the high regime of aspect B. The number in parentheses is p-value. *, **, and *** are denoted significant at the 10%, 5%, and 1% levels, respectively.
Table 6.
Determinants of credit spread (regime specification is deviation).
| Dependent Variables | Financial Holding Company | Government-Controlled Bank | |||||||
|---|---|---|---|---|---|---|---|---|---|
| FH | Non-FH | Gov-Controlled | Non-Gov-Controlled | ||||||
| C–Low | C1 | 1.394(0.000) *** | --- | 2.868(0.000) *** | --- | 0.057(0.055) * | --- | 0.131(0.000) *** | --- |
| C2 | −1.452(0.000) *** | --- | −3.106(0.000) *** | --- | −0.110(0.000) *** | --- | −0.018(0.533) | --- | |
| C3 | 1.023(0.000) *** | --- | 2.871(0.000)*** | --- | 0.074(0.005) *** | --- | −0.034(0.175) | --- | |
| C–High | C1 | --- | 0.057(0.000) *** | --- | 0.085(0.039) ** | --- | 1.377(0.000) *** | --- | 1.769(0.000) *** |
| C2 | --- | −0.099(0.000) *** | --- | 0.027(0.549) | --- | −1.552(0.000) *** | --- | 0.125(0.366) | |
| C3 | --- | 0.071(0.000) *** | --- | −0.016(0.686) | --- | 1.017(0.000) *** | --- | 0.069(0.485) | |
| Constant | −0.616(0.000) *** | −0.484(0.000) *** | −0.503(0.000) *** | −1.398(0.000) *** | |||||
| A | A1 | −0.300(0.000) *** | −0.271(0.000) *** | −0.321(0.000) *** | −0.118(0.000) *** | ||||
| A2 | −0.064(0.047) ** | −0.354(0.000) *** | −0.091(0.027) ** | 0.188(0.000) *** | |||||
| A3 | 0.069(0.615) | 1.418(0.000) *** | −0.055(0.772) | 1.516(0.000) *** | |||||
| A4 | 0.028(0.134) | 0.153(0.000) *** | 0.083(0.001) *** | 0.007(0.769) | |||||
| B | B1 | 0.014(0.000) *** | −0.016(0.001) *** | 0.004(0.272) | 0.019(0.000) *** | ||||
| B2 | −0.012(0.000) *** | −0.018(0.000) *** | −0.014(0.000) *** | 0.027(0.000) *** | |||||
| D | D1 | 0.005(0.431) | −0.003(0.789) | 0.004(0.671) | −0.015(0.062) * | ||||
| D2 | 0.018(0.006) *** | 0.041(0.001) *** | 0.006(0.460) | 0.037(0.000) *** | |||||
| D3 | −0.027(0.013) ** | 0.143(0.000) *** | 0.004(0.974) | −0.077(0.000) *** | |||||
| Risk | 0.215(0.000) *** | 0.231(0.000) *** | 0.208(0.000) *** | 0.260(0.000) *** | |||||
Note: FH means the group of banks that belong to the financial holding company. Non-FH means the group of banks that do not belong to the financial holding company. Gov-controlled means the group of banks that are controlled by the government. Non-gov-controlled means the group of banks that are not controlled by the government. There are four aspects of corporate governance. “A” represents the first aspect, ownership structure. “B” represents the second aspect, board structure. “C” represents the third aspect, deviation. Finally, “D” represents the fourth aspect, the firm’s information environment. The aspect A includes four variables: A1 is the shareholding ratio of directors and supervisors, A2 is the shareholding ratio of major shareholders, A3 is the shareholding ratio of the management, and A4 is the percentage of shares collateralized or pledged by directors and supervisors. The aspect B includes two variables: B1 is the percentage of independent directors and B2 is the number of board members. The aspect C includes three variables: C1 is the deviation between earnings control and ownership control, C2 is the deviation between earning control and board seat control, and C3 is the deviation between ownership control and board seat control. The aspect D includes three variables: D1 means whether financial statements are restated, D2 is the number of CPA changes in three years, and D3 means whether producing financial projections. This table assumes that the aspect C follows the Markov regime-switching process. “C—low” means the low regime of aspect C. “C—high” means the high regime of aspect C. The number in parentheses is p-value. *, **, and *** are denoted significant at the 10%, 5%, and 1% levels, respectively.
Table 7.
Determinants of credit spread (regime specification is firm’s information environment).
| Dependent Variables | Financial Holding Company | Government-Controlled Bank | |||||||
|---|---|---|---|---|---|---|---|---|---|
| FH | Non-FH | Gov-Controlled | Non-Gov-Controlled | ||||||
| D–Low | D1 | 0.198(0.000) *** | --- | 0.221(0.000) *** | --- | 0.199(0.000) *** | --- | −0.013(0.107) | --- |
| D2 | 0.633(0.000) *** | --- | 0.594(0.000) *** | --- | 0.611(0.000) *** | --- | 0.008(0.293) | --- | |
| D3 | 0.513(0.000) *** | --- | 0.551(0.000) *** | --- | 0.524(0.000) *** | --- | −0.158(0.000) *** | --- | |
| D–High | D1 | --- | −0.009(0.207) | --- | −0.028(0.005) *** | --- | −0.013(0.156) | --- | 0.201(0.000) *** |
| D2 | --- | −0.012(0.073) * | --- | 0.009(0.365) | --- | −0.026(0.002) *** | --- | 0.608(0.000) *** | |
| D3 | --- | −0.138(0.000) *** | --- | −0.173(0.000) *** | --- | −0.155(0.000) *** | --- | 0.526(0.000) *** | |
| Constant | −0.631(0.000) *** | −0.514(0.000) *** | −0.516(0.000) *** | −0.720(0.000) *** | |||||
| A | A1 | −0.281(0.000) *** | −0.241(0.000) *** | −0.293(0.000) *** | −0.253(0.000) *** | ||||
| A2 | −0.151(0.000) *** | −0.265(0.000) *** | −0.171(0.000) *** | −0.142(0.000) *** | |||||
| A3 | 0.252(0.056) * | 0.675(0.001) *** | 0.172(0.345) | 0.537(0.000) *** | |||||
| A4 | 0.045(0.015) ** | 0.138(0.000) *** | 0.104(0.000) *** | 0.045(0.040) ** | |||||
| B | B1 | 0.006(0.028) ** | 0.003(0.441) | −0.004(0.236) | 0.009(0.001) *** | ||||
| B2 | −0.009(0.000) *** | −0.016(0.000) *** | −0.012(0.000) *** | −0.010(0.000) *** | |||||
| C | C1 | 0.108(0.000) *** | 0.145(0.000) *** | 0.124(0.000) *** | 0.134(0.000) *** | ||||
| C2 | −0.127(0.000) *** | −0.060(0.095) * | −0.154(0.000) *** | −0.081(0.002) *** | |||||
| C3 | 0.079(0.000) *** | 0.032(0.286) | 0.094(0.000) *** | 0.046(0.041) ** | |||||
| Risk | 0.222(0.000) *** | 0.220(0.000) *** | 0.211(0.000) *** | 0.236(0.000) *** | |||||
Note: FH means the group of banks that belong to the financial holding company. Non-FH means the group of banks that do not belong to the financial holding company. Gov-controlled means the group of banks that are controlled by the government. Non-gov-controlled means the group of banks that are not controlled by the government. There are four aspects of corporate governance. “A” represents the first aspect, ownership structure. “B” represents the second aspect, board structure. “C” represents the third aspect, deviation. Finally, “D” represents the fourth aspect, the firm’s information environment. The aspect A includes four variables: A1 is the shareholding ratio of directors and supervisors, A2 is the shareholding ratio of major shareholders, A3 is the shareholding ratio of the management, and A4 is the percentage of shares collateralized or pledged by directors and supervisors. The aspect B includes two variables: B1 is the percentage of independent directors and B2 is the number of board members. The aspect C includes three variables: C1 is the deviation between earnings control and ownership control, C2 is the deviation between earning control and board seat control, and C3 is the deviation between ownership control and board seat control. The aspect D includes three variables: D1 means whether financial statements are restated, D2 is the number of CPA changes in three years, and D3 means whether producing financial projections. This table assumes that the aspect D follows the Markov regime-switching process. “D—low” means the low regime of aspect D. “D—high” means the high regime of aspect D. The number in parentheses is p-value. *, **, and *** are denoted significant at the 10%, 5%, and 1% levels, respectively.
Table 8.
Likelihood ratio tests for Markov regime-switching model against single-regime model.
| Financial Holding Company | Government-Controlled Bank | |||||||
|---|---|---|---|---|---|---|---|---|
| FH | Non-FH | Gov-Controlled | Non-Gov-Controlled | |||||
| Monetary Policy | Economic Status | Monetary Policy | Economic Status | Monetary Policy | Economic Status | Monetary Policy | Economic Status | |
| Risk | 200.796(0.000) *** | 68.818(0.000) *** | 808.665(0.000) *** | 110.500(0.000) *** | 1050.072(0.000) *** | 1.056(0.304) | 229.605(0.000) *** | 1001.847(0.000) *** |
| A | 196.188(0.000) *** | 48.111(0.000) *** | 722.572(0.000) *** | 103.039(0.000) *** | 1151.507(0.000) *** | 20.762(0.000) *** | 178.141(0.000) *** | 1036.366(0.000) *** |
| B | 192.313(0.000) *** | 62.793(0.000) *** | 801.943(0.000) *** | 106.634(0.000) *** | 1211.149(0.000) *** | 7.671(0.022) ** | 166.720(0.000) *** | 1173.089(0.000) *** |
| C | 206.709(0.000) *** | 59.013(0.000) *** | 822.115(0.000) *** | 107.231(0.000) *** | 1162.484(0.000) *** | 4.451(0.217) | 190.650(0.000) *** | 1073.035(0.000) *** |
| D | 98.239(0.000) *** | 57.171(0.000) *** | 202.519(0.000) *** | 32.383(0.000) *** | 1198.482(0.000) *** | 29.059(0.000) *** | 123.608(0.000) *** | 1351.968(0.000) *** |
Note: FH means the group of banks that belong to the financial holding company. Non-FH means the group of banks that do not belong to the financial holding company. Gov-controlled means the group of banks that are controlled by the government. Non-gov-controlled means the group of banks that are not controlled by the government. “A” represents the first aspect, ownership structure. “B” represents the second aspect, board structure. “C” represents the third aspect, deviation. Finally, “D” represents the fourth aspect, the firm’s information environment. The aspect A includes four variables: A1 is the shareholding ratio of directors and supervisors, A2 is the shareholding ratio of major shareholders, A3 is the shareholding ratio of the management, and A4 is the percentage of shares collateralized or pledged by directors and supervisors. The aspect B includes two variables: B1 is the percentage of independent directors and B2 is the number of board members. The aspect C includes three variables: C1 is the deviation between earnings control and ownership control, C2 is the deviation between earning control and board seat control, and C3 is the deviation between ownership control and board seat control. The aspect D includes three variables: D1 means whether financial statements are restated, D2 is the number of CPA changes in three years, and D3 means whether producing financial projections. The number in parentheses is p-value. **, and *** are denoted significant at the 5%, and 1% levels, respectively.
Table 9.
The effects of monetary policy and economic status on determinants of credit spread and credit risk.
Table 9.
The effects of monetary policy and economic status on determinants of credit spread and credit risk.
| Dependent Variables | Financial Holding Company | Government-Controlled Bank | ||||||
|---|---|---|---|---|---|---|---|---|
| FH | Non-FH | Gov-Controlled | Non-Gov Controlled | |||||
| Monetary Policy | Economic Status | Monetary Policy | Economic Status | Monetary Policy | Economic Status | Monetary Policy | Economic Status | |
| Constant | −0.606(0.000) *** | −0.602(0.000) *** | −0.585(0.000) *** | −0.581(0.000) *** | −0.436(0.000) *** | −0.448(0.000) *** | −0.802(0.000) *** | −0.792(0.000) *** |
| Risk | 0.257(0.000) *** | 0.292(0.000) *** | 0.257(0.000) *** | 0.267(0.000) *** | 0.202(0.000) *** | 0.204(0.000) *** | 0.279(0.000) *** | 0.249(0.000) *** |
| Risk*dv | 0.022(0.000) *** | -0.049(0.000) *** | 0.020(0.000) *** | 0.002(0.342) | 0.062(0.000) *** | 0.049(0.000) *** | 0.019(0.000) *** | 0.060(0.000) *** |
| A1 | −0.291(0.000) *** | −0.289(0.000) *** | −0.239(0.000) *** | −0.249(0.000) *** | −0.362(0.000) *** | −0.353(0.000) *** | −0.208(0.000) *** | −0.198(0.000) *** |
| A2 | −0.572(0.000) *** | −0.581(0.000) *** | −0.662(0.000) *** | −0.663(0.000) *** | −0.489(0.000) *** | −0.505(0.000) *** | −0.552(0.000) *** | −0.556(0.000) *** |
| A3 | 1.095(0.000) *** | 1.173(0.000) *** | 2.029(0.000) *** | 1.992(0.000) *** | 1.022(0.000) *** | 0.916(0.001) *** | 1.360(0.000) *** | 1.459(0.000) *** |
| A4 | 0.248(0.000) *** | 0.245(0.000) *** | 0.251(0.000) *** | 0.245(0.000) *** | 0.308(0.000) *** | 0.305(0.000) *** | 0.221(0.000) *** | 0.214(0.000) *** |
| B1 | −0.058(0.000) *** | −0.060(0.000) *** | −0.062(0.000) *** | −0.061(0.000) *** | −0.067(0.000) *** | −0.062(0.000) *** | −0.047(0.000) *** | −0.045(0.000) *** |
| B2 | −0.011(0.000) *** | −0.011(0.000) *** | −0.020(0.000) *** | −0.020(0.000) *** | −0.016(0.000) *** | −0.017(0.000) *** | −0.011(0.000) *** | −0.012(0.000) *** |
| C1 | 0.109(0.001) *** | 0.111(0.000) *** | 0.255(0.000) *** | 0.257(0.000) *** | 0.177(0.000) *** | 0.186(0.000) *** | 0.174(0.000) *** | 0.171(0.000) *** |
| C2 | −0.085(0.016) ** | −0.082(0.019) ** | −0.034(0.494) *** | −0.035(0.488) | −0.206(0.000) *** | −0.218(0.000) *** | −0.005(0.875) | −0.003(0.935) |
| C3 | 0.035(0.244) | 0.029(0.330) | 0.024(0.544) | 0.027(0.495) | 0.136(0.005) *** | 0.141(0.003) *** | −0.022(0.414) | −0.030(0.268) |
| D1 | 0.015(0.166) | 0.007(0.527) | 0.009(0.555) | 0.007(0.650) | 0.026(0.070) * | 0.023(0.110) | 0.011(0.375) | 0.001(0.906) |
| D2 | 0.017(0.082) * | 0.024(0.012) ** | 0.008(0.565) | 0.006(0.662) | 0.006(0.634) | −0.003(0.787) | 0.019(0.074) * | 0.031(0.003) *** |
| D3 | 0.296(0.000) *** | 0.319(0.000) *** | 0.329(0.000) *** | 0.328(0.000) *** | 0.294(0.000) *** | 0.308(0.000) *** | 0.292(0.000) *** | 0.313(0.000) *** |
| Restricted test | 315.299(0.000) *** | 403.413(0.000) *** | 315.725(0.000) *** | 142.777(0.000) *** | 81.478(0.000) *** | 88.238(0.000) *** | 359.471(0.000) *** | 343.035(0.000) *** |
Note: FH means the group of banks that belong to the financial holding company. Non-FH means the group of banks that do not belong to the financial holding company. Gov-controlled means the group of banks that are controlled by the government. Non-gov-controlled means the group of banks that are not controlled by the government. There are four aspects of corporate governance. “A” represents the first aspect, ownership structure. “B” represents the second aspect, board structure. “C” represents the third aspect, deviation. Finally, “D” represents the fourth aspect, the firm’s information environment. The aspect A includes four variables: A1 is the shareholding ratio of directors and supervisors, A2 is the shareholding ratio of major shareholders, A3 is the shareholding ratio of the management, and A4 is the percentage of shares collateralized or pledged by directors and supervisors. The aspect B includes two variables: B1 is the percentage of independent directors and B2 is the number of board members. The aspect C includes three variables: C1 is the deviation between earnings control and ownership control, C2 is the deviation between earning control and board seat control, and C3 is the deviation between ownership control and board seat control. The aspect D includes three variables: D1 means whether financial statements are restated, D2 is the number of CPA changes in three years, and D3 means whether producing financial projections. dv is dummy variable. dv equals one or zero according to smoothed probability of monetary policy or economic status are above or below the cutoff point 0.5. The number in parentheses is p-value. 5. *, **, and *** are denoted significant at the 10%, 5%, and 1% levels, respectively.
Table 10.
The effects of monetary policy and economic status on determinants of credit spread—ownership structure.
Table 10.
The effects of monetary policy and economic status on determinants of credit spread—ownership structure.
| Dependent Variables | Financial Holding Company | Government-Controlled Bank | ||||||
|---|---|---|---|---|---|---|---|---|
| FH | Non-FH | Gov-Controlled | Non-Gov Controlled | |||||
| Monetary Policy | Economic Status | Monetary Policy | Economic Status | Monetary Policy | Economic Status | Monetary Policy | Economic Status | |
| Constant | −0.607(0.000) *** | −0.604(0.000) *** | −0.586(0.000) *** | −0.583(0.000) *** | −0.439(0.000) *** | −0.451(0.000) *** | −0.802(0.000) *** | −0.802(0.000) *** |
| Risk | 0.271(0.000) *** | 0.269(0.000) *** | 0.268(0.000) *** | 0.268(0.000) *** | 0.246(0.000) *** | 0.248(0.000) *** | 0.291(0.000) *** | 0.290(0.000) *** |
| A1 | −0.387(0.000) *** | −0.019(0.596) | −0.330(0.000) *** | −0.238(0.000) *** | −0.758(0.000) *** | −0.800(0.000) *** | −0.302(0.000) *** | −0.699(0.000) *** |
| A2 | −0.849(0.000) *** | −0.451(0.000) *** | −0.764(0.000) *** | −0.630(0.000) *** | −0.845(0.000) *** | −0.570(0.000) *** | −0.765(0.000) *** | −0.573(0.000) *** |
| A3 | 1.670(0.000) *** | 2.522(0.000) *** | 1.791(0.000) *** | 1.715(0.000) *** | −0.038(0.924) | −0.517(0.239) | 1.932(0.000) *** | −0.570(0.061) * |
| A4 | 0.218(0.000) *** | 0.376(0.000) *** | 0.200(0.001) *** | 0.116(0.033) ** | −0.142(0.005) *** | −0.337(0.000) *** | 0.168(0.001) *** | −0.251(0.000) *** |
| A1*dv | 0.155(0.000) *** | −0.589(0.000) *** | 0.164(0.004) *** | −0.029(0.614) | 0.567(0.000) *** | 0.504(0.000) *** | 0.150(0.000) *** | 0.731(0.000) *** |
| A2*dv | 0.450(0.000) *** | −0.277(0.000) *** | 0.187(0.023) ** | −0.083(0.332) | 0.491(0.000) *** | 0.072(0.330) | 0.340(0.000) *** | 0.039(0.553) |
| A3*dv | −0.960(0.010) * | −2.929(0.000) *** | 0.437(0.458) | 0.715(0.256) | 1.532(0.003) *** | 1.629(0.001) *** | −0.931(0.022) ** | 3.028(0.000) *** |
| A4*dv | 0.043(0.431) | −0.289(0.000) *** | 0.086(0.293) | 0.324(0.000) *** | 0.621(0.000) *** | 0.704(0.000) *** | 0.085(0.195) | 0.676(0.000) *** |
| B1 | −0.058(0.000) *** | −0.059(0.000) *** | −0.062(0.000) *** | −0.061(0.000) *** | −0.067(0.000) *** | −0.063(0.000) *** | −0.048(0.000) *** | −0.045(0.000) *** |
| B2 | −0.011(0.000) *** | −0.010(0.000) *** | −0.020(0.000) *** | −0.020(0.000) *** | −0.017(0.000) *** | −0.017(0.000) *** | −0.011(0.000) *** | −0.012(0.000) *** |
| C1 | 0.111(0.001) *** | 0.112(0.000) *** | 0.257(0.000) *** | 0.259(0.000) *** | 0.187(0.000) *** | 0.189(0.000) *** | 0.174(0.000) *** | 0.180(0.000) *** |
| C2 | −0.085(0.015) ** | −0.079(0.024) ** | −0.037(0.465) | −0.038(0.456) | −0.217(0.000) *** | −0.223(0.000) *** | −0.005(0.876) | −0.011(0.755) |
| C3 | 0.035(0.243) | 0.026(0.390) | 0.025(0.513) | 0.029(0.460) | 0.142(0.003) *** | 0.144(0.002) *** | −0.022(0.413) | −0.029(0.278) |
| D1 | 0.016(0.136) | 0.007(0.542) | 0.009(0.552) | 0.008(0.616) | 0.025(0.086) * | 0.024(0.096) * | 0.012(0.326) | 0.001(0.918) |
| D2 | 0.016(0.097) * | 0.024(0.011) ** | 0.007(0.603) | 0.006(0.662) | 0.008(0.535) | 0.004(0.997) | 0.018(0.083) * | 0.032(0.002) |
| D3 | 0.297(0.000) *** | 0.317(0.000) *** | 0.328(0.000) *** | 0.330(0.000) *** | 0.297(0.000) *** | 0.310(0.000) *** | 0.294(0.000) *** | 0.304(0.000) *** |
| Restricted test | 124.271(0.000) *** | 408.917(0.000) *** | 35.431(0.000) *** | 15.633(0.004) ** | 91.606(0.000) *** | 57.455(0.000) *** | 87.977(0.000) *** | 84.320(0.000) *** |
Note: FH means the group of banks that belong to the financial holding company. Non-FH means the group of banks that do not belong to the financial holding company. Gov-controlled means the group of banks that are controlled by the government. Non-gov-controlled means the group of banks that are not controlled by the government. There are four aspects of corporate governance. “A” represents the first aspect, ownership structure. “B” represents the second aspect, board structure. “C” represents the third aspect, deviation. Finally, “D” represents the fourth aspect, the firm’s information environment. The aspect A includes four variables: A1 is the shareholding ratio of directors and supervisors, A2 is the shareholding ratio of major shareholders, A3 is the shareholding ratio of the management, and A4 is the percentage of shares collateralized or pledged by directors and supervisors. The aspect B includes two variables: B1 is the percentage of independent directors and B2 is the number of board members. The aspect C includes three variables: C1 is the deviation between earnings control and ownership control, C2 is the deviation between earning control and board seat control, and C3 is the deviation between ownership control and board seat control. The aspect D includes three variables: D1 means whether financial statements are restated, D2 is the number of CPA changes in three years, and D3 means whether producing financial projections. dv is dummy variable. dv equals one or zero according to smoothed probability of monetary policy or economic status are above or below the cutoff point 0.5. The number in parentheses is p-value. 5.*, **, and *** are denoted significant at the 10%, 5%, and 1% levels, respectively.
Table 11.
The effects of monetary policy and economic status on determinants of credit spread—board structure.
Table 11.
The effects of monetary policy and economic status on determinants of credit spread—board structure.
| Dependent Variables | Financial Holding Company | Government-Controlled Bank | ||||||
|---|---|---|---|---|---|---|---|---|
| FH | Non-FH | Gov-Controlled | Non-Gov Controlled | |||||
| Monetary Policy | Economic Status | Monetary Policy | Economic Status | Monetary Policy | Economic Status | Monetary Policy | Economic Status | |
| Constant | −0.612(0.000) *** | −0.602(0.000) *** | −0.585(0.000) *** | −0.584(0.000) *** | −0.413(0.000) *** | −0.437(0.000) *** | −0.807(0.000) *** | −15.534(0.000) *** |
| Risk | 0.271(0.000) *** | 0.268(0.000) *** | 0.268(0.000) *** | 0.268(0.000) *** | 0.245(0.000) *** | 0.248(0.000) *** | 0.291(0.000) *** | 68.428(0.000) *** |
| A1 | −0.293(0.000) *** | −0.290(0.000) *** | −0.245(0.000) *** | −0.248(0.000) *** | −0.351(0.000) *** | −0.003(0.000) *** | −0.211(0.000) *** | −5.768(0.000) *** |
| A2 | −0.572(0.000) *** | −0.581(0.000) *** | −0.660(0.000) *** | −0.664(0.000) *** | −0.490(0.000) *** | −0.005(0.000) *** | −0.551(0.000) *** | −9.716(0.000) *** |
| A3 | 1.087(0.000) *** | 1.157(0.000) *** | 2.001(0.000) *** | 2.009(0.000) *** | 1.020(0.000) *** | 0.010(0.001) *** | 1.348(0.000) *** | 6.604(0.000) *** |
| A4 | 0.246(0.000) *** | 0.251(0.000) *** | 0.250(0.000) *** | 0.245(0.000) *** | 0.307(0.000) *** | 0.003(0.000) *** | 0.220(0.000) *** | 6.311(0.000) *** |
| B1 | −0.055(0.000) *** | −0.081(0.000) *** | −0.047(0.000) *** | −0.051(0.000) *** | −0.007(0.310) | −0.013(0.223) | −0.037(0.000) *** | 3.536(0.000) *** |
| B2 | −0.019(0.000) *** | 0.007(0.002) *** | −0.027(0.000) *** | −0.022(0.000) *** | −0.053(0.000) *** | −0.050(0.000) *** | −0.019(0.000) *** | −16.616(0.000) *** |
| B1*dv | −0.004(0.551) | 0.044(0.000) *** | −0.027(0.010) ** | −0.025(0.024) ** | −0.079(0.000) *** | −0.054(0.000) *** | −0.017(0.029) ** | −12.774(0.000) *** |
| B2*dv | 0.014(0.000) *** | −0.037(0.000) *** | 0.014(0.000) *** | 0.005(0.016) ** | 0.048(0.000) *** | 0.035(0.000) *** | 0.013(0.000) *** | 31.158(0.000) *** |
| C1 | 0.111(0.001) *** | 0.115(0.000) *** | 0.256(0.000) *** | 0.259(0.000) *** | 0.184(0.000) *** | 0.002(0.000) *** | 0.176(0.000) *** | 5.019(0.000) *** |
| C2 | −0.087(0.014) ** | −0.086(0.015) ** | −0.037(0.466) | −0.037(0.464) | −0.215(0.000) *** | −0.002(0.000) *** | −0.009(0.799) | −0.080(0.937) |
| C3 | 0.037(0.225) | 0.033(0.275) | 0.026(0.500) | 0.028(0.470) | 0.134(0.005) *** | 0.001(0.005) *** | −0.019(0.479) | −0.983(0.326) |
| D1 | 0.015(0.177) | 0.004(0.704) | 0.009(0.572) | 0.007(0.654) | 0.027(0.066) * | 0.023(0.118) | 0.010(0.402) | −0.164(0.870) |
| D2 | 0.017(0.085) * | 0.024(0.012) ** | 0.007(0.581) | 0.006(0.661) | 0.005(0.660) | −0.002(0.874) | 0.018(0.079) * | 3.075(0.002) *** |
| D3 | 0.297(0.000) *** | 0.314(0.000) *** | 0.328(0.000) *** | 0.329(0.000) *** | 0.290(0.000) *** | 0.309(0.000) *** | 0.293(0.000) *** | 20.022(0.000) *** |
| Restrict test | 151.641(0.000) *** | 361.631(0.000) *** | 65.165(0.000) *** | 64.293(0.000) *** | 135.089(0.000) *** | 62.507(0.000) *** | 224.873(0.000) *** | 218.631(0.000) *** |
Note: FH means the group of banks that belong to the financial holding company. Non-FH means the group of banks that do not belong to the financial holding company. Gov-controlled means the group of banks that are controlled by the government. Non-gov-controlled means the group of banks that are not controlled by the government. There are four aspects of corporate governance. “A” represents the first aspect, ownership structure. “B” represents the second aspect, board structure. “C” represents the third aspect, deviation. Finally, “D” represents the fourth aspect, the firm’s information environment. The aspect A includes four variables: A1 is the shareholding ratio of directors and supervisors, A2 is the shareholding ratio of major shareholders, A3 is the shareholding ratio of the management, and A4 is the percentage of shares collateralized or pledged by directors and supervisors. The aspect B includes two variables: B1 is the percentage of independent directors and B2 is the number of board members. The aspect C includes three variables: C1 is the deviation between earnings control and ownership control, C2 is the deviation between earning control and board seat control, and C3 is the deviation between ownership control and board seat control. The aspect D includes three variables: D1 means whether financial statements are restated, D2 is the number of CPA changes in three years, and D3 means whether producing financial projections. dv is dummy variable. dv equals one or zero according to smoothed probability of monetary policy or economic status are above or below the cutoff point 0.5. The number in parentheses is p-value. *, **, and *** are denoted significant at the 10%, 5%, and 1% levels, respectively.
Table 12.
The effects of monetary policy and economic status on determinants of credit spread—deviation.
Table 12.
The effects of monetary policy and economic status on determinants of credit spread—deviation.
| Dependent Variables | Financial Holding Company | Government-Controlled Bank | ||||||
|---|---|---|---|---|---|---|---|---|
| FH | Non-FH | Gov-Controlled | Non-Gov-Controlled | |||||
| Monetary Policy | Economic Status | Monetary Policy | Economic Status | Monetary Policy | Economic status | Monetary Policy | Economic Status | |
| C | −0.599(0.000) *** | −0.591(0.000) *** | −0.581(0.000) *** | −0.581(0.000) *** | −0.423(0.000) *** | −0.450(0.000) *** | −0.796(0.000) *** | −0.780(0.000) *** |
| Risk | 0.271(0.000) *** | 0.269(0.000) *** | 0.268(0.000) *** | 0.268(0.000) *** | 0.246(0.000) *** | 0.248(0.000) *** | 0.291(0.000) *** | 0.289(0.000) *** |
| A1 | −0.287(0.000) *** | −0.285(0.000) *** | −0.239(0.000) *** | −0.248(0.000) *** | −0.349(0.000) *** | −0.349(0.000) *** | −0.206(0.000) *** | −0.203(0.000) *** |
| A2 | −0.570(0.000) *** | −0.586(0.000) *** | −0.663(0.000) *** | −0.663(0.000) *** | −0.482(0.000) *** | −0.505(0.000) *** | −0.551(0.000) *** | −0.574(0.000) *** |
| A3 | 1.098(0.000) *** | 1.176(0.000) *** | 2.018(0.000) *** | 1.996(0.000) *** | 1.015(0.000) *** | 0.923(0.001) *** | 1.360(0.000) *** | 1.463(0.000) *** |
| A4 | 0.248(0.000) *** | 0.246(0.000) *** | 0.251(0.000) *** | 0.245(0.000) *** | 0.310(0.000) *** | 0.303(0.000) *** | 0.221(0.000) *** | 0.218(0.000) *** |
| B1 | −0.058(0.000) *** | −0.061(0.000) *** | −0.062(0.000) *** | −0.061(0.000) *** | −0.067(0.000) *** | −0.062(0.000) *** | −0.048(0.000) *** | −0.046(0.000) *** |
| B2 | −0.011(0.000) *** | −0.010(0.000) *** | −0.020(0.000) *** | −0.020(0.000) *** | −0.017(0.000) *** | −0.017(0.000) *** | −0.011(0.000) *** | −0.012(0.000) *** |
| C1 | −0.013(0.710) | 0.288(0.000) *** | 0.157(0.002) *** | 0.232(0.000) *** | −0.227(0.000) *** | −0.150(0.004) *** | 0.065(0.080) * | −0.250(0.000) *** |
| C2 | 0.050(0.321) | −0.262(0.000) *** | 0.077(0.234) | −0.026(0.643) | 0.139(0.057) * | 0.038(0.540) | 0.111(0.025) ** | 0.471(0.000) *** |
| C3 | −0.064(0.132) | 0.163(0.000) *** | −0.045(0.386) | 0.047(0.268) | −0.088(0.176) | −0.025(0.616) | −0.101(0.010) ** | −0.287(0.000) *** |
| C1*dv | 0.187(0.000) *** | −0.414(0.000) *** | 0.170(0.000) *** | 0.063(0.073) * | 0.561(0.000) *** | 0.383(0.000) *** | 0.165(0.000) *** | 0.603(0.000) *** |
| C2*dv | −0.198(0.000) *** | 0.443(0.000) *** | −0.186(0.006) *** | −0.028(0.695) | −0.481(0.000) *** | −0.302(0.000) *** | −0.172(0.001) *** | −0.670(0.000) *** |
| C3*dv | 0.141(0.000) *** | −0.336(0.000) *** | 0.112(0.021) ** | −0.045(0.349) | 0.296(0.000) *** | 0.195(0.000) *** | 0.112(0.001) *** | 0.366(0.000) *** |
| D1 | 0.015(0.171) | 0.005(0.619) | 0.009(0.560) | 0.007(0.640) | 0.026(0.076) * | 0.022(0.125) | 0.011(0.367) | 0.001(0.991) |
| D2 | 0.016(0.096) * | 0.025(0.010) ** | 0.007(0.618) | 0.006(0.682) | 0.004(0.723) | −0.002(0.851) | 0.018(0.090) * | 0.029(0.005) *** |
| D3 | 0.296(0.000) *** | 0.319(0.000) *** | 0.329(0.000) *** | 0.329(0.000) *** | 0.292(0.000) *** | 0.308(0.000) *** | 0.293(0.000) *** | 0.311(0.000) *** |
| Restrict test | 196.575(0.000) *** | 315.737(0.000) *** | 84.693(0.000) *** | 81.994(0.000) *** | 241.981(0.000) *** | 93.240(0.000) *** | 251.588(0.000) *** | 471.016(0.000) *** |
Note: FH means the group of banks that belong to the financial holding company. Non-FH means the group of banks that do not belong to the financial holding company. Gov-controlled means the group of banks that are controlled by the government. Non-gov-controlled means the group of banks that are not controlled by the government. There are four aspects of corporate governance. “A” represents the first aspect, ownership structure. “B” represents the second aspect, board structure. “C” represents the third aspect, deviation. Finally, “D” represents the fourth aspect, the firm’s information environment. The aspect A includes four variables: A1 is the shareholding ratio of directors and supervisors, A2 is the shareholding ratio of major shareholders, A3 is the shareholding ratio of the management, and A4 is the percentage of shares collateralized or pledged by directors and supervisors. The aspect B includes two variables: B1 is the percentage of independent directors and B2 is the number of board members. The aspect C includes three variables: C1 is the deviation between earnings control and ownership control, C2 is the deviation between earning control and board seat control, and C3 is the deviation between ownership control and board seat control. The aspect D includes three variables: D1 means whether financial statements are restated, D2 is the number of CPA changes in three years, and D3 means whether producing financial projections. dv is dummy variable. dv equals one or zero according to smoothed probability of monetary policy or economic status are above or below the cutoff point 0.5. The number in parentheses is p-value. *, **, and *** are denoted significant at the 10%, 5%, and 1% levels, respectively.
Table 13.
The effects of monetary policy and economic status on determinants of credit spread—firm’s information environment.
Table 13.
The effects of monetary policy and economic status on determinants of credit spread—firm’s information environment.
| Dependent Variables | Financial Holding Company | Government-Controlled Bank | ||||||
|---|---|---|---|---|---|---|---|---|
| FH | Non-FH | Gov-Controlled | Non-Gov-Controlled | |||||
| Monetary Policy | Economic Status | Monetary Policy | Economic Status | Monetary Policy | Economic Status | Monetary Policy | Economic Status | |
| C | −0.605(0.000) *** | −0.614(0.000) *** | −0.589(0.000) *** | −0.586(0.000) *** | −0.434(0.000) *** | −0.441(0.000) *** | −0.799(0.000) *** | −0.824(0.000) *** |
| Risk | 0.271(0.000) *** | 0.270(0.000) *** | 0.268(0.000) *** | 0.268(0.000) *** | 0.248(0.000) *** | 0.248(0.000) *** | 0.291(0.000) *** | 0.293(0.000) *** |
| A1 | −0.287(0.000) *** | −0.280(0.000) *** | −0.251(0.000) *** | −0.252(0.000) *** | −0.334(0.000) *** | −0.331(0.000) *** | −0.208(0.000) *** | −0.213(0.000) *** |
| A2 | −0.569(0.000) *** | −0.562(0.000) *** | −0.654(0.000) *** | −0.658(0.000) *** | −0.530(0.000) *** | −0.524(0.000) *** | −0.548(0.000) *** | −0.525(0.000) *** |
| A3 | 1.064(0.000) *** | 1.057(0.000) *** | 1.996(0.000) *** | 1.992(0.000) *** | 0.993(0.000) *** | 1.006(0.000) *** | 1.322(0.000) *** | 1.341(0.000) *** |
| A4 | 0.242(0.000) *** | 0.235(0.000) *** | 0.249(0.000) *** | 0.250(0.000) *** | 0.316(0.000) *** | 0.319(0.000) *** | 0.216(0.000) *** | 0.203(0.000) *** |
| B1 | −0.056(0.000) *** | −0.049(0.000) *** | −0.061(0.000) *** | −0.062(0.000) *** | −0.069(0.000) *** | −0.067(0.000) *** | −0.046(0.000) *** | −0.032(0.000) *** |
| B2 | −0.011(0.000) *** | −0.012(0.000) *** | −0.020(0.000) *** | -0.019(0.000) *** | −0.017(0.000) *** | −0.017(0.000) *** | −0.012(0.000) *** | −0.013(0.000) *** |
| C1 | 0.107(0.001) *** | 0.120(0.000) *** | 0.262(0.000) *** | 0.258(0.000) *** | 0.170(0.000) *** | 0.177(0.000) *** | 0.173(0.000) *** | 0.186(0.000) *** |
| C2 | −0.086(0.015) ** | −0.088(0.012) ** | −0.041(0.415) | −0.039(0.442) | −0.197(0.000) *** | −0.201(0.000) *** | −0.007(0.829) | −0.018(0.582) |
| C3 | 0.035(0.248) | 0.031(0.294) | 0.028(0.469) | 0.029(0.449) | 0.120(0.011) ** | 0.120(0.011) ** | −0.021(0.429) | −0.023(0.390) |
| D1 | −0.040(0.007) *** | 0.030(0.034) ** | −0.016(0.445) | 0.014(0.523) | −0.055(0.007) *** | −0.189(0.000) *** | −0.059(0.001) *** | −0.039(0.015) ** |
| D2 | −0.039(0.003) *** | 0.097(0.000) *** | 0.024(0.172) | 0.012(0.465) | −0.174(0.000) *** | −0.187(0.000) *** | 0.006(0.692) | −0.070(0.000) *** |
| D3 | 0.388(0.000) *** | 0.635(0.000) *** | 0.228(0.000) *** | 0.270(0.000) *** | 0.120(0.001) *** | 0.084(0.017) ** | 0.337(0.000) *** | −0.144(0.000) *** |
| D1*dv | 0.084(0.000) *** | −0.041(0.055) * | 0.041(0.184) | −0.015(0.623) | 0.099(0.000) *** | 0.222(0.000) *** | 0.109(0.000) *** | 0.067(0.002) *** |
| D2*dv | 0.088(0.000) *** | −0.163(0.000) *** | −0.034(0.153) | −0.014(0.578) | 0.258(0.000) *** | 0.211(0.000) *** | 0.018(0.332) | 0.142(0.000) *** |
| D3*dv | −0.142(0.000) *** | −0.578(0.000) *** | 0.180(0.000) *** | 0.131(0.000) *** | 0.231(0.000) *** | 0.272(0.000) *** | −0.062(0.049) * | 0.709(0.000) *** |
| Restrict test | 300.940(0.000) *** | 899.209(0.000) *** | 76.214(0.000) *** | 84.854(0.000) *** | 31.897(0.000) *** | 8.554(0.036) ** | 288.809(0.000) *** | 301.662(0.000) *** |
Note: FH means the group of banks that belong to the financial holding company. Non-FH means the group of banks that do not belong to the financial holding company. Gov-controlled means the group of banks that are controlled by the government. Non-gov-controlled means the group of banks that are not controlled by the government. There are four aspects of corporate governance. “A” represents the first aspect, ownership structure. “B” represents the second aspect, board structure. “C” represents the third aspect, deviation. Finally, “D” represents the fourth aspect, the firm’s information environment. The aspect A includes four variables: A1 is the shareholding ratio of directors and supervisors, A2 is the shareholding ratio of major shareholders, A3 is the shareholding ratio of the management, and A4 is the percentage of shares collateralized or pledged by directors and supervisors. The aspect B includes two variables: B1 is the percentage of independent directors and B2 is the number of board members. The aspect C includes three variables: C1 is the deviation between earnings control and ownership control, C2 is the deviation between earning control and board seat control, and C3 is the deviation between ownership control and board seat control. The aspect D includes three variables: D1 means whether financial statements are restated, D2 is the number of CPA changes in three years, and D3 means whether producing financial projections. dv is dummy variable. dv equals one or zero according to smoothed probability of monetary policy or economic status are above or below the cutoff point 0.5. The number in parentheses is p-value. *, **, and *** are denoted significant at the 10%, 5%, and 1% levels, respectively.
Publisher’s Note: MDPI stays neutral with regard to jurisdictional claims in published maps and institutional affiliations. |
© 2021 by the authors. Licensee MDPI, Basel, Switzerland. This article is an open access article distributed under the terms and conditions of the Creative Commons Attribution (CC BY) license (https://creativecommons.org/licenses/by/4.0/).
Share and Cite
MDPI and ACS Style
Lu, S.-L.; Lee, K.-J. Investigating the Determinants of Credit Spread Using a Markov Regime-Switching Model: Evidence from Banks in Taiwan. Sustainability 2021, 13, 9535. https://doi.org/10.3390/su13179535
AMA Style
Lu S-L, Lee K-J. Investigating the Determinants of Credit Spread Using a Markov Regime-Switching Model: Evidence from Banks in Taiwan. Sustainability. 2021; 13(17):9535. https://doi.org/10.3390/su13179535
Chicago/Turabian StyleLu, Su-Lien, and Kuo-Jung Lee. 2021. "Investigating the Determinants of Credit Spread Using a Markov Regime-Switching Model: Evidence from Banks in Taiwan" Sustainability 13, no. 17: 9535. https://doi.org/10.3390/su13179535
Note that from the first issue of 2016, this journal uses article numbers instead of page numbers. See further details here.