
Explanatory Factors of Business Failure: Literature Review and Global Trends
by
 , and
, and
Fernando Zambrano Farias
1,* ,
,
María del Carmen Valls Martínez
2 and
and
Pedro Antonio Martín-Cervantes
2
1
Faculty of Administrative Sciences, International University of Ecuador, Quito 170411, Ecuador
2
Department of Economics and Business, University of Almería, 04120 Almeria, Spain
*
Author to whom correspondence should be addressed.
Sustainability 2021, 13(18), 10154; https://doi.org/10.3390/su131810154
Submission received: 13 August 2021
/
Revised: 4 September 2021
/
Accepted: 9 September 2021
/
Published: 11 September 2021
Abstract
:This study aims to provide a bibliometric analysis of business failure research, recognise the main existing research topics and establish future research challenges. The results, based on a sample of 588 articles, show that the number of published papers and citations has grown steadily, especially in the last 14 years. The most productive and relevant journals, countries, institutions and authors are presented using bibliometric performance indicators. In addition, through the graphical mapping of strategic diagrams, this study identifies the most significant research trends and proposes several directions for future research. The results of this research may be helpful for beginner researchers and experts in business failure, as they contribute to bringing clarity to this line of investigation. These results reveal all the aspects involved in business failure research, analysing its temporal and methodological characterisation, and the most prolific authors who have participated in its study (see, i.e., H. Li), leading journals (see, i.e., Expert Systems with Applications) or academic institutions that have headed the scientific analysis of this business phenomenon. Likewise, it has been possible to identify three main areas in which the research on business failure has been focused: business, management and accounting; economics, econometrics and finance; and social sciences. In addition, a complete, synthesised and organised summary of the various definitions, perspectives and research trends are presented.
1. Introduction
As living organisms, companies follow a three-stage life cycle: they are established, they grow and develop and, at some point, their life ends more or less suddenly. From the 1960s to the present day, entrepreneurs and scholars have been particularly interested in identifying and analysing the factors that trigger business failure based on a simple premise: it is only feasible to achieve corporate success if it is known in advance what are the reasons that lead to the failure of a given company.
Business failure occurs when a company is unable to pay its creditors, shareholders and suppliers [1,2,3,4,5]. It is often the consequence of a national economic crisis reflected in some macroeconomic variables, such as high unemployment, declining gross domestic product, declining foreign direct investment and inadequate income distribution [6,7,8,9,10,11]. These socio-economic repercussions have led to a permanent interest, from an academic and professional perspective, in finding determinants that make it possible to explain, predict and anticipate risk scenarios for the company, with the intention of taking corrective measures to avoid business failure and the possible disappearance of the company from the market.
In the last 50 years, the study of business failure has generated a notable increase in the number of works. From an academic point of view, this boom is manifested by the multiple theories and approaches that research has applied to explain this phenomenon and the large number of empirical studies on business survival in the literature [12,13,14,15,16], whereas, from a societal point of view, it is indicated by the interest exhibited by state institutions of regulation and control, which seek to develop effective public policies that allow a better business performance to achieve economic recovery.
With the establishment of the Sustainable Development Goals (SDG) by the United Nations and the well-known Agenda 2030, the study of business failure is more topical than ever. In particular, Goal 8, decent work and economic growth, is only possible if companies survive. The economic and financial disruptions caused by the COVID-19 pandemic make it very difficult for many companies to continue in business. Only inclusive and sustainable economic growth can drive progress, create decent jobs for all and improve living standards. Preventing business failure is also necessary to achieve the end of poverty (Goal 1), the eradication of hunger (Goal 2) and the health and well-being of the population (Goal 3), as well as the reduction of inequalities (Goal 10). People must have a decent job to feed themselves, have a dignified home and reasonable quality of life. For this purpose, there must be companies that provide proper and stable employment.
With the purpose of having the most updated knowledge, this work is a critical and systematic review of the literature related to the subject under study, avoiding general articles and focusing on the best publications. At present, and due to the considerable increase in research published in scientific journals, it is necessary to use and apply bibliometric tools that facilitate the review of the literature and provide knowledge of the most important work for the scientific community, as well as of those authors most cited for carrying out the highest quality research and of the relationships that exist between the different studies [17,18,19,20,21].
In 1966, the first research paper on business failure was published in the Journal of Accounting Research [22]. Since then, a great deal of research has focused on predicting corporate insolvency scenarios; therefore, it is necessary to evaluate the development of this research and identify the main actors (e.g., countries, institutions, authors) and suggest directions for future research [23,24,25,26,27]. A review of articles related to the subject is of great help to those who wish to approach this line of research, since the literature often appears confusing and chaotic for those who start in this field [28,29,30,31].
To address the literature on business failure, we performed a bibliometric analysis, identified the prominent authors who have developed research and recognised the main themes of the existing research in this field.
Bibliometrics analysis examines scientific performance and makes it possible to represent human knowledge through the quantification of documents [12,32,33,34]. This term was conceptualised by Pritchard [35] as “The application of statistical and mathematical methods designed to define the processes of written communication and the nature and development of scientific disciplines, by counting and analysing the different facets of such communication”.
Escorcia and Poutou [36] indicate that bibliometrics is a subdiscipline of scientometrics and provides results about the research process, volume, evolution, visibility and structure. This methodology allows the study and analysis of scientific activity through so-called bibliometric indicators, which provide information on scientific production in all its expressions [37,38,39,40].
Currently, several academics [21,41,42,43,44,45,46] recognise the importance of research of this type. The results of this work provide helpful information for analysing academic and scientific activity and guiding future research lines.
The purpose of this study is to analyse the trends in research on business failure through a bibliometric study of 588 papers selected from scientific journals in the Scopus database, published in the period between 1954 and 2020. In recent years, bibliometric studies have become widespread in all areas of knowledge due to the enormous body of research work to organise and analyse the literature of a given line of work. However, to our knowledge, there is no up-to-date bibliometric study on business failure. The closest we have found are two papers by Shi and Li [18,19] on bankruptcy prediction models. However, business failure is a broader issue, as we will see below, including risk management, decision making, entrepreneurship, organisational change, finance, etc.
Therefore, this work makes significant contributions to the existing literature, expanding and strengthening knowledge about business failure. First, this paper presents a comprehensive review study showing the leading performance indicators of journals, institutions, countries, authors and articles, which will be valuable for both novice and experienced researchers to broaden their knowledge on the origin, evolution and current state of research on business failure. Second, this study uses the emergent review method of science mapping to detect patterns of relationships between agents and different aspects of research in business failure. In addition, bibliometric indicators are used for each of the elements studied. Specifically, two tools were used in a complementary way: VOSviewer and SciMAT, unlike most current reviews that only use the first one or another similar one, such as NodeXL. Third, the paper provides a comprehensive overview of multidisciplinary research in business failure because the only way to advance knowledge today is through an interdisciplinary perspective and collaboration. Fourth, the developed analysis contributes to the theoretical development of business failure research because it helps both novice and experienced researchers to identify the main research topics, the applicable techniques and the possibility of investigating under-exploited issues.
2. Literature Review
Business failure is an adverse and undesired event for companies that leads to insolvency scenarios and, in some cases, the disappearance of a company from the market. By exploring the extensive literature on business failure, it appears that authors propose different meanings of this phenomenon, causing variability in the results of the research they conducted. The definition given to the term business failure causes the investigative baggage to be broad and deep, since there are different interpretations of this term.
For authors such as Balcaen and Ooghe [23] and Dimitras et al. [47], definitions of failure have been made arbitrarily in work on business failure, and this could have severe consequences for the resulting models. Many authors give business failure a legal definition of bankruptcy [48,49,50,51,52,53,54,55,56,57,58,59,60,61]. Others, instead, define business failure as financial difficulties in meeting a company’s obligations [62,63,64,65,66,67]. Altman [48] initially considered as examples of business failure those firms that were legally in bankruptcy; in contrast, in a later study conducted in 1988, he indicated as business failure cases those companies that were in a situation of insolvency or inability to meet their obligations. Laitinen and Laitinen [68] defined failure as insolvency, i.e., as a company’s inability to pay its debts. For Dimitras et al. [47], business failure is a situation in which a company is unable to meet its financial obligations.
Various authors, such as Tascón and Castaño [69], Correa et al. [70] and Romero Espinosa [59], summarised the different interpretations of business failure, as detailed in Table 1. Romero [59] classified the concept of failure into three categories on the basis of the most common definitions used in research studies: (i) inability to pay debts or obligations in the short term; (ii) negative equity; (iii) legal declaration of suspension of payments or bankruptcy. In this study, failure is defined as liquidation, inactivation and legal declaration.
In an attempt to explain business failure, the vast literature shows that most research has been directed towards the development of statistical models, using information from financial statements, i.e., statement of financial position, income statement and cash flow statement, through the generation of variables that allow forecasting the outcome of a company.
The first contributions in this field were made by Beaver [65], who pioneered this line of research using a univariate approach. In his work, he demonstrated that financial ratios explain a large part of corporate insolvency, specifically, the proportion of funds generated by operations with respect to total debt. Since the nature of the firm is multidimensional, this conception was quickly replaced by a multivariate approach.
Under this new approach, a new wave of research began based on multiple discriminant analysis, a technique used to classify an element into one of several groups established a priori, depending on the individual characteristics of that element [48,71,72,73,74,75,76,77,78,79,80,81,82,83,84]. Despite the great acceptance of this technique and the excellent results achieved, the validity of the results was questioned. This methodology has statistical restrictions, especially the non-compliance with the hypothesis of normality and independence of the variables.
Over time, researchers sought less stringent techniques with respect to statistical requirements, focusing their attention on conditional probability models such as the logit and probit models, which allow for predicting the probability of failure of a company subject to a set of characteristics and attributes [55,80,85,86,87]. Authors such as Lo [53] concluded that the results from applying this new technique are similar to those resulting from multiple discriminant analysis. Other authors, such as Lennox [88], stipulated that the logit technique is more efficient than multiple discriminant analysis due to the absence of statistical requirements in the latter and the possibility of incorporating categorical variables into the model [10].
Artificial intelligence techniques have strengthened the literature on business failure in recent years. In some cases, the results have surpassed those of studies based on statistical and econometric methods, as evidenced by some research [61,89,90]. In all these investigations, the results obtained by a neural network outperform those achieved using other statistical techniques.
3. Materials and Methods
Bibliometric indicators and scientific mapping are techniques at the basis of bibliometric analysis, which help to assess both scientific activity and the impact of research and its sources. These analytic measures can be classified into two main groups, i.e., activity indicators and impact indicators. Activity indicators visualise the real state of science and include number and distribution of publications, productivity, dispersion of publications, collaboration in publications, citation half-life or ageing and connections between authors, among others. Among the impact indicators are the evaluation of highly cited documents (hot papers) and the impact factor of journals, the latter being the best known indicator [91]. On the other hand, scientific mapping makes it possible to relate networks between countries, institutions, journals, authors and keywords. It also allows the recognition of emerging research trends and research topics. The two techniques may complement each other, making it possible to understand how documents, authors, keywords or disciplines are related to each other [92].
In the present work, two software tools were selected to analyse and visualise the scientific literature, i.e., VOSviewer and SciMAT. VOSviewer represents the interaction between countries, institutions, journals, authors and keywords graphically [93,94,95]. SciMAT detects the substructures contained, such as groupings of authors, words or references, in the research field through a bibliometric analysis for a given period [96].
Bibliometric analysis is a widely used method for measuring various aspects of scientific production by applying statistical and mathematical techniques [39,40,97,98,99]. This methodology makes it possible to illustrate and identify critical elements, such as countries, institutions, authors, documents, etc., which provide information on results in different fields of research [96,97,98,99,100].
This paper shows the dynamics of general research on the main topics and trends in business failure. For this purpose, and as in bibliometric analyses by other authors [44,101,102], this study followed the following process: (1) definition of the field of study, (2) database selection, (3) research criteria adjustment, (4) export of the final data sample, (5) data processing and (6) results analysis and discussion. Figure 1 summarises the process.
3.1. Search Criteria and Database
The existing data sources in the scientific literature (Google Scholar, PubMed, Scopus and Web of Science (WOS)) use various approaches for research and tools for data analysis; however, bibliometric studies are carried out with data supplied by two important databases, Scopus and Web of Science. In this research, we choose to focus on academic literature retrieved from the Scopus database because most WoS articles are also indexed in Scopus, and the latter database includes a larger number of journals [24].
Since the object of the research was specifically business failure in a broad sense (other articles have focused on bankruptcy prediction techniques, for example, [18,19]), the following search criteria were used: “TITLE-SUMMARY-KEYWORD” (business failure). The search was conducted on 21 January 2021, and the selected study period covered 66 years, from the first article published on the subject (1954) to those published last year (2020), resulting in 588 documents. This sample only included research articles. Reviews, books, conferences, etc. were discarded.
3.2. Data Extraction
Data for bibliometric analysis were downloaded in CSV and RIS format and processed with Microsoft Excel (version 2016), VOSviewer (v1.6.16) and SciMAT (v1.1.04). These sources included journal title, publication date, author details (name, affiliation, author ID), article title, keywords, abstract and the number of citations.
3.3. Data Analysis
Subsequently, data were analysed with two complementary tools, VOSviewer and SciMAT. VOSviewer [93,96,103,104,105,106] is a tool to illustrate, visualise and explore scientific maps [107]. Some authors [93,94] indicate that VOSviewer allows for displaying graphical representations of maps that help interpret and understand data, linking networks between countries, institutions, journals, authors and keywords [24].
SciMAT is a tool used in many areas of science such as tourism [43], ecology [108], sustainable economics and business [109], education [110] and entrepreneurship [111]. SciMAT is widely used to recognise associations and interactions regarding research topics and emerging research trends [112].
The descriptive analysis was developed with the help of Excel. However, the distribution of the scientific production and the analysis of the keywords was performed with VOSviewer. However, research trends were analysed with SciMAT.
The results of this study will be helpful for researchers, academics, public and private institutions and other stakeholders, given the importance and wide repercussions that the scientific literature related to business failure has for society.
4. Results
In order to detail our analysis, this section is divided into two subsections. The first shows the descriptive results: evolution of scientific production in terms of published papers and citations, distribution of scientific production by thematic areas and journals, countries, institutions and most productive authors and most cited articles. The second part analyses the content results, pointing out the most relevant trends in business failure and identifying the areas of most excellent empirical–conceptual development. Table 2 presents a summary of the data used to develop this bibliometric study.
4.1. Descriptive Analysis
4.1.1. Evolution of Scientific Production
Figure 2 and Table 3 show that business failure has been a topic of considerable interest since the early 2000s and that the number of articles published has steadily increased since 2011. In the first 50 years of research about business failure, barely 18% of the retrieved articles were published, while in the last decade (2011–2020), almost 58% of them were published.
Figure 2 shows the percentage variation of articles published per period, the number of citations per article and the number of articles published in the SCOPUS database, which, as can be seen, have increased considerably in recent years. These results, which coincide with those of previous research [43,113,114], indicate that in the earlier years examined in this work, there was little scientific production on the subject.
Table 3 also details essential information about the published studies, such as the average number of citations per period, the number of authors per period, the average number of authors per article, the number of journals that published articles per period and the number of countries that published articles per period. From 2016 to 2020, the most significant number of papers related to business failure was published, i.e., 208 articles, which shows the great interest of researchers in addressing this topic. Even though 99 papers were published between 2006 and 2010, they were the most cited, with a total of 3697 citations, followed by papers published from 1996–2000 and from 2011–2015, with 2862 and 2782 citations, respectively. The number of scientific journals that publish topics related to business failure increased significantly from 2000 onwards.
4.1.2. Distribution of Scientific Production
The Scopus database classifies the scientific production on business failure in several essential thematic areas. Figure 3 represents a radial stacked bar plot that indicates that the most relevant scientific area or discipline is business, management and accounting with 33.5% of published papers, followed by economics, econometrics and finance with 17.6%, social sciences with 12.2% and computer science with 9.2%. These four areas account for 72.5% of the total number of articles published. Other areas, among which are engineering, decision sciences, arts and humanities, mathematics and others, account for 27.5% of the published studies.
Table 4 shows the 11 most productive journals in this field of research. These journals published 16.15% (95 of 588) of the total number of articles included in this study, which shows that works on this research topic are dispersed and distributed in a large number of different publications. It is worth mentioning that the first journal in this ranking published 19 articles that generated a total of 1070 citations, while the second-ranked journal obtained a total of 259 citations for 13 published studies. Table 4 details other bibliometric indicators such as the year of the first and last publication, citations per article, the quartile according to the SCImago Journal Rank (SJR) indicator and the h-index. Regarding the quartile of the SJR indicator, 9 of the 11 journals are in quartile 1, which indicates that the topic of business failure is well received in high-impact journals. It is worth mentioning that these 11 journals are published in Europe, specifically, six in the United Kingdom, four in the Netherlands and one in Switzerland.
As detailed in Table 2 and illustrated in Figure 4, 70 different countries have published articles on business failure. However, as shown in Table 5, most papers, 346 out of 588, were published in only four countries. It is worth mentioning that an article can represent more than one country because the publishing countries are indicated by the institutions of affiliation of the researchers. The United States leads the list of countries with 147 publications; in second place, but far behind, is the United Kingdom with 98 articles. Spain is in third place with 55 research papers, while China is in fourth place with 46 published papers. Another characteristic detailed in Table 5 is the total number of citations. The United States is again in first place with 5212 citations, the United Kingdom is in second place with 2732 citations, while China is in third place with 1256 citations. This indicator shows that research from these countries has a highly significant impact and great prestige. Other countries, such as Germany and France, have fewer citations, 252 and 357, respectively.
In terms of the h-index, the United States is again in first place with 39, the United Kingdom is in second place with an h-index of 26, while China is in third place with an h-index of 18. Finally, it is relevant to mention that the United States and the United Kingdom are the countries that have the most extensive history of research on business failure, steadily continuing up to 2020, which could encourage the growth of interest in this topic.
Figure 5 shows a network representing the cooperation among the top 26 countries that published research on business failure. The colour of the circles corresponds to the cluster that encompasses each of the various groups of countries. The size of the spheres reflects the number of papers published per country. Seven different groups can be observed. The countries associated with the red colour are Canada, Greece, Italy, New Zealand and Poland. The green cluster, headed by the Czech Republic, also includes Japan, Romania, Slovakia and South Korea. The blue group is led by the United Kingdom, with Belgium, the Netherlands and Turkey as collaborators. The yellow group is led by France, together with Argentina, Colombia and Spain. The purple group comprises China, Germany and Portugal. India, Sweden and the United States are grouped in orange. Finally, Nigeria and South Africa make up the brown cluster.
Table 6 details the main characteristics of the 10 countries that contributed the most published articles and their main contributors. The United States tops this ranking with 147 articles, 5212 citations and 44 collaborations, with the United Kingdom, Germany, Sweden and France among the main contributors. The United Kingdom is placed in second place with 97 published articles, 2732 citations and 32 collaborations, mainly with the Netherlands, United States, Spain and China. The latter has a considerable number of citations, i.e., 1256 for only 45 published papers, and 18 collaborations with the United States, United Kingdom, Portugal and South Korea.
Table 7 shows the 10 most productive authors on the topic of business failure. These authors represent eight universities, six countries and three regions, among which Asia and Europe stand out, although there are also authors from North and South America.
The author with the most publications is Li, H. with 21 articles, followed by Sun, J. with 18. Although Zopounidis, C. has only eight published papers, he is the author with the highest number of citations, 876, which gives him an average number of citations per article of 109.50. The second author with the highest number of citations is Li, H. with 550, with 26.19 citations per article. Sun, J. is in third place, with 543 citations and an average number of citations per article of 30.17.
Figure 6 graphically displays collaborative network based on co-authorships of the principal authors. As in Figure 5, the colour of the circle corresponds to the cluster that groups the authors and their main collaborators. The red circle comprises Aghaeirad, A. together with Antunes, F., Chen, A., Chen, N., Pereira, F. and Ribeiro, B. The green circle also includes six authors: Beaverstock, J., Chen, J.J., Ding, G., Li, W., Xiao, X. and Zhang, H. The association in blue consists of five authors, Adeleye, I., Antwi-Agyei, I., Boson, N., Donbesuur, F. and Gyensare, M. Moreover, in yellow is the group composed of Amankwah-Amoah, J., Khan, Z., Syllias, J. and Wood, G. The fifth cluster, in purple, groups together Hinson, R.E., Honyenuga, B. and Lu, Y. Finally, the sixth cluster, in light blue, is formed by Xia, M. and Xu, Z.
Table 8 shows the main characteristics of the 11 most productive institutions in business failure research from 1954 to 2020. These institutions are located in seven countries. Spain has four institutions, the United Kingdom has two, while China, South Africa, the United States and Greece have one institution. From this ranking, the top four institutions are Zhejiang Normal University, with 19 articles, followed by the University of South Africa and the University of Kent with 10 publications, while the University of Bristol has eight published articles.
In terms of the number of citations per article, it can be seen that, although the Technical University of Crete has seven publications, it is the institution with the most citations, 871. In second place is the Erasmus Universiteit Rotterdam with seven published articles and 703 citations, which, together with the University of Valencia, is the institution with the longest history of research on business failure.
Table 9 shows the 10 most cited articles from 1954 to 2020, each having received a minimum of 280 citations. This point is crucial because the number of citations shows the popularity and influence of an article in the scientific community. The most cited work is that of Greco et al. [115], with 350 citations, while other influential studies are the article by Dimitras et al. [113], with 349 citations, and that by Chen et al. [114], which, apart from having 342 citations, has the highest average number of citations per year, that is, 42.75, which gives this work the highest impact in the scientific literature among all the papers analysed.
4.2. Content Analysis
4.2.1. Research Trends
According to some previous studies [96,103] and for a better analysis of the strategic diagrams, the research should be divided into two subperiods. The first subperiod is longer (1954–2010) than the second (2011–2020) because the scientific production was relatively low at the beginning of the first subperiod. Considering the sample analysed in this study, the first subperiod included 247 papers, while the second subperiod had 341 articles. The strategic diagram shown in Figure 7 represents the first subperiod, from 1954 to 2010. This diagram presents three driving themes, two highly developed themes, two emerging or disappearing themes and two basic themes, which are also known as cross-cutting themes. The size of the circles is proportional to the h-index of each theme. Table 10, which complements the information provided in Figure 7, shows some qualitative indicators of the bibliographic impact of each topic: the number of citations, h-index, density and centrality.
The driving themes, which in the diagram are in the upper right quadrant, are the well-developed and essential themes for the construction of the scientific field [93]. In this first subperiod, multiple discriminant analysis, business failure prediction and decision making presented a high density and strong centrality. The position of these three areas should not be surprising, since the first years of research on business failure focused on predicting financial insolvency. Initially, research was conducted with a univariate analysis approach [65] and subsequently using multiple discriminant analysis [48,71,78], a methodology for predicting business failure. Likewise, the study of the determinants of business failure led to decision making to avoid this scenario. As shown in Figure 7 and Table 10, this term has a high incidence, with 1108 citations.
Concerning basic issues, Figure 7 shows that business failure was an important research theme. Fundamentally, this topic focuses on its incidence with unemployment indicators and contribution to a country’s economy. It is important to emphasise that this topic is central in the first studies in this line of research and was developed by authors who to this day serve as a reference for new research [5,116,117,118,119].
Another topic considered basic in the study of business failure is entrepreneur, which has received great attention by various researchers [120,121,122,123,124,125,126,127,128,129,130]. In some economies, there is a strong connection between entrepreneurship, microenterprises and business failure.
Figure 7 also shows two emerging or disappearing themes: organisational change and industrial performance. Table 10 shows that these themes have low centrality and low density. Therefore, it is crucial to see if these themes will evolve to a better position or disappear in the second subperiod.
For some authors [131], organisational change in companies increases the risk of business failure. At the same time, other authors affirmed that [132] the management of organisational change within the industry must be incremental, continuous and planned for the survival and success of SMEs.
Regarding industrial performance, eight studies addressed this issue, since it is a term related to the determinants that affect business failure [133,134,135,136]. Finally, for this first subperiod, two peripheral themes are human and bankruptcy prediction. Both were well developed but isolated themes.
The second subperiod (Figure 8 and Table 11) shows five driving themes, four basic themes, four emerging themes and four peripheral themes. Regarding the driving themes, it is important to note that decision making is the main theme for analysing business failure. Indeed, some studies [54,137,138,139] affirmed that corporate governance’s correct decision making could avoid financial insolvency scenarios.
Case-based reasoning (CBR) is one of the primary methods for predicting business failure; it has great predictive power and a high capacity to explain results [31,118,140,141,142,143,144] based on clusters that integrate supervised and unsupervised processes to improve information retrieval efficiency.
Entrepreneurship is another driving theme for this second subperiod. As indicated above, it is a topic that is currently attracting the attention of researchers [120,121,122,123,124,125,126,127,128,129,130] who seek to understand internal causes (associated with the entrepreneur) and external causes (associated with the environment in which the entrepreneurship is developed) that cause the failure of entrepreneurship in the short term. Finally, two driving themes are presented: web services and poverty. Table 11 shows that these topics exhibit high density and medium centrality, in addition to having 108 and 42 citations, respectively.
Figure 8 presents four basic or cross-cutting themes, among which the term business failure stands out, perfectly describing the central theme of this study. Table 11 presents other indicators for this term; for example, it occurred in 105 papers and had 1249 citations. Another basic topic that attracted the attention of researchers is the support vector machine, which, combined with the log-linear embedding rhythm, was used to predict business failure; this methodology analyses data on the performance of companies from previous years [141,145,146,147,148,149,150,151,152]. The last two basic themes, business and finance, have high centrality, indicating the importance of these themes in the overall development of business failure.
There are four emerging themes for this second subperiod: risk management, failure, financial distress and restructuring. These are topics that have a low density and centrality due to the fact that they have been developed very little. Risk management and failure are considered basic, while restructuring and financial distress were addressed independently. It is important to point out that none of these issues was found in the first subperiod, so it can be stated that they cannot be considered decadent. The appearance of financial distress is due to research [6,62,64,153,154,155] examining the strategies that companies choose when faced with financial difficulties before reaching the stage of financial insolvency or business failure and how such difficulties affect the probability of recovery.
The industrial performance theme, which in the first subperiod was considered an emerging theme, was highly developed independently in the second subperiod together with project failure, modelling and communication.
4.2.2. Keywords
This section complements the study of research trends by analysing the 35 most used keywords through a network visualisation map based on the co-occurrence of keywords (see Figure 9). As can be seen, the term business failure corresponds to a cluster including other keywords such as bankruptcy, prediction, regression analysis and risk management. Another relevant topic within the research is plant shutdowns, a term used in some research [148,156,157,158,159,160,161], leading to a cluster of keywords comprising failure prediction models, neural networks, learning systems and mathematical models. It can also be seen that, in the last 10 years, words such as logistic regression, principal component analysis and discriminant analysis have been used in articles that explain business failure through statistical models.
5. Discussion
The aim of this work was, through a bibliometric analysis, to reflect on the current state of the study of business failure and its research trends and to establish new future lines of research. The review covers a large number of articles, 588 in total, published in the period between 1954 and 2020, and retrieved using the Scopus database. In order to carry out the analysis, the primary agents contributing to the field of study were identified: authors, institutions, journals and the most relevant thematic areas in which the articles are classified. The following conclusions can be drawn.
Firstly, since the first published article [162] related to a business case, the number of scientific publications has been increasing considerably over the years. Seventy-five per cent of the examined studies were published since 2006, which indicates a significant development of this research line in recent years. This productive impulse may be linked to the emergence of new techniques for predicting business failure and of specific themes in industry sectors. This boom in the number of studies coincides with the collapse of the leading economies due to the financial crisis of 2008, which led to a great demand for business failure prediction models applying methodologies such as machine learning and artificial intelligence [19,26].
On 25 September 2015, top world leaders adopted a set of global goals to eradicate poverty and ensure the prosperity and sustainability of the planet. Obviously, the fight against business failure is a necessary element for achieving the SDGs within the set 15-year period, i.e., by 2030. Researchers have not been on the sidelines of the political objectives. It is precisely in the period 2016–2020 when over thirty-nine per cent of the total production on business failure was published, with a total of 208 articles. Targets such as sustaining per capita economic growth, achieving higher levels of economic productivity, reaching full and productive employment and decent work for women and men, etc., are only possible if business failure is prevented. Thus, public authorities should promote development-oriented policies that support productive activities and strengthen the growth of micro, small and medium-sized enterprises.
Second, the main subject area appeared to be business, management and accounting, comprising 33.5% of the total production, followed by economics, econometrics and finance with 17.6% and social sciences with 12.2% of the examined articles. The most productive journals on business failure research were Expert Systems with Applications, Journal of Business Research and Journal of Business Venturing, with 19, 13 and 11 articles published, respectively. The 10 journals that have published the highest number of articles on business failure belong to the first quartile (Q1) of Scopus.
Third, Hui Li is the most prolific researcher, with 21 published papers and the highest rate of publication measured by the h-index (15). In second place is Jie Sun, with 18 published articles and an h-index of 15. Both authors work at Zhejiang Normal University and have 550 and 543 citations, respectively; in addition, they share authorship in almost all their research. Therefore, their work has led the trend in this line of research in the last 10 years. Although Zopounidis, C. has eight published works, he is one of the authors with the highest number of citations (876) and the highest average of citations per article (109.50).
Fourth, the institution with the highest number of articles published on business failure is Zhejiang Normal University, China, with 19 research papers and 545 citations. However, the one with the highest impact is the Technical University of Crete, with 871 citations and an average of 124.43 citations per paper. In order of importance, the most productive countries are the United States, with 147 articles, followed by the United Kingdom, with 97 publications, and China, with 45 papers. Likewise, the United States is the most productive country for articles on topics related to business failure, with 44 collaborations, followed by the United Kingdom and China, with 32 and 18 partnerships, respectively.
Finally, these results reinforce findings of previous work that analysed the trends in models for predicting business failure [21,163,164].
The main contribution of this study consists in the new insights it provides into bibliometric trends in the research of business failure. The techniques applied to predict financial insolvency and business failure scenarios have evolved over the years: from univariate analysis proposed in 1966 [65] to artificial intelligence techniques and, within these, machine learning [1,150,165,166,167,168,169,170,171,172], which currently has become a preeminent methodological approach to identify the explanatory factors of business failure and whose results are auspicious. Therefore, and intending to discover new research niches on this topic, it is necessary to understand and identify the intellectual structure of the trend in business failure prediction studies.
Secondly, the results of this paper provide a global perspective on interdisciplinary research on business bankruptcy modelling since 1954. Thus, it offers information on applying some techniques that are currently in demand, such as artificial intelligence, CBR and machine learning.
Thirdly, the study contributes to theoretical development in this field, as it aims to help graduate students and academics who are new to this field to identify the main research topics and discover possible study opportunities in this line of research.
Finally, this research provides experienced researchers with an overview of the evolution of this area of study and the possibility of generating future efforts to investigate underexplored settings.
The present study has some limitations, which could be the basis for future research. Future studies could extend the present results by using other databases and Scopus and by applying other quantitative or qualitative instruments. Other types of documents, in addition to articles, such as books, conference proceedings, etc., could also be incorporated into new studies. Another limitation of this research could be found in the information provided on companies, since no geographic location, type of company or sector to which they belong was specified.
Future lines of research could focus on how the use of artificial intelligence and neural networks and the incidence of gender influence entrepreneurial failure. In addition, it should be explored how the transition from entrepreneurship to the formal incorporation of a company affects an entrepreneur’s failure, which implies knowing the difficulties that small businesses have in accessing and managing credit, as well as the strategies to be used in scenarios of financial hardship.
6. Conclusions
Our work has evidenced how a business phenomenon as dense as business failure can be contemplated from very different points of view through the use of bibliometric tools such as the ones implemented here, allowing a level of detail that under any other perspective would be quite unlikely to be achieved. It has been particularly significant to note that this global phenomenon has had special significance in those nations that have recently joined the world economic concert governed by a market economy. This point explains the abundance of works carried out in China, which are contemporary to the spectacular economic growth of this Asiatic nation. Likewise, since the establishment of the 2030 Agenda by the United Nations, research on business failure has drawn the attention of researchers, who have been aware that achieving the SDGs is only possible if companies remain productive in the marketplace. On the other hand, the enumeration and the evaluation of the analytical techniques used in this field, from the first models based on discriminant analysis to the modern ones based on algorithms arising from the field of artificial intelligence, have allowed us to detail the evolution of the methodological framework in this entrepreneurial area. The same applies to the keyword analysis, whose evolution in the conception of business failure runs parallel to the evolution of the prevailing social value system.
This work contributes to the theoretical development of research on business failure since it helps researchers to identify the main research topics and, above all, future research lines: artificial intelligence, neural networks, decision making, risk management, entrepreneurship, poverty, web services and the relationship between gender and business failure.
One of the added values of this work has been the simultaneous deployment of two relevant bibliometric tools, VOSviewer and SciMAT, a fact that is not generally found in other works, which usually opt for a single bibliometric tool. In subsequent works, complementing the future lines of the research described above, it would be convenient to extend the analytical–descriptive potential of VOSviewer to the WoS database, given the contrasted reputation of the publications stored in this database. In any case, the leftovers of bibliometrics are not so much the use of a given database, but the nature, structure and quality of the starting available data. Unfortunately, the structure of the metadata used in each database often differs, a fact that hinders any bibliometric analysis and that has been attempted to be solved in this research work by applying the same database from two different methodological perspectives.
Author Contributions
Conceptualisation, M.d.C.V.M. and F.Z.F.; methodology, M.d.C.V.M.; software, M.d.C.V.M.; validation, M.d.C.V.M. and P.A.M.-C.; formal analysis, M.d.C.V.M.; investigation, F.Z.F.; writing—original draft preparation, F.Z.F.; writing—review and editing, M.d.C.V.M. and P.A.M.-C.; supervision, M.d.C.V.M. and P.A.M.-C.; funding acquisition, F.Z.F. All authors have read and agreed to the published version of the manuscript.
Funding
The APC was funded by determinantes que inciden en el desempeño empresarial de las microempresas en la provincia del guayas-uide-dgip-gye-proy-0002; Universidad Internacional del Ecuador.
Institutional Review Board Statement
Not applicable.
Informed Consent Statement
Not applicable.
Data Availability Statement
The data presented in this study are available on request from the corresponding author.
Conflicts of Interest
The authors declare no conflict of interest.
References
- Lin, F.; Yeh, C.C.; Lee, M.Y. The Use of Hybrid Manifold Learning and Support Vector Machines in the Prediction of Business Failure. Knowl. Based Syst. 2011, 24, 95–101. [Google Scholar] [CrossRef]
- Liou, F.M.; Yang, C.H. Predicting Business Failure under the Existence of Fraudulent Financial Reporting. Int. J. Account. Inf. Manag. 2008, 16, 74–86. [Google Scholar] [CrossRef]
- Scherger, V.; Terceño, A.; Vigier, H. The OWA Distance Operator and Its Application in Business Failure. Kybernetes 2017, 46, 114–130. [Google Scholar] [CrossRef]
- Tsakonas, A.; Dounias, G.; Doumpos, M.; Zopounidis, C. Bankruptcy Prediction with Neural Logic Networks by Means of Grammar-Guided Genetic Programming. Expert Syst. Appl. 2006, 30, 449–461. [Google Scholar] [CrossRef] [Green Version]
- Terceño, A.; Vigier, H.; Scherger, V. Prediction of Business Failure with Fuzzy Models. Int. J. Uncertain. Fuzziness Knowl. Based Syst. 2018, 26, 21–38. [Google Scholar] [CrossRef]
- Ece, A.; Sayılgan, G. Macroeconomic Determinants of Financial Distress in Turkey: An Econometric Analysis. Australas. Account. Bus. Financ. J. 2020, 14, 86–107. [Google Scholar] [CrossRef]
- Stenbäck, T. Corporate Default Prediction with Financial Ratios and Macroeconomic Variables. Master’s Thesis, Aalto University School of Business, Espoo, Finland, 2013. [Google Scholar]
- Liu, J.; Wilson, N. Corporate Failure Rates and the Impact of the 1986 Insolvency Act: An Econometric Analysis. Manag. Financ. 2002, 28, 61–71. [Google Scholar] [CrossRef] [Green Version]
- Wilson, N.; Ochotnický, P.; Káčer, M. Creation and Destruction in Transition Economies: The SME Sector in Slovakia. Int. Small Bus. J. Res. Entrep. 2016, 34, 579–600. [Google Scholar] [CrossRef]
- Turner, P.; Coutts, A.; Bowden, S. The Effect of the Thatcher Government on Company Liquidations: An Econometric Study. Appl. Econ. 1992, 24, 935–943. [Google Scholar] [CrossRef]
- Zambrano Farias, F. Determinantes de La Supervivencia Empresarial de Las MIPYME En Ecuador. Master’s Thesis, University of Almería, Almería, Spain, 2018. [Google Scholar]
- Jiménez Postigo, M.V.; Díaz Casero, J.C.; Hernández Mogollón, R. Revision de La Literatura En Fracaso Empresarial: Aproximación Bibliométrica. In Estableciendo Puentes en una Economía Global; Pindado García, J., Payne, G., Eds.; ESIC: Madrid, Spain, 2008; p. 102. [Google Scholar]
- Tascón, M.T.; Castaño, F.J. Selection of Variables in Small Business Failure Analysis: Mean Selection vs. Median Selection. Rev. Métodos Cuantitativos Econ. Empresa 2017, 24, 54–88. [Google Scholar] [CrossRef] [Green Version]
- Masa Lorenzo, C.; del Campo, J.; Martín López, S. Aspectos Determinantes Del Fracaso Empresarial: Efecto de La Proyección Social de Las Sociedades Cooperativas Frente a Otras Formas Jurídicas. CIRIEC-Rev. Econ. Pública Soc. Coop. 2016, 88, 93–125. [Google Scholar] [CrossRef]
- Labatut Serer, G.; Pozuelo Campillo, J.; Veres Ferrer, E.J. Time Modelling of the Accounting Ratios for Detection of Managerial Failure in Spanish Small and Medium Size Enterprises. Span. J. Financ. Account. 2009, 38, 423–447. [Google Scholar] [CrossRef] [Green Version]
- Pozuelo Campillo, J.; Labatut Serer, G.; Veres Ferrer, E. Validez de La Información Financiera En Los Procesos de Insolvencia. Un Estudio de La Pequeña Empresa Española. Cuadernos de Economía y Dirección de la Empresa 2013, 16, 29–40. [Google Scholar] [CrossRef] [Green Version]
- Díaz Cásero, J.C.; Fernández Portillo, A.; la Sánchez Escobedo, M.D.C.; Hernández Mogollón, R. Estructura Intelectual Del Fracaso Empresarial. Faedpyme Int. Rev. 2014, 3, 43–55. [Google Scholar] [CrossRef]
- Shi, Y.; Li, X. A Bibliometric Study on Intelligent Techniques of Bankruptcy Prediction for Corporate Firms. Heliyon 2019, 5, e02997. [Google Scholar] [CrossRef] [Green Version]
- Shi, Y.; Li, X. An Overview of Bankruptcy Prediction Models for Corporate Firms: A Systematic Literature Review. Intang. Cap. 2019, 15, 114–127. [Google Scholar] [CrossRef] [Green Version]
- Ramos Rodríguez, A.; Ruiz Navarro, J. Base Intelectual de La Investigación En Creación de Empresas: Un Estudio Biométrico. Revista Europea de Dirección y Economía de la Empresa 2008, 17, 13–38. [Google Scholar]
- Fernández-Portillo, A.; Díaz-Casero, J.C.; Sánchez-Escobedo, M.C.; Hernández-Mogollón, R. Certified Knowledge of Business Failure: A Bibliometric Analysis of the Period 1965–2012. Espacios 2019, 40, 1–20. [Google Scholar]
- Mears, P.K. Discussion of Financial Ratios As Predictors of Failure. J. Account. Res. 1966, 4, 119. [Google Scholar] [CrossRef]
- Balcaen, S.; Ooghe, H. 35 Years of Studies on Business Failure: An Overview of the Classic Statistical Methodologies and Their Related Problems. Br. Account. Rev. 2006, 38, 63–93. [Google Scholar] [CrossRef]
- Terán-Yépez, E.; Marín-Carrillo, G.M.; del Casado-Belmonte, M.P.; de las Capobianco-Uriarte, M.M. Sustainable Entrepreneurship: Review of Its Evolution and New Trends. J. Clean. Prod. 2020, 252. [Google Scholar] [CrossRef]
- De Monelos, P.L.; Sánchez, C.P.; López, M.R. Business Failure Prediction. A Contribution to the Synthesis of a Theory, through Comparative Analysis of Different Prediction Techniques. Estud. Econ. 2016, 43, 163–198. [Google Scholar] [CrossRef]
- Do Prado, J.W.; de Castro Alcântara, V.; de Melo Carvalho, F.; Vieira, K.C.; Machado, L.K.C.; Tonelli, D.F. Multivariate Analysis of Credit Risk and Bankruptcy Research Data: A Bibliometric Study Involving Different Knowledge Fields (1968–2014). Scientometrics 2016, 106, 1007–1029. [Google Scholar] [CrossRef]
- Gissel, J.; Giacomino, D.; Akers, M. A Review of Bankruptcy Prediction Studies: 1930-Present. J. Financ. Educ. 2007, 33, 1–42. [Google Scholar]
- Bojović, S.; Matić, R.; Popović, Z.; Smiljanić, M.; Stefanović, M.; Vidaković, V. An Overview of Forestry Journals in the Period 2006-2010 as Basis for Ascertaining Research Trends. Scientometrics 2014, 98, 1331–1346. [Google Scholar] [CrossRef]
- Liu, X. Full-Text Citation Analysis: A New Method to Enhance. J. Am. Soc. Inf. Sci. Technol. 2013, 64, 1852–1863. [Google Scholar] [CrossRef]
- Daubie, M.; Meskens, N. Business Failure Prediction: A Review and Analysis of the Literature. New Trends Bank. Manag. Contrib. Manag. Sci. 2002, 71–86. [Google Scholar] [CrossRef]
- Li, H.; Yu, J.L.; Yu, L.A.; Sun, J. The Clustering-Based Case-Based Reasoning for Imbalanced Business Failure Prediction: A Hybrid Approach through Integrating Unsupervised Process with Supervised Process. Int. J. Syst. Sci. 2014, 45, 1225–1241. [Google Scholar] [CrossRef]
- Demyanyk, Y.; Hasan, I. Financial Crises and Bank Failures: A Review of Prediction Methods. Omega 2010, 38, 315–324. [Google Scholar] [CrossRef] [Green Version]
- Hassan, S.U.; Haddawy, P.; Zhu, J. A Bibliometric Study of the World’s Research Activity in Sustainable Development and Its Sub-Areas Using Scientific Literature. Scientometrics 2014, 99, 549–579. [Google Scholar] [CrossRef]
- Mongeon, P.; Paul-Hus, A. The Journal Coverage of Web of Science and Scopus: A Comparative Analysis. Scientometrics 2016, 106, 213–228. [Google Scholar] [CrossRef]
- Pritchard, A. Statistical Bibliography or Bibliometrics. J. Doc. 1969, 25, 348. [Google Scholar]
- Ferrer-Villalobos, M.; Freire-Constante, L.; Suasnavas-Bermúdez, P.; Merino-Salazar, P.; Gómez-García, A. Análisis Bibliométrico de Los Artículos Originales Publicados En La Revista Ciencia & Trabajo: 1999–2015. Cienc. Trab. 2017, 19, 81–85. [Google Scholar] [CrossRef] [Green Version]
- Çeti, B.; Tunç Hassan, A. Bibliometric Profile of Studies Related with Equity Theory. J. Tour. 2019, 5, 17–29. [Google Scholar] [CrossRef]
- Muthumari, S.; Raja, S. Bibliometric Analysis of Defence Science Journal during 2005–2014: A Study Based on Scopus Database. COLLNET J. Sci. Inf. Manag. 2016, 10, 273–287. [Google Scholar] [CrossRef]
- Payán-Sánchez, B.; Belmonte-Ureña, L.J.; Plaza-úbeda, J.A.; Vazquez-Brust, D.; Yakovleva, N.; Pérez-Valls, M. Open Innovation for Sustainability or Not: Literature Reviews of Global Research Trends. Sustainability 2021, 13, 1136. [Google Scholar] [CrossRef]
- Macias-Chapula, C.A. O Papel Da Informetria e Da Cienciometria e Sua Perspectiva Nacional e Internacional. Ciência da Informação 1998, 27, 134–140. [Google Scholar] [CrossRef]
- De las Capobianco-Uriarte, M.M.; Del Casado-Belmonte, M.P.; Marín-Carrillo, G.M.; Terán-Yépez, E. A Bibliometric Analysis of International Competitiveness (1983–2017). Sustainability 2019, 11, 1877. [Google Scholar] [CrossRef] [Green Version]
- Chen, Y.; Zheng, B. What Happens after the Rare Earth Crisis: A Systematic Literature Review. Sustainability 2019, 11, 1288. [Google Scholar] [CrossRef] [Green Version]
- Niñerola, A.; Sánchez-Rebull, M.V.; Hernández-Lara, A.B. Tourism Research on Sustainability: A Bibliometric Analysis. Sustainability 2019, 11, 1377. [Google Scholar] [CrossRef] [Green Version]
- Bach, M.P.; Krstič, Ž.; Seljan, S.; Turulja, L. Text Mining for Big Data Analysis in Financial Sector: A Literature Review. Sustainability 2019, 11, 1277. [Google Scholar] [CrossRef] [Green Version]
- Zhang, C.; Fang, Y.; Chen, X.; Congshan, T. Bibliometric Analysis of Trends in Global Sustainable Livelihood Research. Sustainability 2019, 11, 1150. [Google Scholar] [CrossRef] [Green Version]
- Pankowska, M. Information Technology Outsourcing Chain: Literature Review and Implications for Development of Distributed Coordination. Sustainability 2019, 11, 1460. [Google Scholar] [CrossRef] [Green Version]
- Dimitras, A.I.; Zanakis, S.H.; Zopounidis, C. A Survey of Business Failures with an Emphasis on Prediction Methods and Industrial Applications. Eur. J. Oper. Res. 1996, 90, 487–513. [Google Scholar] [CrossRef]
- Altman, E.I. The Prediction of Corporate Bankruptcy: A Discriminant Analysis. J. Financ. 1968, 23, 193. [Google Scholar] [CrossRef]
- Altman, E.I.; Marco, G.; Varetto, F. Corporate Distress Diagnosis: Comparisons Using Linear Discriminant Analysis and Neural Networks (the Italian Experience). J. Bank. Financ. 1994, 18, 505–529. [Google Scholar] [CrossRef]
- Fletcher, D.; Goss, E. Forecasting with Neural Networks. An Application Using Bankruptcy Data. Inf. Manag. 1993, 24, 159–167. [Google Scholar] [CrossRef]
- Lee, K.C.; Han, I.; Kwon, Y. Hybrid Neural Network Models for Bankruptcy Predictions. Decis. Support Syst. 1996, 18, 63–72. [Google Scholar] [CrossRef]
- Lien, G.; Brian Hardaker, J.; Flaten, O. Risk and Economic Sustainability of Crop Farming Systems. Agric. Syst. 2007, 94, 541–552. [Google Scholar] [CrossRef] [Green Version]
- Lo, A.W. Logit versus Discriminant Analysis. A Specification Test and Application to Corporate Bankruptcies. J. Econom. 1986, 31, 151–178. [Google Scholar] [CrossRef]
- Manzaneque, M.; Priego, A.M.; Merino, E. Corporate Governance Effect on Financial Distress Likelihood: Evidence from Spain. Rev. Contab. Account. Rev. 2016, 19, 111–121. [Google Scholar] [CrossRef] [Green Version]
- Ohlson, J.A. Financial Ratios and the Probabilistic Prediction of Bankruptcy. J. Account. Res. 1980, 18, 109. [Google Scholar] [CrossRef] [Green Version]
- Parra, J.F. Determinantes de La Probabilidad de Cierre de Nuevas Empresas En Bogotá. Rev. Fac. Cienc. Econ. 2010, 19, 27–53. [Google Scholar] [CrossRef] [Green Version]
- Theodossiou, P.T. Predicting Shifts in the Mean of a Multivariate Time Series Process: An Application in Predicting Business Failures. J. Am. Stat. Assoc. 1993, 88, 441–449. [Google Scholar] [CrossRef]
- Zmijewski, M.E. Methodological Issues Related to the Estimation of Financial Distress Prediction Models. J. Account. Res. 1984, 22, 59. [Google Scholar] [CrossRef]
- Romero Espinosa, F. Variables Financieras Determinantes Del Fracaso Empresarial Para La Pequeña y Mediana Empresa En Colombia: Análisis Bajo Modelo Logit. Pensam. Gest. 2013, 34, 235–277. [Google Scholar]
- Hillegeist, S.A.; Keating, E.K.; Cram, D.P.; Lundstedt, K.G. Assessing the Probability of Bankruptcy. Rev. Account. Stud. 2004, 9, 5–34. [Google Scholar] [CrossRef]
- Pranav Naidu, G.; Govinda, K. Bankruptcy Prediction Using Neural Networks. In Proceedings of the 2nd International Conference on Inventive Systems and Control, ICISC 2018, Coimbatore, India, 19–20 January 2018; pp. 248–251. [Google Scholar] [CrossRef]
- Ashraf, S.; Félix, E.G.S.; Serrasqueiro, Z. Do Traditional Financial Distress Prediction Models Predict the Early Warning Signs of Financial Distress? J. Risk Financ. Manag. 2019, 12, 55. [Google Scholar] [CrossRef] [Green Version]
- Kristanti, F.T.; Rahayu, S.; Huda, A.N. The Determinant of Financial Distress on Indonesian Family Firm. Procedia Soc. Behav. Sci. 2016, 219, 440–447. [Google Scholar] [CrossRef] [Green Version]
- Popescu, M.E.; Dragotă, V. What Do Post-Communist Countries Have in Common When Predicting Financial Distress? Prague Econ. Pap. 2018, 27, 637–653. [Google Scholar] [CrossRef] [Green Version]
- Beaver, W.H. Financial Ratios As Predictors of Failure. J. Account. Res. 1966, 4, 71. [Google Scholar] [CrossRef]
- Aktan, S. Financial Statement Indicators of Financial Failure: An Empirical Study on Turkish Public Companies during the November 2000 and February 2001 Crisis. Investig. Manag. Financ. Innov. 2009, 6, 163–173. [Google Scholar]
- Lin, T.H. A Cross Model Study of Corporate Financial Distress Prediction in Taiwan: Multiple Discriminant Analysis, Logit, Probit and Neural Networks Models. Neurocomputing 2009, 72, 3507–3516. [Google Scholar] [CrossRef]
- Laitinen, E.K.; Laitinen, T. Cash Management Behavior and Failure Prediction. J. Bus. Financ. Account. 1998, 25, 893–919. [Google Scholar] [CrossRef]
- Tascón Fernández, M.T.; Castaño Gutiérrez, F.J. Predicción Del Fracaso Empresarial: Una Revisión. In XV Congreso AECA “Decidir en Época de Crisis: Transparencia y Responsabilidad”; AECA: Valladolid, Spain, 2006; pp. 63–74. [Google Scholar]
- Correa Rodríguez, A.; Acosta Molina, M.; González Pérez, A. La Insolvencia Empresarial: Un Análisis Empírico Para La Pequeña y Mediana Empresa. Rev. Contab. Spanish Account. Rev. 2003, 6, 47–79. [Google Scholar]
- Deakin, E.B. A Discriminant Analysis of Predictors of Business Failure. J. Account. Res. 1972, 10, 167. [Google Scholar] [CrossRef]
- Taffler, R.J. Forecasting Company Failure in the UK Using Discriminant Analysis and Financial Ratio Data. J. R. Stat. Soc. Ser. A 1982, 145, 342. [Google Scholar] [CrossRef]
- Dietrich, J.R. Discussion of Methodological Issues Related to the Estimation of Financial Distress Prediction Models. J. Account. Res. 1984, 22, 83. [Google Scholar] [CrossRef]
- Altman, E.I. The Success of Business Failure Prediction Models. An International Survey. J. Bank. Financ. 1984, 8, 171–198. [Google Scholar] [CrossRef]
- Dambolena, I.G.; Khoury, S.J. Ratio Stability and Corporate Failure. J. Financ. 1980, 35, 1017–1026. [Google Scholar] [CrossRef]
- Edmister, R.O. An Empirical Test of Financial Ratio Analysis for Small Business Failure Prediction. J. Financ. Quant. Anal. 1972, 7, 1477. [Google Scholar] [CrossRef]
- Gentry, J.A.; Newbold, P.; Whitford, D.T. Funds Flow Components, Financial Ratios, and Bankruptcy. J. Bus. Financ. Account. 1987, 14, 595–606. [Google Scholar] [CrossRef]
- Meyer, P.A.; Pifer, H.W. Prediction of Bank Failures. J. Financ. 1970, 25, 853–868. [Google Scholar] [CrossRef]
- Taffler, R.J. The Assessment of Company Solvency and Performance Using a Statistical Model. Account. Bus. Res. 1983, 13, 295–308. [Google Scholar] [CrossRef]
- Casey, C.; Bartczak, N. Using Operating Cash Flow Data to Predict Financial Distress: Some Extensions. J. Account. Res. 1985, 23, 384. [Google Scholar] [CrossRef]
- Blum, M. Failing Company Discriminant Analysis. J. Account. Res. 1974, 12, 1. [Google Scholar] [CrossRef]
- Starks, L. American Finance Association. J. Financ. 2020, 75, 3370. [Google Scholar] [CrossRef]
- Gentry, J.A.; Newbold, P.; Whitford, D.T. Predicting Bankruptcy: If Cash Flow’s Not the Bottom Line, What Is? Financ. Anal. J. 1985, 41, 47–56. [Google Scholar] [CrossRef]
- Gentry, J.A.; Newbold, P.; Whitford, D.T. Classifying Bankrupt Firms with Funds Flow Components. J. Account. Res. 1985, 23, 146. [Google Scholar] [CrossRef]
- Keasey, K.; McGuinness, P.; Short, H. Multilogit Approach to Predicting Corporate Failure-Further Analysis and the Issue of Signal Consistency. Omega 1990, 18, 85–94. [Google Scholar] [CrossRef]
- Platt, H.D.; Platt, M.B. A Note on the Use of Industry-Relative Ratios in Bankruptcy Prediction. J. Bank. Financ. 1991, 15, 1183–1194. [Google Scholar] [CrossRef]
- Martin, D. Early Warning of Bank Failure. A Logit Regression Approach. J. Bank. Financ. 1977, 1, 249–276. [Google Scholar] [CrossRef]
- Lennox, C. Identifying Failing Companies: A Reevaluation of the Logit, Probit and DA Approaches. J. Econ. Bus. 1999, 51, 347–364. [Google Scholar] [CrossRef]
- Serrano Cinca, C.; Martín del Brío, B. Predicción de La Quiebra Bancaria Mediante El Empleo de Redes Neuronales Artificiales. Rev. Esp. Financ. Contab. 1993, 22, 153–176. [Google Scholar]
- Tam, K.Y.; Kiang, M. Predicting Bank Failures: A Neural Network Approach. Appl. Artif. Intell. 1990, 4, 265–282. [Google Scholar] [CrossRef]
- Camps, D. Limitaciones de Los Indicadores Bibliométricos En La Evaluación de La Actividad Científica Biomédica. Colomb. Med. 2008, 39, 74–79. [Google Scholar]
- Small, H. Visualizing Science by Citation Mapping. J. Am. Soc. Inf. Sci. 1999, 50, 799–813. [Google Scholar] [CrossRef]
- Cobo, M.J.; López-Herrera, A.G.; Herrera-Viedma, E.; Herrera, F. Science Mapping Software Tools: Review, Analysis, and Cooperative Study among Tools. J. Am. Soc. Inf. Sci. Technol. 2011, 62, 1382–1402. [Google Scholar] [CrossRef]
- Castillo-Vergara, M.; Alvarez-Marin, A.; Placencio-Hidalgo, D. A Bibliometric Analysis of Creativity in the Field of Business Economics. J. Bus. Res. 2018, 85, 1–9. [Google Scholar] [CrossRef]
- Jeong, D.; Koo, Y. Analysis of Trend and Convergence for Science and Technology Using the VOSviewer. Int. J. Contents 2016, 12, 54–58. [Google Scholar] [CrossRef] [Green Version]
- Cobo, M.J.; Lõpez-Herrera, A.G.; Herrera-Viedma, E.; Herrera, F. SciMAT: A New Science Mapping Analysis Software Tool. J. Am. Soc. Inf. Sci. Technol. 2012, 63, 1609–1630. [Google Scholar] [CrossRef]
- Da Silva Pereira, R.; de Martins Resende, L.M.; Betim, L.M.; Bonatto, F.; Von Agner, T. Systematic Bibliometric Analysis of Horizontal Network of Enterprises. IFAC-PapersOnLine 2015, 48, 1821–1826. [Google Scholar] [CrossRef]
- Sweileh, W.M. Research Trends on Human Trafficking: A Bibliometric Analysis Using Scopus Database. Glob. Health 2018, 14, 1–12. [Google Scholar] [CrossRef]
- Dupleix, M.D.; Rébori, A. Strategy and Turnaround in Declining Firms: A Literature Review of the Past 15 Years. Estud. Gerenc. 2017, 33, 141–152. [Google Scholar] [CrossRef]
- Moed, H.F.; de Bruin, R.E.; van Leeuwen, T.N. New Bibliometric Tools for the Assessment of National Research Performance: Database Description, Overview of Indicators and First Applications. Scientometrics 1995, 33, 381–422. [Google Scholar] [CrossRef]
- López Núñez, J.A.; López-Belmonte, J.; Moreno-Guerrero, A.J.; Navas-Parejo, M.R.; Hinojo-Lucena, F.J. Education and Diet in the Scientific Literature: A Study of the Productive, Structural, and Dynamic Development in Web of Science. Sustainability 2020, 12, 4838. [Google Scholar] [CrossRef]
- Wang, W.; Laengle, S.; Merigó, J.M.; Yu, D.; Herrera-Viedma, E.; Cobo, M.J.; Bouchon-Meunier, B. A Bibliometric Analysis of the First Twenty-Five Years of the International Journal of Uncertainty, Fuzziness and Knowledge-Based Systems. Int. J. Uncertain. Fuzziness Knowl. Based Syst. 2018, 26, 169–193. [Google Scholar] [CrossRef]
- Cobo, M.J.; Martínez, M.A.; Gutiérrez-Salcedo, M.; Fujita, H.; Herrera-Viedma, E. 25 Years at Knowledge-Based Systems: A Bibliometric Analysis. Knowl. Based Syst. 2015, 80, 3–13. [Google Scholar] [CrossRef]
- Van Eck, N.J.; Waltman, L. Bibliometric Mapping of the Computational Intelligence Field. Int. J. Uncertain. Fuzziness Knowl. Based Syst. 2007, 15, 625–645. [Google Scholar] [CrossRef]
- Van Eck, N.J.; Waltman, L. Visualizing Bibliometric Networks. In Measuring Scholarly Impact; Ding, Y., Rousseau, R., Wolfram, D., Eds.; Springer: Cham, Switzerland, 2014; pp. 285–320. [Google Scholar] [CrossRef]
- Waltman, L.; van Eck, N.J. A New Methodology for Constructing a Publication-Level Classification System of Science. J. Am. Soc. Inf. Sci. Technol. 2012, 63, 2378–2392. [Google Scholar] [CrossRef] [Green Version]
- Van Eck, N.J.; Waltman, L.; Dekker, R.; van Den Berg, J. A Comparison of Two Techniques for Bibliometric Mapping: Multidimensional Scaling and VOS. J. Am. Soc. Inf. Sci. Technol. 2010, 61, 2405–2416. [Google Scholar] [CrossRef] [Green Version]
- Zhang, Y.; Huang, K.; Yu, Y.; Yang, B. Mapping of Water Footprint Research: A Bibliometric Analysis during 2006–2015. J. Clean. Prod. 2017, 149, 70–79. [Google Scholar] [CrossRef]
- Tiemann, I.; Breuer, H.; Fichter, K.; Lüdeke Freund, F. Sustainability-Oriented Business Model Development: Principles, Criteria and Tools. Int. J. Entrep. Ventur. 2018, 10, 256. [Google Scholar] [CrossRef]
- Valverde-Berrocoso, J.; del Carmen Garrido-Arroyo, M.; Burgos-Videla, C.; Morales-Cevallos, M.B. Trends in Educational Research about E-Learning: A Systematic Literature Review (2009–2018). Sustainability 2020, 12, 5153. [Google Scholar] [CrossRef]
- Dionisio, M. The Evolution of Social Entrepreneurship Research: A Bibliometric Analysis. Soc. Enterp. J. 2019, 15, 22–45. [Google Scholar] [CrossRef]
- Caldarelli, G.; Ellul, J. Trusted Academic Transcripts on the Blockchain: A Systematic Literature Review. Appl. Sci. 2021, 11, 1842. [Google Scholar] [CrossRef]
- Dimitras, A.I.; Slowinski, R.; Susmaga, R.; Zopounidis, C. Business Failure Prediction Using Rough Sets. Eur. J. Oper. Res. 1999, 114, 263–280. [Google Scholar] [CrossRef]
- Chen, N.; Xu, Z.; Xia, M. Correlation Coefficients of Hesitant Fuzzy Sets and Their Applications to Clustering Analysis. Appl. Math. Model. 2013, 37, 2197–2211. [Google Scholar] [CrossRef]
- Greco, S.; Matarazzo, B.; Slowinski, R. Rough Approximation by Dominance Relations. Int. J. Intell. Syst. 2002, 17, 153–171. [Google Scholar] [CrossRef]
- Amankwah-Amoah, J.; Adomako, S. Big Data Analytics and Business Failures in Data-Rich Environments: An Organizing Framework. Comput. Ind. 2019, 105, 204–212. [Google Scholar] [CrossRef] [Green Version]
- Bertrand, J.L.; Parnaudeau, M. Understanding the Economic Effects of Abnormal Weather to Mitigate the Risk of Business Failures. J. Bus. Res. 2019, 98, 391–402. [Google Scholar] [CrossRef]
- Li, H.; Sun, J. Predicting Business Failure Using an RSF-Based Case-Based Reasoning Ensemble Forecasting Method. J. Forecast. 2013, 32, 180–192. [Google Scholar] [CrossRef]
- Akinbami, C.A.O.; Adejumo, O.O.; Akinyemi, F.O.; Jiboye, T.F.; Obisanya, J.F. Family Business and Succession in Developing Economies: The Nigerian Perspective. Int. J. Entrep. Small Bus. 2019, 38, 45–59. [Google Scholar] [CrossRef]
- Lin, S.; Yamakawa, Y.; Li, J. Emergent Learning and Change in Strategy: Empirical Study of Chinese Serial Entrepreneurs with Failure Experience. Int. Entrep. Manag. J. 2019, 15, 773–792. [Google Scholar] [CrossRef]
- Mandl, C.; Berger, E.S.C.; Kuckertz, A. Do You Plead Guilty? Exploring Entrepreneurs’ Sensemaking-Behavior Link after Business Failure. J. Bus. Ventur. Insights 2016, 5, 9–13. [Google Scholar] [CrossRef]
- Masuda, T. Novice Founders and Re-Starters in Japanese Business Society. Int. J. Bus. Glob. 2010, 5, 304–327. [Google Scholar] [CrossRef]
- Nheta, D.S.; Shambare, R.; Sigauke, C. Micro-Perspective Lens on Entrepreneurs in the Early Stage of Business: Expectations Vis-à-Vis Realities. Afr. J. Sci. Technol. Innov. Dev. 2020. [Google Scholar] [CrossRef]
- Nwankwo, C.A.; Kanyangale, M. Entrepreneurial Orientation and Survival of Small and Medium Enterprises in Nigeria: An Examination of the Integrative Entrepreneurial Marketing Model. Int. J. Entrep. 2020, 24, 1–14. [Google Scholar]
- Roudaki, J.; Radford, J. Accounting and Financial Analysis Competencies: Essential for Entrepreneurs and Small Businesses in Sustainable Development. Middle East Bus. Econ. Rev. 2010, 22, 20–47. [Google Scholar]
- Simmons, S.A.; Wiklund, J.; Levie, J. Stigma and Business Failure: Implications for Entrepreneurs’ Career Choices. Small Bus. Econ. 2014, 42, 485–505. [Google Scholar] [CrossRef] [Green Version]
- Simmons, S.A.; Wiklund, J.; Levie, J.; Bradley, S.W.; Sunny, S.A. Gender Gaps and Reentry into Entrepreneurial Ecosystems after Business Failure. Small Bus. Econ. 2019, 53, 517–531. [Google Scholar] [CrossRef] [Green Version]
- Masuda, T. Entrepreneurial Re-Starters in Japan. Int. J. Entrep. Small Bus. 2010, 11, 145–164. [Google Scholar] [CrossRef]
- Zhang, H.; Amankwah-Amoah, J.; Beaverstock, J. Toward a Construct of Dynamic Capabilities Malfunction: Insights from Failed Chinese Entrepreneurs. J. Bus. Res. 2019, 98, 415–429. [Google Scholar] [CrossRef] [Green Version]
- Kuckertz, A.; Berger, E.S.C.; Prochotta, A. Misperception of Entrepreneurship and Its Consequences for the Perception of Entrepreneurial Failure—The German Case. Int. J. Entrep. Behav. Res. 2020, 26, 1865–1885. [Google Scholar] [CrossRef]
- Wezel, F.C.; van Witteloostuijn, A. From Scooters to Choppers: Product Portfolio Change and Organizational Failure. Evidence from the UK Motorcycle Industry 1895 to 1993. Long Range Plann. 2006, 39, 11–28. [Google Scholar] [CrossRef]
- By, R.T.; Dale, C. The Successful Management of Organisational Change in Tourism SMEs: Initial Findings in UK Visitor Attractions. Int. J. Tour. Res. 2008, 10, 305–313. [Google Scholar] [CrossRef]
- Alderman, N. Innovation and Survival Amongst Mature Establishments in the Mechanical Engineering Industry. Geoforum 1996, 27, 461–477. [Google Scholar] [CrossRef]
- Chen, J.H.; Williams, M. The Determinants of Business Failures in the US Low-Technology and High-Technology Industries. Appl. Econ. 1999, 31, 1551–1563. [Google Scholar] [CrossRef]
- Eljelly, A.M.A.; Mansour, I.H.F. Predicting Private Companies Failure in the Sudan. J. Afr. Bus. 2001, 2, 23–43. [Google Scholar] [CrossRef]
- Ooghe, H.; Spaenjers, C. A Note on Performance Measures for Business Failure Prediction Models. Appl. Econ. Lett. 2009, 17, 67–70. [Google Scholar] [CrossRef]
- Ghosh, C.; Guha, S. Determinants of Profitability of the Microenterprises Led by Women Micro Entrepreneurs: Evidence from Mumbai Slums. Int. J. Entrep. Small Bus. 2015, 24, 455–473. [Google Scholar] [CrossRef]
- Spitsin, V.; Ryzhkova, M.; Vukovic, D.; Anokhin, S. Companies Profitability under Economic Instability: Evidence from the Manufacturing Industry in Russia. J. Econ. Struct. 2020, 9, 1–20. [Google Scholar] [CrossRef] [Green Version]
- Yazdanfar, D.; Salman, K.; Arnesson, L. Life Cycle of Profitability among Swedish Micro Firms. World Rev. Entrep. Manag. Sustain. Dev. 2013, 9, 340–351. [Google Scholar] [CrossRef]
- Chuang, C.L. Application of Hybrid Case-Based Reasoning for Enhanced Performance in Bankruptcy Prediction. Inf. Sci. 2013, 236, 174–185. [Google Scholar] [CrossRef]
- Li, H.; Sun, J. Forecasting Business Failure in China Using Case-Based Reasoning with Hybrid Case Respresentation. J. Forecast. 2010, 29, 486–501. [Google Scholar] [CrossRef]
- Li, H.; Sun, J. On Performance of Case-Based Reasoning in Chinese Business Failure Prediction from Sensitivity, Specificity, Positive and Negative Values. Appl. Soft Comput. J. 2011, 11, 460–467. [Google Scholar] [CrossRef]
- Lin, R.H.; Wang, Y.T.; Wu, C.H.; Chuang, C.L. Developing a Business Failure Prediction Model via RST, GRA and CBR. Expert Syst. Appl. 2009, 36, 1593–1600. [Google Scholar] [CrossRef]
- Li, H.; Hong, L.Y.; He, J.X.; Xu, X.G.; Sun, J. Small Sample-Oriented Case-Based Kernel Predictive Modeling and Its Economic Forecasting Applications under n-Splits-k-Times Hold-out Assessment. Econ. Model. 2013, 33, 747–761. [Google Scholar] [CrossRef]
- AghaeiRad, A.; Chen, N.; Ribeiro, B. Improve Credit Scoring Using Transfer of Learned Knowledge from Self-Organizing Map. Neural Comput. Appl. 2017, 28, 1329–1342. [Google Scholar] [CrossRef] [Green Version]
- Antunes, F.; Ribeiro, B.; Pereira, F. Probabilistic Modeling and Visualization for Bankruptcy Prediction. Appl. Soft Comput. J. 2017, 60, 831–843. [Google Scholar] [CrossRef] [Green Version]
- Hosaka, T. Bankruptcy Prediction Using Imaged Financial Ratios and Convolutional Neural Networks. Expert Syst. Appl. 2019, 117, 287–299. [Google Scholar] [CrossRef]
- Li, H.; Hong, L.Y.; Zhou, Q.; Yu, H.J. The Assisted Prediction Modelling Frame with Hybridisation and Ensemble for Business Risk Forecasting and an Implementation. Int. J. Syst. Sci. 2015, 46, 2072–2086. [Google Scholar] [CrossRef]
- Xu, W.; Xiao, Z.; Dang, X.; Yang, D.; Yang, X. Financial Ratio Selection for Business Failure Prediction Using Soft Set Theory. Knowl. Based Syst. 2014, 63, 59–67. [Google Scholar] [CrossRef]
- Xu, W.; Xiao, Z. Soft Set Theory Oriented Forecast Combination Method for Business Failure Prediction. J. Inf. Process. Syst. 2016, 12, 109–128. [Google Scholar] [CrossRef] [Green Version]
- Sun, J.; Li, H.; Huang, Q.H.; He, K.Y. Predicting Financial Distress and Corporate Failure: A Review from the State-of-the-Art Definitions, Modeling, Sampling, and Featuring Approaches. Knowl. Based Syst. 2014, 57, 41–56. [Google Scholar] [CrossRef]
- Jang, Y.; Jeong, I.-B.; Cho, Y.K.; Ahn, Y. Predicting Business Failure of Construction Contractors Using Long Short-Term Memory Recurrent Neural Network. J. Constr. Eng. Manag. 2019, 145, 04019067. [Google Scholar] [CrossRef]
- Amendola, A.; Giordano, F.; Parrella, M.L.; Restaino, M. Variable Selection in High-Dimensional Regression: A Nonparametric Procedure for Business Failure Prediction. Appl. Stoch. Model. Bus. Ind. 2017, 33, 355–368. [Google Scholar] [CrossRef]
- Koh, S.K.; Durand, R.B.; Dai, L.; Chang, M. Financial Distress: Lifecycle and Corporate Restructuring. J. Corp. Financ. 2015, 33, 19–33. [Google Scholar] [CrossRef] [Green Version]
- Lee, L.T.; Fan, C.K.; Hung, H.W.; Ling, Y.C. Analysis of Financial Distress Prediction Models. J. Test. Eval. 2010, 38, 635–640. [Google Scholar] [CrossRef]
- Assaad, R.; El-adaway, I.H. Enhancing the Knowledge of Construction Business Failure: A Social Network Analysis Approach. J. Constr. Eng. Manag. 2020, 146, 04020052. [Google Scholar] [CrossRef]
- Bednarz, L.M. International Management and Risk Assessment. Int. J. Glob. Energy Issues 2010, 34, 16–24. [Google Scholar] [CrossRef]
- Pal, R.; Kupka, K.; Aneja, A.P.; Militky, J. Business Health Characterization: A Hybrid Regression and Support Vector Machine Analysis. Expert Syst. Appl. 2016, 49, 48–59. [Google Scholar] [CrossRef]
- Patil, R.; Grantham, K.; Steele, D. Business Risk in Early Design: A Business Risk Assessment Approach. Eng. Manag. J. 2012, 24, 35–46. [Google Scholar] [CrossRef]
- Yang, H.; Chan, A.P.C.; Li, Q. Density Dependence in the Chinese Construction Industry Focus on Mortality of Jiangsu Province(1989–2007). Eng. Constr. Archit. Manag. 2010, 17, 563–580. [Google Scholar] [CrossRef]
- Al-Joburi, K.I.; Al-Aomar, R.; Bahri, M.E. Analyzing the Impact of Negative Cash Flow on Construction Performance in the Dubai Area. J. Manag. Eng. 2012, 28, 382–390. [Google Scholar] [CrossRef]
- Marburg, T.F. A Study of Small Business Failure: Smith & Griggs of Waterbury. Bus. Hist. Rev. 1954, 28, 366–384. [Google Scholar] [CrossRef]
- Appiah, K.O.; Chizema, A.; Arthur, J. Predicting Corporate Failure: A Systematic Literature Review of Methodological Issues. Int. J. Law Manag. 2015, 57, 461–485. [Google Scholar] [CrossRef]
- Salazar, J.A.; Figueroa, E.; Caballero, S.M. Fracaso Empresarial: Análisis Bibliométrico. Rev. CIES 2016, 7, 15–30. [Google Scholar]
- Aktan, S. Application of Machine Learning Algorithms for Business Failure Prediction. Investig. Manag. Financ. Innov. 2011, 8, 52–65. [Google Scholar]
- Eling, M.; Jia, R. Business Failure, Efficiency, and Volatility: Evidence from the European Insurance Industry. Int. Rev. Financ. Anal. 2018, 59, 58–76. [Google Scholar] [CrossRef]
- Li, H.; Sun, J. Business Failure Prediction Using Hybrid2 Case-Based Reasoning (H2CBR). Comput. Oper. Res. 2010, 37, 137–151. [Google Scholar] [CrossRef]
- Tsai, C.F. Combining Cluster Analysis with Classifier Ensembles to Predict Financial Distress. Inf. Fusion 2014, 16, 46–58. [Google Scholar] [CrossRef]
- Xu, W.; Yang, D. A Novel Unweighted Combination Method for Business Failure Prediction Using Soft Set. J. Inf. Process. Syst. 2019, 15, 1489–1502. [Google Scholar] [CrossRef]
- Li, H.; Sun, J. Principal Component Case-Based Reasoning Ensemble for Business Failure Prediction. Inf. Manag. 2011, 48, 220–227. [Google Scholar] [CrossRef]
- Huang, S.M.; Tsai, C.F.; Yen, D.C.; Cheng, Y.L. A Hybrid Financial Analysis Model for Business Failure Prediction. Expert Syst. Appl. 2008, 35, 1034–1040. [Google Scholar] [CrossRef]
- Borrajo, M.L.; Baruque, B.; Corchado, E.; Bajo, J.; Corchado, J.M. Hybrid Neural Intelligent System to Predict Business Failure in Small-to-Medium-Size Enterprises. Int. J. Neural Syst. 2011, 21, 277–296. [Google Scholar] [CrossRef] [PubMed] [Green Version]
Figure 1.
Flowchart methodology. * The database search was conducted on 27 January 2021. The results included two articles from 2021 that have been included in the analysis in 2020. The authors wanted to consider all the existing literature and not eliminate these two articles, which, although published in the early days of 2021, were written in 2020.

Figure 2.
Evolution over time of published articles, percentage variation of published articles and total citations. Source: own work.
Figure 2.
Evolution over time of published articles, percentage variation of published articles and total citations. Source: own work.

Figure 3.
Documents by subject area (in percentage). Source: own work.

Figure 4.
Worldwide publications on BF. Source: own work.

Figure 5.
Network of cooperation based on authorship between countries. Source: own work.

Figure 6.
Network of cooperation based on coauthorship of the principal authors. Source: own work.

Figure 7.
Strategic diagram of keywords from 1954–2010. Source: own work.

Figure 8.
Strategic diagram of keywords from 2011–2020. Source: own work.

Figure 9.
Evolution of leading keywords network based on co-occurrence (1954–2020). Source: own work.
Figure 9.
Evolution of leading keywords network based on co-occurrence (1954–2020). Source: own work.


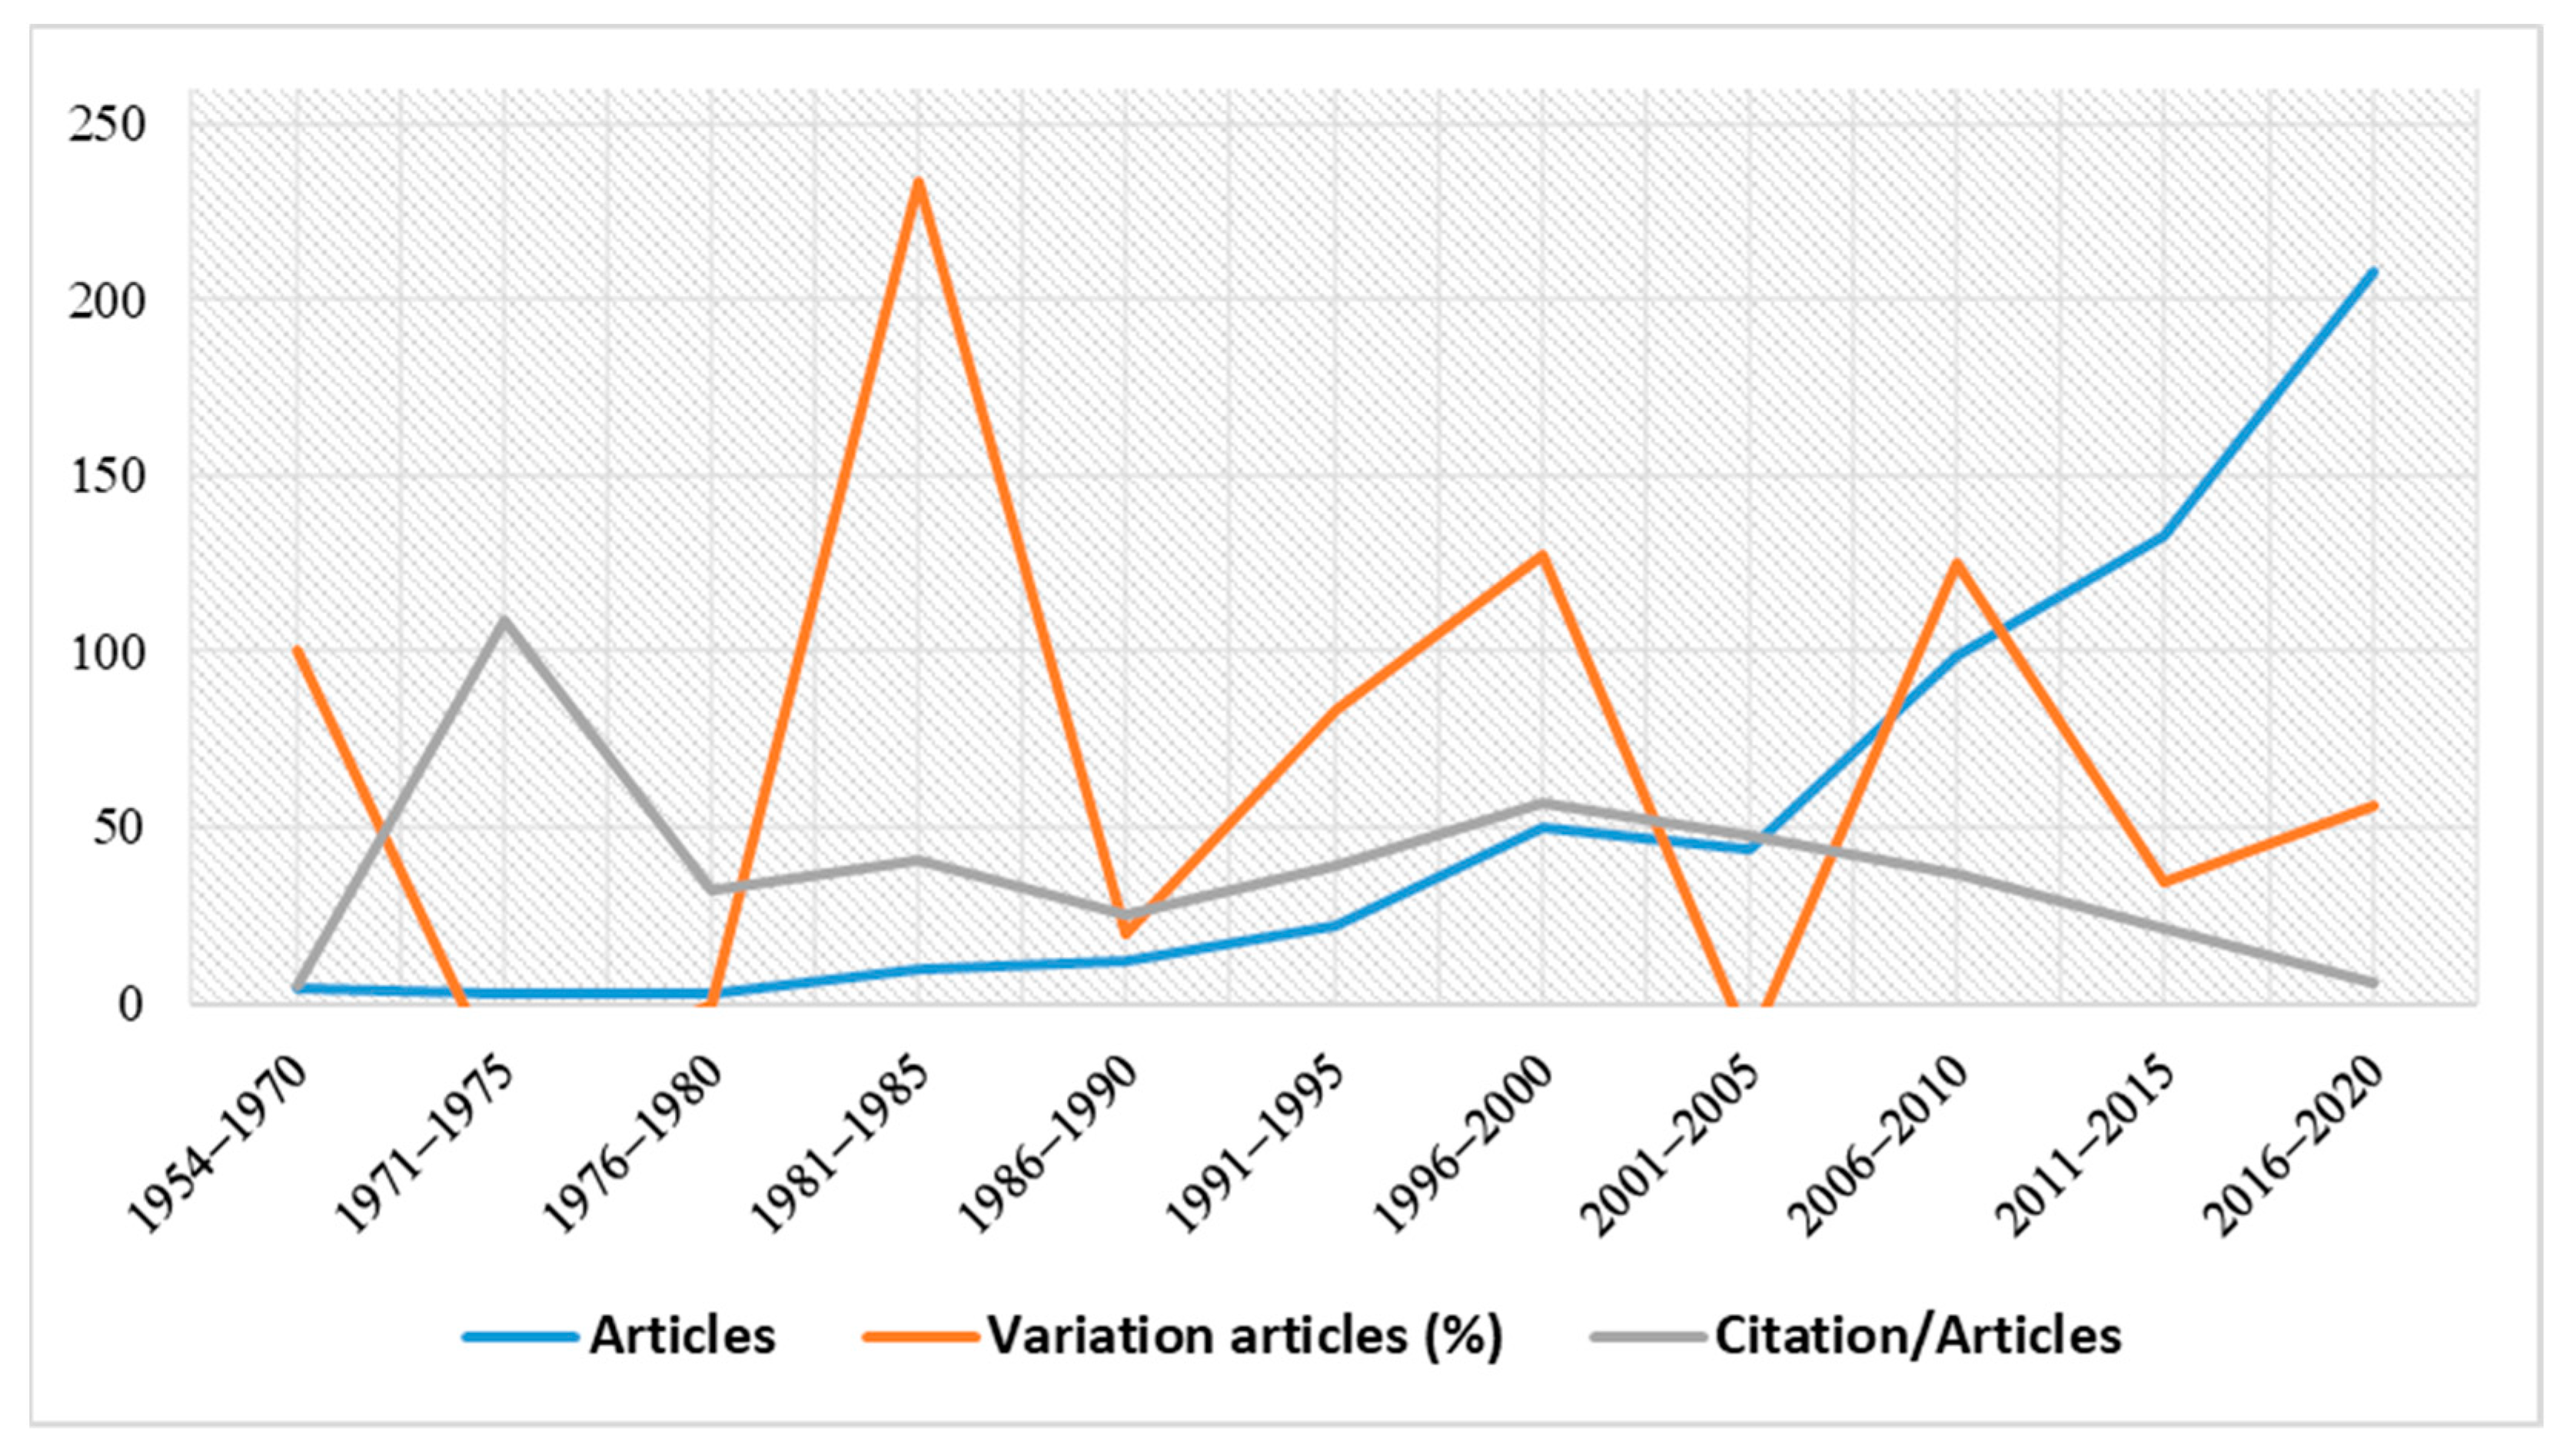
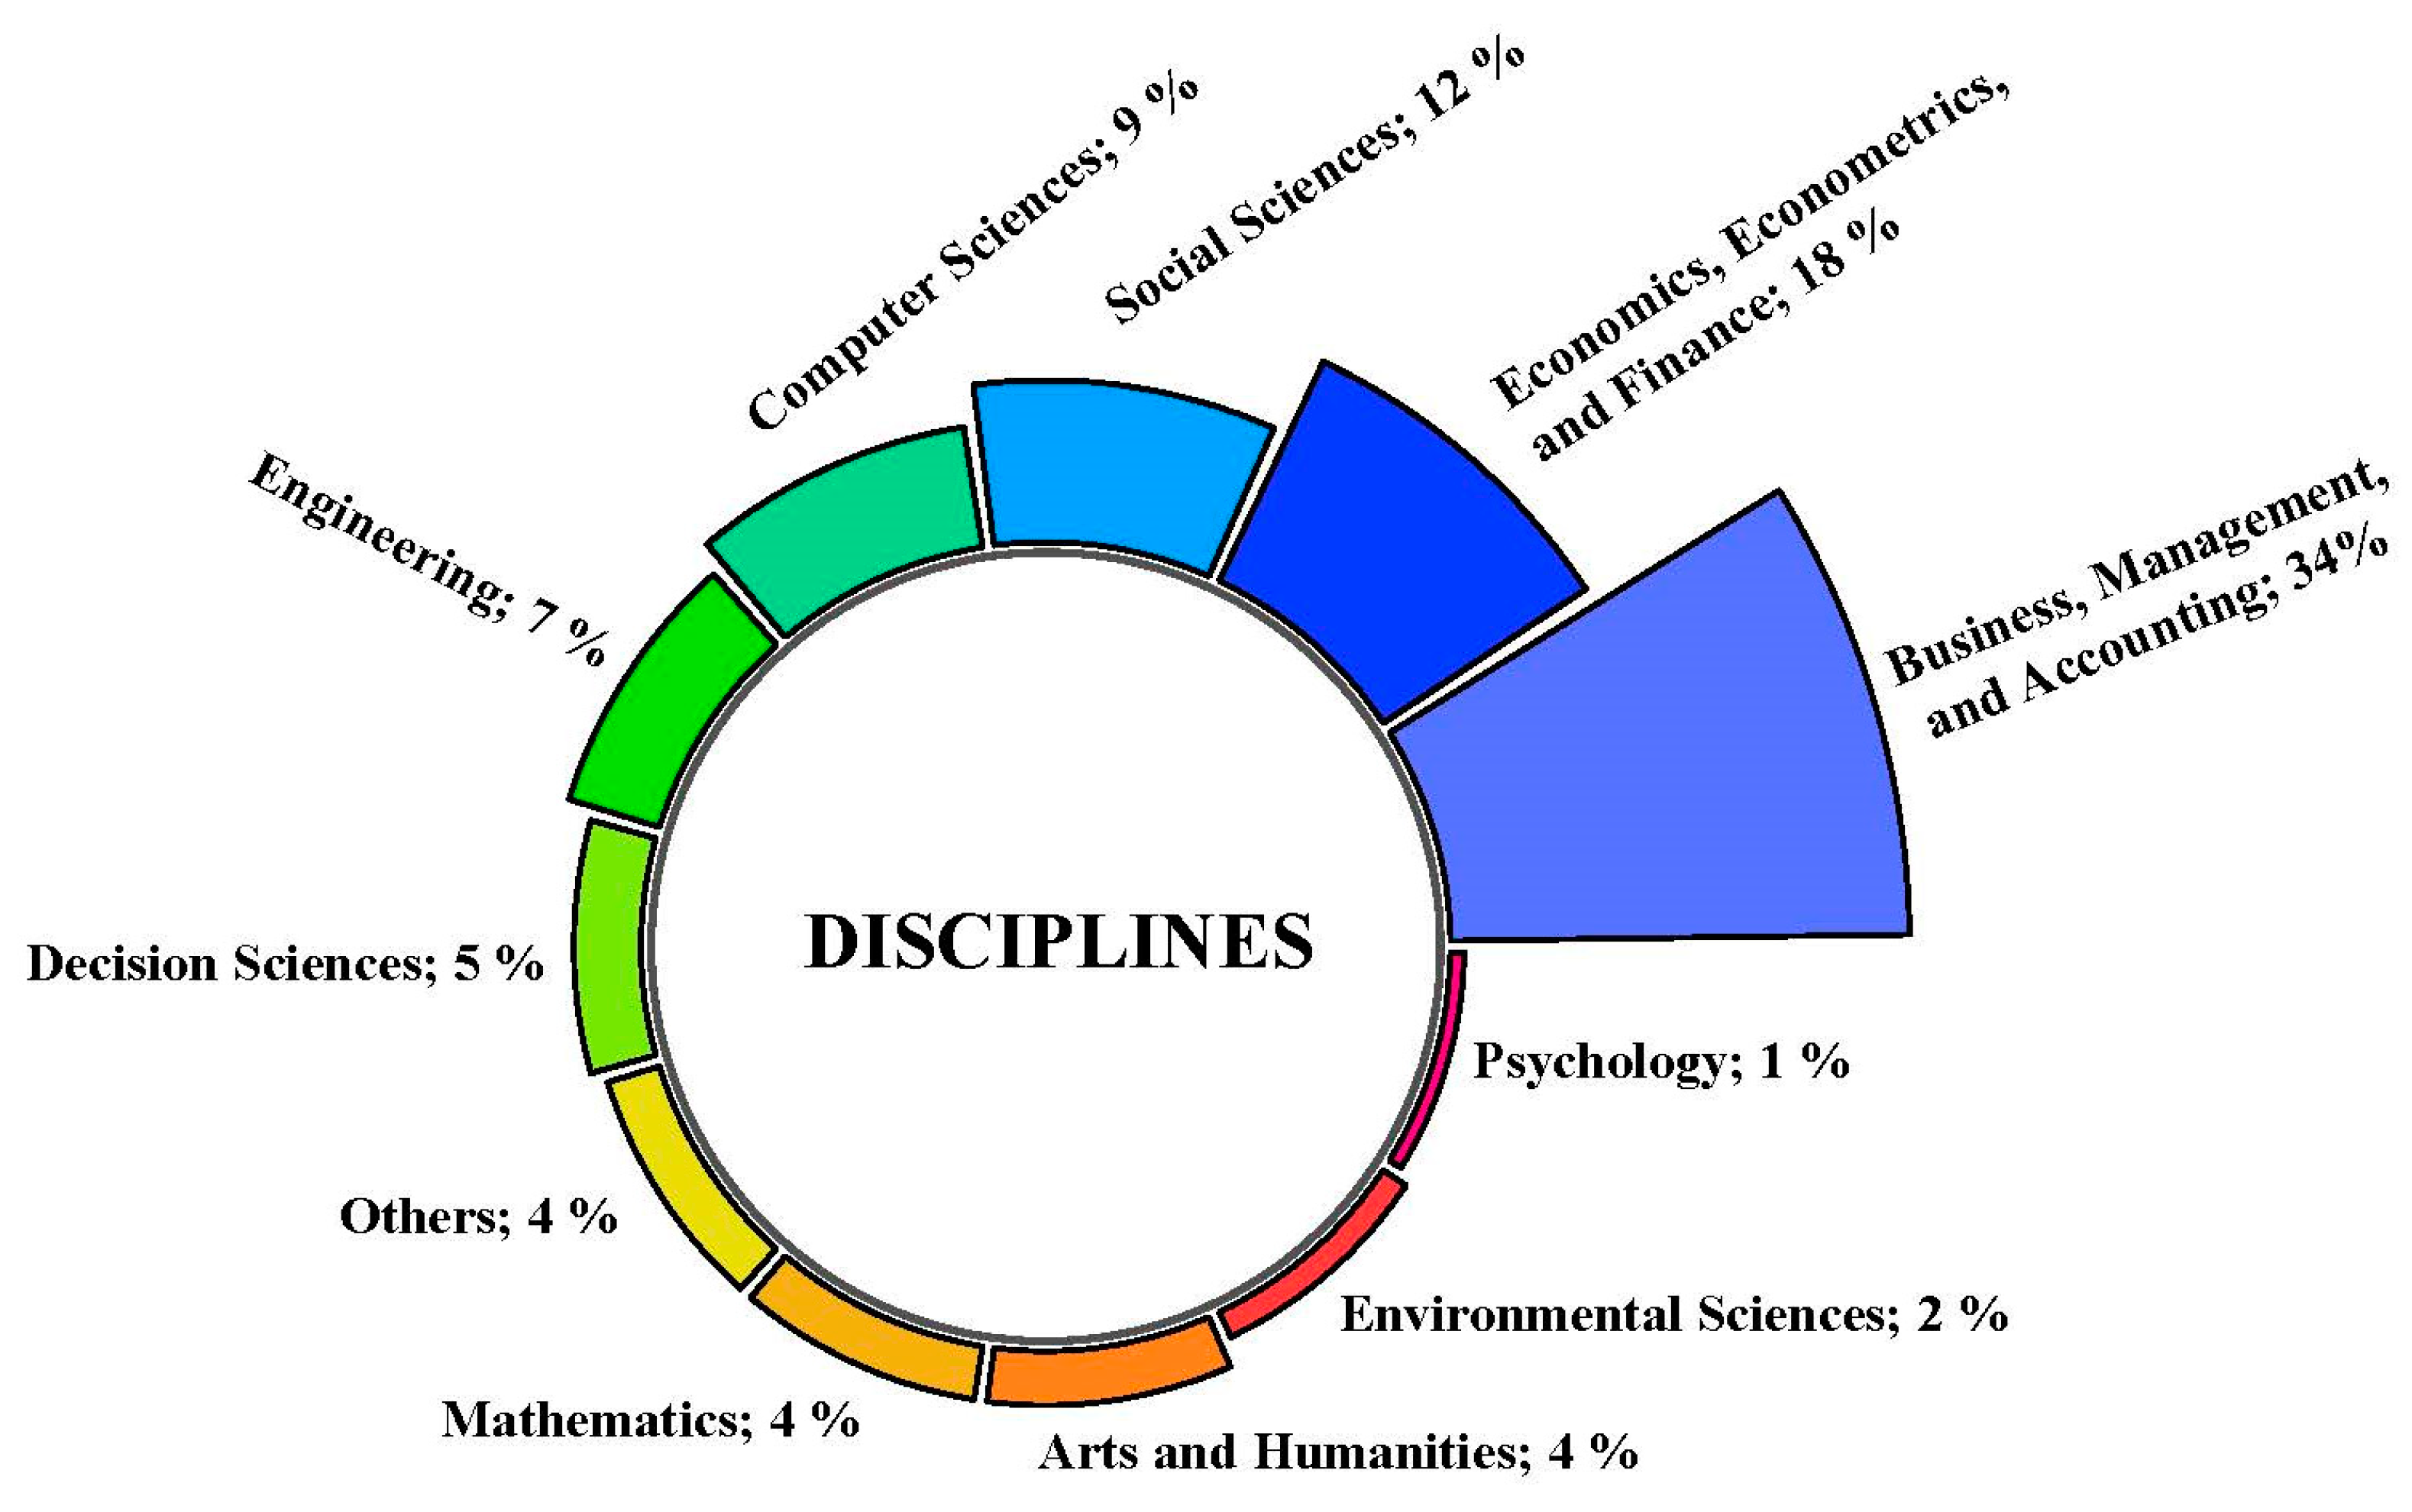
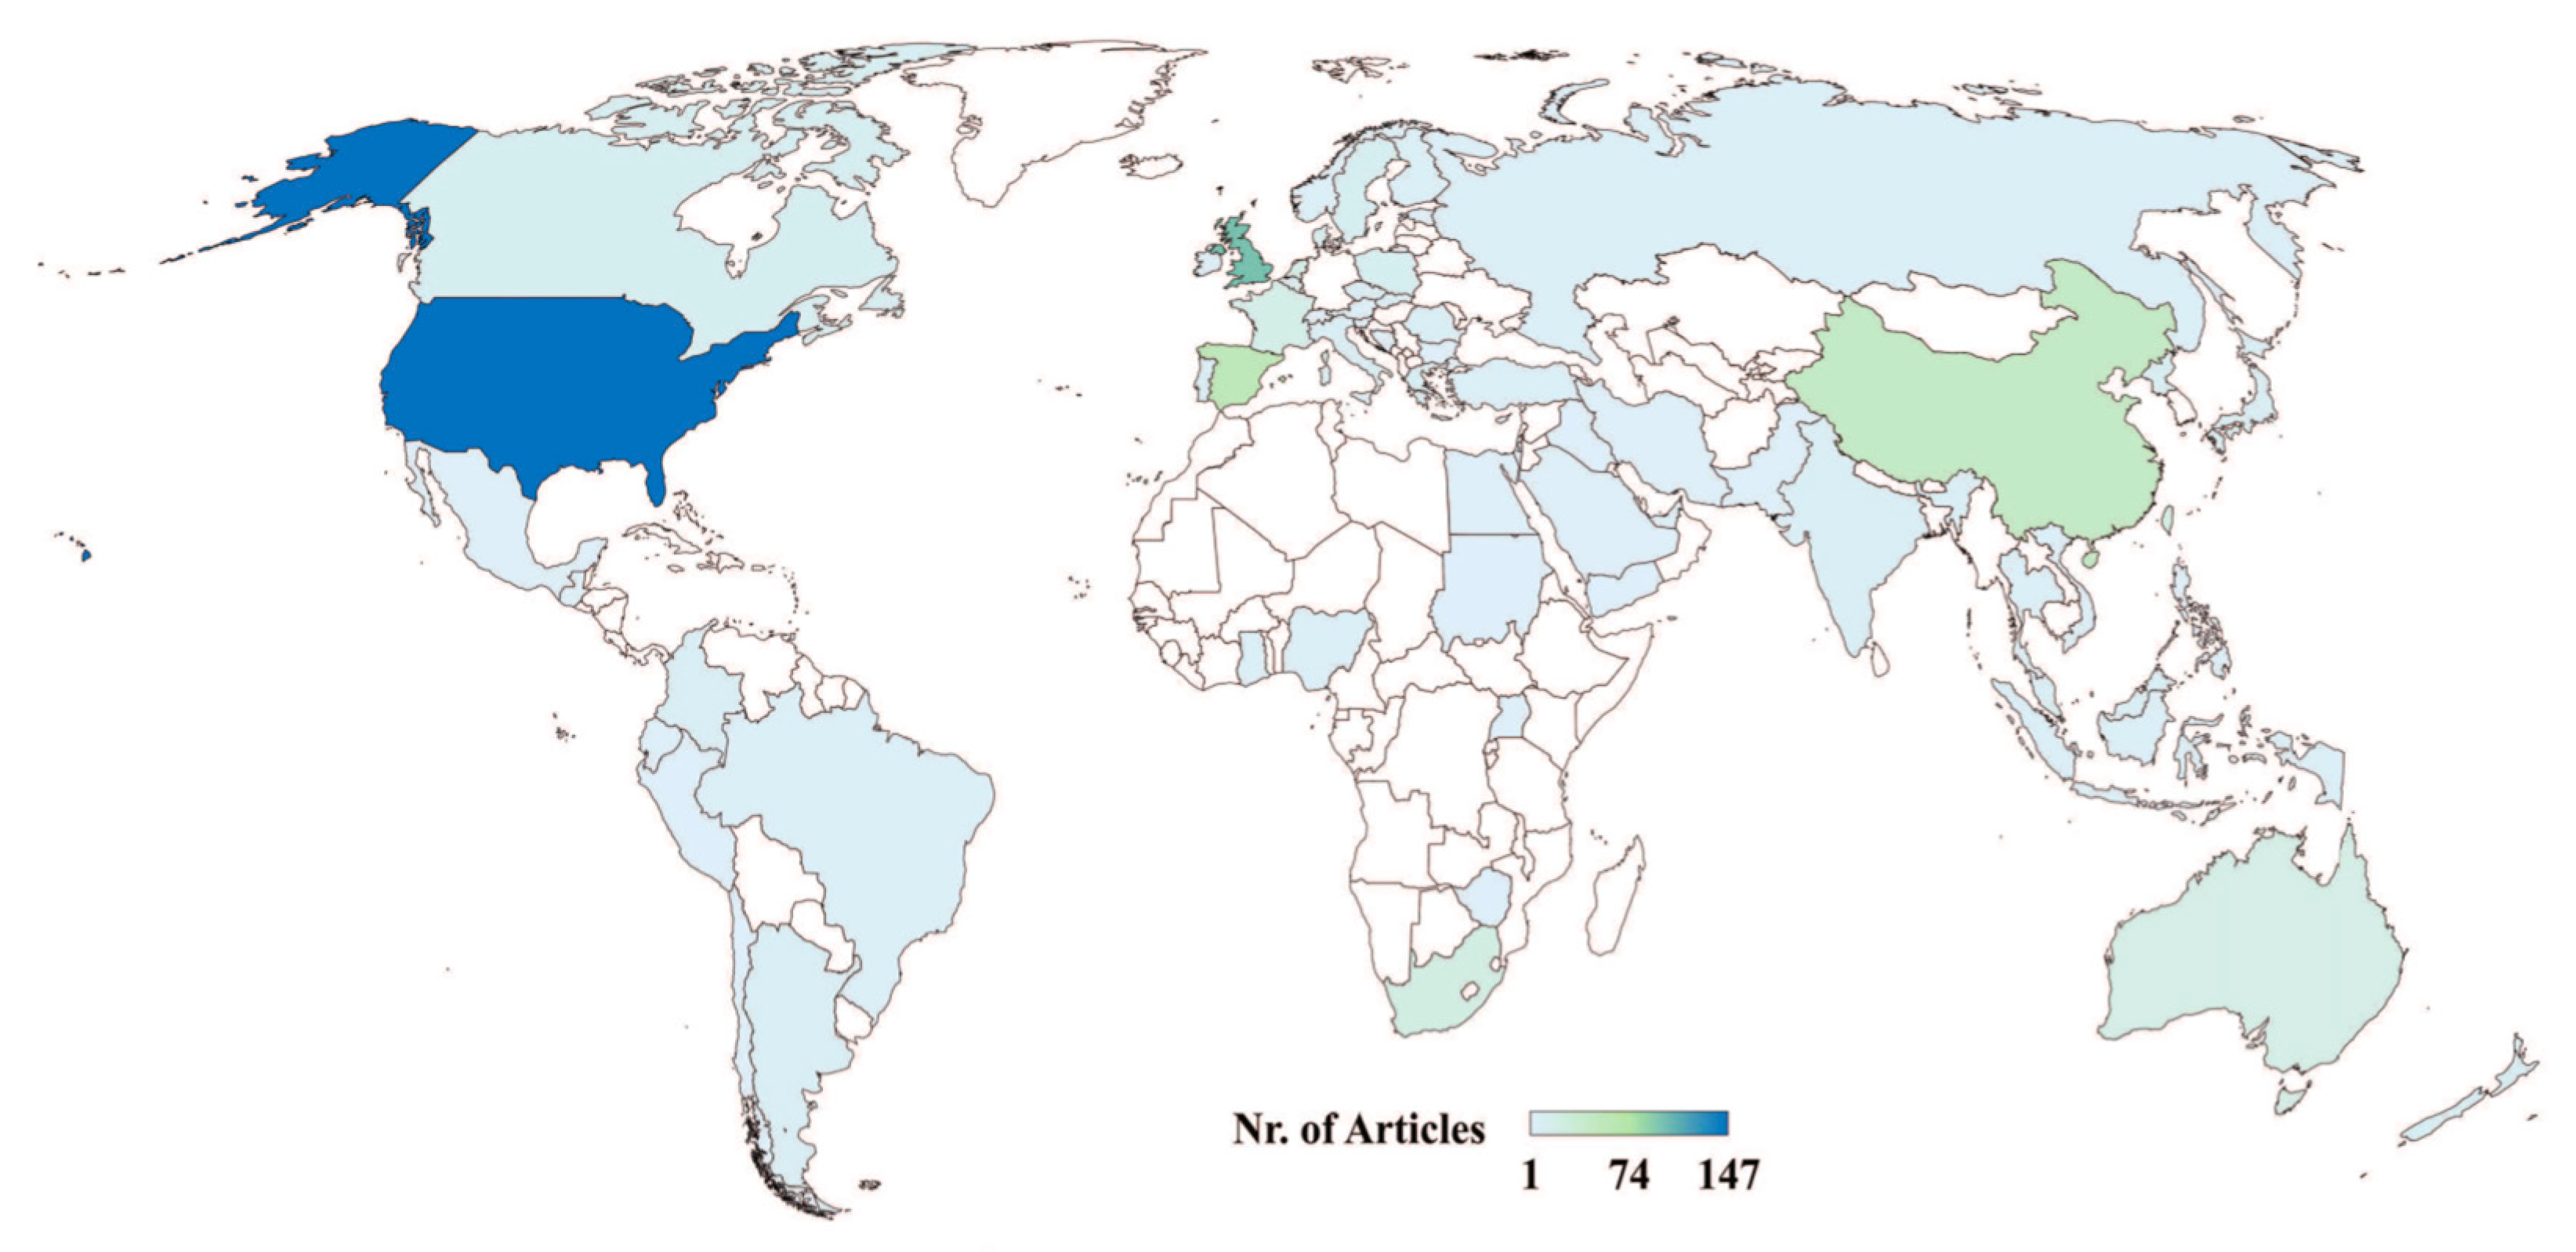
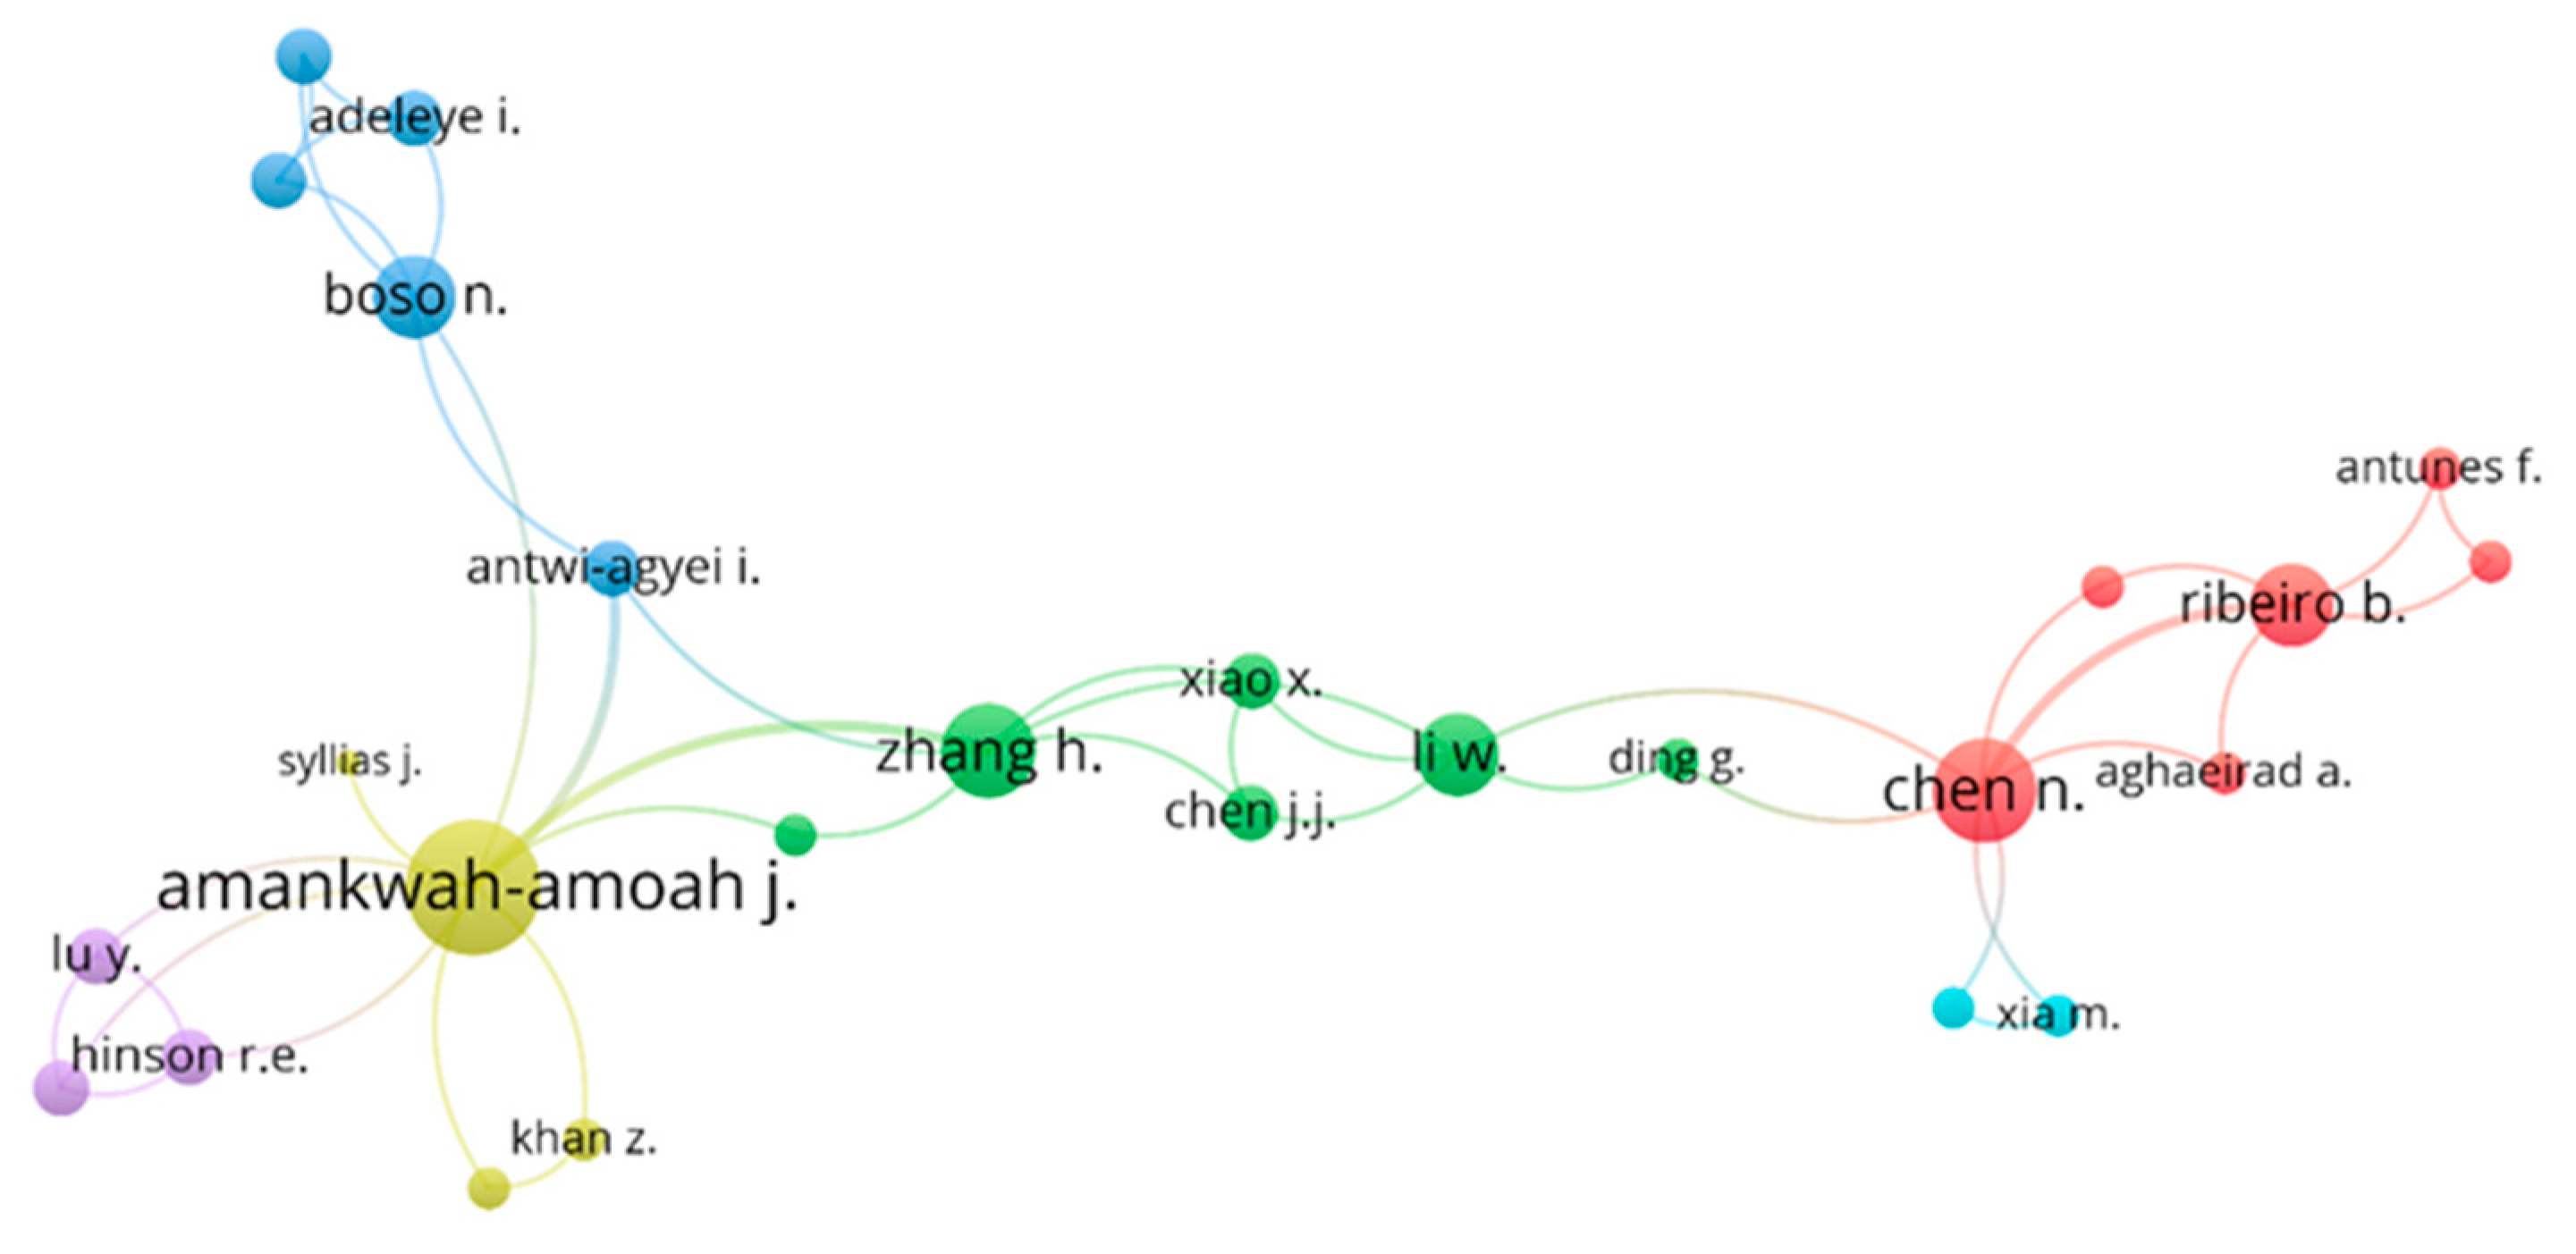
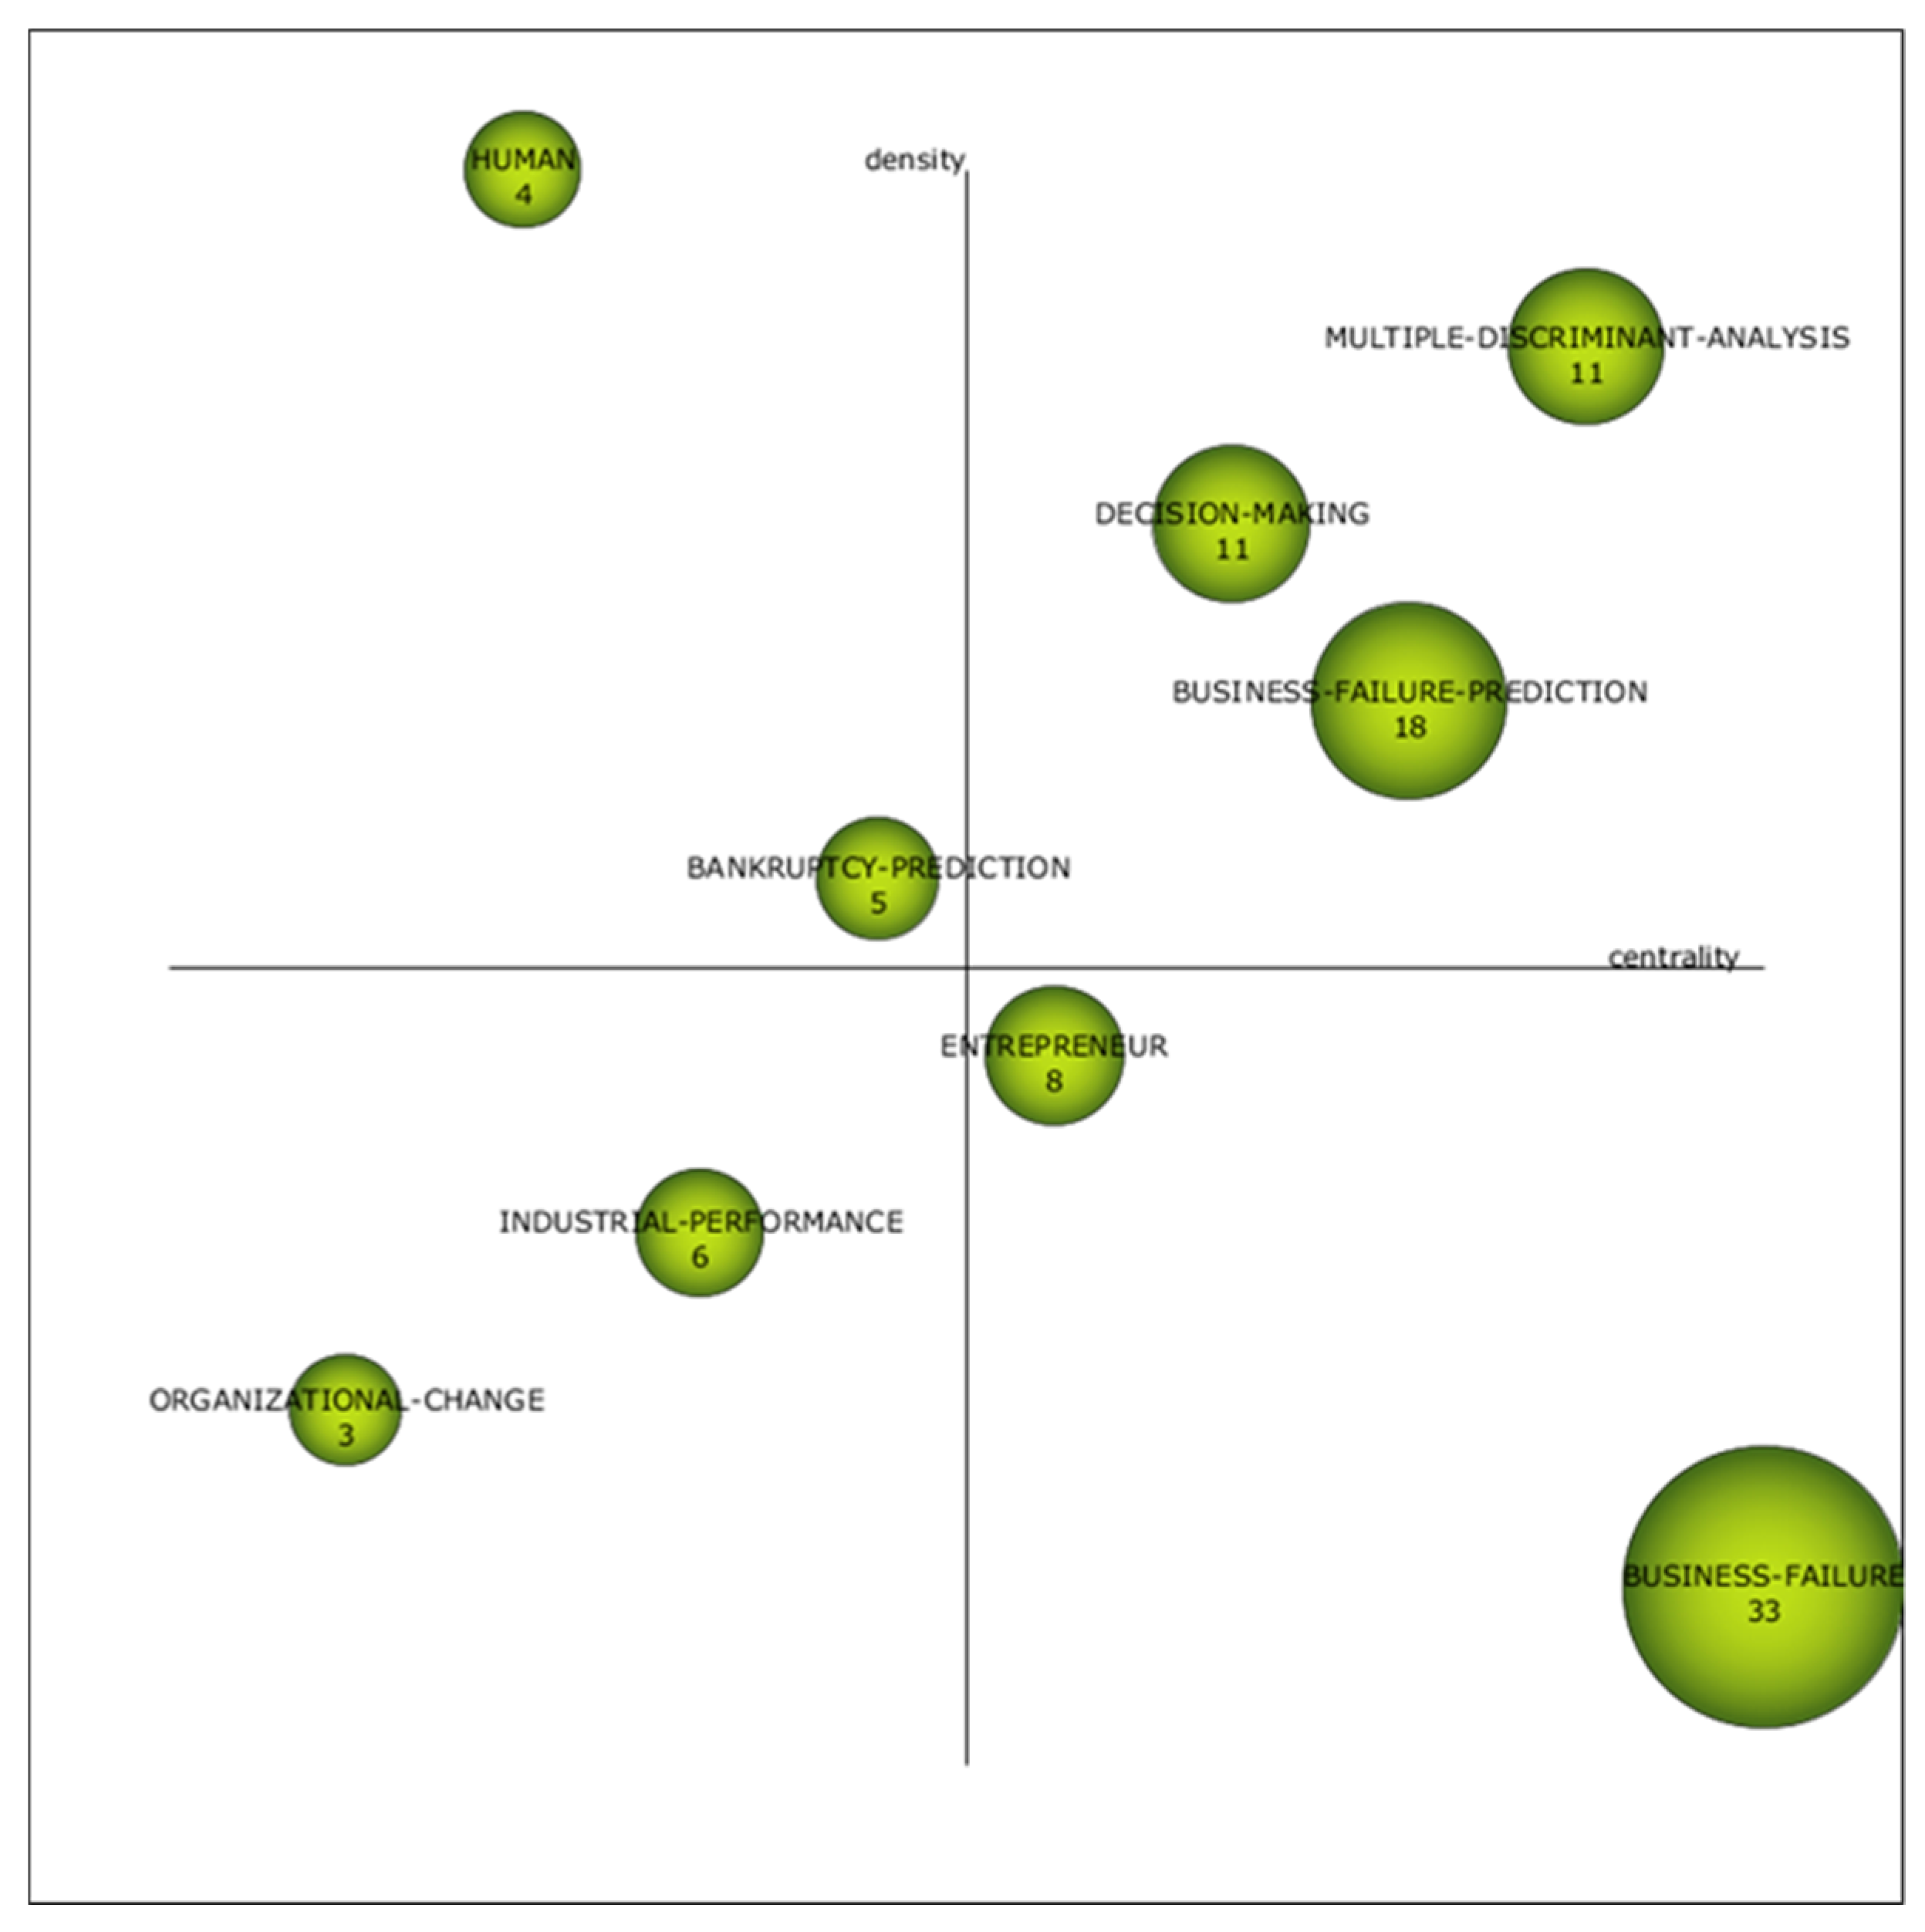
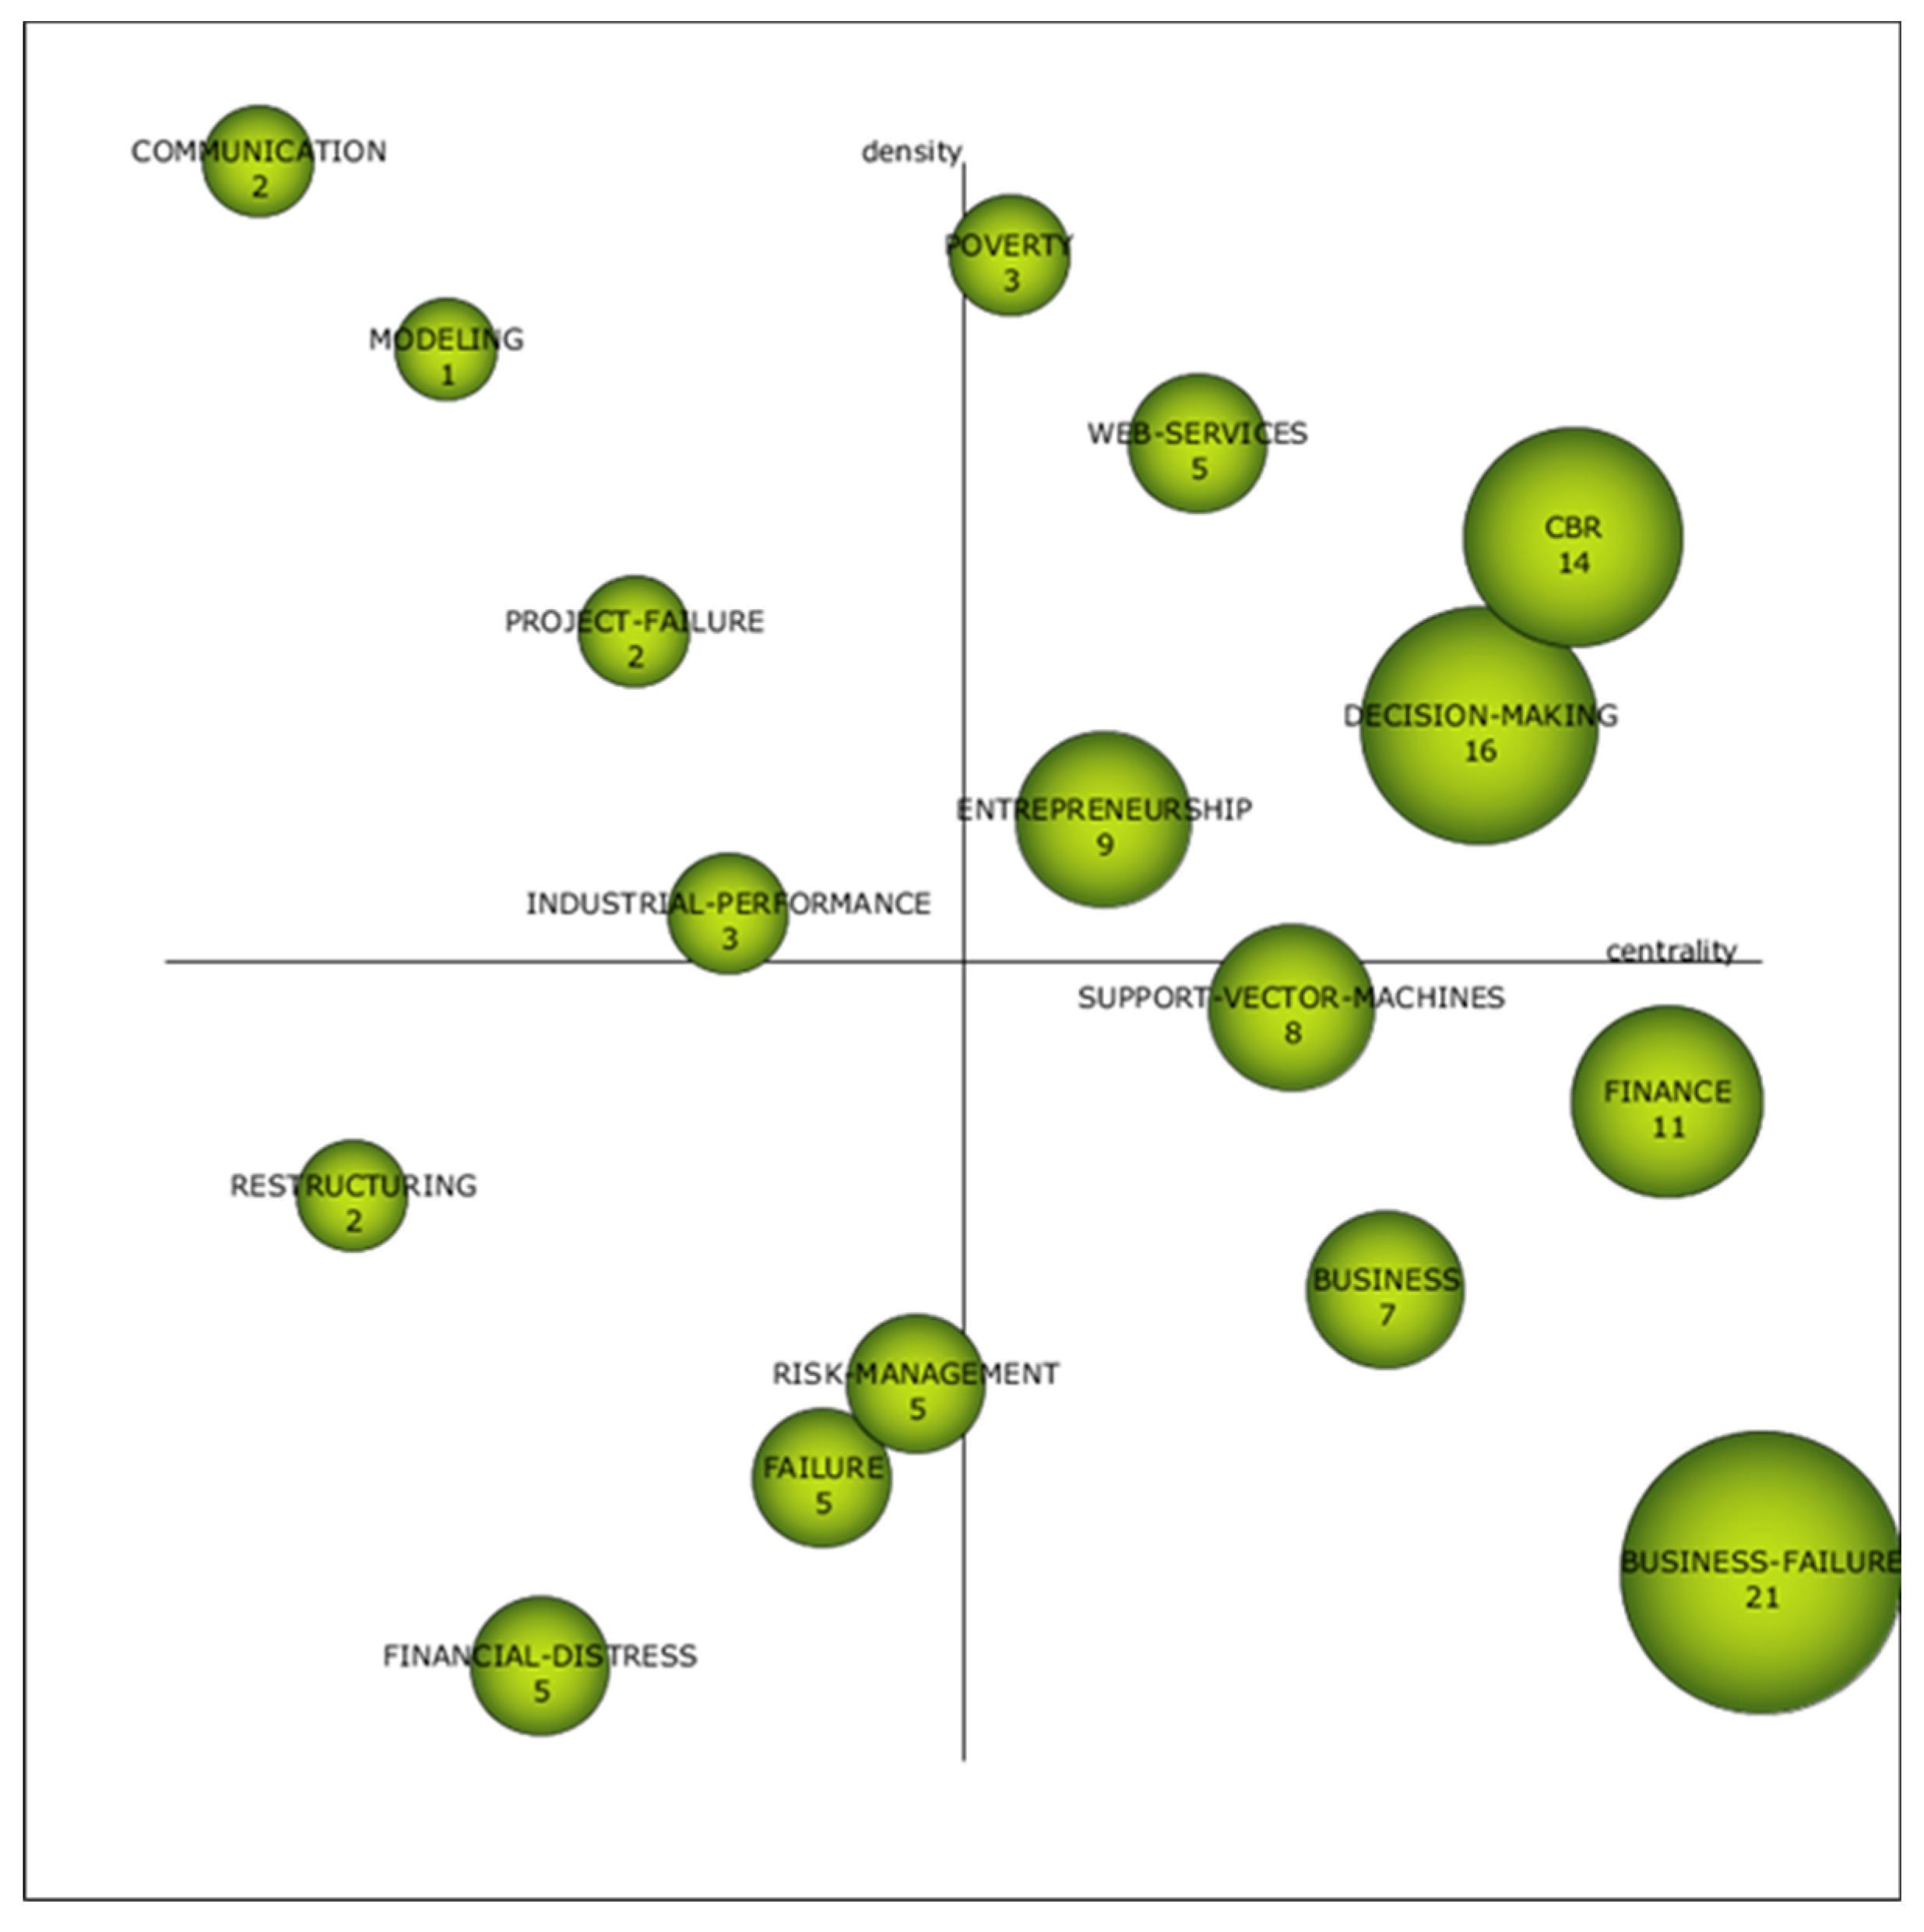
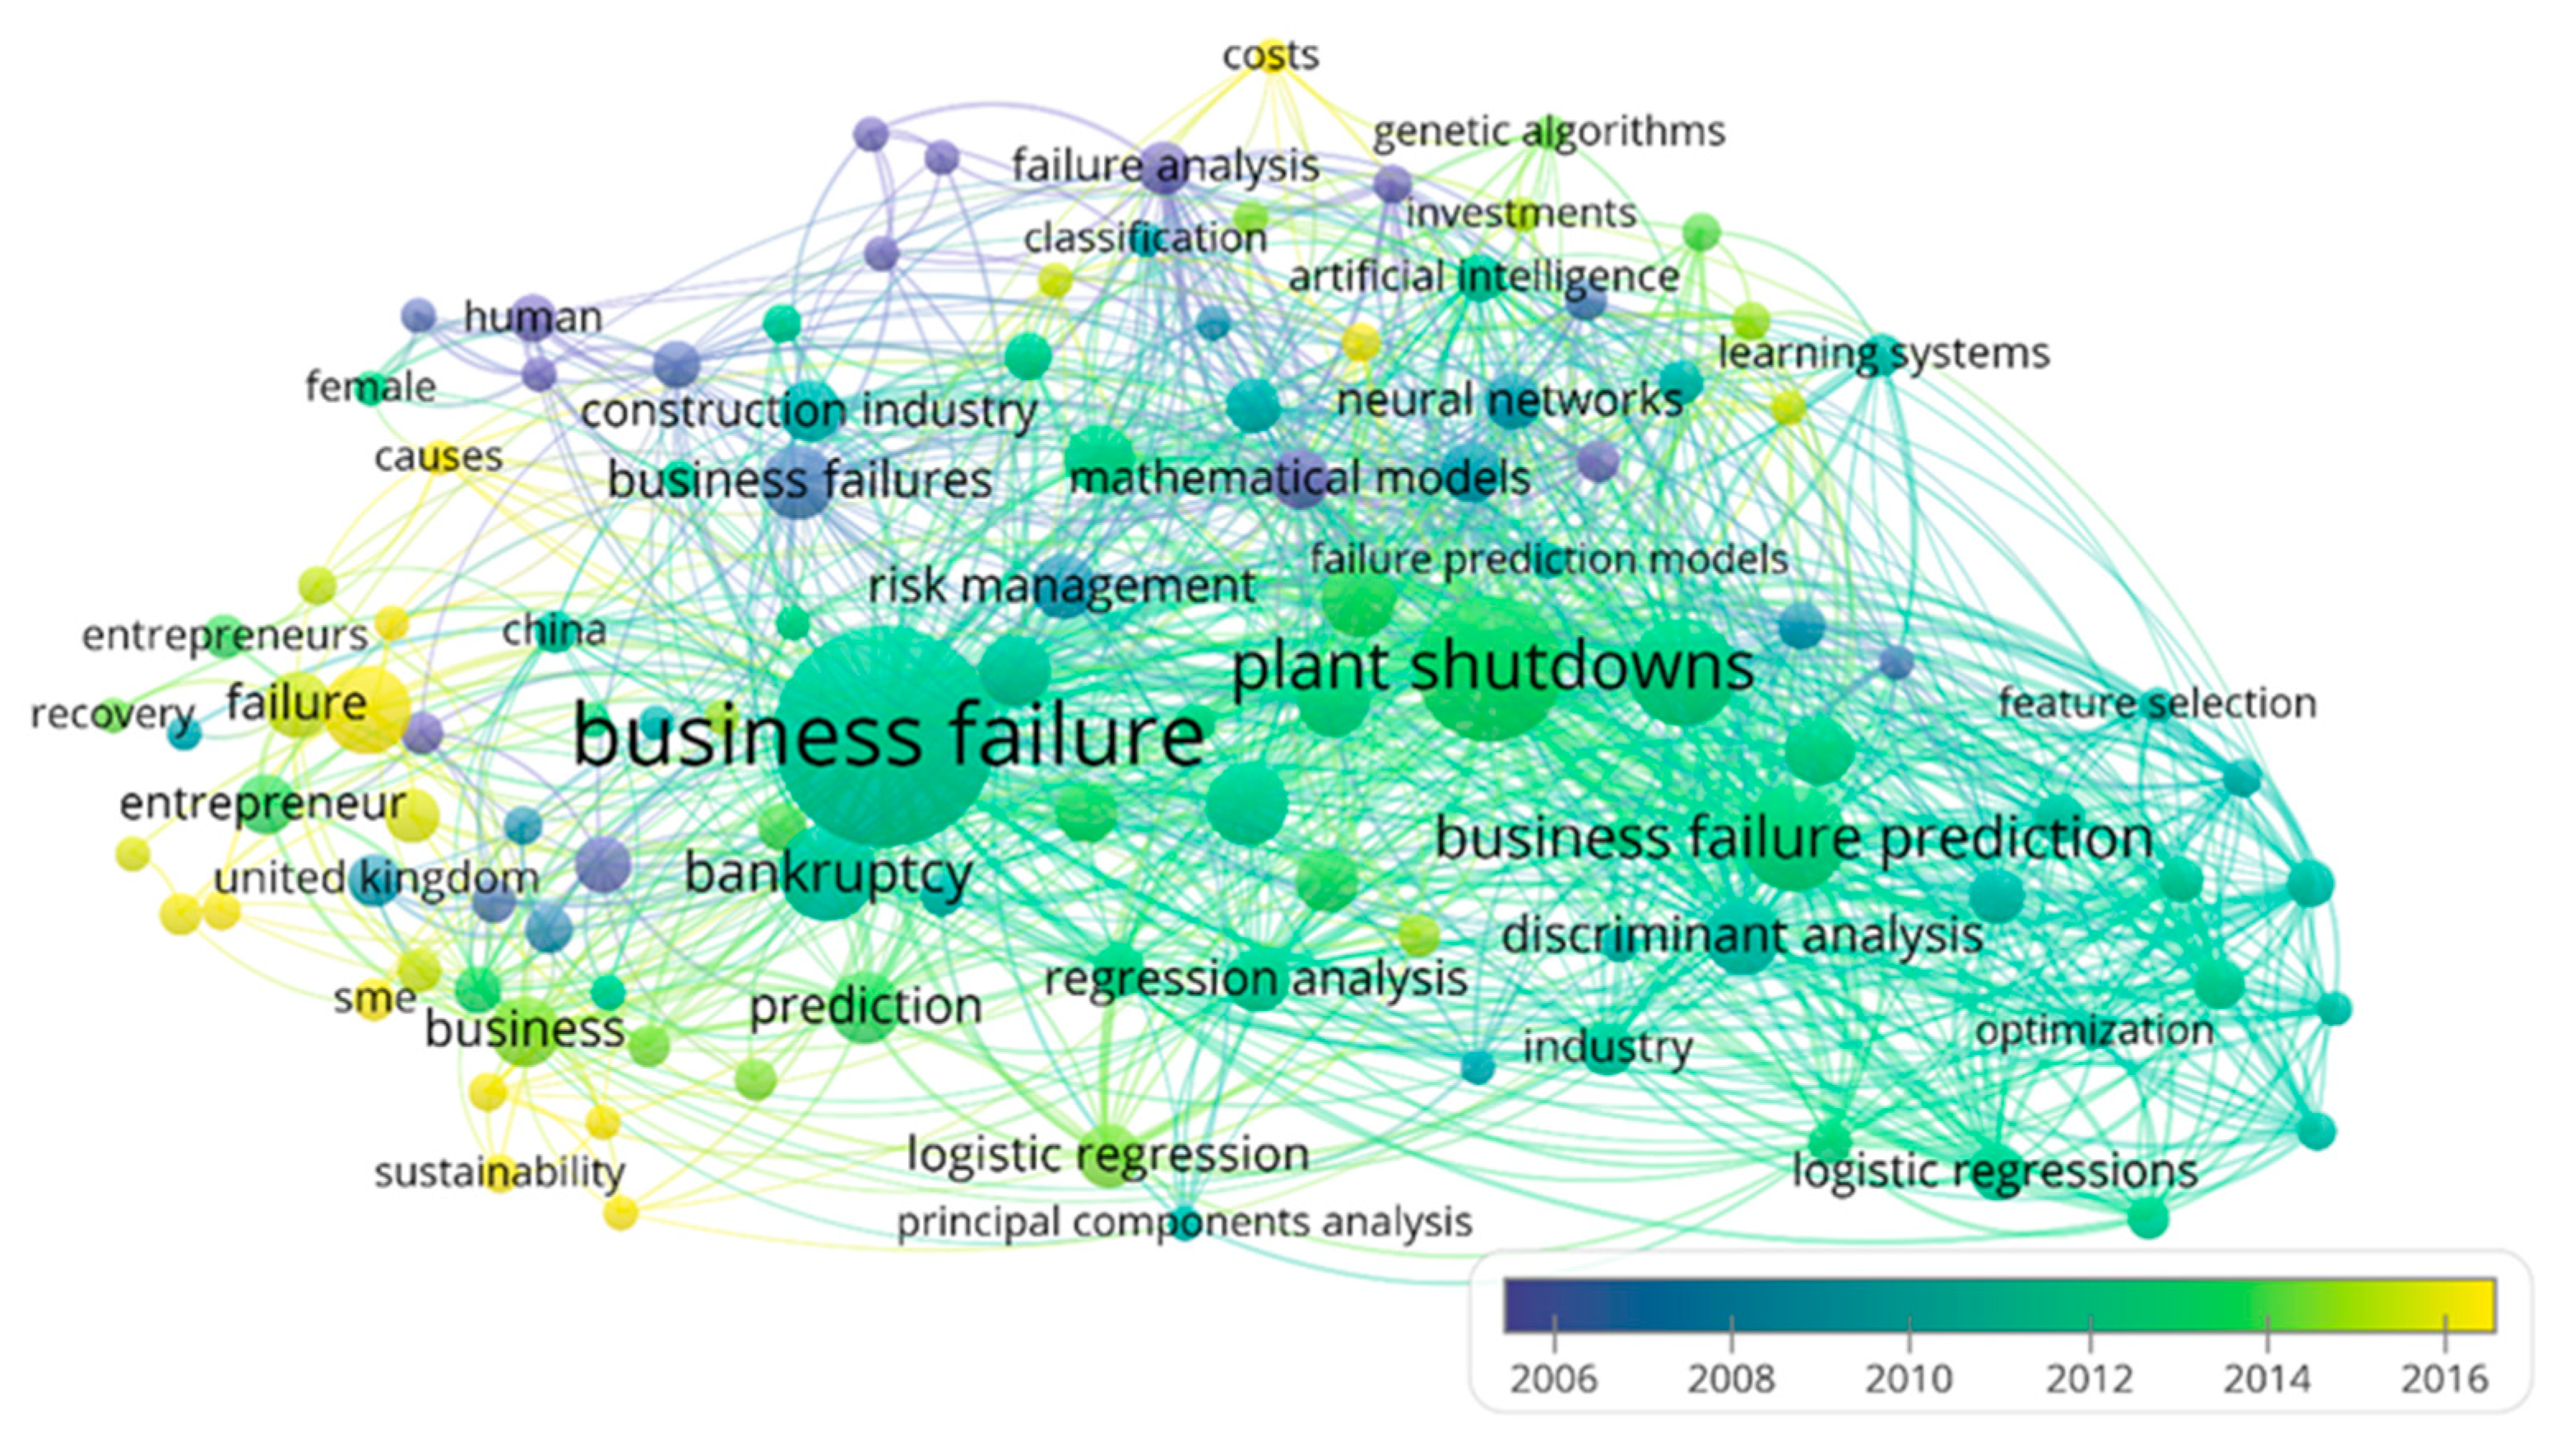
Table 1.
Definitions of business failure.
| Author | Term | Definition |
|---|---|---|
| Beaver, 1966 | Failure | Impediment to affront debts |
| Altman, 1968 | Bankruptcy | Legal bankruptcy declaration |
| Deakin, 1972 | Failure | Insolvency |
| Ohlson, 1980 | Bankruptcy | Legal bankruptcy declaration |
| Taffler, 1982 | Failure | Voluntary liquidation, the legal order of liquidation or state intervention |
| Lo, 1986 | Bankruptcy | Legal bankruptcy declaration |
| Theodossiou, 1993 | Bankruptcy | Insolvency, legally bankrupt |
| Correa et al., 2003 | Bankruptcy | Insolvency |
| Romero, 2013 | Failure | Legal bankruptcy declaration |
| Zmijewski, 2013 | Bankruptcy | Legal bankruptcy declaration |
Source: own work.
Table 2.
Summary of data.
| Data | Business Failure Research |
|---|---|
| Number of articles | 588 |
| Number of journals | 373 |
| Number of authors | 1163 |
| Number of countries | 70 |
| Number of citations | 14,696 |
| Average citations/article | 24.99 |
| Average citations/authors | 12.64 |
Source: own work.
Table 3.
Significant characteristics of the scientific production.
| Year | A | AU | AU/A | C | J | TC | TC/A |
|---|---|---|---|---|---|---|---|
| 2016–2020 | 208 | 568 | 2.73 | 57 | 154 | 1238 | 5.95 |
| 2011–2015 | 133 | 324 | 2.44 | 37 | 114 | 2782 | 20.92 |
| 2006–2010 | 99 | 225 | 2.27 | 30 | 80 | 3697 | 37.34 |
| 2001–2005 | 44 | 93 | 2.11 | 22 | 36 | 2109 | 47.93 |
| 1996–2000 | 50 | 104 | 2.08 | 13 | 41 | 2862 | 57.24 |
| 1991–1995 | 22 | 38 | 1.73 | 6 | 22 | 848 | 38.55 |
| 1986–1990 | 12 | 17 | 1.42 | 3 | 11 | 304 | 25.33 |
| 1981–1985 | 10 | 14 | 1.4 | 6 | 6 | 413 | 41.30 |
| 1976–1980 | 3 | 3 | 1.00 | 2 | 3 | 95 | 31.67 |
| 1971–1975 | 3 | 3 | 1.00 | 2 | 3 | 327 | 109.00 |
| 1954–1970 | 4 | 5 | 1.25 | 2 | 3 | 21 | 5.25 |
A: number of articles; AU: number of authors; AU/A: number of authors by article; C: number of countries; J: number of journals; TC: total citations in the articles; TC/A: total citations per article. Source: own work.
Table 4.
The top 11 most productive journals on BF from 1954–2020.
| Journal | A | C | TC | TC/A | 1st A | Last A | TC/Y | SJR(Q) | H-Index |
|---|---|---|---|---|---|---|---|---|---|
| Expert Systems With Applications | 19 | UK | 1070 | 56.32 | 1995 | 2019 | 41.15 | 1.494(Q1) | 15 |
| Journal of Business Research | 13 | The Netherlands | 259 | 19.92 | 1998 | 2019 | 11.26 | 1.871(Q1) | 9 |
| Journal of Business Venturing | 11 | The Netherlands | 1549 | 140.82 | 1997 | 2020 | 64.54 | 4.977(Q1) | 9 |
| Small Business Economics | 9 | The Netherlands | 414 | 46.00 | 1998 | 2020 | 18.00 | 1.929(Q1) | 6 |
| Business History Review | 7 | UK | 79 | 11.29 | 1954 | 2012 | 1.18 | 0.681(Q1) | 4 |
| Business History | 6 | UK | 37 | 6.17 | 1983 | 2020 | 0.97 | 0.600(Q1) | 4 |
| European Journal of Operational Research | 6 | The Netherlands | 972 | 162.00 | 1996 | 2020 | 38.88 | 2.364(Q1) | 5 |
| International Small Business Journal | 6 | UK | 528 | 88.00 | 1983 | 2000 | 13.89 | 1.848(Q1) | 6 |
| Journal of Small Business and Enterprise Development | 6 | UK | 49 | 8.17 | 2000 | 2020 | 2.33 | 0.723(Q1) | 4 |
| Managerial Finance | 6 | UK | 52 | 8.67 | 1997 | 2013 | 2.17 | 0.248(Q3) | 4 |
| Sustainability | 6 | Switzerland | 15 | 2.50 | 2017 | 2020 | 3.75 | 0.581(Q2) | 2 |
A: number of articles; C: country; TC: total citations; TC/A: total citations by article; 1st A: year corresponding to first published article; Last A: year corresponding to last published article; TC/Y: average number of citations per year since the 1st published article; SJR(Q): SCImago Journal Rank (quartile in 2019); H-Index: Hirsch index in this topic. Source: own work.
Table 5.
The top 14 most productive countries on BF research.
| Country | A | TC | TC/A | 1st A | Last A | TC/Y | H-Index |
|---|---|---|---|---|---|---|---|
| United States | 147 | 5212 | 35.46 | 1954 | 2020 | 77.79 | 39 |
| UK | 98 | 2732 | 27.88 | 1983 | 2020 | 71.89 | 26 |
| Spain | 55 | 628 | 6.41 | 1998 | 2020 | 27.30 | 13 |
| China | 46 | 1256 | 27.30 | 2009 | 2020 | 104.67 | 18 |
| South Africa | 22 | 373 | 16.96 | 2001 | 2020 | 18.65 | 5 |
| Taiwan | 22 | 656 | 29.82 | 1999 | 2019 | 29.82 | 13 |
| Germany | 20 | 252 | 12.60 | 2002 | 2020 | 13.26 | 7 |
| Australia | 19 | 449 | 23.63 | 1981 | 2019 | 11.23 | 8 |
| The Netherlands | 18 | 899 | 49.94 | 2001 | 2019 | 44.95 | 10 |
| France | 17 | 357 | 21.00 | 1984 | 2020 | 9.65 | 7 |
| Canada | 11 | 293 | 26.64 | 1995 | 2019 | 7.92 | 6 |
| South Korea | 11 | 373 | 33.91 | 1997 | 2019 | 15.54 | 5 |
| Sweden | 11 | 497 | 45.18 | 1999 | 2019 | 22.59 | 7 |
| Poland | 10 | 786 | 78.60 | 2002 | 2018 | 41.37 | 6 |
A: number of articles; TC: total citations; TC/A: total citations by article; 1st A: year corresponding to first published article; Last A: year corresponding to last published article; TC/Y: average number of citations per year since the 1st published article; H-Index: Hirsch index in this topic. Source: own work.
Table 6.
Top 10 most cooperative countries and main collaborators.
| Country | A | C | NC | Main Collaborators |
|---|---|---|---|---|
| United States | 147 | 5212 | 44 | UK, Germany, Sweden, France |
| UK | 97 | 2732 | 32 | The Netherlands, United States, Spain, China |
| China | 45 | 1256 | 18 | United States, UK, Portugal, South Korea |
| Germany | 19 | 252 | 18 | United States, UK, The Netherlands |
| The Netherlands | 18 | 899 | 14 | UK, United States, Germany, Belgium, Czech Republic |
| Spain | 55 | 628 | 12 | UK, Argentina, Colombia, Germany, France |
| France | 17 | 357 | 10 | United States, Germany, UK, Spain, Greece, New Zealand |
| Sweden | 10 | 497 | 8 | United States, UK, Canada, Germany, Czech Republic |
| Czech Republic | 7 | 43 | 7 | United States, Japan, Slovakia, The Netherlands, Germany, Sweden |
| Taiwan | 22 | 656 | 7 | Australia, Vietnam, United States, UK |
A: number of articles, C: number of citations; NC: number of collaborations.
Table 7.
The top 10 most productive authors on BF research.
| Author | A | TC | TC/A | 1st A | Last A | TC/Y | H-Index | Country | Affiliation |
|---|---|---|---|---|---|---|---|---|---|
| Li, H. | 21 | 550 | 26.19 | 2009 | 2020 | 45.83 | 15 | China | Zhejiang Normal University |
| Sun, J. | 18 | 543 | 30.17 | 2009 | 2014 | 45.25 | 15 | China | Zhejiang Normal University |
| Amankwah-Amoah, J. | 13 | 189 | 14.54 | 2014 | 2020 | 27.00 | 8 | UK | University of Kent |
| Zopounidis, C. | 8 | 876 | 109.50 | 1996 | 2009 | 35.04 | 6 | Greece | Technical University of Crete |
| Doumpos, M. | 5 | 193 | 38.60 | 1999 | 2006 | 8.77 | 5 | Greece | Technical University of Crete |
| Shepherd, D.A. | 5 | 429 | 85.80 | 2009 | 2019 | 35.75 | 4 | United States | University of Notre Dame |
| Scherger, V. | 4 | 17 | 4.25 | 2017 | 2020 | 4.25 | 2 | Argentina | Universidad Nacional del Sur |
| Watson, J. | 4 | 338 | 84.50 | 1993 | 1999 | 12.07 | 4 | Australia | The University of Western Australia |
| Wiklund, J. | 4 | 403 | 100.75 | 2009 | 2019 | 33.58 | 4 | United States | Martin J. Whitman School of Management |
| Xu, W. | 4 | 48 | 12.00 | 2014 | 2019 | 6.86 | 3 | China | Jiangnan University |
A: number of articles; TC: total citations; TC/A: total citations by article; 1st A: year corresponding to first published article; Last A: year corresponding to last published article; TC/Y: average number of citations per year since the 1st published article; H-Index: Hirsch index in this topic. Source: own work.
Table 8.
The top 11 most productive institutions on BF research.
| Institution | Country | A | TC | TC/A | 1st A | Last A | TC/Y | H-Index |
|---|---|---|---|---|---|---|---|---|
| Zhejiang Normal University | China | 19 | 545 | 28.68 | 2009 | 2015 | 45.42 | 15 |
| University of South Africa | South Africa | 10 | 27 | 2.70 | 2005 | 2020 | 1.93 | 3 |
| University of Kent | UK | 10 | 83 | 8.30 | 2012 | 2020 | 9.22 | 6 |
| University of Bristol | UK | 8 | 155 | 19.38 | 2014 | 2019 | 22.14 | 7 |
| Universidad de Castilla-La Mancha | Spain | 7 | 73 | 10.43 | 2010 | 2020 | 6.64 | 4 |
| Universidad de Valencia | Spain | 7 | 54 | 7.71 | 1998 | 2019 | 2.35 | 5 |
| Universidad de León | Spain | 7 | 56 | 8.00 | 2012 | 2018 | 6.22 | 3 |
| Indiana University Bloomington | United States | 7 | 550 | 78.57 | 1999 | 2016 | 25.00 | 6 |
| Erasmus Universiteit Rotterdam | The Netherlands | 7 | 703 | 100.43 | 2001 | 2020 | 35.15 | 3 |
| Universitat Rovira i Virgili | Spain | 7 | 26 | 3.71 | 2015 | 2020 | 4.33 | 3 |
| Technical University of Crete | Greece | 7 | 871 | 124.43 | 1996 | 2009 | 34.84 | 6 |
A: number of articles; TC: total citations; TC/A: total citations by article; 1st A: year corresponding to first published article; Last A: year corresponding to last published article; TC/Y: average number of citations per year since the 1st published article; H-Index: Hirsch index in this topic. Source: own work.
Table 9.
The top 10 most cited articles.
| Title | Author/s | Journal | TC | Year | TC/Year |
|---|---|---|---|---|---|
| Rough approximation by dominance relations | Greco, S., Matarazzo, B., Slowinski, R. | International Journal of Intelligent Systems | 350 | 2002 | 18.42 |
| Business failure prediction using rough sets | Dimitras, A.I., Slowinski, R., Susmaga, R., Zopounidis, C. | European Journal of Operational Research | 349 | 1999 | 15.86 |
| Correlation coefficients of hesitant fuzzy sets and their applications to clustering analysis | Chen, N., Xu, Z., Xia, M. | Applied Mathematical Modelling | 342 | 2013 | 42.75 |
| A survey of business failures with an emphasis on prediction methods and industrial applications | Dimitras, A.I., Zanakis, S.H., Zopounidis, C. | European Journal of Operational Research | 333 | 1996 | 13.32 |
| 35 years of studies on business failure: An overview of the classic statistical methodologies and their related problems | Balcaen, S., Ooghe, H. | British Accounting Review | 329 | 2006 | 21.93 |
| The extent and nature of opportunity identification by experienced entrepreneurs | Ucbasaran, D., Westhead, P., Wright, M. | Journal of Business Venturing | 320 | 2009 | 26.67 |
| An empirical test of financial ratio analysis for small business failure prediction | Edmister, R.O. | Journal of Financial and Quantitative Analysis | 319 | 1972 | 6.50 |
| Correlates of success in family business transitions | Morris, M.H., Williams, R.O., Allen, J.A., Avila, R.A. | Journal of Business Venturing | 308 | 1997 | 12.83 |
| The Performance and Competitive Advantage of Small Firms: A Management Perspective | Jennings, P., Beaver, G. | International Small Business Journal | 298 | 1997 | 12.42 |
| Integrated methodology of rough set theory and artificial neural network for business failure prediction | Ahn, B.S., Cho, S.S., Kim, C.Y. | Expert Systems with Applications | 280 | 2000 | 13.33 |
TC: total citations; TC/Year: average number of citations per year since the article was published. Source: own work.
Table 10.
The characteristic of the strategic diagram topics from 1954 to 2010.
| Topics | Documents | H-Index | Citations | Centrality | Density |
|---|---|---|---|---|---|
| Multiple discriminant-analysis | 15 | 11 | 573 | 0.89 | 0.89 |
| Business failure prediction | 24 | 18 | 1746 | 0.78 | 0.67 |
| Business failure | 82 | 33 | 3364 | 1.00 | 0.11 |
| Human | 5 | 4 | 236 | 0.22 | 1.00 |
| Decision making | 14 | 11 | 1108 | 0.67 | 0.78 |
| Entrepreneurship | 10 | 8 | 544 | 0.56 | 0.44 |
| Industrial performance | 8 | 6 | 192 | 0.33 | 0.33 |
| Bankruptcy prediction | 5 | 5 | 196 | 0.44 | 0.56 |
| Organisational change | 3 | 3 | 57 | 0.11 | 0.22 |
Source: own work.
Table 11.
The characteristics of the strategic diagram topics from 2011 to 2020.
| Topics | Documents | H-Index | Citations | Centrality | Density |
|---|---|---|---|---|---|
| Decision making | 43 | 16 | 744 | 0.82 | 0.65 |
| CBR | 23 | 14 | 522 | 0.88 | 0.76 |
| Finance | 19 | 11 | 412 | 0.94 | 0.41 |
| Support vector machines | 16 | 8 | 264 | 0.71 | 0.47 |
| Entrepreneurship | 29 | 9 | 382 | 0.59 | 0.59 |
| Business | 21 | 7 | 160 | 0.76 | 0.29 |
| Business failure | 105 | 21 | 1249 | 1.00 | 0.12 |
| Failure | 15 | 5 | 124 | 0.41 | 0.18 |
| Web services | 5 | 5 | 108 | 0.65 | 0.82 |
| Poverty | 3 | 3 | 42 | 0.53 | 0.94 |
| Risk management | 6 | 5 | 89 | 0.47 | 0.24 |
| Industrial performance | 4 | 3 | 60 | 0.35 | 0.53 |
| Communication | 2 | 2 | 103 | 0.06 | 1 |
| Modelling | 3 | 1 | 2 | 0.18 | 0.88 |
| Financial distress | 12 | 5 | 167 | 0.24 | 0.06 |
| Project failure | 2 | 2 | 19 | 0.29 | 0.71 |
| Restructuring | 3 | 2 | 45 | 0.12 | 0.35 |
Source: own work.
Publisher’s Note: MDPI stays neutral with regard to jurisdictional claims in published maps and institutional affiliations. |
© 2021 by the authors. Licensee MDPI, Basel, Switzerland. This article is an open access article distributed under the terms and conditions of the Creative Commons Attribution (CC BY) license (https://creativecommons.org/licenses/by/4.0/).
Share and Cite
MDPI and ACS Style
Zambrano Farias, F.; Valls Martínez, M.d.C.; Martín-Cervantes, P.A. Explanatory Factors of Business Failure: Literature Review and Global Trends. Sustainability 2021, 13, 10154. https://doi.org/10.3390/su131810154
AMA Style
Zambrano Farias F, Valls Martínez MdC, Martín-Cervantes PA. Explanatory Factors of Business Failure: Literature Review and Global Trends. Sustainability. 2021; 13(18):10154. https://doi.org/10.3390/su131810154
Chicago/Turabian StyleZambrano Farias, Fernando, María del Carmen Valls Martínez, and Pedro Antonio Martín-Cervantes. 2021. "Explanatory Factors of Business Failure: Literature Review and Global Trends" Sustainability 13, no. 18: 10154. https://doi.org/10.3390/su131810154
Note that from the first issue of 2016, this journal uses article numbers instead of page numbers. See further details here.