1. Introduction
Food security remains a key concept for agricultural policy in both developing and developed countries to ensure the livelihood of their populations. Accordingly, governments worldwide allocate public support for the agricultural sector. The effective use of public support is an important issue for both researchers and policymakers. Especially, the emergence of crises requires rapid adjustment of support allocation, oftentimes without much supporting information. As an example, the recent crisis related to the COVID-19 pandemic stressed the need for securing the objectives of food security. Especially, the ripple effect caused disturbances in the supply chains across the globe [
1,
2]. In such a context, agricultural resilience appears as a focal point for research and policymaking [
3].
The COVID-19 pandemic has had a profound effect on world development [
4]. Poverty alleviation has been temporarily halted [
5], social instability and threats to democracy in the least developed countries has increased [
6], and aggregate demand has shrunk [
7]. Access to nutritious and diverse food has become an issue [
8], especially in underdeveloped countries [
9]. These challenges put additional focus on agriculture [
10], although it is also struggling with COVID-19-related consequences [
11]. The impact of the COVID-19 pandemic on agriculture has been felt in the overall level of rural development [
12]. The shortage of inputs necessary for the continuation of agricultural activities have been hindering efficient everyday farm practices [
13] and destroying established vending channels [
14]. Even the sustainability goals have been threatened. The COVID-19 pandemic has reduced the economic returns in agriculture [
15], has disrupted trade [
16], has threatened cooperation initiatives [
17], and has negatively affected agricultural education [
18]. Mishra et al. [
19] compared the effects of natural disasters (e.g., droughts) and human disasters (e.g., COVID-19) to agriculture and found human disasters to be much more impactful. These effects started threatening the proper functioning of the agricultural sector [
19]. In order to avoid this and assure the provision of safe and affordable food for its citizens, which is considered one of the main government functions [
20], state authorities started an extensive financial aid program aimed at supporting farmers [
21]. However, due to time constraints and a lack of scientific background, some of these measures were deemed not very effective [
22]. In order to avoid the repetition of situations of this kind and to provide scientifically based evidence on the most effective public support measures for farmers in times of crisis, this paper aims to reveal and rank the most effective support measures for agricultural supply chains.
Multiple dimensions of agricultural resilience are impacted by the pandemic crisis. In order to successfully cope with the challenges induced by the pandemic crisis, one needs to ensure that (i) multiple dimensions of agricultural resilience are considered, (ii) an effective decision-making framework is available (including decision data), and (iii) robustness of the results is ensured. The multi-criteria decision-making (MCDM) technique appears as one of the key techniques in this regard [
23]. Recently, a number of quantitative frameworks have been developed to handle multi-criteria problems. The group decision-making procedures based on the analytical hierarchical process and best–worst method have been used to address complex issues [
24,
25]. Note that the former technique requires pairwise comparisons of all the alternatives under consideration, whereas the latter one is confined to comparisons against the best and worst ones. Still, these may be challenging for inexperienced users and render inconsistent results. The use of the aggregation operators also helps to achieve consensus in group decision-making [
26]. Fuzzy logic [
27,
28] can also be applied for modeling uncertain situations that are often inherent to the socioeconomic phenomena, as well as artificial intelligence tools [
29,
30].
In this paper, we adapt the concept of the Pugh matrix [
31] to relate policy measures to the impact on agricultural resilience. These effects are represented by multiple criteria. The group decision-making approach is applied to describe the performance of the support measures. Then, the data aggregation is supplemented with Monte Carlo simulation, allowing for perturbations in the criterion weights.
This paper proposes an MCDM framework for rapid decision analysis for agricultural resilience improvements. Such a framework is topical for addressing such challenges as those posed by the recent COVID-19 pandemic, where the decision information is often readily unavailable and conflicting interests need to be met. We embark on a group MCDM procedure to elicit (i) the priorities of the agricultural policy (as represented by the criteria of agricultural resilience), (ii) the possible policy responses, and (iii) the expected outcomes associated with the policy responses. The Monte Carlo simulation is carried out in order to check the robustness of the results. The paper is the first study that provides a set of possible public support measures aimed at rapid mitigation of the effects of various crises to agricultural supply chains along with a stochastic analytical framework. The possible options are also ranked based on their effectiveness, defined in terms of costs and benefits.
The paper proceeds as follows.
Section 2 explores the effects of the COVID-19 pandemic on the agricultural sector.
Section 3 discusses the criteria of agricultural resilience. The MCDM framework is proposed in
Section 4. Results are discussed in
Section 5.
2. The Diverse Effects of COVID-19 on Agriculture
Global food security came at the forefront of agricultural research during the COVID-19 pandemic [
32,
33]. Apart from a global viewpoint, it has also been researched at the country [
34], province [
35], and household levels [
36]. Under the food security umbrella, new approaches to the evaluation of the resilience of agriculture [
37,
38] and food systems [
39] have been proposed. The research of food systems’ resilience on a regional level has been offered, as it is considered that a collaborative response by various countries to external perturbations is more effective [
40] compared to uncoordinated decisions by each single state. This conclusion is contrary to the actual decisions made by a number of countries, which led to border closures even in alliances with such close cooperation as the EU [
41]. The agricultural resilience concept has been enhanced to cover community marketing [
42], thus elevating agricultural resilience to a more conceptual level covering various approaches and initiatives. In order to cover the entire path of food products within a research framework, a resilience approach to agri-food systems has been proposed [
39]. Some new indicators for measuring food system disruption as a part of a new resilience framework have been offered by Amjath-Babu et al. [
43]. Aday and Aday [
44] have raised concerns that the COVID-19 pandemic threatens not only food security, but food safety as well.
The inadequacy of financial resources necessary for agricultural purposes sharpened the effect of the COVID-19 pandemic on agriculture [
45]. Asiedu et al. [
46] revealed the insufficiency of the physical capital required for maintaining adequate food supply during the pandemic. It led to insufficient access to food among the poorest cohorts of the population [
35], significantly affecting their health [
47]. The insufficient healthcare of agricultural workers was documented by Ramakumar [
48]. Childcare in agricultural populations suffered even more [
49].
Price adjustments were investigated in both international commodity markets [
50] and the retail sector [
51]. The differences in prices of perishable and non-perishable agricultural products were noticed [
52]. The increased correlation between crude oil prices and prices of agricultural products was observed during the pandemic [
53]. The increased usage of various financial mechanisms is proposed to stabilize the fluctuations of retail prices of agricultural goods and farmers’ income levels [
51]. In addition, price control measures were proposed for the stabilization of retail food prices [
54]. Ker [
55] referred to risk management tools as a way to avoid significant disruptions in the agricultural sector as well as sharp fluctuations in retail prices. The returns in agriculture seem to fluctuate less due to the COVID-19 pandemic than due to the bad growing seasons [
56].
The labor force’s participation in agriculture during the pandemic has also received widespread interest [
57,
58]. Balwinder-Singh et al. [
59] showed how labor force shortages during harvesting, caused by direct and indirect results of the COVID-19 pandemic, may lead to cascading consequences for the whole agri-food industry. The impact of occupational stress on agricultural employees and its effect on their performance during the COVID-19 pandemic was documented by Prasad and Vaidya [
60]. The implemented restrictions on labor force migration led to a decrease in agricultural diversity [
61]. The insufficiency of the workforce in the primary economic sector led to decreasing demand for workforce in other agri-food industries, damaging the overall employment situation within the country [
62]. These insights partially correspond to Kumar et al.’s [
63] conclusions about the role of agriculture in transferring the effects of economic shock to other industry branches. The labor shortages in agriculture have intensified during the pandemic period [
64,
65]. These issues have raised voices about at least partial replacement of human work by robots in agriculture [
66].
Food supply chain vulnerability has also become one of the focal points in agricultural research during the COVID-19 pandemic [
67]. Kerr [
68] revealed the dependency of developed states on the food trade and transportation. Morton [
69] found agricultural value chains to be increasingly more susceptible to the COVID-19 pandemic. Cardwell and Ghazalian [
70] appealed to supranational institutions as facilitators of uninterrupted food flows during the pandemic. Macro-level coordination measures dominated Workie et al.’s [
71] suggestions for coping with food insecurity and vulnerability of supply chains. Huss et al. [
72] looked at the micro level for balancing the supply and demand of agricultural products during a crisis. De Paulo Farias and De Araujo [
73] focused on the vulnerability of food product distribution centers in analyzing the bottlenecks of the whole food supply chain. Singh et al. [
74] also saw public distribution centers as one of the most vulnerable links in a food supply chain. Zhou et al. [
75] emphasized short-distance transportation as one of the tools to mitigate supply chain risks. It is also seen as a measure to increase farmers’ profits [
76] and to assure the provision of more fresh and healthy food [
77]. Practical implications for ensuring the stability of food supply chains based on sophisticated ICT were proposed by Sharma et al. [
78]. The agriculture is also seen as a transmitter of economic shocks to other related economic sectors, with the argument that inefficient handling of the consequences of pandemic in the agri-food sector led to a worsening situation in other rural and urban branches of the economy [
63]. However, this view was contradicted by Zhang et al. [
79], who stated that agriculture follows the general path of the economy during the crisis but does not adjust it. The increase in poverty and economic inequality levels were documented as results of the COVID-19 pandemic [
80], which have been aggravated by disproportionate access to agricultural goods [
81]. The activation of informal economy has been observed [
82], although this was contradicted by Crush and Si [
83], who stated that COVID-19 containment measures had significantly decreased the street vending and informal trade in agricultural products. The additional stress on food supply chains caused by panic buying was mentioned by Hobbs [
84].
Land and nature preservation strategies have been stressed [
85,
86]. The higher levels of fertilizers and other soil enrichers were deemed acceptable in order to assure food security in low-income countries [
50]. However, the increasing tolerance of the intensification of land exploitation may lead to soil degradation at even higher rates [
87].
Significant changes in consumer behavior in food consumption in quarantined areas were monitored [
88]. This finding is consistent with Lin and Zhang’s [
89] insights about changes in the portfolio of agricultural products in international trade during the COVID-19 pandemic. Behavioral changes were also noticed on the farmers’ side. Faced with the inability to sell the surplus of their production, they may be reluctant to grow the same numbers of agricultural products the next season in order to avoid possible losses [
90]. This may cause food security stress in the future, or at least be reflected in food prices. These insights were challenged by Deaton and Deaton [
91], who, although acknowledging serious food supply issues, did not find a significant increase in prices, concluding that there is sufficient food production. The presumptions about the unavoidability of the intensification of agriculture in combating COVID-19 outcomes were also raised by Sampath et al. [
92].
On the other hand, there are also studies documenting a positive impact of the COVID-19 pandemic on agriculture, food production, and consumption [
93,
94], and on the spread of agricultural information [
95]. A slight decrease in GHG emissions from agriculture has been observed [
96]. This scientific fact was challenged by McDonald et al. [
97], revealing increased air pollution during the COVID-19 pandemic related to agricultural activities. Consumers’ awareness and concerns regarding food waste increased and were evaluated from various environmental, economic, and nutritional aspects [
98]. Innovations are important for business activities [
99,
100,
101]. Technical and managerial innovations on the plant and farm levels were introduced in the least developed countries [
102]. The increased engagement of agricultural producers with online sales was documented by Chang and Mayerhoefer [
103]. Even the whole sales model of agricultural products has been updated [
104]. A significant increase in local agri-tourism has been observed [
105]. The COVID-19 pandemic is also seen as a possibility to transform agriculture to a more sustainable model [
106]. The deindustrialization of agriculture is also predicted [
107]. This is in part contradicted by Lal et al. [
108], who predicted increased soil exploitation required for recovery from the pandemic. The transformation of agriculture induced by the pandemic was noticed by Gregorioa and Ancog [
109], who also stressed the modified attitudes of society towards agriculture. The decentralization of agriculture is also seen as one of the response measures to future crises [
110]. This is in part supported by Lal [
111], who offered an increase in urban agriculture as a measure to mitigate food security issues during supply shocks. Such a view is supported by Pulighe and Lupia [
112]. Studies on the effects of COVID-19 on agriculture are presented in
Table 1.
3. Socioeconomic Resilience in Agriculture
In the last decade, resilience has become a buzzword in agriculture. However, despite its popularity, resilience is still a highly abstract concept, offering a more intuitive understanding of a phenomenon rather than a clear and measurable definition of it. Up-to-date resilience in agricultural settings has mainly been explored from the socio-ecological system point of view, focusing mainly on resilience of agro-ecosystems to meteorological perturbations and climate change [
113,
114,
115]. Research on economic resilience is concentrated mostly in regional and supply chain studies [
116], whereas analysis of economic resilience in agriculture is very scarce and fragmented. Since our focus is on economic resilience, further on we limit our analysis to the field of economics.
According to Kitsos and Bishop [
117], two main approaches to resilience are used within the economic literature: “equilibrium” approaches and “adaptive” approaches. The former ones refer to resilience as either the ability of the system to return to its pre-shock equilibrium state or growth path [
118,
119] or as its ability to absorb the shocks [
120,
121] while keeping the structure of the system, its feedback, and its institutional arrangements unchanged. The “adaptive” approaches, which treat economic systems as complex and heterogeneous, constantly change and develop in a barely predictable way, with the argument that since the systems are never in equilibrium, the return to a previous state after a disturbance may not be possible or desirable. Consequently, the resilience of the system is referred to as its capacity to absorb the perturbation, adapt to it, or transform into a better development path after it not necessarily keeping its structure or institutional arrangement unchanged, but maintaining its key functions [
122]. “Adaptive” approaches, although more complicated, better reflect the real-world economic systems, and therefore recently are being adopted more often than the “equilibrium” ones [
123]. We also follow this approach by defining economic resilience of agriculture as the capacity of this sector to withstand or recover from various (market, competitive, environmental, etc.) shocks, if necessary by undergoing changes to its economic structures and social and institutional arrangements so as to maintain its core performances and functionalities within a given time period (based on interpretations of [
122,
124]).
Since resilience is a multifarious concept (even when neglecting the problems of the fuzziness of the concept itself), it cannot be measured directly. There have been numerous attempts to measure it using proxies and surrogate indicators in a variety of ways using different methods [
119,
125,
126,
127,
128,
129]. One of the most popular ways to measure resilience is via an index that is composed of the indicators reflecting the essential functions of a relevant system [
130,
131,
132]. Since continuance of the essential functions and maintenance of the appropriate levels of performances are the core of the resilience concept, this way of measuring resilience allows changes in it to be observed directly. The indices based on key functions are much easier (and less time costly) to calculate, to interpret, to compare, and to replicate. They allow for problems associated with other ways of resilience measurements to be avoided (such as subjectivity in selecting the potential resilience-influencing factors from a large group of possible ones, determining their weights, updating these weights in time, etc.).
In order to assess resilience of the agricultural sector as an index of its functions, the main functions of the sector and their indicators have to be identified. Although the agricultural sector provides various private and public services, in this paper we focus mainly on the former ones, since provision of private goods best represents the economic dimension of agriculture. Besides that, in most cases important trade-offs exist between providing private and public goods and increasing resilience, defined as maintaining one function despite possibly decreasing resilience in providing another function [
133]. Therefore, in a case of perturbation, decision-makers usually have to make a choice about which functions to prioritize. According to Meuwissen et al. [
124], the provision of private goods encompasses production of food at affordable prices (further on referred to as Food Security), assurance of farm viability (further on referred to as Agricultural Viability), and provision of employment opportunities with decent income for agricultural workers (further on referred to as Decent Jobs).
There are various indicator frameworks designed to assess agricultural system performance regarding its essential functions. A framework suggested by Volkov et al. [
134] is used as a basis to select the indicators for the agricultural sector’s performances in this paper (
Table 2). In the sequel, these indicators will be considered to reflect the changes in the resilience of the agricultural sector.
4. Methods
In this paper, we relied on the Pugh matrix approach when assessing the impacts of different policy measures from the multi-criteria perspective. The general description of the Pugh matrix approach can be found in, e.g., Rondini et al. [
31]. This paper further extends the approach in the group decision-making environment with Monte Carlo simulation.
4.1. Impact of the Policy Measures
The indicators of agricultural resilience were organized in a two-level system. As regards the indicators, they were attributed with local and global weights: the local weights were directly determined by the experts, whereas the global weights were determined by multiplying the local weights by the weights of the agricultural functions.
The experts were asked to attach the level of importance to each agricultural function and the corresponding indicators independently. Let there be an index for experts of . Then, let the weights of the three agricultural functions be arranged into vector . Similarly, let the weights for indicators defining a certain agricultural function be defined as vector , where is the number of indicators in function . Thus, there were agricultural functions, with each of them being represented by indicators, i.e., indicators were used in total.
Note that the weights were based on the aggregation of the individual assessments:
where
is a certain aggregation function for the expert assessments of the criterion (function) weights. Indeed, the aggregation functions could include the average, ordered weighted average, median, etc. Normalization was ensured by scaling the factors used in the aggregation process so that
and
. Once the local weights of the criteria and functions were established, the global weights could be calculated as follows:
where
and
.
The measures of agricultural resilience support were indexed over
. The experts appraised the effects of the measures on (the indicators of) the agricultural resilience in terms of the ratings. For a certain expert
, the ratings were stored in matrix
. The ratings were aggregated as follows:
where
indicates the effect of the
m-th measure on the
n-th indicator relevant to the
g-th agricultural function.
The weights from Equation (3) were then used to aggregate the ratings from Equation (4). The linear function could be applied to obtain the composite score, indicating the impact of policy measure
on agricultural resilience [
106]:
Here, we assumed that all the criteria contributed to an increase in resilience. In case certain criteria act in an opposite direction, they need to be negated, i.e., their scale is reversed (we do not formally describe this for the sake of brevity). Note that the values of should be measured on the same scale across the indicators. Otherwise, a normalization technique should be adopted.
4.2. Monte Carlo Simulation for Sensitivity Analysis
The results, based on the expert assessment, could have been subjective. In order to check the possible effects on perturbations in the decision process, we assumed that the weights were randomly generated from a uniform distribution and applied the Monte Carlo approach. Thus, we generated the random numbers from the uniform distribution and normalized them with respect to their sum. This rendered a weight vector that satisfied the restriction that is usually applied in multi-criteria decision-making. This procedure was replicated a large number of times (say, 1000 times).
The multi-criteria analysis (cf. Equations (1)–(5)) was reiterated for each weight vector resulting from the uniform-normalized sampling. This imposed no assumptions on the structure of the weight vector. In case one is interested in a more nuanced scheme for the weighting, assumptions can be made for the lower and upper bounds of the weights (note that these bounds are mutually inclusive in general). As a result of the Monte Carlo analysis, one obtains the utility scores and a ranking order of the alternatives (i.e., policy measures) for each Monte Carlo iteration. This allows the sampling distribution of the utility scores and the expected ranking to be identified in case the weights are perturbed.
5. Results
Based on the literature review and preliminary screening, we identified the major components of the agricultural resilience. These include the three functions of agriculture corresponding to the groups of indicators and the indicators identifying each function.
Table 2 presents the resulting two-level indicator system. First, three agricultural functions are defined: Food Security represents the objectives related to access to affordable agricultural (and food) produce by the local population. This function is represented by the self-sufficiency and price level indicators. Agricultural Viability refers to the farm performance. The indicators related to this agricultural function include profitability, solvency, and access to credit. Decent Jobs defines the possibilities for the rural population to be employed in the agricultural sector. The two indicators relevant to this agricultural function are the agricultural labor force and the average wages paid in agriculture.
5.1. Importance of the Criteria for Agricultural Resilience
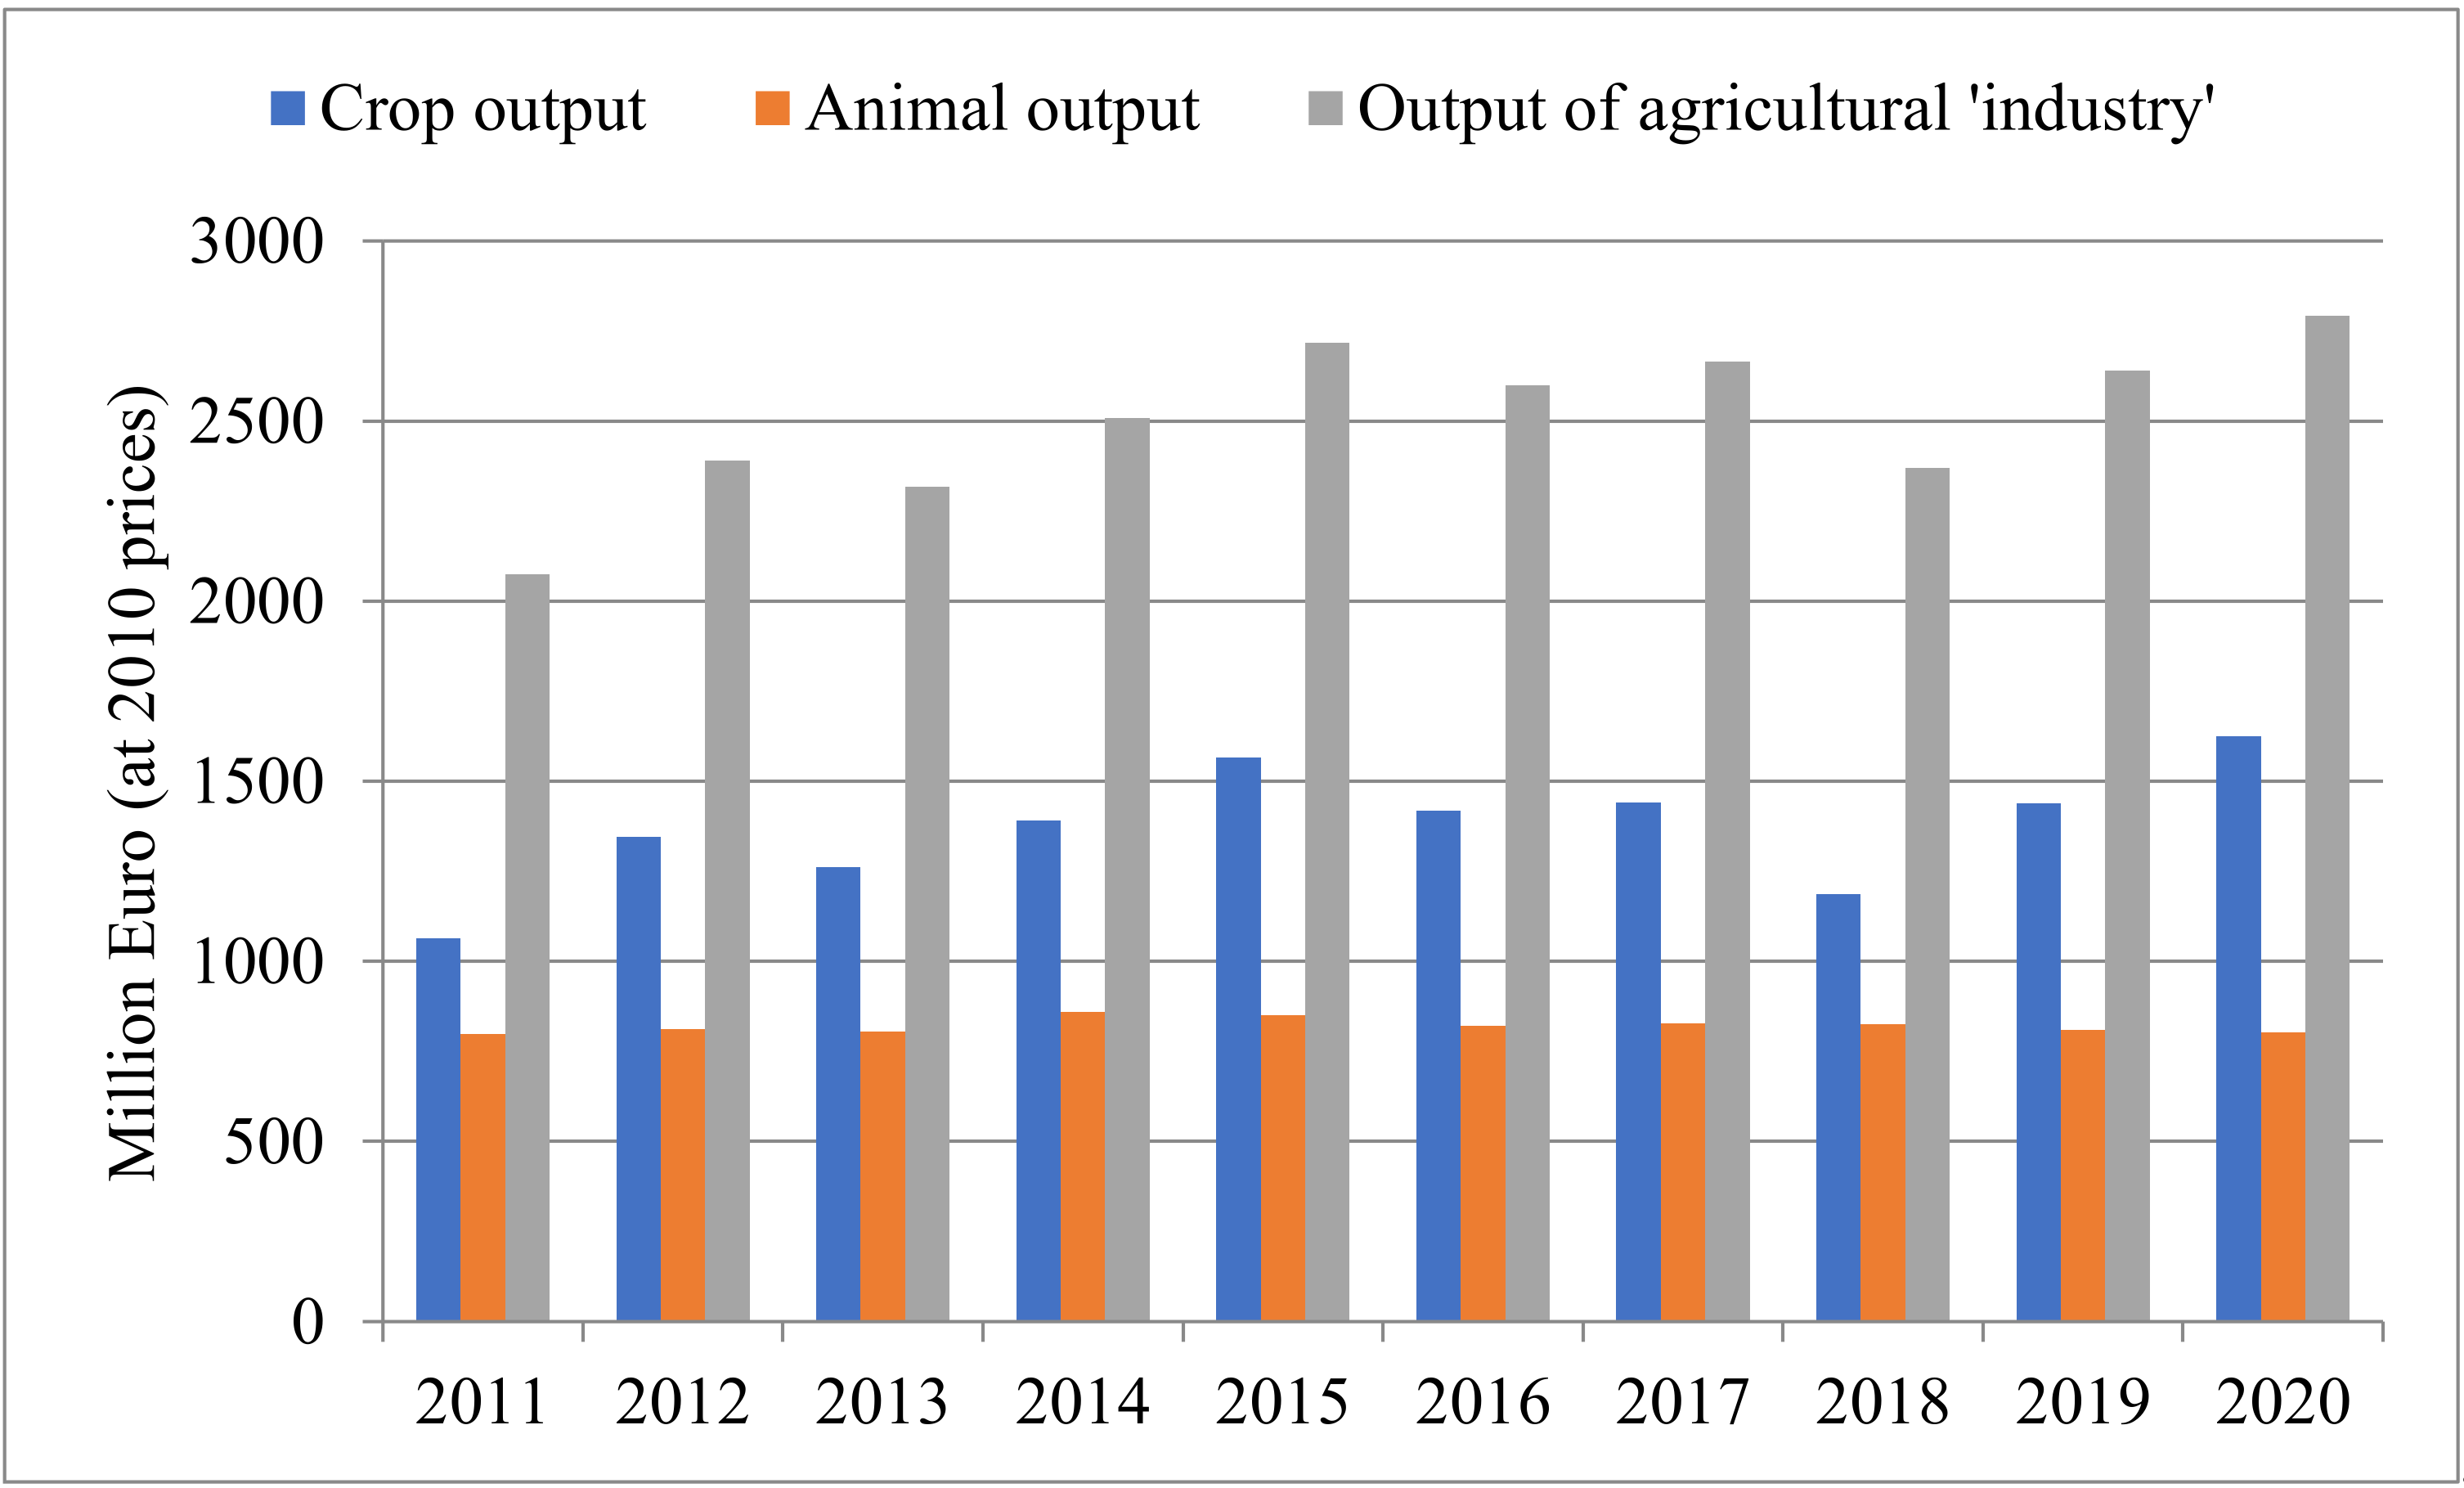
Lithuanian agriculture has experienced a shift towards crop production (as opposed to animal production).
Figure 1 presents the trends in the crop and animal output of Lithuanian agriculture (EUROSTAT defines animal output as livestock and meat products, milk and milk products, eggs for hatching, and farmyard poultry chicks). The recent crisis related to COVID-19 seems to have had no significant effect on the overall output level of the agricultural sector. Still, certain sub-sectors faced severe disruptions from the supply changes (e.g., vegetable production was no longer demanded by the institutional clients due to the lockdown). Therefore, it is important to ascertain what the effects and remedies are thereof relevant to particular sub-sectors.
The experts involved in the analysis of the resilience of the Lithuanian agricultural sector amidst the COVID-19 pandemic and the associated policy measures comprised 15 professionals with more than 10 years of experience in agribusiness, academia, or government (see
Table A1,
Appendix B for more details). The experts provided the ratings on the importance of agricultural functions and the corresponding indicators and the effects of the policy measures on the agricultural functions. The average scores provided for each indicator are provided in
Table 3. As the decision support system for agricultural resilience amid the pandemic requires rapid interaction, the qualitative assessments based on the expert opinions were used for the reasoning. As regards the weights of the criteria, the five-point Likert scale was applied.
The averaging function was used to aggregate the expert assessments. This implied equal importance of the experts. Indeed, such an approach is relevant in that the maximum observed relative standard deviation was 0.41.
Among the three agricultural functions, Food Security appeared as the one with the highest importance (average score of 4.9), whereas Agricultural Viability came next, with an average score of 4.3. The least important agricultural function was Decent Jobs (3.7). This pattern is convincing in that the agricultural employment and rural population are declining in Lithuania and in other countries. Furthermore, the efficient allocation of factor inputs is more important than the quantity itself from the viewpoint of economic theory. The Decent Jobs agricultural function also showed the highest variation in the rating as measured by the relative standard deviation. Therefore, the resulting weight for Food Security (0.38) exceeded that for Decent Jobs (0.29) by 31%.
Within the Food Security agricultural function, the two indicators appeared to bee equally important (the average scores of 4.5 and 4.2 were observed for self-sufficiency and retail prices, respectively). The relative standard deviations were also similar (0.18 and 0.19). Therefore, taking into account the weight of the Food Security agricultural function (0.38), the global weights of the self-sufficiency and retail prices obtained were 0.2 and 0.18, respectively.
Turning to the Agricultural Viability agricultural function, the average scores rendered by the experts ranged in between the values of 3.4 and 4.3. The relative standard deviation also varied from 0.14 up to 0.41. Therefore, the criteria belonging to this agricultural function showed different importance, as suggested by the experts. Taking into account the weight of the Agricultural Viability agricultural function (0.33), the global weights for farm profitability, farm solvency, and access to credit were 0.1, 0.12 and 0.11, respectively.
The Decent Jobs agricultural function comprised the two indicators that were attributed with different importance, yet rather similar standard deviations. This indicates that the experts were concordant in terms of assigning the weights to these criteria. The creation of the demand for agricultural labor force was an attributed with the average score of 3.6, whereas the maintenance of average agricultural wage was associated with an average score of 4.1 (the relative standard deviations were 0.31 and 0.29, respectively). Therefore, the global weights of 0.13 and 0.15 were obtained for the aforementioned indicators.
5.2. Performance of the Public Policy Measures
The experts were asked to provide an assessment of the effects of the policy measures that were identified during the literature review on the (indicators of) agricultural resilience. The decision matrix was restricted in the sense that not all the measures were assumed to affect all the indicators. This allowed the computational burden to be reduced and meaningless responses to be avoided. The five-point Likert scale was used to measure the strength of the linkages among the policy options and the indicators of agricultural resilience. The resulting average scores are provided in
Table 4 (again, equal importance of the experts was assumed).
Obviously, most of the measures (15 out of 23) addressed the agricultural viability indicators (farm profitability, solvency, and access to credit). Therefore, the agribusiness activities were likely to be stimulated to the highest extent by the policy measures identified during the analysis. Criteria related to food security and decent jobs were potentially affected by 7 out of 23 measures (possibly overlapping).
The performance of the policy measures were then calculated by integrating the weights of the indicators of agricultural resilience and the effects of the policy measures as defined by Equation (5). As the price indicator was inversely related to the agricultural resilience, subtraction was used instead of addition for this indicator. The resulting utility scores are presented in
Table 5.
Simplified investment support under the CAP appeared as the best-performing policy measure able to improve agricultural sustainability. Indeed, it affected all the indicators of resilience, thus offering the most comprehensive and strongest response to the crisis. The coupled payments appeared as the second most important option in terms of the impact to agricultural resilience. According to the expert assessment, these payments do not affect the creation of decent jobs in Lithuania (i.e., the third group of indicators comprising labor force and wages is neglected).
Besides the expected effects of the agricultural policy measures, the associated costs needed to be assessed. We exploited the expert knowledge and readily available data to approximate the financial resources needed to implement each of the policy measures (
Table 6). Note that some of the measures do not require the use of financial resources but solely rely on administrative and institutional arrangements. By comparing the costs to utility, one can assess the relative cost effectiveness of the policy measures. Obviously, the minimum cost–utility ratio is preferred.
The utility-based and cost–utility-based ratings differed substantially. For instance, the most effective measures (EU simplified investment support and coupled payments) appeared to be the least cost effective. However, these measures are a part of the CAP and are not likely to be abolished or significantly reshaped in the short run. The most cost-effective measures included those with zero financial burden (e.g., food supply corridors). However, such policy measures may not be enough in case of serious shocks in the agricultural sector.
Some cost-effective policy measures may face limitations in terms of their implementation. For instance, priority for young farmers when acquiring/renting land may be most effective in the buying out of state-owned land. Such types of land resources are diminishing in Lithuania and are not likely to be easily implemented in practice. As regards private transactions, policy restrictions need to take market conditions into account to be effective in practice.
The experts were also asked to assess the effectiveness of the already existing policy measures (note that there are seven newly proposed policy measures included in the analysis). Thus,
Table 7 lists the existing policy measures (including the existing form of EU investment support) along with their rankings based on the multi-criteria analysis (with and without implementation costs taken into account) and naïve ratings of the effectiveness directly provided as scores on the five-point Likert scale. By comparing these rankings, we were able to assess the consistency of the expert ratings. Specifically, an overall assessment of effectiveness is likely to resemble the composite score based on the multi-criteria analysis in case the consistency of assessment is ensured.
The rankings based on the indicators (multi-criteria analysis) and direct ratings were positively correlated (R = 0.69). Obviously, the experts tended not to take into account the cost considerations when making the direct assessment and the correlation of the ranking based on the cost–utility ratio being low or negative with respect to the other types of rankings. However, the cost information is only indicative in our study, as exact levels of financial requirements are not easily available for some policy measures.
5.3. Monte Carlo Simulation
In order to check the robustness of the results, we further implemented the Monte Carlo approach as discussed in
Section 4.2. The Monte Carlo simulation is used to check the effects of perturbations in the criterion weights. For this study, 1000 replications were used. The perturbations in weights throughout the sampling from the uniform distribution and re-calculation of the utility scores by Equation (5) generated a set of the Monte Carlo estimates. Thus, the sampling distribution could be established for the utility scores
,
.
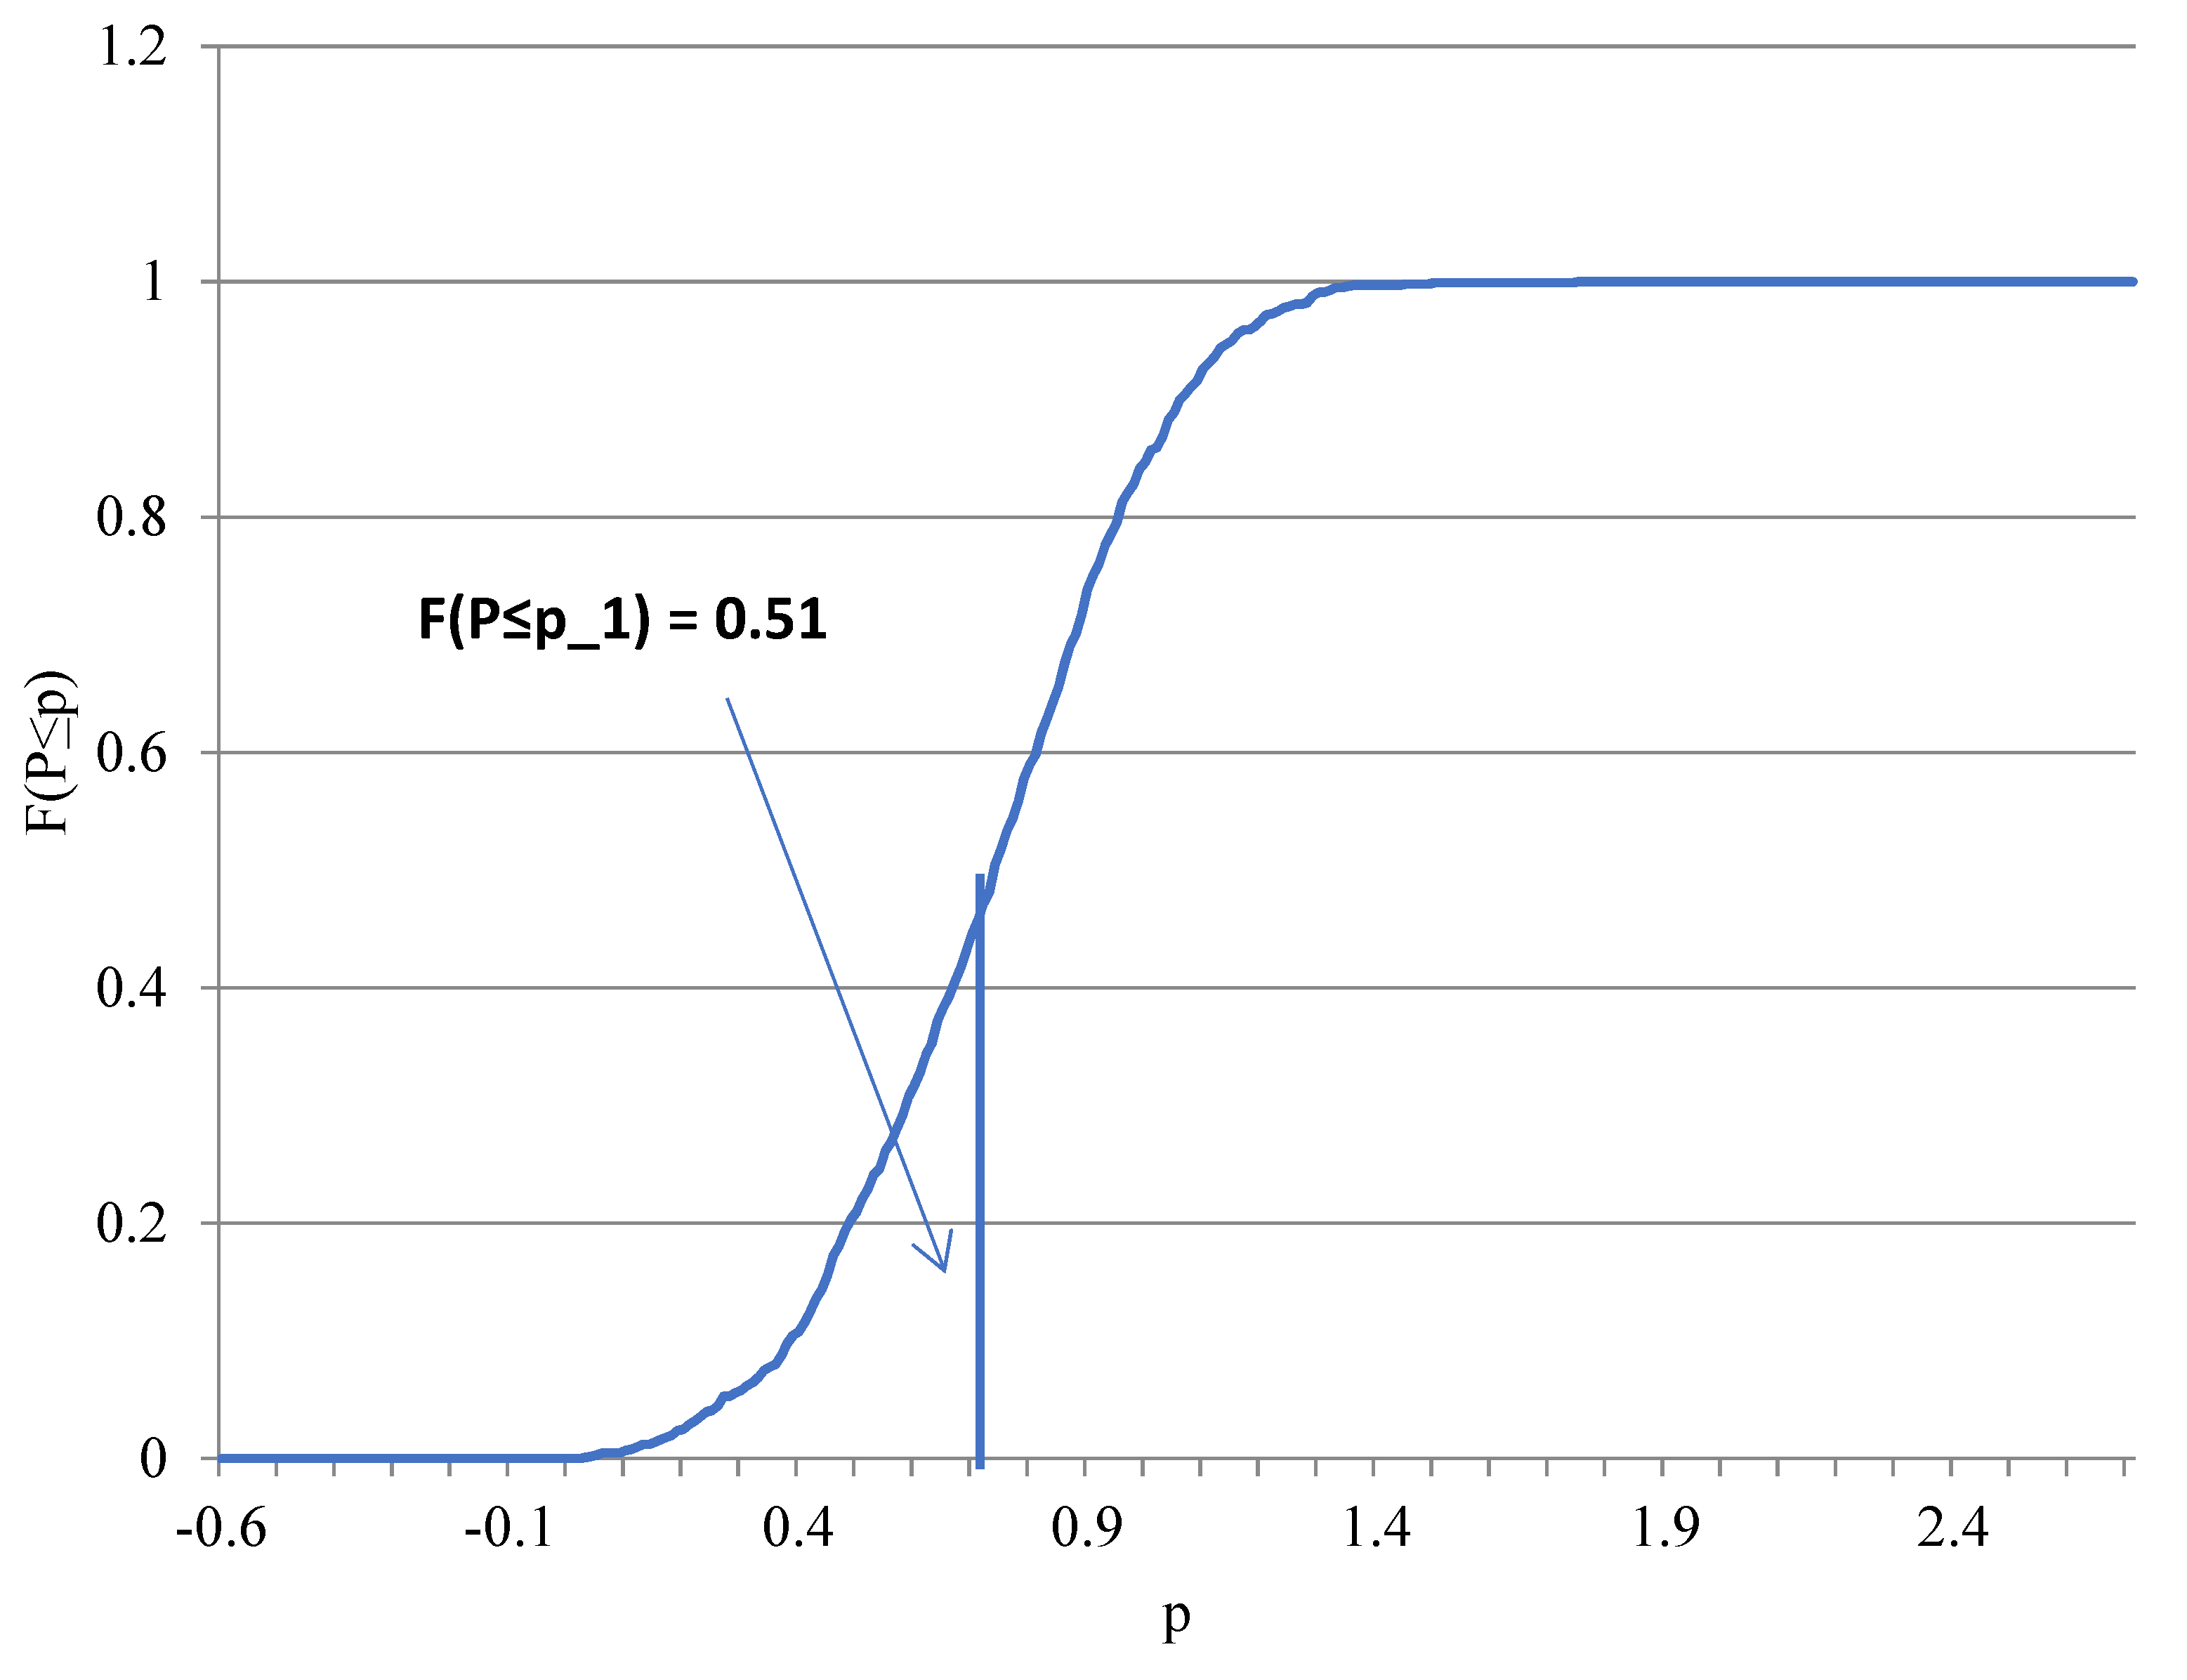
Taking
for the measure “Partial compensation of remuneration” as an example, one can note that the sampling distribution was close to the normal one (
Figure 2). The curve represents the empirical cumulative distribution function (ECDF). The vertical line indicates the estimate of
based on the expert survey (
Table 4). The value of the CDF at the latter point indicates the proportion of the Monte Carlo values lower or equal to the expert-based estimate. In our case, the ECDF equaled 0.51 (which is close to 0.5) at the expert-based estimate. This suggests that the utility score based on the expert ratings was close to the median value—at which
—of the utility scores rendered by the Monte Carlo simulation where the weights of criteria of agricultural resilience were completely unknown. Therefore, the expert ratings seemed to have little deviation from the random weighting.
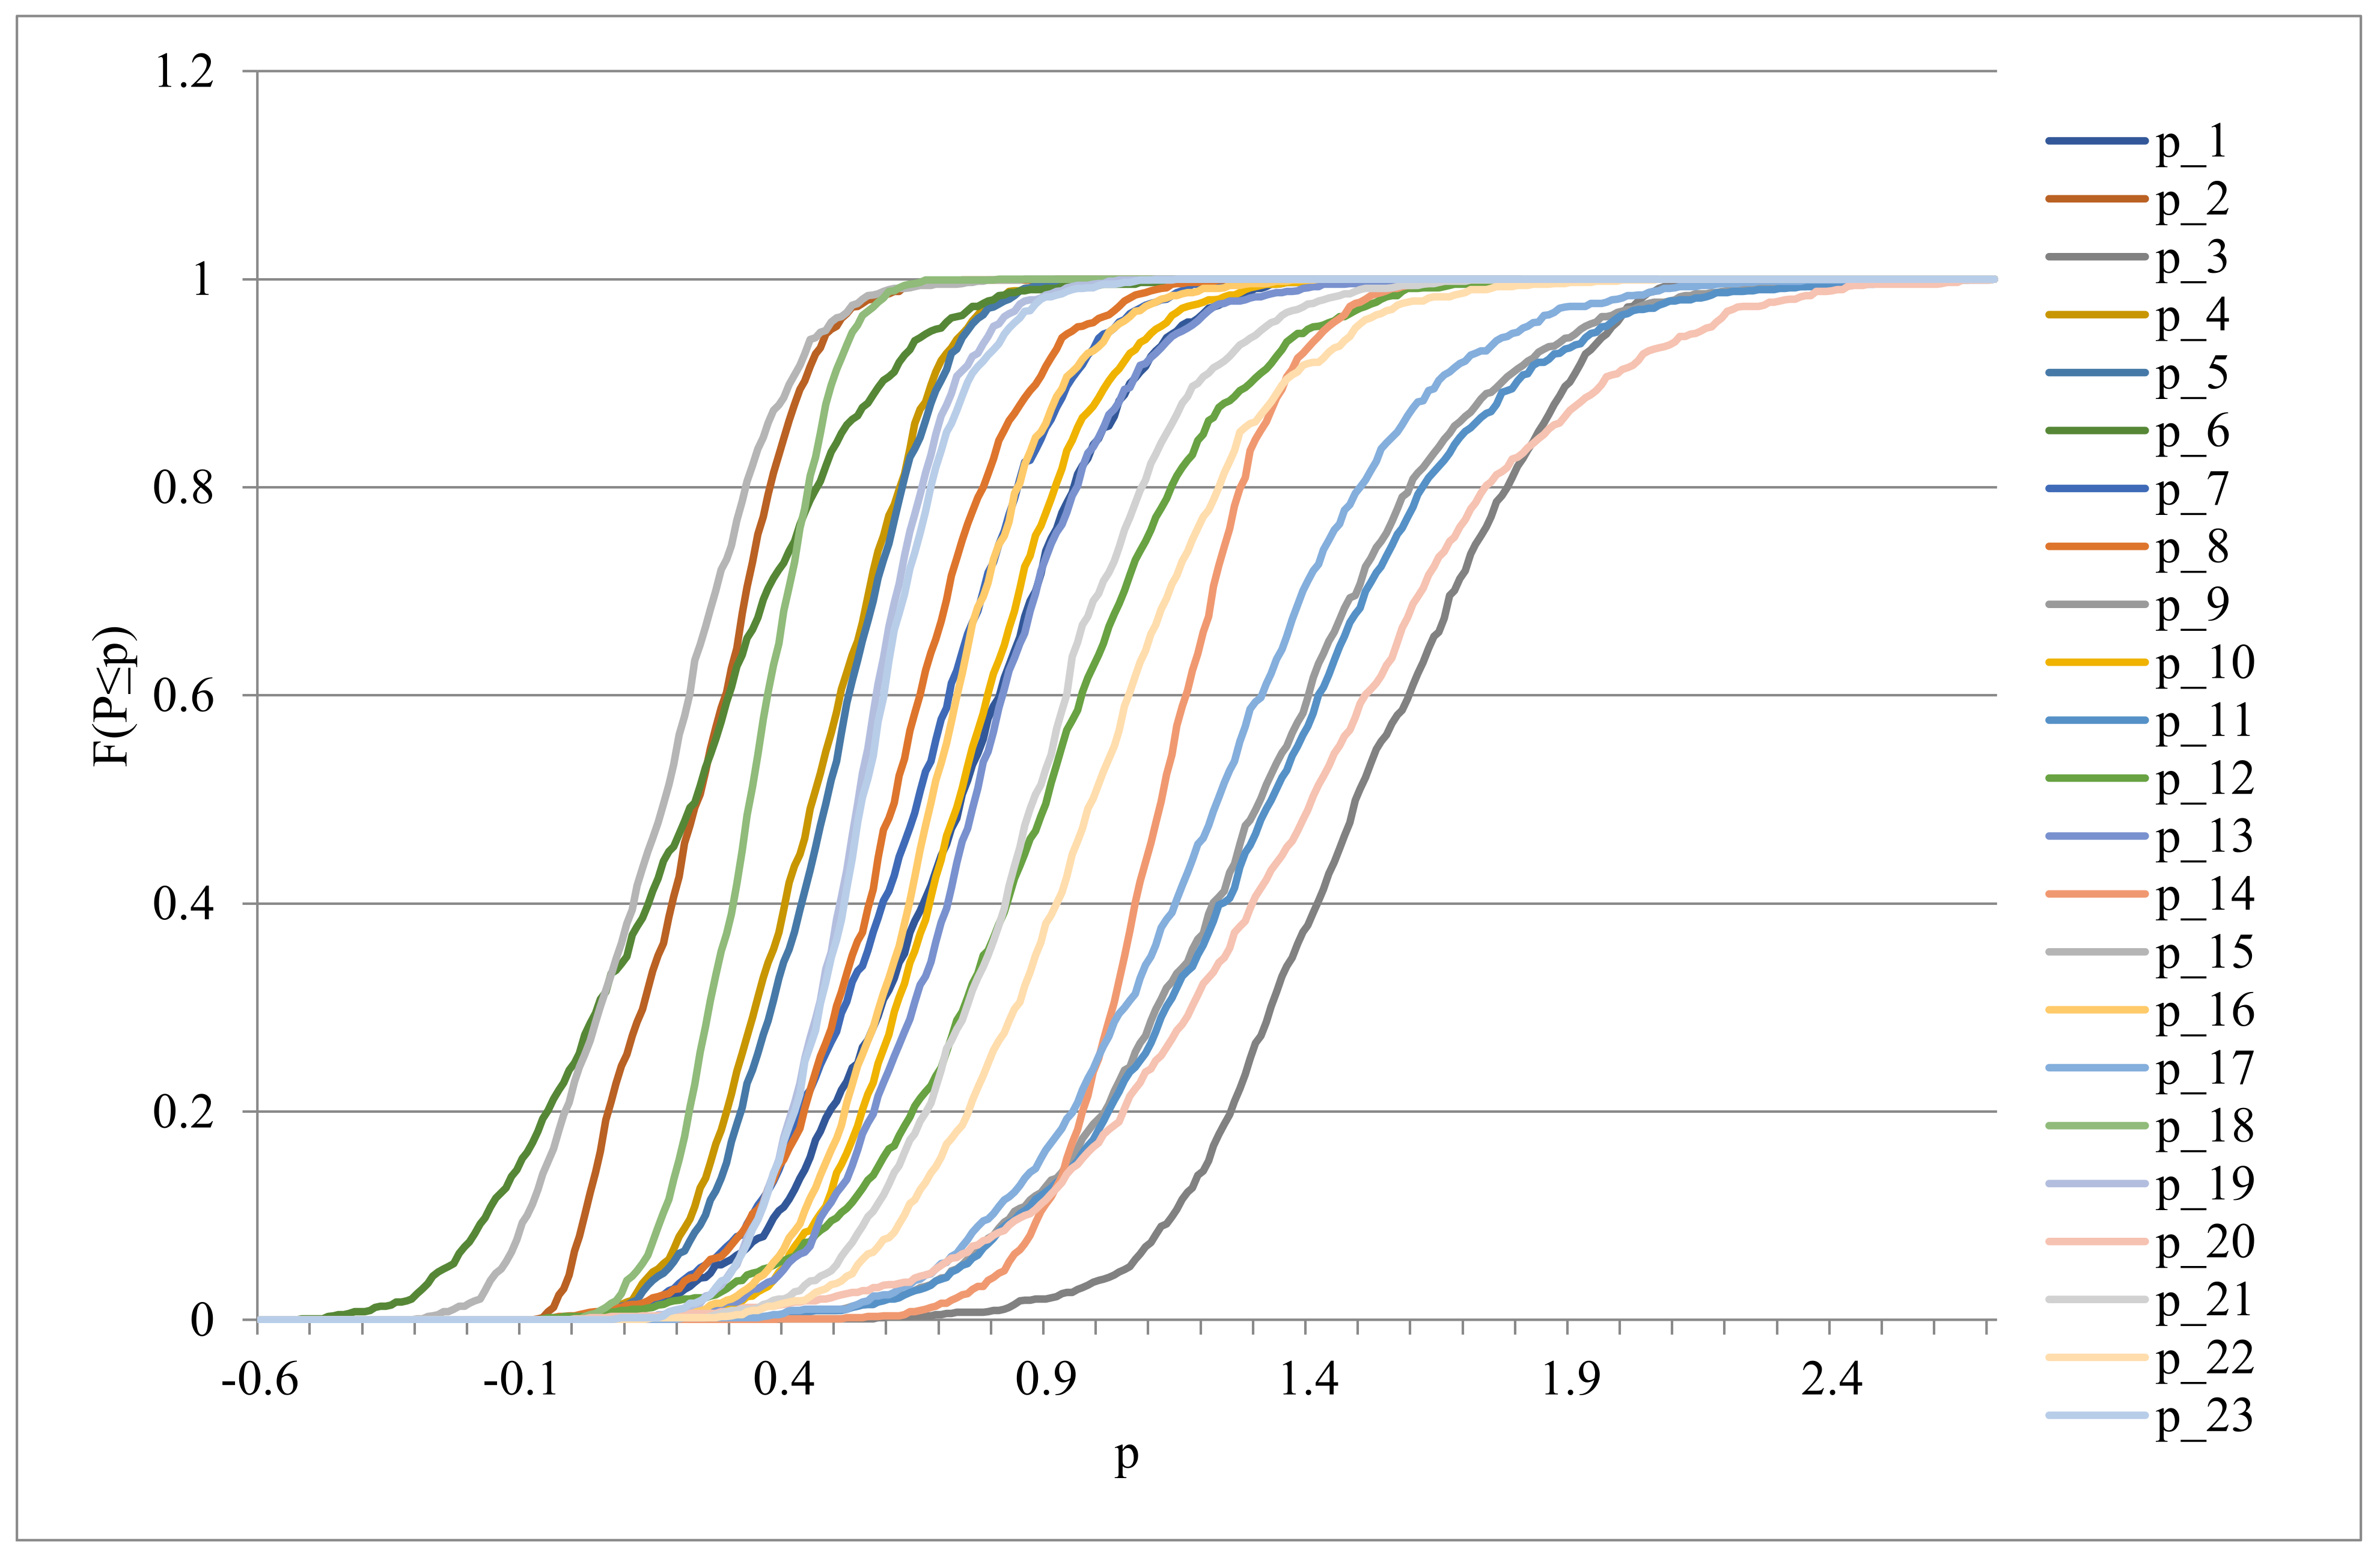
We performed this kind of analysis for all 23 of the policy measures considered in the multi-criteria assessment.
Table 8 presents the results of the Monte Carlo simulation in terms of the utility scores and the cost–utility ratio. Note that the expert-based weights were used to construct utility scores
, whereas the utility scores related to the Monte Carlo simulation are represented by the first and third quartiles of the resulting series that are denoted by
and
, respectively. The probabilities of observing values equal to or lower than the expert-based estimates are denoted as
. The cost–utility ratios were taken from
Table 7 and supplemented by the first and third quartiles of the estimates of the ratios based on the Monte Carlo simulation.
The values of the ECDF evaluated at the expert-based utility scores
were higher than 0.18 and lower than 0.7. Therefore, the acceptable level of statistical significance was not achieved in any instance.
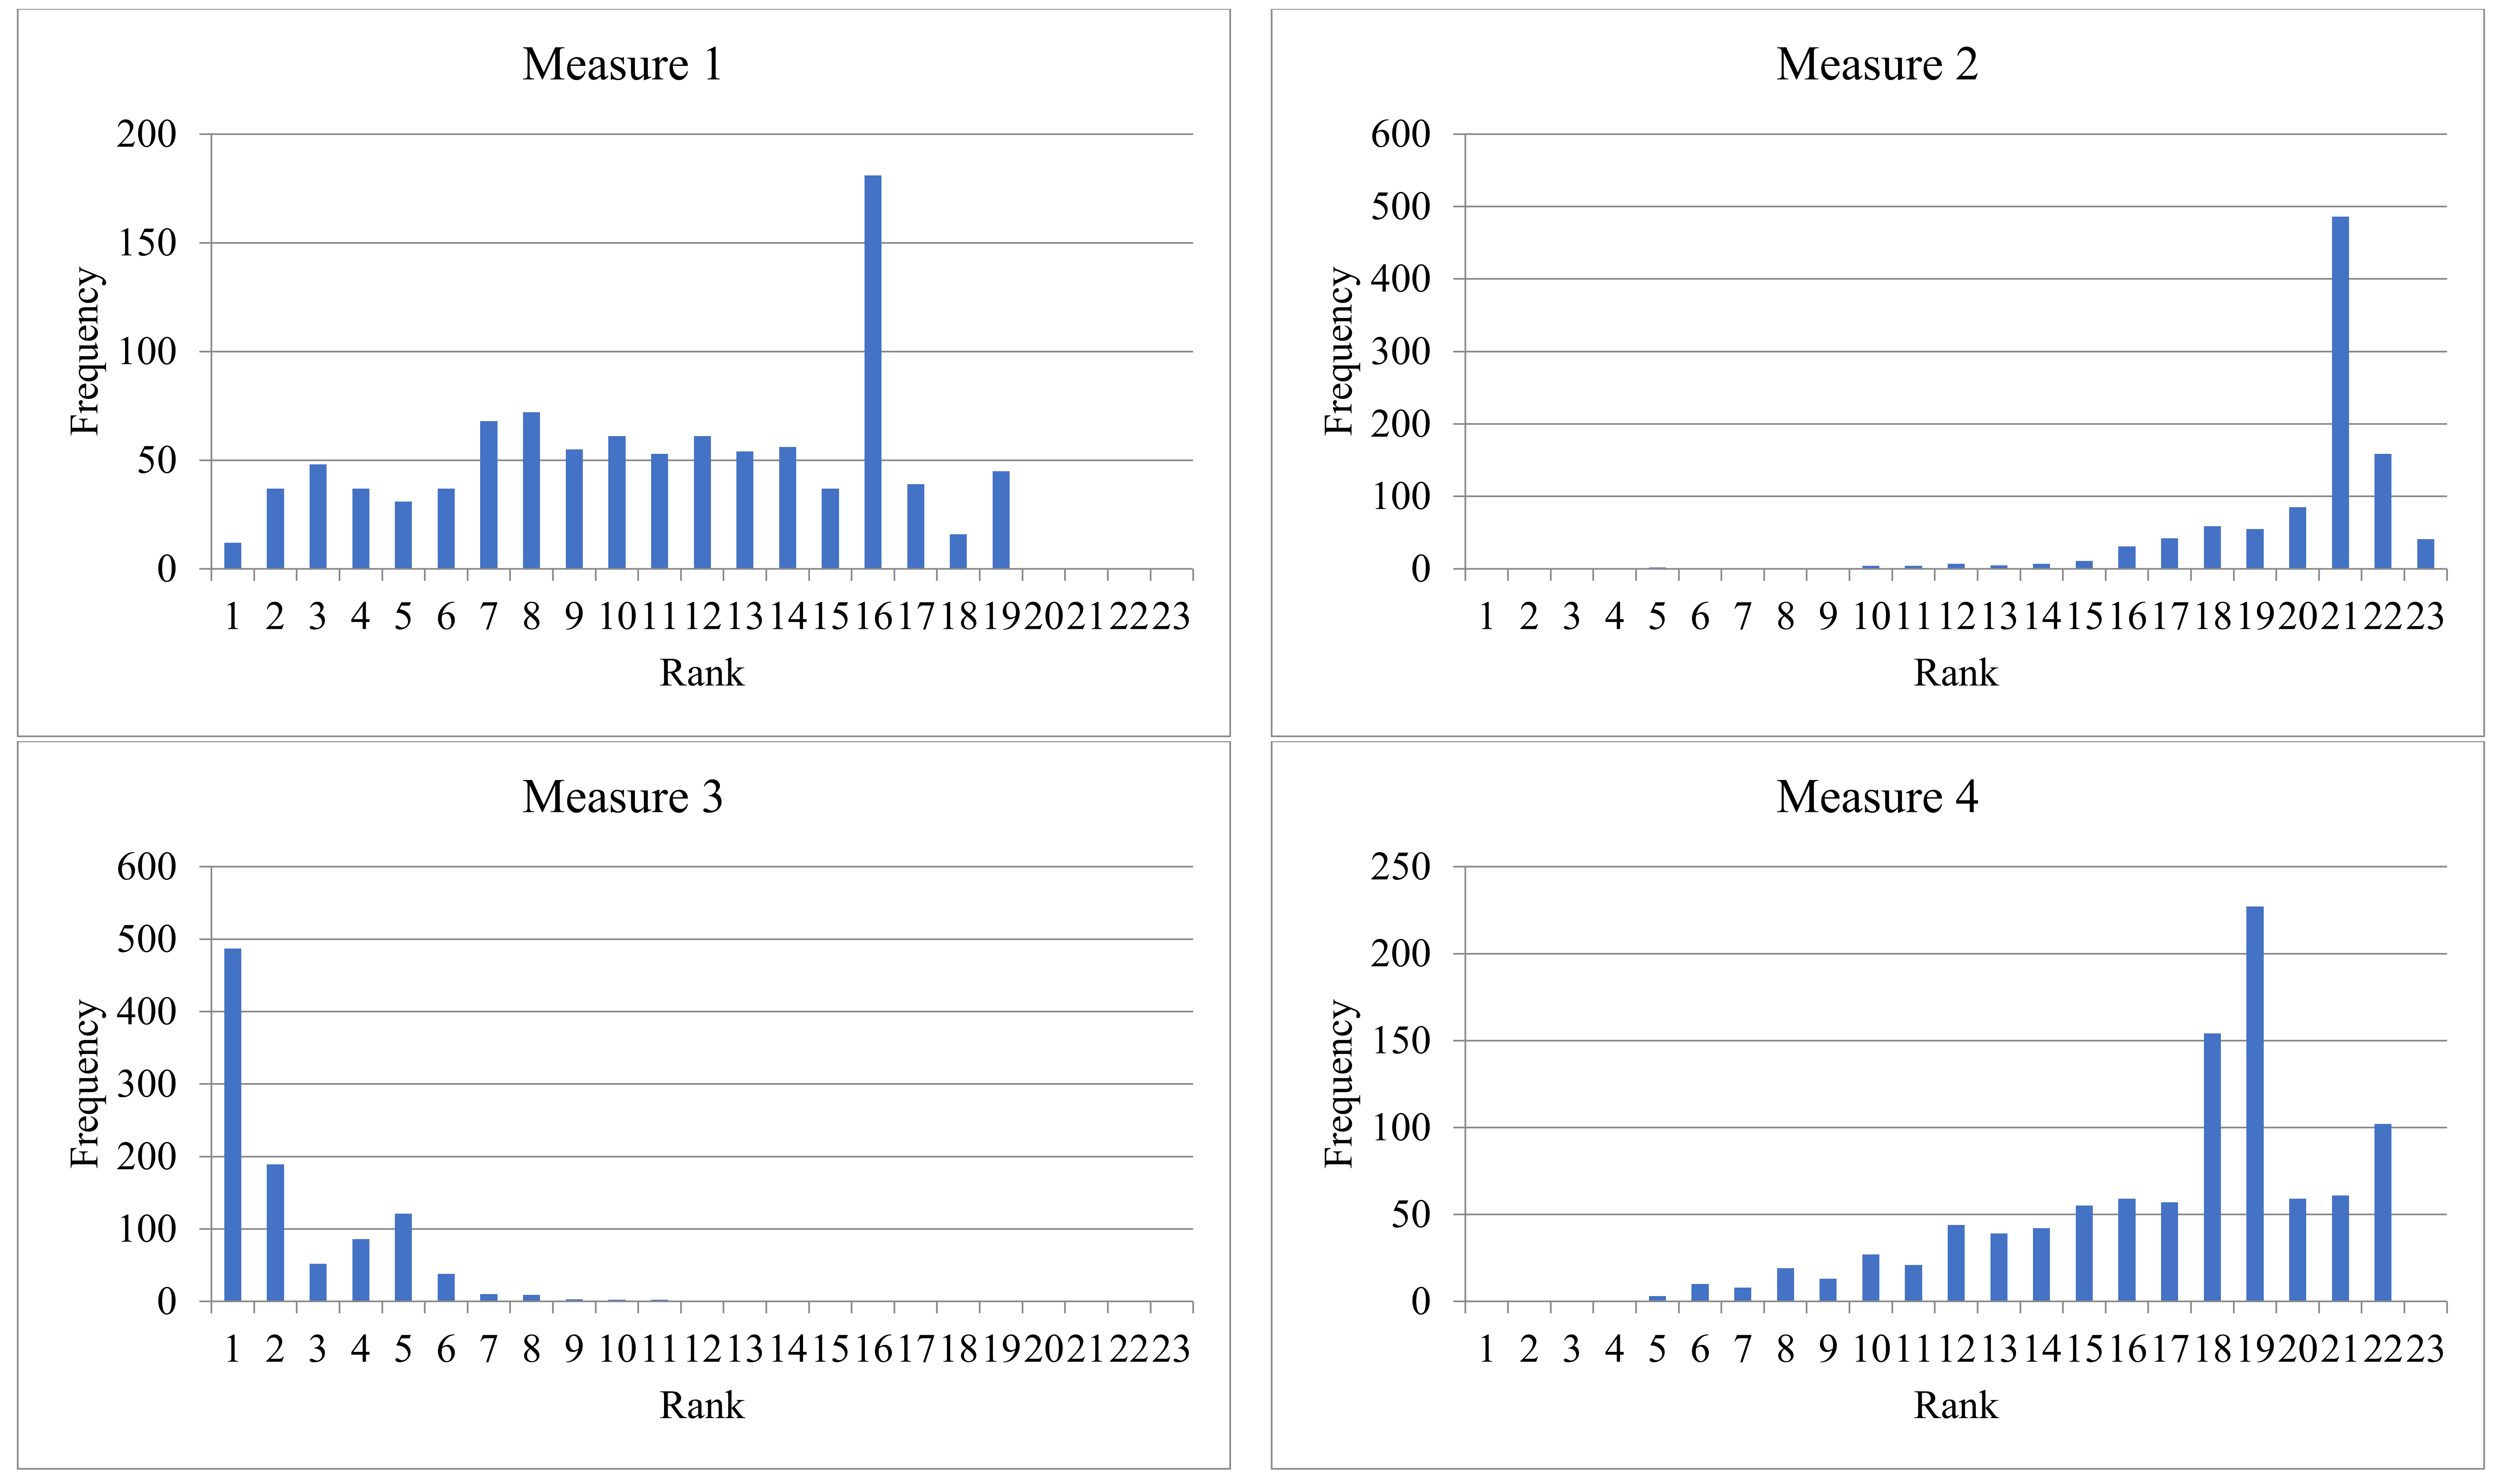
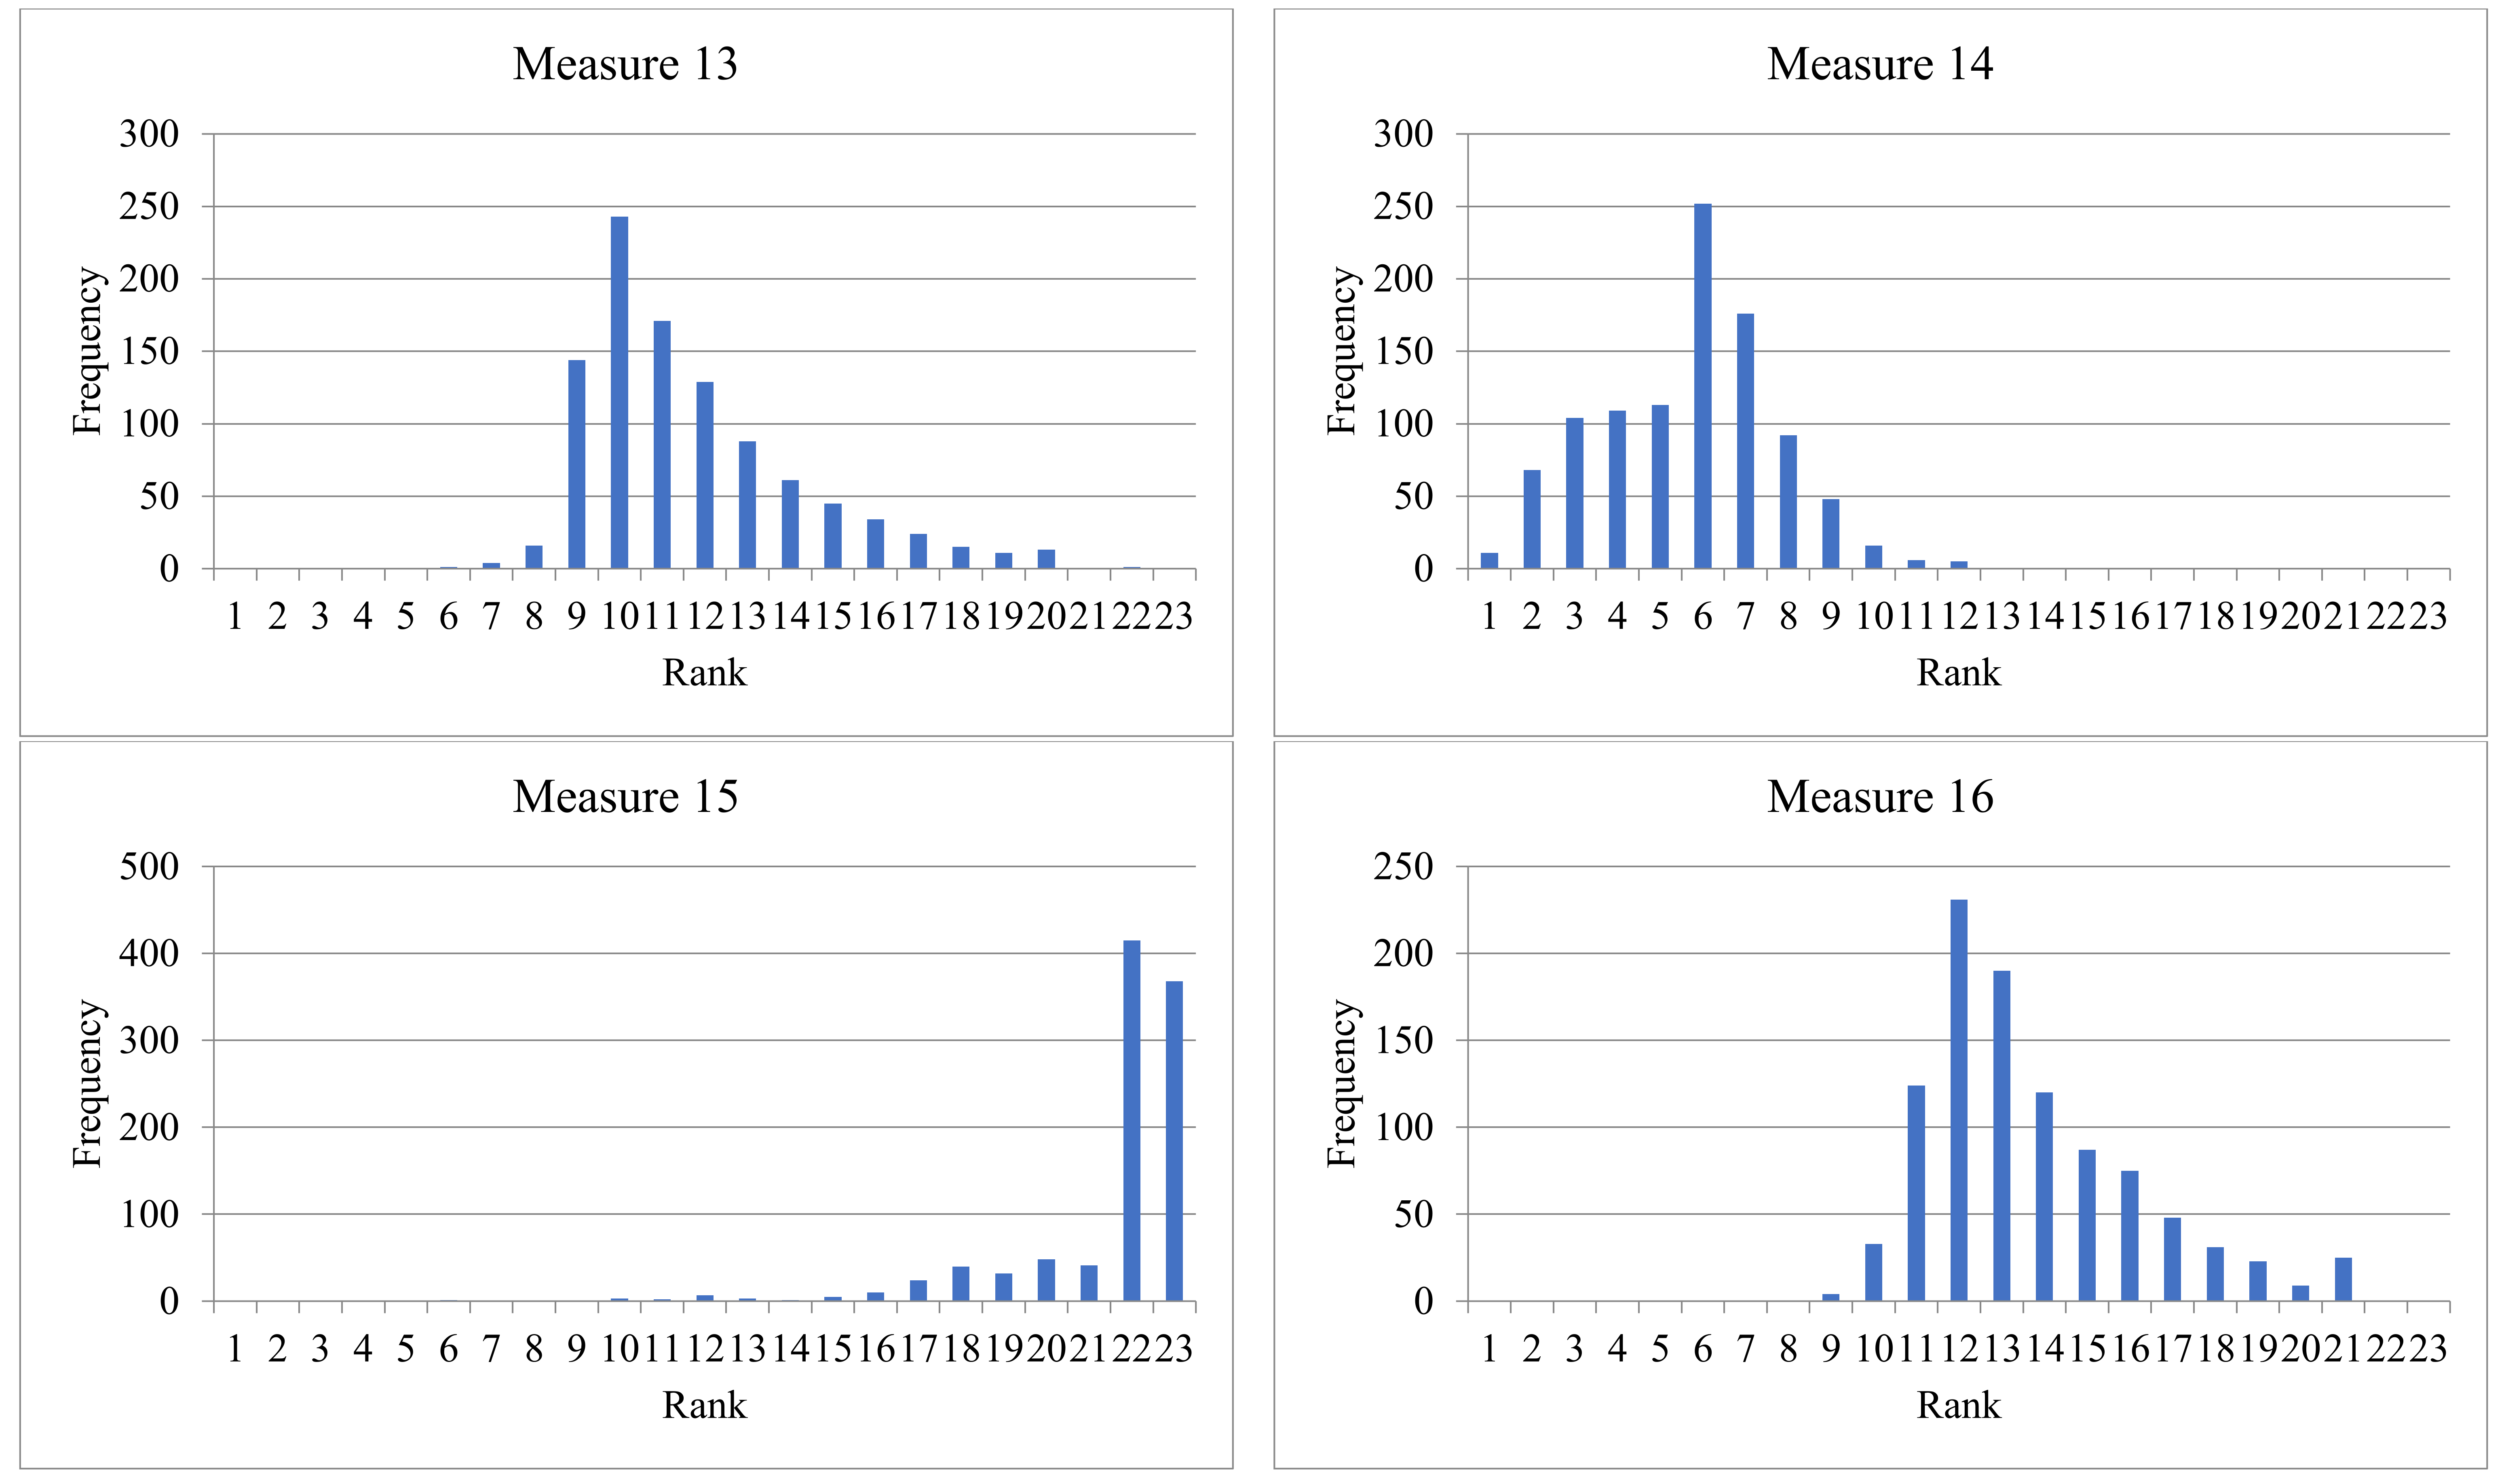
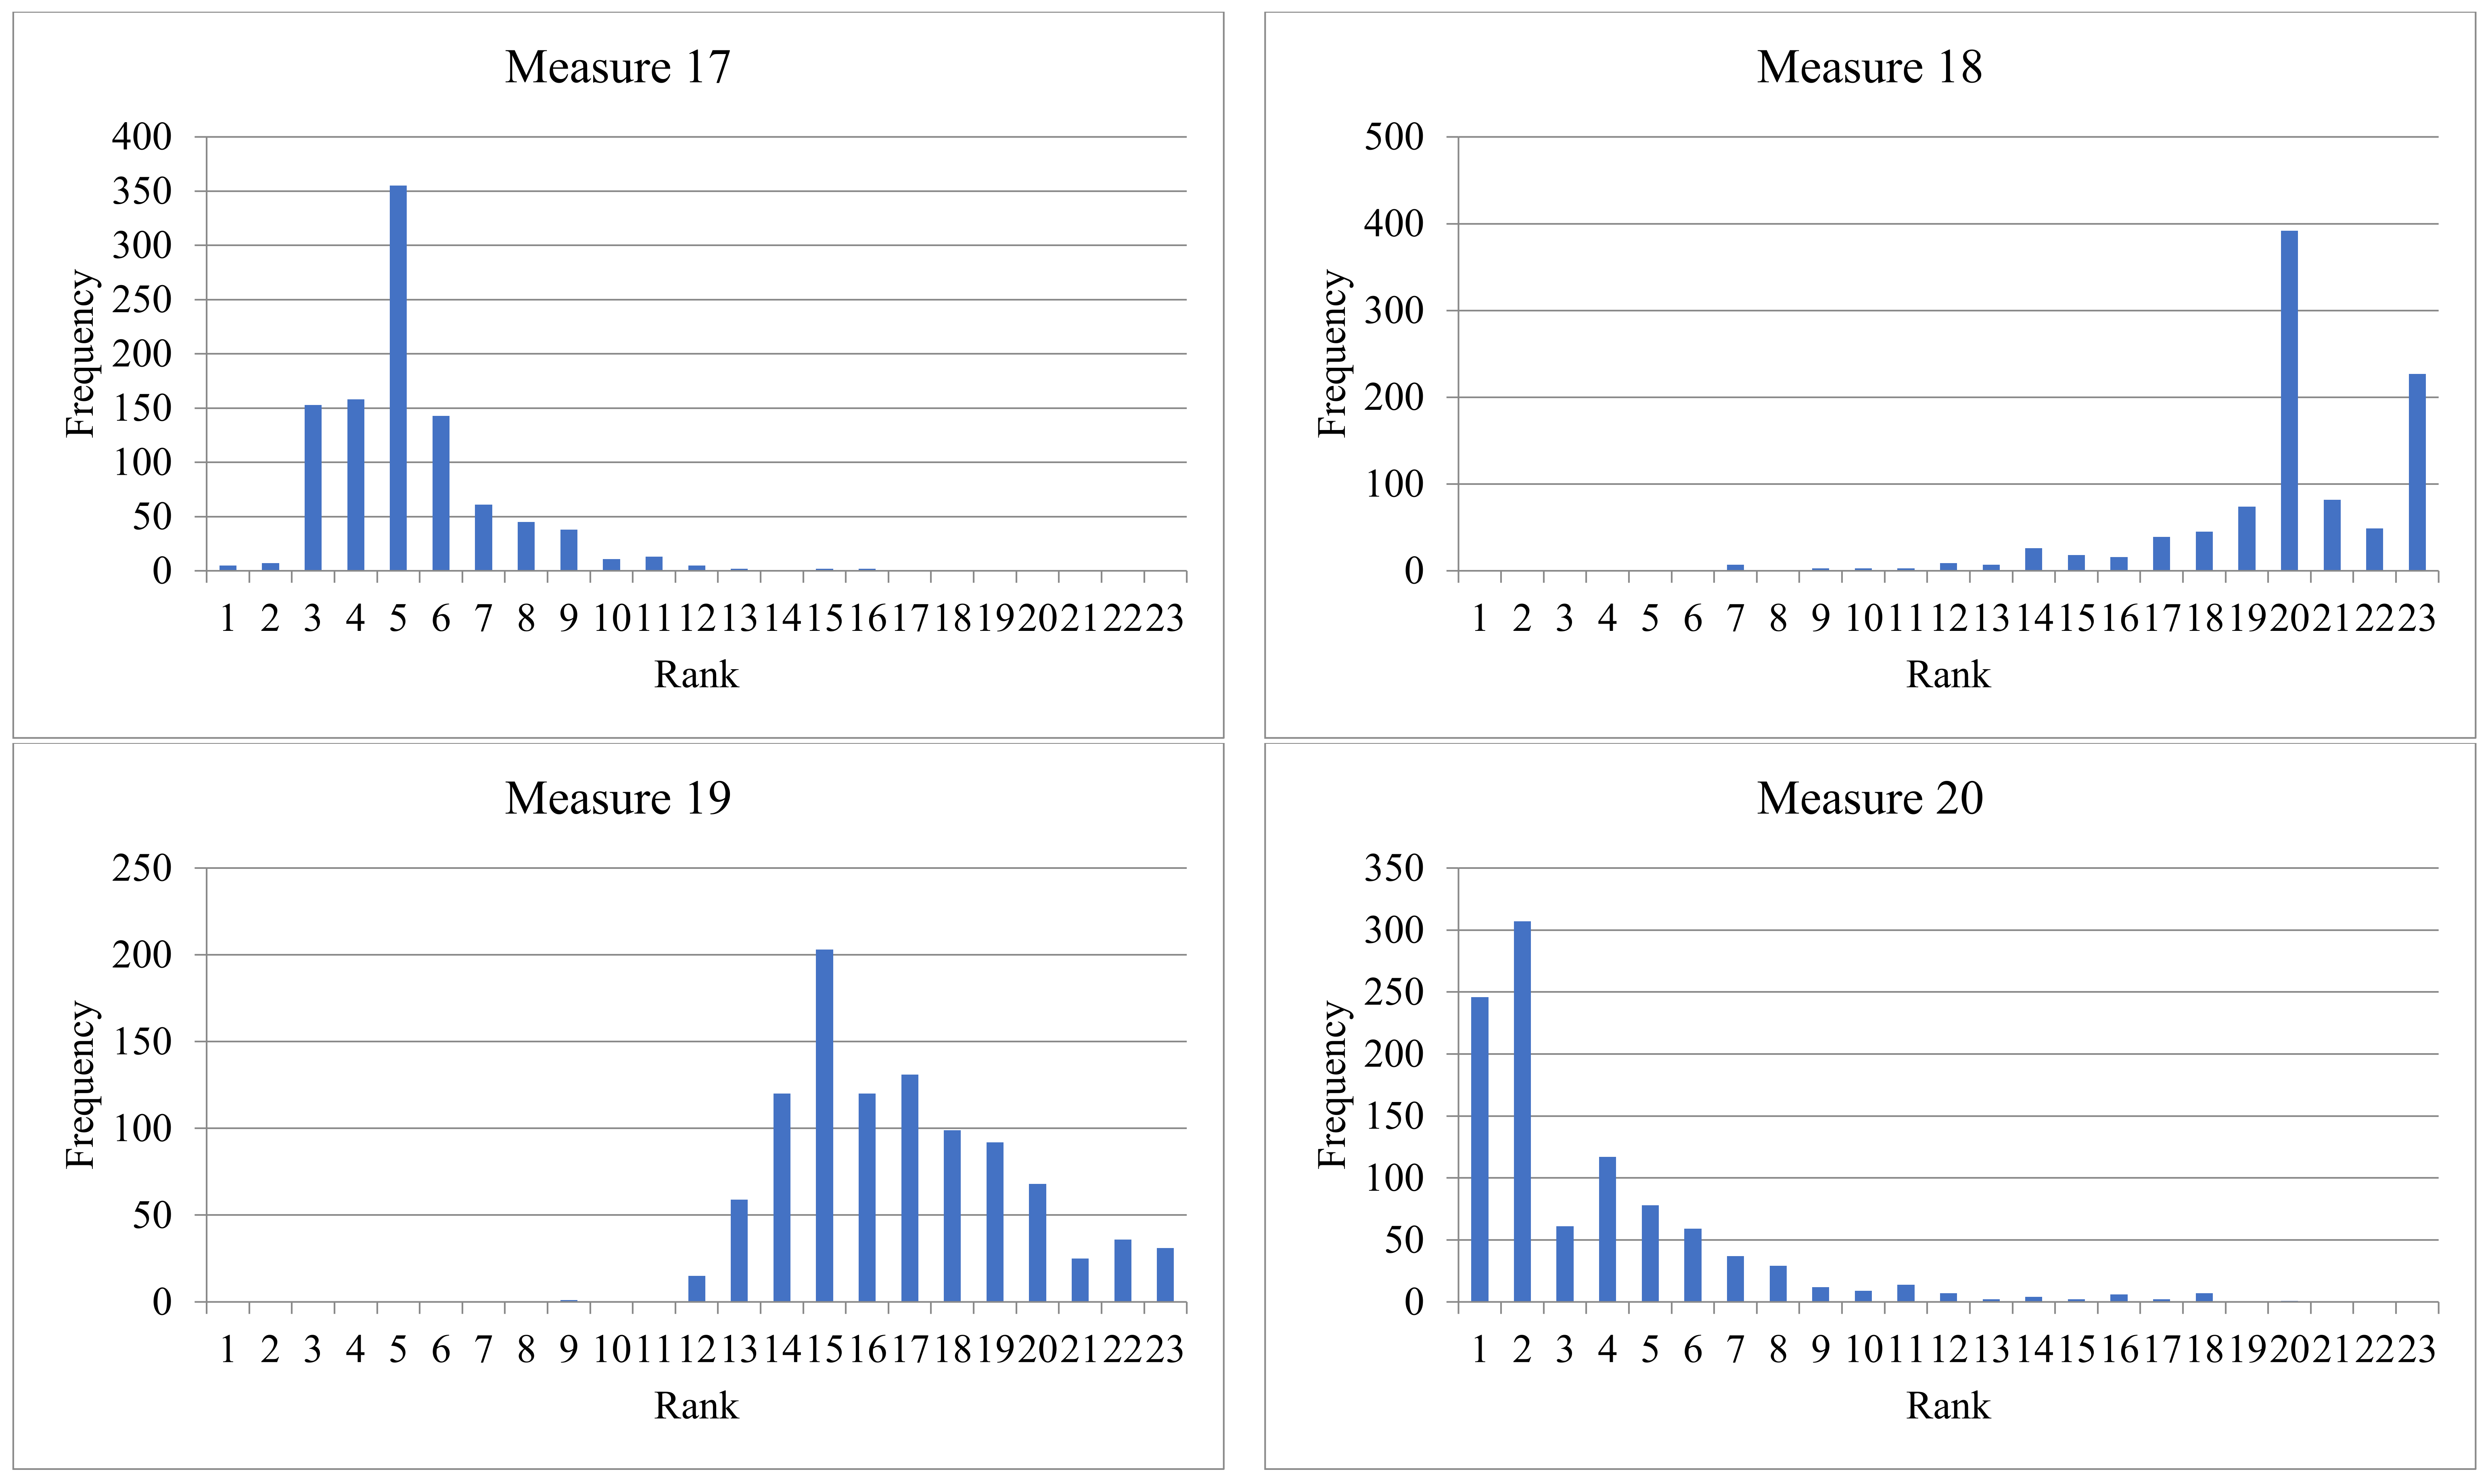
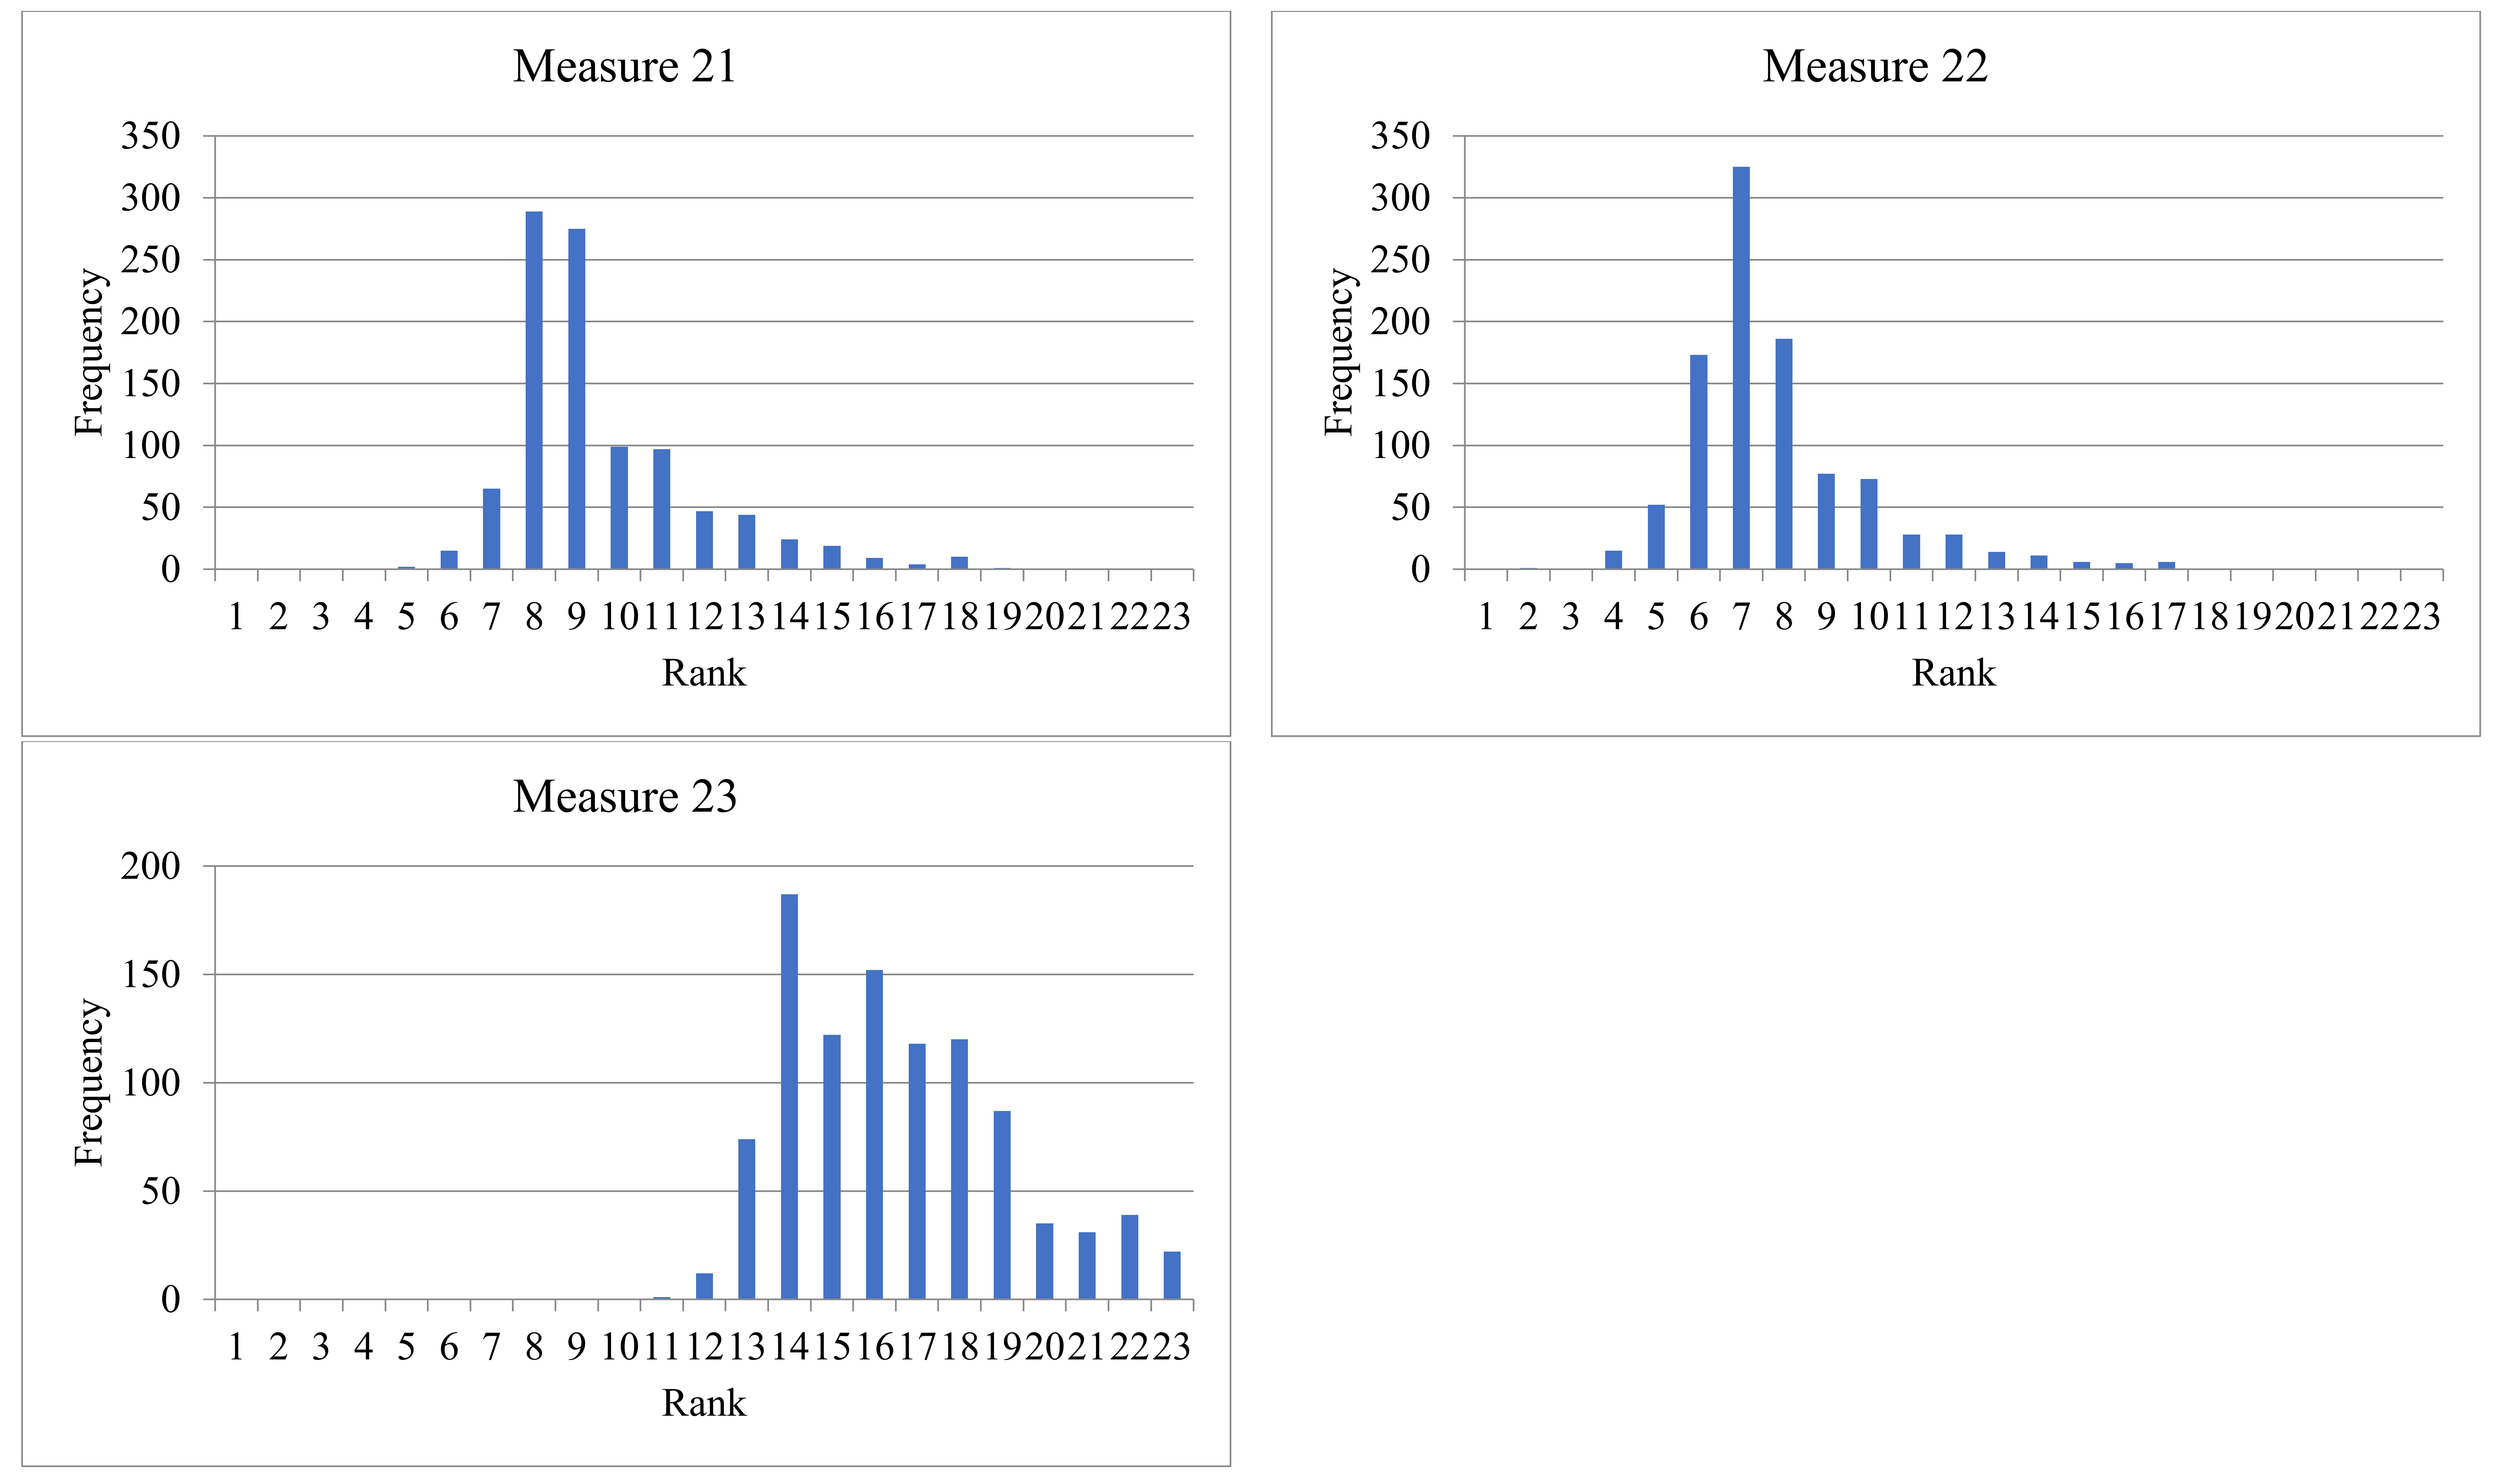
Figure 3 further plots the ECDFs for all the policy measures. As one can note, the slopes of the curves varied, implying different degrees of variation of the underlying utility scores due to changes in weights.
The most serious changes in the utility score (and, hence, cost–utility ratio) were observed for Measure 6—EU support for short supply chains and local markets. As indicated in
Figure 4, the ECDF for the utility score of this measure began at the lowest value among the measures covered and intersected those for Measures 2, 15, and 18. Thus, even though the minimum utility value was obtained for Measure 6, it was not stochastically dominated by all the measures.
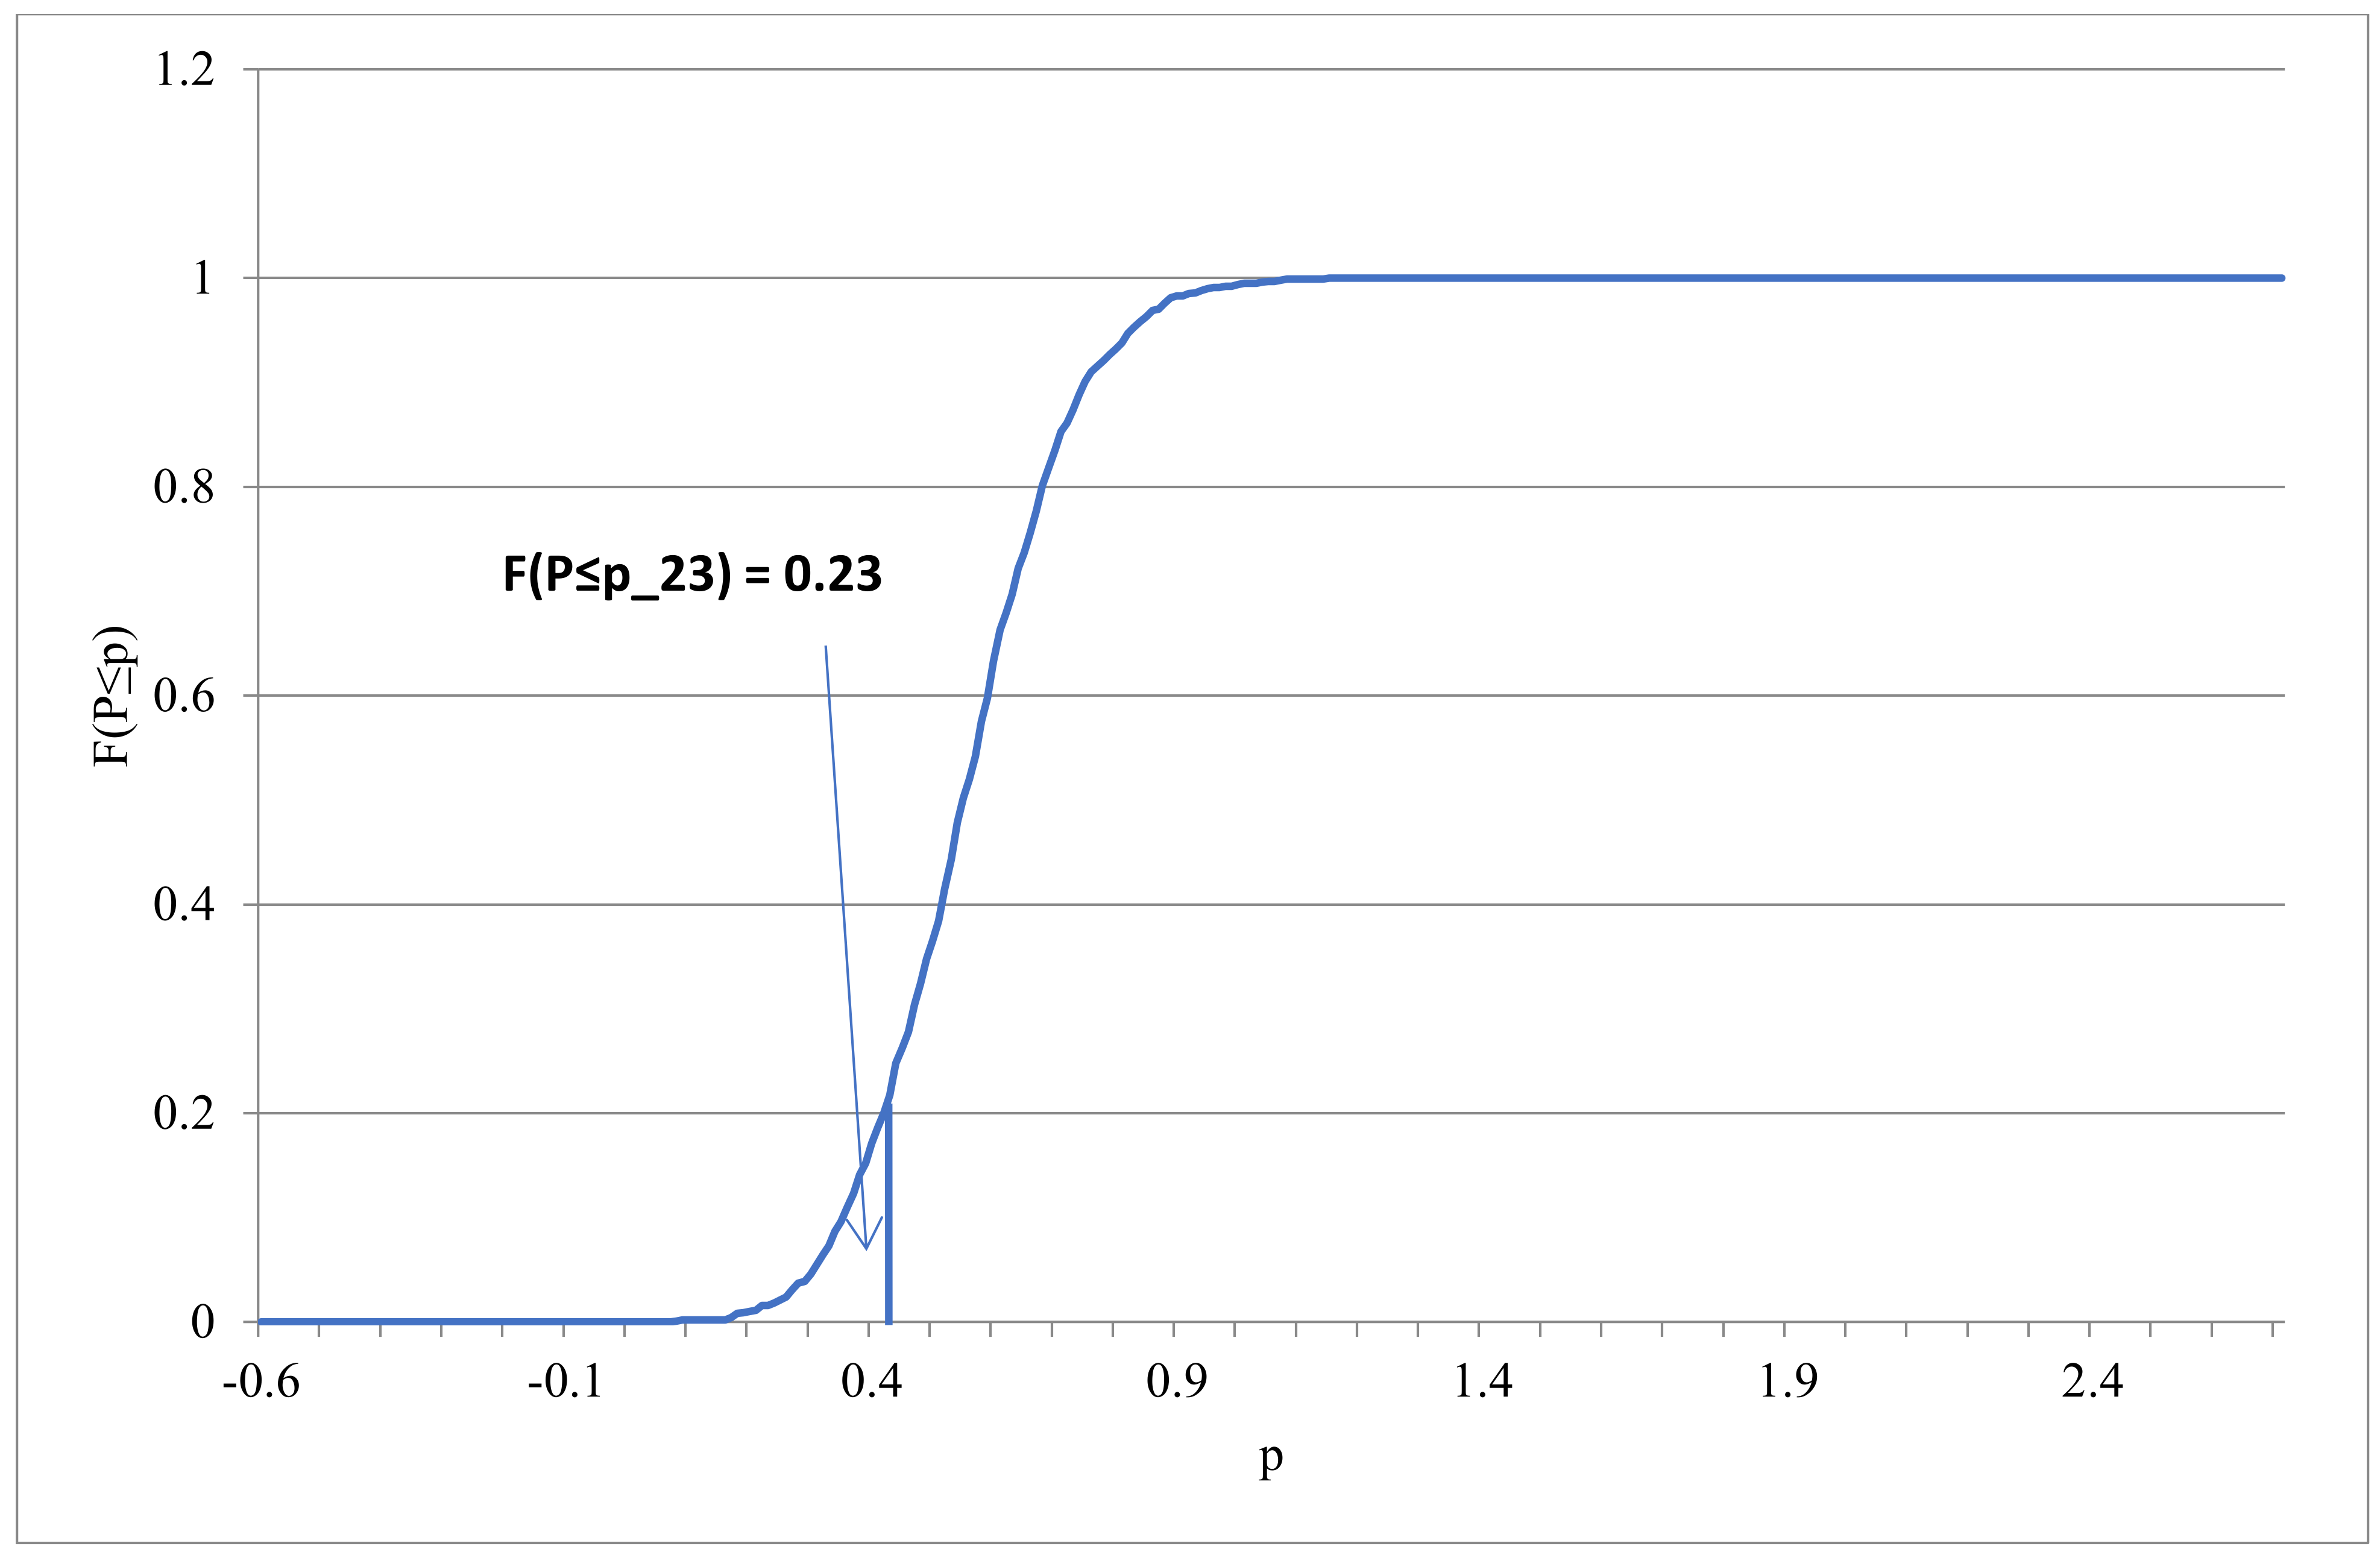
Figure 4 presents the distribution of the utility score for Measure 23 (intervention purchases of agrifood products), which showed rather low probability. In this case, the utility score based on the expert ratings deviated from the median of the distribution based on the Monte Carlo simulation. The distribution was rather compact.
The utility scores were used for ranking the policy measures. Thus, we established the distributions of the ranks rendered by the Monte Carlo simulation for each of the alternatives (
Appendix A). This could show whether the changes in the weights were substantial to induce the changes in ranking of the alternatives. Indeed,
Figure 3 suggests that there is no single policy measure that would be stochastically dominated by others. Therefore, the rankings based on the expert assessment and Monte Carlo simulation are compared in
Table 9.
The Monte Carlo simulation carried out for the assessment of the agricultural policies against the effects of COVID-19 provided the three main indicators: (i) the distribution of the resulting ranks for each policy measure allowing the most probable rank (i.e., the modal rank with the highest frequency) to be identified; (ii) the stability of the rating, which is represented by probability of remaining with the most probable rank; and (iii) the probability of being ranked higher than the most probable rank. These measures defined the shape of the distribution of ranks rendered by the Monte Carlo simulation for a certain alternative.
Table 9 presents the results.
In general, the rankings of the measures directed towards agricultural resilience resulting from the expert survey and the Monte Carlo simulation were highly concordant (
R = 0.93). In both instances, the five top-ranked measures coincided. The most effective measures included EU simplified investment support, coupled payments, credit guarantees, compensation of the guarantee payment for loans, and covering interest payments. Similarly, the worst-ranked alternatives also coincided. Note that one can apply the measures developed by Sałabun et al. [
135] when assessing the differences in the ranking.
The ties in ranks appeared during the Monte Carlo simulation. For instance, both Measure 12 (food supply corridors) and Measure 14 (training and advisory services) showed the modal ranks of six. However, further analysis revealed that Measure 12 showed a higher expected rank than Measure 14. Therefore, the case of ties in the Monte Carlo analysis could be resolved by applying the additional indicators describing the underlying distribution of the ranks.
The stability and modal ranks are related in
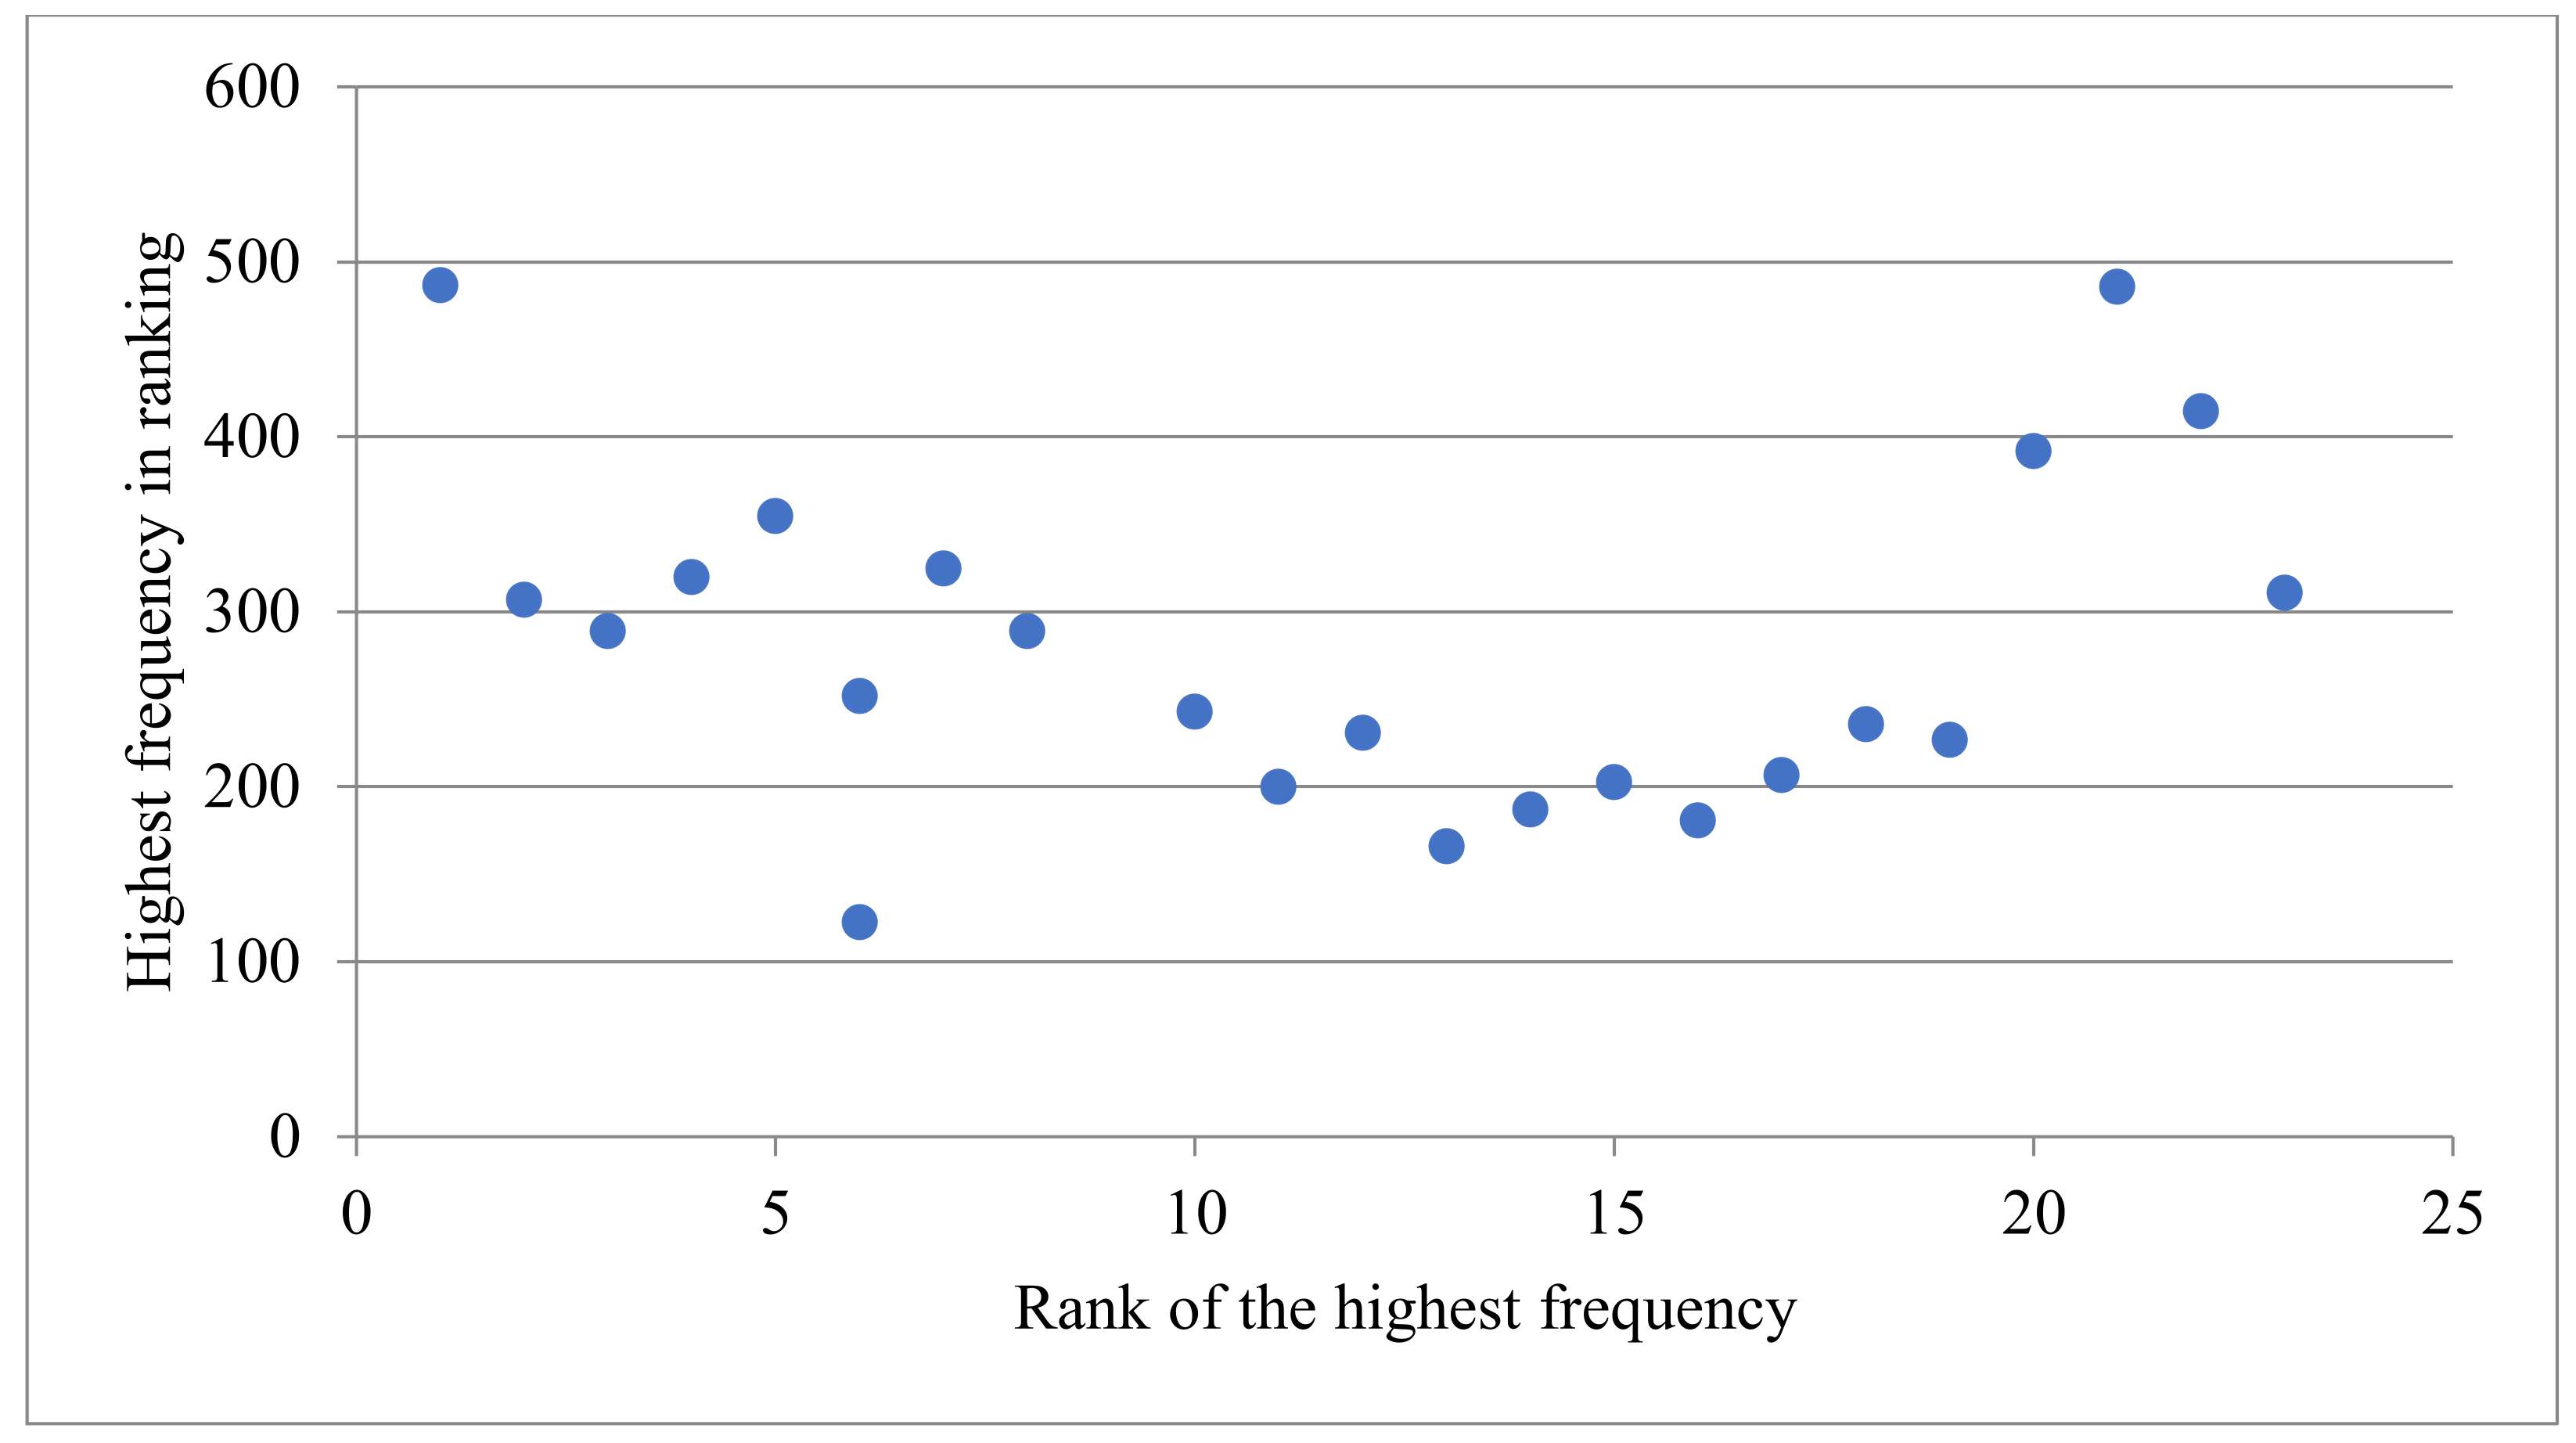
Figure 5. As one can note, there was a U-shape relationship between the modal rank and stability. Thus, the best- and worst-ranked alternatives seemed to be more stable in their ranking than the medium-performing ones. Specifically, the highest value of stability was close to 0.56, whereas the lowest values fluctuated around 0.2. This result confirms that the ranking provided by both the expert assessment and Monte Carlo simulation was similar and robust to perturbations in weights (as one is mostly concerned about the highest-ranking policy measures).
6. Conclusions
The emergence of global hazards requires rapid policy response. However, limited resources require identification of the most effective ensembles of policy measures in order to ensure that both policy objectives and resource availability are satisfied. The present paper discussed the possibilities for responding to the recent COIVD-19 pandemic in the agricultural sector. The case of Lithuania was considered. The multi-criteria approach was followed due to the multi-dimensionality of the agricultural resilience. In order to provide a rapid response to the crisis, the expert ratings were elicited on the possible effects of the agricultural policy measures.
The results show that the measures related to support payments were considered the most effective in mitigating the effects of the pandemic on agriculture. However, these measures were also associated with the highest cost levels. Several measures could be introduced without significant costs and with medium impact on the sector’s activity: public procurement for local agrifood products, reduction in the delay of settlements for agrifood production, priority for young farmers when acquiring/renting land, and increasing food reserves near the consumers. As one can note, these measures are likely to contribute to agricultural viability through different channels and within different time frames. In addition, both novel and existing policy measures can be adapted to combat the negative consequences of the pandemic on the agricultural sector.
Finally, the Monte Carlo simulation was implemented in order to check the robustness of results with respect to perturbations in weights. In general, the results regarding the effectiveness of the policy measures indicate concordance between the expert-based and random ranking of the indicators and, consequently, alternatives. Therefore, the experts’ opinion did not cause significant divergence from the results based on completely unknown preferences. Therefore, in case of resource restrictions, the simulation is likely to be an appealing option for policy-oriented decision-making in the context of agricultural viability.
The present research poses certain limitations that can potentially be addressed in future research. For instance, fuzzy data can be used for future research in order to allow for more uncertainty in the analysis. Objective and subjective data can be combined in order to ensure a higher degree of confidence. The present paper allowed for perturbations in weights. Further analysis could aim to reveal the effects of perturbations in the decision matrix (i.e., the policy effects with regard to particular indicators of agricultural resilience). Further research could apply different multi-criteria decision-making methods and use measures of ranking congruence to check the effects of the different methodological assumptions on the results. The use of the aggregation operators (e.g., Bonferroni operator, Heronian operator) could improve the aggregation of the expert opinions when constructing the aggregate decision matrix.


 ,
, 


