
Study on Feasibility of Photovoltaic Power to Grid Parity in China Based on LCOE


1
Department of Disaster Mitigation for Structures, Tongji University, Shanghai 200092, China
2
State Key Laboratory of Disaster Reduction in Civil Engineering, Tongji University, Shanghai 200092, China
*
Author to whom correspondence should be addressed.
Sustainability 2021, 13(22), 12762; https://doi.org/10.3390/su132212762
Submission received: 8 October 2021
/
Revised: 13 November 2021
/
Accepted: 15 November 2021
/
Published: 18 November 2021
(This article belongs to the Special Issue Approaching Carbon Neutrality: Low-Carbon Solutions to Urban Regeneration and Green Economy)
Abstract
:Today, photovoltaic (PV) power generation accounts for a relatively small proportion of total power generation in China. If photovoltaic power can achieve grid parity, it can replace the original traditional thermal power generation, which has positive significance on the environment. The Levelized Cost of Energy (LCOE) is the main general economic indicator for the evaluation of power generation technology in the world. Based on the traditional LCOE evaluation model and considering the shortcomings of the previous LCOE evaluation models, the cost of photovoltaic power generation is refined in this paper. The cost of the taxation with calculating the depreciation, the loss, and the income of the Clean Development Mechanism (CDM) are taken into consideration. Hence, a more accurate and more comprehensive LCOE model is presented. Moreover, combined with other investment indicators, a photovoltaic power generation benefit model corresponding to the current development status is proposed. Taking a 3-MW distributed photovoltaic power station project in Nanjing as a case study, the sensitivity analysis of factors that affect the benefit of photovoltaic power generation is carried out to further explore the feasibility of photovoltaic power to grid parity.
1. Introduction
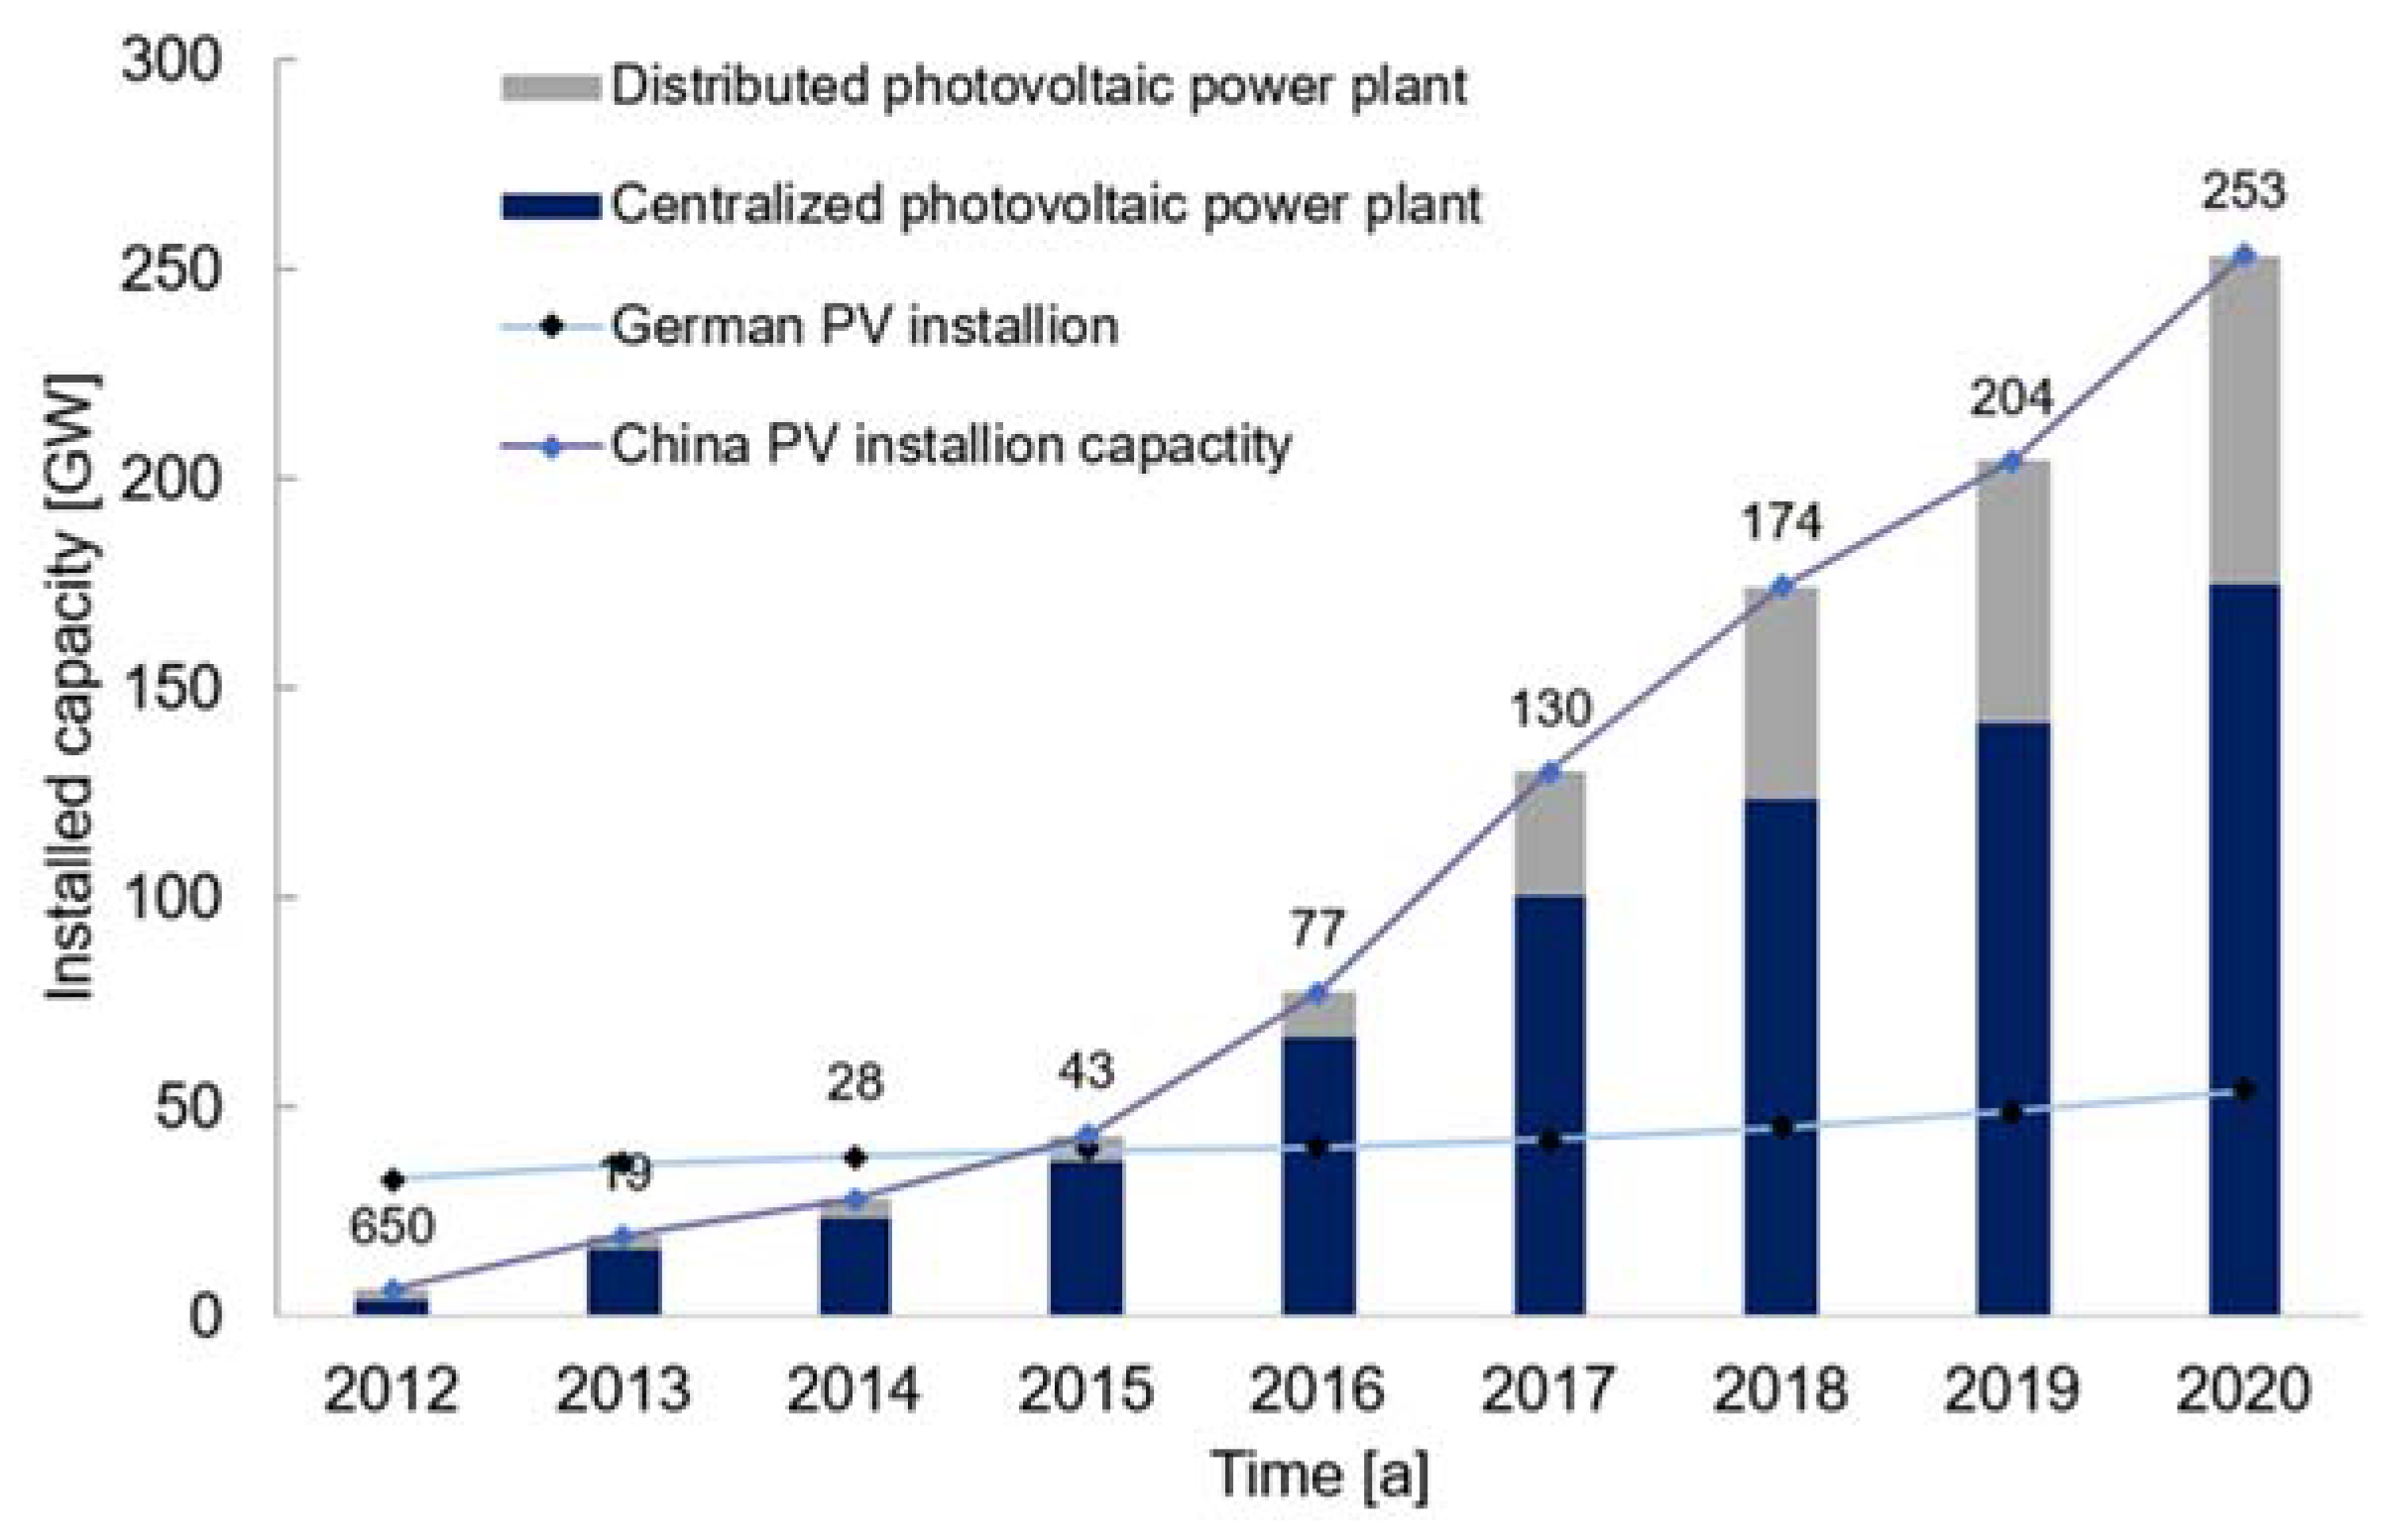
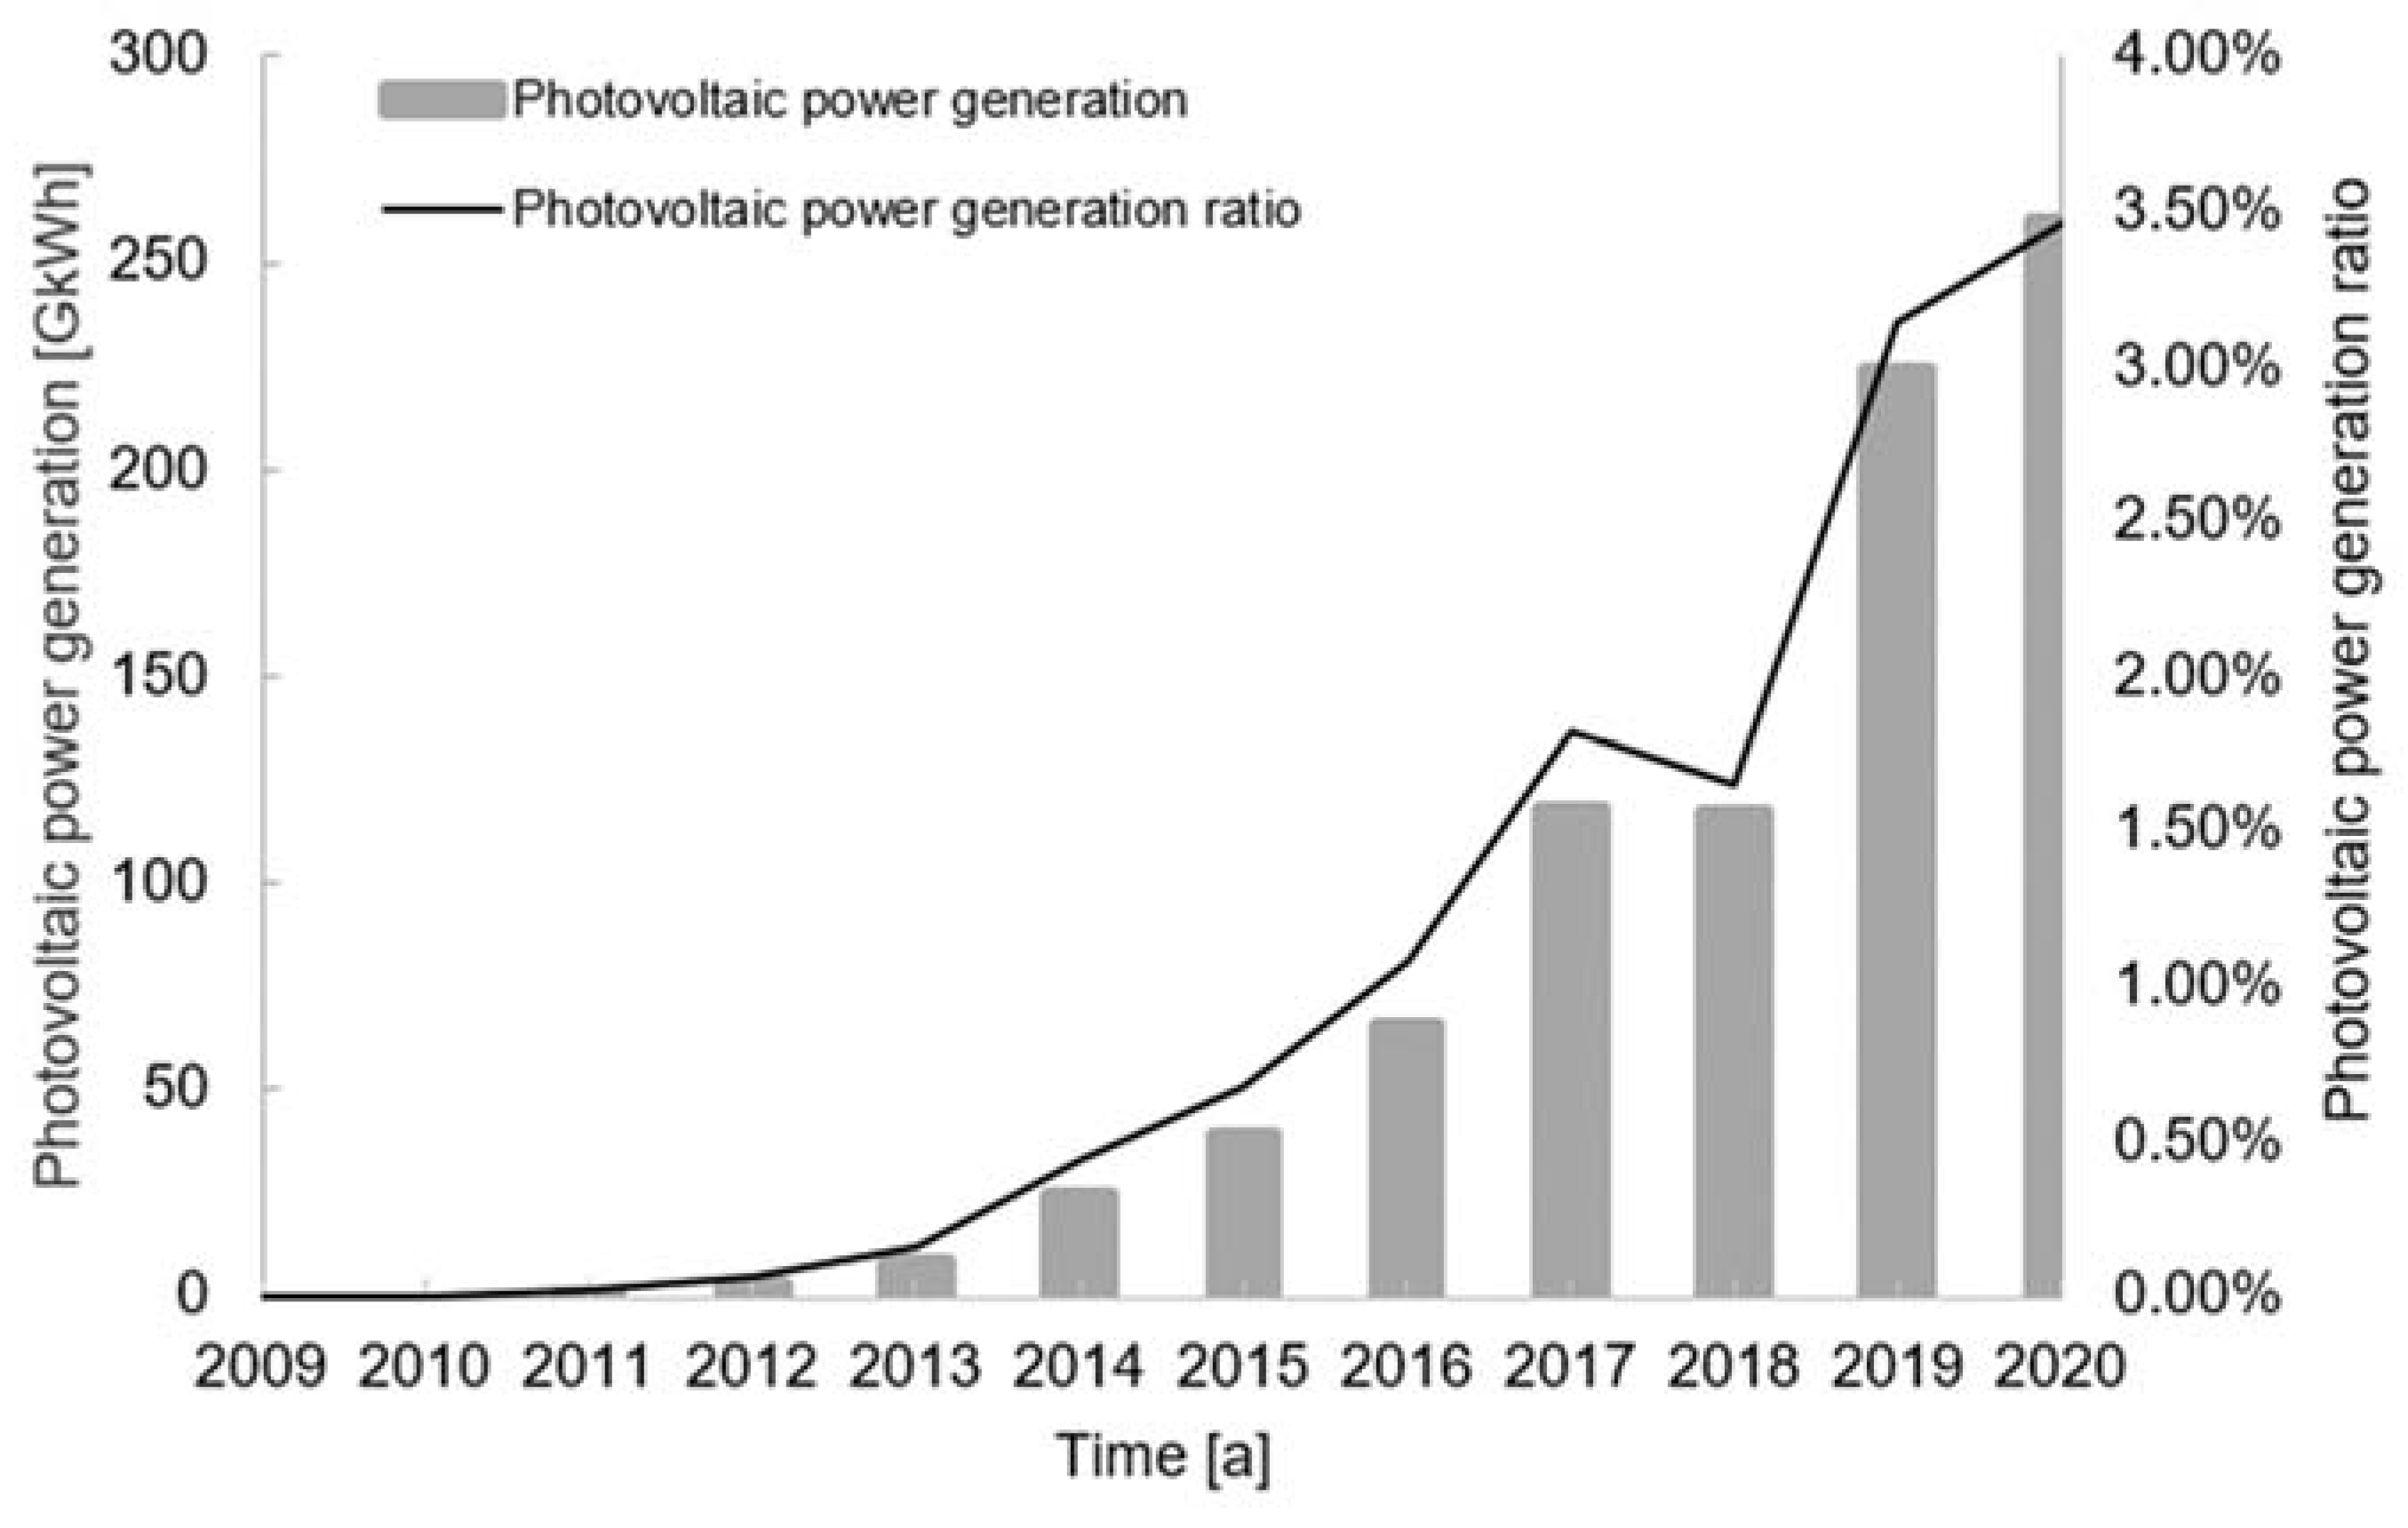
The development of sustainable energy is one of the biggest challenges for humanity in the 21st century. At the end of 2015, the installed photovoltaic (PV) capacity of China surpassed the installed capacity of Germany for the first time [1], ranking first in the world [2]. Meanwhile, PV power generation is continuously rising in China [3], as shown in Figure 1. However, the ratio of photovoltaic power generation to gross power generation is lower than 2% (Figure 2) [3], which is due to the high cost of PV [4,5].
Solar companies in China make income by outputting power to grid with the feed-in tariffs (Fits) [6,7,8], a subsidy mechanism by which the government wants to encourage people to join the photovoltaic industry [9,10,11,12]. By 2017, the feed-in tariffs have been enacted in around 110 countries [13]. However, through the macro policy orders to promote the development of the photovoltaic industry, some problems such as unreasonable resource allocation, low efficiency, inability to select, and huge deficit pressure to the government are still in suspense. Solar auction, another power generation price mechanism, will squeeze the profit of companies, accelerate research and lower power generation cost [6,7]. If the photovoltaic industry can achieve grid parity, it means that photovoltaic power generation has the same cost competitiveness as other power generation technologies in market [14]. With grid parity, PV auctions can be realized, and subsidies can be completely abandoned [7]. Meanwhile, the government can also know the PV situation and control the installed capacity to better regulate the photovoltaic market. Therefore, how to achieve PV grid parity is quite important.
There are many photovoltaic powerhouses that have implemented the auctions [6,13]. For example, Germany, one of the earliest countries introducing the feed-in tariffs mechanism, since the speed of photovoltaic development exceeds the speed of the grid and power market affordability development, cut down subsidies gradually [15]. During the period from January 2010 to July 2011, the cumulative reduction in feed-in tariffs in the European market was up to about one-third. Then, the reform of EEG (Erneuerbare-Energien-Gesetz) in Germany came into force in 2017, including the switch from Fits to auctions. According to EEG, the financial support is granted to projects through auctions. Similarly, PV auctions will become the main photovoltaic power generation price determination mechanism in China.
In recent years, some scholars have carried out a series of studies on the economics of photovoltaic power generation [16,17,18,19,20,21]. The Levelized Cost of Energy (LCOE) is the main general economic indicator for evaluation of power generation technology in the world [22]. Considering the important status of LCOE, there are many investigations and studies putting the emphasis on it, and scholars around the whole world have already conducted the research work on the cost of PV with LCOE. For example, Ameli N et al. [5] proposed that the program based on a Property Assessed Clean Energy (PACE) loan program would, in the short-term, be an effective tool to accelerate grid parity between solar and conventional energy generation and in the long-term provides a theoretically and financially sound alternative to subsidy-based incentives. Zhang H L et al. [15] reviewed the European Feed-in-Tariffs and changing PV efficiencies and costs in detail and predicted the levelized cost of energy (LCOE) in terms of investment and efficiency as functions of the overall process’s efficiency and cost. Chen et al. [19] put forward a ‘new’ LCOE model suitable for Guangzhou, China and carried out the sensitivity analysis. Zweibel K [23] focused on the operating life of PV and conducted the analysis on the topic of ‘Should solar photovoltaics be deployed sooner because of long operating life at low, predictable cost’. Andrychowice M raises the issue of allocation of RES and ES with the use of MILP and also shows the impact of these two activities on the costs of energy from renewable sources [24].
It can be seen that so many scholars have optimized the LCOE model and tried to make the proposed optimized model to be more indigenous with high precision, in order to realize the aim of ‘practical feasibility’. However, the existing LCOE models are not sufficiently detailed and complete for the reason that most of them do not take transmission losses, tax costs, or Clean Development Mechanism (CDM) revenues into account. Moreover, it should be noted that many existing models are proposed and optimized according to other countries, and they are not entirely applicable to China’s national conditions. Hence, the deeper study on an LCOE model especially suitable for China still has an important research value.
Based on the above studies, this paper refines the cost and income of photovoltaic power generation with supplementary consideration of the cost of the taxation with calculating depreciation, the additional cost of transmission loss, and the CDM income so as to propose a more accurate and complete optimized LCOE model. Combined with other investment indicators [25], a photovoltaic power generation investment model applicable to China is further proposed. Through the sensitivity analysis of a case study [25], the ways to achieve grid parity is explored.
2. The Composition of Photovoltaic Power Generation Cost
For centralized photovoltaic power stations or distributed photovoltaic power stations, the project cost is composed of four parts: system cost , operating cost , financial cost and taxation , as shown in Figure 3. The system cost is the initial investment. Operating cost, financial cost, and taxation are the costs incurred when the project is officially operating. Due to the long cycle of the PV power generation project, taking the net present value into account, the operating cost, financial cost, and taxation should be discounted.
The paper discusses the calculation models of the transmission cost , operating cost , financial cost , and taxation in detail. Because of existing research, the calculation models of other costs are not discussed here [26].
2.1. Transmission Cost Ctrans
In the process of buck-boosting of centralized photovoltaic power stations, there is a certain loss of electrical energy [26], reflecting that it is necessary to consider the efficiency of the boosting grid and the efficiency of the buck grid. Meanwhile, in the process of the power transmission of centralized photovoltaic power stations, the long transmission distance would also lead a large amount of power loss. Therefore, the cost brought from high-voltage transmission efficiency shall be considered.
Distributed photovoltaic power stations are often built in residential areas, relying primarily on the mode that users self-generate power at the user end for self-use and utilization of surplus power in the grid. Distributed photovoltaic power stations do not need much space, unlike centralized power plants; they can be easily installed at load centres. Meanwhile, distributed photovoltaic power stations increase the diversity of power sources; therefore, in liberalised power markets, they increase the competition among market players, thereby increasing the quality and decreasing cost of power for end users. Distributed photovoltaic power stations can shift the peak loads, reduce the network losses, improve the voltage profiles, enhance the system reliability, and so on. In the process of gridding, the amount of power has been calculated at the user end [27]. Hence, it is only necessary to consider the cost caused by the efficiency of the photovoltaic power generation system.
Since the initial investment does not take the loss of electrical power into account for calculation, the transmission cost shall be calculated to consider the cost of the power loss of centralized photovoltaic power stations. The transmission cost includes the boosting grid cost , the long transmission cost , and the buck grid cost and is calculated as follows:
Ordinarily, the boosting grid cost and buck grid cost consist of the cost of the photovoltaic power stations and the cost of transmission lines with different voltage levels, which will lead to different costs. According to [26], the cost per unit transmission capacity of direct current transmission projects with different voltage levels can be calculated as RMB 1.5/(kW·km), so the cost of high-voltage transmission can be simplified as a function related to the length L and capacity of the transmission line.
Distributed photovoltaic power plants only need to consider the external access cost , without considering the transmission cost.
2.2. Operating Cost Cop
The operating cost mainly includes the maintenance and management cost (), the insurance cost (), the transmission cost (), and the distribution cost [21]. The maintenance and management cost should be dynamically analysed. The insurance cost is related to the amount of insurance. The transmission costs are calculated according to Section 2.1, and the distribution cost is assumed as a certain value.
The maintenance and management cost () of the plant for the year of n is calculated as follows:
where is the investment cost for the year of (n − 1); is the fixed asset depreciation expense for the year of (n − 1); is the fixed asset depreciation expense for the year of n, and in this model, the straight line method is adopted to calculate depreciation; is the depreciation period; is the system salvage value percent; and is the annual growth rate of the maintenance and management cost.
The insurance cost is calculated as follows:
where is the amount of insurance and is the annual insurance rate.
2.3. Financial Cost Cfn
The financial cost of photovoltaic power stations refers to the interest expense arising from the loan, which is most volatile. The financial cost is determined by the amount of loan and the loan interest rate. The financial cost is calculated as follows:
where is the proportion of loans to total cost, and is the loan interest rate.
If the model adopts the repayment method of the average capital plus interest, which is commonly used by banks, the monthly financial cost shall be determined as follows:
where is the monthly loan interest rate, and n is the number of repayment periods.
If the model adopts the repayment method of average capital, the monthly financial cost shall be determined as follows:
where is the accumulated repayment of capital.
2.4. Taxation Cost Ctax
The existing electricity cost model does not consider the impact of taxation. However, the tax cannot be ignored in practice. The taxation of the photovoltaic power station project mainly includes value-added tax (), surcharge tax (), and income tax (). It should be paid special attention that the taxation policies about photovoltaic power generation are often adjusted according to government support. Meanwhile, different projects are applicable to different taxation policies. Therefore, it is necessary to refine and elaborate the calculation method in this model.
The value-added tax is calculated as follows:
where is the PV power generation income; is the proportion of self-use electricity; is the amount of electricity generated; is the feed-in tariffs; is the contracted electricity prices for use; is the sales revenue of the CDM indicators; and is the value-added tax rate.
The surcharge tax is calculated as follows:
where is the surcharge tax rate.
The income tax is calculated as follows:
where is the photovoltaic power generation cost, ; is the income tax rate; and is the depreciation tax deduction, .
Because the model considers the depreciation factor of fixed assets, depreciation expenses need to be deducted before paying income tax.
3. LCOE Calculation Model
Commonly. used project evaluation indicators in China will be affected by income. However, LCOE, an internationally used electricity cost evaluation indicator, can get rid of the income influence [23,28]. LCOE is the unit cost when the net present value of the total cost is equal to the net present value of the total income. Namely, LCOE is the present value of the cost divided by the power generation during the product’s lifetime. One of the advantages of LCOE is that LCOE of different power generation technologies can be compared horizontally. There is no need to consider feed-in tariffs, and the scope of LCOE application is wider [29,30]. Therefore, LCOE will be the common indicator in China to evaluate the cost of power generation in the future. Taking account of the current situation that the photovoltaic industry in China is still based on subsidies and the trend of bidding, the model chooses electricity cost, net present value, investment payback period, and internal rate of return as evaluation indicators.
3.1. Amount of Power Generation Eg
The amount of photovoltaic power station generating is mainly determined by the number of hours of illumination, the rated power of photovoltaic system, the performance ratio of photovoltaic system, and the system attenuation rate. The annual amount of power generation without considering transmission loss is calculated as follows:
where is the annual peak sunshine hours, referring to the ratio of total solar radiation received by the photovoltaic array on the ground to the solar radiation intensity under standard test conditions; is the photovoltaic system’s rated power; is the photovoltaic system’s performance ratio [31,32], related to photovoltaic square inclination, light utilization, surface contamination of photovoltaic modules, etc.; and is the system attenuation rate.
3.1.1. Solar Energy Resources in China
According to the amount of solar radiation resources, China is divided into three types of areas, as shown in Table 1.
3.1.2. Power Generation Statistical Model
Through the observation and analysis of four photovoltaic power stations in East China for five months (March–July), a good linear correlation is found between the power generation per unit watt and the radiation intensity per unit area, as shown in Figure 4.
The relationship between the power generation per unit watt () and the radiation intensity per unit area x () is calculated as follows:
The coefficient of determination , the common evaluation index in statistics, is used to test the regression effect. After calculation, is 0.8567, which means that the linear regression result is accurate.
3.1.3. Transmission Loss
Centralized photovoltaic power stations will lose a certain amount of power in the process of buck-boosting. The efficiency of the booster grid and the buck grid reflects the power loss during the multi-stage transformer transmission process, which is related to the voltage level, transmission line parameters, the actual power grid topology, and other related factors and is calculated as follows:
where is the efficiency of the boosting grid; is the efficiency of the buck grid; is the grid line loss rate corresponding to the voltage level; is the set of voltage levels of the boosting grid; and is the set of voltage levels of the buck grid.
Since the efficiency of the boosting grid is mainly related to the efficiency of the main transformer, the efficiency of the main transformer can also be used as the transmission efficiency of the boosting grid in the calculation.
At the same time, in the process of power transmission, the distance is usually long, so a large amount of power will be lost, that is, the efficiency of high-voltage transmission must be considered. In the actual system, the transmission utilization rate of the AC (alternating current) system is lower than that of the DC (direct current) system and the cost is higher, so the following high-voltage DC transmission system is adopted:
where is the efficiency of the rectifier side converter station, is the efficiency of the grid-connected inverter side converter station, and [26] is the corresponding transmission loss rate, which can be obtained from the State Grid Corporation of China.
After considering the losses, the annual amount of power generation is calculated as follows:
In the process of the gridding of distributed photovoltaic power stations, the amount of power has been calculated at the user end. Hence, it is only necessary to consider the cost caused by the efficiency of the photovoltaic power generation system as follows:
3.1.4. Effect of PV Array Inclination
Inclination design is the key to ensure that the system’s power generation can reach the design value. The station at the same place with different inclinations may lead to large difference in the amount of power generated [33].
In general, the long-term prediction of the amount of power generated by a photovoltaic project requires only the calculation of the monthly average solar radiation on the inclined surface. Some studies have proposed calculation methods for solar radiation on an inclined surface, such as the classical calculation method of inclined plane radiation proposed by Liu and Jordan in 1962 [34], and the calculation methods proposed by Klien and Theilacker, which are commonly used in the world [35]. Companies generally design and determine the best local inclination according to both the experience and the methods mentioned above.
3.2. Annual Income
The income of a photovoltaic power station mainly comes from feed-in income, government subsidies, and CDM income, etc. The annual income of a PV plant is calculated as follows:
where is Fits; is the subsidized electricity price; is the CDM indicator sales income, , where is CDM-certified emission reduction prices (CERs); and is greenhouse gas emission reductions.
3.3. Optimized Calculation Model of LCOE
According to the previous analysis about the cost and income of photovoltaic power generation, considering the taxation with depreciation tax deduction and the additional cost caused by the loss, a more accurate calculation model of LCOE is obtained as follows:
where is the discount rate; n is the year of operation, ; is the operating period of the PV system; and is the taxation, .
4. Case Study and Analysis
A 3-MW distributed photovoltaic power station project in Nanjing, China is selected as an example for case study and analysis.
4.1. Case Parameters
The PV generation system area is 18181.8 m2. The operating period is 20 a. The annual average solar radiation is 5400 MJ/m2. The first-year power generation is 319,344 kWh. The self-use ratio is 50%. The photovoltaic system performance efficiency is 0.7062. The depreciation period is 20 a. The system salvage value percent is 5%. The first-year operating cost (except insurance) is RMB 80,000. The annual growth rate of the maintenance and management cost is 3%. The insurance rate is 0.08%. The discount rate is 8%. The proportion of self-owned funds is 50%. The annual interest rate is 9%. The repayment period is 5 a.
4.2. Evaluation Index
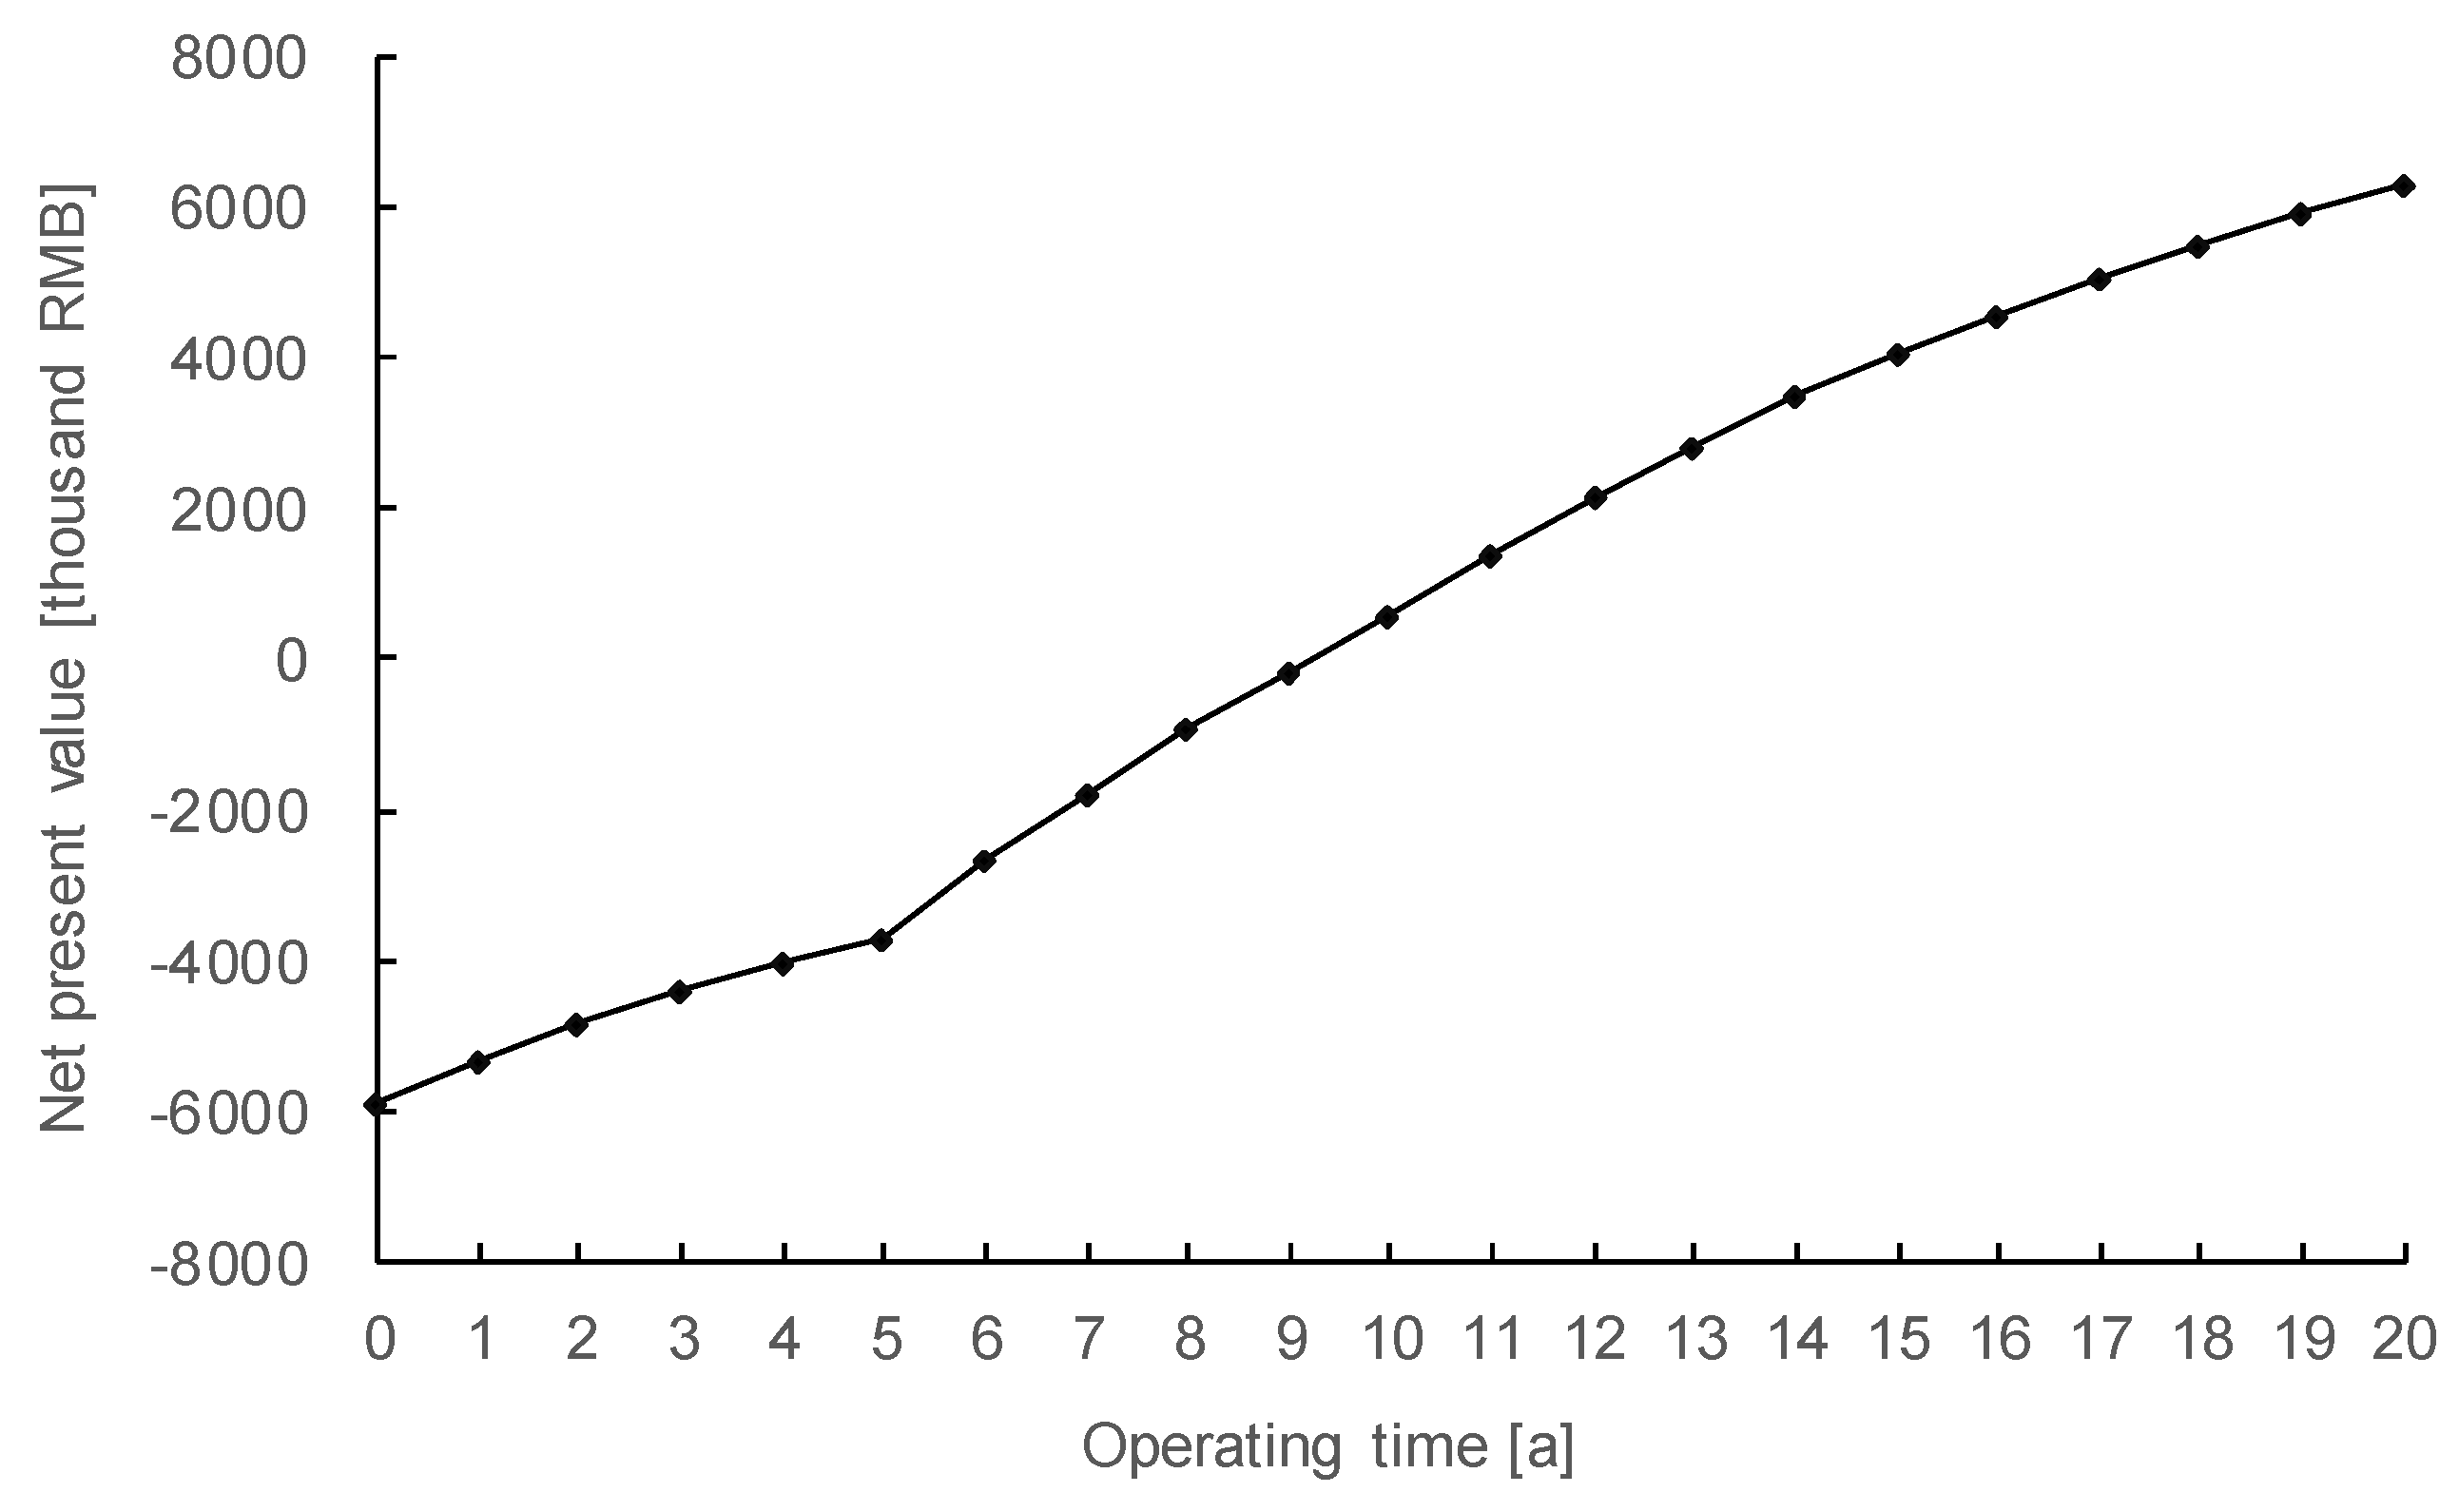
According to the proposed optimized calculation model of LCOE, the LCOE for this project is 0.89 RMB/kWh, and the financial status is shown in Table 2 and Figure 5. The solar radiation intensity is 5400 MJ/m2, and the photovoltaic system rated power is 3 MW.
It can be found that the PV gird parity has not yet been realized by comparing the electricity cost of this project with the 2016 coal-fired feed-in tariffs of Jiangsu Province of 0.4096 RMB/kWh. The investment payback period of this project is 8.96 a. The investment payback period of most distributed photovoltaic generation projects in 2016 was between 8 a and 10 a. The investment payback period of this project is at the industry average. The internal rate of return is 17%, far greater than the discount rate of 8%, which shows that the project has better investment returns.
4.3. Sensitivity Analysis
Sensitivity analysis was carried out on the six factors: feed-in tariffs, amount of generated power, system unit cost, loan ratio, loan interest rate and CERs price. Each factor was changed by 10%, and the LCOE sensitivity coefficient, the internal rate of return sensitivity coefficient, and the payback period sensitivity coefficient of the example were calculated. According to the future development of photovoltaic power generation, feed-in tariffs will be reduced by 10%; the amount of power generation will increase by 10%; the system unit cost will be reduced by 10%; the loan ratio will be reduced by 10%; the loan interest rate will increase by 10%; and the CERs price will decrease by 10%. The sensitivity calculation result is shown in Table 3.
According to the calculated results from the three indicators, the LCOE sensitivity coefficient, the internal rate of return sensitivity coefficient, and the payback period sensitivity coefficient, the following can be found:
(1) The system unit cost has the greatest impact on project cost and income. The LCOE is reduced from 0.89 RMB/kWh to 0.84 RMB/kWh. The internal rate of return sensitivity coefficient is 1.86. The payback period sensitivity coefficient is second only to power generation. Cutting down the system unit cost effectively reduces the cost of photovoltaic power generation and greatly shortens the payback period;
(2) The amount of power generation has the greatest impact on payback period. The sensitivity coefficient is as high as 2.39. The internal rate of return sensitivity coefficient of the amount of power generation is 1.73. The LCOE is reduced to 0.84 RMB/kWh. The amount of power generation has a great impact on the cost and benefit of photovoltaic power generation;
(3) The reduction in feed-in tariffs has a certain small impact on the LCOE, the internal rate of return, and the payback period;
(4) The loan ratio can reduce LCOE slightly, whose sensitivity coefficient is 0.17. Meanwhile, it has a certain impact on the internal rate of return and nearly does not affect the payback period;
(5) The sensitivity coefficient of each factor of loan interest rate and CERs price is small, which has little impact on the LCOE and benefit of photovoltaic power generation.
5. Discussion on Feasibility of Photovoltaic Power to Grid Parity
If LCOE of photovoltaic power generation is equal to traditional power generation technologies, people will actively choose to use solar power, a clean energy, which will be a huge leap in China’s energy conservation and emission reduction. Therefore, it is critical to consider how to reduce the cost of photovoltaics. Through sensitivity analysis, it is found that the system unit cost and the amount of power generation have great impact on photovoltaic projects. Therefore, reducing system unit cost and increasing amount of power generation are the main ways to achieve grid parity.
5.1. Lowering the System Unit Cost
Lowering the system unit cost relies on accelerating independent innovation and improving the technology of photovoltaic power generation industry. If the price of components such as cells goes down, the system unit cost will decrease. Figure 6 shows the price of silicon module and thin-film solar module. It can be seen that with technology developing significantly, the price of photovoltaic modules has dropped extensively. From 2012 to 2018, the price of silicon module dropped from 0.65USD/Watt to 0.22USD/Watt, nearly falling 66.2%. The price of thin-film solar module decreased by 59%. Meanwhile, the reduction of cost is also speeding up, which can promote the grid parity of photovoltaic. The average cost of the GCL (Golden Concord Holdings Limited) photovoltaic power station in 2018 is 5.9 RMB/W, and is expected to drop to 5 RMB/W in the second half of 2019. Compared to the prediction in China’s photovoltaic industry development road map (2016 edition) released by the China Photovoltaic Industry Association, the PV power generation cost in 2020 can be reduced to RMB 5.7/W. The average cost of a GCL photovoltaic power station has exceeded the prediction for nearly one year. It proves that China’s independent innovation capability has been greatly improved. If China can maintain the speed of innovation, it is believed that the recognized expectation of industry that the grid parity of photovoltaic can be achieved in 2020 will come true [36,37].
5.2. Improving the Efficiency of PV Power Generation
With the development of technology, the efficiency of photovoltaic modules is gradually increasing. The efficiency of PV power generation rises nearly 97% from 2012 to 2017. If inverters can generate 10% more electricity under strong light, the power station can generate 4% more electricity in the whole year, which can reduce the power generation cost by nearly 2%. In addition to the performance improvement of the components, there are other ways to improve the system efficiency. For example, if the bracket is changed from the now-used fixed bracket with the two-axis tracking PV bracket to reach the best inclination [27], the power generation can be improved by about 40%.
5.3. Limitation Effect of Curtailment
A decrease in the curtailment rate will cause the actual amount of power generation to increase, thereby lowering the LCOE. In the northwestern region of China with sufficient radiation resources, a large amount of power is wasted. In 2015, the curtailment rate in Gansu and Xinjiang reached 31% and 26%, respectively. However, in 2018, it dropped to 16% and 10%. The decline of curtailment rate is attributed to a series of clean energy consumption policy of China. At the same time, in recent years, newly built distributed photovoltaic installations are mainly located in the eastern region, which can contribute to reasonable resource allocation. In the end of 2018, it was mentioned in ‘the Clean Energy Dissipation Action Plan 2018–2020’ that the PV curtailment rate of Gansu and Xinjiang in 2020 was 10%. Compared with the situation in 2018, there is only a 6% drop and a 0% drop in the curtailment rates in Gansu province and Xinjiang province, respectively. There exists a limitation effect for the decline in LCOE.
5.4. Acceleration of Financial Leverage on PV Develoepment
The impact of loans on revenue is not huge, but it does solve the financial difficulties of companies in the initial investment. However, the instability, low return of PV power generation, the unclearness of the PV industry, and the lack of real multi-year cases have affected the evaluation of PV projects by banks. If the PV industry shows profitability, the financing will be more possible, which will relieve the initial PV financial pressure. With financial leverage, PV can enter a virtuous circle of industry development.
6. Conclusions
(1) In this paper, the LCOE model is optimized, and the cost model is refined, supplementarily considering the expenditure cost of power loss and taxation in line with China’s status, and also taking the income of the Clean Development Mechanism (CDM) into consideration. The research in this paper is more closely related to the application scenario of practical calculation of PV cost and is of reference significance. This paper combines other economic investment indicators with LCOE to comprehensively evaluate the benefits of photovoltaic power generation, which is of practical significance.
(2) Taking a 3-MW distributed photovoltaic power station project in Nanjing, China as an example, it can be found that the investment payback period of the project is in the average level of the photovoltaic industry, the cost of electricity is RMB 0.89/kWh, and the grid parity is not realized.
(3) The sensitivity analysis of the project in Nanjing, China is carried out. It is found that the system unit cost has the greatest impact on project benefits, followed by power generation, feed-in tariffs, loan ratio, loan interest rate, and CERs price. Cutting down the system unit cost of the photovoltaic system and improving the amount of generated power are the main ways to achieve grid parity for the reason that these two methods are relatively much easier to realize and have greater influence on cost. It is believed that with the advancement of photovoltaic technology and the increasingly standardized market, the photovoltaic industry will become more stable and ultimately achieve grid parity.
There are also some limitations about this paper. The sensitivity analysis used for the case study in this paper chooses the number of 10%. In the future study, the numbers can change in stepwise increments up to 10% and study the dependence of the model as applied to their power-plant of choice. Moreover, there are still some other factors that can marginally affect the cost of PV that are not considered in the formula proposed in this paper, which can be taken into account in the future analysis.
Author Contributions
Conceptualization, Q.F.; methodology, Y.C.; writing—original draft preparation, Y.C.; writing—review and editing, Y.C. and Z.L. All authors have read and agreed to the published version of the manuscript.
Funding
This research was funded by the Peak Discipline Construction Project of Shanghai (No. 2021-CE-07) and the Fundamental Research Funds for the Central Government Supported Universities (11080).
Institutional Review Board Statement
Not applicable.
Informed Consent Statement
Informed consent was obtained from all subjects involved in the study.
Data Availability Statement
Not applicable.
Conflicts of Interest
The authors declare no conflict of interest.
References
- Lai, C.S.; Jia, Y.; Lai, L.L.; Xu, Z.; McCulloch, M.D.; Wong, K.P. A comprehensive review on large-scale photovoltaic system with applications of electrical energy storage. Renew. Sustain. Energy Rev. 2017, 78, 439–451. [Google Scholar] [CrossRef]
- Thapar, S.; Sharma, S.; Verma, A. Analyzing solar auctions in India: Identifying key determinants. Energy Sustain. Dev. 2018, 45, 66–78. [Google Scholar] [CrossRef]
- NBS—National Bureau of Statistics of China. National Data—Output of Electricity. Available online: http://data.stats.gov.cn/english/easyquery.htm?cn=A01 (accessed on 1 January 2019).
- Ouyang, X.; Lin, B. Levelized cost of electricity (lcoe) of renewable energies and required subsidies in china. Energy Policy 2014, 70, 64–73. [Google Scholar] [CrossRef]
- Yuan, J.; Sun, S.; Zhang, W.; Xiong, M. The economy of distributed PV in China. Energy 2014, 78, 939–949. [Google Scholar] [CrossRef]
- Atalay, Y.; Kalfagianni, A.; Pattberg, P. Renewable energy support mechanisms in the Gulf Cooperation Council states: Analyzing the feasibility of feed-in tariffs and auction mechanisms. Renew. Sustain. Energy Rev. 2017, 72, 723–733. [Google Scholar] [CrossRef]
- Karneyeva, Y.; Wüstenhagen, R. Solar feed-in tariffs in a post-grid parity world: The role of risk, investor diversity and business models. Energy Policy 2017, 106, 445–456. [Google Scholar] [CrossRef]
- Lüthi, S. Effective deployment of photovoltaics in the Mediterranean countries: Balancing policy risk and return. Sol. Energy 2010, 84, 1059–1071. [Google Scholar] [CrossRef]
- Clò, S.; D’Adamo, G. The dark side of the sun: How solar power production affects the market value of solar and gas sources. Energy Econ. 2015, 49, 523–530. [Google Scholar] [CrossRef]
- Lund, P.D. Boosting new renewable technologies towards grid parity—Economic and policy aspects. Renew. Energy 2011, 36, 2776–2784. [Google Scholar] [CrossRef]
- Ding, L.; Zhang, F.; Shuai, J. How Do Chinese Residents Expect of Government Subsidies on Solar Photovoltaic Power Generation?—A Case of Wuhan, China. Energies 2018, 11, 228. [Google Scholar] [CrossRef] [Green Version]
- Tongsopit, S. Thailand’s feed-in tariff for residential rooftop solar PV systems: Progress so far. Energy Sustain. Dev. 2015, 29, 127–134. [Google Scholar] [CrossRef]
- REN21. Renewables 2018 Global Status Report. Available online: http://www.ren21.net/wp-content/uploads/2016/06/GSR_2016_Full_Report_REN21.pd (accessed on 1 January 2019).
- Biondi, T.; Moretto, M. Solar Grid Parity dynamics in Italy: A real option approach. Energy 2015, 80, 293–302. [Google Scholar] [CrossRef] [Green Version]
- Zhang, H.L.; Van Gerven, T.; Baeyens, J.; Degrève, J. Photovoltaics: Reviewing the European feed-in-tariffs and changing PV efficiencies and costs. Sci. World J. 2014, 2014, 404913. [Google Scholar] [CrossRef]
- Manso-Burgos, Á.; Ribó-Pérez, D.; Alcázar-Ortega, M.; Gómez-Navarro, T. Local Energy Communities in Spain: Economic Implications of the New Tariff and Variable Coefficients. Sustainability 2021, 13, 10555. [Google Scholar] [CrossRef]
- Campana, P.E.; Cioccolanti, L.; François, B.; Jurasz, J.; Zhang, Y.; Varini, M.; Stridh, B.; Yan, J. Li-ion batteries for peak shaving, price arbitrage, and photovoltaic self-consumption in commercial buildings: A Monte Carlo Analysis. Energy Convers. Manag. 2021, 234, 113889. [Google Scholar] [CrossRef]
- Colasante, A.; D’Adamo, I.; Morone, P. Nudging for the increased adoption of solar energy? Evidence from a survey in Italy. Energy Res. Soc. Sci. 2021, 74, 101978. [Google Scholar] [CrossRef]
- Chen, R.; Sun, Y.L.; Chen, S.M.; Shen, H. LCOE analysis of grid-connected photovoltaic power generation project. Renew. Energy Resour. 2015, 33, 731–735. (In Chinese) [Google Scholar]
- Urmee, T.; Harries, D. A survey of solar PV program implementers in Asia and the Pacific regions. Energy Sustain. Dev. 2009, 13, 24–32. [Google Scholar] [CrossRef]
- Zou, H.; Du, H.; Brown, M.A.; Mao, G. Large-scale PV power generation in China: A grid parity and techno-economic analysis. Energy 2017, 134, 256–268. [Google Scholar] [CrossRef]
- Choi, D.G.; Park, S.Y.; Park, N.B.; Hong, J.C. Is the concept of “grid parity” defined appropriately to evaluate the cost-competitiveness of renewable energy technologies? Energy Policy 2015, 86, 718–728. [Google Scholar] [CrossRef]
- Zweibel, K. Should solar photovoltaics be deployed sooner because of long operating life at low, predictable cost? Energy Policy 2010, 38, 7519–7530. [Google Scholar] [CrossRef]
- Andrychowicz, M. The Impact of Energy Storage along with the Allocation of RES on the Reduction of Energy Costs Using MILP. Energies 2021, 14, 3783. [Google Scholar] [CrossRef]
- Said, M.; EL-Shimy, M.; Abdelraheem, M.A. Photovoltaics energy: Improved modeling and analysis of the levelized cost of energy (LCOE) and grid parity—Egypt case study. Sustain. Energy Technol. Assess. 2015, 9, 37–48. [Google Scholar] [CrossRef]
- Jun, S. Mathematical model analysis of photovoltaic power generation cost. Sol. Energy 2012, 2, 53–58. (In Chinese) [Google Scholar]
- Zhang, W.; Zhao, Y.; Huang, F.; Zhong, Y.; Zhou, J. Forecasting the Energy and Economic Benefits of Photovoltaic Technology in China’s Rural Areas. Sustainability 2021, 13, 8408. [Google Scholar] [CrossRef]
- Khan, M.F.; Pervez, A.; Modibbo, U.M.; Chauhan, J.; Ali, I. Flexible Fuzzy Goal Programming Approach in Optimal Mix of Power Generation for Socio-Economic Sustainability: A Case Study. Sustainability 2021, 13, 8256. [Google Scholar] [CrossRef]
- Reichelstein, S.; Sahoo, A. Time of day pricing and the levelized cost of intermittent power generation. Energy Econ. 2015, 48, 97–108. [Google Scholar] [CrossRef]
- Reichelstein, S.; Yorston, M. The prospects for cost competitive solar PV power. Energy Policy 2013, 55, 117–127. [Google Scholar] [CrossRef]
- Abdullah, G.; Nishimura, H. Techno-Economic Performance Analysis of a 40.1 kWp Grid-Connected Photovoltaic (GCPV) System after Eight Years of Energy Generation: A Case Study for Tochigi, Japan. Sustainability 2021, 13, 7680. [Google Scholar] [CrossRef]
- Kumar, K.A.; Sundareswaran, K.; Venkateswaran, P.R. Performance study on a grid connected 20kWp solar photovoltaic installation in an industry in Tiruchirappalli (India). Energy Sustain. Dev. 2014, 23, 294–304. [Google Scholar] [CrossRef]
- Deb, J.; Yohanis, Y.G.; Norton, B. The impact of array inclination and orientation on the performance of a grid-connected photovoltaic system. Renew. Energy 2006, 32, 118–140. [Google Scholar] [CrossRef]
- Yakup, M.A.B.H.M.; Malik, A.Q. Optimum tilt angle and orientation for solar collector in Brunei Durassalam. Renew. Energy 2001, 24, 223–234. [Google Scholar] [CrossRef]
- Klein, S.A.; Theilacker, J.C. An algorithm for calculating monthly-average radiation on inclined surfaces. J. Sol. Energy Eng. Trans. ASME 1981, 103, 29–33. [Google Scholar] [CrossRef]
- Zhang, X.; Liu, W.; Zhang, H.; Yuan, J. Can China Realize the Grid Parity Target of Centralized Photovoltaic Power by 2020? Emerg. Mark. Financ. Trade 2019, 57, 740–756. [Google Scholar] [CrossRef]
- Li, H.; Yu, Y.; Xie, Y.; Zhang, J. Could wind and PV energies achieve the grid parity in China until 2020? Filomat 2016, 30, 4173–4189. [Google Scholar] [CrossRef]
Figure 1.
Photovoltaic power generation in China compared with Germany.

Figure 2.
Photovoltaic power generation and ratio.

Figure 3.
The composite of photovoltaic power generation cost.

Figure 4.
Relationship between the power generation and the solar radiation intensity.

Figure 5.
Net present value of a 3-MW distributed PV project.

Figure 6.
The price of silicon module and thin-film solar module.


Table 1.
Distribution of solar energy resources in China.
| Types | Solar Radiation Intensity (MJ·m−2) | Areas |
|---|---|---|
| I | 6700~8370 | Qinghai, Gansu, Ningxia, Xinjiang, northwestern Hebei, Shanxi, Inner Mongolia, etc. |
| II | 5400~6700 | Shandong, Henan, Jilin, Liaoning, Yunnan, etc. |
| III | 4200~5400 | Middle and lower reaches of the Yangtze River, Fujian, Zhejiang, Guangdong, etc. |
Table 2.
Financial analysis of the life cycle of a 3-MW distributed PV project.
| Year | Annual Power Generation /kWh | Financial Cost /Thousand RMB | Operating Cost /Thousand RMB | Income /Thousand RMB | Taxation/Thousand RMB | Net Profit after Tax /Thousand RMB | Net Present Value /Thousand RMB |
|---|---|---|---|---|---|---|---|
| 0 | 0 | 0 | 0 | 0 | 0 | 0 | −5850.0 |
| 1 | 3,139,602 | 1504 | 80 | 3371.43 | 628.48 | 590.58 | −5303.2 |
| 2 | 3,087,143 | 1504 | 82.4 | 3315.1 | 608.4 | 555.2 | −4827.2 |
| 3 | 3,061,708 | 1504 | 84.87 | 3287.78 | 598.34 | 535.47 | −4402.1 |
| 4 | 3,036,273 | 1504 | 87.42 | 3260.47 | 588.26 | 515.69 | −4023.1 |
| 5 | 30,108,380 | 1504 | 90.04 | 3233.16 | 578.16 | 495.86 | −3685.6 |
| 6 | 29,854,030 | 0 | 92.74 | 3205.84 | 944.04 | 1603.96 | −2674.8 |
| 7 | 29,599,680 | 0 | 95.52 | 3178.53 | 933.9 | 1584 | −1750.6 |
| 8 | 29,345,340 | 0 | 98.39 | 3151.22 | 923.74 | 1563.98 | −905.6 |
| 9 | 29,090,990 | 0 | 101.34 | 3123.91 | 913.55 | 1543.9 | −133.3 |
| 10 | 28,836,640 | 0 | 104.38 | 3096.59 | 903.35 | 1523.75 | 572.5 |
| 11 | 28,582,290 | 0 | 107.51 | 3069.28 | 1032.06 | 1920.35 | 1396.1 |
| 12 | 28,327,950 | 0 | 110.74 | 3041.97 | 1021.81 | 1900.06 | 2150.7 |
| 13 | 28,073,600 | 0 | 114.06 | 3014.65 | 1011.54 | 1879.7 | 2841.8 |
| 14 | 27,819,250 | 0 | 117.48 | 2987.34 | 1001.24 | 1859.26 | 3474.8 |
| 15 | 27,564,900 | 0 | 121.01 | 2960.03 | 990.91 | 1838.75 | 4054.5 |
| 16 | 27,310,560 | 0 | 124.64 | 2932.72 | 980.56 | 1818.16 | 4585.2 |
| 17 | 27,056,210 | 0 | 128.38 | 2905.4 | 970.18 | 1797.49 | 5071 |
| 18 | 26,801,860 | 0 | 132.23 | 2878.09 | 959.77 | 1776.73 | 5515.6 |
| 19 | 26,547,510 | 0 | 136.19 | 2850.78 | 949.34 | 1755.89 | 5922.5 |
| 20 | 26,293,170 | 0 | 140.28 | 2823.46 | 938.87 | 1734.95 | 6294.7 |
Table 3.
Sensitivity analysis of a 3-MW distributed PV plant project.
| Influence Factor | LCOE | LCOE Sensitivity Coefficient | Internal Rate of Return | Internal Rate of Return Sensitivity Coefficient | Payback Period | Payback Period Sensitivity Coefficient |
|---|---|---|---|---|---|---|
| Feed-in tariffs | 0.8796 | 0.16 | 15.83% | 0.66 | 8.78 | 0.20 |
| Amount of power generation | 0.8438 | 0.56 | 19.89% | 1.73 | 6.82 | 2.39 |
| System unit cost | 0.8413 | 0.59 | 20.11% | 1.86 | 6.84 | 2.36 |
| Loan ratio | 0.8785 | 0.17 | 16.44% | 0.30 | 8.91 | 0.05 |
| Loan interest rate | 0.8978 | 0.04 | 16.76% | 0.12 | 8.92 | 0.04 |
| CERs price | 0.8961 | 0.02 | 16.88% | 0.04 | 8.95 | 0.01 |
Publisher’s Note: MDPI stays neutral with regard to jurisdictional claims in published maps and institutional affiliations. |
© 2021 by the authors. Licensee MDPI, Basel, Switzerland. This article is an open access article distributed under the terms and conditions of the Creative Commons Attribution (CC BY) license (https://creativecommons.org/licenses/by/4.0/).
Share and Cite
MDPI and ACS Style
Lu, Z.; Chen, Y.; Fan, Q. Study on Feasibility of Photovoltaic Power to Grid Parity in China Based on LCOE. Sustainability 2021, 13, 12762. https://doi.org/10.3390/su132212762
AMA Style
Lu Z, Chen Y, Fan Q. Study on Feasibility of Photovoltaic Power to Grid Parity in China Based on LCOE. Sustainability. 2021; 13(22):12762. https://doi.org/10.3390/su132212762
Chicago/Turabian StyleLu, Zheng, Yunfei Chen, and Qiaoqiao Fan. 2021. "Study on Feasibility of Photovoltaic Power to Grid Parity in China Based on LCOE" Sustainability 13, no. 22: 12762. https://doi.org/10.3390/su132212762
Note that from the first issue of 2016, this journal uses article numbers instead of page numbers. See further details here.