Determining the Number of Passengers for Each of Three Reverse Pyramid Boarding Groups with COVID-19 Flying Restrictions


1
Department of Economic Informatics and Cybernetics, Bucharest University of Economic Studies, 010552 Bucharest, Romania
2
David D. Reh School of Business, Clarkson University, 333 B.H. Snell Hall, Potsdam, NY 13699, USA
*
Author to whom correspondence should be addressed.
Symmetry 2020, 12(12), 2038; https://doi.org/10.3390/sym12122038
Submission received: 5 November 2020
/
Revised: 2 December 2020
/
Accepted: 4 December 2020
/
Published: 9 December 2020
Abstract
:The onset of the novel coronavirus SARS-CoV2 has changed many aspects of people’s economic and social activities. For many airlines, social distancing has reduced airplane capacity by one third as a result of keeping the middle seats empty. Additionally, social distancing between passengers traversing the aisle slows the boarding process. Recent literature has suggested that the reverse pyramid boarding method provides favorable values for boarding time and passenger health metrics when compared to other boarding methods with social distancing. Assuming reverse pyramid boarding with the middle seats unoccupied, we determined the number of passengers to include in each of three boarding groups. We assumed that passengers use a jet-bridge that connects the airport terminal to the airplane’s front door. We used agent-based modeling and a stochastic simulation to evaluate solutions. A full grid search found an initial good solution, and then local search optimization determined the best solution based upon the airline’s relative preference for minimizing average boarding time and minimizing risks to previously seated passengers from later-boarding, potentially contagious passengers breathing near them. The resulting solution contained the number of passengers to place into each of the three boarding groups. If an airline is most concerned about the health risk to seated passengers from later boarding passengers walking near them, the best three-group reverse pyramid method adapted for social distancing will first board passengers with window seats in the rear half of the airplane, then will board passengers with window seats in the front half of the airplane and those with aisle seats in the rear half of the airplane, and finally will board the passengers with aisle seats in the front half of the airplane. The resulting solution takes about 2% longer to board than the three-group solution that minimizes boarding time while providing a 25% decrease in health risk to aisle seat passengers from later boarding passengers.
1. Introduction
Due to the spread of the novel coronavirus SARS-CoV2, social distancing has changed the way business is conducted in many industries. The air transportation sector has suffered major losses due to flight cancelations between affected countries and due to the reluctance of passengers to use air travel.
In a recent study commissioned by the International Air Transport Association (IATA) regarding passengers’ perception on the aviation industry in times of the pandemic [1], only 12% of passengers indicated that they will not wait to return to their typical travel plans. The remaining respondents indicated that it is probable for them to wait a month or two (33%), wait about six months (36%), wait about one year (14%), or not resume their usual travel plans for the foreseeable future [1]. The study included 4700 respondents from 11 countries and was conducted in three waves: February 2020, April 2020, and June 2020.
The same report [1] indicated that even after the pandemic subsides, people expect to travel less: 66% of the respondents indicated that they are somewhat likely or very likely to travel less for business or leisure. These results are in line with projections made by the International Civil Aviation Organization (ICAO) that expects an unprecedent drop in air travel demand [2]. Furthermore, as Schultz and Fuchte [3] observed, there are regions in the world in which the air traffic has dropped by more than 90% due to the pandemic. As airlines attempt to restore the confidence of passengers, trust is becoming an important factor [4,5].
Comparing the expectations of passengers with the measures employed by the airlines, we have observed that there is a common ground with respect to social distancing rules. Social distancing can be achieved inside the cabin by ensuring social distance among the passengers walking down the aisle to their seats and by keeping the middle seats empty. Additionally, the risk generated by passengers passing closely by previously seated passengers and a prolonged boarding process can be reduced by selecting an appropriate boarding method.
Over time, a series of studies in the literature have searched for a boarding method that provides the smallest boarding time [6,7,8,9]. With the advent of the novel coronavirus, in addition to boarding time, recent airplane boarding and seating assignment studies have considered performance evaluation metrics related to the passengers’ health risks [10,11,12,13].
As a result, the present paper considers the previous works from the field in the area of airplane boarding and expands that research by investigating the performance of the reverse pyramid method when the number of passengers in each of the three groups varies, adapted for a case in which social distancing among passengers is considered.
The paper is organized as follows. Section 2 provides a short literature review of airplane boarding methods that emphasizes studies featuring the reverse pyramid method. Section 3 discusses the assumptions and performance metrics used in this paper for evaluating the number of passengers assigned to each boarding group when using the reverse pyramid method under various scenarios. Section 4 describes the agent-based model used for simulating the passenger boarding process, the rules for the adaptation of the reverse pyramid method, and the local search optimization method used for determining the best reverse pyramid variant. Section 5 describes the numerical results attained through the stochastic simulation experiments. The paper closes with concluding remarks and suggestions for future research.
2. Literature Review
Scientific research literature dedicated to reducing airplane turn time has provided a large number of research papers that have attempted to reduce the airplane boarding time [6]. Various studies have proposed boarding methods for airline passengers by considering the airport infrastructure [7,8,14]. For example, when an airport provides jet bridges for passengers’ boarding, three types of airplane boarding methods have been created, generally characterized as: “random,” “by group,” or “by seat” [15,16,17,18,19]. Random boarding can be conducted with passengers having their seat numbers printed on their boarding cards or with “open seating” in which passengers choose their seats from among those available after arriving inside the airplane [6]. When passengers ride apron buses to travel from the airport terminal to the airplane, the airplane boarding methods can only be characterized as “random” or “by group” because airlines exert no control over the boarding sequence of passengers departing a particular apron bus, so there is no “by seat” possibility [20,21,22,23,24,25].
Among the three categories of methods, the “by group” category comprises most of the methods proposed in the literature [6]. As a general rule, the methods in this category separate the passengers to be boarded into two-to-six groups—except for the “by row” methods that assign the passengers to a number of groups equal to the number of the airplane rows—and assign passengers to groups based on specific rules. For example, with the WilMA (window–middle–aisle) boarding method, the first boarding group contains those passengers with seats adjacent to the window, the second boarding group contains those passengers with middle seats, and the third (and final) group to board contains passengers with seats adjacent to the aisle [9,19,26,27,28]. Within a given boarding group, the passengers board the airplane in a random sequence [29]. Other methods in the by group category include: back-to-front, rotating zone, and the optimal method [30,31,32].
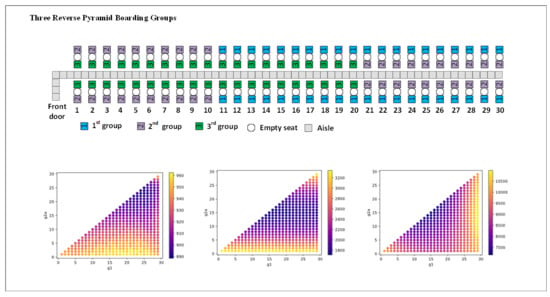
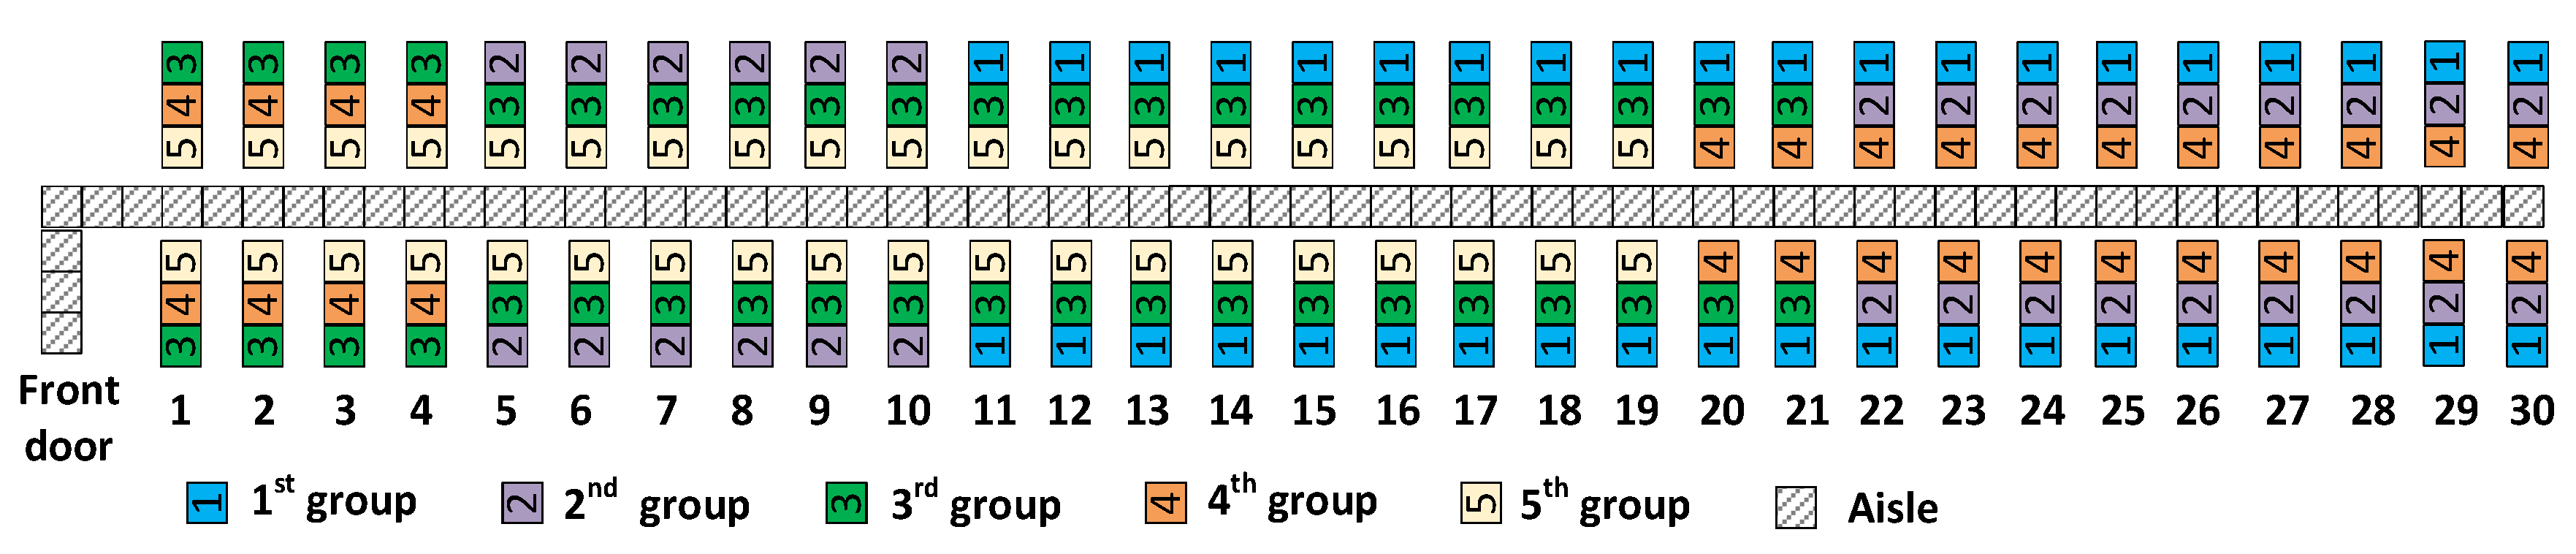
The reverse pyramid method, developed by Van den Briel et al. [17], is one of the most well-known methods in the “boarding by group” category. It segregates the passengers into groups based on their seats’ positions using a “diagonally load” scheme. The method leverages concepts from the WilMA and back-to-front methods while trying to retain some of the advantages of each. For instance, within a given row of the airplane, the row’s passengers board in a WilMA sequence. Passengers seated closer to the rear of the airplane tend to board earlier than those seated near the front of the airplane. The method features up to six boarding groups in situations when the middle seats may be occupied (that is, without social distancing) [17]. Following the reverse pyramid method’s boarding scheme, the first boarding group contains passengers with window seats closest to the rear of the airplane, while the last boarding group contains passengers in the aisle seats closest to the front of the airplane. For the other groups, some of its passengers have seats closer to the window in the front or middle rows of the airplane, while its other passengers have seats closer to the aisle and the rear of the airplane [18]. As with the other “by group” boarding methods, within each reverse pyramid group, the passengers enter the airplane in a random manner [30,33]. Figure 1 presents the reverse pyramid method—unadapted for social distancing—with five boarding groups applied on an Airbus A320 with 30 rows [6]. The reverse pyramid method provides good (i.e., low) values for boarding time when passengers use jet bridges [10,15,17,34] and when using apron buses [12,30].
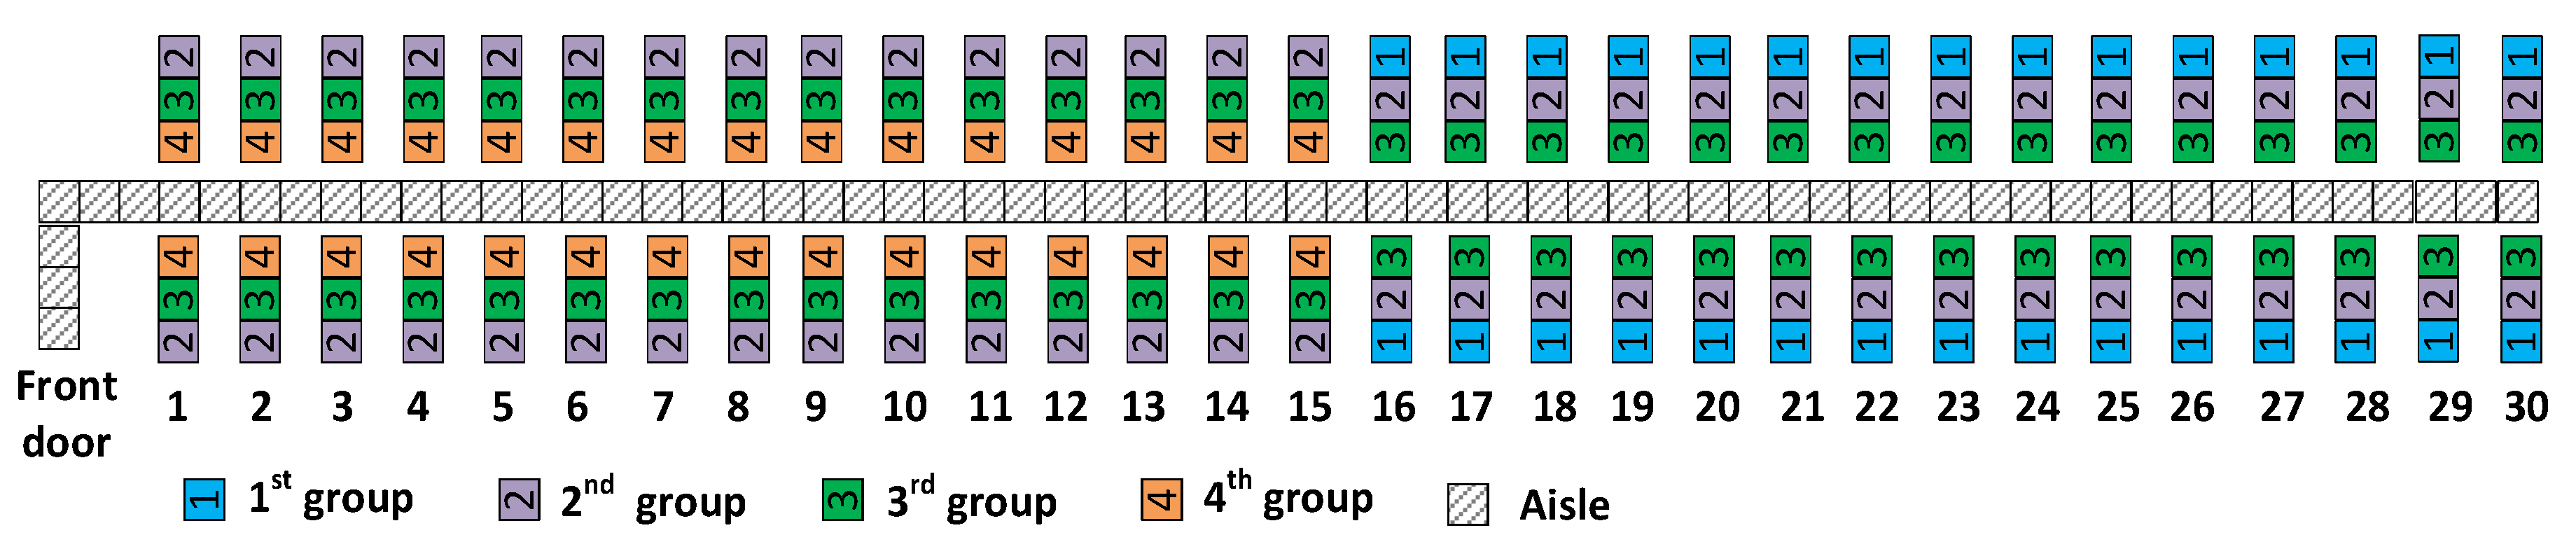
JetBlue has used a modified version of the reverse pyramid boarding method that features four boarding groups. Referred to as the modified reverse pyramid half-zone method, this method is illustrated, with four boarding groups and without social distancing, in Figure 2 [35]. The first group comprises the passengers with window seats located in the rear half of the airplane, while the fourth group has the passengers with aisle seats located in the front half of the airplane. The second and the third groups are composed of an equal number of passengers located in a diagonal scheme in the remaining seats [35,36]. Testing the modified reverse pyramid half-zone method in similar conditions with other methods from the “by group” category has shown that it offers a faster airplane boarding time than the other methods [36]. That test was made in situations for which no social distancing was needed.
Recent studies have proposed adaptations of the reverse pyramid method to account for social distancing due to the novel coronavirus, e.g., leaving the middle seats empty and providing 1 m of social distancing for the passengers walking down the aisle [12,30]. Stochastic simulation results have indicated that when apron buses are used to transport passengers to the airplane, the adapted versions of the reverse pyramid provide the best performance in terms of boarding times and passengers’ health risk when compared with the adapted versions of back-to-front and WilMA methods when social distancing applies [12]. Milne et al. [30] reached similar conclusions with social distancing when passengers use a jet bridge and the airplane’s front door for boarding. Assuming an equal number of passengers in each boarding group, Milne et al. [30] found that the reverse pyramid method with three boarding groups outperforms the reverse pyramid method with two groups in terms of both boarding time and passenger health risk. These results merit the further investigation of the variations in reverse pyramid that bring the best results under social distancing when a jet bridge is used for passengers boarding.
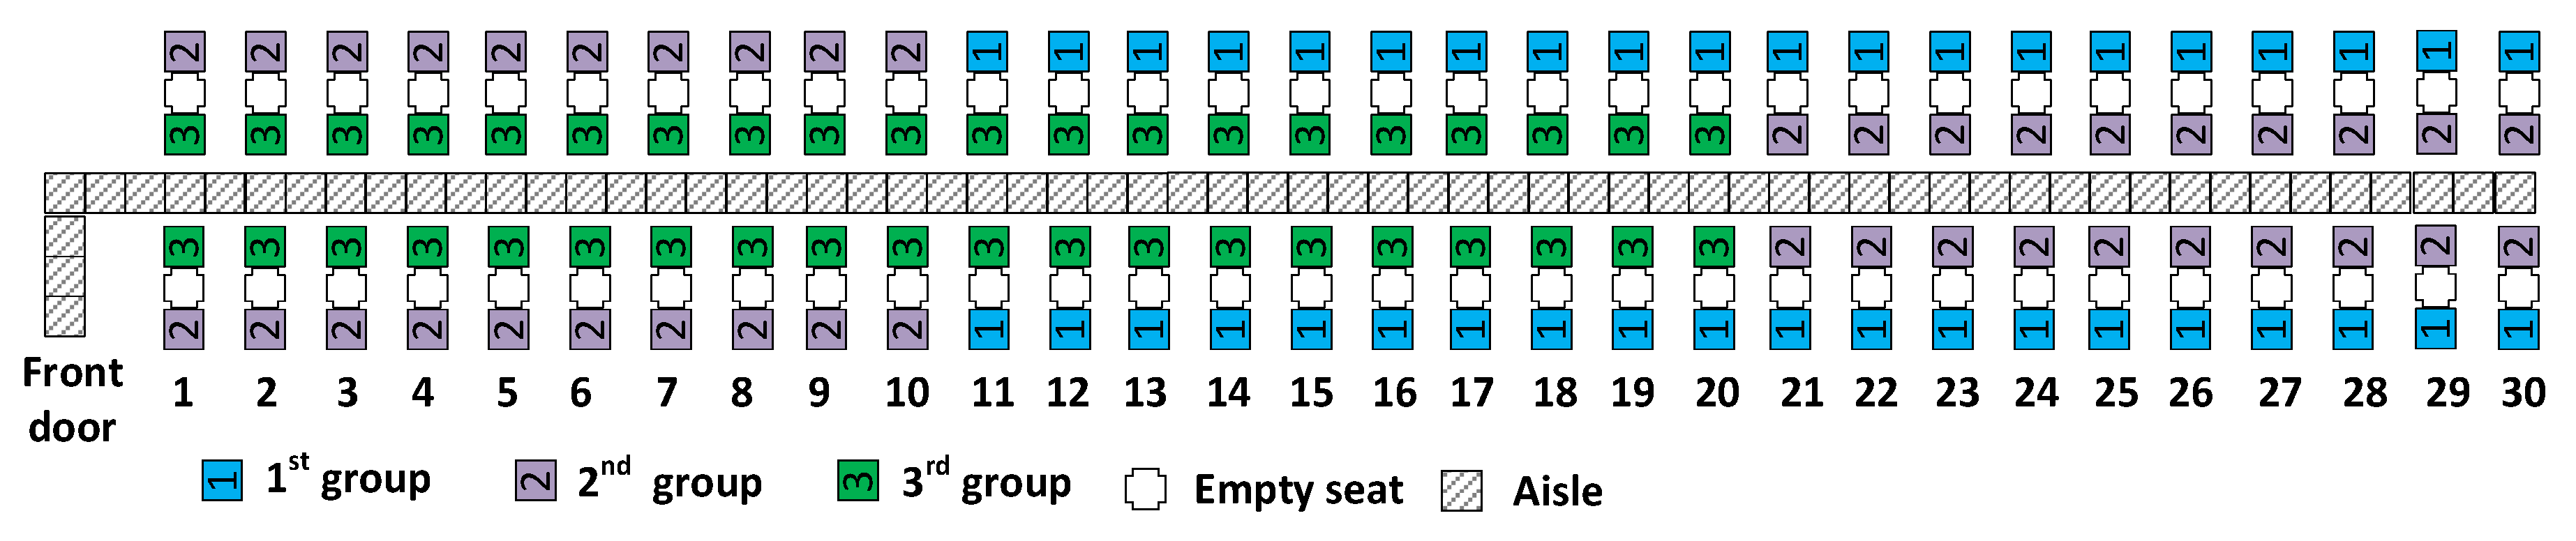
Figure 3 illustrates the reverse pyramid method with three equal-sized boarding groups in the case of an Airbus A320 airplane with 30 rows of seats and social distancing [30].
The literature has examined various models and methods for airplane boarding with comparative testing under various conditions of airplane occupancy rates [16,24,37,38,39], passengers rules of movement and personal characteristics [9,14], the presence of hand luggage [16,26,40,41], airplane characteristics [15,27,42,43], and disturbances and passengers interferences [26,27,34,38,44].
Passenger behavior has been modeled through the use of different methods and techniques such as stochastic modeling [7,45,46], simulated annealing [47], mixed integer programming [34,40,48], genetic algorithms [15], agent-based modelling [6,11,20,25,29], grid-based simulation model [49], and pedestrian flow modeling [50,51,52].
We expanded upon those prior works to investigate the performance of the reverse pyramid method (adapted for social distancing) when the number of passengers within each boarding group varies. We analyzed possible cases in which the three groups of passengers can be formed, starting with a small number of passengers assigned to the first and second groups and ending with a small number of passengers assigned to the third group. Based on the performance indicators favored by the airline (boarding time and passenger health risk), we provide the number of passengers to assign to each of the three boarding groups when using the reverse pyramid (adapted for social distancing).
3. Assumptions and Metrics for Evaluation of Boarding Group Assignments of Passengers
In this section, we discuss our assumptions for social distancing, the passengers’ hand luggage, and the metrics used for evaluating the number of passengers to place into each of the three boarding groups when reverse pyramid boarding is used with social distancing.
3.1. Assumptions for Passengers’ Social Distancing and Luggage
De Vos [53] stated that social distancing reduces interactions among individuals with the purpose of slowing down the virus spread, while the World Health Organization (WHO) underlined that social distancing is one of the most important measures to be taken to mitigate the impact of the novel coronavirus [54]. The European Union Aviation Safety Agency (EASA) stated in a recent report that it is the duty of the airplane operators to ensure, as much as possible, physical distance among passengers [55]. Inside the airplane, social distancing can be practiced by minimizing the interaction among the air travelers when they are moving in the aisle and when they are seated.
The aisle social distance represents the distance to be kept between two passengers walking (or standing) in the aisle while heading to their assigned seats. Based on the recommendations made by the IATA [56], an ideal distance among the passengers is 1–2 m, while the WHO [54] advises people to keep a social distance of at least 3.3 feet (equivalent to 1 m). Considering these recommendations, in the agent-based model, we assumed an aisle social distance of 1 m among the passengers advancing down the aisle to their seats.
Seat social distancing refers to leaving an empty seat between the window and aisle seat passengers. A study conducted by Barnett [57] indicated that when the middle seat is unoccupied, the risk of COVID-19 spread between seated passengers is reduced by half. This measure has been used in practice by Delta Air Lines and others [58]; the former company committed to keeping the middle seat blocked off until at least 6 January 2021 [59]. As a result, in the agent-based model, we decided that the middle seat was empty. Due to the middle-seat-empty policy, a 30-row airplane, which usually accommodates 180 passengers, will now only accommodate 120 passengers.
Another assumption is related to the quantity of luggage carried by passengers inside the cabin. The IATA Medical Advisory Group recommends travelers limit their carry-on luggage [56]. Even though this measure might be beneficial, it may not be practical—at least without the support of the airlines offering free transportation of luggage in the cargo compartment. Few airlines have made this step in practice. One is Turkish Airlines, which has limited carry-on luggage to a small piece of luggage, while the large luggage is transported free of charge into the cargo compartment [60]. We assume a high luggage situation in which 10% of the passengers have no carry-on bags, 10% carry a small bag, 10% carry one large bag, and the remaining passengers carry one large and one small bag. These luggage frequencies are implemented in an agent-based model and used for simulations; it is the same luggage assumptions as the S1 situation considered in [10,22].
3.2. Metrics Used to Evaluate the Reverse Pyramid Method with Various 3-Passenger Groups
Based on the studies in the literature, four metrics are used for evaluating the performance of boarding methods when considering social distancing and the overall boarding process: the boarding time, the aisle seat risk, the window seat risk, and the number of type three seat interferences.
The boarding time is the time between when the first passenger arrives inside the airplane and when the final passenger occupies his/her assigned seat. This measure is one of the most discussed measures in the literature when analyzing the performance of airplane boarding methods [3].
The second and the third metrics measure the health risks for the passengers who are seated and subsequently passed by other (potentially contagious) passengers who are walking down the aisle toward their seats. Depending on the location of the seated passenger, the risk is either an aisle seat risk, for passengers already sitting in aisle seats, or a window seat risk, for passengers already sitting in window seats. Both risks are measured in terms of the duration of potential exposure. The duration of exposure for each seated passenger is the sum of all times that later boarding passengers are standing (whether walking or waiting) in the row of the seated passenger. These durations are then aggregated across all previously seated passengers.
The formulas used to calculate the aisle seat risk and window seat risk are as follows [10,11,12,30]:
where p is the passenger advancing towards his/her seat, r is the row index, RowSitp is the row in which passenger p has a seat, RowTimepr is the time that passenger p spends in row r (this duration begins when passenger p begins to enter row r and concludes when passenger p begins to leave row r; this convention was chosen because a passenger’s nose and mouth are at the front of the passenger), p’ = passenger boarding before passenger p, AisleSeatp’r is 1 if passenger p’ has an aisle seat in row r and 0 otherwise, and WindowSeatp’r is 1 if passenger p’ has a window seat in row r and 0 otherwise.
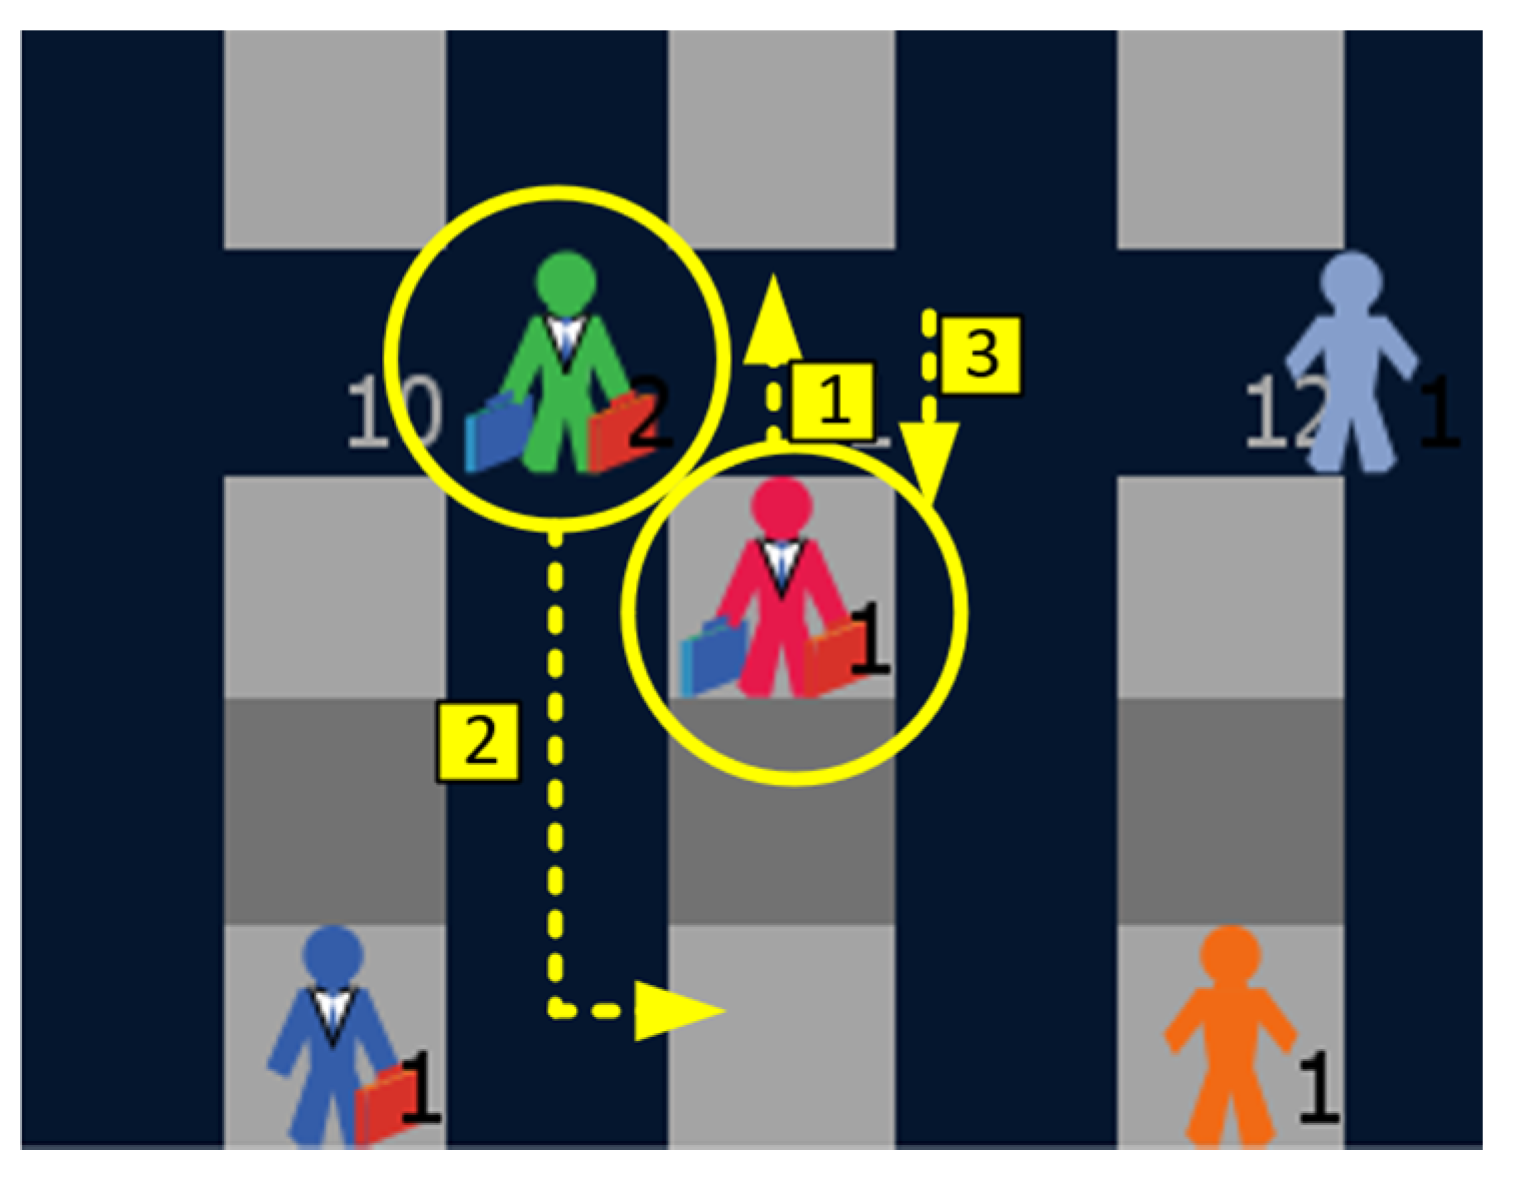
The last metric also involves health risk and refers to the numbers of type three seat interferences. A type three seat interference occurs when a passenger with a window seat arrives near his/her seat after a passenger with the aisle seat located in the same row and on the same side of the aisle has already taken his/her seat [61]. For the passenger with the window seat to take his/her seat, the passenger with the aisle seat needs to stand to clear the first passenger’s path. During this event, if one of the passengers is contagious, the other passenger may become infected. Figure 4 presents a case of type three seat interference between the passenger with the window seat (green) and the passenger with the aisle seat (red). For the passenger colored in green to occupy his/her seat, three moves are needed. First, the passenger with the aisle seat needs to leave his/her seat. Secondly, the window seat passenger sits down. Third, the aisle seat passenger returns to his/her seat.
With the reverse pyramid method, the number of type three seat interferences is always zero. Consequently, the value of the total number of type three seat interferences was extracted in the agent-based model just to confirm that the software was behaving properly. As all the variants of the reverse pyramid method had zero for this indicator due to the boarding method rules, the indicator is not mentioned in the remainder of this paper.
4. Methods
In the following section, we present the main features of the agent-based model, the full grid search algorithm, and the local search optimization method applied to determine the number of passengers to board and their seat assignments in each of the three reverse pyramid method boarding groups.
4.1. Agent-Based Model Implementation
Agent-based modelling has been used in various applications featuring the simulation of human behavior in a given environment [62,63,64,65,66,67,68,69,70]. Multiple platforms are available for designing an agent-based model. We selected NetLogo for the airplane boarding model because it provides advantages related to the graphical interface, ease in understanding and modifying the code, free access to the software and various models developed by the agent-based community, ease of installation, and real-time user access to the state of agents, which is a valuable tool in the process of calibrating the model [71,72,73,74]. NetLogo has been used over time in research applications featuring human movement in different indoor and outdoor settings [65,66,75,76,77,78].
The agents we use in the model had the main characteristics presented in [10,20,22,24,25]. We used two types of agents: patch agents for building the inside area of the airplane and turtle agents for representing the passengers heading to their assigned seats.
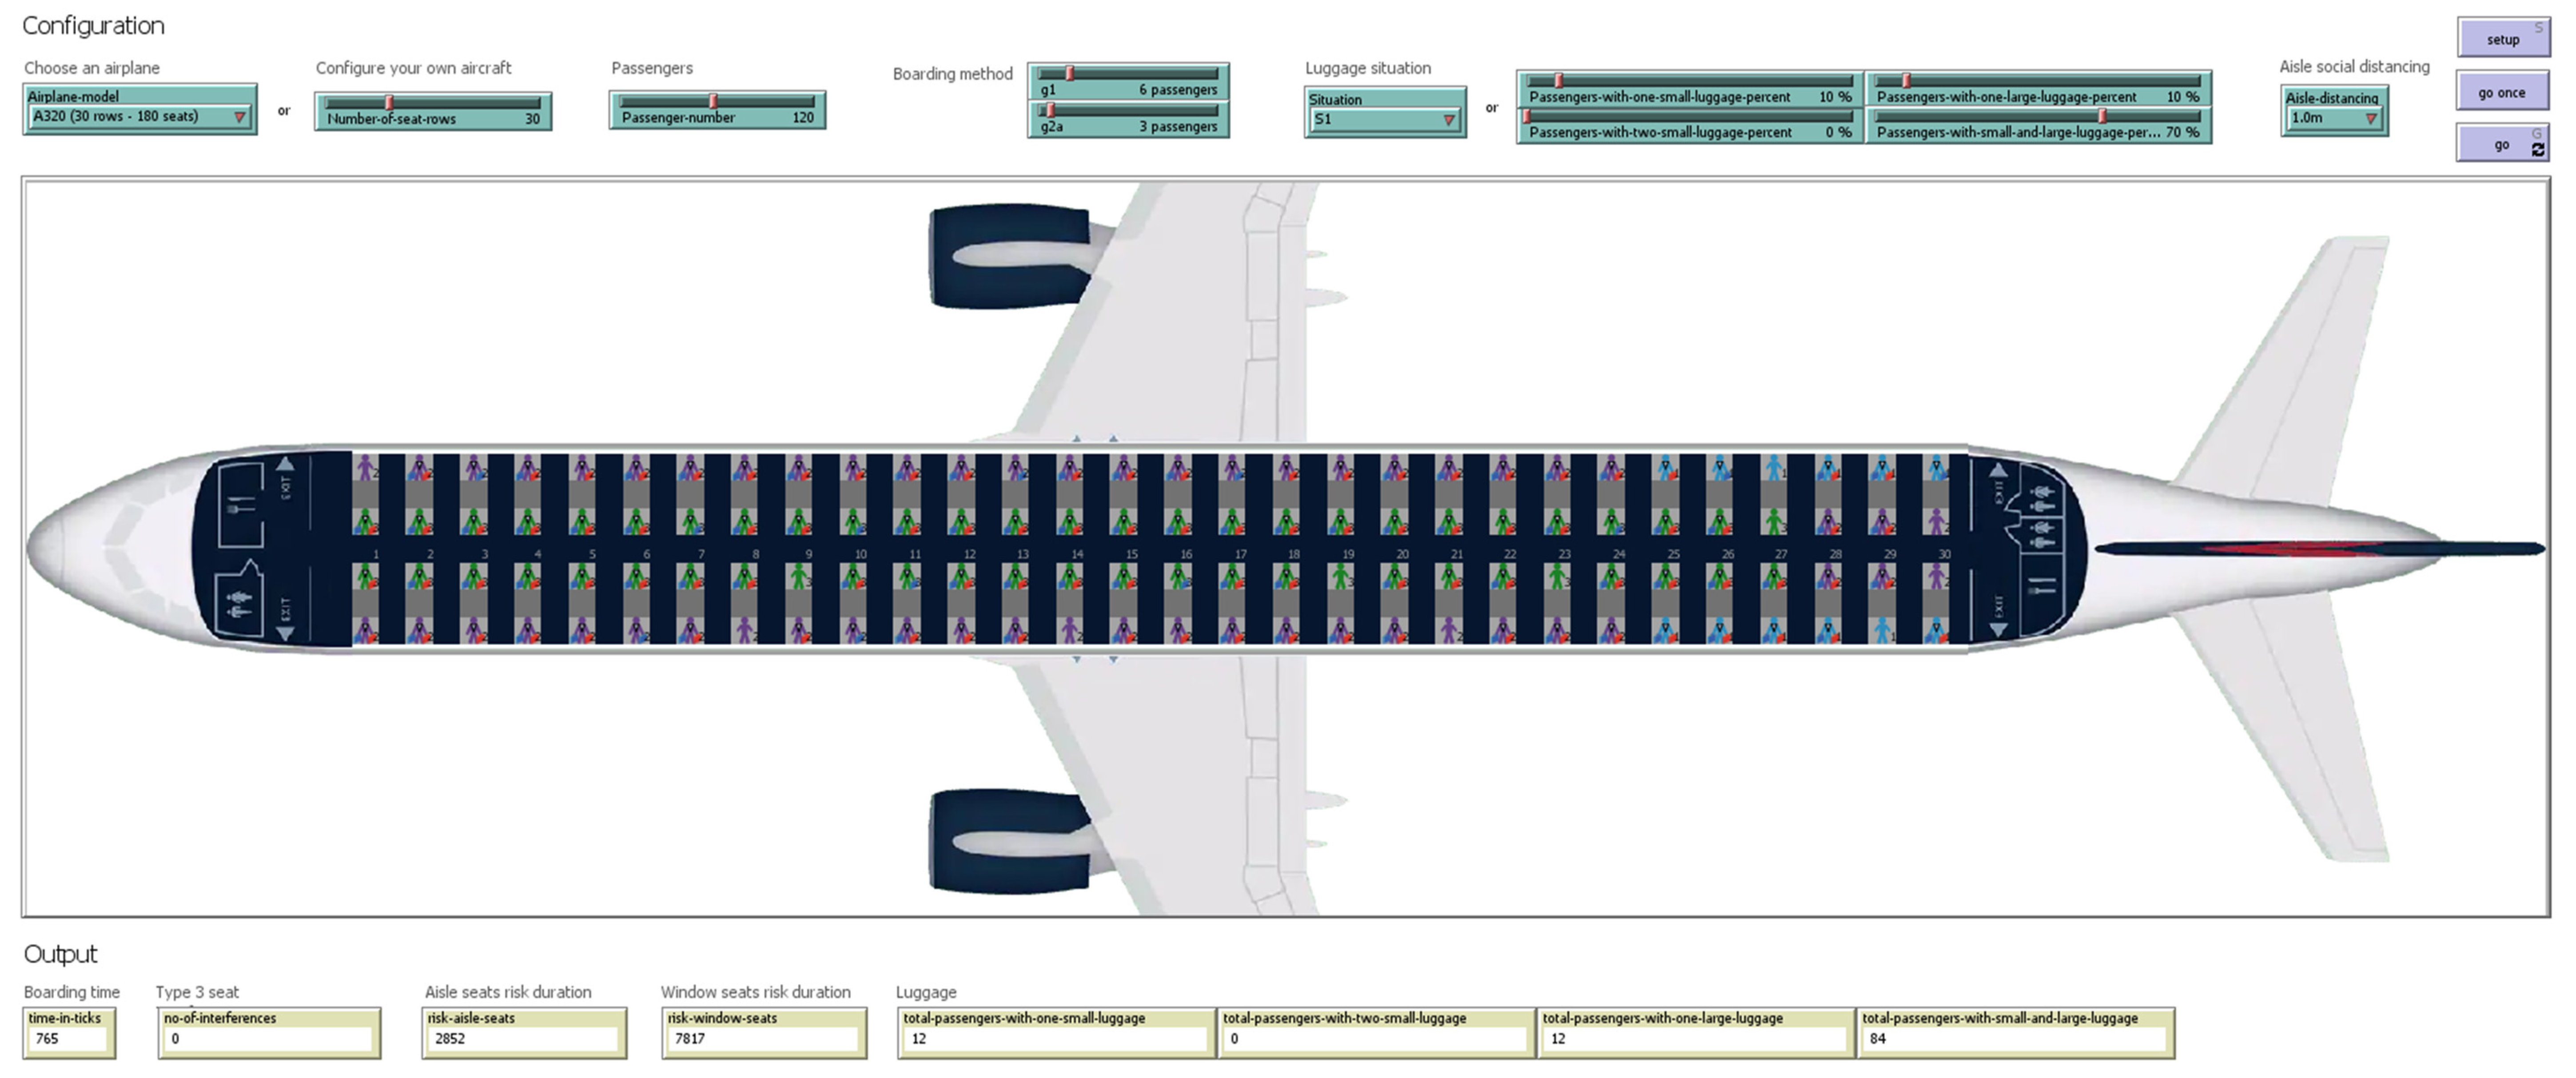
Based on the literature, each of the patch agents in the model reproduced a spatial dimension equivalent to 0.4 × 0.4 m in real life [79,80,81]. Using the possibility offered by NetLogo of setting different characteristics to the agents, in the model, different colors were assigned to the patches to represent various object from the airplane cabin such as the aisle and seats. As a result, the walkable areas were represented in dark blue, the seats to be taken by the passengers in light grey, and the empty middle seats in dark grey, as illustrated in the model’s graphical user interface (GUI) presented in Figure 5. The airplane was symmetrical with respect to the aisle, so all the rules that apply on one side of the aisle applied for the other side of the aisle [24].
The turtle agents had various speeds to account for the various physical characteristics of the passengers that could vary due to gender, weight, age, and mobility [10]. The speeds were extracted from field trials [79] and were translated from meters/second into patches/tick using the correspondence of one tick to 1.2 s [22], because the tick is the time unit in NetLogo.
We know from our personal experiences and common sense that it takes longer for a passenger to traverse the aisle of an airplane when carrying luggage than when not carrying luggage, and furthermore, that the impact of the luggage on passenger speed varies. Consequently, for passenger agents carrying luggage, their speed was reduced to 0.6–0.9 patch/tick (modeled with the uniform probability distribution) [10]. TA variable, Tstore, measures the time needed by an agent to store luggage in the overhead bin, as suggested by [82], and used in the below equation, as done in [8,20,22,25,48].
where Tstore is the time to store the luggage, NbinLarge is the number of large bags in the bin prior to the passenger’s arrival, NbinSmall is the number of small bags in the bin prior to the passenger’s arrival, NpassengerLarge is the number of large bags carried by the passenger, NpassengerSmall is the number of small bags carried by the passenger, and Trow is the time for a passenger to walk from one row to the next (when not delayed by another passenger in front).
We do not assert that this equation provides an accurate estimate of the time it takes a passenger to store luggage in an overhead bin. However, this equation has several favorable properties. The greater the values of NbinLarge, NbinSmall, NpassengerLarge, and NpassengerSmall, the longer the time to store luggage. The longer it takes a passenger to traverse a row (Trow), the longer it takes the same passenger to store the same luggage (as it is reasonable to assume that walking speed is related to the agility and fitness involved in storing luggage). For example, consider an elderly person with short legs versus a fit young and tall person. The young person would walk faster and store luggage more quickly than the elderly person. The multiplication within the equation is consistent with the principle that the time it takes a person to store two pieces of luggage is greater than twice the time it takes the same person with one piece of luggage to store it. That is because when a passenger carries two bags of luggage, either one bag is put down before storing the other or the first bag is stored using only a single hand.
The simulation began at time zero when the first passenger agent entered the airplane using the front door and concluded when the final passenger to sit had occupied its seat. While walking down the aisle, all the agents maintained a minimum aisle social distance between each other of 2.5 patches, corresponding to 1 m.
Upon arriving near its seat, the passenger agent placed its carry-on luggage, if any, in the overhead bin and then took its seat. While placing the luggage, the agent halted the progress of any later boarding agents that were in the aisle within a distance of 2.5 patches.
4.2. Adaption of Reverse Pyramid for Social Distancing and Unequal Group Sizes
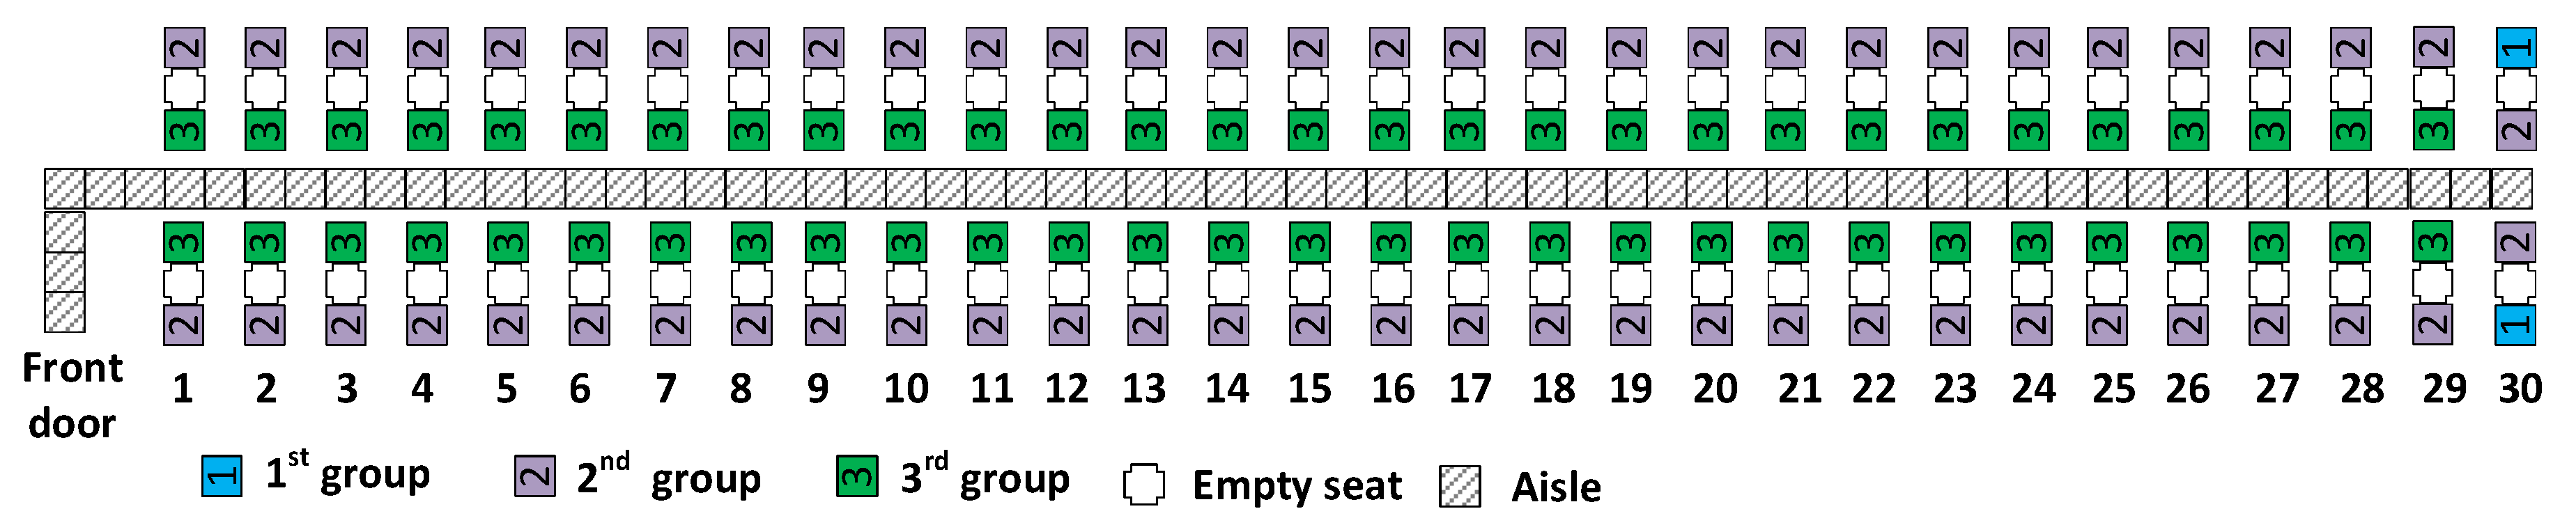
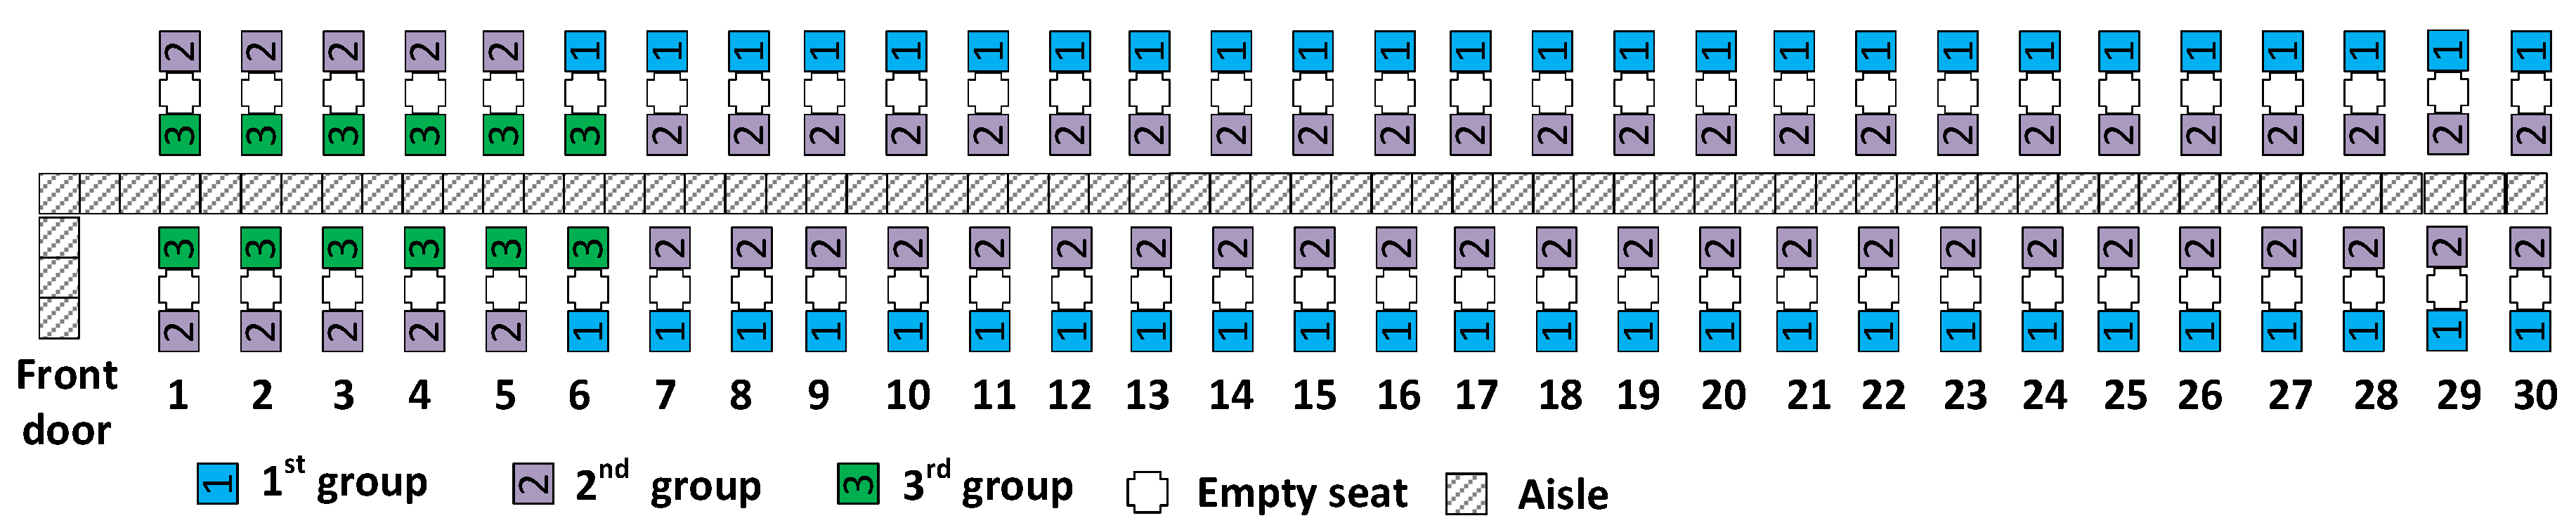
With the reverse pyramid—adapted for social distancing—and three boarding groups, the first group to board contains window seat passengers seated closest to the rear of the airplane, and the third group to board contains aisle seat passengers seated closest to the front of the airplane. The second group to board contains the remaining window and aisle seat passengers, with the second group’s window seat passengers having seats closest to the front of the airplane and its aisle seat passengers having seats closest to the rear of the airplane.
When experimenting with reverse pyramid methods using apron buses, the authors [12] found that the health risk of aisle seated passengers is lowest when both aisle seat passengers of a given row are in the same boarding group and found no advantage for any performance metric when they were in different boarding groups. Likewise, in this paper, we assumed that both aisle seat passengers of a given row would be assigned to the same boarding group. Similarly, we assumed that both window seat passengers of a given row would be assigned to the same boarding group.
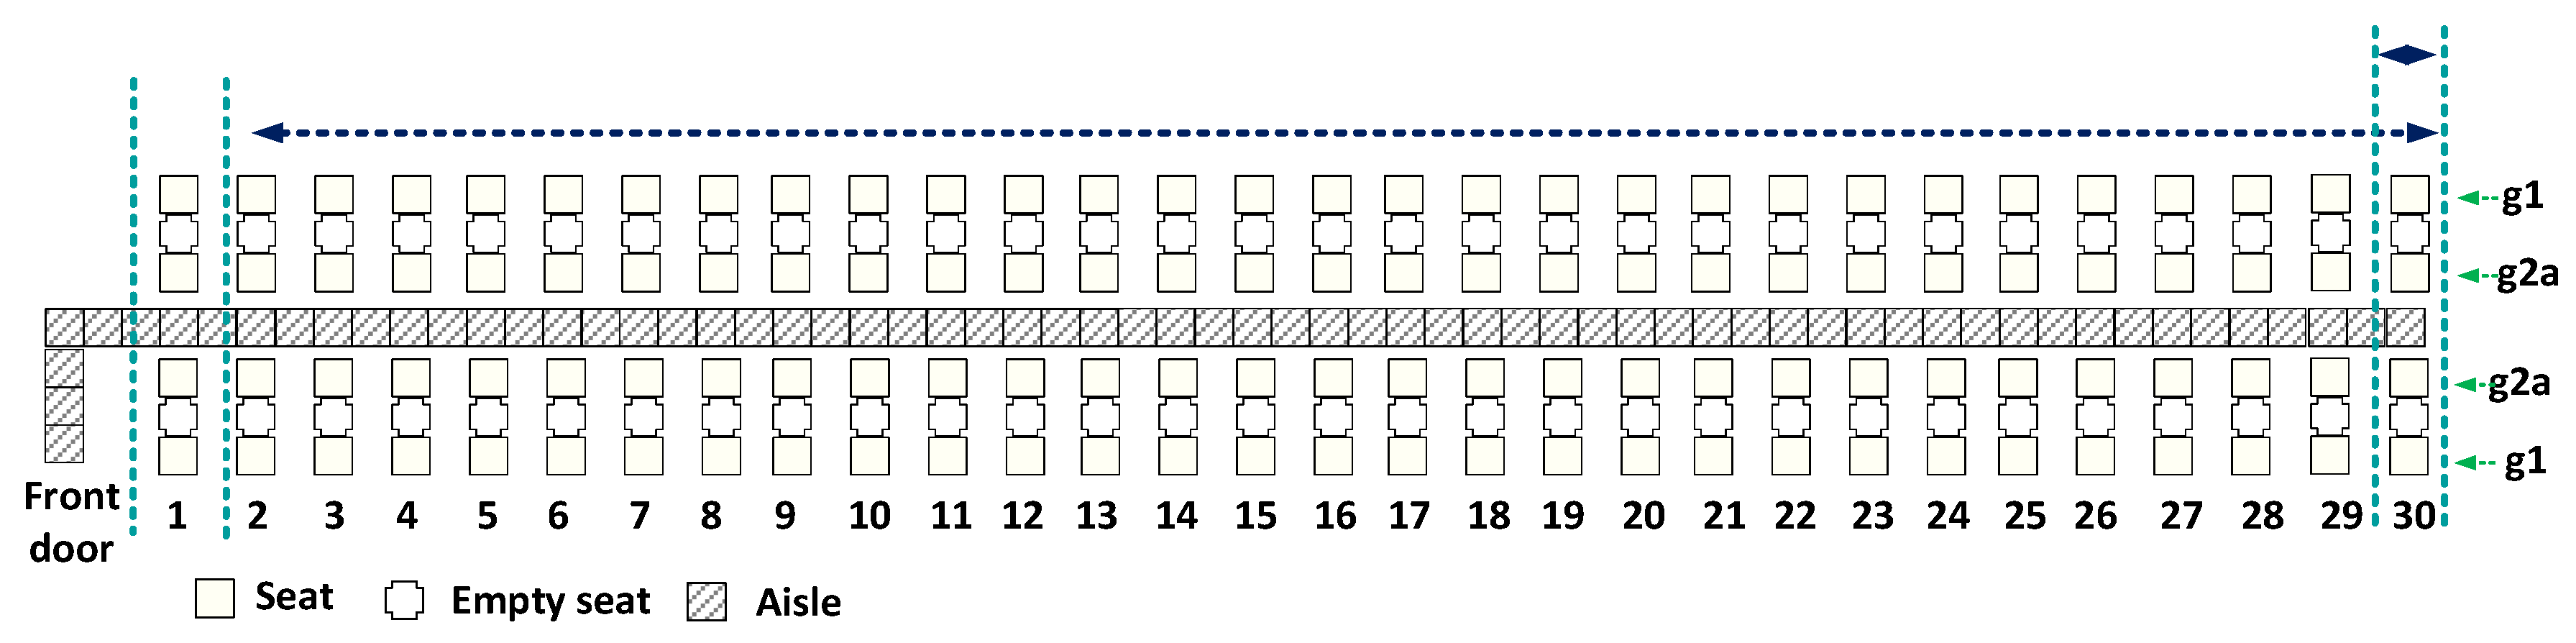
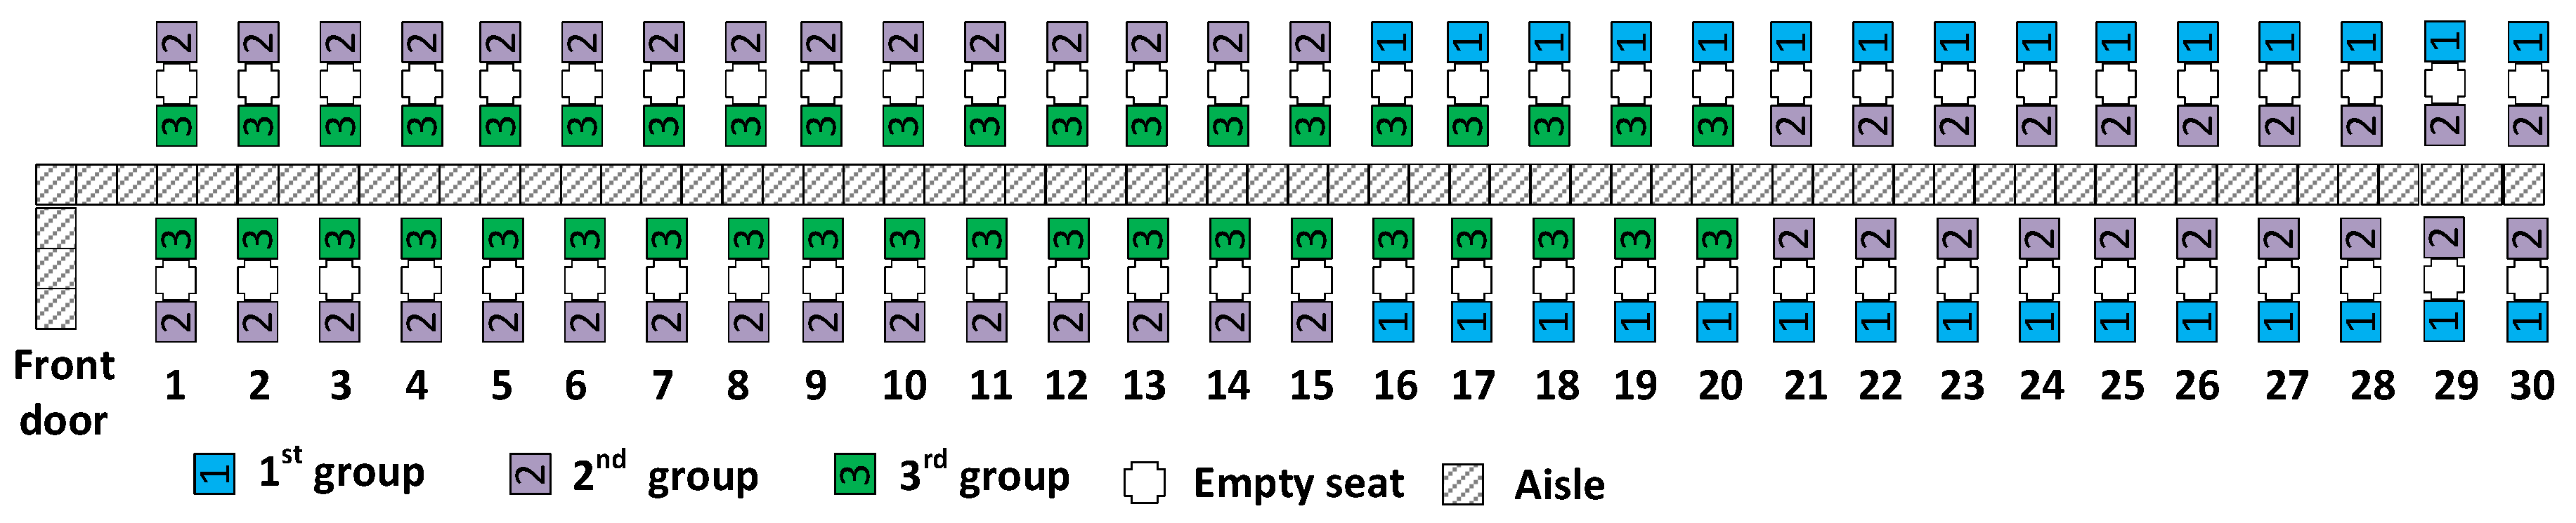
Consequently, there were two decision variables (user input parameters) that we varied in our simulation experiments: g1 and g2a. The first variable, g1, provided the model with the number of seats to be allocated to the first group on each side of the aisle. Because the first group only contains window seat passengers, the total number of passengers assigned to the first group was decided to be G1 = 2 × g1. These were the window seat passengers sitting closest to the rear of the airplane. The second variable, g2a, provided the model with the number of aisle seat passengers on each side of the aisle assigned to the second boarding group. These seats were on both sides of the aisle starting from the rear of the airplane. With 30 rows of seats in the airplane, the total number of seats assigned to the second group was decided to be G2 = (g2a + 30 − g1) × 2. The third boarding group comprised passengers in the remaining aisle seats. The number of passengers in this third group was decided to be G3 = (30 − g2a) × 2.
The decision variables g1 and g2a had to satisfy the following constraints:
- g1 > 0, g2a > 0, integers.
- g2a ≤ g1 (within a row, window seat passengers board before aisle seat passengers).
- g1 ≤ 29 for a 30-row airplane (because otherwise there are not three boarding groups).
We illustrate the last two constraints in Figure 6, where g1 and g2a could vary to cover up to the final 29 rows of the airplane. Additionally, a case where g1 = 6 and g2a = 3 is depicted in Figure 5.
Figure 7 presents the case when g1 and g2a have their smallest feasible values. Figure 8 presents an arbitrarily selected case depicted for g1 = 15 and g2a = 10. Figure 9 present the case when g1 and g2a have their largest feasible values.
During the simulation process, the model recorded the values for the operational and risk indicators: boarding time, aisle seats, and window seat risks—all expressed in ticks. The model was configurable with respect to the type of the airplane, the number of passengers, and the quantity of luggage brought inside the airplane by the passengers.
4.3. Full Grid Search for Finding a Good Starting Point for the Local Search
To find a good starting point for the local search, we conducted a full grid search with all 435 feasible combinations—those satisfying the constraints mentioned above—starting with g1 = 1 and g2a = 1 and then ending with g1 = 29 and g2a = 29. Each combination was initially simulated 1000 times using the agent-based model in NetLogo. We executed the NetLogo model from a Python script, for which the corresponding pseudo code is provided in Algorithm 1. In total, 435,000 simulation runs were performed during the full grid search to find a good starting point for the local search.
| Algorithm 1. Full-grid-search | |
| in: | number of simulation trials per data point noSimulations |
| out: | boarding metrics for all group configurations m |
| 1: | forg1 = 1 to 29 do |
| 2: | for g2a = 1 to g1 do |
| 3: | m[g1][g2a] ← ABMSimulation(g1, g2a, noSimulations) |
| 4: | end for |
| 5: | end for |
| 6: | |
| 7: | returnm |
To evaluate the efficiency of the 435 variants of the reverse pyramid with three boarding groups, we used the objective function, F, defined as follows as a weighted average of the performance metrics:
where represents the weight of the boarding time criterion on the overall solution, represents the weight of the aisle seat risk criterion on the overall solution, represents the weight of the window seat risk criterion on the overall solution, is the value of the average boarding time in seconds, is the value of the average aisle seat risk duration in seconds, and is the value of the average window seat risk duration in seconds.
Based on the emphasis (weight) placed on each metric, F could take various values. The starting point we used in the local search optimization corresponded to the best (i.e., minimum) value of the function F, which depended on the weighted average results of the 435 variants of g1 and g2a, each with 1000 simulation trials during the full grid search.
4.4. Local Search Optimization Method
The local search optimization method is described in Algorithm 2. Its inputs were the initial group configuration resulting from the full grid search evaluation of Section 4.3, the weights to applied to the three performance evaluation metrics (average boarding time, average aisle seat risk duration, and average window seat risk duration), and the number of simulation trials per input condition. The latter value was 30,000 during the local search.
The method began by conducting 30,000 stochastic simulation runs with the initial group configuration, which was used as the incumbent solution. At each iteration, the method conducted 30,000 stochastic simulation runs for each of the eight points that were feasible neighbors of the incumbent. If the best neighboring solution was not worse than that of the incumbent, then the neighboring solution became the incumbent and the iterations continued until the neighboring points all had worse solutions than the incumbent. The resulting solution was locally optimal—and we suspect globally optimal (or close to it).
Before 30,000 simulations were executed for a neighboring point, a check was made to see if simulations had already been executed for that point. If they had been, then the simulations were not repeated.
| Algorithm 2. Local Search Optimization Method | |
| in: | initial boarding group configuration <g1′, g2a’>; weights of average boarding time, average aisle seat risk duration, and average window seat risk duration w1, w2 and w3; number of simulation trials per condition tested noSimulations |
| out: | group configuration having the minimum weighted average duration; the group’s weighted average duration |
| {initialize the boarding metrics for all group configurations with NIL} | |
| 1: | forg1 = 1 to 29 do |
| 2: | for g2a = 1 to g1 do |
| 3: | m[g1][g2a] ← NIL |
| 4: | end for |
| 5: | end for |
| 6: | |
| 7: | m[g1′][g2a’] ← ABMSimulation(g1′, g2a’, noSimulations) {boarding metrics determined using NetLogo simulations} |
| 8: | |
| 9: | minWeightedAverage ← w1 * duration(m[g1′][g2a’]) + w2 * aisleRisk(m[g1′][g2a’]) + w3 * windowRisk(m[g1′][g2a’]) |
| 10: | minWeightedAverageConfiguration ← <g1′, g2a’> |
| 11: | |
| 12: | Repeat |
| 13: | neighborMinWeightedAverage ← ∞ |
| 14: | neighborWithMinWeightedAverage ← NIL |
| 15: | <x, y> ← minWeightedAverageConfiguration |
| 16: | |
| 17: | for i in {-1, 0, 1} do |
| 18: | for j in {-1, 0, 1} do |
| 19: | if i != 0 or j != 0 then |
| 20: | if (x + i ≥ y + j) and (x + i ≥ 1) and (y + j ≥ 1) and (x + i ≤ 29) then |
| 21: | if m[x + i][y + j] = NIL then {avoid reanalyzing configurations} |
| 22: | m[x + i][y + j] ← ABMSimulation(x + i, y + j, noSimulations) {store the boarding metrics} |
| 23: | |
| 24: | neighborWeightedAverage ← w1 * duration(m[x + i][y + j]) + w2 * aisleRisk(m[x + i][y + j]) + w3 * windowRisk(m[x + i][y + j]) |
| 25: | |
| 26: | if neighborWeightedAverage < neighborMinWeightedAverage then |
| 27: | neighborMinWeightedAverage ← neighborWeightedAverage |
| 28: | neighborWithMinWeightedAverage ← <x+i, y+j> |
| 29: | end if |
| 30: | end if |
| 31: | end if |
| 32: | end if |
| 33: | end for |
| 34: | end for |
| 35: | |
| 36: | if neighborMinWeightedAverage ≤ minWeightedAverage then |
| 37: | minWeightedAverage ← neighborMinWeightedAverage |
| 38: | minWeightedAverageConfiguration ← neighborWithMinWeightedAverage {update the best configuration} |
| 39: | end if |
| 40: | |
| 41: | untilneighborMinWeightedAverage > minWeightedAverage |
| 42: | |
| 43: | returnminWeightedAverageConfiguration, minWeightedAverage |
5. Numerical Simulation Results
We investigated four cases that had different values of the weights applied to the performance metrics. For each case, an initial solution that worked best (averaged over its 1000 simulation trials) according to the weighted objective function F was determined by considering the metrics provided by the full grid search. This combination of g1 and g2a values was used as the starting point for the local search method. Because the local search conducted 30,000 simulation runs for each point examined, its resulting solution was more accurate than that of the full grid search that conducted 1000 simulation runs for each point examined. The resulting local search solution provided the values of g1 and g2a for reverse pyramid with three passengers groups for the selected weights that had the lowest value found for the objective function F.
5.1. Simulation Results for w1 = 100%, w2 = 0%, and w3 = 0%
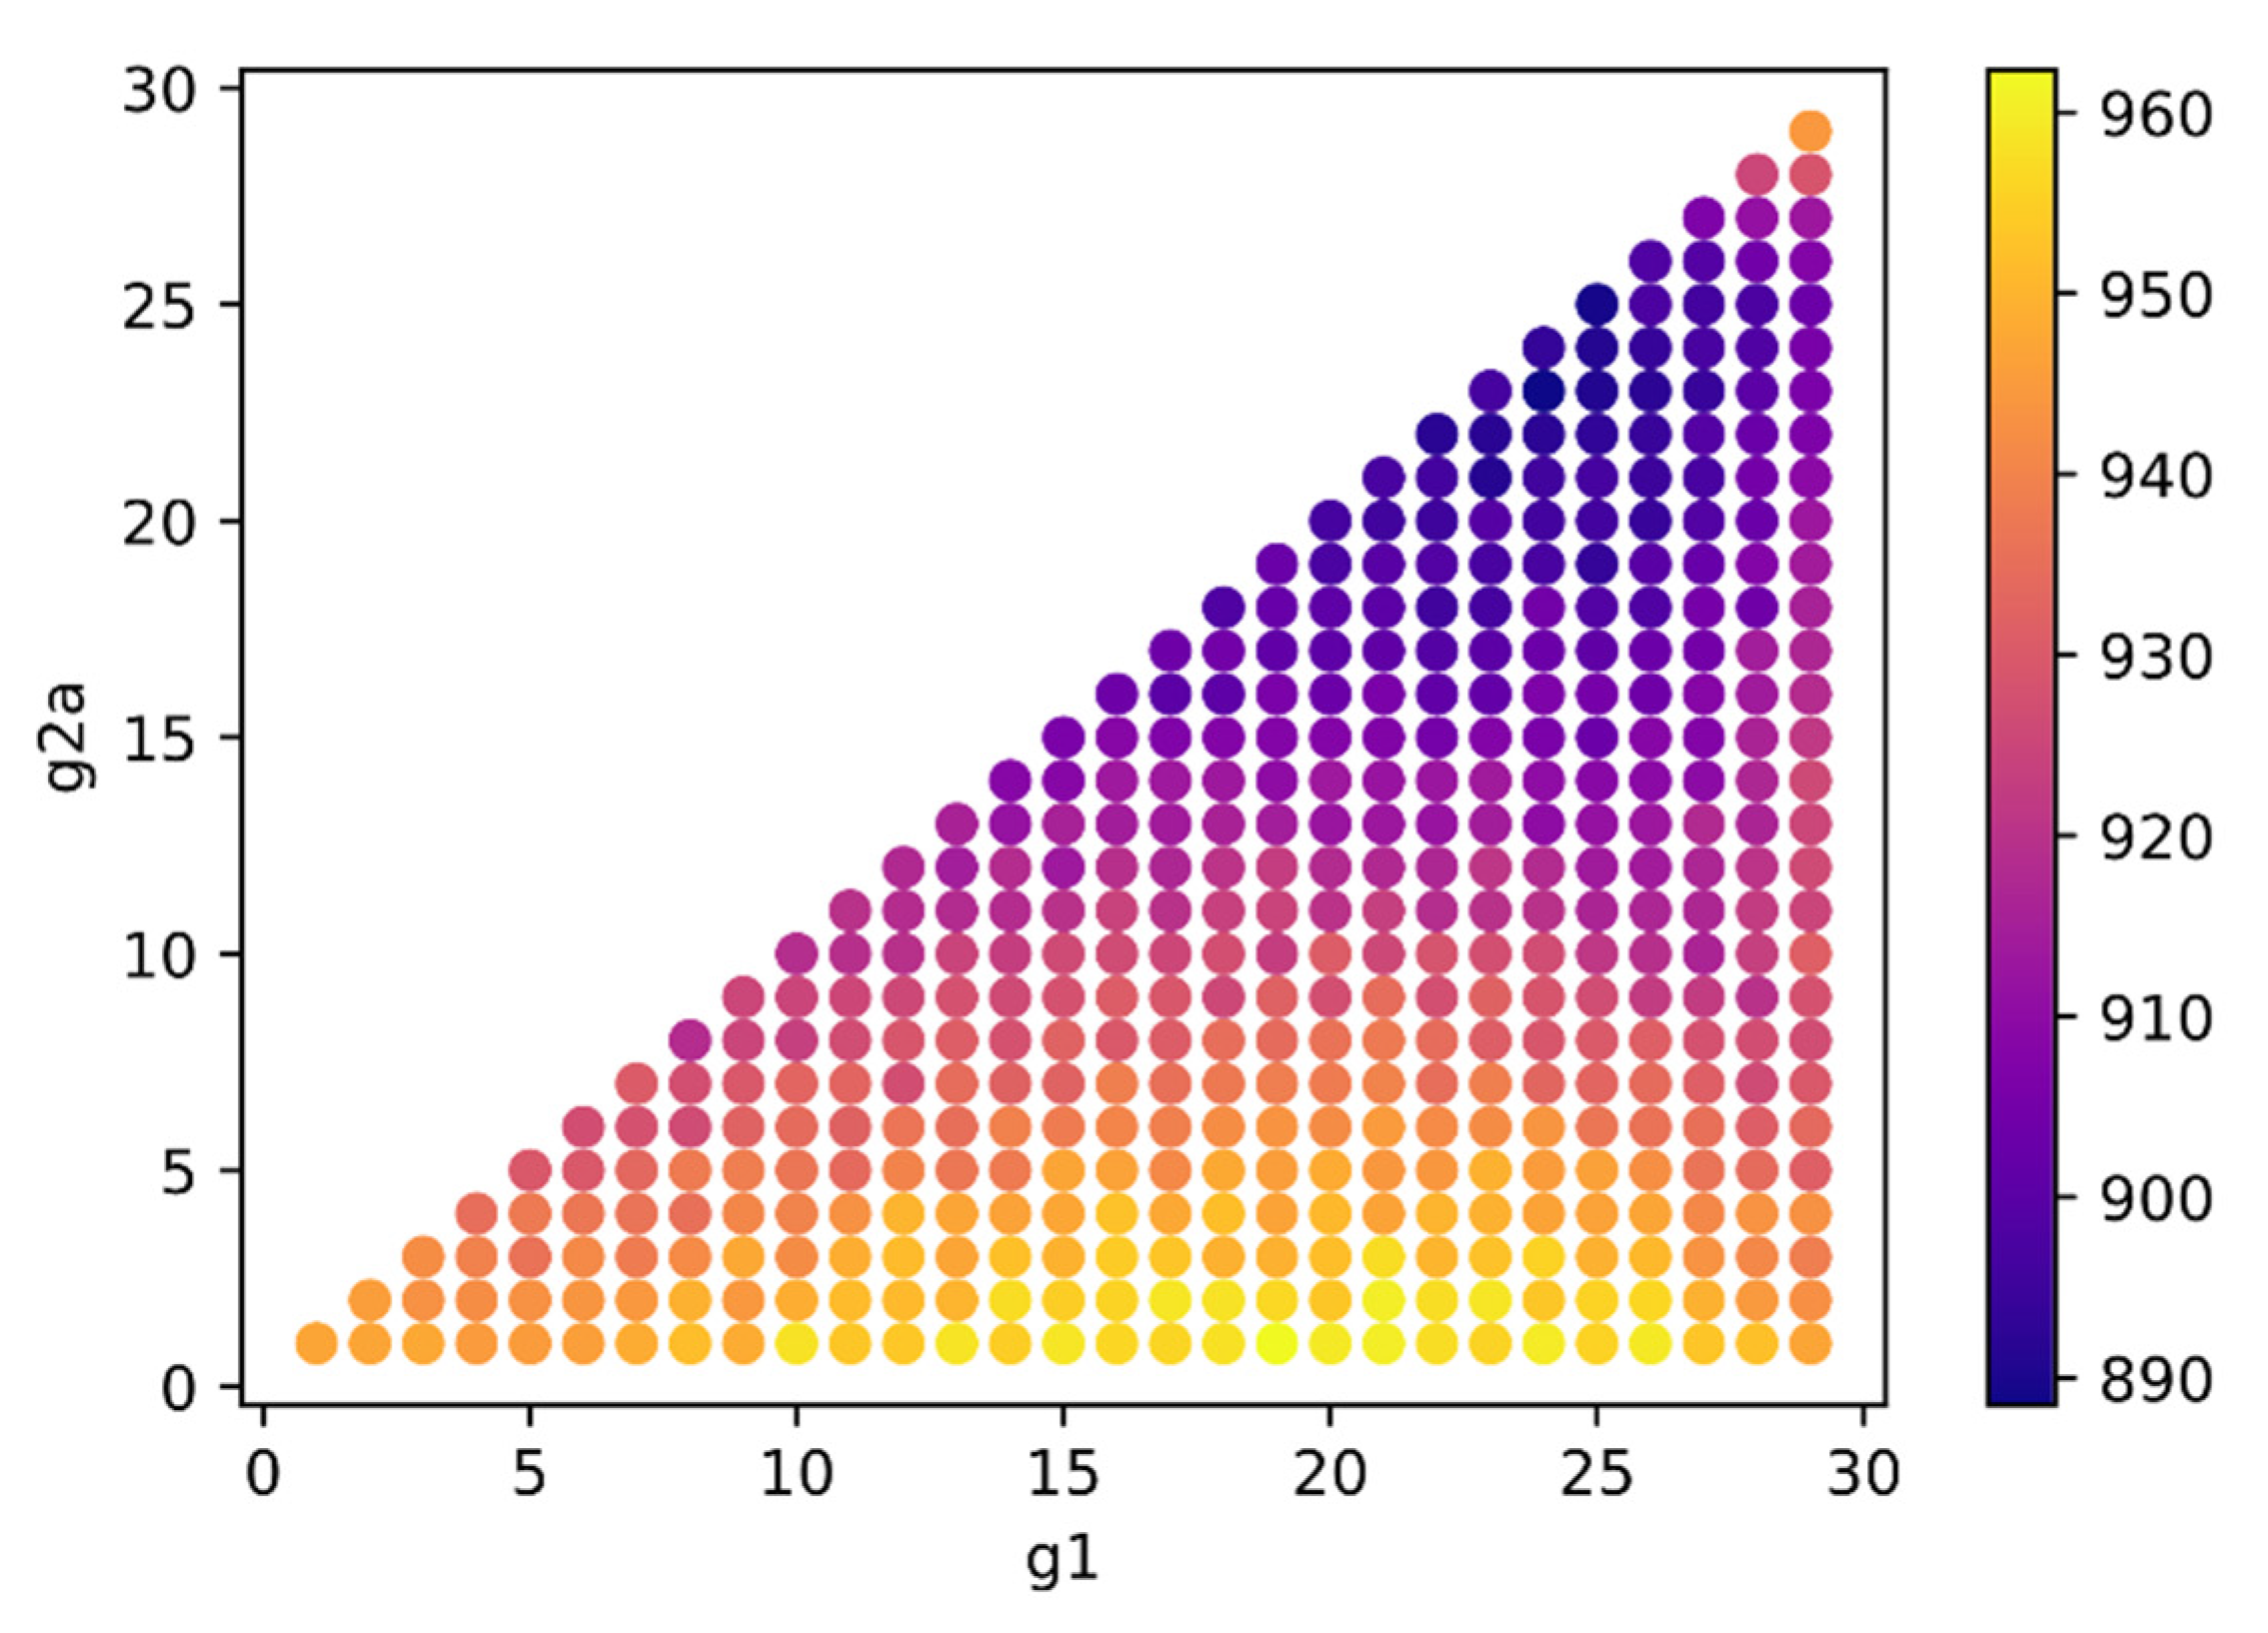
The first case we examined, C1, had a 100% weight for the average boarding time performance metric and zero weight for the other performance metrics. This weight would be applicable for an airline that cares only about boarding time. Figure 10 presents the values (in colors) of the objective function F determined by the full grid search of the feasible combinations of g1 and g2a. The lowest (most desirable) values obtained for F are depicted in dark blue. Most of these values were encountered when both g1 and g2a ranged between 15 and 28. The highest values of F are depicted in light yellow and resulted from values of g1 between 10 and 26 combined with values of g2a smaller than 3.
Using the best solution provided by the full grid search as a starting point, the local search method was applied, and the results are presented as follows.
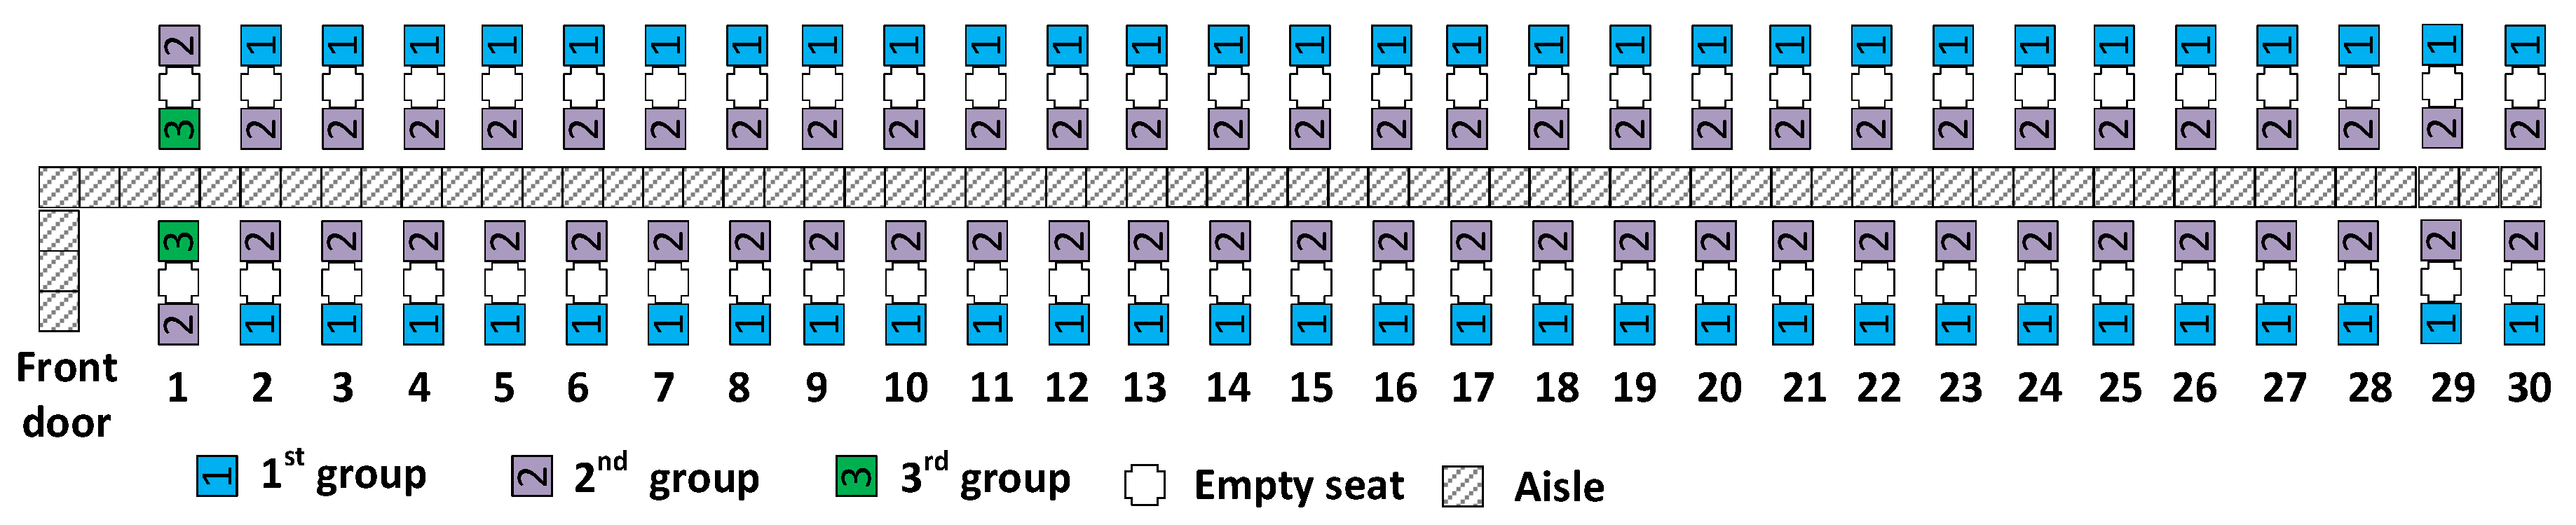
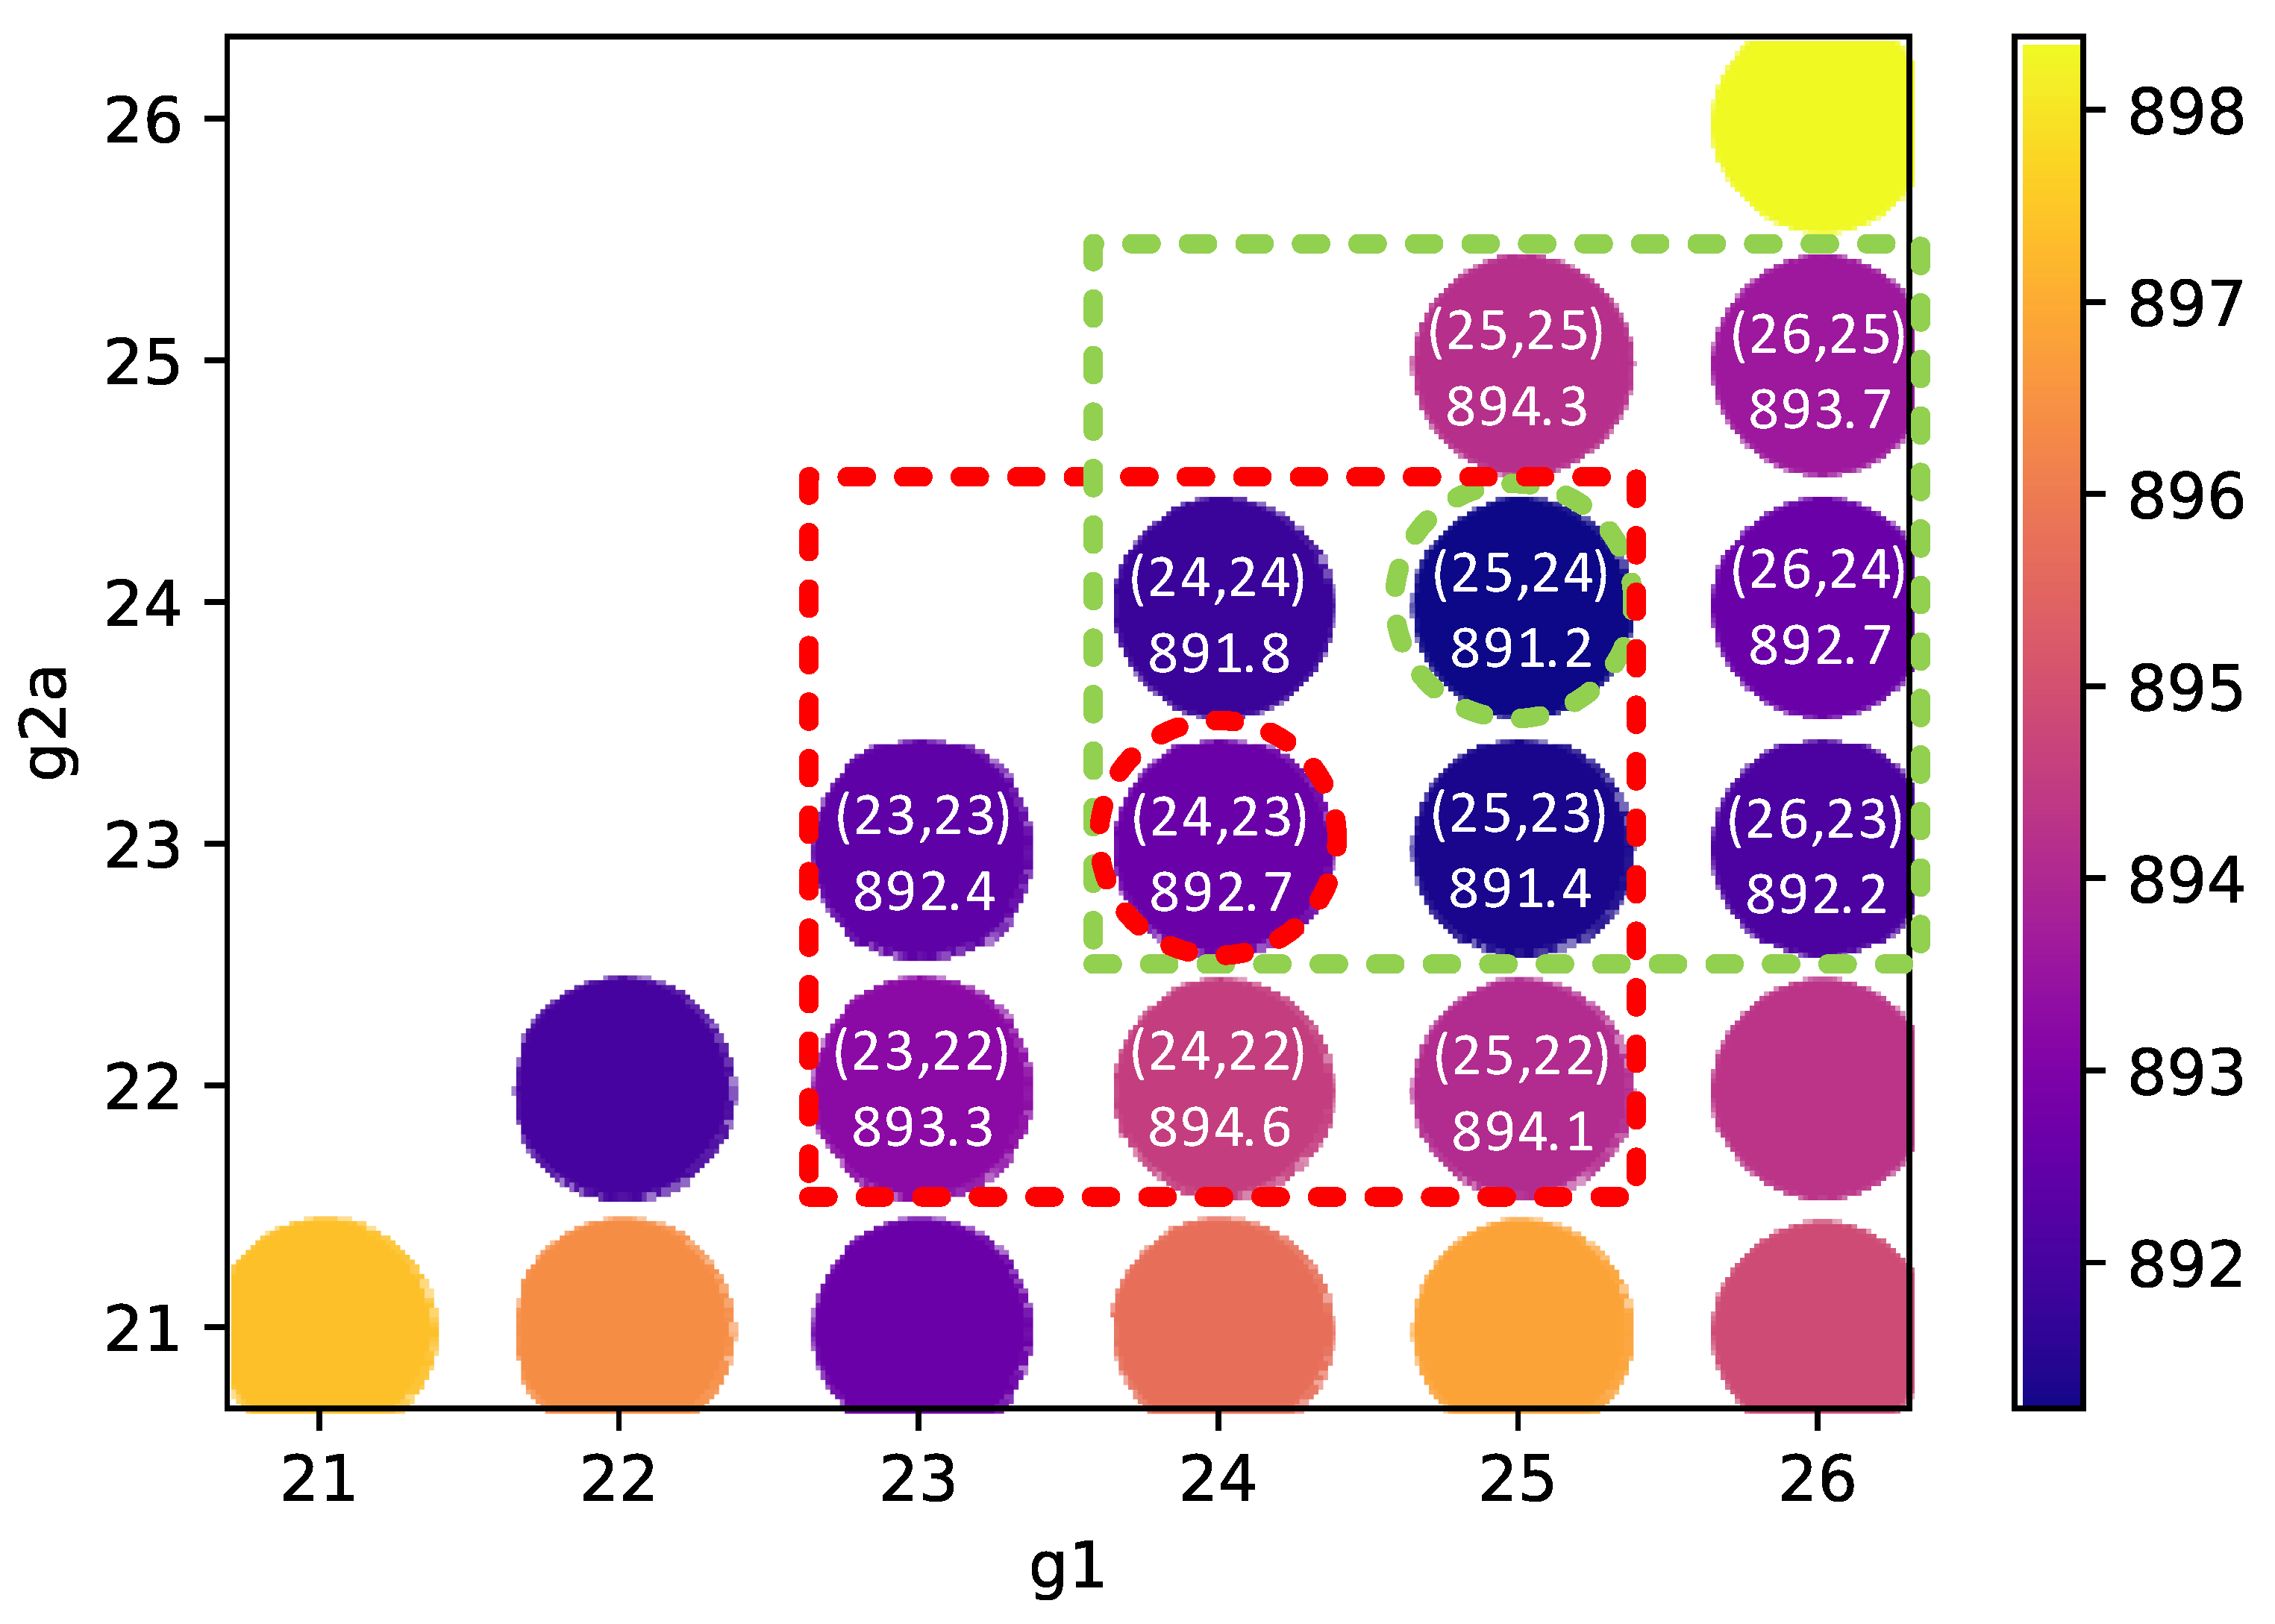
The full grid search provided a starting solution containing the combination g1 = 24 and g2a = 23, to which we refer to using the (24, 23) notation. The value of F for this solution was 892.7 s, as determined with 30,000 simulation runs. The neighboring feasible combinations of (24, 23) for g1 and g2a were (23, 22), (23, 23), (24, 24), (25, 24), (25, 23), (25, 22), and (24, 22). Note that (23, 24) was not a feasible combination because g2a (24) was greater than g1 (23). The starting point for the local search and its neighboring points are marked within the dotted red circle and dotted red square in Figure 11. After performing 30,000 simulation runs for each of the seven neighboring feasible points within the dotted red square, the weighted average minimum for the objective function F was found to be 891.2 s, resulting from g1 and g2a of (25, 24) as noted within the dotted green circle. The next iteration examined that point’s feasible neighboring points (those within the dotted green rectangle), though it ignored those points (within the red square) that were already examined in the previous iteration. All of these newly examined points—(25, 25), (26, 25), (26, 24), and (26, 23)—had higher values for the objective function F than 891.2 s. Consequently, the local search stopped, concluding with the best solution given by the (25, 24) combination, which was equivalent to G1 = 50, G2 = 58, and G3 = 12 seats and is illustrated in Figure 12. This solution resulted in the minimum time to complete boarding of the airplane.
5.2. Simulation Results for w1 = 0%, w2 = 100%, and w3 = 0%
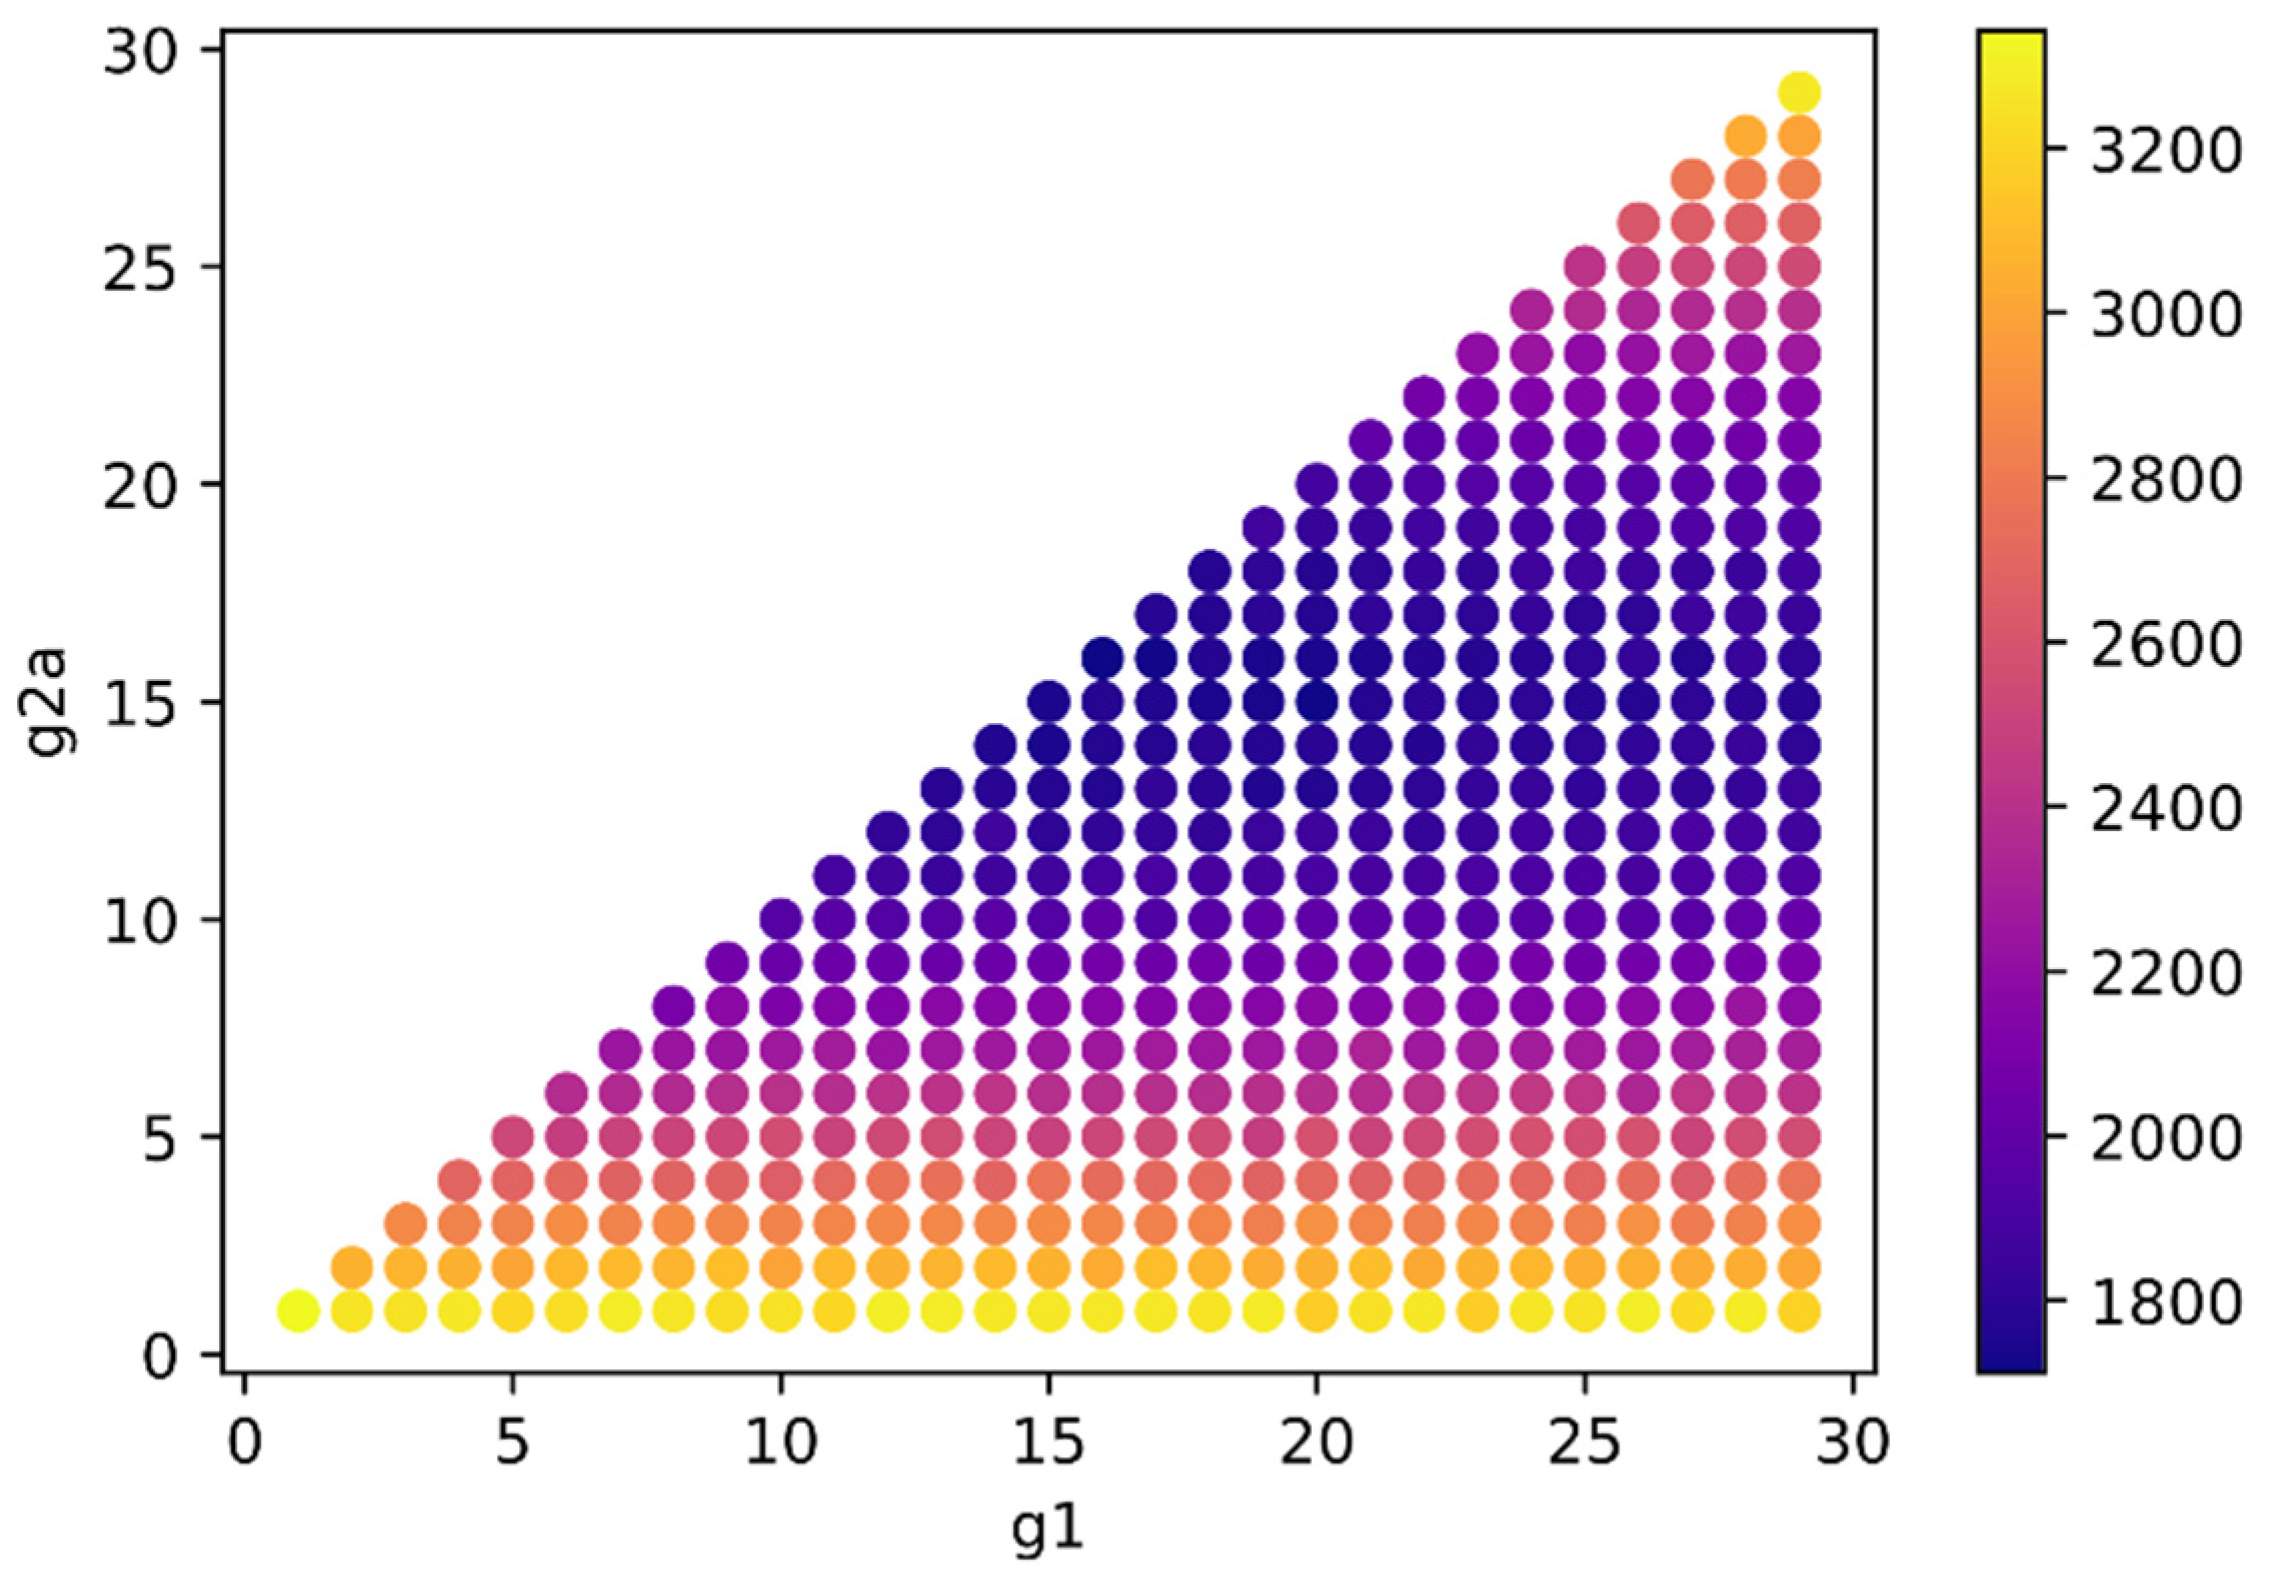
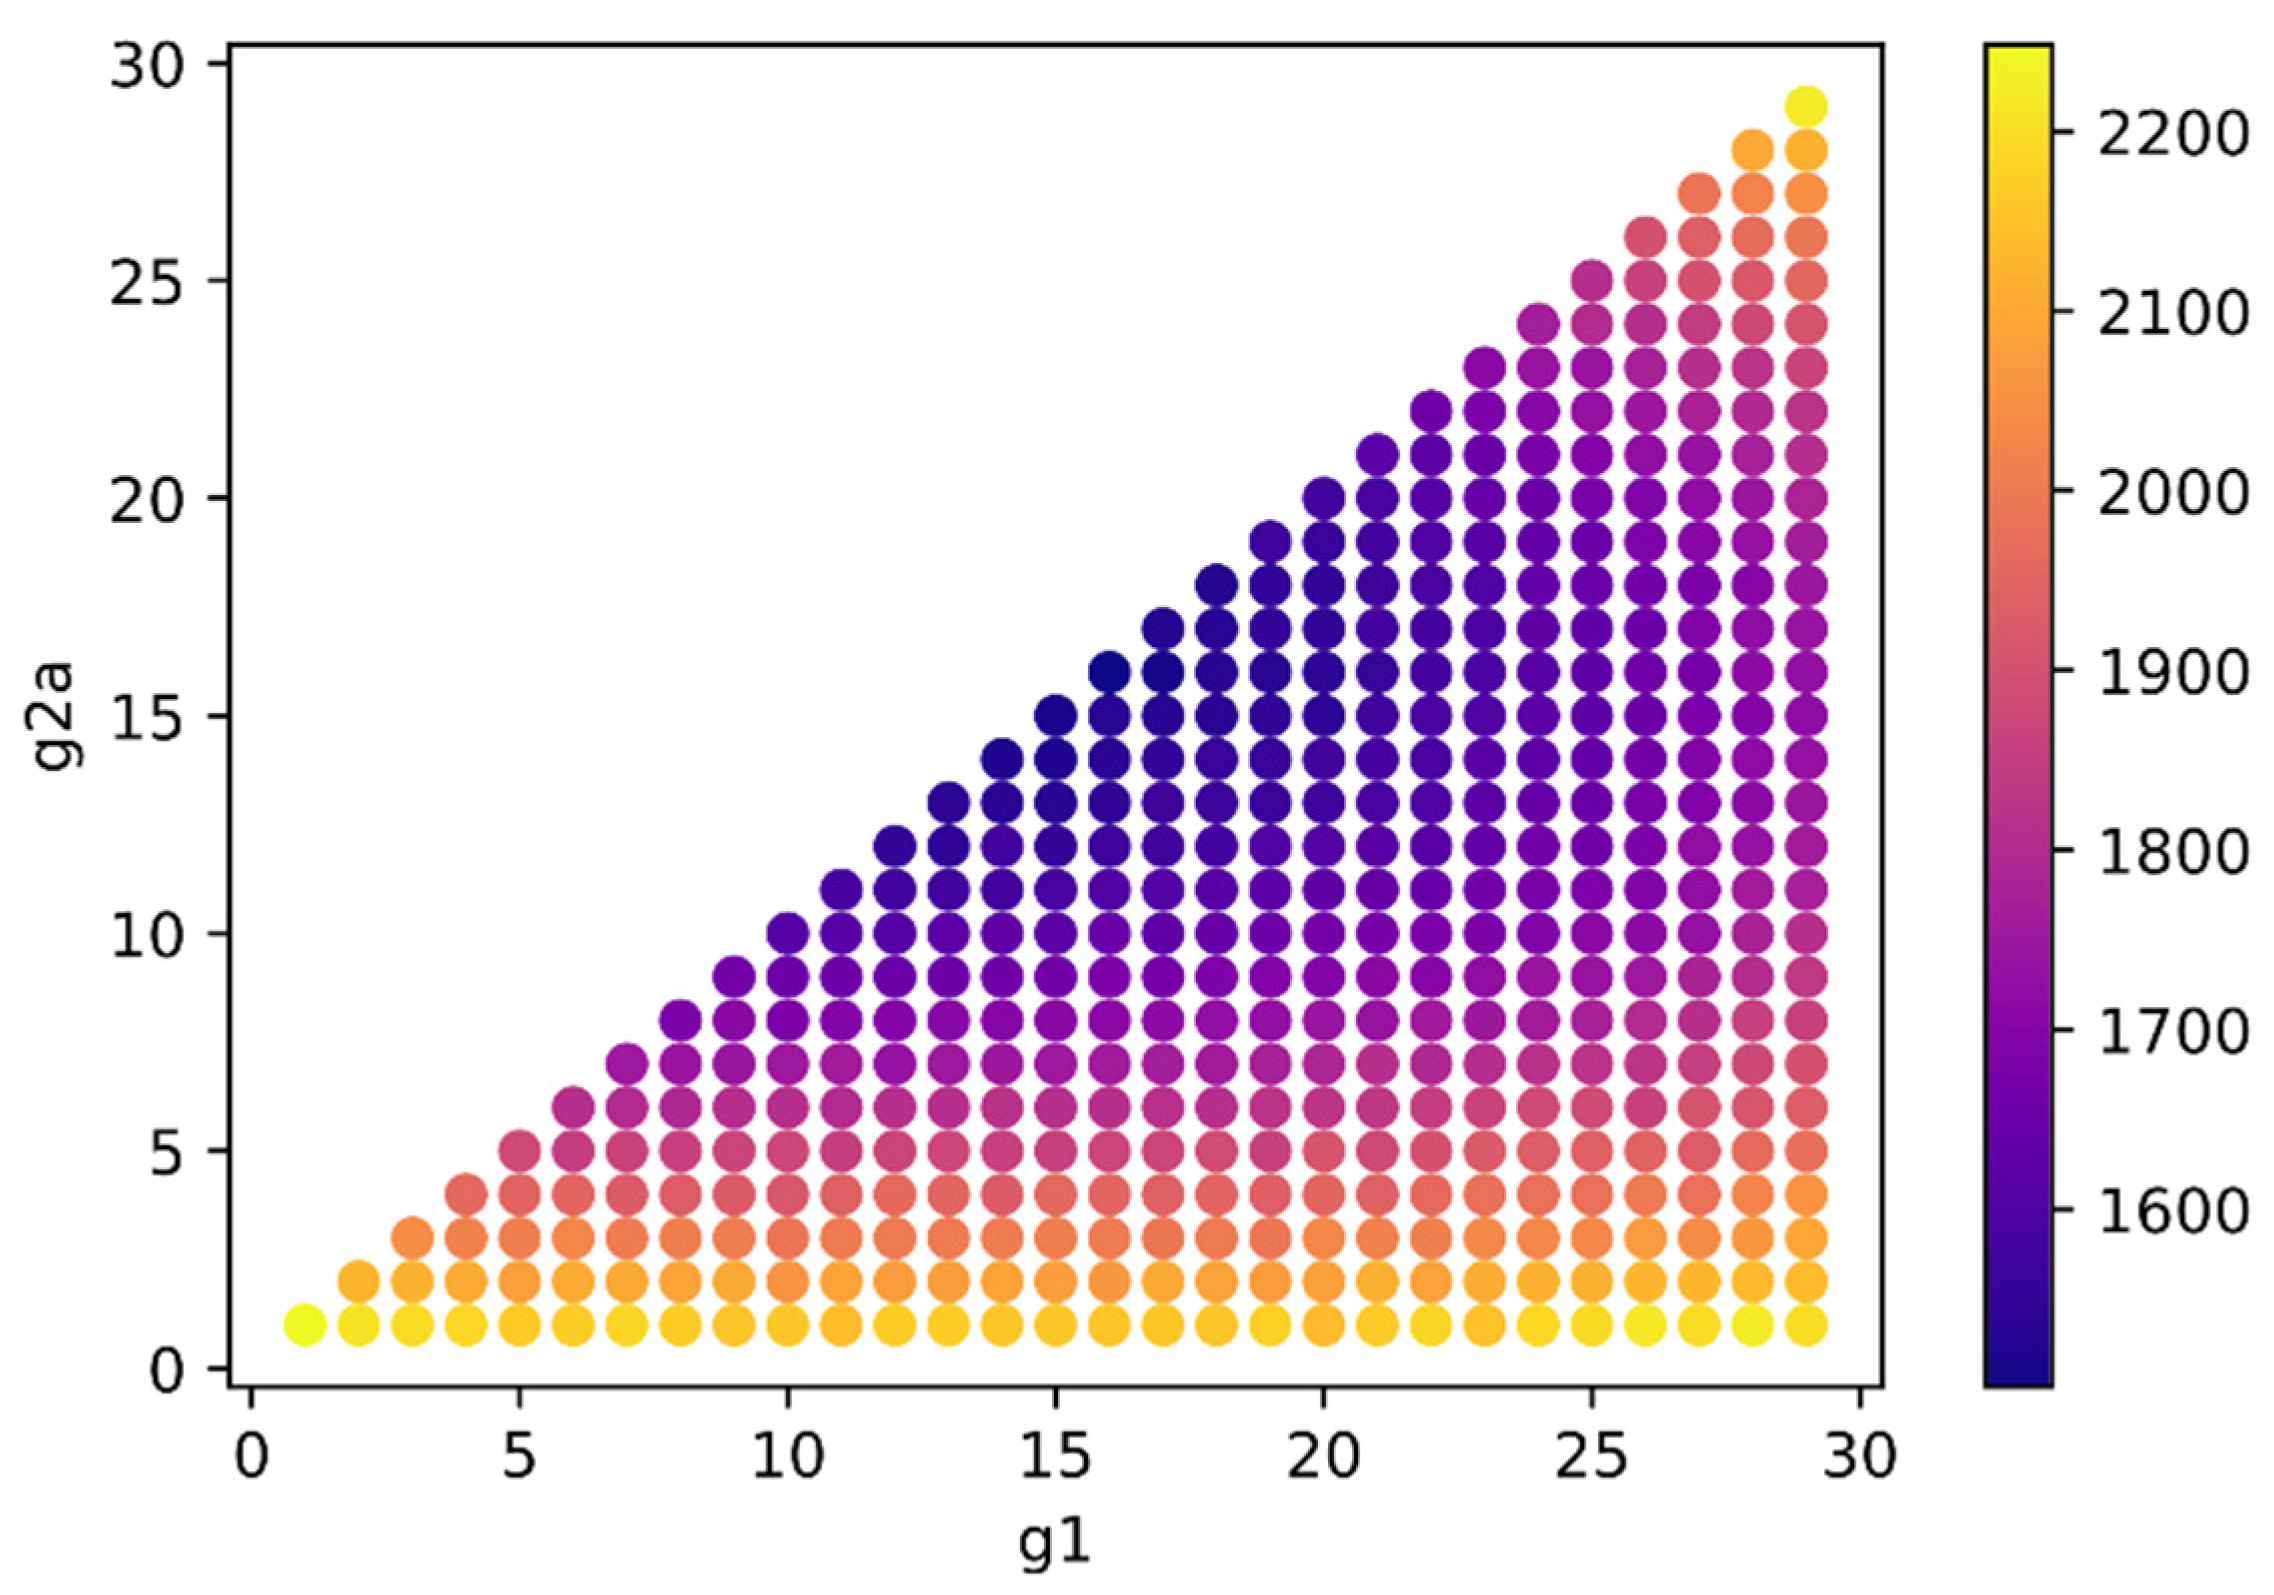
The second case we examined, C2, had a 100% weight for the average aisle seat risk duration and zero weight for the other performance metrics. This weight would be applicable for an airline that cares only about the health risk of those sitting in the aisle from being passed by later (possibly infected) passengers. Figure 13 presents the values of the objective function F for w1 = 0%, w2 = 100%, and w3 = 0%, determined for each full grid combination of g1 and g2a examined. Most of the lowest (dark blue) values for F were encountered when g1 ranged between 15 and 28 and g2a ranged between 10 and 19. The highest values of F are depicted in light yellow and were obtained for any values of g1 that were combined with values of g2a equal to either 1 or 29.
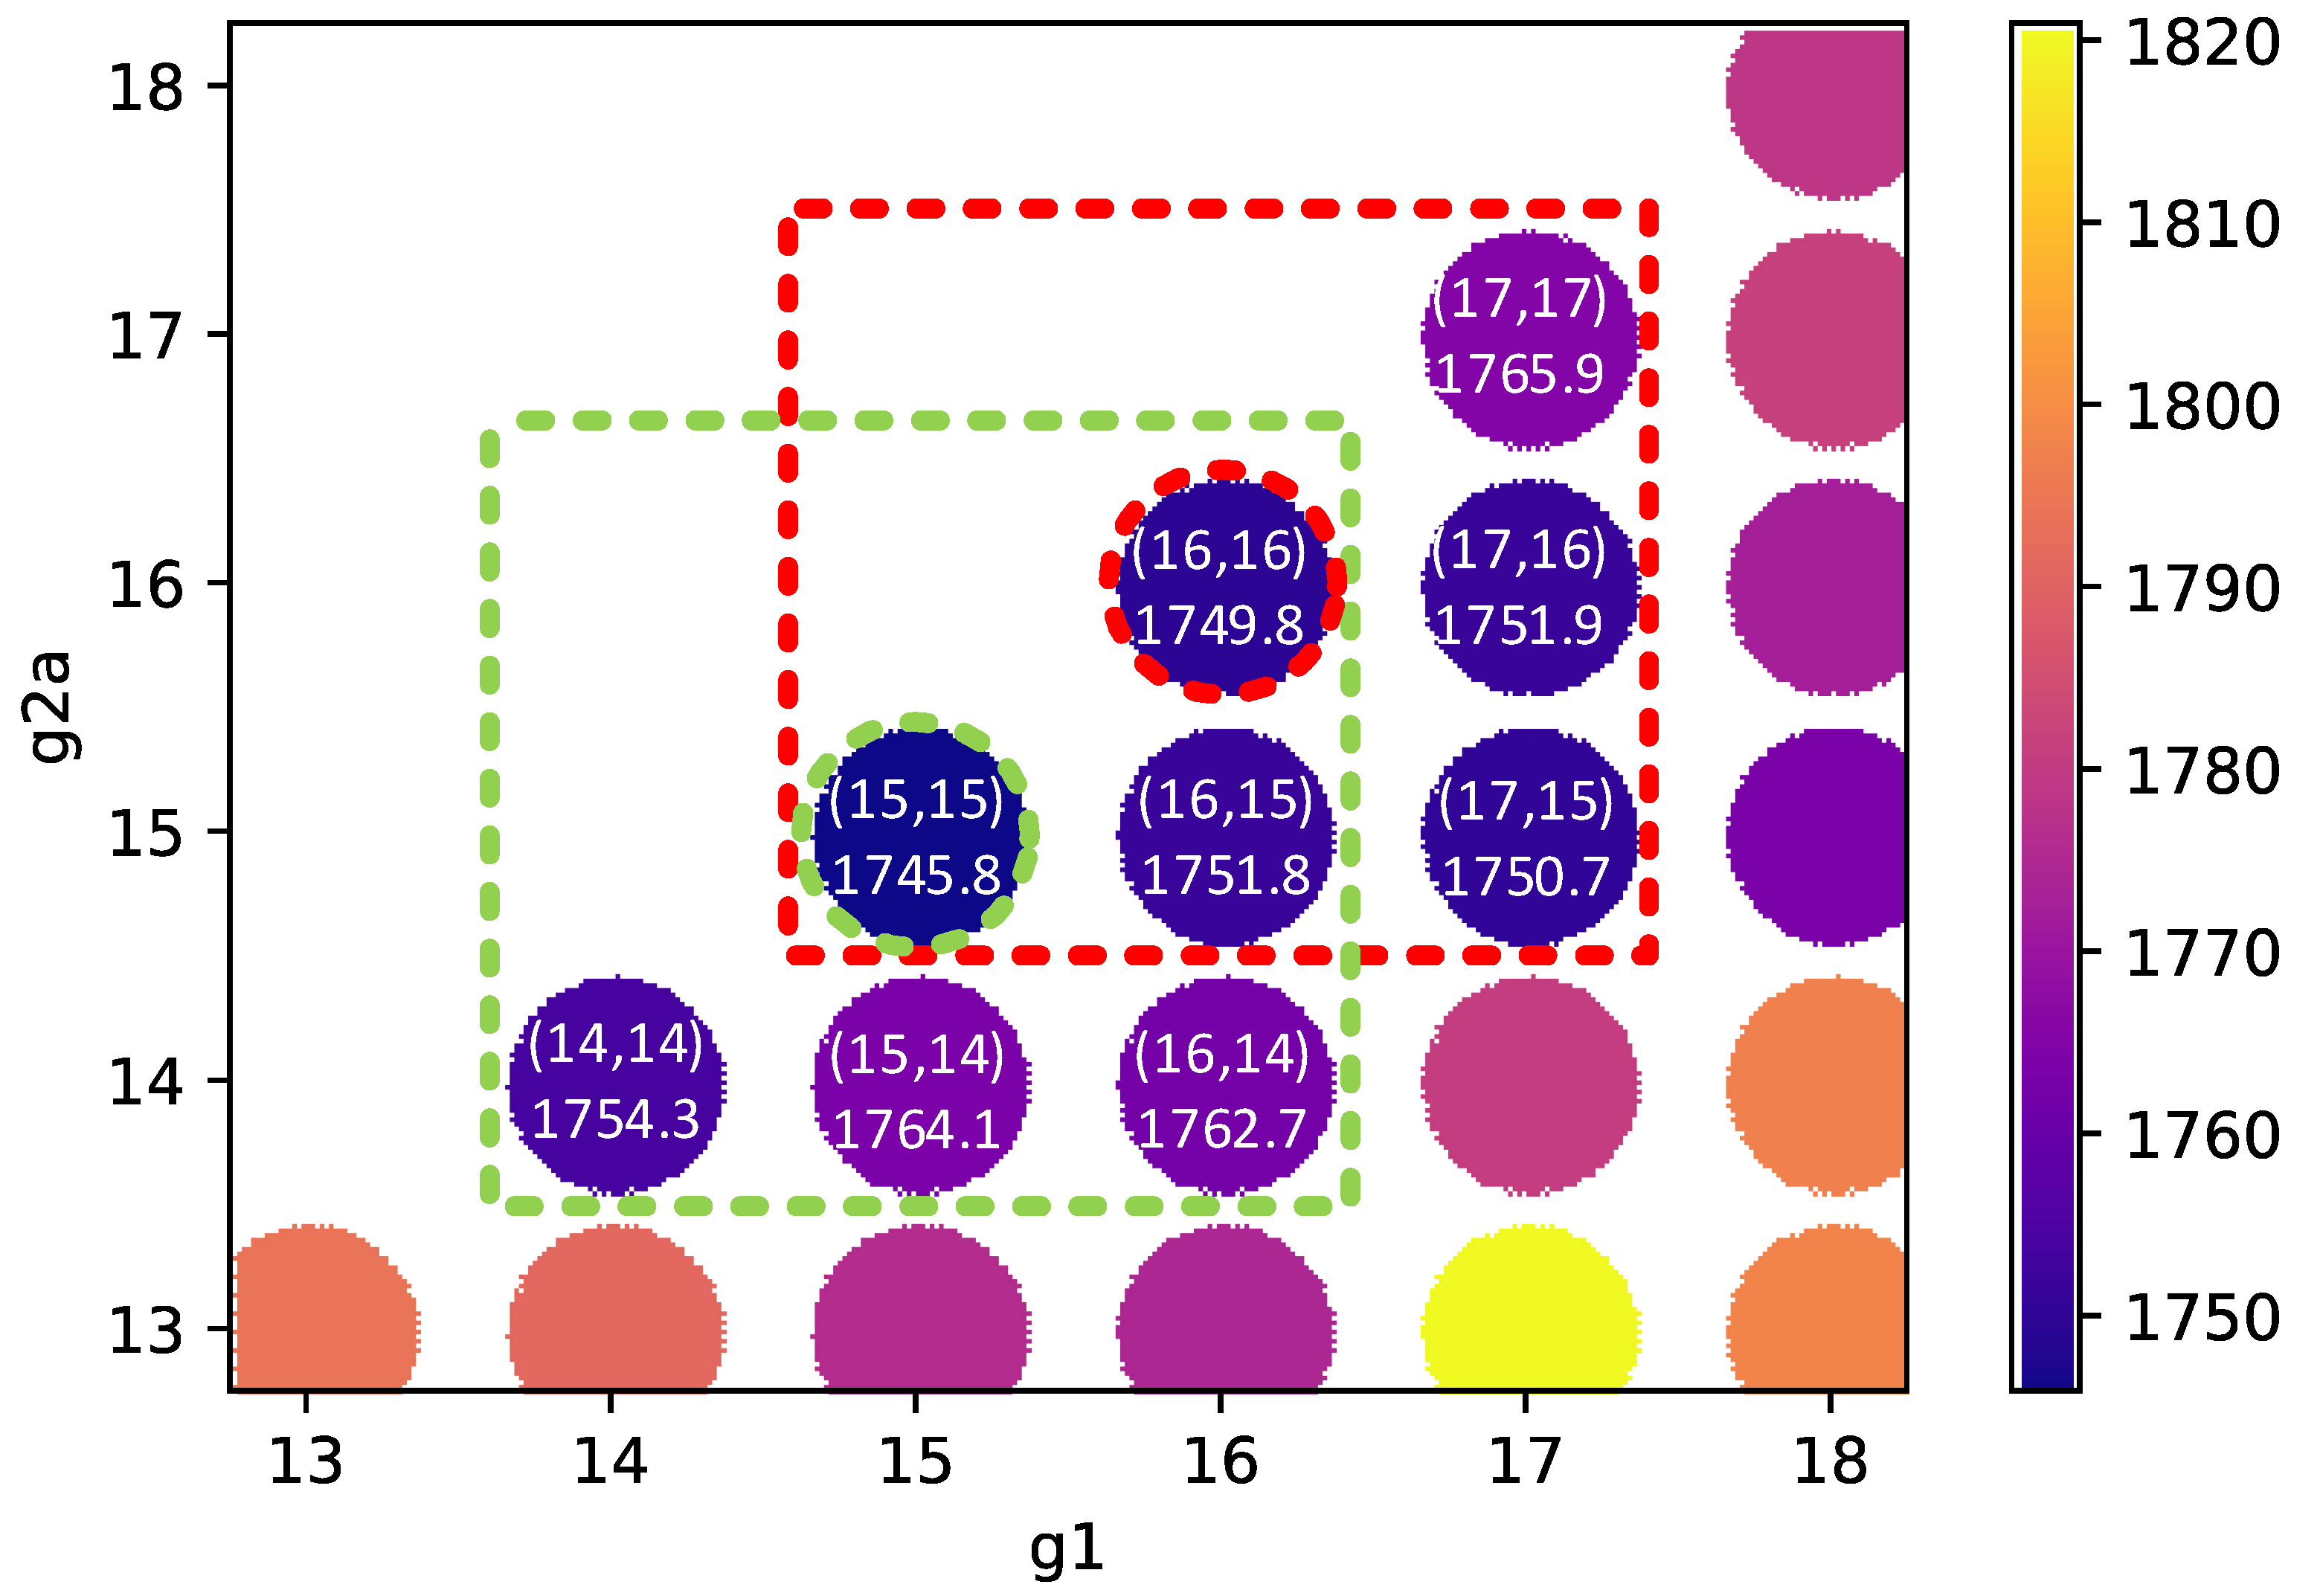
In this case, the best solution from the full grid search resulted from the combination (16, 16). The local search examined the neighboring feasible combinations for (16, 16). These were (15, 15), (16, 15), (17, 15), (17, 16), and (17, 17), as indicated by the circles within the dotted red box in Figure 14. The best of these points was (15, 15). As a result, a new search was performed for the neighboring feasible combinations of (15, 15) not investigated so far (14, 14), (15, 14), and (16, 14), as illustrated within the dotted green box of Figure 14. The minimum value of F resulted from (15, 15).
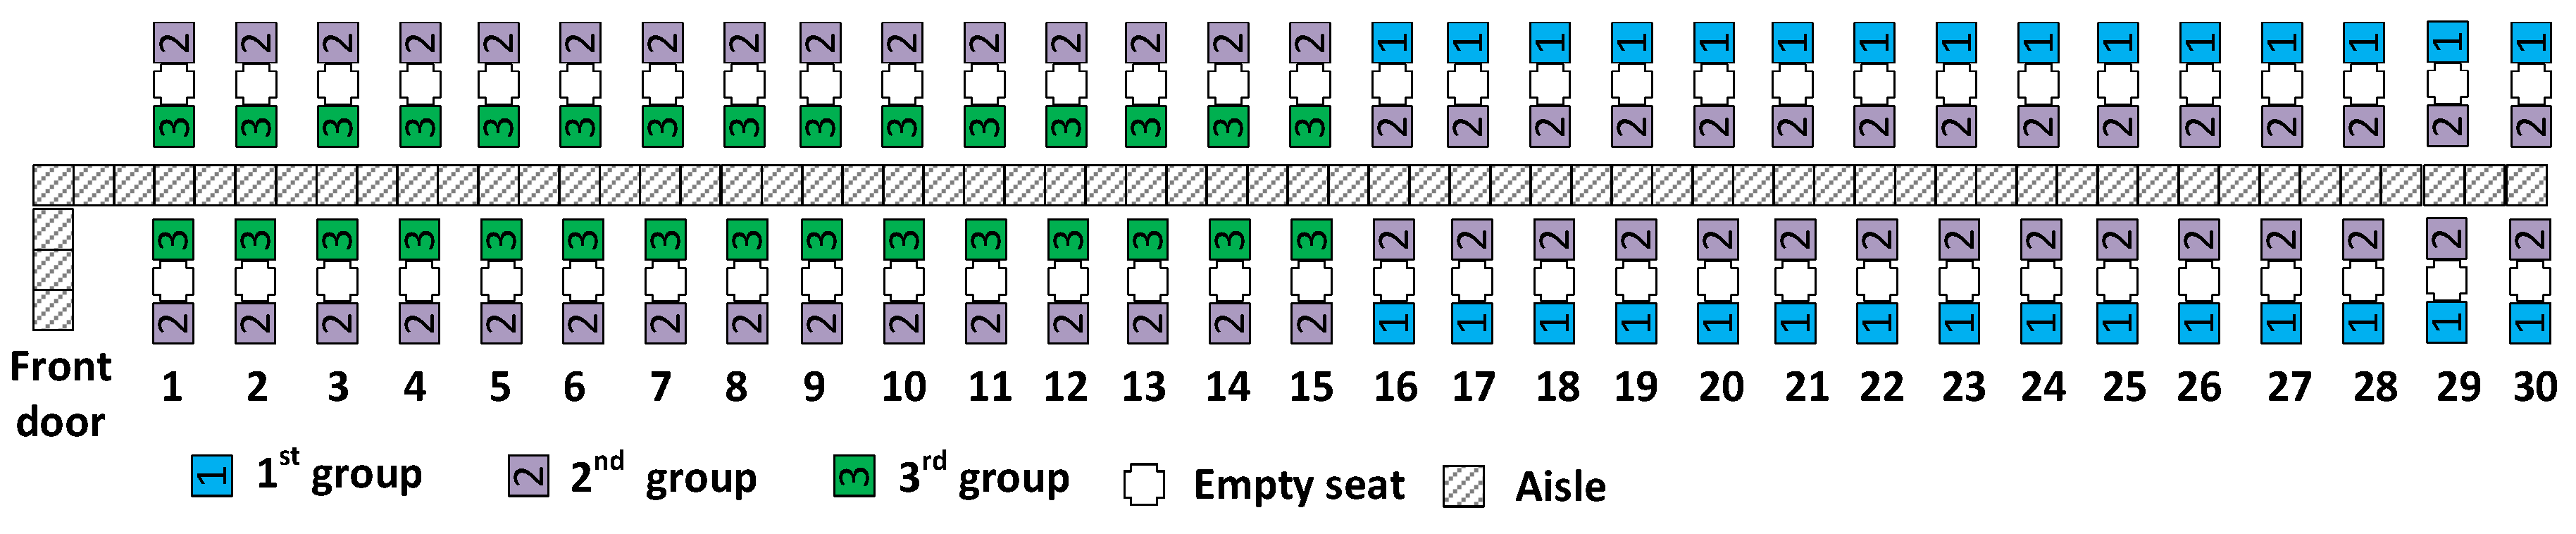
For (15, 15), the structure of the reverse pyramid groups was G1 = 30, G2 = 60, and G3 = 30 seats, which is presented in Figure 15.
This method is referred to as the modified reverse pyramid half-zone, as adapted for social distancing in [10]. The pre-COVID-19 version of the modified reverse pyramid half-zone is illustrated above in Figure 2 and was first used in practice by JetBlue in 2017 [35]. Observe that we found this solution (15, 15) using the full grid search followed by local search optimization.
We explain further why (15, 15) was the global optimal solution that minimized aisle seat risk as follows. If g2a were 1, then the expected number of aisle seat risk encounters by group 2 passengers would be 1. That is because exactly one of the two aisle seat passengers in boarding group 2 would arrive at its aisle seat in row 30 after the other one. If g2a were 2, then the expected number of aisle seat risk encounters by group 2 passengers would be 4. That is because on average, each of the row 29 group 2 passengers would have a 50% chance of being seated before any particular one of the other three aisle seat passengers of group 2, totaling an expected value of 1.5 aisle seat risk encounters (= 0.5 + 0.5 + 0.5) for each of the two row 29 group 2 passengers and adding that value of 3 (from multiplying 1.5 by 2) to the value of 1 for exactly one of the row 30 group 2 aisle seat passengers being seated before the other. In general, the expected number of aisle seat risk encountered by group 2 passengers would be (g2a)2 (i.e., g2a squared). We show this using proof by induction:
- (1)
- Assume: Notation: E(n) = expected number of aisle seat risk encounters by group 2 passengers when n = g2a. E(g2a) = expected number of aisle seat risk encounters by group 2 passengers = (g2a)2.
- (2)
- E(1) = (1)2 = 1 as explained above, as exactly one of the two row 30 aisle seat passengers is seated before the other.
- (3)
- E(g2a + 1) = E(g2a) + the expected number of aisle seat risk encounters by group 2 passengers seated in row (30 – g2a). Each of the two group 2 passengers sitting in row (30 − g2a) can be expected to be passed, on average, by g2a passengers from the higher numbered rows and also exactly one of the row (30 − g2a) group 2 passengers will be passed by the other. Consequently, E(g2a+1) = E(g2a) + 2 * g2a + 1 = (g2a)2 + 2 * g2a + 1 = (g2a + 1)2, thus completing the proof.
By similar reasoning, the expected number of aisle seat risk encounters by group 3 passengers would be (30 − g2a)2. In total, the expected number of aisle seat risk encounters would be: (g2a)2 + (30 − g2a)2. This value would be minimized when g2a is equal to 15.
5.3. Simulation Results for w1 = 0%, w2 = 0%, and w3 = 100%
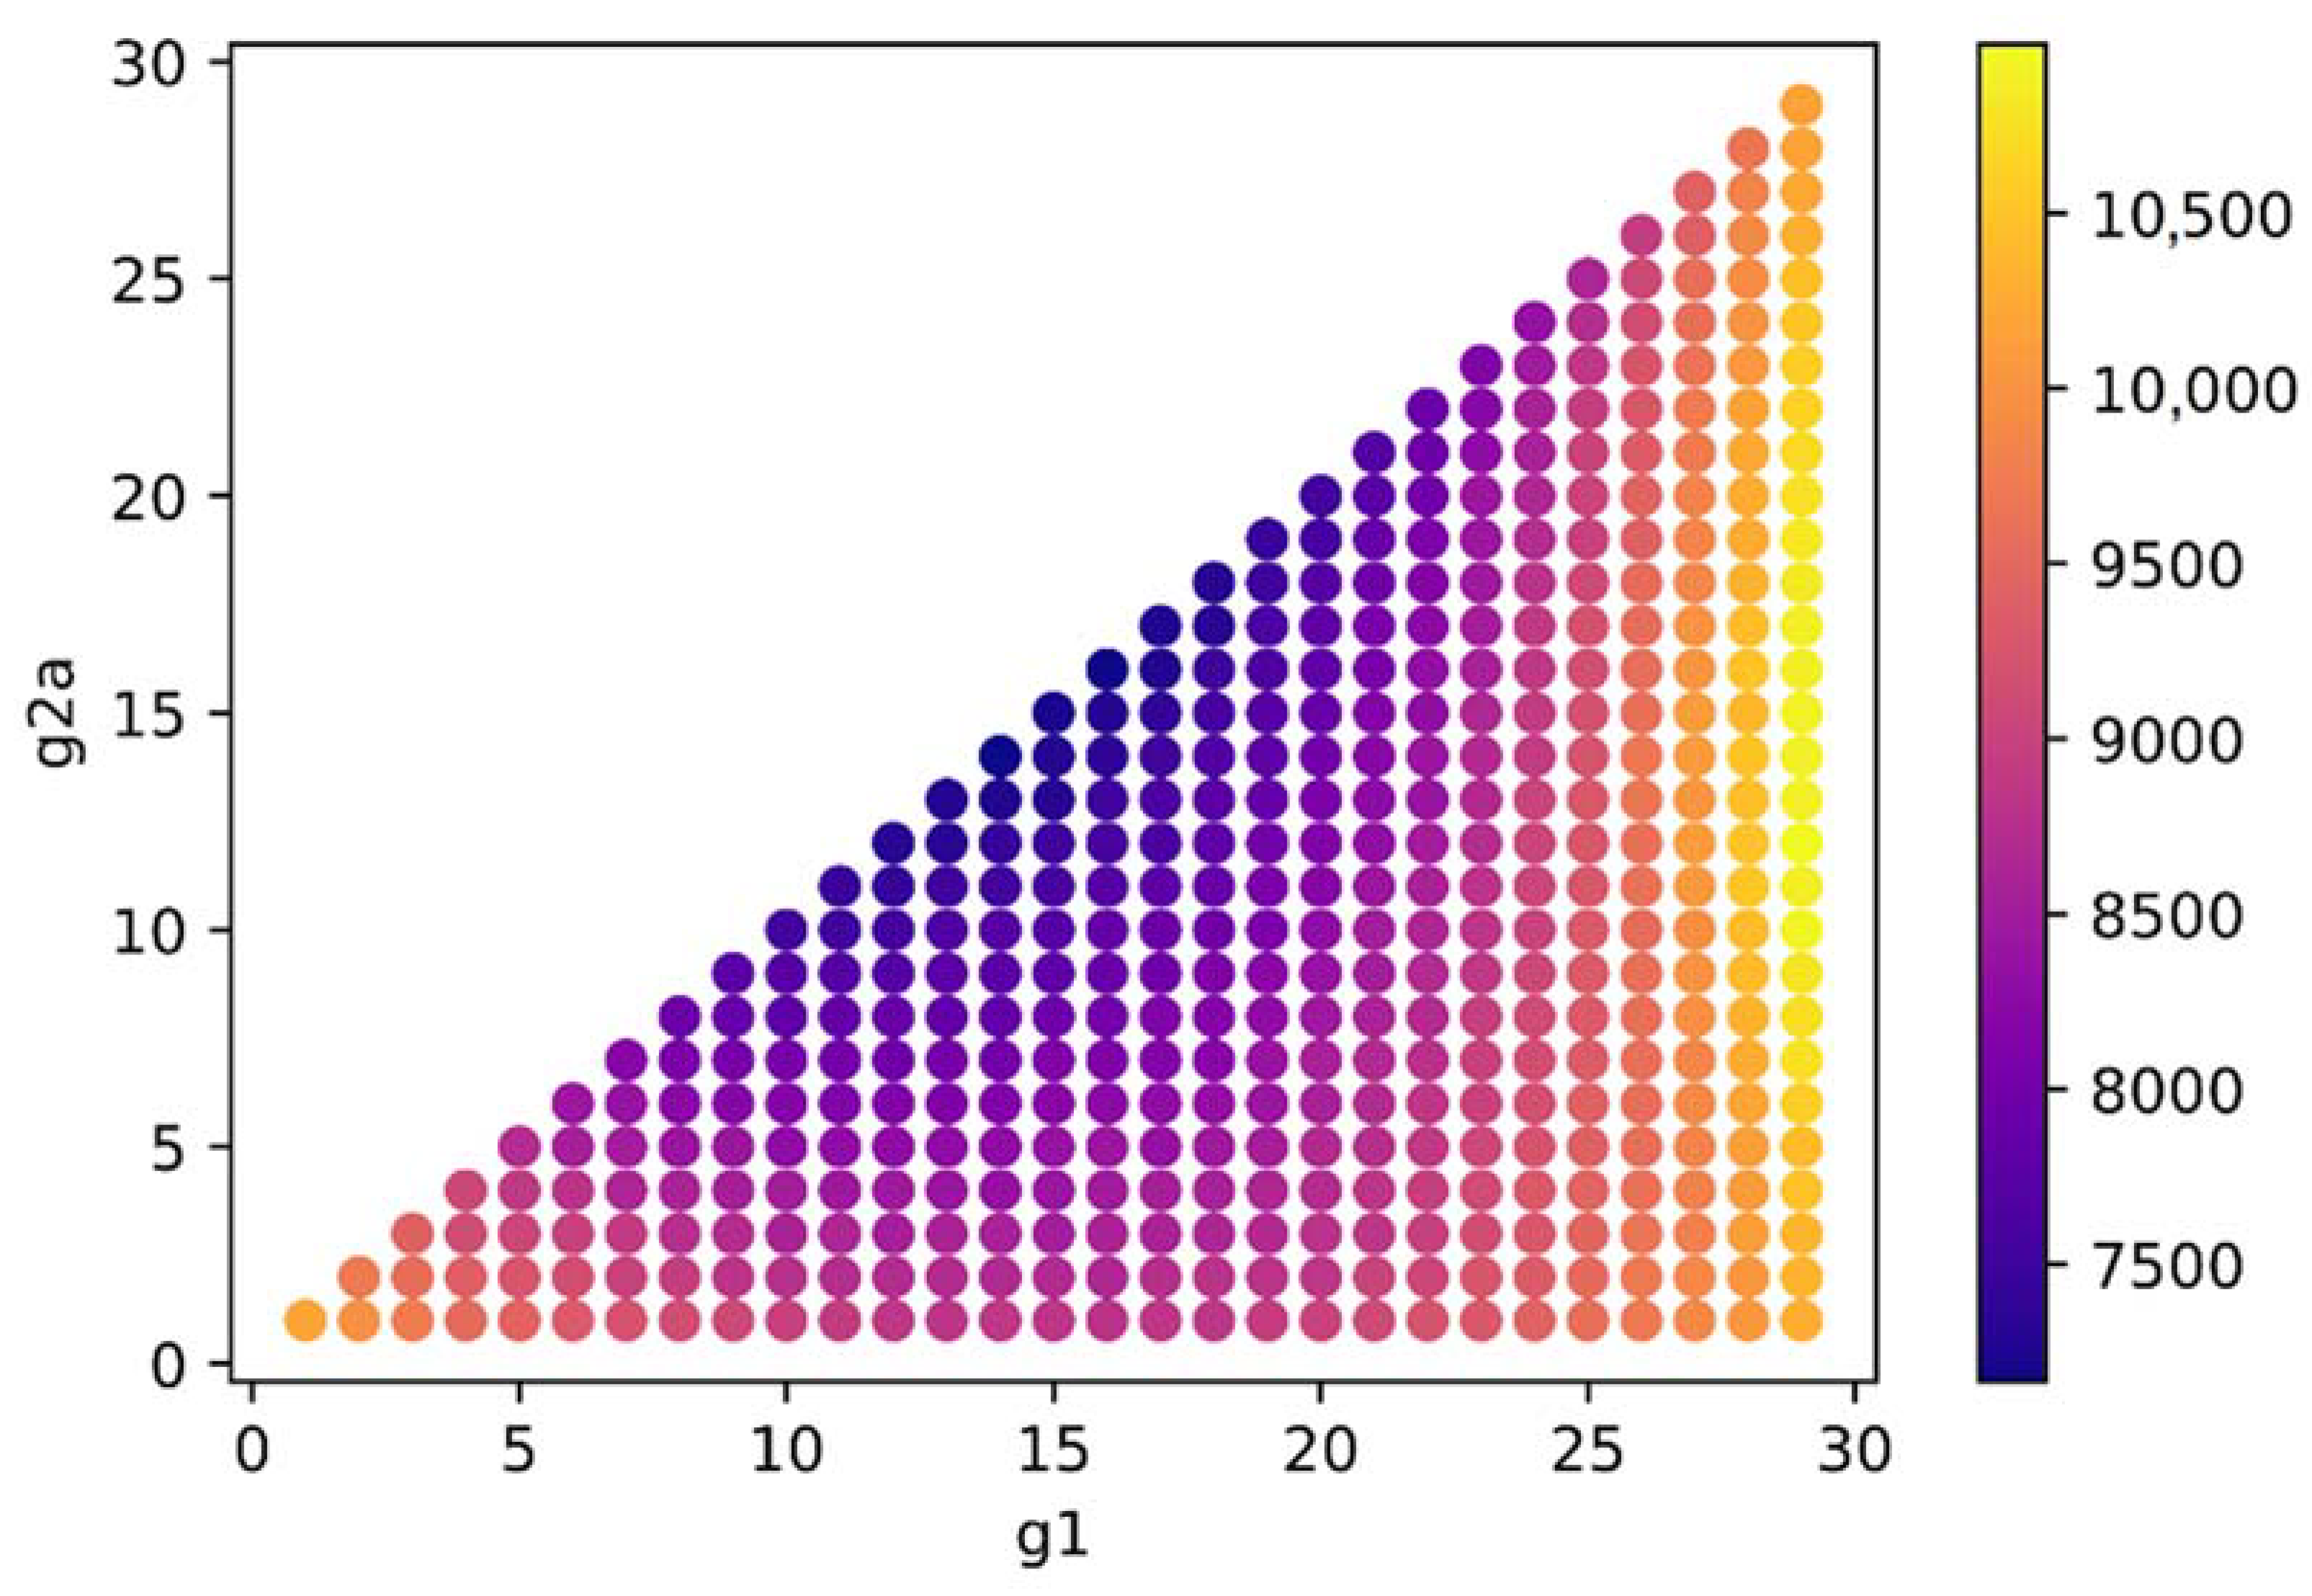
The third case we examined, C3, had a 100% weight for the average window seat risk duration and zero weight for the other performance metrics. Theoretically, this weight would be applicable for an airline that cares only about the health risk to window seat passengers from later boarding (possibly infectious) passengers. However, this case is of greater value for the insights it provides on the risk to window seat passengers than from an airline having this risk as a sole objective. For this case, the values of the objective function F resulting from the full grid search are depicted in Figure 16, with its lowest value achieved for (16, 16).
From Figure 16, we can be observe that the lowest values for F were encountered when both g1 and g2a ranged between 10 and 20. The highest values of F are depicted in light yellow and were obtained with a value for g1 of 29 and values of g2a between 9 and 17.
After a first local search among its neighboring feasible combinations of (15, 15), (16, 15), (17, 15), (17, 16), and (17, 17), a minimum was reached in (15, 15). Furthermore, for (15, 15), its feasible neighboring combinations (14, 14), (15, 14), and (16, 14) were considered, but none of them provided a better solution. As a result, the best solution was given by the (15, 15) combination, which was equivalent to G1 = 30, G2 = 60, and G3 = 30 seats. The best reverse pyramid scheme for this case was the same as the one found above and represented in Figure 15. Though we were surprised at first upon seeing this, after further reflection, we observed that this scheme resulted in the same number of window seat passengers in group 1 as in group 2. Consequently, this resulted in a reduced window seat risk for analogous reasons to having an equal number of aisle seat passengers in groups 2 and 3 resulting in the fewest aisle seat risks.
5.4. Simulation Results for w1 = 60%, w2 = 35%, and w3 = 5%
The fourth case we examined, C4, had positive weights for w1, w2, and w3. These weights would be applicable for an airline that cares mostly about boarding time and that cares considerably more about risk to aisle seat passengers than to window seat passengers. The latter preference may stem from window seat passengers being further from the aisle and thus in less danger of becoming infected than aisle seat passengers from later boarding passengers traversing the aisle. The best solution from the full grid search in this case was (16, 16). The full grid search results are presented in Figure 17. After a first round of local search among its neighboring feasible combinations—(15, 15), (16, 15), (17, 15), (17, 16), and (17, 17)—no better values for the objective were found. As a result, the best solution was given by the (16, 16) combination, which was equivalent to: G1 = 32, G2 = 60, and G3 = 28 seats, presented in Figure 18.
From Figure 18, we can observe that even in this case, the second group comprised half of the number of passengers. The first and the third groups contained the other half, the differences among the number of passengers between these two groups amounting to only four passengers in favor of the first group.
5.5. Summary and Discussion of Simulation Results
We summarize the results for the cases discussed above and shown in Table 1. The values resulting from the local search method are presented in light grey. The best (lowest) values of boarding time, aisle seat risk, and window seat risk are presented in bold font. Additionally, the data in Table 1 provide the value for the object function F, as determined for the four considered cases with the same amount of luggage when the reverse pyramid method contained equal group sizes, G1 = G2 = G3 = 40 seats [30], which is represented in Figure 3.
When comparing the data in Table 1, we can observe that regardless of the weights for the objective function F, the results from the unequal boarding group sizes outperformed those of the equal sized boarding group for the objective function F and for all three performance metrics. As noted earlier, the weights for case C1 resulted in the lowest boarding time, while the weights for cases C2 and C3 resulted in the least aisle seat and window seat risks. For case C4, the aisle and window seat risk durations were better than with case C1 but with an average boarding time that was longer. Meanwhile, Case C4 had a lower average boarding time than cases C2 and C3 but with higher aisle and window seat risk durations. As such, case C4 represents a tradeoff between the superior boarding time of C1 and the superior risk durations of cases C2 and C3. We further observed that the solution of cases C2 and C3 resulted in 2% more boarding time than C1 while also resulting in 25% and 22% less health risk to aisle seat and window seat passengers, respectively, from later boarding passengers.
6. Concluding Remarks
The novel coronavirus and the social distancing rules imposed by the authorities and the institutions in the area of air transport management have changed the airplane boarding process. In this new context, the airlines have struggled to increase their passengers’ confidence in air transportation during this outbreak by adopting a series of policies related to the boarding process and other measures to be considered before and during the flight.
In the present paper, we analyzed how one of the best-performing boarding methods, reverse pyramid, should be adapted for COVID-19 when the passengers are boarded using the front door of the airplane in the presence of a jet bridge. To this aim, all the possible combinations of the reverse pyramid with three boarding groups were considered, and an objective function was created to model the relative importance an airline gives to the boarding time, aisle seat risk, and window seat risk. Based on the airline’s relative preference for optimizing the three performance metrics, a solution regarding the scheme of the reverse pyramid it should use was provided.
If the airline is overwhelmingly concerned with minimizing the boarding time, then the reverse pyramid method with three boarding groups should be one that has the first two groups of passengers much larger than the third group. If the airline’s priority is a safer boarding experience, then the first group of passengers to board should be those with window seats in the rear half of the airplane, the third group to board should be those passengers with aisle seats in the front half of the airplane, and the second boarding group should contain the remaining passengers. This boarding assignment would result in a 2% increase in average boarding time compared with an assignment that minimized boarding time but with 25% and 22% decreases in health risk to aisle and window seat passengers, respectively, from later boarding passengers breathing near them. If a combination of the three metrics is preferred, then the reverse pyramid scheme can be adapted to the required situation.
Future research may investigate the reverse pyramid method with more than three unequal size boarding groups while also considering the cases when the passengers are travelling light with no hand luggage or with a reduced amount of hand luggage, as this was one of the social distancing measures imposed on all national and international flights in Italy between 11 June and 15 July 2020, and might be reused if a large new wave of coronavirus reappears. Additionally, the research can be extended for other airplane configurations and adapted for innovative cabin layouts, such as the folding seats proposed by Schultz and Fuchte [3].
The paper is accompanied by Videos S1–S3. Each video contains a visual animation of passengers boarding the airplane in a simulation trial of the best solution of the g1 and g2a variables corresponding to a case considered in Section 5. The videos can also be accessed at the following link: https://github.com/liviucotfas/symmetry-reverse-pyramid-3-groups.
Supplementary Materials
The following are available online at https://www.mdpi.com/2073-8994/12/12/2038/s1, Video S1: 15-15.mp4, Video S2: 16-16.mp4, Video S3: 25-24.mp4.
Author Contributions
Conceptualization, R.J.M.; data curation, C.D. and L.-A.C.; formal analysis, C.D. and R.J.M.; investigation, C.D., R.J.M. and L.-A.C.; methodology, R.J.M.; software, C.D. and L.-A.C.; supervision, R.J.M.; validation, L.-A.C.; visualization, C.D. and L.-A.C.; writing—original draft, C.D. and R.J.M.; writing—review and editing, L.-A.C. All authors have read and agreed to the published version of the manuscript.
Funding
This research received no external funding.
Conflicts of Interest
The authors declare no conflict of interest.
References
- IATA. IATA COVID-19 Passenger Survey. Available online: https://www.iata.org/en/publications/store/covid-passenger-survey/ (accessed on 1 August 2020).
- ICAO. Effects of Novel Coronavirus (COVID-19) on Civil Aviation: Economic Impact Analysis. Available online: https://www.icao.int/sustainability/Documents/COVID-19/ICAO_Coronavirus_Econ_Impact.pdf (accessed on 31 May 2020).
- Schultz, M.; Fuchte, J. Evaluation of Aircraft Boarding Scenarios Considering Reduced Transmissions Risks. Sustainability 2020, 12, 5329. [Google Scholar] [CrossRef]
- Elcheroth, G.; Drury, J. Collective resilience in times of crisis: Lessons from the literature for socially effective responses to the pandemic. Br. J. Soc. Psychol. 2020, 59, 703–713. [Google Scholar] [CrossRef] [PubMed]
- Belli, S.; Broncano, F. Trust as a Meta-Emotion. Metaphilosophy 2017, 48, 430–448. [Google Scholar] [CrossRef]
- Delcea, C.; Cotfas, L.A.; Paun, R. Agent-Based Evaluation of the Airplane Boarding Strategies’ Efficiency and Sustainability. Sustainability 2018, 10, 1879. [Google Scholar] [CrossRef] [Green Version]
- Schultz, M. A metric for the real-time evaluation of the aircraft boarding progress. Transp. Res. Part C Emerg. Technol. 2018, 86, 467–487. [Google Scholar] [CrossRef]
- Milne, R.J.; Kelly, A.R. A new method for boarding passengers onto an airplane. J. Air Transp. Manag. 2014, 34, 93–100. [Google Scholar] [CrossRef] [Green Version]
- Steffen, J.H. Optimal boarding method for airline passengers. J. Air Transp. Manag. 2008, 14, 146–150. [Google Scholar] [CrossRef] [Green Version]
- Cotfas, L.A.; Delcea, C.; Milne, R.J.; Salari, M. Evaluating Classical Airplane Boarding Methods Considering COVID-19 Flying Restrictions. Symmetry 2020, 12, 1087. [Google Scholar] [CrossRef]
- Milne, R.J.; Delcea, C.; Cotfas, L.A. Airplane Boarding Methods that Reduce Risk from COVID-19. Saf. Sci. 2020. [Google Scholar] [CrossRef]
- Milne, R.J.; Delcea, C.; Cotfas, L.A.; Ioanas, C. Evaluation of Boarding Methods Adapted for Social Distancing When Using Apron Buses. IEEE Access 2020, 8, 151650–151667. [Google Scholar] [CrossRef]
- Salari, M.; Milne, R.J.; Delcea, C.; Kattan, L.; Cotfas, L.A. Social distancing in airplane seat assignments. J. Air Transp. Manag. 2020, 89, 101915. [Google Scholar] [CrossRef] [PubMed]
- Steffen, J.H. A statistical mechanics model for free-for-all airplane passenger boarding. Am. J. Phys. 2008, 76, 1114–1119. [Google Scholar] [CrossRef] [Green Version]
- Soolaki, M.; Mahdavi, I.; Mahdavi-Amiri, N.; Hassanzadeh, R.; Aghajani, A. A new linear programming approach and genetic algorithm for solving airline boarding problem. Appl. Math. Model. 2012, 36, 4060–4072. [Google Scholar] [CrossRef]
- Qiang, S.J.; Jia, B.; Xie, D.F.; Gao, Z.Y. Reducing airplane boarding time by accounting for passengers’ individual properties: A simulation based on cellular automaton. J. Air Transp. Manag. 2014, 40, 42–47. [Google Scholar] [CrossRef]
- van den Briel, M.H.L.; Villalobos, J.R.; Hogg, G.L.; Lindemann, T.; Mulé, A.V. America West Airlines Develops Efficient Boarding Strategies. Interfaces 2005, 35, 191–201. [Google Scholar] [CrossRef]
- Nyquist, D.C.; McFadden, K.L. A study of the airline boarding problem. J. Air Transp. Manag. 2008, 14, 197–204. [Google Scholar] [CrossRef]
- Bachmat, E.; Berend, D.; Sapir, L.; Skiena, S.; Stolyarov, N. Analysis of Airplane Boarding Times. Oper. Res. 2009, 57, 499–513. [Google Scholar] [CrossRef] [Green Version]
- Milne, R.J.; Delcea, C.; Cotfas, L.A.; Salari, M. New methods for two-door airplane boarding using apron buses. J. Air Transp. Manag. 2019, 80, 101705. [Google Scholar] [CrossRef]
- Cotfas, L.A.; Delcea, C.; Milne, R.J.; Salari, M.; Crăciun, L.; Molănescu, A.G. Testing New Methods for Boarding a Partially Occupied Airplane Using Apron Buses. Symmetry 2019, 11, 1044. [Google Scholar] [CrossRef] [Green Version]
- Delcea, C.; Milne, R.J.; Cotfas, L.A.; Craciun, L.; Molanescu, A.G. Methods for Accelerating the Airplane Boarding Process in the Presence of Apron Buses. IEEE Access 2019, 7, 134372–134387. [Google Scholar] [CrossRef]
- Delcea, C.; Cotfas, L.A.; Chiriță, N.; Nica, I. A Two-Door Airplane Boarding Approach When Using Apron Buses. Sustainability 2018, 10, 3619. [Google Scholar] [CrossRef] [Green Version]
- Milne, R.J.; Cotfas, L.A.; Delcea, C.; Salari, M.; Crăciun, L.; Molanescu, A.G. Greedy Method for Boarding a Partially Occupied Airplane Using Apron Buses. Symmetry 2019, 11, 1221. [Google Scholar] [CrossRef] [Green Version]
- Milne, R.J.; Cotfas, L.A.; Delcea, C.; Salari, M.; Craciun, L.; Molanescu, A.G. Airplane Boarding Method for Passenger Groups When Using Apron Buses. IEEE Access 2020, 8, 18019–18035. [Google Scholar] [CrossRef]
- Tang, T.Q.; Yang, S.P.; Ou, H.; Chen, L.; Huang, H.J. An aircraft boarding model with the group behavior and the quantity of luggage. Transp. Res. Part C Emerg. Technol. 2018, 93, 115–127. [Google Scholar] [CrossRef]
- Ferrari, P.; Nagel, K. Robustness of Efficient Passenger Boarding Strategies for Airplanes. Transp. Res. Rec. J. Transp. Res. Board 2005, 1915, 44–54. [Google Scholar] [CrossRef]
- Kisiel, T. Resilience of passenger boarding strategies to priority fares offered by airlines. J. Air Transp. Manag. 2020, 87, 101853. [Google Scholar] [CrossRef]
- Delcea, C.; Cotfas, L.A.; Paun, R. Airplane Boarding Strategies Using Agent-Based Modeling and Grey Analysis. In Computational Collective Intelligence; Nguyen, N.T., Pimenidis, E., Khan, Z., Trawiński, B., Eds.; Springer International Publishing: Cham, Germany, 2018; Volume 11055, pp. 329–339. ISBN 978-3-319-98442-1. [Google Scholar]
- Milne, R.J.; Cotfas, L.A.; Delcea, C.; Craciun, L.; Molanescu, A.G. Adapting the Reverse Pyramid Airplane Boarding Method for Social Distancing in Times of COVID-19. PLoS ONE 2020. [Google Scholar] [CrossRef]
- Steiner, A.; Philipp, M. Speeding up the airplane boarding process by using pre-boarding areas. In Proceedings of the Swiss Transport Research Conference, Ascona, Switzerland, 9–11 September 2009. [Google Scholar]
- Jafer, S.; Mi, W. Comparative Study of Aircraft Boarding Strategies Using Cellular Discrete Event Simulation. Aerospace 2017, 4, 57. [Google Scholar] [CrossRef] [Green Version]
- Jaehn, F.; Neumann, S. Airplane boarding. Eur. J. Oper. Res. 2015, 244, 339–359. [Google Scholar] [CrossRef]
- Bazargan, M. A linear programming approach for aircraft boarding strategy. Eur. J. Oper. Res. 2007, 183, 394–411. [Google Scholar] [CrossRef]
- Breuer, A. JetBlue to Unveil New Boarding Process | Frequent Business Traveler. Available online: http://www.frequentbusinesstraveler.com/2017/10/jetblue-to-unveil-new-boarding-process/ (accessed on 4 August 2020).
- Delcea, C.; Cotfas, L.A.; Salari, M.; Milne, R.J. Investigating the Random Seat Boarding Method without Seat Assignments with Common Boarding Practices Using an Agent-Based Modeling. Sustainability 2018, 10, 4623. [Google Scholar] [CrossRef] [Green Version]
- Van Landeghem, H.; Beuselinck, A. Reducing passenger boarding time in airplanes: A simulation based approach. Eur. J. Oper. Res. 2002, 142, 294–308. [Google Scholar] [CrossRef]
- Kierzkowski, A.; Kisiel, T. The Human Factor in the Passenger Boarding Process at the Airport. Procedia Eng. 2017, 187, 348–355. [Google Scholar] [CrossRef]
- Notomista, G.; Selvaggio, M.; Sbrizzi, F.; Di Maio, G.; Grazioso, S.; Botsch, M. A fast airplane boarding strategy using online seat assignment based on passenger classification. J. Air Transp. Manag. 2016, 53, 140–149. [Google Scholar] [CrossRef]
- Milne, R.J.; Salari, M.; Kattan, L. Robust Optimization of Airplane Passenger Seating Assignments. Aerospace 2018, 5, 80. [Google Scholar] [CrossRef] [Green Version]
- Ren, X.; Zhou, X.; Xu, X. A new model of luggage storage time while boarding an airplane: An experimental test. J. Air Transp. Manag. 2020, 84, 101761. [Google Scholar] [CrossRef]
- Steffen, J.H.; Hotchkiss, J. Experimental test of airplane boarding methods. J. Air Transp. Manag. 2012, 18, 64–67. [Google Scholar] [CrossRef] [Green Version]
- Hutter, L.; Jaehn, F.; Neumann, S. Influencing Factors on Airplane Boarding Times. Omega 2018. [Google Scholar] [CrossRef]
- Ren, X.; Xu, X. Experimental analyses of airplane boarding based on interference classification. J. Air Transp. Manag. 2018, 71, 55–63. [Google Scholar] [CrossRef]
- Schultz, M. Fast Aircraft Turnaround Enabled by Reliable Passenger Boarding. Aerospace 2018, 5, 8. [Google Scholar] [CrossRef] [Green Version]
- Schultz, M. Dynamic change of aircraft seat condition for fast boarding. Transp. Res. Part C Emerg. Technol. 2017, 85, 131–147. [Google Scholar] [CrossRef]
- Wittmann, J. Customer-oriented optimization of the airplane boarding process. J. Air Transp. Manag. 2019, 76, 31–39. [Google Scholar] [CrossRef]
- Milne, R.J.; Salari, M. Optimization of assigning passengers to seats on airplanes based on their carry-on luggage. J. Air Transp. Manag. 2016, 54, 104–110. [Google Scholar] [CrossRef]
- Schultz, M. The Seat Interference Potential as an Indicator for the Aircraft Boarding Progress. SAE Tech. Pap. 2017. [Google Scholar] [CrossRef]
- Sadeghi Lahijani, M.; Islam, T.; Srinivasan, A.; Namilae, S. Constrained Linear Movement Model (CALM): Simulation of passenger movement in airplanes. PLoS ONE 2020, 15, e0229690. [Google Scholar] [CrossRef] [Green Version]
- Islam, T.; Lahijani, M.S.; Srinivasan, A.; Namilae, S.; Mubayi, A.; Scotch, M. From Bad to Worse: Airline Boarding Changes in Response to COVID-19. arXiv 2020, arXiv:2006.06403. [Google Scholar]
- Derjany, P.; Namilae, S.; Liu, D.; Srinivasan, A. Multiscale model for the optimal design of pedestrian queues to mitigate infectious disease spread. PLoS ONE 2020, 15, e0235891. [Google Scholar] [CrossRef] [PubMed]
- De Vos, J. The effect of COVID-19 and subsequent social distancing on travel behavior. Transp. Res. Interdiscip. Perspect. 2020, 5, 100121. [Google Scholar] [CrossRef]
- WHO. Advice for Public. Available online: https://www.who.int/emergencies/diseases/novel-coronavirus-2019/advice-for-public (accessed on 31 May 2020).
- EASA. COVID-19 Aviation Health Safety Protocol. Available online: https://www.easa.europa.eu/document-library/general-publications/covid-19-aviation-health-safety-protocol (accessed on 31 May 2020).
- IATA. Restarting Aviation Following COVID-19. Available online: https://www.iata.org/contentassets/f1163430bba94512a583eb6d6b24aa56/covid-medical-evidence-for-strategies-200423.pdf (accessed on 31 May 2020).
- Barnett, A.; Fleming, K. Covid-19 Risk Among Airline Passengers: Should the Middle Seat Stay Empty. MedRxiv 2020. Available online: https://www.medrxiv.org/content/10.1101/2020.07.02.20143826v4 (accessed on 20 October 2020).
- Porterfield, C. Leaving Airplane Middle Seats Empty Could Cut Coronavirus Risk Almost In Half, A Study Says. Available online: https://www.forbes.com/sites/carlieporterfield/2020/07/11/leaving-airplane-middle-seats-empty-could-cut-coronavirus-risk-almost-in-half-a-study-says/ (accessed on 1 August 2020).
- Delta Air Lines More Space for Holiday Travel: Delta Extends Middle Seat Blocks into January 2021. Available online: https://news.delta.com/more-space-holiday-travel-delta-extends-middle-seat-blocks-january-2021 (accessed on 20 October 2020).
- Turkish Airlines Travel and Coronavirus: Amended Cabin Baggage Rules. Available online: https://www.turkishairlines.com/en-int/any-questions/what-are-cabin-baggage-rules-during-the-coronavirus-process/ (accessed on 1 August 2020).
- Delcea, C.; Cotfas, L.A.; Crăciun, L.; Molanescu, A. Are Seat and Aisle Interferences Affecting the Overall Airplane Boarding Time? An Agent-Based Approach. Sustainability 2018, 10, 4217. [Google Scholar] [CrossRef] [Green Version]
- Currie, C.S.M.; Fowler, J.W.; Kotiadis, K.; Monks, T.; Onggo, B.S.; Robertson, D.A.; Tako, A.A. How simulation modelling can help reduce the impact of COVID-19. J. Simul. 2020, 14, 83–97. [Google Scholar] [CrossRef] [Green Version]
- An, L. Modeling human decisions in coupled human and natural systems: Review of agent-based models. Ecol. Model. 2012, 229, 25–36. [Google Scholar] [CrossRef]
- Dai, J.; Li, X.; Liu, L. Simulation of pedestrian counter flow through bottlenecks by using an agent-based model. Phys. A Stat. Mech. Its Appl. 2013, 392, 2202–2211. [Google Scholar] [CrossRef]
- Delcea, C.; Cotfas, L.A. Increasing awareness in classroom evacuation situations using agent-based modeling. Phys. A Stat. Mech. Its Appl. 2019. [Google Scholar] [CrossRef]
- Delcea, C.; Cotfas, L.A.; Craciun, L.; Molanescu, A.G. An agent-based modeling approach to collaborative classrooms evacuation process. Saf. Sci. 2020, 121, 414–429. [Google Scholar] [CrossRef]
- Delcea, C.; Cotfas, L.; Craciun, L.; Molanescu, A.G. Establishing the Proper Seating Arrangement in Elevated Lecture Halls for a Faster Evacuation Process. IEEE Access 2019, 7, 48500–48513. [Google Scholar] [CrossRef]
- Delcea, C.; Cotfas, L.A.; Bradea, I.A.; Boloș, M.I.; Ferruzzi, G. Investigating the Exits’ Symmetry Impact on the Evacuation Process of Classrooms and Lecture Halls: An Agent-Based Modeling Approach. Symmetry 2020, 12, 627. [Google Scholar] [CrossRef] [Green Version]
- Joo, J.; Kim, N.; Wysk, R.A.; Rothrock, L.; Son, Y.J.; Oh, Y.; Lee, S. Agent-based simulation of affordance-based human behaviors in emergency evacuation. Simul. Model. Pract. Theory 2013, 32, 99–115. [Google Scholar] [CrossRef]
- Poulos, A.; Tocornal, F.; de la Llera, J.C.; Mitrani-Reiser, J. Validation of an agent-based building evacuation model with a school drill. Transp. Res. Part C Emerg. Technol. 2018, 97, 82–95. [Google Scholar] [CrossRef]
- Ponsiglione, C.; Primario, S.; Zollo, G. Does natural language perform better than formal systems? Results from a fuzzy agent-based model. Int. J. Technol. Policy Manag. 2019, 19, 171–175. [Google Scholar] [CrossRef]
- Ponsiglione, C.; Quinto, I.; Zollo, G. Regional Innovation Systems as Complex Adaptive Systems: The Case of Lagging European Regions. Sustainability 2018, 10, 2862. [Google Scholar] [CrossRef] [Green Version]
- Wilensky, U.; Rand, W. An Introduction to Agent-Based Modeling: Modeling Natural, Social, and Engineered Complex Systems with NetLogo; The MIT Press: Cambridge, MA, USA, 2015; ISBN 978-0-262-73189-8. [Google Scholar]
- Stonedahl, F.; Wilensky, U. Finding Forms of Flocking: Evolutionary Search in ABM Parameter-Spaces. In Multi-Agent-Based Simulation XI; Bosse, T., Geller, A., Jonker, C.M., Eds.; Springer: Berlin/Heidelberg, Germany, 2011; Volume 6532, pp. 61–75. ISBN 978-3-642-18344-7. [Google Scholar]
- Almeida, J.E.; Kokkinogenis, Z.; Rossetti, R.J.F. NetLogo implementation of an evacuation scenario. In Proceedings of the 7th Iberian Conference on Information Systems and Technologies (CISTI 2012), Madrid, Spain, 20–23 June 2012; pp. 1–4. [Google Scholar]
- Zou, Q.; Fernandes, D.S.; Chen, S. Agent-based evacuation simulation from subway train and platform. J. Transp. Saf. Secur. 2019. [Google Scholar] [CrossRef]
- Liu, R.; Jiang, D.; Shi, L. Agent-based simulation of alternative classroom evacuation scenarios. Front. Archit. Res. 2016, 5, 111–125. [Google Scholar] [CrossRef] [Green Version]
- Wang, H.; Mostafizi, A.; Cramer, L.A.; Cox, D.; Park, H. An agent-based model of a multimodal near-field tsunami evacuation: Decision-making and life safety. Transp. Res. Part C Emerg. Technol. 2016, 64, 86–100. [Google Scholar] [CrossRef]
- Schultz, M. Field Trial Measurements to Validate a Stochastic Aircraft Boarding Model. Aerospace 2018, 5, 27. [Google Scholar] [CrossRef] [Green Version]
- Alizadeh, R. A dynamic cellular automaton model for evacuation process with obstacles. Saf. Sci. 2011, 49, 315–323. [Google Scholar] [CrossRef]
- Schultz, M.; Soolaki, M. Analytical Approach to Solve the Problem of Aircraft Passenger Boarding during the Coronavirus Pandemic; Preprint Under Journal Review. Available online: https://www.researchgate.net/publication/343390376_Analytical_approach_to_solve_the_problem_of_aircraft_passenger_boarding_during_the_coronavirus_pandemic (accessed on 4 August 2020).
- Audenaert, J.; Verbeeck, K.; Berghe, G. Multi-agent based simulation for boarding. In Proceedings of the 21st Benelux Conference on Artificial Intelligence, Eindhoven, The Netherlands, 29–30 October 2009; pp. 3–10. [Google Scholar]
Figure 1.
Reverse pyramid with 5 boarding groups without considering social distancing.

Figure 2.
Modified reverse pyramid half-zone without social distancing.

Figure 3.
Reverse pyramid with 3 equal size boarding groups adapted for social distancing.

Figure 4.
Type three seat interference.

Figure 5.
The graphical user interface (GUI) for the agent-based model in NetLogo. (view in the case of reverse pyramid with 3 groups and g1 = 6 and g2a = 3).
Figure 5.
The graphical user interface (GUI) for the agent-based model in NetLogo. (view in the case of reverse pyramid with 3 groups and g1 = 6 and g2a = 3).

Figure 6.
The seat positions pointed to by the g1 and g2a variables for a 30-row airplane.

Figure 7.
Reverse pyramid with 3 boarding groups and g1 = 1 and g2a = 1.

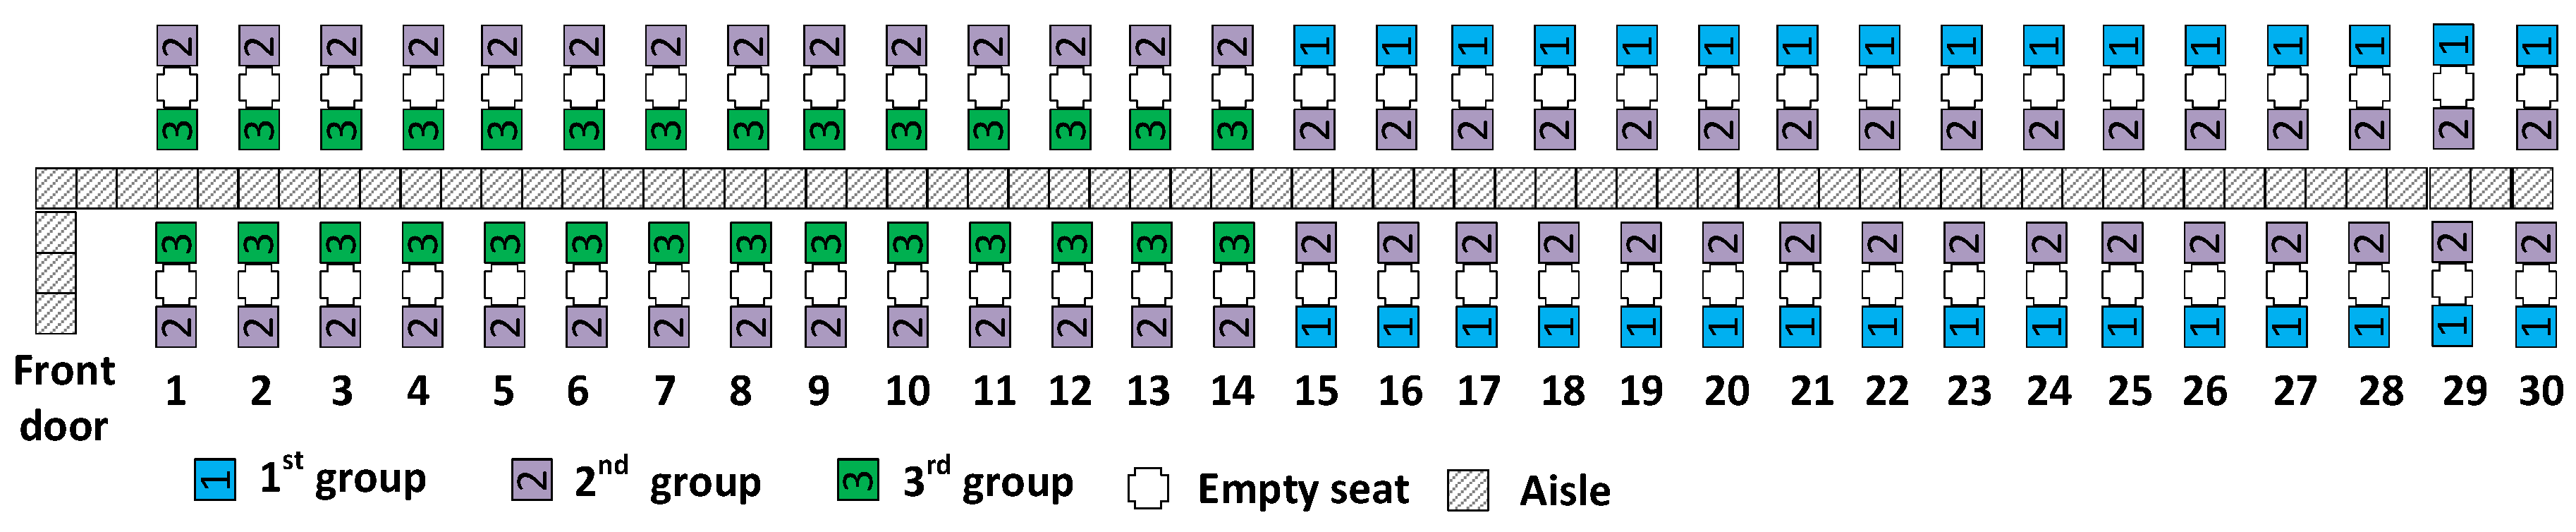
Figure 8.
Reverse pyramid with 3 boarding groups and g1 = 15 and g2a = 10.

Figure 9.
Reverse pyramid with 3 boarding groups and g1 = 29 and g2a = 29.

Figure 10.
The performance (in colors) of the g1 and g2a combinations when the objective function F was determined by weights w1 = 100%, w2 = 0%, and w3 = 0%.
Figure 10.
The performance (in colors) of the g1 and g2a combinations when the objective function F was determined by weights w1 = 100%, w2 = 0%, and w3 = 0%.

Figure 11.
The starting solution (24, 23), the area explored by the local search method and the best solution (25, 24) for weights w1 = 100%, w2 = 0%, and w3 = 0%.
Figure 11.
The starting solution (24, 23), the area explored by the local search method and the best solution (25, 24) for weights w1 = 100%, w2 = 0%, and w3 = 0%.

Figure 12.
The reverse pyramid scheme for the best local search solution G1 = 50, G2 = 58, and G3 = 12 for weights w1 = 100%, w2 = 0%, and w3 = 0%.
Figure 12.
The reverse pyramid scheme for the best local search solution G1 = 50, G2 = 58, and G3 = 12 for weights w1 = 100%, w2 = 0%, and w3 = 0%.

Figure 13.
The performance of the g1 and g2a combinations for w1 = 0%, w2 = 100%, and w3 = 0%.

Figure 14.
The starting solution, the area explored by the local search method, and the best solution (15, 15) for weights w1 = 0%, w2 = 100%, and w3 = 0%.
Figure 14.
The starting solution, the area explored by the local search method, and the best solution (15, 15) for weights w1 = 0%, w2 = 100%, and w3 = 0%.

Figure 15.
The reverse pyramid scheme for the best local search solution G1 = 30, G2 = 60, and G3 = 30 for weights w1 = 0%, w2 = 100%, and w3 = 0%.
Figure 15.
The reverse pyramid scheme for the best local search solution G1 = 30, G2 = 60, and G3 = 30 for weights w1 = 0%, w2 = 100%, and w3 = 0%.

Figure 16.
The performance of the g1 and g2a combinations for w1 = 0%, w2 = 0%, and w3 = 100%.

Figure 17.
The performance of the g1 and g2a combinations for w1 = 60%, w2 = 35%, and w3 = 5%.

Figure 18.
The reverse pyramid scheme for the best local search solution G1 = 32, G2 = 60, and G3 = 28 for weights w1 = 60%, w2 = 35%, and w3 = 5%.
Figure 18.
The reverse pyramid scheme for the best local search solution G1 = 32, G2 = 60, and G3 = 28 for weights w1 = 60%, w2 = 35%, and w3 = 5%.


Table 1.
Summary of the results for reverse pyramid with 3 boarding groups.
| Boarding Groups | Case | Weights | Local Search Results | |||||||
|---|---|---|---|---|---|---|---|---|---|---|
| w1 | w2 | w3 | g1 | g2a | F | Boarding Time | Aisle Seat Risk | Window Seat Risk | ||
| Unequal | C1 | 100% | 0% | 0% | 25 | 24 | 891.2 | 891.2 | 2338.0 | 8768.1 |
| C2 | 0% | 100% | 0% | 15 | 15 | 1745.8 | 907.7 | 1745.8 | 7192.3 | |
| C3 | 0% | 0% | 100% | 15 | 15 | 7192.3 | 907.7 | 1745.8 | 7192.3 | |
| C4 | 60% | 35% | 5% | 16 | 16 | 1515.2 | 904.5 | 1749.8 | 7200.5 | |
| Equal | C1 | 100% | 0% | 0% | 20 | 10 | 927.6 | 927.6 | 1972.2 | 8298.1 |
| C2 | 0% | 100% | 0% | 1972.2 | ||||||
| C3 | 0% | 0% | 100% | 8298.1 | ||||||
| C4 | 60% | 35% | 5% | 1661.7 | ||||||
Publisher’s Note: MDPI stays neutral with regard to jurisdictional claims in published maps and institutional affiliations. |
© 2020 by the authors. Licensee MDPI, Basel, Switzerland. This article is an open access article distributed under the terms and conditions of the Creative Commons Attribution (CC BY) license (http://creativecommons.org/licenses/by/4.0/).
Share and Cite
MDPI and ACS Style
Delcea, C.; Milne, R.J.; Cotfas, L.-A. Determining the Number of Passengers for Each of Three Reverse Pyramid Boarding Groups with COVID-19 Flying Restrictions. Symmetry 2020, 12, 2038. https://doi.org/10.3390/sym12122038
AMA Style
Delcea C, Milne RJ, Cotfas L-A. Determining the Number of Passengers for Each of Three Reverse Pyramid Boarding Groups with COVID-19 Flying Restrictions. Symmetry. 2020; 12(12):2038. https://doi.org/10.3390/sym12122038
Chicago/Turabian StyleDelcea, Camelia, R. John Milne, and Liviu-Adrian Cotfas. 2020. "Determining the Number of Passengers for Each of Three Reverse Pyramid Boarding Groups with COVID-19 Flying Restrictions" Symmetry 12, no. 12: 2038. https://doi.org/10.3390/sym12122038
Note that from the first issue of 2016, this journal uses article numbers instead of page numbers. See further details here.