
An Investigation of Social Distancing and Quantity of Luggage Impacts on the Three Groups Reverse Pyramid Boarding Method


1
Department of Economic Informatics and Cybernetics, Bucharest University of Economic Studies, 010552 Bucharest, Romania
2
David D. Reh School of Business, Clarkson University, 333 B.H. Snell Hall, Potsdam, NY 13699, USA
3
Department of Accounting and Audit, Bucharest University of Economic Studies, 010552 Bucharest, Romania
*
Author to whom correspondence should be addressed.
Symmetry 2021, 13(4), 544; https://doi.org/10.3390/sym13040544
Submission received: 11 March 2021
/
Revised: 22 March 2021
/
Accepted: 24 March 2021
/
Published: 26 March 2021
Abstract
:The social distancing imposed by the novel coronavirus, SARS-CoV-2, has affected people’s everyday lives and has resulted in companies changing the way they conduct business. The airline industry has been continually adapting since the novel coronavirus appeared. A series of airlines have changed their airplane boarding and passenger seat allocation process to increase their passengers’ safety. Many suggest a minimum social distance among passengers in the aisle while boarding. Some airlines have reduced their airplanes’ capacities by keeping the middle seats empty. Recent literature indicates that the Reverse Pyramid boarding method provides favorable values for boarding time and passenger health metrics when compared to other boarding methods. This paper analyses the extent to which aisle social distancing, the quantity of carry-on luggage, and an airline’s relative preferences for different performance metrics influence the optimal number of passengers to board the airplane in each of three boarding groups when the Reverse Pyramid method is used and the middle seats are empty. We also investigate the resulting impact on the average boarding time and health risks to boarding passengers. We use an agent-based model and stochastic simulation approach to evaluate various levels of aisle social distancing among passengers and the quantity of luggage carried aboard the airplane. When minimizing boarding time is the primary objective of an airline, for a given value of aisle social distance, decreasing the carry-on luggage volumes increases the optimal number of boarding group 1 passengers and decreases the optimal number of group 2 passengers with aisle seats; for a given volume of luggage, an increase in aisle social distance is associated with more passengers in group 1 and more aisle seat passengers in group 2. When minimizing the health risk to aisle seat passengers or to window seat passengers, the optimal solution results from assigning an equal number of window seat passengers to groups 1 and 2 and an equal number of aisle seat passengers to groups 2 and 3. This solution is robust to changes in luggage volume and the magnitude of aisle social distance. Furthermore, across all luggage and aisle social distancing scenarios, the solution reduces the health risk to aisle seat passengers between 22.76% and 35.31% while increasing average boarding time by less than 3% in each scenario.
1. Introduction
According to Powley et al. [1], the aviation industry is facing the worst crisis in its 100-year history due to COVID-19. To reduce losses and recover from this crisis, the main actors in the industry—airplane manufacturers, air transport associations, airlines, and airports—have tried to address issues raised by air transport travelers through campaigns and public interventions [1].
The International Air Transport Association (IATA) conducted a survey [2] related to the main measures which can be taken by airlines to create a feeling of safety. The survey respondents with a frequency >30% indicated that the following measures should be taken: screening all passengers for COVID-19 at departure (37%), mandatory wearing of masks in airplane and airports by passengers (34%), and social distancing on airplanes (33%). Other popular measures are: COVID-19 immunity certificate (27%), temperature testing at departure (26%), sanitization performed throughout the airplane (25%), receiving a personal sanitization kit to clean the seat area (24%), touchless processing throughout the airport (24%), having hand sanitizer readily available on board (22%), and requesting that all passengers complete a health declaration (17%) [2].
Measures implemented by airports and airlines include: boarding using groups of passengers [3] or based on seat number [4], boarding first those passengers with seats near the back of the airplane [5,6], keeping middle seats empty [7,8], suspending priority boarding [9], preventing passengers carrying luggage into the cabin [9,10], requiring passengers and crews to wear masks [9], keeping a social distance among walking passengers of 1 m [9], and using jet bridges when possible [9].
Observing the measures employed by the airlines and the passengers’ expectations, two common practices for social distancing are: keeping a minimum distance among the passengers walking down the aisle to their assigned seats and keeping the middle seat between passengers empty [11].
Some airlines have adapted their carry-on luggage policy to mitigate the impact of the novel coronavirus. Turkish Airlines [12] limited passenger carry-on luggage to one small piece of luggage. Flights in Italy for a limited period of time (11 June–15 July 2020) did not permit any carry-on luggage inside the airplane on national and international flights [13]. The IATA Medical Advisory Group recommended that travelers limit their carry-on luggage [14] to reduce the spreading of the virus.
In addition to social distance and limiting the quantity of carry-on luggage brought inside the airplane by passengers, airlines should also be interested in providing a safe boarding process by minimizing the potential risks generated by passengers walking down the aisle.
When a limited number of boarding groups are permitted, recent studies during the pandemic suggest that the Reverse Pyramid boarding method provides the smallest health risk, accompanied by a small value for the boarding time when passengers board through one jet-bridge or through the use of apron buses [15,16].
The present paper further analyzes how three factors (social distancing, passengers’ carry-on luggage, and relative preferences for boarding performance indicators) influence the quantity of passengers associated with each of the three boarding groups in the Reverse Pyramid boarding method. Expanding upon previous research [11], we increase the number of situations to be considered related to the social distance among the passengers when proceeding down the aisle to their assigned seats by considering aisle social distances of 1, 1.5, and 2 m, we vary the quantity of luggage brought by passengers into the airplane cabin, and we consider different weights for the performance indicators (boarding time, aisle seat risk, window seat risk).
To determine how the Reverse Pyramid method with three boarding groups is influenced by variations in the above-mentioned factors, we use an agent-based model, along with stochastic simulation.
The remainder of the paper is organized as follows. Section 2 provides a short literature review with a focus on the studies addressing the airplane boarding problem. Section 3 summarizes our assumptions, the agent-based model, the performance indicators we take into account, and the methods used for finding the optimal solution for each situation. Section 4 describes the situations considered when varying the social distancing, passengers’ carry-on luggage, and the weights associated with the performance indicators, and discusses the results obtained through simulation. The paper closes with concluding remarks. The paper is accompanied by video recordings (Video V1, Video V2 and Video V3) of a few airplane boarding situations.
2. Literature Review
The topic of airplane boarding methods has been addressed in the research literature long before the occurrence of the new coronavirus, as the boarding time was one of the main components of the turn time [17], which, if well handled, could have the potential of diminishing the cost associated with each flight. Nyquist and McFadden [18] and Steiner and Philipp [19] discussed the costs associated with a late departure due to an airplane standing in the airport and reported values between $30 and $70 per minute.
In that context, a series of research projects have focused on analyzing the elements that could influence a prolonged boarding time, to compare the proposed boarding methods based on their boarding time and discomfort generated for passengers, and to improve airplane boarding methods [20,21,22,23].
Depending on the rules used for passengers’ admission into the airplane cabin, the methods have been divided in the research literature related to the airplane boarding into three main categories: “random”, “by group”, and “by seat” [24].
In the case of “random” boarding, the passengers could have or not have an assigned seat on the boarding pass, and they arrive in a random sequence to the boarding gate. The passengers enter the airplane in a “first come, first serve” manner [25].
The methods featuring a “by group” rule impose a division of the passengers into groups based on their assigned seats. The division can be made following simple rules such as: all the passengers with seats near the window belong to the first group, all the passengers with middle seats belong to the second group, and all the passengers with aisle seats belong to the third group. This division is known as the WilMA (Window-Middle-Aisle) boarding method [25]. Another well-known “by group” method requires the division of the passengers into groups based on the rows in which they have a seat: rear, middle, or front, and this is the case for the back-to-front boarding method.
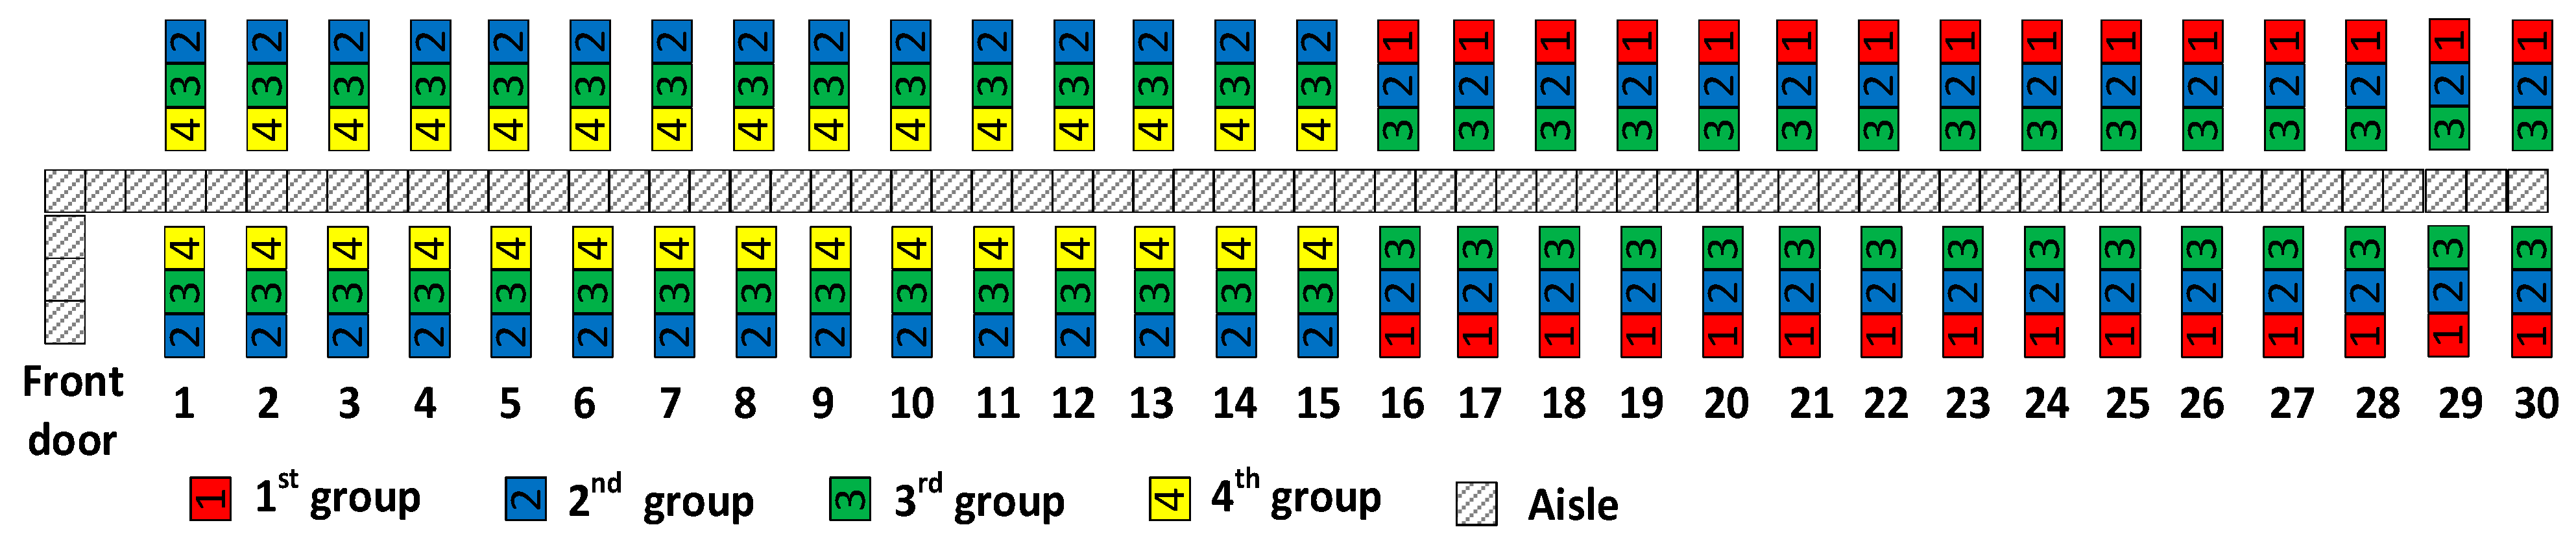
The Reverse Pyramid boarding method is an effective “by group” way to determine the sequence in which passengers enter an airplane. With this method, passengers may be divided into five groups based on their seat. The groups board in a diagonal scheme starting with those having window seats near the rear of the airplane and concludes with passengers having aisle seats near the front of the airplane [22]. The Reverse Pyramid method proposed by Van den Briel et al. [22] provides good performance when compared to other methods that segregate boarding passengers into a few groups. One variant of the Reverse Pyramid method, the Modified Reverse Pyramid Half-zone method, features the existence of four boarding groups and has been used by JetBlue [26]. In this variant, the first and the fourth group comprise a number of passengers reduced by half when compared to the number of passengers in the second and third groups. Figure 1 presents the scheme for the JetBlue Reverse Pyramid boarding method used for a single-aisle airplane with 30 seat-rows, without considering social distancing.
A division of the passengers into smaller groups can be encountered in the “by row” boarding methods, which are part of the “by group” boarding methods, with the difference being that in this case, the number of groups is equal to the number of rows with seats in the airplane [25]. To the best of our knowledge, the “by row” boarding methods (e.g., By-row-back-to-front, By-half-row-back-to-front [27]) have been rarely used in practice by the airlines. This might be due to the fact that their implementation creates additional overhead such as installing the proper infrastructure in the airport.
The “by seat” boarding methods assign a different group to each passenger. In this case, the airport needs to provide a proper infrastructure which allows each passenger to be called for boarding, one at a time, which makes these boarding methods hard to implement in practice. Among the most well-known methods from this category are: back-to-front by seating order, by-seat-descending-order, Steffen method, or variation in the Steffen method [25,28].
As for the assumptions made when building the models used for simulating the passengers’ boarding, various conditions have been considered in the research literature, such as: passengers’ personal characteristics [29,30], the presence and/or the quantity of carry-on luggage brought inside the airplane [21,31,32,33], airplane occupancy rates [31,34,35], airplane characteristics [20,36,37], and seat and/or aisle interferences [38,39,40,41].
The behavior of the passengers while inside the airplane has been simulated using a series of techniques. Some of these refer to: agent-based modelling [24,42,43], genetic algorithms [20], grid-based simulation model [41], mixed integer programming [38,44,45], simulated annealing [46], pedestrian flow modeling [47,48,49], and stochastic modeling [50,51,52].
The onset of the novel coronavirus stimulated further interest in the scientific community towards airplane boarding methods. Even though it has been a short time since the World Health Organization announced the occurrence of the novel coronavirus as a “pandemic” [53] on 20 March 2020, a series of papers have been written with respect to this matter. Schultz and Soolaki [54] propose an analytical approach to the airplane passenger boarding problem, while Salari et al. [55] discuss social distancing in airplane seating assignments. The risks generated by the contact between the passengers while boarding have been discussed by Schultz and Fuchte [56] and by Cotfas et al. [57].
Milne et al. [15] adapts the Reverse Pyramid boarding method to account for social distancing when apron buses are used to transport passengers from the airport terminal to the airplane. Their Adapted Reverse Pyramid method produces the best values for the health risk indicators when apron buses are used.
Delcea et al. [11] determines the quantities of passengers to include in each of the three Reverse Pyramid boarding groups when jet bridges are used and accounting for social distance (Figure 2). They assume aisle social distancing among passengers of 1 m and a luggage scenario in which 70% of the passengers carry inside the airplane one large and one small bag, 10% carry one large bag, 10% one small bag, and the remaining 10% of the passengers have no bag. The authors conclude that when an airline is overwhelmingly concerned with minimizing the average time to complete the boarding of the airplane, the first two Reverse Pyramid boarding groups should each have a large number of passengers. If the airline is more concerned with the health risks associated with the boarding process, then the scheme in Figure 2 is advisable. Depending on the airline’s strategy of balancing between the performance indicators (boarding time vs. health risks), other variations in Reverse Pyramid with three unequal size boarding groups can be considered.
The present paper extends the work of Delcea et al. [11] to analyze how different values of aisle social distancing and different volumes of carry-on luggage yield changes in the quantities of passengers to assign to each of the three Reverse Pyramid boarding groups and the resulting impact on performance. Based on this analysis, airlines can determine the number of passengers to include in each of the three Reverse Pyramid boarding groups depending on the particular conditions during times of social distancing.
3. Assumptions, Metrics, and Methods for Passenger Boarding Simulation
The assumptions, metrics, and methods presented in this section are in line with the previous studies from the field, as discussed in the following.
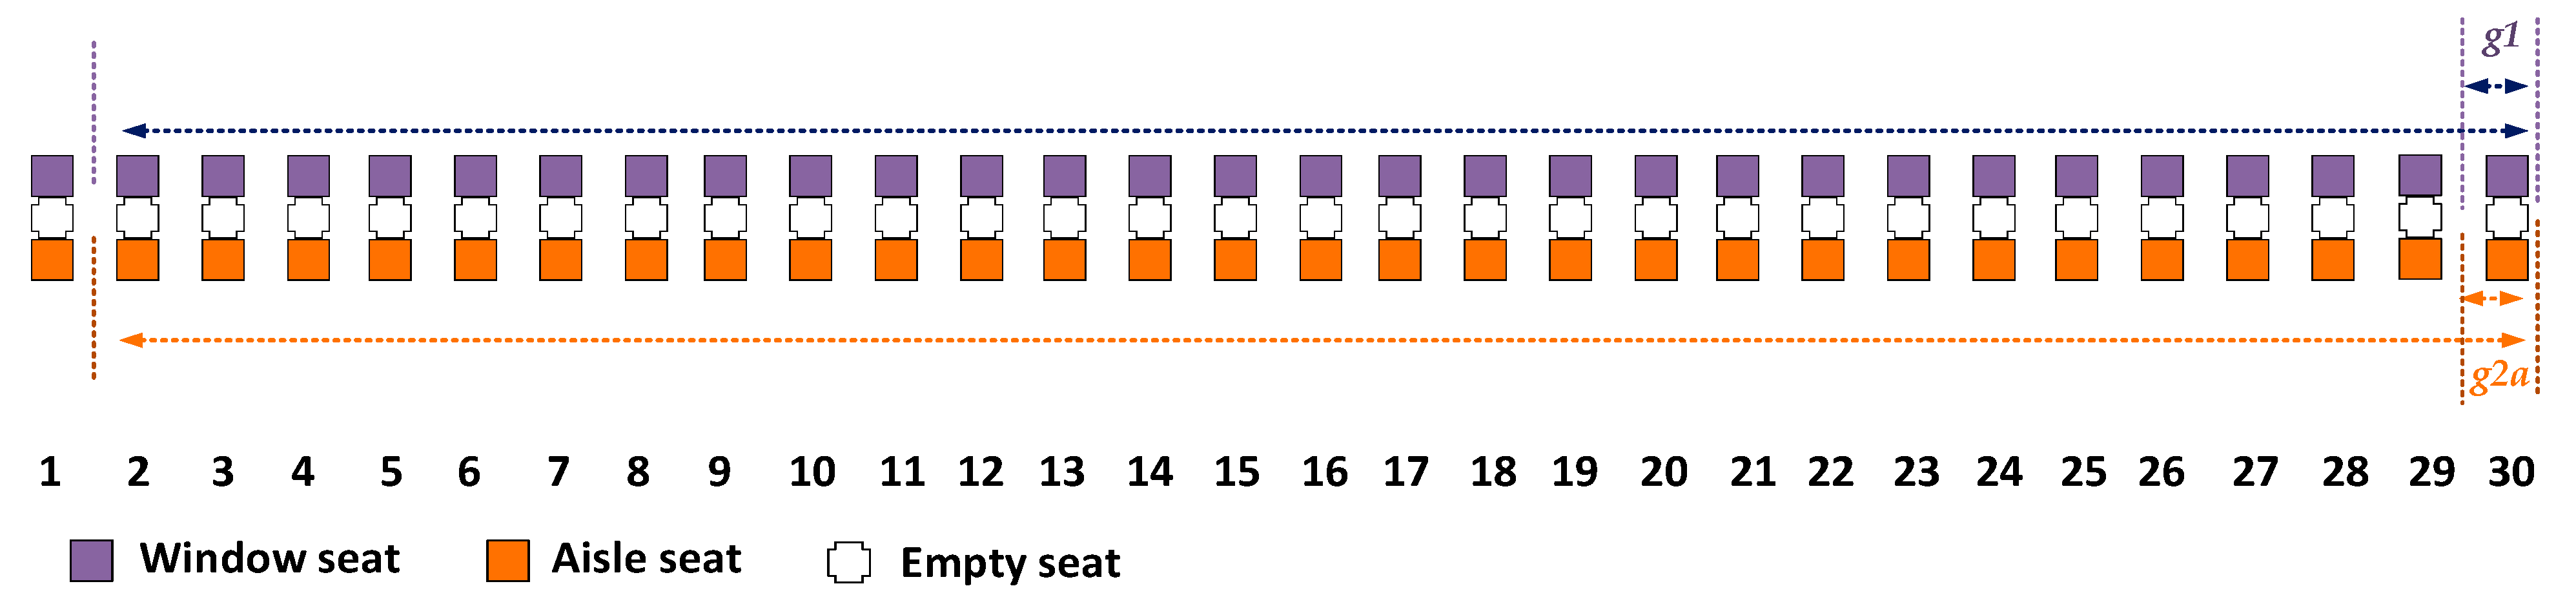
To model the quantities of passengers in each of three Reverse Pyramid boarding groups, two decision variables are used, noted with g1 and g2a, as stated in Reference [11], with:
- g1 representing the number of window seats allocated to the first group on each side of the aisle, and
- g2a representing the number of aisle seats allocated to the second group on each side of the aisle.
Figure 3 presents the possible values and positions of the seats associated with the g1 and g2a decision variables for a 30-row airplane, with a single aisle. The figure depicts only one side of the aisle, with an unshown identical pattern on the other side of the aisle. Once g1 and g2a have been determined, the values of g2w and g3, the number of window seat passengers and aisle seat passengers on each side of the aisle for groups 2 and 3, can be determined as 30 − g1 and 30 − g2a respectively, and further the value of g2, the number of group 2 passengers on each side of the aisle, can be determined as g2a + 30 − g1.
To maintain the boarding rules featured in the Reverse Pyramid method [11], the following conditions are imposed on the decision variables:
- g1 > 0, g2a > 0, integers
- g2a ≤ g1
- g1 ≤ n − 1, with n = the number of rows in the airplane.
For the 30-row single-aisle airplane we use in this study, there are 435 feasible combinations of g1 and g2a that satisfy the above conditions.
3.1. Assumptions for Passengers’ Social Distancing
Social distancing is assumed to slow down the spread of the new coronavirus [58]. It is one of the most recommended measures of the World Health Organization [59] for virus mitigation.
While inside the airplane, the social distancing among the passengers can be kept both when the passengers are walking down the aisle to their seats (named in the following as aisle social distancing) and when they are seated (seat social distancing).
The aisle social distancing can be kept inside the airplane if the passengers are correctly informed about the advised aisle social distancing length and if the passengers are willing to respect the recommended minimum distance. According to the World Health Organization [59], this distance should be approximately 1 m, while the International Air Transport Association [14] states that an ideal social distance should be between 1 and 2 m.
The seat social distancing refers to the distance among the passengers while seated. It can be ensured by keeping the middle seat empty within the airplane. According to Barnet [60], having a proper seat social distance can reduce the risk of spread of the new coronavirus by half. Some airlines, such as Delta Airlines [61], have implemented seat social distancing by blocking the middle seat.
In the following, we consider for the agent-based model and for the stochastic simulations, an aisle social distance which can vary, taking values of: 1, 1.5, or 2 m, and seat social distance resulting by leaving the middle seat empty on each side of the aisle. We assume that all window seats and all aisle seats are occupied. We further assume that all passengers board through the front of the airplane (such as when a jet bridge connects the airport terminal to the airplane).
3.2. Assumptions for Carry-on Luggage Quantities and Luggage Storage Times
As this paper studies how the different values for aisle social distance, luggage quantities, and performance metrics affect the performance of the Reverse Pyramid boarding method with three passenger groups, several scenarios are used for simulating the quantity of carry-on luggage the passengers bring inside the airplane.
In the agent-based model, we consider seven luggage scenarios as proposed in References [24,57,62]. The quantity of luggage varies in these scenarios between a situation in which 90% of the passengers carry at least one luggage in the cabin (scenario S1) to the situation in which the airline (or governing authority) prohibits carry-on luggage inside the airplane (scenario S7). The luggage scenarios are presented in Table 1.
To model the time it takes a passenger to store carry-on luggage in the overhead compartment, we implemented the formula suggested by Audenaert et al. [63] and adjusted by Milne et al. [24] in the agent-based model. The same formula has been used in References [62,64]. In this formula, the time needed to store the luggage in the overhead compartment depends on the size of luggage the passenger stores (small or big) and on the quantity and sizes of luggage already stored in the overhead compartment by previously boarded passengers.
3.3. Metrics: Boarding Performance Indicators
The boarding performance indicators refer to average values of boarding time, aisle seat risk, and window seat risk.
Boarding time is calculated as the time between the moment the first passenger enters the airplane and the last passenger occupies his or her seat [56]. The boarding time is expressed in seconds.
The two health risk performance indicators (aisle seat risk and window seat risk) are calculated as follows and are both measured in terms of the potential exposure duration (in seconds) from later boarding passengers for the passengers already seated in the airplane in the aisle seats and window seats, respectfully [15,16,43,57]:
where
- p = passenger advancing towards his or her seat
- r = row
- RowSitp = row in which passenger p has a seat
- RowTimepr = time that passenger p spends in row r
- p′ = passenger boarding before passenger p
- AisleSeatp′r = 1 if passenger p′ has an aisle seat in row r, =0 otherwise
- WindowSeatp′r = 1 if passenger p′ has a window seat in row r, =0 otherwise
Both health risk indicators are measured through summing the total time that a seated passenger is exposed to later boarding passengers who pass through or stand in the row. The summation is made for each passenger already seated in an aisle or window seat, for every moment in which a later boarding passenger is in the row.
Another potential health metric would be the number or duration of seat interferences. However, with the Reverse Pyramid methods, there are no circumstances in which a window seat passenger will board the airplane after a passenger with an aisle seat in the same row. Consequently, there are no seat interferences with Reverse Pyramid boarding.
3.4. Agent-Based Model
An agent-based model is used to simulate the passengers’ movement to their assigned seats. The model is implemented in NetLogo [65,66]. Compared to a grid-based approach, the agent-based modeling offers more flexibility as it allows the agents to move around the environment, following a given path. As the agents can freely move based on a set of given rules, the agents can stop moving at any moment of time when a particular situation might arise (such as their path is blocked by another agent or they have arrived at their assigned seat) and they do not need to be placed inside a cell (called patch in NetLogo) nor do they need to advance by a fixed distance from one moment of time to another (Figure 4). During each simulation step, the agents perform the assigned activities (such as moving down the aisle or taking their seat) in a sequential order. These actions are executed for the agents that have not yet taken their assigned seat, in the order in which they have entered the airplane.
Having this flexibility, the agents’ movement is similar to the movement of passengers involved in an airplane boarding process. The natural walk of the agents in the agent-based model can be observed by watching the videos accompanying this paper as Supplementary Materials, listed as Video V1, Video V2 and Video V3.
In the agent-based model, the agents have various individual speeds. The values for the speed are taken from the field trials conducted in an airplane boarding study [67] and have been transformed from meters/second to patches/tick. This translation is conducted because in NetLogo, the time is measured in ticks (1 tick corresponds to 1.2 s [64]), while the surface on which the turtle agents (representing the passengers) are moving is represented by a grid of squares, called patches (one patch is equivalent to 0.4 × 0.4 m [67,68]).
The speed of an agent is 1 patch/tick when the agent is not carrying any luggage. When an agent is carrying luggage, its speed is reduced to 0.6–0.9 patch/tick (modeled using the uniform probability distribution) [11,64]. In the case in which a passenger closely follows a slower passenger, the faster passenger’s speed will be reduced to maintain the imposed aisle social distance. The speed will become zero when the path of the agent is blocked by another agent and when the agent has reached its assigned seat. Additionally, the agents are not allowed to pass another agent in the aisle.
Other agent characteristic refers to the number of carry-on luggage pieces the agent carries inside the airplane. To retain the value for each agent, two variables are used: large-luggage and small-luggage.
Based on the formula suggested by Audenaert et al. [63] and adjusted by Milne et al. [24] related to the time needed for a passenger to store his or her luggage in the overhead compartment, a luggage-store-time variable is used in the agent-based model. This variable takes different values depending on the number of large-luggage and small-luggage that the agent carries into the airplane and by the space already occupied in the overhead compartment by luggage stored by the agents who have already taken their seats. Generally, the time needed to store luggage in the overhead compartment is up to 6 ticks.
The social distance between the agents while advancing through the aisle is kept in the aisle-social-distance variable, which can take the values 2.5, 3.75, or 5 patches, corresponding to the 1, 1.5, and 2 m values for aisle social distance. By keeping the aisle social distance equal to the mentioned number of patches, we assume that the aisle social distance is strictly followed and always respected by every agent. We acknowledge that this situation might not always happen in real-world boarding situations as some passengers might decide not to respect the imposed aisle social distance. This possibility is not modeled in this paper. We make the same aisle social distance assumption consistently across all scenarios conducted, and thus our experiments provide a consistent means for comparison of the scenarios.
The time needed for an agent to take its seat, after it has stored any luggage in the overhead compartment, is retained through the time-to-sit variable which is equal to 1 tick.
The boarding group to which the agent belongs according to its seat and the Reverse Pyramid with three boarding groups scheme is recorded in the agent-based model through the variable group that is attached to each turtle agent. This variable takes either 1, 2, or 3 as its value depending on whether the passenger is in the first, second, or third group of passengers to board, respectively.
Other state variables are used to monitor the state of the turtle agents (e.g., seated? which can take a true/false value indicating whether the agent has arrived at its assigned seat, luggage?—a true/false variable indicating the presence or absence of carry-on luggage) or the patch agents (e.g., is-seat?—indicating whether a patch is a seat or a portion of the aisle).
Each simulation run begins at time zero, when one of the agents marked as belonging to group 1 enters the airplane and proceeds to its allocated seat and ends at the moment the last passenger takes their seat. Between the first and the last tick of the boarding process, each agent enters the airplane after the preceding agent is an aisle-social-distance in front. Upon arriving at the row of its allocated seat, the agent first places the carry-on luggage (if any) in the overhead compartment and then proceeds to its allocated seat. For each seated passenger in the aisle or window seat, the aisle seat risks and window seat risks are determined each time a passenger walks the aisle to its assigned seat and spends an amount of time in the same row as the seated passenger. At the end of the simulation, the agent-based model reports the values for the performance indicators. During the simulation, one can observe the passengers’ movement and read in real-time the values of the performance indicators from the monitors presented in the graphical user interface (GUI), as illustrated in Figure 5.
The simulation uses a fixed-increment time progression, which means that within each fixed unit of time (a “tick” in our nomenclature), the state of the system is updated to reflect the set of activities that occurred during each tick. These activities include: move down the aisle, wait for another passenger to advance along the aisle or to store the luggage in the overhead compartment or to take their seat, store their own luggage, and sit down in their allocated seat.
Regarding the agents’ interactions while boarding, fewer interactions can be encountered in this case when compared to other boarding methods due to the boarding rules of the Reverse Pyramid method. For example, seat interactions do not occur with the Reverse Pyramid method because passengers seated closer to the window board before passengers seated closer to the airplane’s aisle. As a result, the only potential interaction between agents occurs when they are in the aisle. This interaction can result in a reduction of an agent’s speed when an earlier boarding adjacent agent is moving more slowly down the aisle (for example, if the earlier boarding agent carries luggage and the later boarding agent does not). The interaction can also result in a reduction of an agent’s speed when an earlier boarding agent has paused in the aisle (for example, to store luggage). In both cases, the interaction is based on an agent being forced to adapt its speed based on the speed of the agent in front of it and the necessity of ensuring the imposed aisle social distance.
The agents interact with the environment by moving down the aisle and by the logic determining in each moment the agent’s current position in connection with its allocated seat. The state of the environment concerning the quantity of luggage stored in the overhead compartment influences the time to store the luggage of each agent. As a result, the time needed to store the luggage depends on both the state of the environment (quantity and type of the luggage already stored by any previous agents which have taken their allocated seats in the same row) and the quantity and type of luggage carried by the agent.
As the focus of the present paper is on the performance of the Reverse Pyramid boarding method with three passenger groups when different values are used for aisle social distance, different luggage scenarios, and different preferences (weights) for the performance metrics, the implementation of the agent-based model will not be discussed in further detail here. A complete description of the implementation is provided in any of the following papers: [11,24,57].
3.5. Local Grid Search and Full Grid Search
As described above near the beginning of Section 3, the decision variables g1 and g2a refer to the number of window seat passengers on each side of the aisle allocated to the first boarding group of passengers and the number of aisle seat passengers on each side of the aisle allocated to the second boarding group. The effectiveness of the particular combination of values chosen for g1 and g2a varies according to the aisle social distance and luggage scenarios. These combinations are evaluated based on the relative preference for the performance metrics. These preferences are expressed through user-specified weights. The weight applies to BoardingTime, applies to , and applies to . All of these performance metrics are expressed in seconds. The objective function, F, is a weighted average of the metrics as follows:
Given weights for the performance metrics of the objective function, we find the optimal solution (i.e., best values of g1 and g2a) for a particular aisle social distance and luggage scenario, by conducting a full grid search followed by a local optimization search. The full grid search examines all feasible combinations of g1 and g2a and conducts 1000 simulation trial runs for each combination. The solution from the full grid search that results in the best weighted objective function value becomes an input for the local optimization search that follows.
The local search conducts 30,000 simulation runs for each combination of g1 and g2a evaluated. Beginning with the incumbent solution resulting from the full grid search, at each iteration, all neighboring feasible points are examined, except those that have been examined earlier in the local search for the scenario. The best neighboring point of an iteration—according to the objective function—becomes the incumbent solution, and the method continues. The local search stops when all neighboring points provide worse results than the incumbent solution or when all neighboring feasible points have been evaluated during the local search. At this point, the incumbent solution contains the best values of g1 and g2a for the particular aisle social distance, luggage scenario, and set of weights chosen by the user.
For further details on the local optimization search and full grid search methods, please see Delcea et al. [11].
4. Numerical Simulation—Scenarios and Results
We examine the four cases used in Reference [11]. For a proper comparison with the previous results, Table 2 presents for each case the associated weight and the optimal solution determined in Reference [11] for the high volume of luggage scenario S1. The first three cases apply weights of 100% to the first, second, and third performance metrics respectively, while the fourth case, C4, provides a more balanced setting of the weights. We examine each of the four cases in turn in the following subsections.
4.1. Simulation Results for C1
The first examined case is C1, in which the performance of the average boarding time is given total priority, with = 100%, while the other performance indicators are ignored ( = 0% and = 0%).
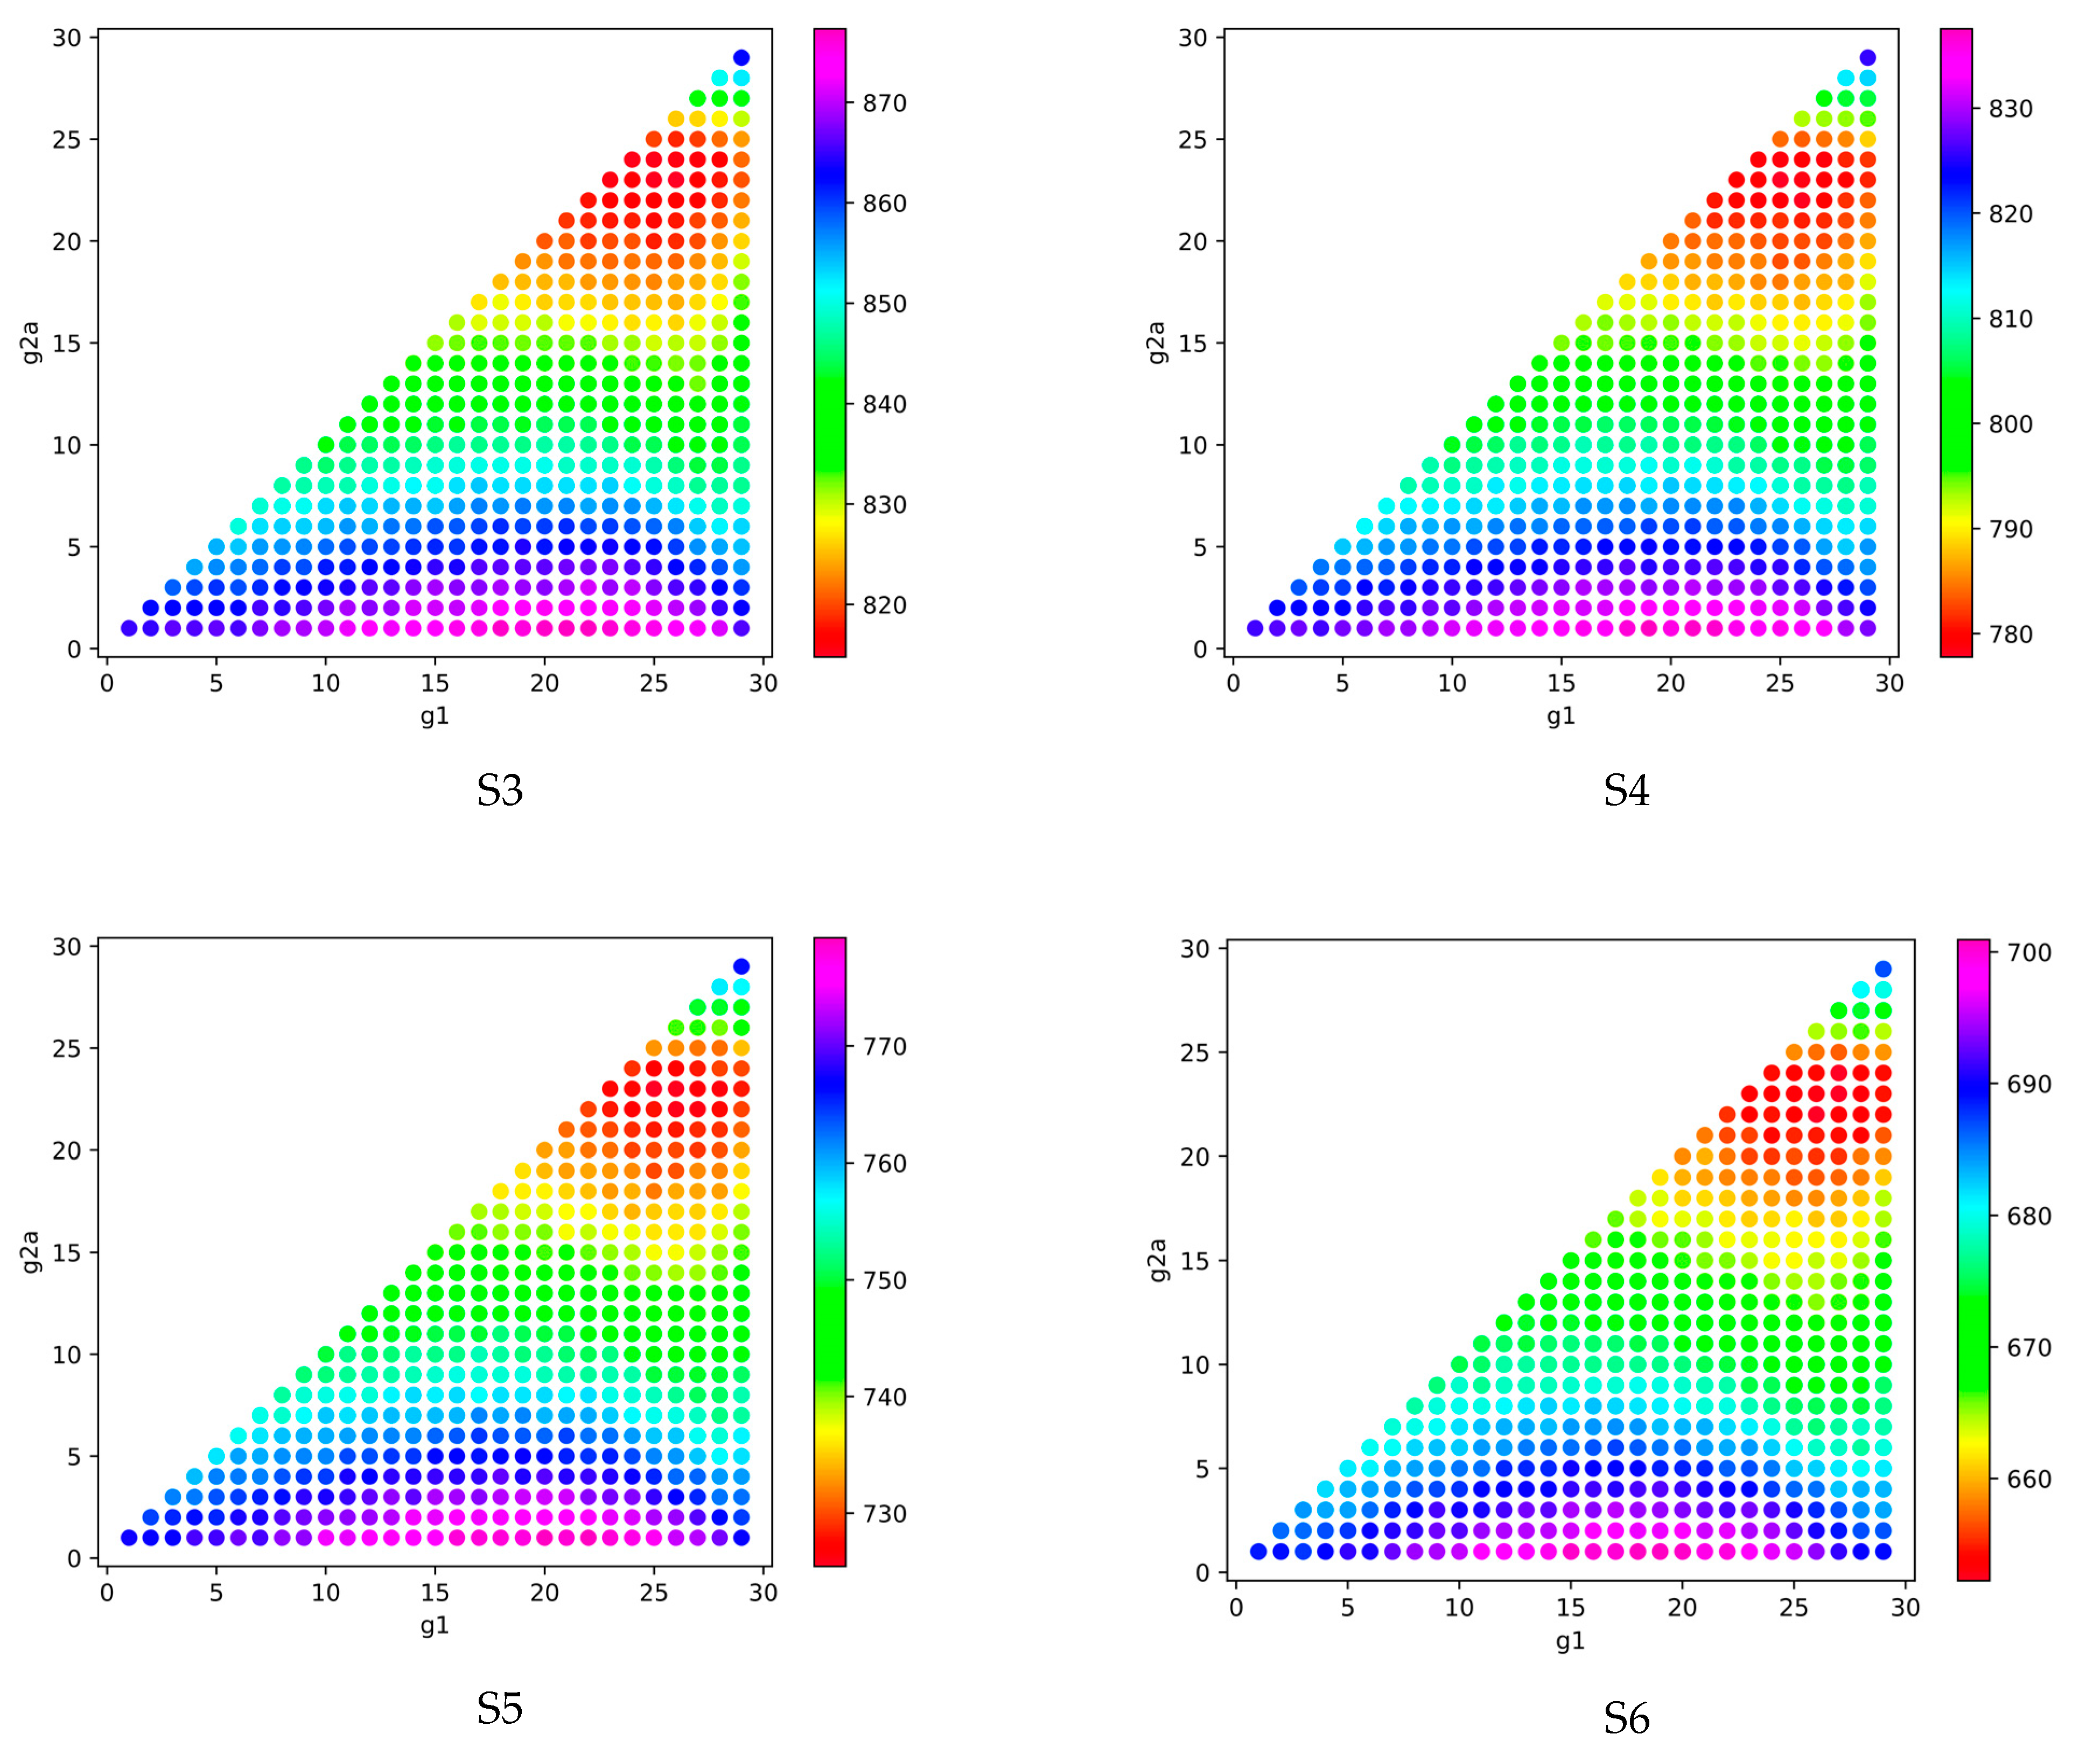
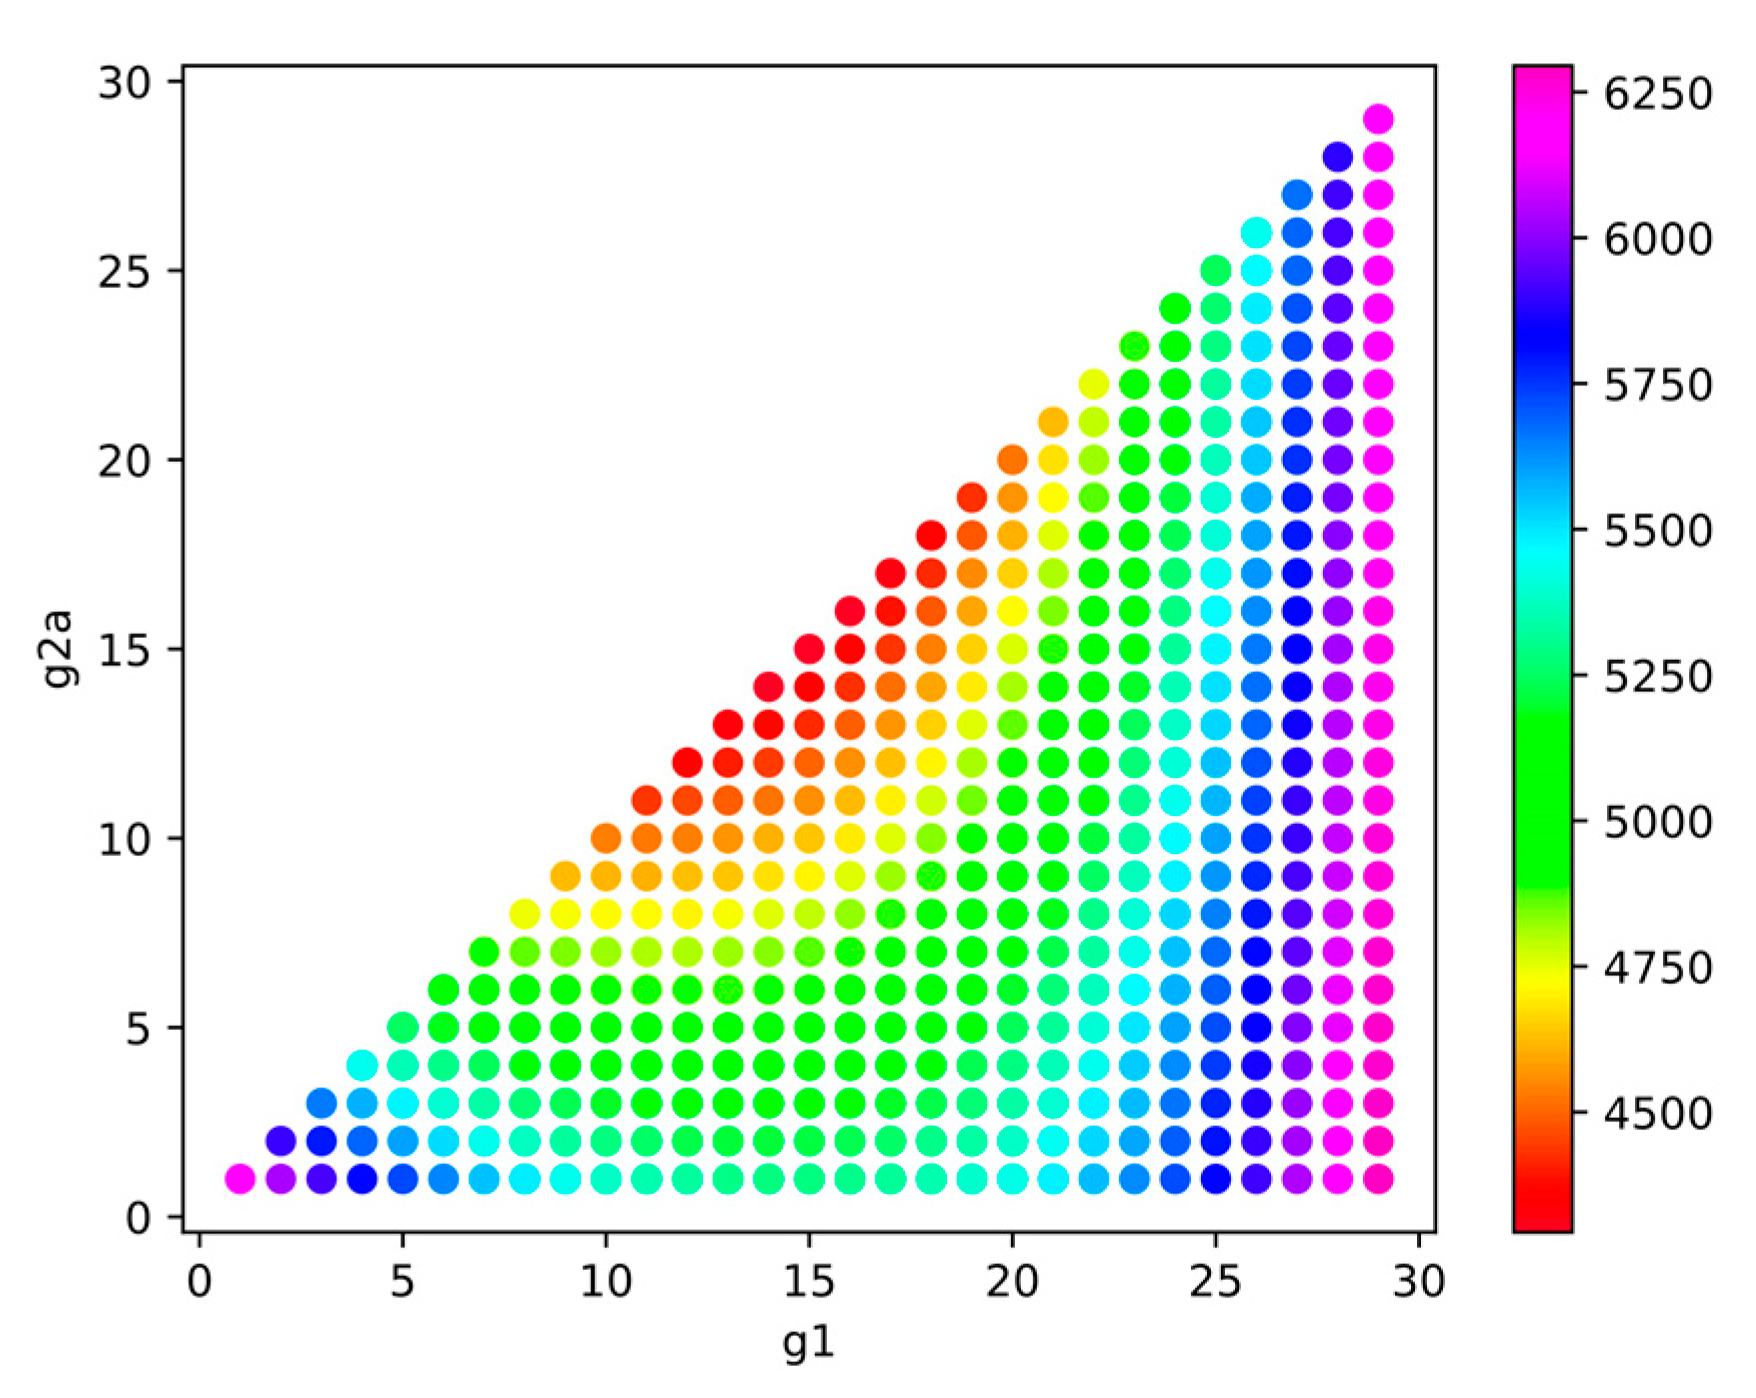
Based on the full grid search, the performance of the g1 and g2a combinations for 1 m aisle social distance and S1–S6 luggage scenarios is depicted using colors in Figure 6. The colors correspond to the values of the objective function, F, expressed in seconds.
As observed in Figure 6, the best-performing combinations of g1 and g2a are those for which the value of g1 is between 18 and 29, while the value for g2a ranges between 17 and 26. As the quantity of luggage decreases (from S1 to S6), the best g1 and g2a combinations tend to have higher values for g1, while the lower and upper bounds for the best values of g2a tend to increase and decrease, respectively. This observation is further supported by the S7 luggage scenario with 1 m aisle social distance depicted in Figure 7, where the area containing the best-performing g1 and g2a combinations is easily distinguished, having g1 ranging between 22 and 29, and g2a between 21 and 24.
The remaining results for the full grid search (on 1.5 and 2 m aisle social distance) are similar to the ones presented on 1 m aisle social distance, with the only difference being that the values of the objective function calculated for each g1 and g2a combination are higher than in the 1 m aisle social distance case (the figures depicting these situations, Figures S1 and S2, are included as Supplementary Materials).
After the local searches are performed, the optimal solutions for the luggage scenarios (S1–S7) for the three aisle social distances cases (1, 1.5, and 2 m) are presented in Table 3 and Figure 8.
The most common combination encountered is (27, 24), which produces the best results with 1.5 m aisle social distance and for the five scenarios with less luggage (S3 through S7), as illustrated by the five triangles at that point (27, 24) in Figure 8.
Based on the data in Table 3 and Figure 8, we observe that the best-performing configurations for (g1, g2a) are the ones for which g1 ranges between 25 and 29, while g2a takes values between 23 and 26. Accounting for passengers on both sides of the airplane’s aisle, for the C1 case, the first two groups of passengers to board should have many passengers (between 50 and 58 for group 1 and between 46 and 52 for group 2), while the third group (with 2 ∗ (30 − g2a passengers)) should have a smaller number of passengers (between 8 and 14).
From Table 3 and Figure 8, we observe that for a given value of aisle social distance, as the quantity of luggage decreases (from S1 to S7), the best values for g1 increase (or stay the same for some luggage incremental decreases), while the best values for g2a decrease (or stay the same for some increments). Furthermore, as luggage volumes decrease, the value of g1–g2a grows (or stay the same) and averaged across all aisle social distances, the average value of g1–g2a grows (never stays the same) with each decrease in luggage. This means that as luggage volumes decrease, more passengers are placed into group 1 and fewer into group 2. Meanwhile, for a given value of aisle social distance, the number of passengers in group 3 increases by one passenger per side of the aisle (two total) when less luggage (scenarios S3 to S7) is carried aboard the airplane than the higher volume of luggage scenarios (S1 and S2). For example, when the aisle social distance is 2 m, Figure 9 and Figure 10 illustrate the optimal solutions for the high luggage scenario S1 and no luggage scenario S7, respectively. As illustrated, in the solution with no luggage (Figure 10), boarding group 2 has six fewer window seat passengers and two fewer aisle seat passengers than when the luggage volume is high (Figure 9).
As observed from watching many simulated video animations of the boarding process, in an optimal solution, the final group 2 passenger to sit, on average, may sit at about the same time as the final group 3 passenger sits. This is achieved through a balance in the values of g2 and g3. While a limited number of group 2 passengers have window seats near the front of the airplane, the vast majority of the group 2 passengers sit in aisle seats closer to the rear of the airplane than the group 3 passengers. That fact tends to lead towards the group 2 passengers sitting down later than the group 3 passengers. On the other hand, all group 2 passengers enter the airplane before any group 3 passengers enter. This second factor tends to lead toward group 2 passengers sitting down earlier than group 3 passengers. Thus, an optimal solution balances those two antagonistic factors so that the two groups complete their seating at about the same time on average. In the experiments conducted within this paper for case C1, there are more passengers in group 2 than in group 3.
For a given luggage scenario, when the aisle social distance between the passengers increases, the value of g1 increases (or stays the same) for each 0.5 m increment in aisle social distance from 1 to 2 m, and the value of g2 increases (and never stays the same) for each 0.5 m increment in aisle social distance from 1 to 2 m. For a given luggage scenario, the number of passengers in group 3 decreases by one passenger per side of the aisle (two total) for each 0.5 m increase of the aisle seat social distance from 1 to 2 m. For example, when the aisle social distance increases from 1 to 2 m in the S7 (no luggage) scenario, as illustrated in Figure 10 and Figure 11 respectively, there are six fewer window seat passengers and four fewer aisle seat passengers in boarding group 2.
The values for the three performance indicators (average boarding time, average aisle seat risk, and average window seat risk) for case C1 are presented in Table 4, Table 5 and Table 6.
From Table 4, we observe, as expected, that as the quantity of luggage brought inside the airplane by the passenger decreases, the boarding time decreases as well. The boarding time difference between the S1 and S7 luggage scenarios varies between 40.22% and 43.43% across the three aisle social distances. Observe that as the aisle social distance increases, the average boarding time increases. The boarding time increase varies between 57.37% and 66.23% across the seven luggage scenarios.
The results for average aisle seat risk and average window seat risk (Table 5 and Table 6) show that as the quantity of luggage decreases, both risks decrease. In the case of aisle seat risk, the decrease is between 40.44% and 42.13% when comparing results of the S1 and S7 luggage scenarios, while the window seat risk decreases between 29.27% and 44.27%.
The relationship between luggage volumes and health risk can be understood as follows. The aisle and window seat risks are based on the duration of time that later boarding passengers are in the aisle while earlier boarding passengers are seated. That duration depends on both the number of later boarding passengers that pass them and the duration each of those later boarding passengers spend in the aisle. As luggage volume increases, the later boarding passengers spend longer in the aisle, on average, due to increased delays (Table 5). Consequently, as their time waiting in the aisle increases, the risk of later boarding passengers infecting those previously seated increases.
The relationship between aisle seat risks and aisle social distance does not exhibit a consistent pattern. That is because of the impact of aisle social distance on the optimal solution. As the aisle social distance increases, the optimal solution has an increasing value of g2a, which worsens aisle seat risk as more group 2 aisle seat passengers walk to their seats passing others from the same group already seated. Had the optimal solution not changed when the aisle social distance increased, then aisle seat risk would have decreased. For example, with luggage scenario S1, a solution of (25, 24) will result in the decreasing values of aisle seat risk of 2338.0, 2295.3, and 2254.8 s for aisle social distancing of 1, 1.5, and 2 m respectively, and a solution of (26, 26) would have decreasing aisle seat risks of 2628.4, 2583.2, and 2554.1 for aisle social distancing of 1, 1.5, and 2 m, respectively. This pattern is consistent with Reference [16], that found aisle seat risk durations decrease when aisle seat risk durations increase. However, as noted above, that relationship holds only when the optimal solution is held constant.
4.2. Simulation Results for C2
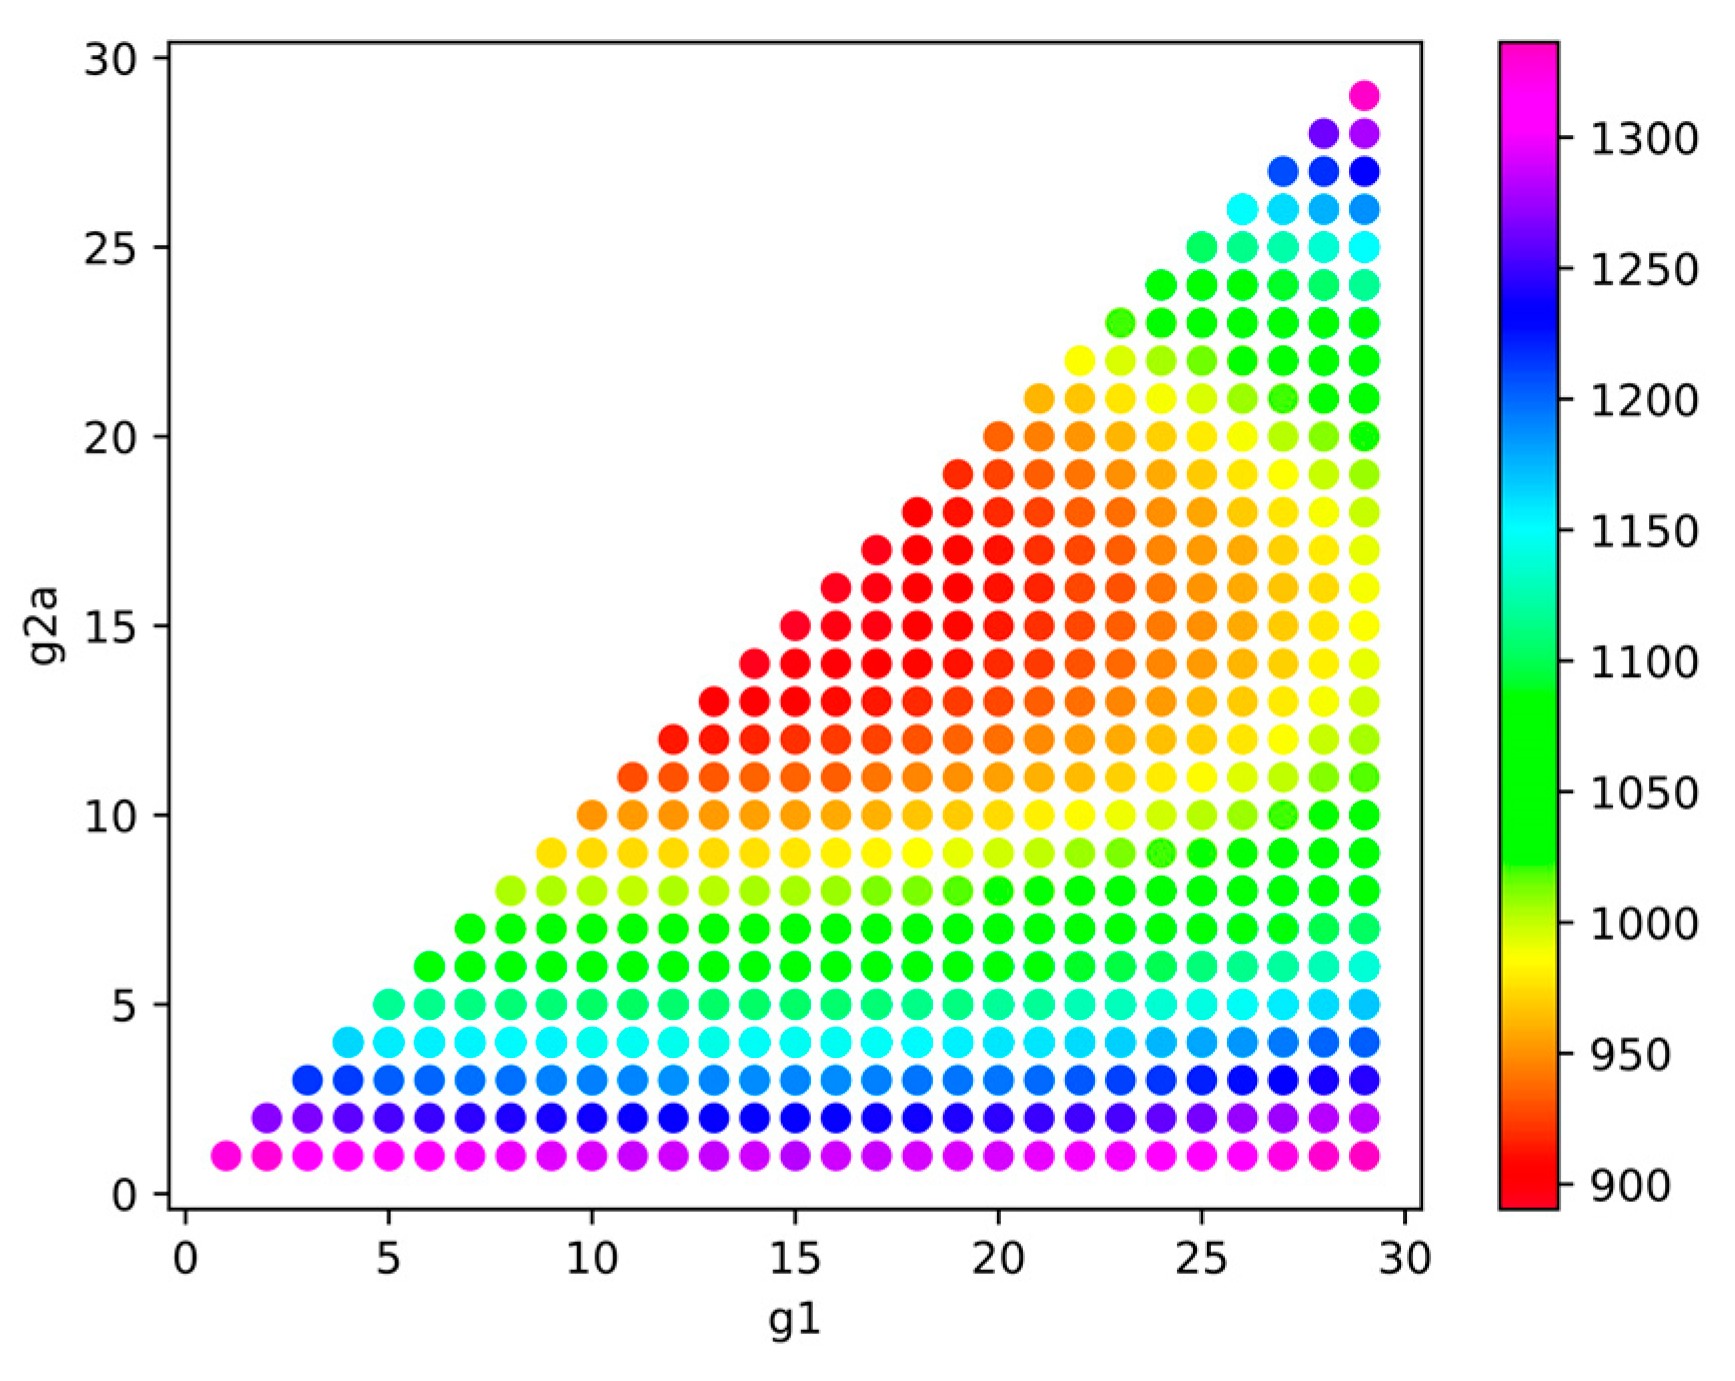
The second examined case is C2. In this case, the average aisle seat risk is given total priority with = 100%, while all the other performance indicators are ignored ( = 0% and = 0%).
For C2, the performance of the g1 and g2a combinations for 1 m aisle social distance and S7 luggage after running the full grid search is depicted using colors in Figure 12. The values of g1 and g2a for which the Reverse Pyramid boarding method performs best are in the range between 10 and 29 for g1 and 10 and 20 for g2a. The results obtained for the remaining luggage scenarios for all three values of aisle social distance are depicted in Figures S3–S5 (as Supplementary Materials). Considering all these figures, observe that in all situations, the range of the values for g1 and g2a that provide the best results in terms of full grid search is almost the same (g1 between 10 and 29 and g2a between 10 and 20).
After running the local grid search for all combinations of luggage and aisle social distance scenarios, the best performing Reverse Pyramid method with three unequal groups is obtained for g1 = 15 and g2a = 15 (Figure 2). The results are consistent with the findings in Reference [11] for S1, 1 m aisle social distance. This consistency is insightful because it confirms that the results of that earlier study continue to apply regardless of the volume of luggage and the value of aisle social distance. The earlier work [11] shows that the combination of g1 = 15 and g2a = 15 results in the fewest number of later boarding passengers passing previously seated aisle seat passengers. As explained above, aisle seat risk depends on the number of later boarding passengers who pass them and also on the duration those later boarding passengers are in the aisle. Of those two contributors to aisle seat risk, the former factor (number of passing passengers) appears to have a larger impact on the best values of g1 and g2a than the latter factor. That is, even though the values of g1 and g2a affect waiting time in the aisle and vary with luggage volumes and aisle social distance, the best values for g1 and g2a (in terms of minimizing aisle seat risk) are the same regardless of luggage volume and aisle social distance. The solution of g1 = 15 and g2a = 15 is thus robust to changes in luggage volume and the magnitude of aisle social distance—at least over the broad ranges tested.
Table 7 presents the average boarding times for all luggage scenarios and aisle social distances for C2. Similar observations as in the previous case can be made with respect to the diminishing of the boarding time as the luggage quantity becomes smaller and the increase of boarding time as the aisle social distance is increased. Compared to the best solutions obtained in the C1, the values obtained for the boarding time are up to 2.83% higher. This is not surprising given that average boarding time metric had 100% weight in the objective function in C1 and zero weight in C2.
The average values for aisle seat risk are presented in Table 8. As the aisle social distance increases from 1 to 2 m, we observe that the average aisle seat risk decreases up to 4.28%. Again, this makes sense. As aisle social distance increases, the average waiting times of passengers to enter the airplane increases, but their average waiting times in the aisle would be expected to decrease (consistent with Table 8). In the case of the no luggage scenario (S7), we observe that the increase in the aisle social distance has little impact on the overall aisle seat risk. Without the need to store luggage, none of the passengers are waiting in the aisle long regardless of aisle social distance.
Compared to the best combinations of the Reverse Pyramid boarding method obtained in the C1 case, we observe that when choosing the Reverse Pyramid with g1 = 15 and g2a = 15, the average aisle seat risk is reduced between 22.76% and 35.31% depending on the luggage and aisle social distance scenarios.
In terms of average window seat risk, the values in Table 9 have been obtained for the optimal solution (15, 15). Even in this case, we observe that for the S7 luggage scenario, similar values for this risk have been obtained. As a result, the increase in the aisle social distance has no particular influence in reducing the window seat risk if the passengers are travelling with no carry-on luggage (there is incidental variation in results due to randomness). As for the S1–S6 luggage scenarios, the increase in aisle social distance from 1 to 2 m contributes to a decrease in the value of the average window seat risk up to 3.24%.
Compared to the results obtained in C1 for this type of risk, observe that in the case of the optimal solution found for C2, namely (15, 15), the average window seat risk is reduced between 12.24% and 30.68%.
4.3. Simulation Results for C3
The third examined case is C3. In this case, the average window seat risk is given total priority with = 100%, while all the other performance indicators are ignored (having = 0% and = 0%).
The full grid search in the C3 case reveals that the best-performing results have different combinations for g1 and g2a than in the previous two cases, and in fact, the shape (pattern) of the best-performing (red) colors in Figure 13 changes. This figure depicts the performance of the Reverse Pyramid boarding method in terms of window seat risk for the S7 luggage scenario, 1 m aisle social distance. Similar results are obtained for the other considered scenarios (please see the Supplementary Materials Figures S6–S8).
After performing the local grid search, the best-performing combination of g1 and g2a has been (15, 15) for all the luggage scenarios and for the three values of aisle social distance considered. The reason for this is analogous to the reasoning described in the previous subsection because minimizing window seat risk is conceptually similar to minimizing aisle seat risk. The values for the three performance indicators have been presented above in Table 7 and Table 9.
4.4. Simulation Results for C4
The fourth and final case examined is C4. The objective function of this case considers all three performance metrics, with = 60%, = 35%, and = 5%.
The full grid search in this case reveals a different area in which the best-performing Reverse Pyramid boarding methods are located—marked in red in Figure 14. Similar results, namely g1 between 10 and 26 and g2a between 10 and 20, have been obtained for all the considered luggage scenarios in all the three aisle social distance cases (please see Supplementary Figures S9–S11).
After running the local grid search, the best-performing solutions have been determined, as presented in Table 10. The optimal solution for C4 is (15, 15) in most of the scenarios. The optimal solution is (16, 16) for the S1 luggage scenario with 1 and 1.5 m aisle social distance and the S2 luggage scenario with 1 m aisle social distance.
For the three scenarios leading to (16, 16) for C4, the second-best solution is (15, 15), which has similar performance. The value of the objective function for the second-best solution is no more than 0.06% worse than the optimal value across all three scenarios.
The average boarding time, average aisle seat risk, and average window seat risk for C4 are presented in Table 11, Table 12 and Table 13. Comparing the three situations in which (16, 16) has been obtained as an optimal solution for C4 with the values obtained in the case of C2 and C3, we observe that the average boarding time is up to 3.6 s lower in the case of the (16, 16) solution than in the case of the (15, 15) solution (Table 7 and Table 11).
Compared to the C2 and C3 cases, observe that the values for the average aisle risks are slightly worse in the C4 case, with up to 4 s of difference (Table 8 and Table 12).
In terms of average window seat risk, the values recorded for the optimal solution of C4 are up to 22.4 s higher than the ones recorded for the C2 and C3 cases (Table 9 and Table 13).
Based on the cases examined above, observe that depending on the relative importance an airline places on the three performance indicators, the luggage policy the airline uses, and the aisle social distance imposed by the epidemiological situation, the three-groups Reverse Pyramid scheme can be adapted to best fit the conditions.
5. Concluding Remarks
The present paper analyzed how different values of aisle social distance and different volumes of carry-on luggage change the optimal number of airplane passengers to assign to each of the three Reverse Pyramid boarding groups and the resulting performance.
We measured performance through three metrics: the average boarding time, the average aisle seat risk, and the average window seat risk. Based on the relative importance an airline assigns to those performance indicators and the particular conditions encountered, the airline can determine the number of passengers to include in each of the three Reverse Pyramid boarding groups.
We examined four cases involving different weights for the performance metrics. Stochastic simulation results indicated that, in most of the cases, increasing the aisle social distance leads to increasing boarding time and decreasing aisle seat risk and window seat risk, while increasing the quantity of luggage increases all three performance indicators (boarding time, aisle seat risk, and window seat risk).
When boarding time is the primary performance objective of the airline, for a given value of aisle social distance, as the quantity of luggage decreases, the best solution is characterized by an increase in the value of g1 (number of boarding group 1 passengers) and a decrease of g2a (number of group 2 aisle seat passengers). On the other hand, for a given volume of luggage, as the aisle social distance increases, the best value of g1 increases or stays the same, while the best value of g2 increases and never stays the same. Increases (decreases) in g2 are associated with a corresponding increase (decrease) in the number of passengers boarding in group 3. Similarly, as the number of group 1 passengers increases (decreases), the number of group 2 window seat passengers decreases (increases). For all scenarios tested with boarding time as the primary objective, most window seat passengers are assigned to boarding group 1 and most aisle seat passengers are assigned to boarding group 2.
When an airline places top priority on minimizing the health risk to passengers (i.e., minimizing the health risk to aisle seat passengers or window seat passengers), the solution g1 = 15 and g2a = 15 provides the safest boarding process. This solution divides the window seat passengers equally between groups 1 and 2 and divides the aisle seat passengers equally into groups 2 and 3. This solution is robust to changes in luggage volume and the magnitude of aisle social distance. Furthermore, depending on the luggage and aisle social distancing scenarios, the (15, 15) solution reduces the health risk to aisle seat passengers between 22.76% and 35.31% when compared with the best solution that minimizes average boarding time, while incurring average boarding times that are less than 3% higher than the latter solutions. Consequently, the (15, 15) solution is an attractive possibility for airlines wanting to minimize health risk to their passengers.
The research can be extended by increasing the number of groups in Reverse Pyramid and observing how the results change when different levels of aisle social distance are considered, while varying the quantity of carry-on luggage brought by the passengers inside the airplane. Additional research could be conducted to ascertain the impact of the aisle and window seats being partially occupied due to unsold seats.
The paper is accompanied by three videos (Video V1, Video V2 and Video V3 available as Supplementary Materials). Each video contains a visual animation of passengers boarding the airplane in a simulation trial of a best solution of the g1 and g2a variables corresponding to a particular condition of Section 4.
Supplementary Materials
The following results of full grid simulations are available as Supplementary Materials. The following are available online at https://www.mdpi.com/article/10.3390/sym13040544/s1, For Figures S3, S6, and S9, the results for S7 luggage scenario are included in the main body of the manuscript and thus omitted from the Supplementary Materials. Figure S1: The performance (in colors) of the g1, g2a combinations when the objective function is determined by weights = 100%, = 0%, and = 0%, for the S1–S7 luggage scenarios, 1.5 m aisle social distance. Figure S2: The performance (in colors) of the g1, g2a combinations when the objective function is determined by weights = 100%, = 0%, and = 0%, for the S1–S7 luggage scenarios, 2 m aisle social distance. Figure S3: The performance (in colors) of the g1, g2a combinations when the objective function is determined by weights = 0%, = 100%, and = 0%, for the S1–S6 luggage scenarios, 1 m aisle social distance. Figure S4: The performance (in colors) of the g1, g2a combinations when the objective function is determined by weights = 0%, = 100%, and = 0%, for the S1–S7 luggage scenarios, 1.5 m aisle social distance. Figure S5: The performance (in colors) of the g1, g2a combinations when the objective function is determined by weights = 0%, = 100%, and = 0%, for the S1–S7 luggage scenarios, 2 m aisle social distance. Figure S6: The performance (in colors) of the g1, g2a combinations when the objective function is determined by weights = 0%, = 0%, and = 100%, for the S1–S6 luggage scenarios, 1 m aisle social distance. Figure S7: The performance (in colors) of the g1, g2a combinations when the objective function is determined by weights = 0%, = 0%, and = 100%, for the S1–S7 luggage scenarios, 1.5 m aisle social distance. Figure S8: The performance (in colors) of the g1, g2a combinations when the objective function is determined by weights = 0%, = 0%, and = 100%, for the S1–S7 luggage scenarios, 2 m aisle social distance. Figure S9: The performance (in colors) of the g1, g2a combinations when the objective function is determined by weights = 60%, = 35%, and = 5%, for the S1–S6 luggage scenarios, 1 m aisle social distance. Figure S10: The performance (in colors) of the g1, g2a combinations when the objective function is determined by weights = 60%, = 35%, and = 5%, for the S1–S7 luggage scenarios, 1.5 m aisle social distance. Figure S11: The performance (in colors) of the g1, g2a combinations when the objective function is determined by weights = 60%, = 35%, and = 5%, for the S1–S7 luggage scenarios, 2 m aisle social distance. Video V1: Agent-based boarding for S1 luggage situation, 1 m aisle social distance, g1 = 25 and g2a = 24. Video V2: Agent-based boarding for S3 luggage situation, 1.5 m aisle social distance, g1 = 15 and g2a = 15. Video V3: Agent-based boarding for S2 luggage situation, 1 m aisle social distance, g1 = 26 and g2a = 26. The videos can be accessed at the following link: https://github.com/liviucotfas/symmetry-social-distance-luggage-reverse-pyramid-3-groups (accessed on 26 February 2021).
Author Contributions
Conceptualization, R.J.M. and C.D.; Data curation, L.-A.C., R.J.M., C.D. and C.I.; Formal analysis, R.J.M. and C.D.; Investigation, L.-A.C., R.J.M., C.D. and C.I.; Methodology, R.J.M.; Software, L.-A.C. and C.D.; Supervision, R.J.M.; Validation, L.-A.C. and R.J.M.; Visualization, L.-A.C., C.D. and C.I.; Writing—original draft, R.J.M. and C.D.; Writing—review and editing, L.-A.C. and C.I. All authors have read and agreed to the published version of the manuscript.
Funding
This research received no external funding.
Institutional Review Board Statement
Not applicable.
Informed Consent Statement
Not applicable.
Data Availability Statement
Not applicable.
Conflicts of Interest
The authors declare no conflict of interest.
References
- Powley, T.; Peel, M.; Hollinger, P. How Safe Is Air Travel during Coronavirus Pandemic? Available online: https://www.ft.com/content/b6a40987-4272-4b51-addb-f30c8066ce2c (accessed on 1 August 2020).
- IATA COVID-19 Passenger Survey. Available online: https://www.iata.org/en/publications/store/covid-passenger-survey/ (accessed on 1 August 2020).
- Harrington, J. Southwest Changes Boarding Process: What You Need to Know. Available online: https://www.mercurynews.com/2020/05/01/southwest-airlines-changes-boarding-process-what-you-need-to-know/ (accessed on 19 May 2020).
- Future Travel Experience How COVID-19 Could Change the End-to-End Passenger Experience Forever. Available online: https://www.futuretravelexperience.com/2020/04/how-covid-19-could-change-end-to-end-passenger-experience/ (accessed on 14 May 2020).
- Ash, L. What Air Travel Might Look Like Post Covid. Available online: https://simpleflying.com/what-air-travel-might-look-like-post-covid/ (accessed on 14 May 2020).
- Delta Air Lines Delta Blocking Middle Seats, Pausing Automatic Advance Upgrades and More to Enable More Space for Safer Travel. Available online: https://news.delta.com/delta-blocking-middle-seats-pausing-automatic-advance-upgrades-and-more-enable-more-space-safer (accessed on 19 May 2020).
- Walton, J. Will Empty Middle Seats Help Social Distancing on Planes? Available online: https://www.bbc.com/worklife/article/20200422-when-can-we-start-flying-again (accessed on 14 May 2020).
- Dan, A. In a Twist on Loyalty Programs, Emirates Is Promising Travelers a Free Funeral If Infected with Covid. Available online: https://www.forbes.com/sites/avidan/2020/08/02/in-a-twist-on-loyalty-programs-emirates-is-promising-travelers-a-free-funeral-if-infected-with-covid-19/?fbclid=IwAR1LuM7VTWxYlsbn3ZUtWhuMQfjDEJGLQktDai8YZa8SX2GGNI0jwC7qKZs#3cb21aef43e3 (accessed on 5 August 2020).
- Alitalia Flying Safely. Available online: https://www.alitalia.com/en_en/fly-alitalia/news-and-activities/news/info-flights/flying-safely.html?fbclid=IwAR1MrtLmqRdn-I9J-IYmYMCksLfeT-vTl7tfdO8DVZyszu_mkrvjkBz5FV4 (accessed on 7 July 2020).
- Topham, G. UK Air Passengers Urged Not to Take Hand Luggage on Planes; The Guardian: New York, NY, USA, 2020. [Google Scholar]
- Delcea, C.; Milne, R.J.; Cotfas, L.-A. Determining the Number of Passengers for Each of Three Reverse Pyramid Boarding Groups with COVID-19 Flying Restrictions. Symmetry 2020, 12, 2038. [Google Scholar] [CrossRef]
- Turkish Airlines Travel and Coronavirus: Amended Cabin Baggage Rules. Available online: https://www.turkishairlines.com/en-int/any-questions/what-are-cabin-baggage-rules-during-the-coronavirus-process/ (accessed on 1 August 2020).
- Thelocal.it Italy Bans Hand Luggage on Flights “for Health Reasons”. Available online: https://www.thelocal.it/20200626/italy-bans-all-hand-luggae-on-flights-for-safety-reasons (accessed on 5 August 2020).
- IATA Restarting Aviation Following COVID-19. Available online: https://www.iata.org/contentassets/f1163430bba94512a583eb6d6b24aa56/covid-medical-evidence-for-strategies-200423.pdf (accessed on 31 May 2020).
- Milne, R.J.; Delcea, C.; Cotfas, L.-A.; Ioanas, C. Evaluation of Boarding Methods Adapted for Social Distancing When Using Apron Buses. IEEE Access 2020, 8, 151650–151667. [Google Scholar] [CrossRef]
- Milne, R.J.; Cotfas, L.-A.; Delcea, C.; Crăciun, L.; Molănescu, A.-G. Adapting the Reverse Pyramid Airplane Boarding Method for Social Distancing in Times of COVID-19. PLoS ONE 2020, 15, e0242131. [Google Scholar] [CrossRef] [PubMed]
- Marelli, S.; Mattocks, G.; Merry, R. The Role of Computer Simulation in Reducing Airplane Turnaround Time. Boeing Aero Mag. 1998, 1. Available online: https://www.boeing.com/commercial/aeromagazine/aero_01/textonly/t01txt.html (accessed on 14 May 2020).
- Nyquist, D.C.; McFadden, K.L. A Study of the Airline Boarding Problem. J. Air Transp. Manag. 2008, 14, 197–204. [Google Scholar] [CrossRef]
- Steiner, A.; Philipp, M. Speeding up the Airplane Boarding Process by Using Pre-Boarding Areas. In Proceedings of the Swiss Transport Research Conference, Ascona, Switzerland, 9–11 September 2009. [Google Scholar]
- Soolaki, M.; Mahdavi, I.; Mahdavi-Amiri, N.; Hassanzadeh, R.; Aghajani, A. A New Linear Programming Approach and Genetic Algorithm for Solving Airline Boarding Problem. Appl. Math. Model. 2012, 36, 4060–4072. [Google Scholar] [CrossRef]
- Tang, T.-Q.; Yang, S.-P.; Ou, H.; Chen, L.; Huang, H.-J. An Aircraft Boarding Model with the Group Behavior and the Quantity of Luggage. Transp. Res. Part C Emerg. Technol. 2018, 93, 115–127. [Google Scholar] [CrossRef]
- van den Briel, M.H.L.; Villalobos, J.R.; Hogg, G.L.; Lindemann, T.; Mulé, A.V. America West Airlines Develops Efficient Boarding Strategies. Interfaces 2005, 35, 191–201. [Google Scholar] [CrossRef]
- Milne, R.J.; Kelly, A.R. A New Method for Boarding Passengers onto an Airplane. J. Air Transp. Manag. 2014, 34, 93–100. [Google Scholar] [CrossRef] [Green Version]
- Milne, R.J.; Delcea, C.; Cotfas, L.-A.; Salari, M. New Methods for Two-Door Airplane Boarding Using Apron Buses. J. Air Transp. Manag. 2019, 80, 101705. [Google Scholar] [CrossRef]
- Delcea, C.; Cotfas, L.-A.; Paun, R. Agent-Based Evaluation of the Airplane Boarding Strategies’ Efficiency and Sustainability. Sustainability 2018, 10, 1879. [Google Scholar] [CrossRef] [Green Version]
- Breuer, A. JetBlue to Unveil New Boarding Process|Frequent Business Traveler. Available online: http://www.frequentbusinesstraveler.com/2017/10/jetblue-to-unveil-new-boarding-process/ (accessed on 4 August 2020).
- Ozmec-Ban, M.; Babić, R.Š.; Modić, A. Airplane Boarding Strategies for Reducing Turnaround Time. In Proceedings of the 18th International Conference on Transport Science ICTS 2018, Portorož, Slovenia, 14–15 June 2018; pp. 1–7. [Google Scholar]
- Steffen, J.H.; Hotchkiss, J. Experimental Test of Airplane Boarding Methods. J. Air Transp. Manag. 2012, 18, 64–67. [Google Scholar] [CrossRef] [Green Version]
- Steffen, J.H. Optimal Boarding Method for Airline Passengers. J. Air Transp. Manag. 2008, 14, 146–150. [Google Scholar] [CrossRef] [Green Version]
- Steffen, J.H. A Statistical Mechanics Model for Free-for-All Airplane Passenger Boarding. Am. J. Phys. 2008, 76, 1114–1119. [Google Scholar] [CrossRef] [Green Version]
- Van Landeghem, H.; Beuselinck, A. Reducing Passenger Boarding Time in Airplanes: A Simulation Based Approach. Eur. J. of Oper. Res. 2002, 142, 294–308. [Google Scholar] [CrossRef]
- Qiang, S.-J.; Jia, B.; Xie, D.-F.; Gao, Z.-Y. Reducing Airplane Boarding Time by Accounting for Passengers’ Individual Properties: A Simulation Based on Cellular Automaton. J. Air Transp. Manag. 2014, 40, 42–47. [Google Scholar] [CrossRef]
- Ren, X.; Zhou, X.; Xu, X. A New Model of Luggage Storage Time While Boarding an Airplane: An Experimental Test. J. Air Transp. Manag. 2020, 84, 101761. [Google Scholar] [CrossRef]
- Kierzkowski, A.; Kisiel, T. The Human Factor in the Passenger Boarding Process at the Airport. Procedia Eng. 2017, 187, 348–355. [Google Scholar] [CrossRef]
- Notomista, G.; Selvaggio, M.; Sbrizzi, F.; Di Maio, G.; Grazioso, S.; Botsch, M. A Fast Airplane Boarding Strategy Using Online Seat Assignment Based on Passenger Classification. J. Air Transp. Manag. 2016, 53, 140–149. [Google Scholar] [CrossRef]
- Ferrari, P.; Nagel, K. Robustness of Efficient Passenger Boarding Strategies for Airplanes. Transp. Res. Rec. J. Transp. Res. Board 2005, 1915, 44–54. [Google Scholar] [CrossRef]
- Hutter, L.; Jaehn, F.; Neumann, S. Influencing Factors on Airplane Boarding Times. Omega 2018, 87, 177–190. [Google Scholar] [CrossRef]
- Bazargan, M. A Linear Programming Approach for Aircraft Boarding Strategy. Eur. J. Oper. Res. 2007, 183, 394–411. [Google Scholar] [CrossRef]
- Kuo, C.-C. An Improved Zero-One Linear Programming Model for the Plane Boarding Problem. In Applications of Management Science; Emerald Group Publishing Limited: Somerville, MA, USA, 2015; Volume 17, pp. 53–69. [Google Scholar]
- Ren, X.; Xu, X. Experimental Analyses of Airplane Boarding Based on Interference Classification. J. Air Trans. Manag. 2018, 71, 55–63. [Google Scholar] [CrossRef]
- Schultz, M. The Seat Interference Potential as an Indicator for the Aircraft Boarding Progress. SAE Tech. Pap. 2017. [Google Scholar] [CrossRef]
- Delcea, C.; Cotfas, L.-A.; Paun, R. Airplane Boarding Strategies Using Agent-Based Modeling and Grey Analysis. In Computational Collective Intelligence; Nguyen, N.T., Pimenidis, E., Khan, Z., Trawiński, B., Eds.; Springer: Cham, Switzerland, 2018; Volume 11055, pp. 329–339. ISBN 978-3-319-98442-1. [Google Scholar]
- Milne, R.J.; Delcea, C.; Cotfas, L.-A. Airplane Boarding Methods That Reduce Risk from COVID-19. Saf. Sci. 2021, 134, 105061. [Google Scholar] [CrossRef]
- Milne, R.J.; Salari, M.; Kattan, L. Robust Optimization of Airplane Passenger Seating Assignments. Aerospace 2018, 5, 80. [Google Scholar] [CrossRef] [Green Version]
- Milne, R.J.; Salari, M. Optimization of Assigning Passengers to Seats on Airplanes Based on Their Carry-on Luggage. J. Air Transp. Manag. 2016, 54, 104–110. [Google Scholar] [CrossRef]
- Wittmann, J. Customer-Oriented Optimization of the Airplane Boarding Process. J. Air Transp. Manag. 2019, 76, 31–39. [Google Scholar] [CrossRef]
- Sadeghi Lahijani, M.; Islam, T.; Srinivasan, A.; Namilae, S. Constrained Linear Movement Model (CALM): Simulation of Passenger Movement in Airplanes. PLoS ONE 2020, 15, e0229690. [Google Scholar] [CrossRef] [Green Version]
- Islam, T.; Lahijani, M.S.; Srinivasan, A.; Namilae, S.; Mubayi, A.; Scotch, M. From Bad to Worse: Airline Boarding Changes in Response to COVID-19. arXiv 2020, arXiv:2006.06403 [physics]. [Google Scholar]
- Derjany, P.; Namilae, S.; Liu, D.; Srinivasan, A. Multiscale Model for the Optimal Design of Pedestrian Queues to Mitigate Infectious Disease Spread. PLoS ONE 2020, 15, e0235891. [Google Scholar] [CrossRef]
- Schultz, M. Fast Aircraft Turnaround Enabled by Reliable Passenger Boarding. Aerospace 2018, 5, 8. [Google Scholar] [CrossRef] [Green Version]
- Schultz, M. A Metric for the Real-Time Evaluation of the Aircraft Boarding Progress. Transp. Res. Part C Emerg. Technol. 2018, 86, 467–487. [Google Scholar] [CrossRef]
- Schultz, M. Dynamic Change of Aircraft Seat Condition for Fast Boarding. Transp. Res. Part C Emerg. Technol. 2017, 85, 131–147. [Google Scholar] [CrossRef]
- World Health Organization. Coronavirus Disease (COVID-19). Available online: https://www.who.int/emergencies/diseases/novel-coronavirus-2019 (accessed on 12 December 2020).
- Schultz, M.; Soolaki, M. Analytical Approach to Solve the Problem of Aircraft Passenger Boarding during the Coronavirus Pandemic; Preprint under Journal Review. Available online: https://www.researchgate.net/publication/343390376_Analytical_approach_to_solve_the_problem_of_aircraft_passenger_boarding_during_the_coronavirus_pandemic (accessed on 4 August 2020).
- Salari, M.; Milne, R.J.; Delcea, C.; Kattan, L.; Cotfas, L.-A. Social Distancing in Airplane Seat Assignments. J. Air Trans. Manag. 2020, 89, 101915. [Google Scholar] [CrossRef]
- Schultz, M.; Fuchte, J. Evaluation of Aircraft Boarding Scenarios Considering Reduced Transmissions Risks. Sustainability 2020, 12, 5329. [Google Scholar] [CrossRef]
- Cotfas, L.-A.; Delcea, C.; Milne, R.J.; Salari, M. Evaluating Classical Airplane Boarding Methods Considering COVID-19 Flying Restrictions. Symmetry 2020, 12, 1087. [Google Scholar] [CrossRef]
- De Vos, J. The Effect of COVID-19 and Subsequent Social Distancing on Travel Behavior. Transp. Res. Interdiscip. Perspect. 2020, 5, 100121. [Google Scholar] [CrossRef]
- WHO Advice for Public. Available online: https://www.who.int/emergencies/diseases/novel-coronavirus-2019/advice-for-public (accessed on 31 May 2020).
- Barnett, A. Covid-19 Risk among Airline Passengers: Should the Middle Seat Stay Empty? Public and Global Health: Atlanta, GA, USA, 2020. [Google Scholar]
- Porterfield, C. Leaving Airplane Middle Seats Empty Could Cut Coronavirus Risk Almost in Half, a Study Says. Available online: https://www.forbes.com/sites/carlieporterfield/2020/07/11/leaving-airplane-middle-seats-empty-could-cut-coronavirus-risk-almost-in-half-a-study-says/ (accessed on 1 August 2020).
- Delcea, C.; Milne, R.J.; Cotfas, L.-A.; Craciun, L.; Molanescu, A.G. Methods for Accelerating the Airplane Boarding Process in the Presence of Apron Buses. IEEE Access 2019, 7, 134372–134387. [Google Scholar] [CrossRef]
- Audenaert, J.; Verbeeck, K.; Berghe, G. Multi-Agent Based Simulation for Boarding. In Proceedings of the 21st Benelux Conference on Artificial Intelligence, Eindhoven, The Netherlands, 29–30 October 2009; pp. 3–10. [Google Scholar]
- Milne, R.J.; Cotfas, L.-A.; Delcea, C.; Salari, M.; Craciun, L.; Molanescu, A.G. Airplane Boarding Method for Passenger Groups When Using Apron Buses. IEEE Access 2020, 8, 18019–18035. [Google Scholar] [CrossRef]
- Wilensky, U.; Rand, W. An Introduction to Agent-Based Modeling: Modeling Natural, Social, and Engineered Complex Systems with NetLogo; The MIT Press: Cambridge, MA, USA, 2015; ISBN 978-0-262-73189-8. [Google Scholar]
- Ponsiglione, C.; Roma, V.; Zampella, F.; Zollo, G. The Fairness/Efficiency Issue Explored Through El Farol Bar Model. In Scientific Methods for the Treatment of Uncertainty in Social Sciences; Gil-Aluja, J., Terceño-Gómez, A., Ferrer-Comalat, J.C., Merigó-Lindahl, J.M., Linares-Mustarós, S., Eds.; Advances in Intelligent Systems and Computing; Springer: Cham, Switzerland, 2015; Volume 377, pp. 309–327. ISBN 978-3-319-19703-6. [Google Scholar]
- Schultz, M. Field Trial Measurements to Validate a Stochastic Aircraft Boarding Model. Aerospace 2018, 5, 27. [Google Scholar] [CrossRef] [Green Version]
- Alizadeh, R. A Dynamic Cellular Automaton Model for Evacuation Process with Obstacles. Saf. Sci. 2011, 49, 315–323. [Google Scholar] [CrossRef]
Figure 1.
Modified Reverse Pyramid Half-zone method with 4 boarding groups without considering social distancing.
Figure 1.
Modified Reverse Pyramid Half-zone method with 4 boarding groups without considering social distancing.

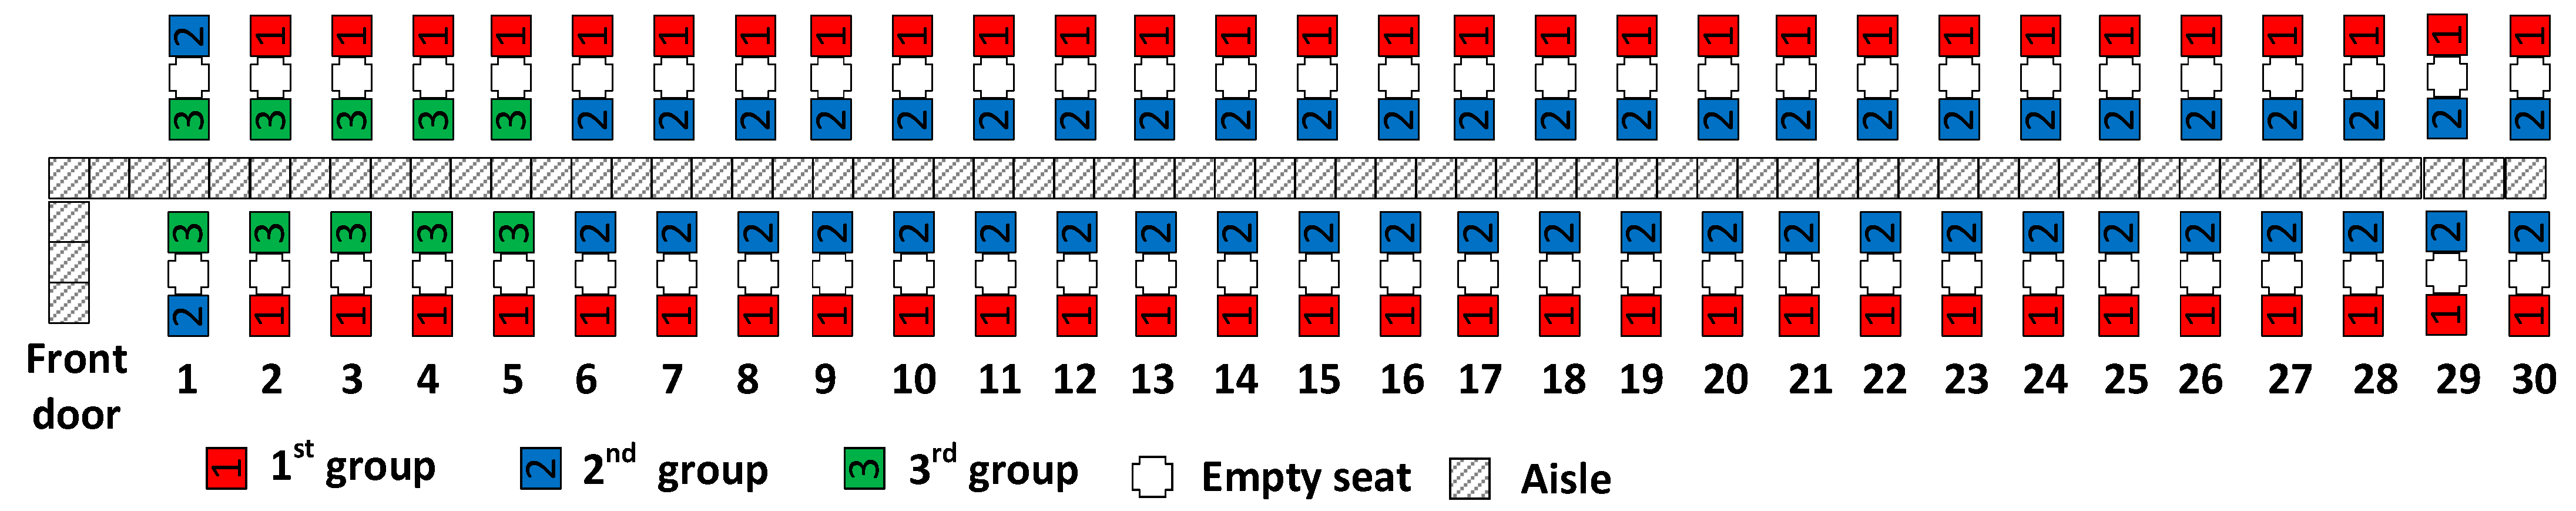
Figure 2.
Reverse Pyramid boarding adapted for social distancing and to minimize health risks.

Figure 3.
The seat positions pointed out by the g1 and g2a variables for a 30-row airplane.

Figure 4.
Screen capture presenting the movement of the agents down the aisle.

Figure 5.
Screen capture of agent-based model graphical user interface (GUI) during simulation.

Figure 6.
The performance (in colors) of the g1, g2a combinations when the objective function is determined by weights = 100%, = 0%, and = 0%, for the S1–S6 luggage scenarios, 1 m aisle social distance (the color scale is determined by the average boarding time expressed in seconds and listed in the right side of each figure).


Figure 7.
The performance (in colors) of the g1 and g2a combinations when the objective function is determined by weights = 100%, = 0%, and = 0%, for the S7 luggage scenario, 1 m aisle social distance.
Figure 7.
The performance (in colors) of the g1 and g2a combinations when the objective function is determined by weights = 100%, = 0%, and = 0%, for the S7 luggage scenario, 1 m aisle social distance.

Figure 8.
The optimal solution for C1 as a function of aisle social distance and luggage scenarios.

Figure 9.
The best-performing Reverse Pyramid scheme for 2 m aisle social distance, S1, g1 = 26, g2a = 26 for weights = 100%, = 0%, and = 0%.
Figure 9.
The best-performing Reverse Pyramid scheme for 2 m aisle social distance, S1, g1 = 26, g2a = 26 for weights = 100%, = 0%, and = 0%.

Figure 10.
The best-performing Reverse Pyramid scheme for 2 m aisle social distance, S7, g1 = 29, g2a = 25 for weights = 100%, = 0%, and = 0%.
Figure 10.
The best-performing Reverse Pyramid scheme for 2 m aisle social distance, S7, g1 = 29, g2a = 25 for weights = 100%, = 0%, and = 0%.

Figure 11.
The best-performing Reverse Pyramid scheme for 1 m aisle social distance, S7, g1 = 26, g2a = 23 for weights 1 = 100%, = 0%, and = 0%.
Figure 11.
The best-performing Reverse Pyramid scheme for 1 m aisle social distance, S7, g1 = 26, g2a = 23 for weights 1 = 100%, = 0%, and = 0%.

Figure 12.
The performance (in colors) of the g1 and g2a combinations when the objective function is determined by weights = 0%, = 100%, and = 0%, for the S7 luggage scenario, 1 m aisle social distance (the color scale is determined by the average aisle seat risk expressed in seconds and listed in the right side of the figure).

Figure 13.
The performance (in colors) of the g1 and g2a combinations when the objective function is determined by weights = 0%, = 0%, and = 100%, for the S7 luggage scenario, 1 m aisle social distance (the color scale is determined by the average window seat risk expressed in seconds and listed in the right side of the figure).

Figure 14.
The performance (in colors) of the g1 and g2a combinations when the objective function is determined by weights = 60%, = 35%, and = 5%, for the S7 luggage scenario, 1 m aisle social distance (the color scale is determined by the average value of the evaluating function expressed in seconds and listed in the right side of the figure).


Table 1.
The carry-on luggage scenarios.
| Scenario | Percentages of Bags Carried by the Passengers | ||||
|---|---|---|---|---|---|
| 1 Large and 1 Small Bag | 1 Large Bag | 2 Small Bags | 1 Small Bag | 0 Bag | |
| S1 | 70% | 10% | 0% | 10% | 10% |
| S2 | 50% | 10% | 5% | 20% | 15% |
| S3 | 30% | 15% | 10% | 20% | 25% |
| S4 | 15% | 15% | 10% | 25% | 35% |
| S5 | 10% | 10% | 10% | 10% | 60% |
| S6 | 5% | 5% | 5% | 5% | 80% |
| S7 | 0% | 0% | 0% | 0% | 100% |
Table 2.
The cases considered and their associated weights.
| Case | Weights | Optimal Solution [11] | |||
|---|---|---|---|---|---|
| g1 | g2a | ||||
| C1 | 100% | 0% | 0% | 25 | 24 |
| C2 | 0% | 100% | 0% | 15 | 15 |
| C3 | 0% | 0% | 100% | 15 | 15 |
| C4 | 60% | 35% | 5% | 16 | 16 |
Table 3.
Optimal solution for C1 as aisle social distance and luggage scenarios change.
| Aisle Social Distance | Luggage Scenarios | ||||||
|---|---|---|---|---|---|---|---|
| S1 | S2 | S3 | S4 | S5 | S6 | S7 | |
| 1 m | (25, 24) | (25, 24) | (25, 23) | (25, 23) | (26, 23) | (26, 23) | (26, 23) |
| 1.5 m | (25, 25) | (26, 25) | (27, 24) | (27, 24) | (27, 24) | (27, 24) | (27, 24) |
| 2 m | (26, 26) | (26, 26) | (27, 25) | (27, 25) | (27, 25) | (28, 25) | (29, 25) |
Table 4.
Average boarding time for C1.
| Aisle Social Distance | Luggage Scenarios | ||||||
|---|---|---|---|---|---|---|---|
| S1 | S2 | S3 | S4 | S5 | S6 | S7 | |
| 1 m | 891.2 | 853.9 | 815.0 | 778.3 | 725.9 | 652.4 | 504.3 |
| 1.5 m | 1157.4 | 1110.4 | 1061.9 | 1015.4 | 941.4 | 843.4 | 671.7 |
| 2 m | 1402.5 | 1351.5 | 1295.6 | 1240.7 | 1148.2 | 1028.0 | 838.3 |
Table 5.
Average aisle seat risk for C1.
| Aisle Social Distance | Luggage Scenarios | ||||||
|---|---|---|---|---|---|---|---|
| S1 | S2 | S3 | S4 | S5 | S6 | S7 | |
| 1 m | 2338.0 | 2227.8 | 2000.1 | 1889.7 | 1740.9 | 1571.6 | 1353.0 |
| 1.5 m | 2423.3 | 2333.0 | 2223.9 | 1980.2 | 1808.1 | 1648.0 | 1422.0 |
| 2 m | 2554.1 | 2449.0 | 2199.2 | 2086.5 | 1912.1 | 1627.1 | 1521.2 |
Table 6.
Average window seat risk for C1.
| Aisle Social Distance | Luggage Scenarios | ||||||
|---|---|---|---|---|---|---|---|
| S1 | S2 | S3 | S4 | S5 | S6 | S7 | |
| 1 m | 8768.1 | 8340.9 | 7963.4 | 7551.1 | 7255.0 | 6540.9 | 4885.7 |
| 1.5 m | 8534.5 | 8517.8 | 8451.1 | 7726.7 | 6771.5 | 6690.4 | 5713.6 |
| 2 m | 8736.8 | 8355.4 | 8350.7 | 7931.2 | 7269.9 | 6291.7 | 6179.1 |
Table 7.
Average boarding time for C2—optimal solution (15, 15).
| Aisle Social Distance | Luggage Scenarios | ||||||
|---|---|---|---|---|---|---|---|
| S1 | S2 | S3 | S4 | S5 | S6 | S7 | |
| 1 m | 907.7 | 867.3 | 828.8 | 795.0 | 741.9 | 668.6 | 518.0 |
| 1.5 m | 1173.8 | 1125.4 | 1077.9 | 1034.1 | 958.5 | 867.3 | 686.0 |
| 2 m | 1416.3 | 1366.6 | 1311.8 | 1259.8 | 1168.4 | 1052.1 | 853.1 |
Table 8.
Average aisle seat risk for C2—optimal solution (15, 15).
| Aisle Social Distance | Luggage Scenarios | ||||||
|---|---|---|---|---|---|---|---|
| S1 | S2 | S3 | S4 | S5 | S6 | S7 | |
| 1 m | 1745.8 | 1655.1 | 1536.6 | 1440.1 | 1336.2 | 1195.6 | 1045.1 |
| 1.5 m | 1719.5 | 1636.4 | 1507.2 | 1438.0 | 1323.9 | 1188.1 | 1045.3 |
| 2 m | 1679.2 | 1584.3 | 1504.9 | 1400.3 | 1293.7 | 1153.1 | 1044.5 |
Table 9.
Average window seat risk for C2—optimal solution (15, 15).
| Aisle Social Distance | Luggage Scenarios | ||||||
|---|---|---|---|---|---|---|---|
| S1 | S2 | S3 | S4 | S5 | S6 | S7 | |
| 1 m | 7192.3 | 6808.3 | 6473.2 | 6055.1 | 5562.3 | 5009.2 | 4287.7 |
| 1.5 m | 7074.9 | 6744.9 | 6341.4 | 6014.4 | 5484.5 | 4951.5 | 4283.8 |
| 2 m | 6959.2 | 6651.9 | 6265.7 | 5906.1 | 5434.6 | 4904.3 | 4283.4 |
Table 10.
Optimal solution for C4.
| Aisle Social Distance | Luggage Scenarios | ||||||
|---|---|---|---|---|---|---|---|
| S1 | S2 | S3 | S4 | S5 | S6 | S7 | |
| 1 m | (16, 16) | (16, 16) | (15, 15) | (15, 15) | (15, 15) | (15, 15) | (15, 15) |
| 1.5 m | (16, 16) | (15, 15) | (15, 15) | (15, 15) | (15, 15) | (15, 15) | (15, 15) |
| 2 m | (15, 15) | (15, 15) | (15, 15) | (15, 15) | (15, 15) | (15, 15) | (15, 15) |
Table 11.
Average boarding time for C4.
| Aisle Social Distance | Luggage Scenarios | ||||||
|---|---|---|---|---|---|---|---|
| S1 | S2 | S3 | S4 | S5 | S6 | S7 | |
| 1 m | 904.5 | 864.7 | 828.8 | 795.0 | 741.9 | 668.6 | 518.0 |
| 1.5 m | 1170.2 | 1125.4 | 1077.9 | 1034.1 | 958.5 | 867.3 | 686.0 |
| 2 m | 1416.3 | 1366.6 | 1311.8 | 1259.8 | 1168.4 | 1052.1 | 853.1 |
Table 12.
Average aisle seat risk for C4.
| Aisle Social Distance | Luggage Scenarios | ||||||
|---|---|---|---|---|---|---|---|
| S1 | S2 | S3 | S4 | S5 | S6 | S7 | |
| 1 m | 1749.8 | 1655.4 | 1536.6 | 1440.1 | 1336.2 | 1195.6 | 1045.1 |
| 1.5 m | 1719.8 | 1636.4 | 1507.2 | 1438.0 | 1323.9 | 1188.1 | 1045.3 |
| 2 m | 1679.2 | 1584.3 | 1504.9 | 1400.3 | 1293.7 | 1153.1 | 1044.5 |
Table 13.
Average window seat risk for C4.
| Aisle Social Distance | Luggage Scenarios | ||||||
|---|---|---|---|---|---|---|---|
| S1 | S2 | S3 | S4 | S5 | S6 | S7 | |
| 1 m | 7200.5 | 6833.9 | 6473.2 | 6055.1 | 5562.3 | 5009.2 | 4287.7 |
| 1.5 m | 7097.3 | 6744.9 | 6341.4 | 6014.4 | 5484.5 | 4951.5 | 4283.8 |
| 2 m | 6959.2 | 6651.9 | 6265.7 | 5906.1 | 5434.6 | 4904.3 | 4283.4 |
Publisher’s Note: MDPI stays neutral with regard to jurisdictional claims in published maps and institutional affiliations. |
© 2021 by the authors. Licensee MDPI, Basel, Switzerland. This article is an open access article distributed under the terms and conditions of the Creative Commons Attribution (CC BY) license (http://creativecommons.org/licenses/by/4.0/).
Share and Cite
MDPI and ACS Style
Cotfas, L.-A.; Milne, R.J.; Delcea, C.; Ioanăș, C. An Investigation of Social Distancing and Quantity of Luggage Impacts on the Three Groups Reverse Pyramid Boarding Method. Symmetry 2021, 13, 544. https://doi.org/10.3390/sym13040544
AMA Style
Cotfas L-A, Milne RJ, Delcea C, Ioanăș C. An Investigation of Social Distancing and Quantity of Luggage Impacts on the Three Groups Reverse Pyramid Boarding Method. Symmetry. 2021; 13(4):544. https://doi.org/10.3390/sym13040544
Chicago/Turabian StyleCotfas, Liviu-Adrian, R. John Milne, Camelia Delcea, and Corina Ioanăș. 2021. "An Investigation of Social Distancing and Quantity of Luggage Impacts on the Three Groups Reverse Pyramid Boarding Method" Symmetry 13, no. 4: 544. https://doi.org/10.3390/sym13040544
Note that from the first issue of 2016, this journal uses article numbers instead of page numbers. See further details here.