Impact of Hydropower Dam Operation and Management on Downstream Hydrogeomorphology in Semi-Arid Environments (Tekeze, Northern Ethiopia)


1
Department of Geography, Ghent University, 9000 Gent, Belgium
2
Department of Geography and Environmental Studies, Mekelle University, Mek’ele 7000, Ethiopia
3
Department of Engineering Management, Antwerp University, 2000 Antwerpen, Belgium
*
Author to whom correspondence should be addressed.
Water 2020, 12(8), 2237; https://doi.org/10.3390/w12082237
Submission received: 30 June 2020
/
Revised: 5 August 2020
/
Accepted: 7 August 2020
/
Published: 8 August 2020
(This article belongs to the Special Issue Fluvial Geomorphology and River Management)
Abstract
:Due to renewed interest in hydropower dams in the face of climate change, it is important to assess dam operations and management in combination with downstream impacts on rivers in (semi-)arid environments. In this study, the impacts of the Tekeze hydropower dam on downstream hydrology and river morphology were investigated, including impacts under normal and extreme reservoir operation conditions. Field observations, in-depth interviews, repeat terrestrial photographs, multi-year high-resolution satellite images, daily reservoir water levels and data on hourly to daily energy production were collected and studied. The results show that high flows (Q5) have declined (with factor 5), low flows (Q95) have increased (with factor 27), seasonal flow patterns have smoothened, river beds have incised (up to 4 m) and locally aggraded near tributary confluences. The active river bed has narrowed by 31%, which was accelerated by the gradual emergence of Tamarix nilotica and fruit plantations. A new post-dam equilibrium had been reached until it was disrupted by the 2018 emergency release, caused by reservoir management and above-normal reservoir inflow, and causing extensive erosion and agricultural losses downstream. Increased floodplain occupation for irrigated agriculture consequently provides an additional argument for reservoir operation optimization to avoid future risks for riparian communities.
1. Introduction
The construction of large dams inevitably alters the downstream hydrology and morphology of rivers [1]. Commonly, peak flows are reduced, base flows are increased and both longitudinal and planform channel adjustments occur [2,3]. An important driver for such channel adjustments is the “clear water effect”, arising from sediment trapping in the reservoir [4]. As downstream released flows are underloaded, rivers are “sediment hungry” and are consequently prone to channel bed degradation and riverbank erosion until the downstream sediment transport capacity is reached again through scouring of the river bed and bank, and due to lateral sediment inflow from tributaries [4,5]. Lateral or planform channel adjustments often include changes in braiding and sinuosity patterns [6], whereas downcutting of river beds can lead to base level lowering of tributaries, which can be evidenced by knickpoints in longitudinal profiles [7]. Downstream of tributary confluences, it is also common to find channel aggradation, as flows are no longer competent to remove the discharged debris from (unaltered) tributaries [8]. As hydrologic and geomorphic processes are key drivers for vegetation dynamics, the downstream riparian species distribution also changes after dam regulation [9]. Depending on the type of river bed and bank materials, and the induced magnitude of change in water and sediment flow, the downstream fluvial system will adapt to the newly obtained conditions until reaching a new equilibrium eventually [5].
This equilibrium heavily depends on the way the reservoir is operated and managed, which is predominantly determined by the purpose of the dam as either flood control, electricity generation, water supply, irrigation development or a combination of the above [10]. Numerous algorithms for optimal dam operation and management exist [11,12,13,14,15], although most large dams currently still are operated by predefined operation rules in which dam operators have a strong voice and often draw on personal judgment and experiences during the decision-making process [13,16]. This particularly is the case in areas with limited available biophysical data and low human, financial and institutional capacities [16,17]. Based on computer algorithms or human decision-making, dam operation and management always seeks to optimize efficiency and maximize the benefits generated by a dam, while at the same time making trade-offs between different dam purposes, dam operability and dam safety [13]. Often, downstream ecological conditions also must be considered, and pre-dam natural flow regimes must be mimicked as good as possible [18]. Irrespective of the dam purpose or operation system, the annual reservoir inflow is the major factor of uncertainty for dam operators, which is especially challenging in environments with strong inter-annual rainfall variability, where (sub-seasonal) inflow forecasting often is not readily available [19,20]. This makes the operation of reservoir systems demanding and leads to a wide range of potential downstream hydrogeomorphic impacts.
In this study, dam operation and management and dam-induced downstream hydrogeomorphic changes are studied simultaneously, as this allows us to grasp the dynamics of the induced impacts, which often are not fully understood when studied independently of the dam decision support system. As a case study, we consider the Tekeze hydropower dam and Tekeze River in semi-arid northern Ethiopia and draw on evidence from a unique set of information, comprising field observations, in-depth and semi-structured interviews, repeat terrestrial photographs, multi-year high-resolution satellite images, daily reservoir water levels and data on hourly-to-daily energy production. The choice for the Tekeze case study was made as (i) some dam management and operation techniques particularly often have adverse impacts in (semi-)arid environments [21], (ii) computer-based decision support systems have difficulties to gain ground in African countries [16], (iii) the Tekeze catchment experiences high inter-annual rainfall variability just like many other areas of the South of the Sahara, and (iv) many new hydropower dams will be constructed in Ethiopia and other developing countries in the 21st century [22,23,24] so that the findings of this research can be extrapolated for optimal dam management in similar environments. In (semi)-arid environments, it is especially important to properly assess dam-induced downstream impacts as dam-regulated rivers become very attractive for human settlers. Floodplains increasingly become occupied for irrigated agriculture and consequently, people increasingly depend on the newly obtained water conditions for their livelihood [25,26]. With this study, we aim to improve the understanding of hydrogeomorphic impacts induced by hydropower dams in (semi-)arid environments with high inter-annual rainfall variability, operated under normal circumstances and in case of extreme high water levels.
2. Study Area
The Tekeze River emerges at the eastern edge of the Ethiopian Plateau at an elevation of 3933 m above sea level (ASL). The river runs north at first and then makes a turn to the northwest. For over 150 km, the river forms the natural boundary between Eritrea and Ethiopia, after which it enters the Sudanese lowlands at an elevation of 540 m ASL. In Sudan, the Tekeze River joins the Atbara River, which is an important tributary of the Nile (Figure 1). Over time, both the Tekeze and Atbara Rivers have become regulated by large hydropower dams. In 2009, a dam with a capacity of 300 MW was commissioned on the Tekeze River (13°21’ N, 38°45’ E), which gave rise to the largest anthropogenic lake of Ethiopia. The Tekeze Reservoir is 70 km long and has a storage volume of 9293 million cubic meter (MCM), of which 5293 MCM is active storage. The 188 m high double-curvature concrete Tekeze arch dam was the highest dam of Africa at construction time [27,28] and is located in a deeply incised gorge, which the river has carved out in the surrounding Precambrian rocks over millions of years [29]. The dam intercepts runoff from 44% of the total catchment area of 66,882 km2 and is operated and managed by Ethiopian Electric Power (EEP), under the administration of the Ministry of Water, Irrigation and Electricity (MoWIE). Hydropower is an extremely important source of electricity in Ethiopia, as it accounts for 90% of the total installed power capacity of 4244 MW [30]. In 2017, the construction of the 3687 MCM Tekeze–Atbara complex near the confluence of the Tekeze and Atbara Rivers was completed, adding 320 MW to the Sudanese electricity grid and providing new possibilities for downstream large-scale irrigated agriculture [31].
In the Tekeze catchment, temperature and precipitation patterns are determined by the seasonal migration of the Intertropical Convergence Zone and associated atmospheric circulations, the complex topography and wide range of elevations [32]. In general, three distinct seasons can be identified: the main rainy season from June to September (kiremt) (receiving>80% of the precipitation [33]), the dry season from October to February (bega) and the small rainy season from March to May (belg) [34]. In the western part of the catchment, along the Tekeze River and in the surroundings of the Tekeze Reservoir, the climate is hot and arid (BSh). A tropical savanna climate (Aw) can be observed at higher elevations, whereas the highest parts of the catchment experience a temperate climate with a dry winter and warm summer (Cwb) [35]. Along the Tekeze River downstream of the dam, average annual air temperatures range from 23.5 °C at the dam site to 29.6 °C near Humera [36]. The annual precipitation amounts 600 to 800 mm in the lowland areas downstream of the dam [36].
3. Materials and Methods
3.1. Dam Operation and Management
Information on the operation and management of the Tekeze hydropower plant and hence Tekeze Reservoir was obtained during an in-depth interview with the EEP Generation Operation executive officer in Addis Ababa and from the analysis of multiple secondary datasets provided by EEP. These datasets include daily reservoir water levels, hourly and daily electricity production, and seasonal water releases from the reservoir using the mid-level outlets (MLOs) and were obtained for the period of July 2008 (reservoir water levels) and 2010 (full dataset) to November 2019 [37,38,39,40].
In order to obtain a good understanding of the dam operation and management under “normal circumstances” and in case of high water levels, the obtained datasets were converted into the required data formats to be able to calculate the yearly reservoir water balance. Hourly and daily electricity production data were converted into average hourly and daily discharges released from the dam, based on the Tekeze hydropower plant-specific conversion factor:
where Q = average daily discharge (m3 s−1) and E = daily energy production (kWh). From the daily reservoir water levels, daily reservoir volumes were estimated using the stage–storage curve [28]. As no information is available on the extent of reservoir sedimentation (though it is clearly visible on high-resolution satellite images), a loss in reservoir volume of 30 MCM yr−1 was assumed to calculate the reservoir water balance, as estimated during the feasibility study of the dam [28]. The reservoir water balance was calculated for each hydrologic year (defined from 1 July to 30 June and named after the calendar year in which the main rainy season occurs) since dam commissioning. Based on the initial (1 July) reservoir volume and the known volume of water leaving the reservoir, the yearly reservoir inflow was calculated as follows:
where Ix = reservoir inflow in year x; Vx = initial reservoir volume in year x; Vx+1 = initial reservoir volume in year (x+1); Ox = reservoir outflow in year x; OEV = reservoir evaporation [41]; OEL = discharged water volume for electricity generation; OEM = discharged water volume using the MLOs; ET0 = reference evapotranspiration (1920 mm year−1, [28]); and A = yearly average reservoir surface area (km2) estimated from the stage–area curve (i.e., 129 ± 13 km2). The reservoir inflow Ix comprises the inflow from upstream runoff, rainfall on the reservoir and groundwater flows. As no data for the different inflow components are available, it is considered as one factor in the water balance. Seepage from the reservoir (i.e., 1.58 MCM year−1 [28]), lateral and deep percolation are assumed to be negligible. In the different equations, volumes consistently are expressed in million cubic meters.
Ix = Vx+1 − (Vx − Ox)
Ox = OEV + OEL + OEM
OEV = ET0 × A × 10−6
3.2. Downstream Hydrogeomorphic Alterations
Between January 2017 and July 2019, four extensive field campaigns (spanning ten weeks in total) were conducted along the Tekeze River downstream of the dam. During these field campaigns, long walks along the river were conducted, starting from the six accessible locations between the dam and Humera, 375 river kilometers (RK375) downstream of the dam (Figure 1), in order to make hydrogeomorphic and biophysical field observations. Ground control points (n = 474) were collected to systematically document the pre-dam and post-dam extent of the active river bed (including the maximum flood extent), the location of river terraces, the pre-dam and post-dam location of riparian vegetation, the extent of alluvial cones and location of field measurements. The latter include measurements on the height of post-dam river terraces and depth of post-dam lateral gullies, and diameters of the ten largest boulders (D10) for eleven alluvial cones at the confluences of large tributaries [42]. The ground control points were integrated in a Geographic Information System (GIS) and findings were extrapolated to areas that were not visited, based on the obtained field information and high-resolution satellite images (available in ArcMap and Google Earth).
For the riparian vegetation, the focus was on the distribution and presence of Tamarix nilotica, a deep-rooted salt-tolerant and stress-adapted pioneer species frequently observed along the river [43,44]. Tamarix sp. are invasive and rapidly expand along dam-regulated rivers, which was well-documented in the south-western United States [9,45,46]. Tamarix sp. typically germinate immediately after flood recession and easily manage to survive when high flow events are low in the subsequent years [45,46]. The spatial distribution of tamarisk bushes of different ages consequently provides information on the current and pre-dam flood extents.
To verify the observed changes and to gain additional information, field observations were complemented by semi-structured interviews with local inhabitants. These interviews helped to improve the understanding of dam-induced changes and provided information on the pre-dam and post-dam “river behavior” (e.g., information on the occurrence of low flows, the frequency and maximum extent of floods…). Some of the observed dam-induced changes were documented by repeat terrestrial photography, whereas others were mapped using multi-year high-resolution satellite images (e.g., changes in river width and extent of alluvial cones).
To study the dam-induced hydrologic alterations, discharge data for the Embamadre station were collected from the Ministry of Water, Irrigation and Electricity. The Embamadre station, located at RK100 (Figure 1), is the only available source of hydrologic data downstream of the dam in the Ethiopian part of the basin. Pre-dam discharges from the Embamadre station consequently were transposed to the dam site using the drainage area ratio method [47], assuming that the hydrology of the (upstream) Tekeze Dam catchment and the (downstream) Embamadre catchment does not differ all too much since both catchments partially drain the Simien Mountains, and as these data were also used in the feasibility study of the dam [28]. Transposing these data allowed us to compare pre- and post-dam discharges at the dam site by the preparation of flow duration curves and the observation of magnitudes of monthly water flows.
4. Results
4.1. General Dam Operation and Management
The operation and management of the (single purpose) Tekeze Dam is centered around the production of firm energy, which is the energy that can be supplied with 97% reliability [28]. Based on the seasonal reservoir inflow, electricity is generated throughout the year, while maintaining the reservoir water levels between the minimum power production level (1096 m ASL) and the maximum retention level (1140 m ASL). Reservoir levels fluctuate seasonally, reaching a minimum around 7 July and a maximum around 24 September. On a daily basis, the National Meteorological Agency (NMA) provides an update on the predicted amount of precipitation for the upcoming two weeks, although these predictions only indicate “below normal”, “normal” or “above normal”. It is difficult to adjust dam management based on such limited information (personal communication) and that is why dam operators use the reservoir volume growth rate for further inflow forecasting (i.e., information supported decision making—Figure S1). At the beginning of the rainy season, the observed volume growth rate is extrapolated to the end of the rainy season, and decisions for electricity generation are made accordingly (even though, around the middle of the rainy season, the surface runoff regime switches from Horton overland flow to saturation excess flow [48]).
Over time, numerous technical (operational) problems were encountered at the Tekeze Dam. Commonly, one to three out of the four turbines were under maintenance, leading to a very variable power production (Figure 2). Mostly, only one turbine was used for electricity generation (46% of the days), as compared to two (24%), three (27%) or four turbines (3%). Despite these numerous problems, the Tekeze Dam has generated 1082 GWh year−1 on average, exceeding the targeted (firm energy) of 981 GWh year−1. In hydrologic years 2010, 2015 and 2016 the power production target was not met due to incomplete transmission lines (2010) and a severe drought in 2015. In hydrologic year 2012, on the other hand, the production has exceeded the planned target with 80%, as 1753 GWh had been generated. At the scale of daily and monthly generated power, the firm energy was not met for 40% of the observed days and in 16.5% of the observed months between July 2010 and November 2019, as compared to the 97% reliability criterion.
4.2. Dam-induced Impacts on Downstream Hydrology and River Morphology
4.2.1. Altered Hydrologic Regime
Since the Tekeze Dam became operational, low flows (Q95) have significantly increased (with a factor of 27, from 0.9 m3 s−1 to 25.3 m3 s−1), whereas high flows (Q5) have been significantly reduced (with a factor of 5, from 743 m3 s−1 to 155 m3 s−1). Over time, the median flow (Q50) has increased by a factor of five (from 18 m3 s−1 to 95 m3 s−1), with an average released flow of 92 ± 44 m3 s−1 for electricity production and a maximum observed flow of 185 m3 s−1 (discharges above this value stem from the emergency releases using the MLOs) (Figure 3a). Discharges were highest during the dry season months and lowest during the months succeeding the rainy season, with a maximum monthly average in May (108 m3 s−1) and minimum monthly average in September (73 m3 s−1). Consequently, the seasonality of flow patterns was inverted downstream of the dam site, but also became much less pronounced than before dam construction (Figure 3b). On a daily basis, the recorded variability in post-dam discharges frequently has been considerably high, with jumps (Qmax–Qmin) up to 200 m3 s−1 within a one day-timeframe, and above 45 m3 s−1 for 25% of the recorded days (Figure 3c). Over time, the released flows have been above the demanded environmental flows (Q95 with a maximum of 60 m3 s−1 [28]), except for the months of July, August, September and October, when the targets were not met for 6.8%, 8.3%, 15.1% and 13.7% of the days respectively. For downstream ecosystems, it is important to reach these environmental flows also during the rainy season months, however, as the first large tributary (Giba) joins the Tekeze River only at RK36.
4.2.2. River Bed Degradation and Aggradation
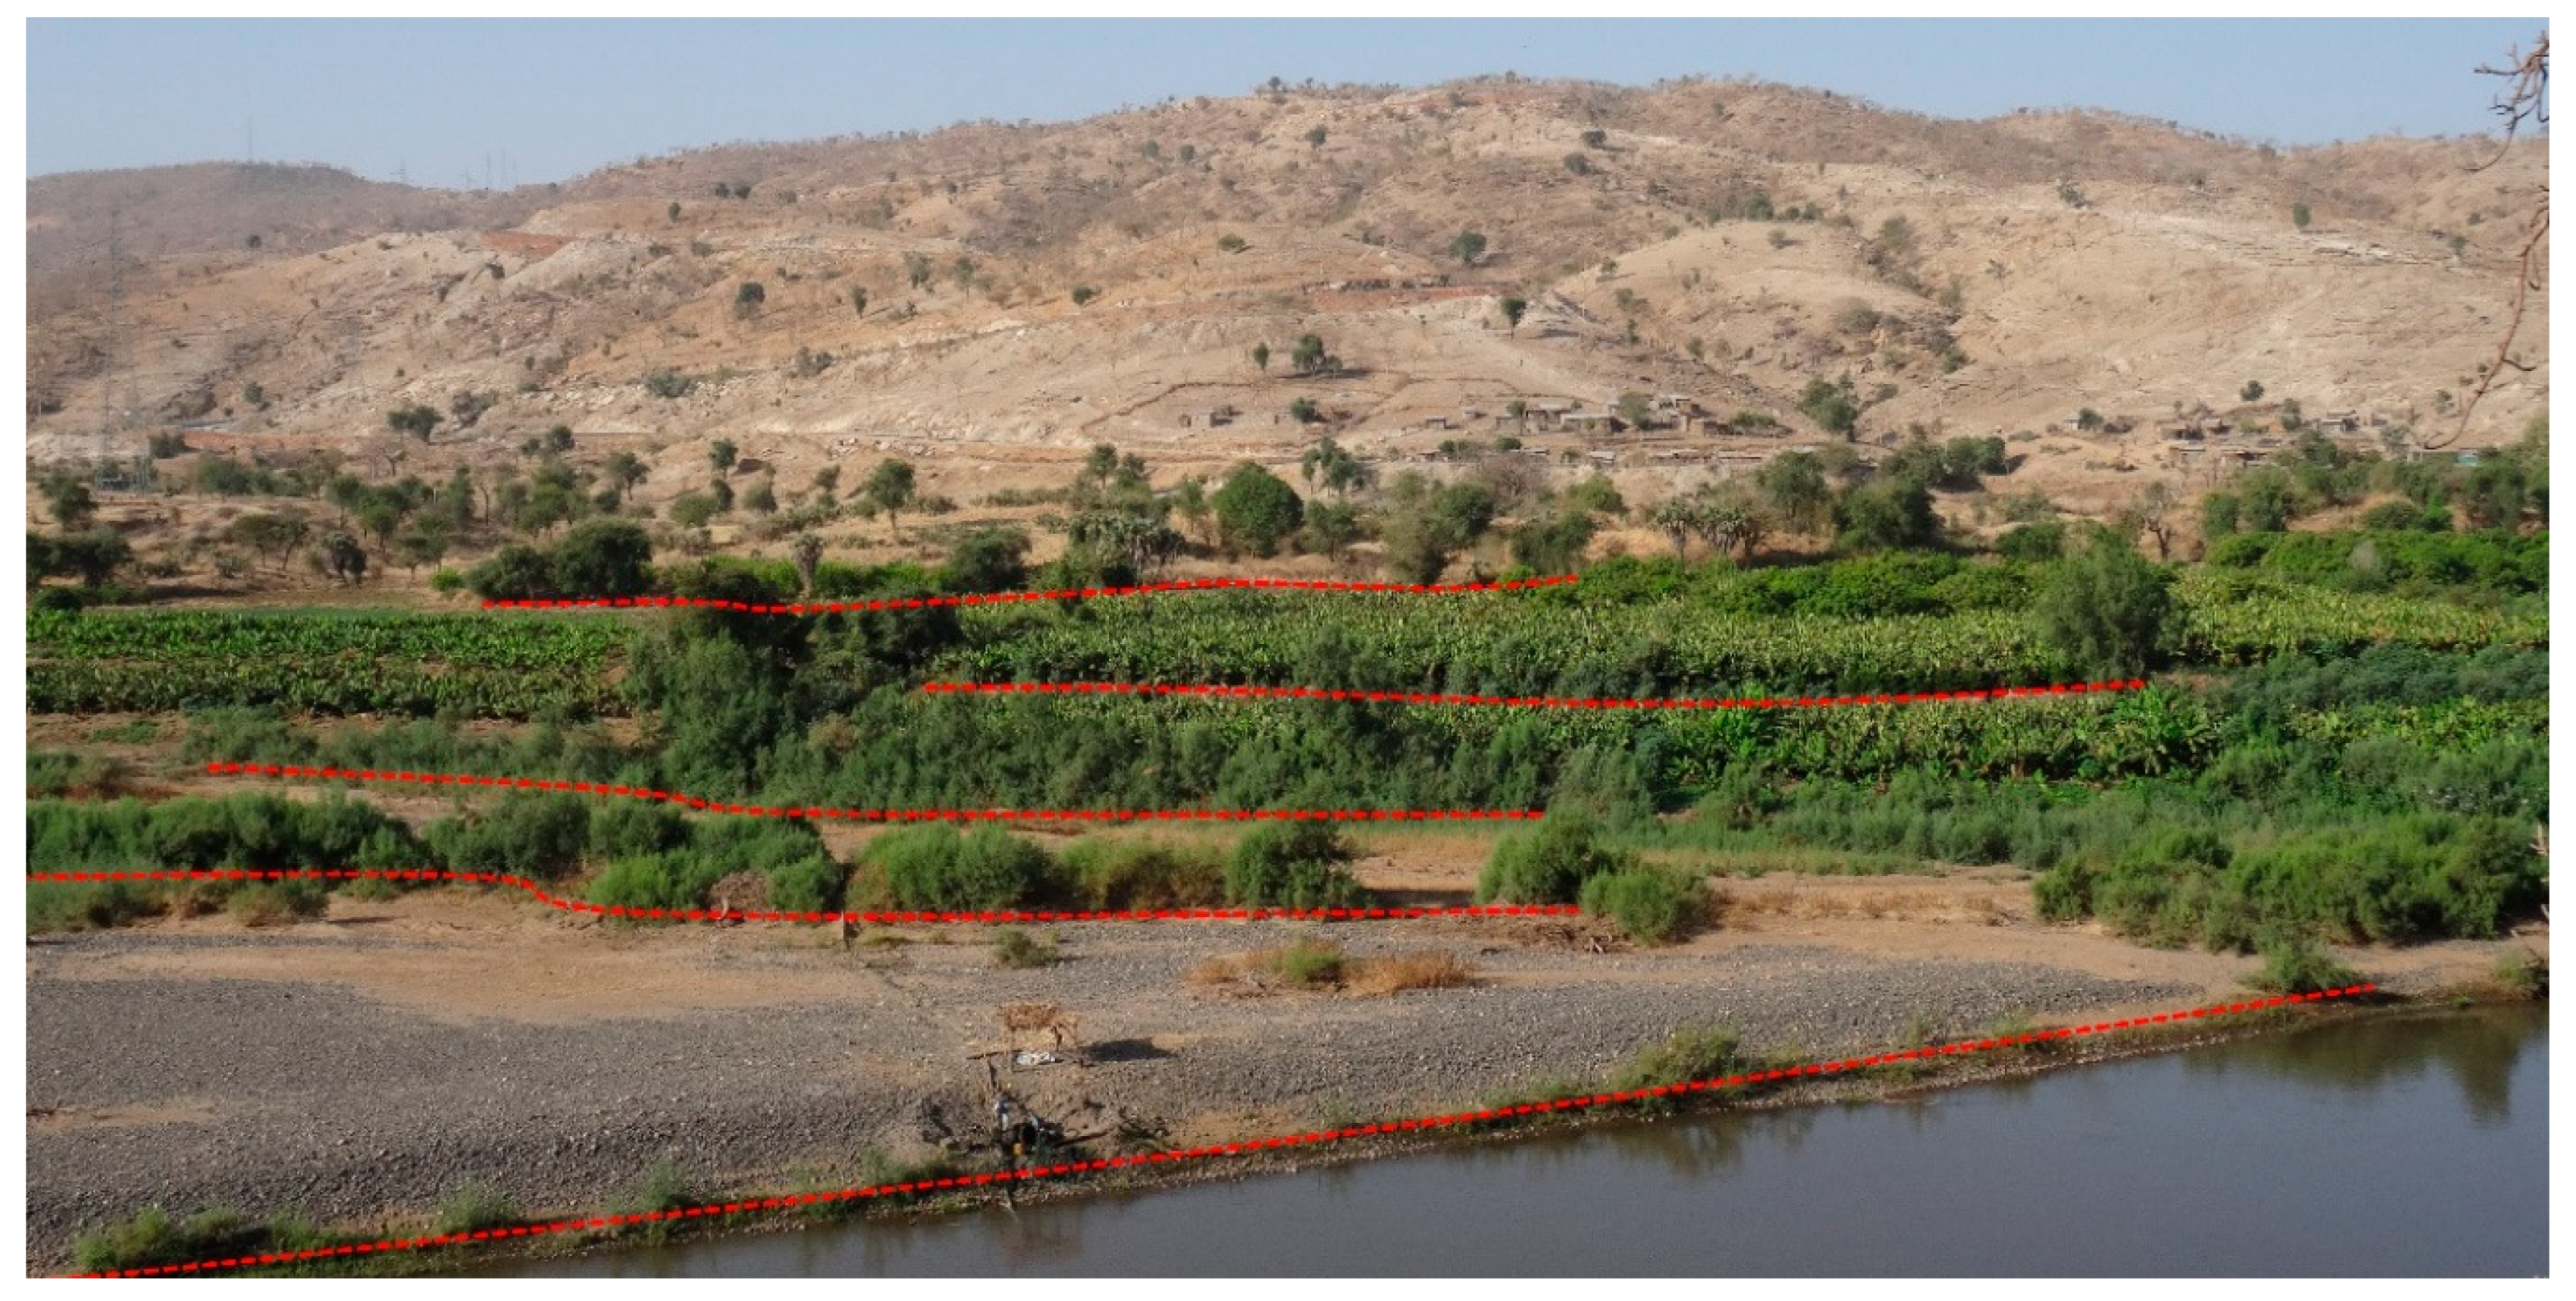
Around RK3, the Tekeze River incised at least 4 m after the dam became operational. Evidence for this was provided by a river terrace and several deep lateral gullies that were dated “pre-dam” and “post-dam” respectively during the field interviews (Figure 4). The height of the river terrace (and hence gully heads) was measured above the 2019 water level, and consequently provides a lower bound estimation. The rate of incision consequently was calculated as at least 0.4 m per year. Further downstream, the Tekeze River flows through a deeply incised gorge, where the absence of alluvial plains and river terraces makes it difficult to estimate incision rates. Near Embamadre (RK100), however, flow data potentially point out that the Tekeze River has incised up to there as well, although probably to a lesser extent. Since the dam became operational, the stage–discharge curve for the Embamadre station has not been updated. River bed degradation consequently could have led to an underestimation of actual discharges, and could be responsible for the observed decreasing trend in runoff volume downstream of the dam between 2010 and 2015 (Figure 5). During this period, no corresponding declining trend in reservoir inflow was observed—the inter-annual rainfall variability is expected to be similar as in the upstream catchment—and the extracted amount of water between the two stations is estimated to have remained invariable, as irrigated agriculture is absent along this stretch of the river [26]. In addition to river bed degradation, localized river bed aggradation also was observed in the first 150 RKs downstream of the dam. Over time, extensive alluvial cones have developed near the confluence of several large tributaries with the Tekeze River. Due to strongly reduced high flows and consequently reduced stream power [42], the Tekeze River has largely lost its ability to seasonally remove the debris cones of its affluents, usually consisting of large boulders with an average maximum diameter (D10) above 40 cm (42.7 ± 9.0 cm for n = 11). Therefore, in many places, the river has been “pushed” towards the opposite side of the valley, where it has further deepened its channel (see Figures in Section 4.4.2).
Downstream of RK100, no clear patterns of river bed degradation or aggradation were observed. This is probably due to the fact that several large tributaries (e.g., Weri’i and Giba) already joined the Tekeze River at that point, increasing both the water and sediment flows. In addition, the river valley becomes less confined around RK80 (Figure 1) and the water consequently gains more freedom to flow, weakening the chance to observe dam-induced changes.
Virtually no planform changes were observed along the Tekeze River after dam construction, despite the release of clear water from the reservoir. Possible explanations include (i) the strong confinement of the river up to RK80 (including the confluence of two major tributaries); (ii) a strong reduction in high flows (which often are responsible for lateral channel migration); and (iii) the increased riverbank stabilization due to natural vegetation expansion and the strongly expanded cultivation of perennial crops.
4.2.3. Narrowing of the Active Channel
Since the Tekeze Dam became operational, the width of the active river bed has declined with on average 7% in the laterally confined areas (from 164 m to 144 m for RK0–RK80 and RK280–RK420) and 31% in the partly confined to unconfined areas (from 241 m to 162 m for RK80–RK280), where the bed gradient is low (0.98 m km−1 vs. 1.35 m km−1 for RK0–RK80 and 1.10 m km−1 for RK280–RK420) and the river has a lot of freedom to flow (Figure 6 and Figure S2). First, due to the clear water effect, the river has incised along the first 100 RKs downstream of the dam, leading to a reduced width/depth ratio and hence decreased required width to allow discharges of the same magnitude as compared to the pre-dam situation. Second, due to reduced high flows, increased low flows and changing water tables, riparian vegetation has expanded along the abandoned floodplains of the Tekeze River, with Tamarix nilotica as the dominant observed pioneer species. Different generations of tamarisk can be observed, with years-old trees located up to hundreds of meters away from the active river bed and young bushes of tamarisk located much closer to and even in the active river bed. Whereas the meters-high old trees indicate the pre-dam flooded perimeter, the young generation of tamarisk bushes indicates the (gradual) post-dam retreat of the maximum flooded perimeter (Figure 7). The presence of new tamarisk bushes triggers a continued narrowing of the river, as depositions are trapped more easily, allowing the accumulation of sediments (vertical accretion) and hence stabilization of the largely abandoned floodplain [45,46]. Third, dam-induced reduced high flows and increased low flows have also caused humans to increasingly occupy floodplains for irrigated agriculture. Since the Tekeze Dam became operational, the irrigated area along the river has expanded from 433 ha to 1698 ha, mainly consisting of fruit plantations, and even the lower river terraces have become cultivated [26]. Similarly to natural vegetation expansion, fruit trees reduce flow velocity during floods, what leads to sediment trapping and temporary runoff storage. Fourth and last, to better protect their fruit plantations, some farmers plant the fast-growing elephant grass (Pennisetum purpureum) at the edge of the river bed, which leads to increased bank stability [50] and hence accelerated river narrowing. Although the narrowing of the river is initially dam-induced, it is accelerated by the expansion of riparian vegetation and anthropogenic land use changes.
4.3. Dam Operation and Management in Case of Extreme Reservoir Water Levels
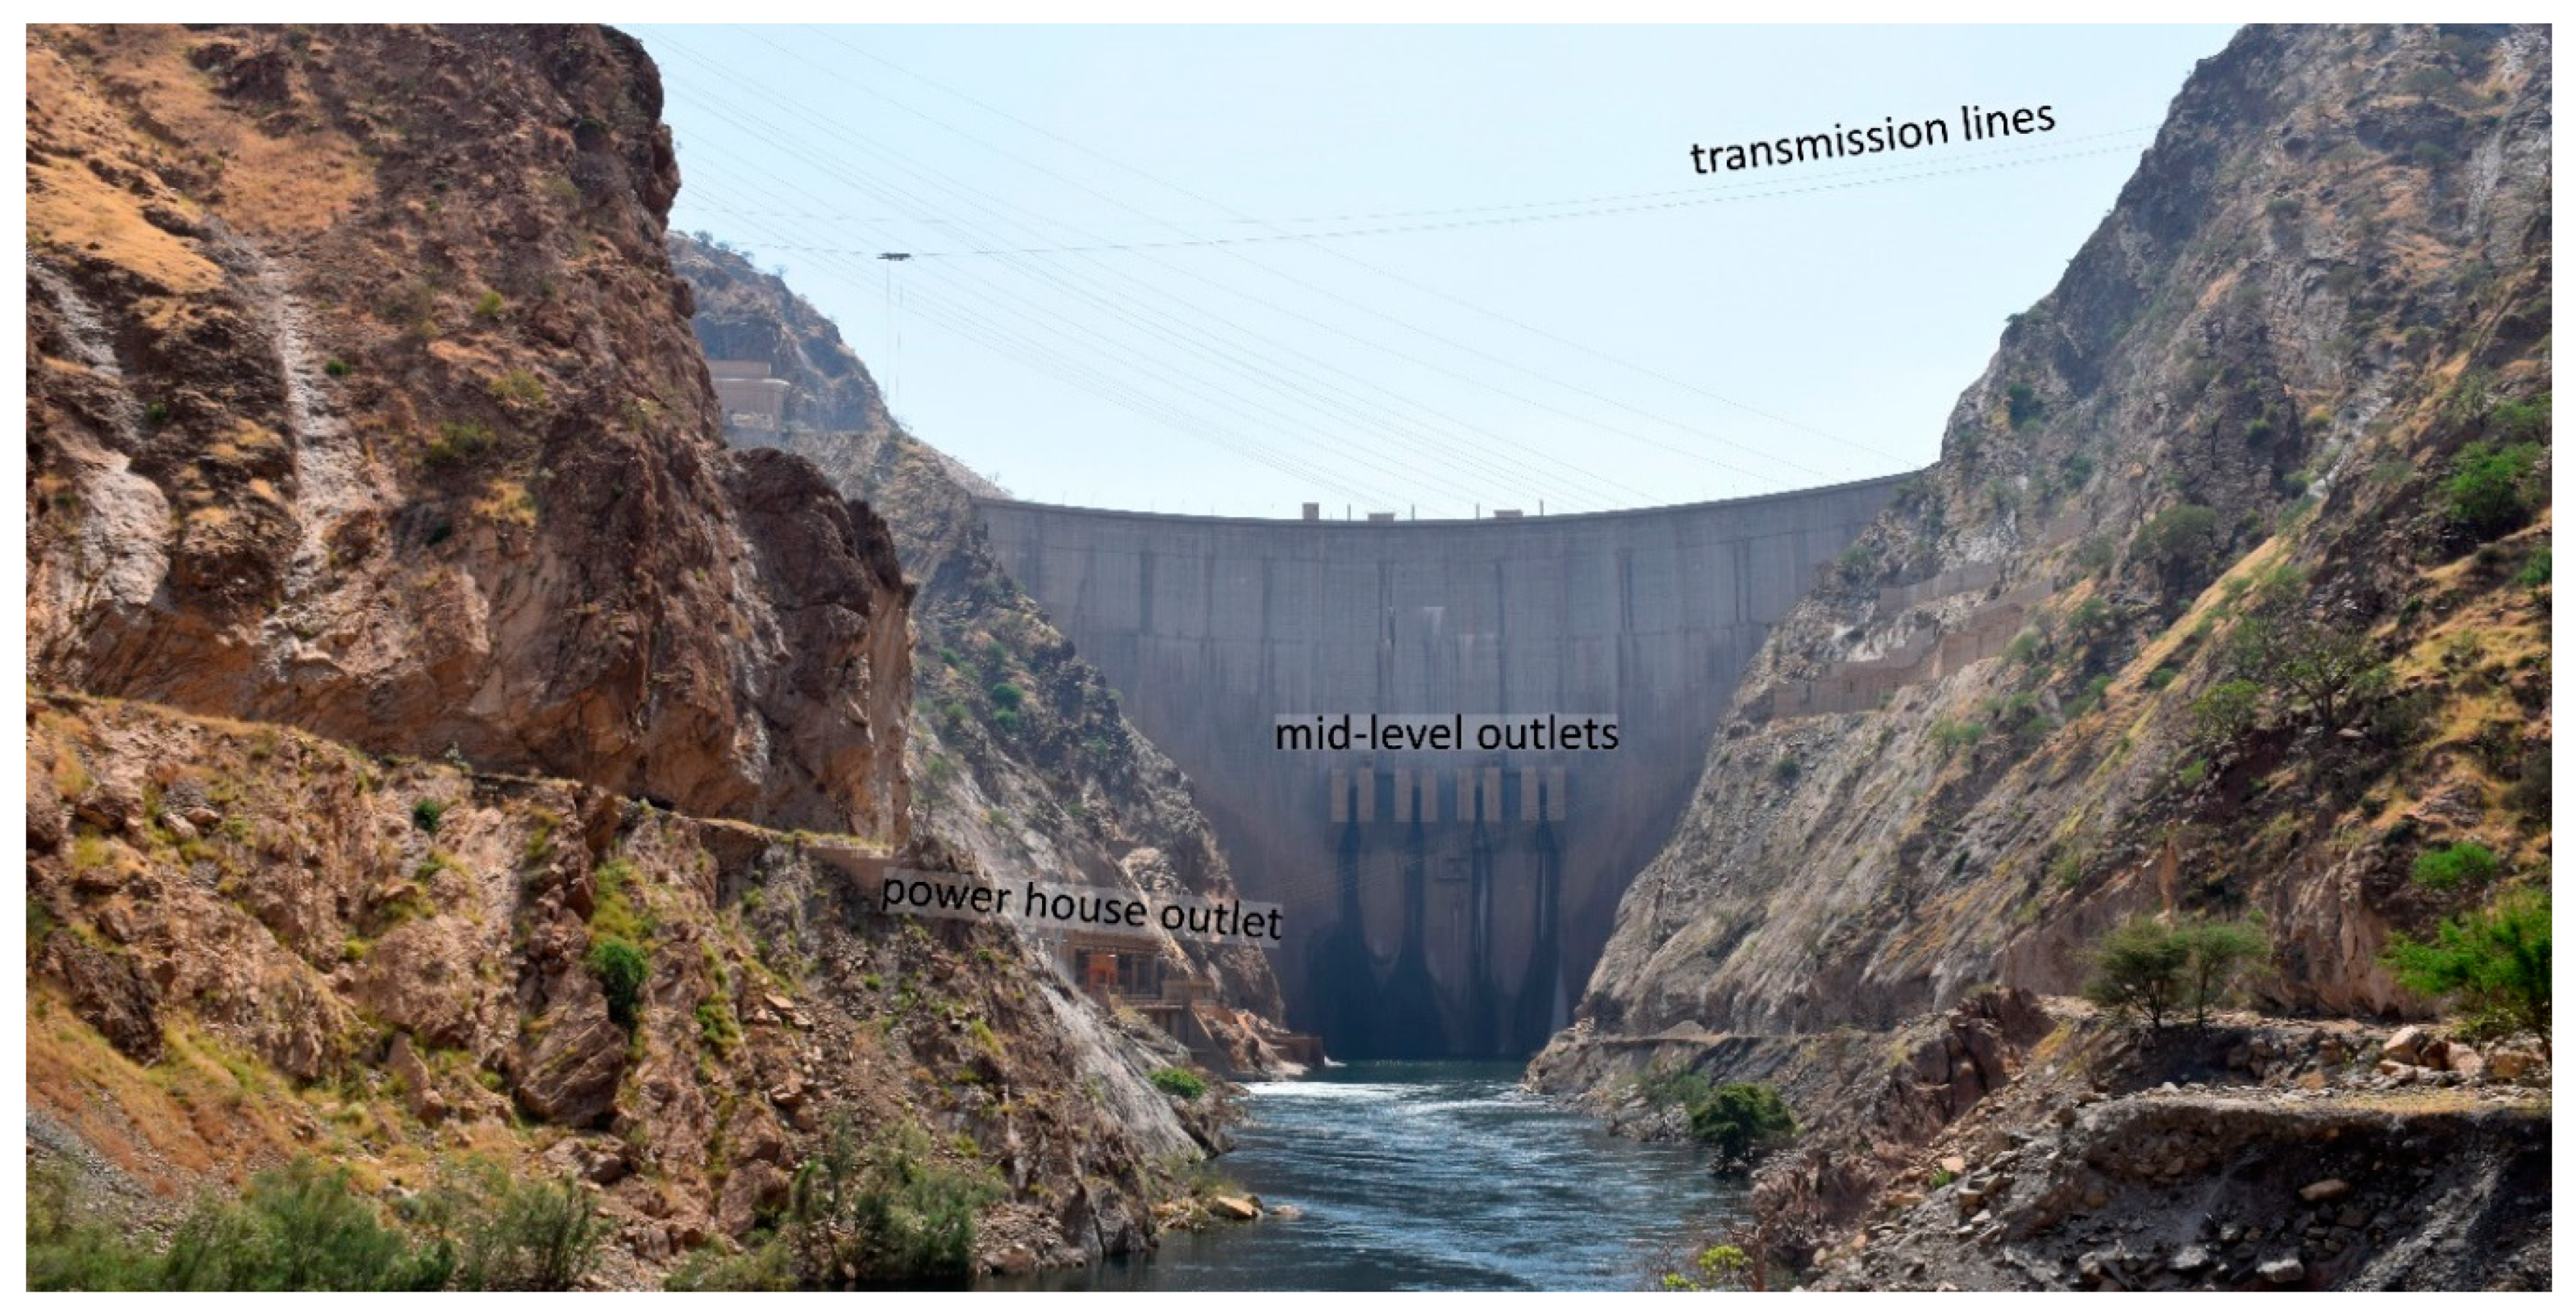
When the reservoir water levels are too high at the beginning of the rainy season or when the Tekeze Reservoir nearly reaches the maximum retention level (1140 m ASL), the four MLOs can be opened to avoid the overtopping of the dam as there is no spillway. When water is spilled (released) from these MLOs, however, no power can be generated simultaneously because the released water creates a foggy shower and wind just downstream of the dam, where the transmission lines cross the narrow gorge on their way to the transformer, anchored on the opposite side of the valley, and on their way back to the switcher (Figure 8). This could potentially cause damage to the transmission lines [51] and consequently threaten electricity production in the period that follows. The transmission lines crossing the gorge too close to the MLOs are considered technical errors in dam design (personal communication). In addition, when too much water is released from the MLOs, both water and debris can enter the powerhouse from outside, which can disrupt and even damage the turbines. This occurred after spilling water from the MLOs in 2019, for example, when debris from a landslide just downstream of the dam had entered the powerhouse. The use of the MLOs will hence be avoided as long as possible, as it is uneconomic and potentially involves damage to the turbines. The dam operator consequently must make a constant trade-off between power generation and dam safety when reservoir water levels become high. The MLOs were used over time, in 2012, 2018 and 2019. In 2018, a vast amount of water was discharged at the end of the rainy season, whereas in 2019, the MLOs were used as a preventive measure, rather.
4.4. Impacts on Downstream Hydrology and River Morphology under Extreme Reservoir Levels
4.4.1. Emergency Water Release in 2018
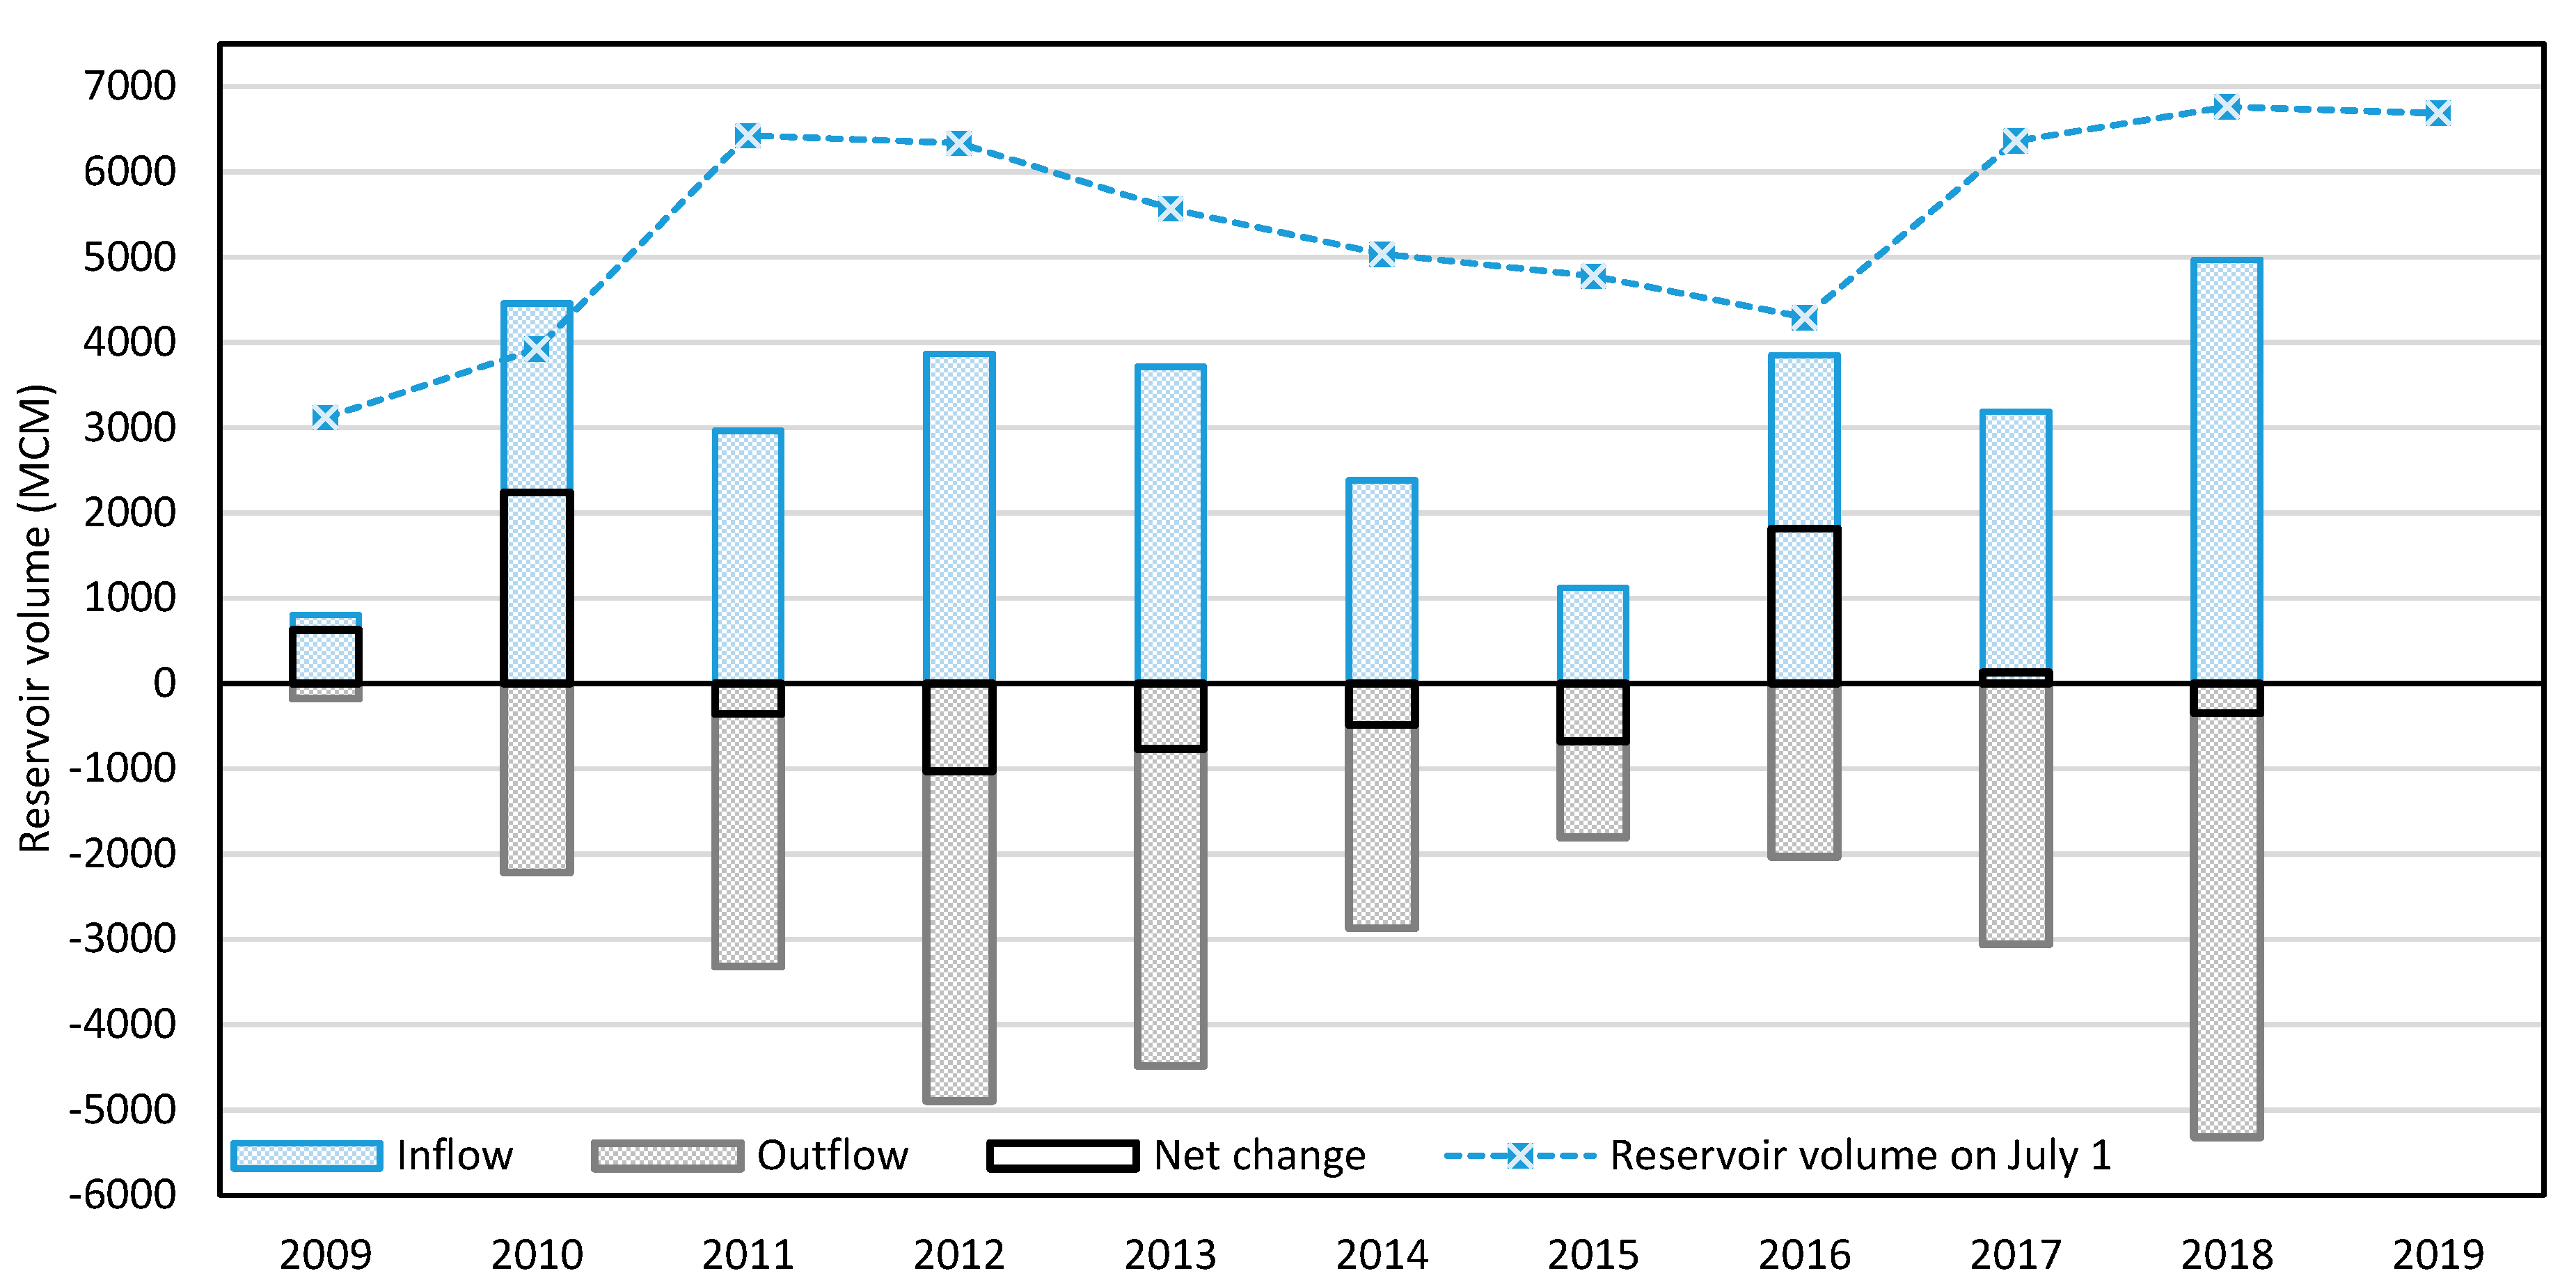
At the beginning of the rainy season of 2018, the reservoir water level was the highest ever recorded for that time of the year (Figure 9). With a water level of 1124 m ASL, the reservoir stored 75% of the 2018 reservoir volume of 9023 MCM (discounted for reservoir sedimentation). Over time, an average yearly reservoir inflow of 3392 MCM was observed, whereas on average only 673 MCM was released for electricity generation during the rising limb of the seasonal reservoir fluctuations (July to September). This should have highlighted the need for preventive actions to release a certain volume of water using the MLOs. The rainy season of 2018 appeared to be the wettest rainy season since the Tekeze Dam became operational, as 4970 MCM water entered the reservoir. Initially the reservoir volume growth rate had remained relatively low (20 MCM day−1), but starting from August 8 the growth rate more than quadrupled (84 MCM day−1) and the reservoir water levels increased rapidly. It was not until August 25 that EEP decided to open the MLOs in order to release water at fast pace. After this, the reservoir levels continued to increase and reached an absolute maximum of 1139.75 m ASL on 1 September, when an additional volume of 41 MCM would have been enough to overtop the maximum retention level, potentially putting dam safety at risk (Figure 10). Between 25 August and 16 September, a volume of 1693 MCM was released from the reservoir using the MLOs. This corresponds to 58% of the average yearly released volume of water for electricity generation (2896 MCM) and the pre-dam observed runoff for the entire month of August [49].
4.4.2. Hydrogeomorphic Impact of the 2018 Emergency Water Release
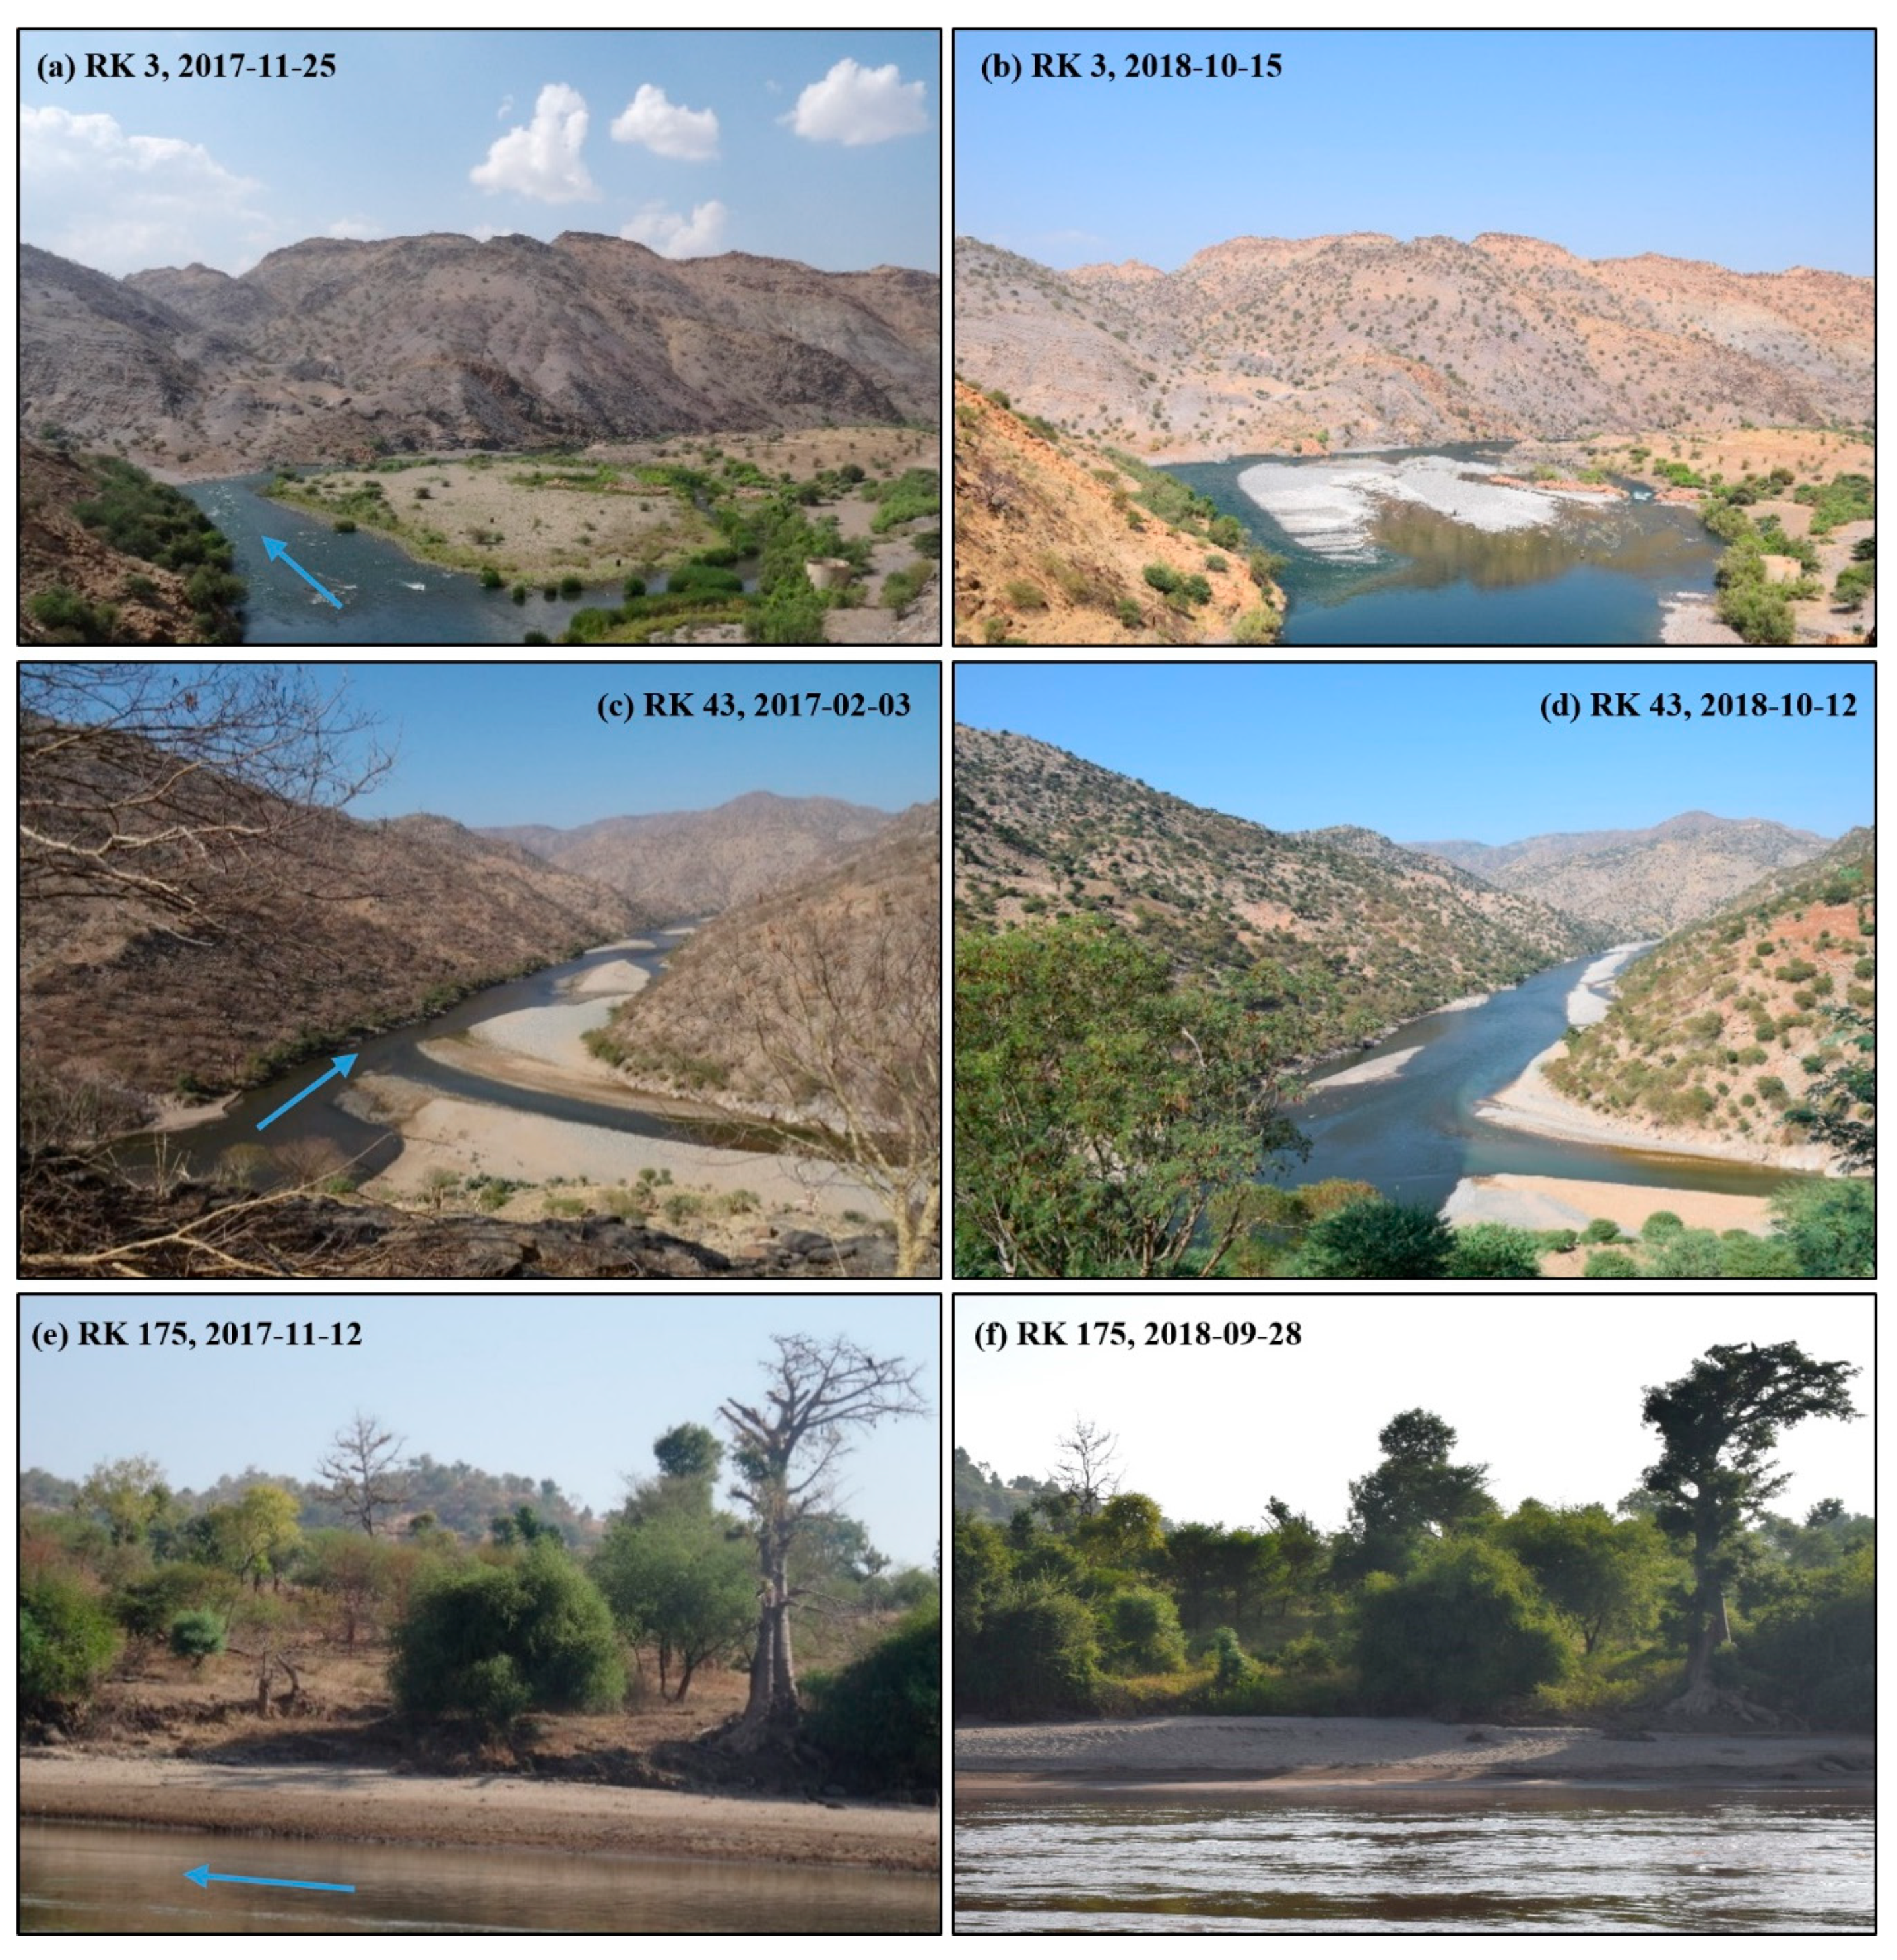
At RK3, a point bar of 5.4 ha was fully washed during the 2018 emergency release. All vegetation and most sand and gravel depositions were flushed away at that time (Figure 11a,b). As the lateral catchments are very limited in extent, only a small amount of new sediments can be brought up to this point in the future, and hence it seems unlikely that the point bar will recover. At many places along the river, extensive alluvial cones had developed near the confluences of large tributaries. The area of these alluvial cones had gradually expanded since the dam became operational, until they abruptly were eroded during the emergency release, which generated discharges competent enough to disrupt the post-dam equilibrium (Figure 11c,d, Figure 12 and Figure 13). One rainy season after the emergency release, multiple alluvial cones already have recovered, indicating that a large share of the underwater volume of the alluvial cones had remained unaffected by the flood. There is no clear correlation between the area of the alluvial cones and the catchment area (R2 = 0.33), Strahler stream order (R2 = 0.28) or catchment slope (R2 = 0.12), or between the emergency release-induced degraded area and the catchment area (R2 = 0.41), Strahler stream order (R2 = 0.21) or distance downstream of the dam (R2 = 0.07). The emergency release caused extensive channel degradation and consequently mobilized a lot of materials that have been transported to the downstream river reaches. At several places along the river, sandy depositions with a thickness of over one meter occurred during the emergency release (Figure 11e,f).
4.4.3. Socioeconomic Impact of the Emergency Water Releases
Due to dam-induced hydrologic alterations, the impact of the 2018 emergency release—with discharges up to 1554 m3 s−1 for several consecutive days (see Figure 3)—was worse than it would have been before dam construction, as floodplains had been considered safe from flooding. During this emergency water release, the plantations (especially) at the lowest river terraces were damaged by extreme high water levels (Figure S3). A total of 179 ha of farmland was reported damaged to the local agricultural specialists. This corresponds to 11% of the total irrigated area along the Tekeze River [26]. While most plants were damaged by high water levels, muddy depositions on banana leaves also caused numerous plants to die, as photosynthesis was hindered. Clearly, this caused serious economic losses for the farmers, as monetary and time investments were lost to the flood and were not compensated. Due to radio warnings, however, no flood-induced deaths were reported, although several persons already had lost their lives in the post-dam Tekeze River. This problem mainly occurred closer to the dam, where communities of both river sides were used to interact and river crossing before dam construction did not require swimming during the dry season. Despite the impacts of the 2018 water release, at the beginning of the rainy season of 2019, the reservoir water levels were as high as those of 2018 (Figure 2), even though a (small) preventive release was performed in the month of May. If the reservoir inflow had been as high as that of 2018, a similar risky situation would have been created with severe downstream flooding and economic losses in the riparian fruit plantations as a consequence. A total volume of water of 450 MCM eventually was spilled in 2019.
5. Discussion
5.1. Future Dam Operation Optimization
As Ethiopia wants to become a major electricity exporter by 2040 [52], it is clear that the Tekeze Dam operation and management should be optimized as the electricity production is below potential and water was spilled in three out of ten years of operation. An important factor that should be considered while doing this is the increased hydro-climatic uncertainty generated by climate change. While some studies predict a (small) decrease in precipitation and consequently streamflow for the Tekeze Basin [33,53], others predict an increase in precipitation [54] and inter-annual precipitation variability [55]. Either way, climate change will amplify the challenges to provide a reliable source of energy and will impact the returns generated from it [20]. In this regard, the implementation of a forecast-informed reservoir operation system would strongly improve the decision-making process, and would be especially beneficial in years with extreme (low or high) precipitation [19,56,57], although some uncertainty will always remain [58]. Forecasting, moreover, would reduce the risk induced by the current qualitative decision making, which strongly relies on judgments of the dam operator, a type of decision making that appears to be common in the entire Ethiopian hydropower sector [59].
Although most studies on the impact of climate change consider a positive correlation between reservoir inflow and electricity generation, energy production was only slightly correlated with the annual reservoir inflow for the Tekeze Reservoir (R2 = 0.15) (Figure 14). However, correlations are markedly higher for years with below-average reservoir inflow (R2 = 0.91) than for those with above-average inflow (R2 = 0.06) (although there is a limited amount of observations only). This shows that no full use was made of above-average reservoir inflows, whereas below-average inflows have directly impacted the amount of electricity generated (as is also modelled by Basheer et al. [60]). The latter is not really surprising as the effect of low flows can be quite pronounced in annual-storage reservoirs [31] (Tekeze Reservoir active storage = 1.56 × annual inflow) and in case of the Tekeze Dam, the operators have to deal with extreme uncertainty produced by inter-annual inflow variability (e.g., I2018 = 4.42 × I2015). The observed poor correlation consequently also highlights that water availability in the reservoir is not the only limiting factor for electricity production. For the Tekeze Dam, the frequently recurring technical issues probably were as equally important. Yet, during the water release from the MLOs in the months of May, July and August 2019, EEP continued to generate electricity at the same time, although this could induce serious damage. From this, it is clear that electricity generation in the short-run is prioritized over sustainable and reliable dam operation in the long-run, which can be considered a “high-risk–high-reward” type of behavior. In order to improve future dam operation, the focus consequently should be on optimal reservoir management in combination with solving of the frequently occurring problems in a sustainable way, while respecting downstream riparian water users and ecosystems.
5.2. Impacts of Hydropower Dams in (Semi-)Arid Environments with High Inter-Annual Rainfall Variability
Under improved reservoir operation (with limited emergency releases), it is expected that the newly established hydrogeomorphic equilibrium will persist through time. This post-dam established equilibrium—with increased low flows, reduced high flows, smoothened seasonal flow patterns, river bed degradation, river bed aggradation at confluences and narrowed active river beds—provides valuable information applicable for many other (semi-)arid environments with high inter-annual rainfall variability, and consequently could be used to anticipate future changes downstream of (single-purpose) hydropower dams in similar environments. Many of the observed changes are in line with other theoretical and empirical studies on dam-induced river morphologic changes [4,5,8,9,61,62,63].
Insights gained in this study on dam-induced vegetation dynamics (Tamarix nilotica) can be of interest for other countries south of the Sahara and in the Middle East. Whereas a lot of studies discuss the behavior of Tamarix ramosissima and Tamarix chinensis after dam regulation [9,45,46], much less is known about the characteristics of Tamarix nilotica [44]. Further research on the post-dam distribution and behavior of Tamarix nilotica consequently is required timely, as the species is known to be invasive, disturbs indigenous species and even alters hydrologic processes due to high consumptive water use [64]. Additionally, empirical and methodological future research should investigate the potential of the presence of (different generations of) tamarisk trees as important indicators of hydrologic alteration, and of river narrowing in the case of dam regulated rivers.
5.3. Methodological Lessons from the Tekeze Case Study
The Tekeze case study highlights the importance of (i) simultaneously investigating the dam operation and management and dam-induced downstream hydrology and river morphology, (ii) planning of multi-year field campaigns along the dam-regulated river, and (iii) supplementing field observations with field interviews and consequently local knowledge. First, the simultaneous investigation of the dam operation and hydrologic and morphologic alterations allowed us to obtain a good understanding of the dam-induced downstream dynamics. Without data on the dam emergency releases, zooming in at different time steps would have been much less interesting and the newly established equilibrium would not have been well understood. Moreover, the hourly discharge variability also provided a unique insight in the unpredictable nature of dam-regulated rivers, which can be very challenging for downstream riparian communities and ecosystems. This variability very often is not considered due to limited data availability. Second, visiting the downstream areas multiple times likewise helped us to improve the understanding of the downstream established new equilibrium and allowed us to take repeat terrestrial photographs at several locations along the river, which is considered a good way for documenting environmental changes. Third, the field interviews also greatly helped us to interpret the post-dam hydrogeomorphic system as local inhabitants have indicated the timing and order of magnitude of different changes and helped to better understand alterations in riparian vegetation. While studying downstream hydrogeomorphic dynamics, it moreover remains important to also consider dam-induced social impacts, which can only be understood properly by interviewing riparian water users [26].
6. Conclusions
Since its commissioning in 2009, the Tekeze hydropower dam in semi-arid northern Ethiopia has extensively altered the downstream hydrologic regime of the Tekeze River. High flows (Q5) have reduced (with a factor of 5), low flows (Q95) have increased (with a factor of 27), seasonal flow patterns have smoothened and diurnal flow variability has increased in accordance with the fluctuating electricity demand. Due to newly obtained hydrologic conditions and trapping of sediments in the reservoir, considerable downstream river morphologic changes have occurred as well. Along the first 100 river kilometers (RK) downstream of the dam, the river bed has incised up to 4 m because of underloaded flows, but has also aggraded near tributary confluences as the river is no longer competent to remove the seasonally supplied (bedload) debris from tributaries. Between RK80 and RK280 (where the river is less confined), the active river bed has narrowed with 31% due to reduced high flows, expanded riparian vegetation (Tamarix nilotica and Pennisetum purpureum) and increased floodplain occupation for irrigated agriculture (mainly fruit plantations). Hydrologic alterations have caused the initial narrowing of the river, while altered vegetation dynamics and agricultural activities have accelerated the process of river narrowing. Whereas under normal conditions the reservoir is managed to optimize electricity generation by taking full advantage of the stored runoff, a large volume of water was spilled at the end of August 2018 (1692 million cubic meter, 58% of the annual released volume of water for electricity generation). This was caused by decisions of the dam management, in combination with an above-average reservoir inflow. Reservoir water levels were too high at the beginning of the rainy season and the dam operators relied too much on the initial (slower) reservoir volume growth rate to forecast reservoir inflow (which, moreover, cannot be considered a good predictor in semi-arid environments, as there is a threshold in runoff response). Consequently, a large amount of water was not used for electricity generation and at the same time induced economic losses due to flooding in the downstream areas, where 11% of the riparian fruit plantations have been damaged. Due to this emergency release, the newly established hydrogeomorphic equilibrium was also partially disrupted. Severe erosion occurred in the first 150 RKs, whereas thick layers of sediment (>1 m) were deposited along the lower reaches of the river. Until the next large volume of water will be released from the reservoir, the river is expected to return to its post-dam (pre-flood) established equilibrium. Simultaneously studying dam operation and management and downstream hydrogeomorphic alterations, based on multiple field campaigns including field interviews, allowed us to properly understand the newly established downstream equilibrium and to report several textbook examples of dam-induced hydrogeomorphic changes. Based on the results of this study, it is suggested to optimize the Tekeze Dam operation (using inflow forecasting) and to sustainably solve the frequently occurring technical problems in order to avoid future risks and to safeguard downstream riparian water users and ecosystems.
Supplementary Materials
The following are available online at https://www.mdpi.com/2073-4441/12/8/2237/s1, Figure S1: The Tekeze dam operation and management is based on an information supported decision support system (DSS): reservoir water levels are monitored but the dam operator makes all decisions (McCartney and King, 2011, [16]); Figure S2 The post-dam river narrowing has mainly occurred in the areas with a large pre-dam river width (unconfined areas) than in those with a smaller pre-dam river width (confined areas); Figure S3: Banana plants damaged by the 2018 emergency dam release: the yellow-colored plants will die and need to be replaced. The water levels remained high for up to fifteen days and thick layers of sand have been deposited.
Author Contributions
Conceptualization, S.A. and J.N.; Formal analysis, S.A.; Funding acquisition, S.A. and J.N.; Investigation, S.A., T.G. and J.N.; Methodology, S.A. and J.N.; Supervision, T.G. and J.N.; Writing – original draft, S.A.; Writing – review & editing, S.A., T.G. and J.N. All authors have read and agreed to the published version of the manuscript.
Funding
This research was funded by the Flemish Research Foundation (FWO, Belgium), through grant numbers G022217N, V445417N, V437018N and K219019N.
Acknowledgments
The authors would like to thank Ethiopian Electric Power to provide the required data and for its valuable cooperation. All support given by Mekelle University has been greatly appreciated and special thanks go to Getachew Gebremedhin for assisting and translating in the field.
Conflicts of Interest
The authors declare no conflict of interest.
References
- Williams, G.; Wolman, M. Downstream Effects of Dams on Alluvial Rivers; United States Government Publishing Office: Washington, DC, USA, 1984; Volume 1286. [Google Scholar]
- Graf, W.L. Downstream hydrologic and geomorphic effects of large dams on American rivers. Geomorphology 2006, 79, 336–360. [Google Scholar] [CrossRef]
- Petts, G.; Pratts, J. Channel changes following reservoir construction on a Lowland English River. Catena 1983, 10, 77–85. [Google Scholar] [CrossRef]
- Kondolf, G.M. Hungry Water: Effects of Dams and Gravel Mining on River Channels. Environ. Manag. 1997, 21, 533–551. [Google Scholar] [CrossRef] [PubMed]
- Brandt, S.A. Classification of geomorphological effects downstream of dams. Catena 2000, 40, 375–401. [Google Scholar] [CrossRef]
- Kondolf, G.M.; Swanson, M.L. Channel adjustments to reservoir construction and gravel extraction along Stony Creek, California. Environ. Geol. 1993, 21, 256–269. [Google Scholar] [CrossRef]
- Musselman, Z.A. The localized role of base level lowering on channel adjustment of tributary streams in the Trinity River basin downstream of Livingston Dam, Texas, USA. Geomorphology 2011, 128, 42–56. [Google Scholar] [CrossRef]
- Petts, G.; Thoms, M.C. Channel aggradation below Chew Valley Lake, Somerset, U.K. Catena 1986, 13, 305–320. [Google Scholar] [CrossRef]
- Stromberg, J.C.; Lite, S.J.; Marler, R.; Paradzick, C.; Shafroth, P.B.; Shorrock, D.; White, J.M.; White, M.S. Altered stream-flow regimes and invasive plant species: The Tamarix case. Glob. Ecol. Biogeogr. 2007, 16, 381–393. [Google Scholar] [CrossRef]
- Poff, N.L.; Hart, D.D. How Dams Vary and Why It Matters for the Emerging Science of Dam Removal. Bioscience 2002, 52, 659–668. [Google Scholar] [CrossRef] [Green Version]
- Moeini, R.; Afshar, A.; Afshar, M.H. Fuzzy rule-based model for hydropower reservoirs operation. Int. J. Electr. Power Energy Syst. 2011, 33, 171–178. [Google Scholar] [CrossRef]
- Aboutalebi, M.; Bozorg-Haddad, O.; Loáiciga, H.A. Optimal Monthly Reservoir Operation Rules for Hydropower Generation Derived with SVR-NSGAII. J. Water Resour. Plan. Manag. 2015, 141, 04015029. [Google Scholar] [CrossRef] [Green Version]
- Bianucci, P.; Sordo, A.; Moralo, J.; Garrote, L. Probabilistic-Multiobjective Comparison of User-Defined Operating Rules. Case Study: Hydropower Dam in Spain. Water 2015, 7, 956–974. [Google Scholar] [CrossRef] [Green Version]
- Tayebiyan, A.; Ali, T.A.M.; Ghazali, A.H.; Malek, M.A. Optimization of Exclusive Release Policies for Hydropower Reservoir Operation by Using Genetic Algorithm. Water Resour. Manag. 2016, 30, 1203–1216. [Google Scholar] [CrossRef]
- Zou, R.; Lung, W.S. Robust Water Quality Modeling Using Alternating Fitness Genetic Algorithm Using an Alternating Fitness Genetic Algorithm. J. Water Resour. Plan. Manag. 2004, 130, 93–111. [Google Scholar] [CrossRef]
- McCartney, M.; King, J. Use of decision support systems to improve dam planning and dam operation in Africa. In Research for Development Series; No. 2; CGIAR: Colombo, Sri Lanka, 2011. [Google Scholar]
- Giupponi, C.; Sgobbi, A. Decision Support Systems for Water Resources Management in Developing Countries: Learning from Experiences in Africa. Water 2013, 5, 798–818. [Google Scholar] [CrossRef] [Green Version]
- Jager, H.I.; Smith, B.T. Sustainable reservoir operation: Can we generate hydropower and preserve ecosystem values? River Res. Appl. 2008, 24, 340–352. [Google Scholar] [CrossRef]
- Block, P. Tailoring seasonal climate forecasts for hydropower operations in Ethiopia’s upper Blue Nile basin. Hydrol. Earth Syst. Sci. Discuss. 2010, 7, 3765–3802. [Google Scholar] [CrossRef] [Green Version]
- Conway, D.; Dalin, C.; Landman, W.; Osborn, T.J. Hydropower plans in eastern and southern Africa increase risk of concurrent climate-related electricity supply disruption. Nat. Energy 2017, 2, 946–953. [Google Scholar] [CrossRef]
- McCartney, M.P. Decision Support Systems for Large Dam Planning and Operation in Africa; Working Paper No. 119; International Water Management Institute: Colombo, Sri Lanka, 2007. [Google Scholar]
- Crow-Miller, B.; Webber, M.; Molle, F. The (re)turn to infrastructure for water management? Water Altern. 2017, 10, 195–207. [Google Scholar]
- Schulz, C.; Adams, W.M. Debating dams: The World Commission on Dams 20 years on. Wiley Interdiscip. Rev. Water 2019, 6, 1–19. [Google Scholar] [CrossRef]
- International Hydropower Association (IHA). Hydropower Status Report 2019; IHA: London, UK, 2019. [Google Scholar]
- Acreman, M.C. Managed Flood Releases from Reservoirs: Issues and Guidance. In Report to DFID and the World Commission on Dams; Thematic Review No. 2.1; Centre for Ecology and Hydrology: Wallingford, UK, 2000. [Google Scholar]
- Annys, S.; Van Passel, S.; Dessein, J.; Asfaha, T.G.; Adgo, E.; Nyssen, J. Small-scale irrigation expansion along the dam-regulated Tekeze River in northern Ethiopia. Int. J. Water Resour. Dev. 2020. [Google Scholar] [CrossRef]
- Ethiopian Electric Power Corporation (EEPCo). Tekeze Hydroelectric Power Plant; EEPCo: Addis Ababa, Ethiopia, 2009. [Google Scholar]
- Howard Humphreys & Partners; Coyne et Bellier; Rust Kennedy & Donkin. Tekeze Medium Hydropower Project—Feasibility Study—Main Report; Addis Ababa, Ethiopia, 1997. [Google Scholar]
- Ismail, E.H.; Abdelsalam, M.G. Morpho-tectonic analysis of the Tekeze River and the Blue Nile drainage systems on the Northwestern Plateau, Ethiopia. J. Afr. Earth Sci. 2012, 69, 34–47. [Google Scholar] [CrossRef]
- Ethiopian Electric Power (EEP). Available online: www.eep.com.et (accessed on 4 May 2020).
- Digna, R.; Castro-Gama, M.; Van Der Zaag, P.; Mohamed, Y.A.; Corzo, G.; Uhlenbrook, S. Optimal Operation of the Eastern Nile System Using Genetic Algorithm, and Benefits Distribution of Water Resources Development. Water 2018, 10, 921. [Google Scholar] [CrossRef] [Green Version]
- Fazzini, M.; Bisci, C.; Billi, P. The Climate of Ethiopia. In Landscapes and Landforms of Ethiopia; Billi, P., Ed.; Springer: Dordrecht, Germany, 2015; pp. 65–87. [Google Scholar]
- Tesfaye, S.; Taye, G.; Birhane, E.; Van Der Zee, S.E. Observed and model simulated twenty-first century hydro-climatic change of Northern Ethiopia. J. Hydrol. Reg. Stud. 2019, 22, 100595. [Google Scholar] [CrossRef]
- Gebrehiwot, T.; Van Der Veen, A. Climate change vulnerability in Ethiopia: Disaggregation of Tigray Region. J. East. Afr. Stud. 2013, 7, 607–629. [Google Scholar] [CrossRef]
- Beck, H.; Zimmermann, N.E.; McVicar, T.R.; Vergopolan, N.; Berg, A.; Wood, E.F. Present and future Köppen-Geiger climate classification maps at 1-km resolution. Sci. Data 2018, 5, 180214. [Google Scholar] [CrossRef] [Green Version]
- National Meteorological Agency (NMA). Precipitation and Temperature Data (Humera and Tekeze Hydropower Stations), 2016; NMA: Addis Ababa, Ethiopia, 2016. [Google Scholar]
- Ethiopia Electric Power (EEP). Daily Lake Levels in the Tekeze Reservoir, 2008–2019; EEP: Addis Ababa, Ethiopia, 2019. [Google Scholar]
- Ethiopia Electric Power (EEP). Average Hourly Energy Production at the Tekeze Hydropower Station, 2018; EEP: Addis Ababa, Ethiopia, 2018. [Google Scholar]
- Ethiopia Electric Power (EEP). Average Daily Energy Production at the Tekeze Hydropower Station, 2010–2019; EEP: Addis Ababa, Ethiopia, 2019. [Google Scholar]
- Ethiopia Electric Power (EEP). Mid-Level Outlet Releases from the Tekeze Hydropower Station, 2018–2019; EEP: Addis Ababa, Ethiopia, 2019. [Google Scholar]
- Kohli, A.; Frenken, K. Evaporation from Artificial Lakes and Reservoirs; Food and Agriculture Organization: Rome, Italy, 2015. [Google Scholar]
- Asfaha, T.G.; Frankl, A.; Haile, M.; Zenebe, A.; Nyssen, J. Sediment flux dynamics as fingerprints of catchment rehabilitation: The case of western Rift Valley escarpment of northern Ethiopia. Geomorphology 2015, 250, 220–235. [Google Scholar] [CrossRef]
- Shaltout, K.H. Post-agricultural succession in the Nile Delta region. J. Arid. Environ. 1994, 28, 31–38. [Google Scholar] [CrossRef]
- Sher, A.; Wiegand, K.; Ward, D. Do Acacia and Tamarix trees compete for water in the Negev desert? J. Arid. Environ. 2010, 74, 338–343. [Google Scholar] [CrossRef]
- Birken, A.; Cooper, D.J. Processes of Tamarix Invasion and Floodplain Development along the Lower Green River, Utah. Ecol. Appl. 2006, 16, 1103–1120. [Google Scholar] [CrossRef]
- Allred, T.M.; Schmidt, J.C. Channel narrowing by vertical accretion along the Green River near Green River, Utah. Geol. Soc. Am. Bull. 1999, 111, 1757–1772. [Google Scholar] [CrossRef]
- Archfield, S.A.; Vogel, R.M. Map correlation method: Selection of a reference streamgage to estimate daily streamflow at ungaged catchments. Water Resour. Res. 2010, 46, 1–15. [Google Scholar] [CrossRef]
- Liu, B.M.; Collick, A.S.; Zeleke, G.; Adgo, E.; Easton, Z.M.; Steenhuis, T.S. Rainfall-discharge relationships for a monsoonal climate in the Ethiopian highlands. Hydrol. Process. 2008, 22, 1059–1067. [Google Scholar] [CrossRef]
- Ministry of Water, Irrigation and Electricity (MoWIE). Discharge data for the Embamadre Station, 1967–2015; MoWIE: Addis Ababa, Ethiopia, 2015. [Google Scholar]
- Zegeye, A.D.; Langendoen, E.J.; Tilahun, S.A.; Mekuria, W.; Poesen, J.; Steenhuis, T.S. Root reinforcement to soils provided by common Ethiopian highland plants for gully erosion control. Ecohydrol. 2018, 11, e1940. [Google Scholar] [CrossRef]
- Guan, Z.; Wang, X.; Bian, X.; Wang, L.; Jia, Z. Analysis of causes of outdoor insulators damages on HV and UHV transmission lines in China. In Proceedings of the 2014 IEEE Electrical Insulation Conference (EIC), Philadelphia, PA, USA, 8–11 June 2014; pp. 227–230. [Google Scholar]
- Sridharan, V.; Broad, O.; Shivakumar, A.; Howells, M.; Boehlert, B.; Groves, D.G.; Rogner, H.-H.; Taliotis, C.; Neumann, J.E.; Strzepek, K.M.; et al. Resilience of the Eastern African electricity sector to climate driven changes in hydropower generation. Nat. Commun. 2019, 10, 302. [Google Scholar] [CrossRef] [Green Version]
- Kahsay, K.D.; Pingale, S.; Hatiye, S.D. Impact of climate change on groundwater recharge and base flow in the sub-catchment of Tekeze basin, Ethiopia. Groundw. Sustain. Dev. 2018, 6, 121–133. [Google Scholar] [CrossRef]
- Abera, F.F.; Asfaw, D.H.; Engida, A.N.; Melesse, A.M. Optimal Operation of Hydropower Reservoirs under Climate Change: The Case of Tekeze Reservoir, Eastern Nile. Water 2018, 10, 273. [Google Scholar] [CrossRef] [Green Version]
- Cole, M.A.; Elliott, R.J.; Strobl, E. Climate Change, Hydro-Dependency, and the African Dam Boom. World Dev. 2014, 60, 84–98. [Google Scholar] [CrossRef]
- Alexander, S.; Wu, S.; Block, P. Model Selection Based on Sectoral Application Scale for Increased Value of Hydroclimate-Prediction Information. J. Water Resour. Plan. Manag. 2019, 145, 04019006. [Google Scholar] [CrossRef]
- Alexander, S.; Yang, G.; Addisu, G.; Block, P. Forecast-informed reservoir operations to guide hydropower and agriculture allocations in the Blue Nile basin, Ethiopia. Int. J. Water Resour. Dev. 2020. [Google Scholar] [CrossRef]
- Koppa, A.; Gebremichael, M.; Zambon, R.C.; Yeh, W.W.-G.; Hopson, T.M. Seasonal Hydropower Planning for Data-Scarce Regions Using Multimodel Ensemble Forecasts, Remote Sensing Data, and Stochastic Programming. Water Resour. Res. 2019, 55, 8583–8607. [Google Scholar] [CrossRef]
- Demissie, A.A.; Solomon, A. Power system sensitivity to extreme hydrological conditions as studied using an integrated reservoir and power system dispatch model, the case of Ethiopia. Appl. Energy 2016, 182, 442–463. [Google Scholar] [CrossRef]
- Basheer, M.; Sulieman, R.; Ribbe, L. Exploring management approaches for water and energy in the data-scarce Tekeze-Atbara Basin under hydrologic uncertainty. Int. J. Water Resour. Dev. 2019, 1–26. [Google Scholar] [CrossRef]
- Petts, G.E.; Gurnell, A.M. Dams and geomorphology: Research progress and future directions. Geomorphol 2005, 71, 27–47. [Google Scholar] [CrossRef]
- Michálková, M.; Piégay, H.; Kondolf, G.; Greco, S. Lateral erosion of the Sacramento River, California (1942–1999), and responses of channel and floodplain lake to human influences. Earth Surf. Process. Landforms 2011, 36, 257–272. [Google Scholar] [CrossRef]
- Casado, A.; Peiry, J.-L.; Campo, A.M. Geomorphic and vegetation changes in a meandering dryland river regulated by a large dam, Sauce Grande River, Argentina. Geomorphol 2016, 268, 21–34. [Google Scholar] [CrossRef] [Green Version]
- Brotherson, J.D.; Field, D. Tamarix: Impacts of a successful weed. Rangel. Arch. 1987, 9, 110–112. [Google Scholar]
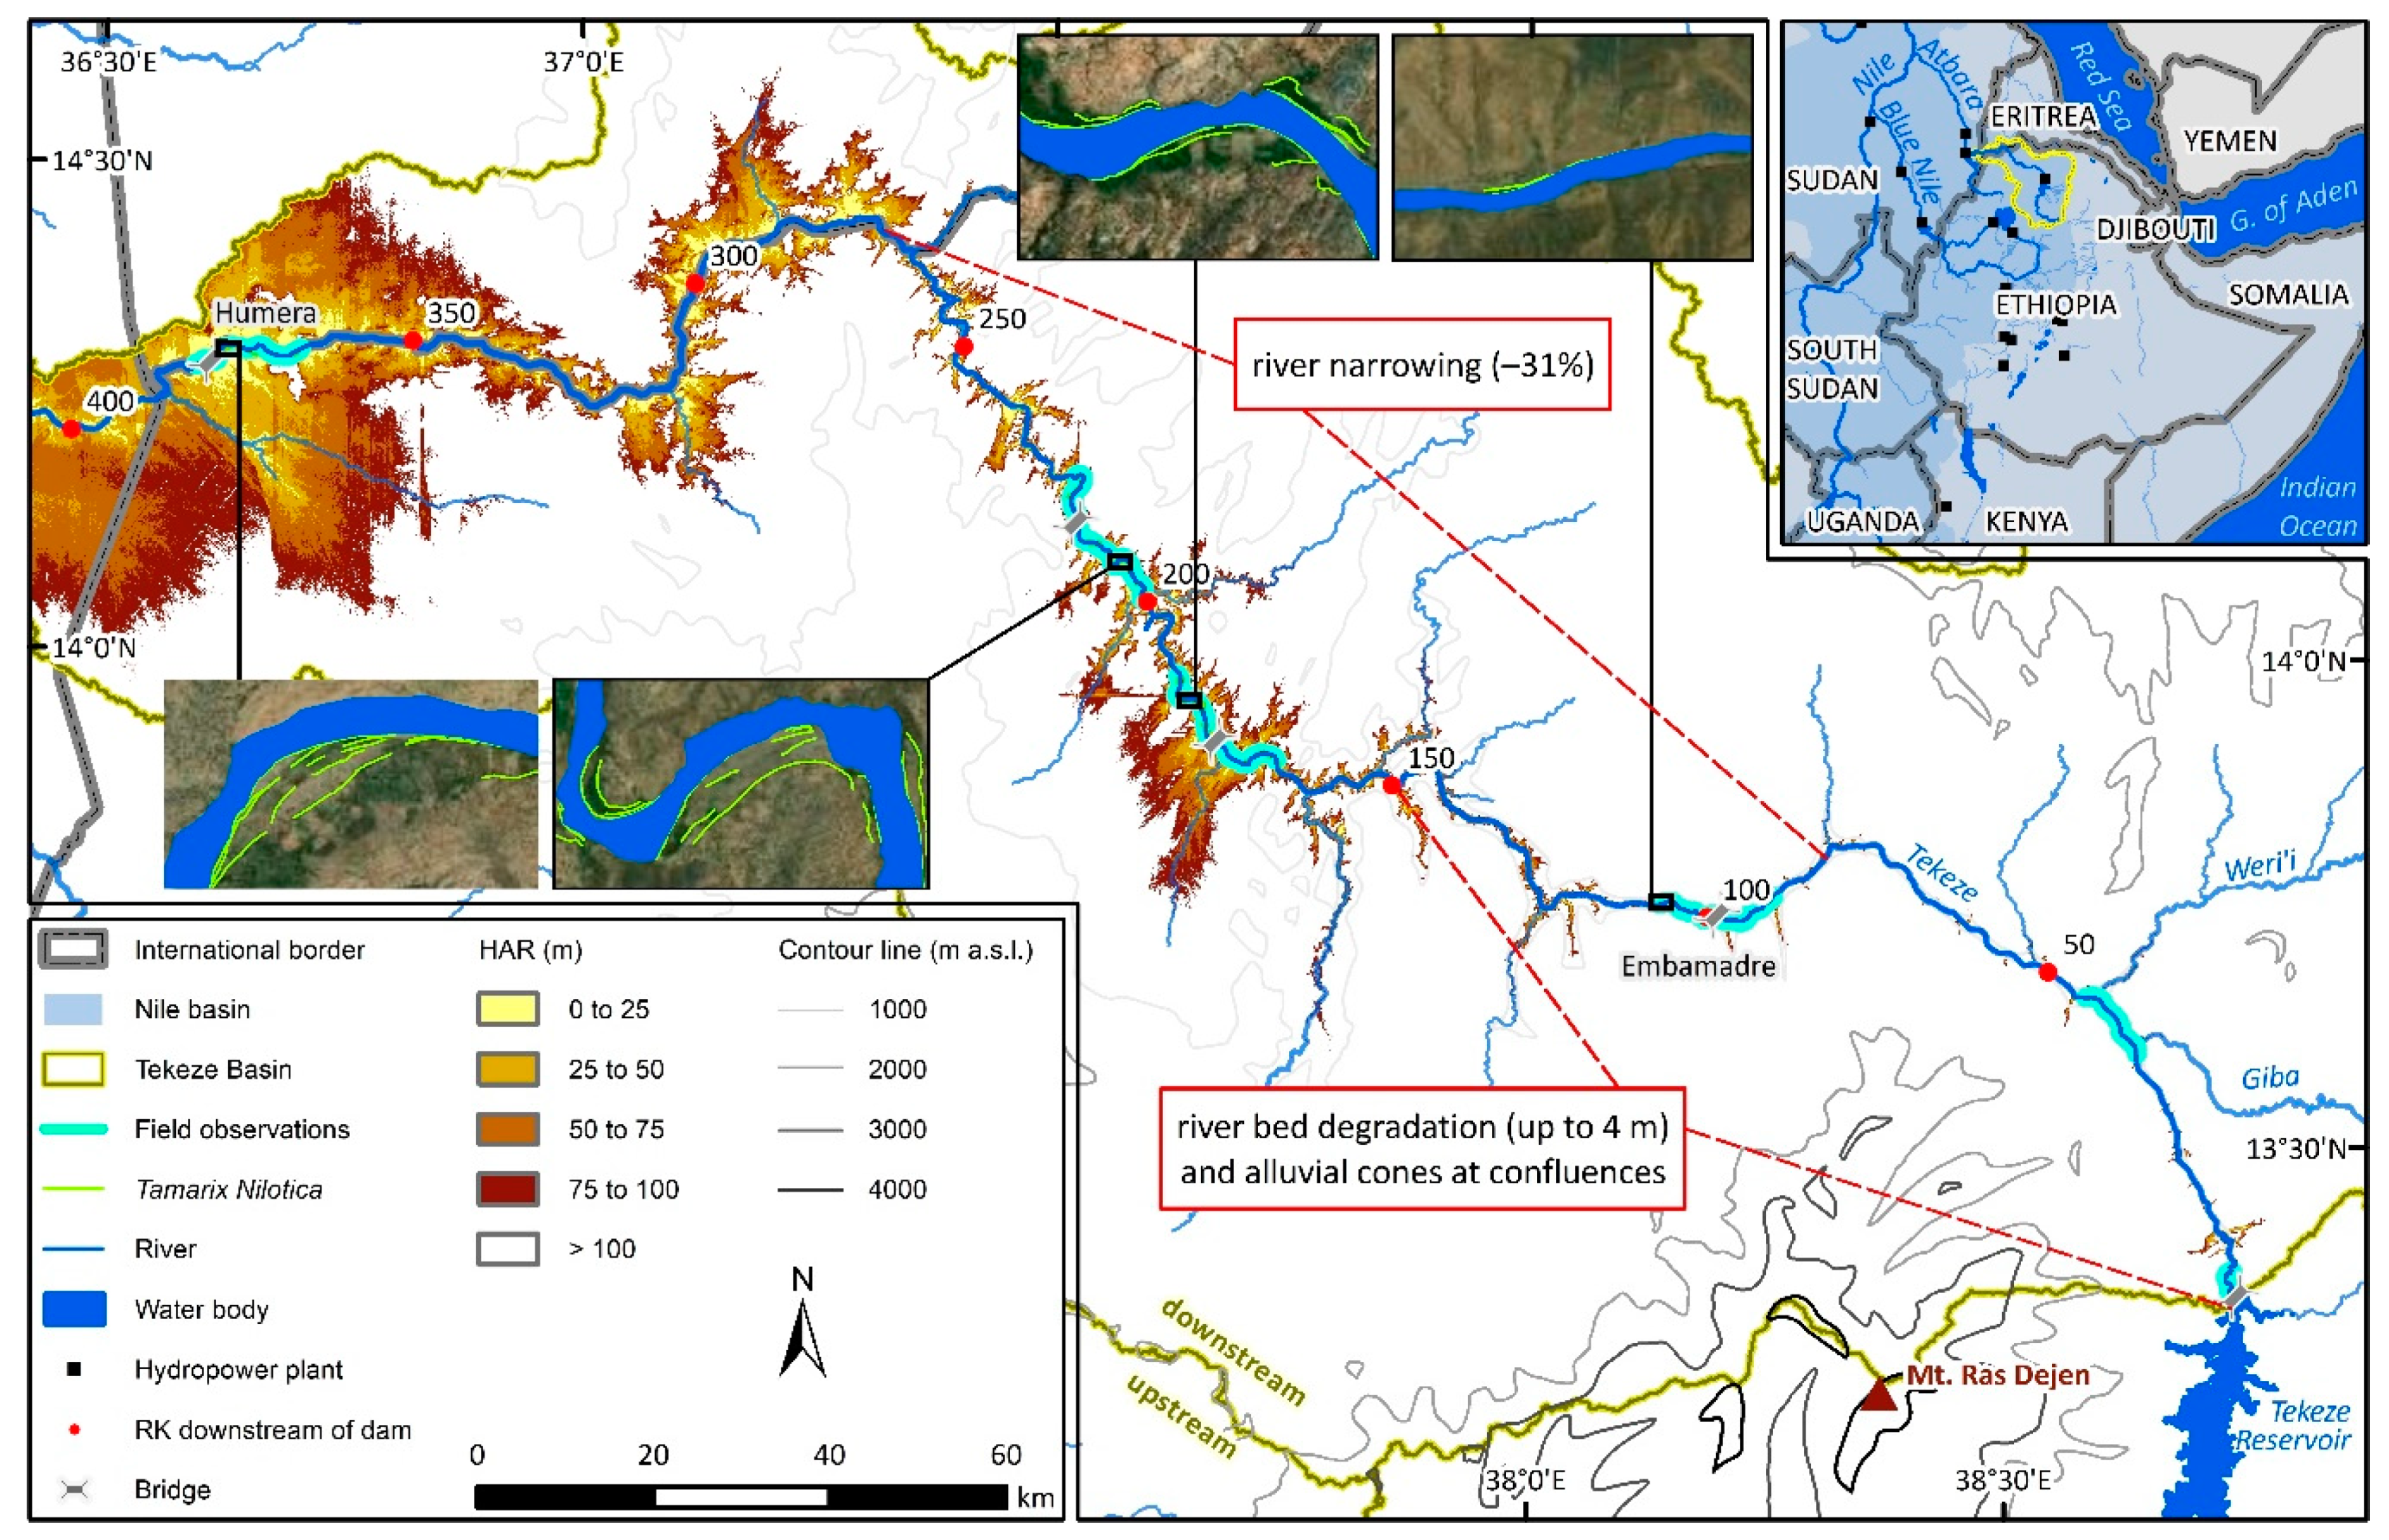
Figure 1.
Location of the study area and representation of some of the main results (with RK = River Kilometer, HAR = Height Above the River within the Tekeze Basin and m ASL = meter above sea level).
Figure 1.
Location of the study area and representation of some of the main results (with RK = River Kilometer, HAR = Height Above the River within the Tekeze Basin and m ASL = meter above sea level).

Figure 2.
Evolution of the Tekeze Reservoir water levels from July 2008 and daily energy production from July 2010 to November 2019 (for this research, no energy production data are available before July 2010; Data source: [37,39]).

Figure 3.
Hydrologic changes of the Tekeze River near the dam site: flow duration curves for average daily discharges (a), average pre-dam and post-dam monthly discharges (b) and daily post-dam variability in discharges for hydrologic year 2018, expressed as the observed maximum jump (Qmax–Qmin) and standard deviation in hourly discharges within a one day-timeframe (c) (Data sources: [38,39,49]).

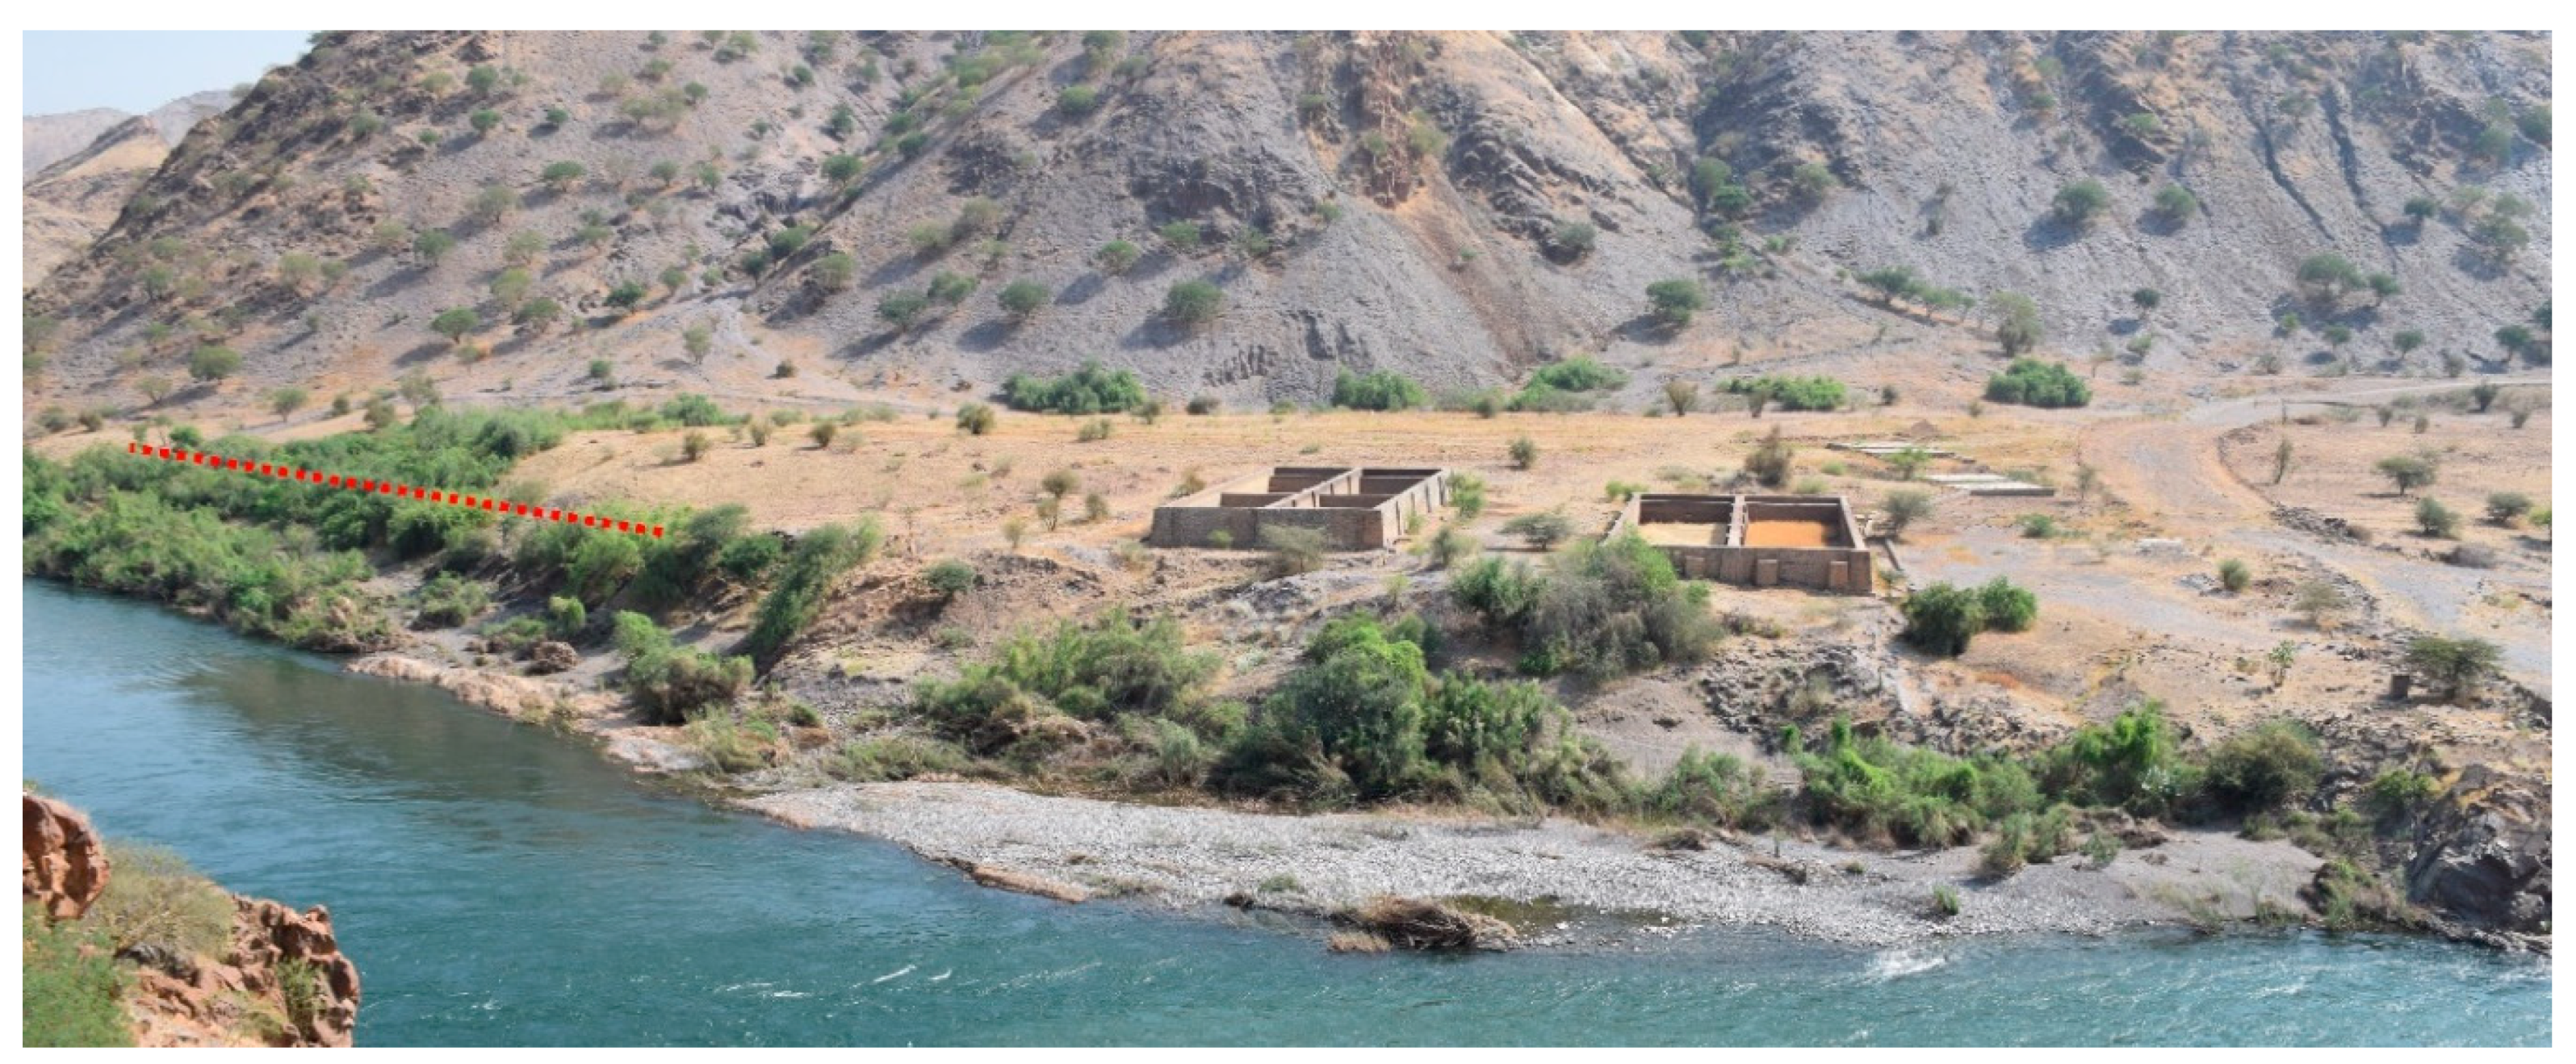
Figure 4.
The Tekeze River has incised at least 4 m. Evidence for this was provided by a river terrace (dotted red line) and deep lateral gullies that were dated “pre-dam” and “post-dam” respectively by local inhabitants during field interviews (Photo: 15 October 2018).
Figure 4.
The Tekeze River has incised at least 4 m. Evidence for this was provided by a river terrace (dotted red line) and deep lateral gullies that were dated “pre-dam” and “post-dam” respectively by local inhabitants during field interviews (Photo: 15 October 2018).

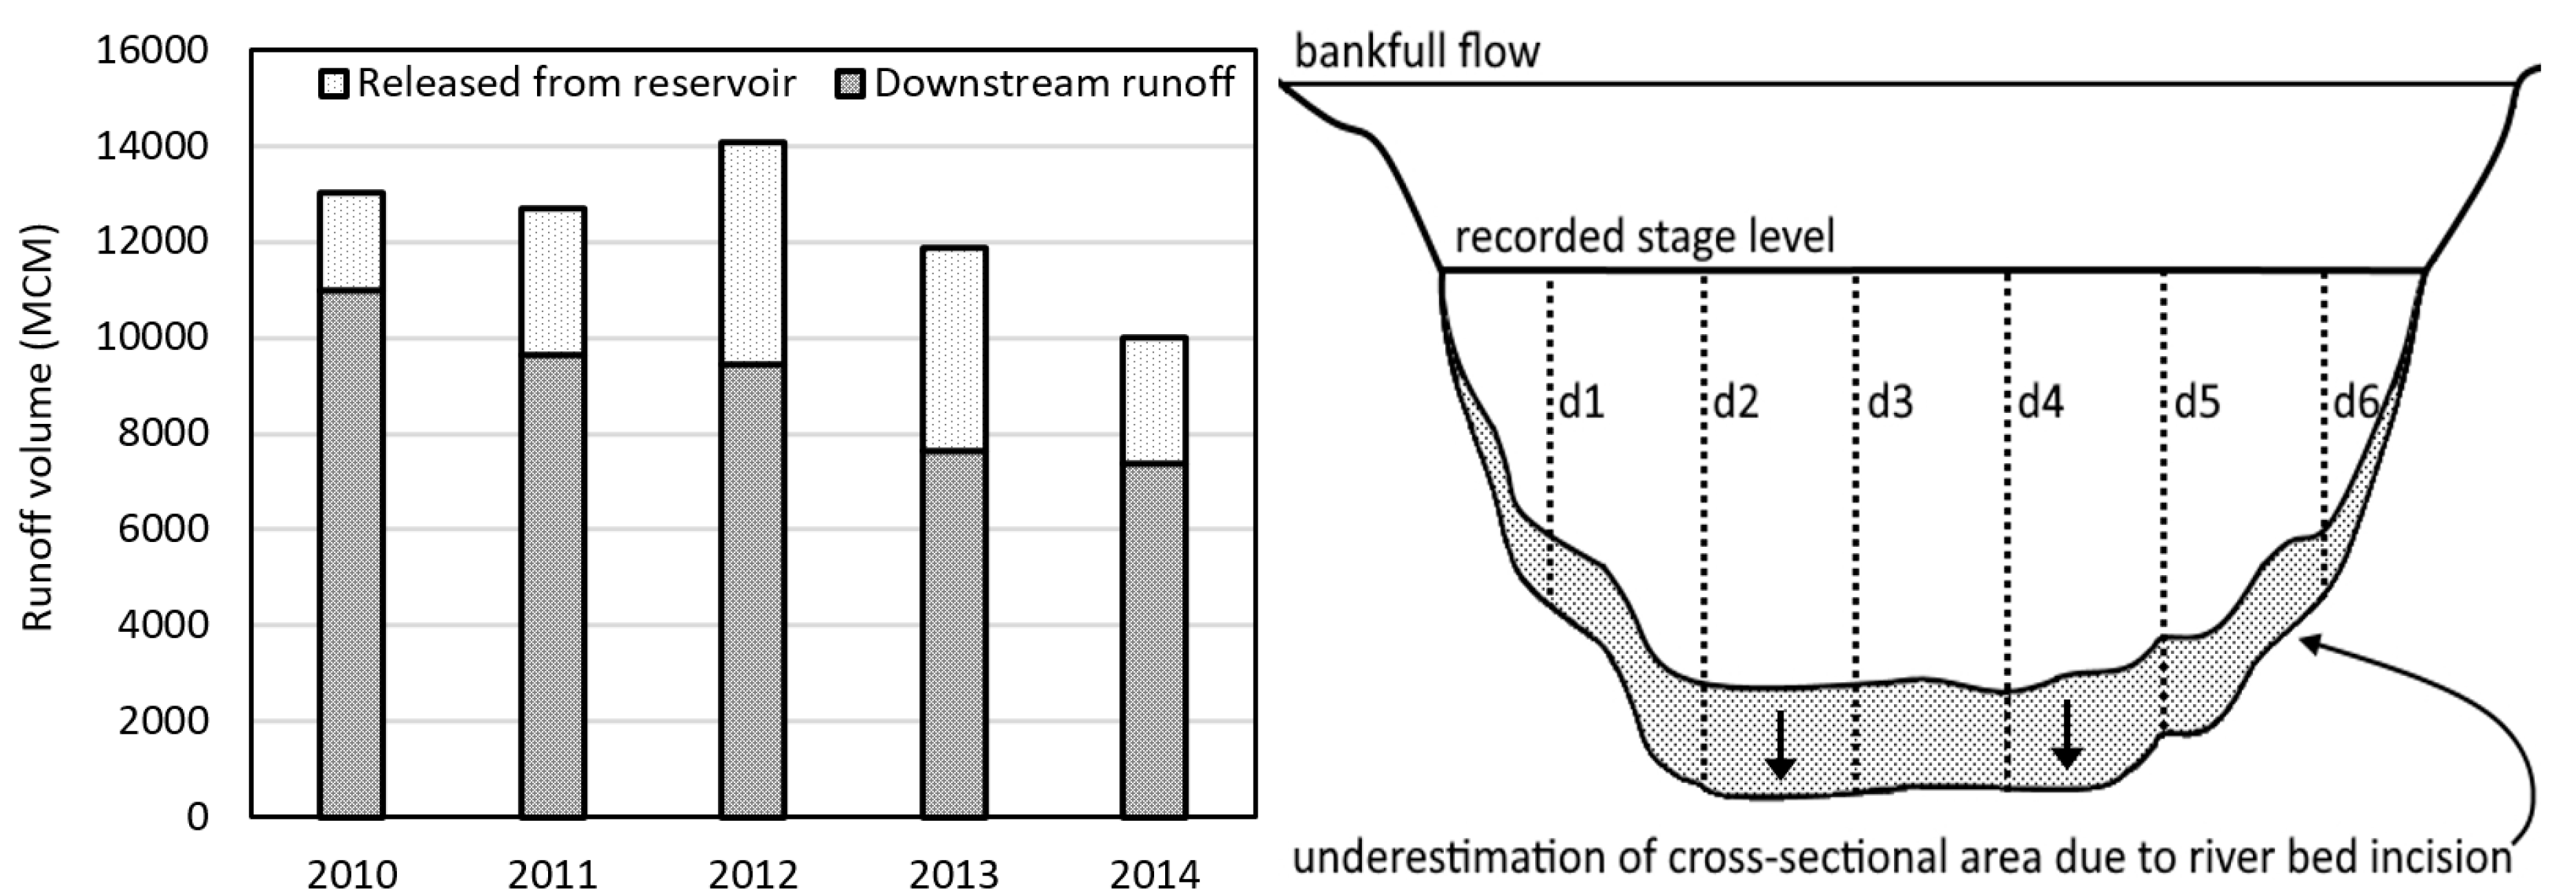
Figure 5.
The decreasing trend in observed runoff volume at the Embamadre station (RK100) (left) potentially indicates an underestimated cross-sectional area caused by dam-induced river bed degradation, as the stage–discharge curve has not been updated after dam implementation (right) (Data source: [39,49], own conceptual diagram).

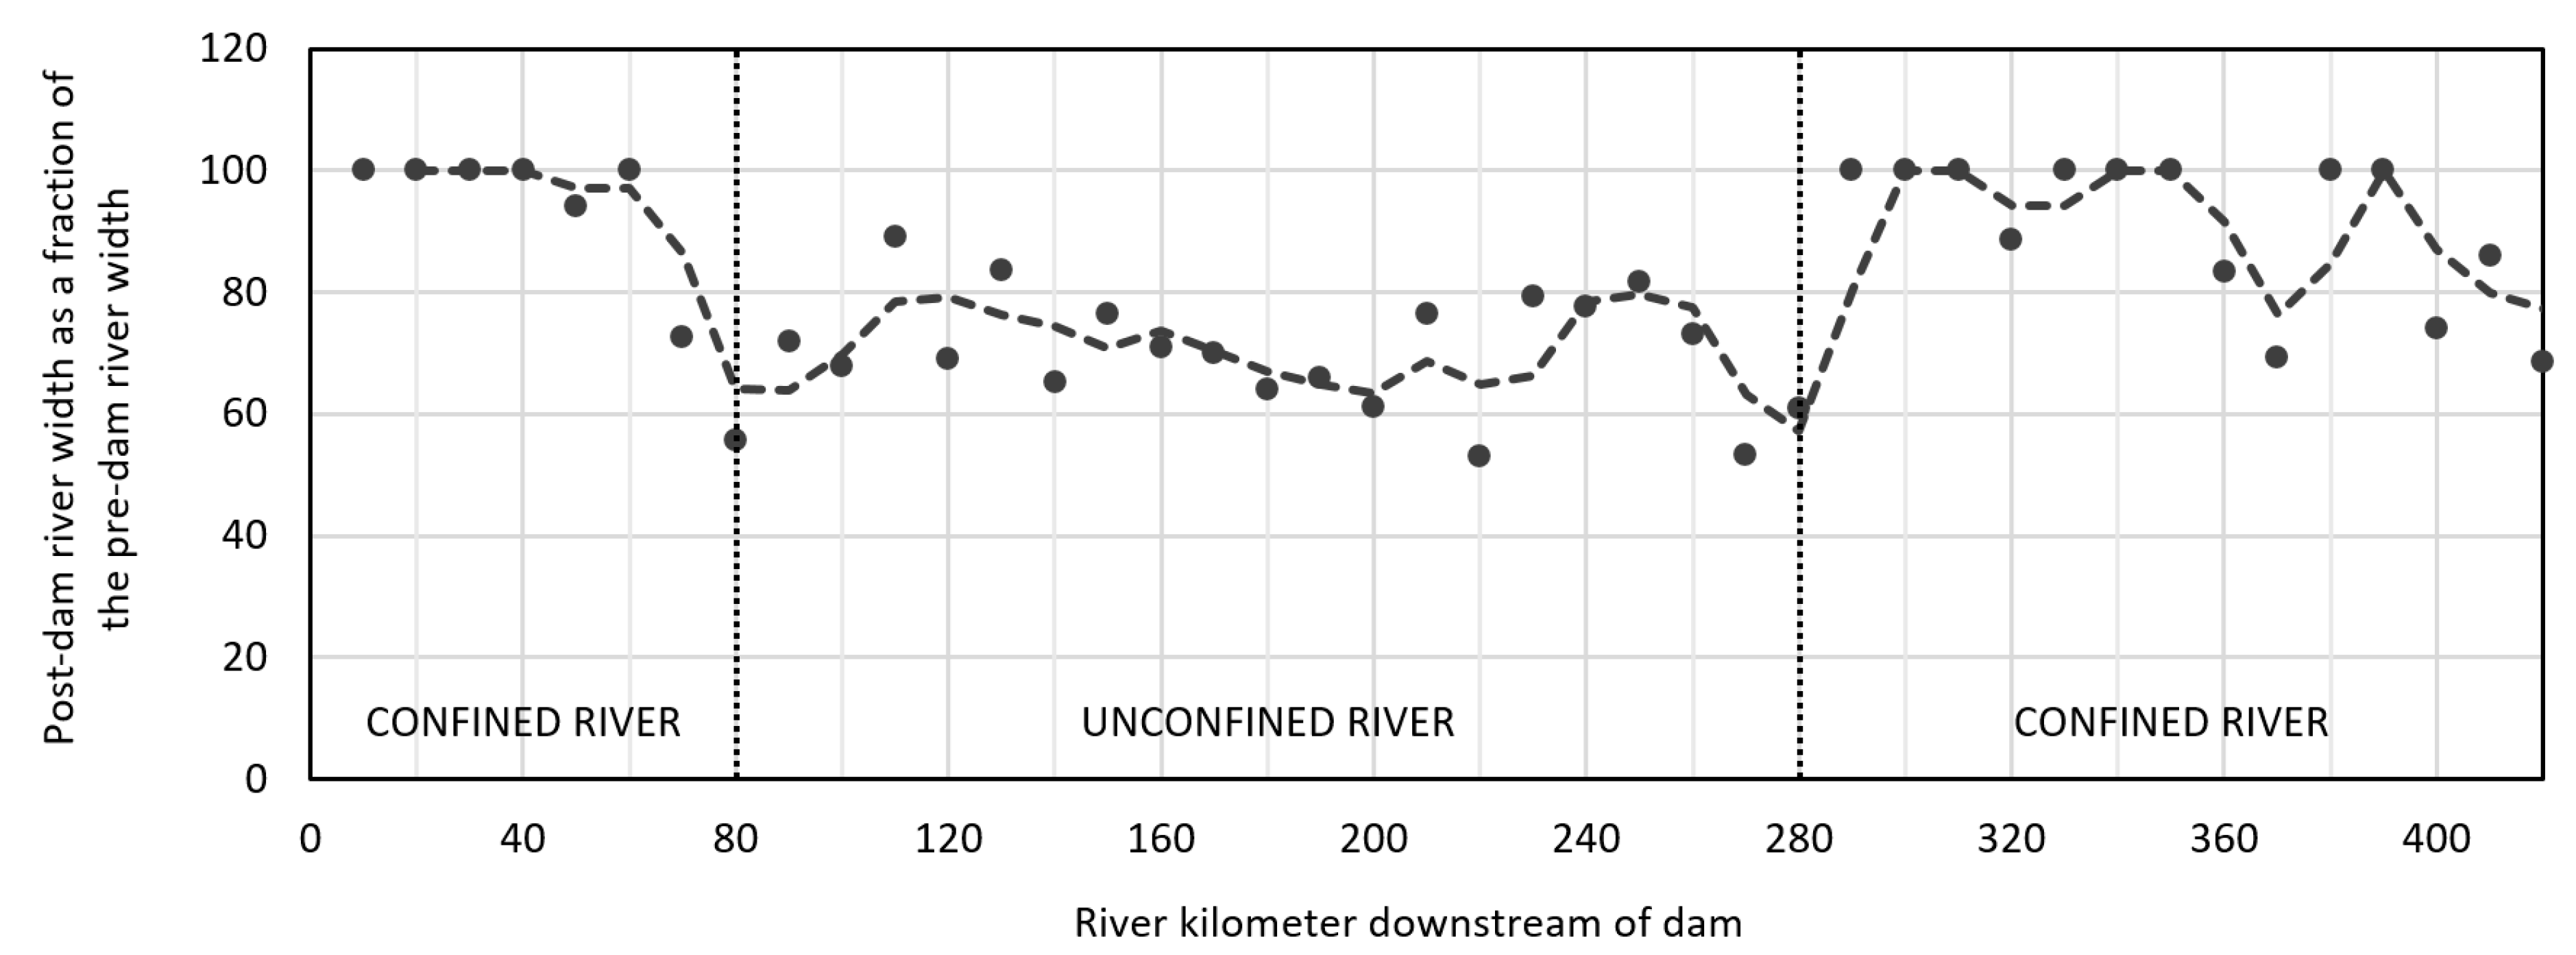
Figure 6.
Post-dam river narrowing along the Tekeze River: −7% in the confined areas versus −31% in the unconfined areas (dashed line = 20 km-moving average).
Figure 6.
Post-dam river narrowing along the Tekeze River: −7% in the confined areas versus −31% in the unconfined areas (dashed line = 20 km-moving average).

Figure 7.
Five generations of Tamarix nilotica can be observed at RK208, indicated by the dotted red lines. Root crowns of the tamarisk trees and bushes typically follow the (maximum) flooded perimeter, which clearly has displaced towards the river after the Tekeze Dam became operational (Photo: 30 January 2017).

Figure 8.
Downstream view on the 188 m high Tekeze arch dam with its four mid-level outlets and transmission lines crossing the narrow gorge (Photo: 15 October 2018).
Figure 8.
Downstream view on the 188 m high Tekeze arch dam with its four mid-level outlets and transmission lines crossing the narrow gorge (Photo: 15 October 2018).

Figure 9.
Yearly reservoir volume inflow and outflow, with corresponding net volume change from July 2009 to November 2019 (Data sources: [37,39,40]).

Figure 10.
Evolution of the reservoir water levels and daily volume changes for hydrologic year 2018 (Data sources: [37,39,40]).

Figure 11.
The emergency release from 25 August to 16 September, 2018 induced several hydrogeomorphic changes downstream of the dam: erosion of a 5.4 ha point bar (a,b), erosion of the years old alluvial cone of the Weri’i River entering from the right (c,d) and thick sandy depositions further downstream (e,f).

Figure 12.
Examples of large alluvial cones that were (partially) eroded during the 2018 emergency release, after they had been gradually expanding for several years. Although discharges vary slightly on the photos, it does not impact the observed results: (a) 85 m3 s−1 vs. (b) 127 m3 s−1 and (c) 29 m3 s−1 vs. (d) 126 m3 s−1 (Data source: [39], Google Earth).

Figure 13.
Evolution in the normalized area of alluvial cones—calculated as a fraction of the maximum extent of the alluvial cone—up to RK150. A total of 41 alluvial cones were mapped at different time steps according to the (non-continuous) availability of high-resolution satellite images in Google Earth (no data were available for hydrologic years 2011, 2016 and 2017). The number of studied alluvial cones is indicated for each time step.

Figure 14.
Correlation between annual reservoir inflow and annual energy production.

© 2020 by the authors. Licensee MDPI, Basel, Switzerland. This article is an open access article distributed under the terms and conditions of the Creative Commons Attribution (CC BY) license (http://creativecommons.org/licenses/by/4.0/).
Share and Cite
MDPI and ACS Style
Annys, S.; Ghebreyohannes, T.; Nyssen, J. Impact of Hydropower Dam Operation and Management on Downstream Hydrogeomorphology in Semi-Arid Environments (Tekeze, Northern Ethiopia). Water 2020, 12, 2237. https://doi.org/10.3390/w12082237
AMA Style
Annys S, Ghebreyohannes T, Nyssen J. Impact of Hydropower Dam Operation and Management on Downstream Hydrogeomorphology in Semi-Arid Environments (Tekeze, Northern Ethiopia). Water. 2020; 12(8):2237. https://doi.org/10.3390/w12082237
Chicago/Turabian StyleAnnys, Sofie, Tesfaalem Ghebreyohannes, and Jan Nyssen. 2020. "Impact of Hydropower Dam Operation and Management on Downstream Hydrogeomorphology in Semi-Arid Environments (Tekeze, Northern Ethiopia)" Water 12, no. 8: 2237. https://doi.org/10.3390/w12082237
Note that from the first issue of 2016, this journal uses article numbers instead of page numbers. See further details here.