Minimal Building Flood Fragility and Loss Function Portfolio for Resilience Analysis at the Community Level


Department of Civil and Environmental Engineering, Colorado State University, Fort Collins, CO 80523-1372, USA
*
Author to whom correspondence should be addressed.
Water 2020, 12(8), 2277; https://doi.org/10.3390/w12082277
Submission received: 27 June 2020
/
Revised: 1 August 2020
/
Accepted: 8 August 2020
/
Published: 13 August 2020
(This article belongs to the Section Hydrology)
Abstract
:Current flood vulnerability analyses rely on deterministic methods (e.g., stage–damage functions) to quantify resulting damage and losses to the built environment. While such approaches have been used extensively by communities, they do not enable the propagation of uncertainty into a risk- or resilience-informed decision process. In this paper, a method that allows the development of building fragility and building loss functions is articulated and applied to develop an archetype portfolio that can be used to model buildings in a typical community. The typical single-variable flood vulnerability function, normally based on flood depth, is extended to a multi-variate flood vulnerability function, which is a function of both flood depth and flood duration, thereby creating fragility surfaces. The portfolio presented herein consists of 15 building archetypes that can serve to populate a community-level model to predict damage and resulting functionality from a scenario flood event. The prediction of damage and functionality of buildings within a community is the first step in developing risk-informed mitigation decisions to improve community resilience.
1. Introduction
Flood hazards are being exacerbated by climate change, making flood risk quantification and adaptive mitigation to flood risk increasingly challenging. As a result, flood risk research has received significant interest over the past decade with the goal of providing frameworks, approaches, and methods that model flood risk at the community-level [1,2,3,4,5,6,7]. Flood risk consists of three main components, namely the hazard, exposure, and vulnerability. Each one of these components was described in detail in a recently published review article by Nofal and van de Lindt [8]. The focus herein is on the flood vulnerability of the building stock and the development of fragilities for use in modeling flood damage prediction at the community-level. Current flood-induced damage prediction for buildings typically relies on empirical [9,10,11,12,13,14,15,16,17] and synthetic stage–damage functions [18,19,20,21,22]. For example, the HAZards US (HAZUS) flood model, which is a leading flood risk analysis platform, uses deterministic stage–damage functions with a suite of 33 building archetypes to characterize community flood vulnerability [23]. Conversely, the HAZUS hurricane and earthquake models use fragility functions to describe building vulnerability [24,25]. While stage–damage functions provide a good approach for understanding the immediate damage-related impacts of a flood, they do not provide adequate information for the propagation of uncertainty [26,27,28], making risk-informed decisions [29,30], and other types of analyses [31].
In general, flood-related literature is well developed by hydrologists where the focus has been placed on propagating uncertainties in the hazard component of the flood risk analysis process [32,33,34,35,36]. Propagating uncertainties in the flood exposure and vulnerability components have been slowed due to a lack of data (and particularly statistical distributions) for the flood resistance characteristics of buildings. Risk-informed decisions require uncertainty propagation across the whole risk model (hazard, exposure, and vulnerability) to define the safety margins for buildings [37] and characterize the community functionality based on these margins [38]. Over the last decade, fragility analysis methods have proven to be a reliable vulnerability analysis approach [39,40,41,42,43,44] and a useful tool to drive resilience-based decisions at the community-level [45,46]. Flood risk analysis would benefit from a parallel shift toward resilience-based decision-making with the application of fragility functions at the community level.
A review of the multiple flood hazard characteristics and their impacts on the built environment including flood depth, flood velocity, and flood duration was conducted by Nofal and van de Lindt [8] and Soetanto and Proverbs [47]. Flood depth, flood velocity, and flood duration are considered the most important flood hazard characteristics causing the majority of buildings’ structural and content damage [48,49]. Although flood depth is considered the main damaging flood hazard characteristic that has been widely used to assess flood damage in the literature [12,17,50,51,52,53], the inclusion of other flood damaging characteristics would increase the accuracy of the flood damage model [54]. Flood damage from coastal flooding resulting from hurricanes and tsunamis has been extensively investigated in the literature in terms of developing fragility functions to model the impact of flood depth and flood velocity on buildings’ structural systems [43,55,56,57,58,59,60,61]. However, fragility functions for flood damage induced by fluvial and pluvial flooding are scarce and there are no flood fragility portfolios that can be used to represent a community-level building stock. Fluvial and pluvial floodings are usually static floodings with very low velocity (except for steep channels, flash floods, dam/levee breaches where flood velocity should be considered) and their main damaging characteristics are flood depth and flood duration (which will be the focus of this paper), such as shallow flooding, which has been defined by the Federal Emergency Management Agency (FEMA) in their guidance for flood risk analysis and mapping [62] and other rainfall and riverine flooding in flat terrains. Therefore, most of the building damage occurs to the interior contents and non-structural components with less damage to the structural system. Recently, there were some attempts to develop numerical flood fragilities for specific building classes including masonry buildings [63], and wood frame buildings [64] along with other empirical flood fragilities based on collected field data from [65,66]. Additionally, some researchers tried to enhance the current stage–damage functions [31,67] and propagate uncertainties in both the empirical [68] and synthetic stage–damage functions [19]. However, those probabilistic methods were not general enough to develop a portfolio of flood fragility functions that could be used at the community-level. Additionally, the compound impact of flood depth and flood duration has not been well addressed in the literature.
Therefore, in this paper, a probabilistic method that uses component-based fragilities is articulated and then used to develop single-variable and multi-variate flood fragilities and loss functions for a number of archetypes aimed at creating a proposed minimal building archetype portfolio for application at the community-level. Buildings within a community are classified based on their occupancy and other characteristics for a suite of 15 archetypes. At this stage in the evolution of community modeling using fragilities, this suite is believed to be a minimum number that could be used to represent a typical small- or mid-size community with adequate representation of buildings in order to provide information for making risk-informed decisions. Flood fragility and loss curves (2D) and surfaces (3D) for each building archetype were developed with uncertainty propagation at the building component-level during assembly of the whole-building fragility curves and surfaces. The fragility and loss functions developed and presented herein can help quantify the impact of flood mitigation measures, policy decisions, and building design decisions at a community scale.
2. Methodology
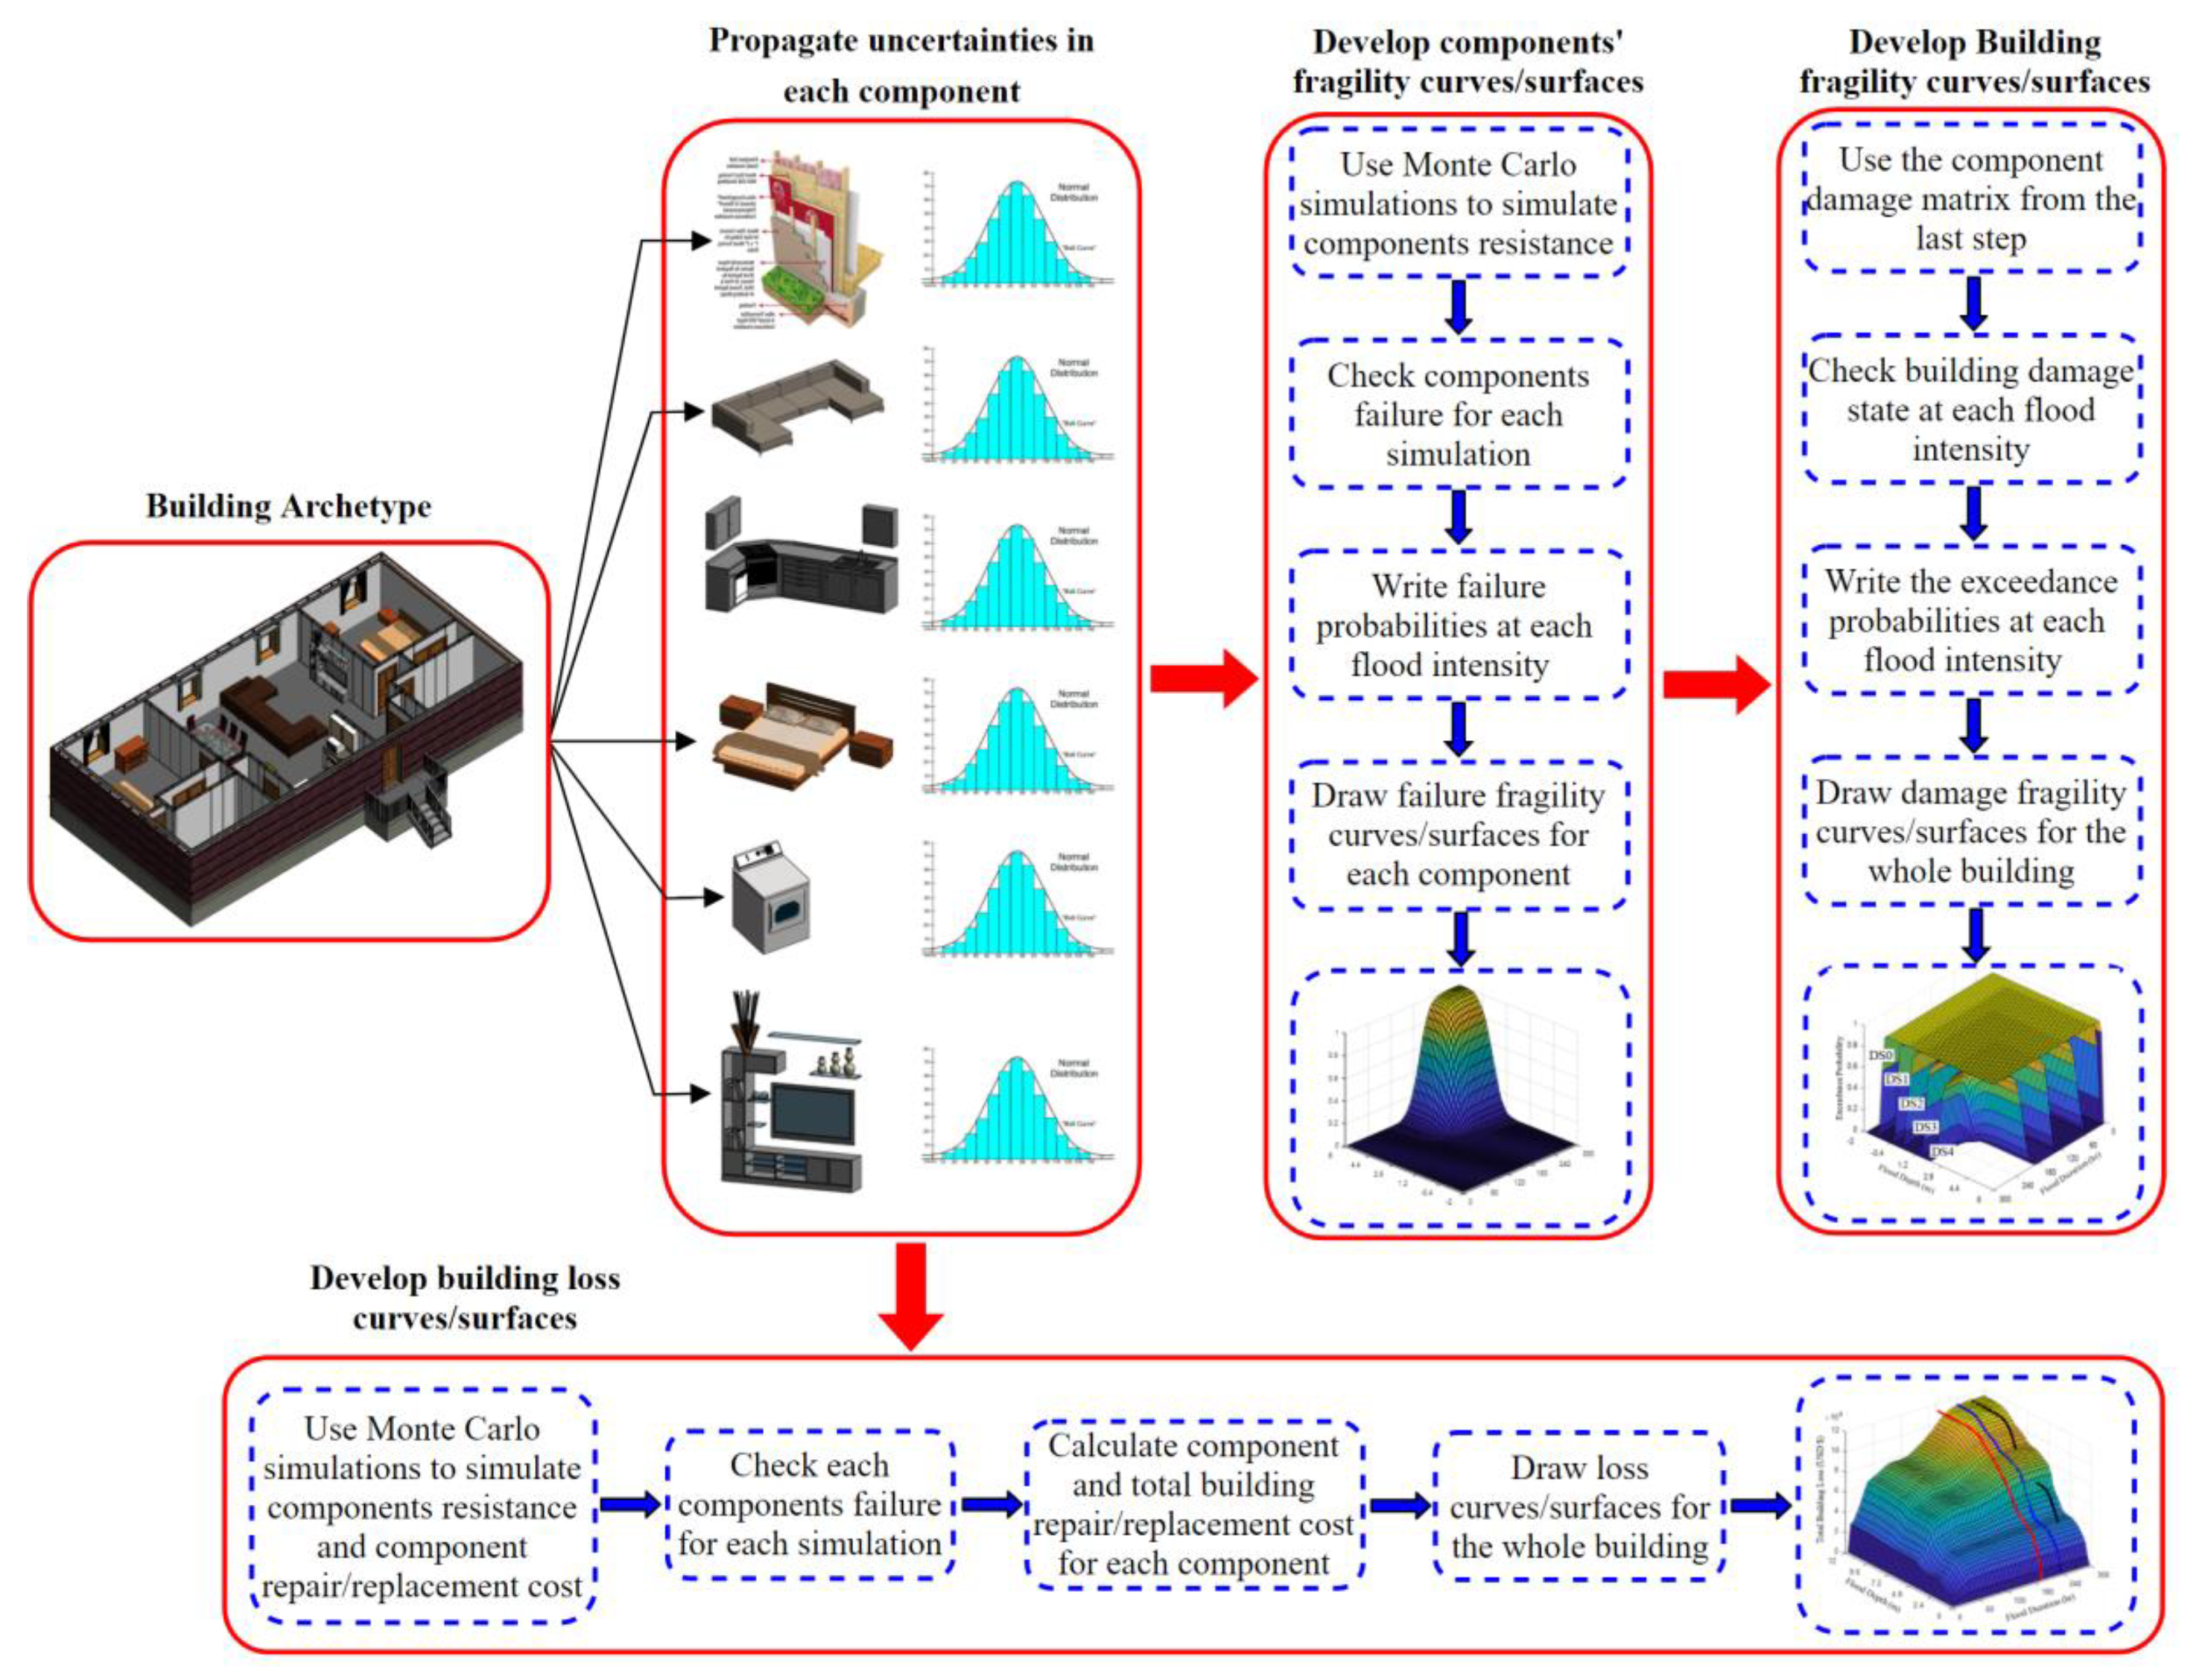
Buildings within typical communities were divided into archetypes that are characterized such that they can represent the building stock within a community when an analyst considers flood. The archetypes are not a perfect match to individual structures but provide a balance between being representative of the building, workload to assign them across a community, and accuracy needed in the analysis results. A component-based numerical fragility and loss approach is articulated and then applied to propagate uncertainties in the resistance of each component to flood depth and flood duration for each archetype. This method uses a single-variable (based on only flood depth) and multi-variate (based on both flood depth and duration) approach to characterize flood damage to buildings. The method herein divides buildings into damageable components (e.g., carpet, drywall, cabinets) and then assembles the resistance statistics of each component, including uncertainties, to obtain the whole-building fragility. This uncertainty propagation from the statistics of each component is accomplished through a series of Monte Carlo simulations (MSC) at each hazard intensity. The analysis is essentially completed using two steps. In the first step, only flood depth is considered as the sole hazard intensity parameter throughout the analysis process. In the second step, flood duration is added as a second hazard intensity parameter to model the combined effect of flood depth and duration. Figure 1 presents a schematic showing the major analyses used in this study to develop building fragility curves/surfaces based on all the damageable components within a building including the propagation of their uncertainty. A detailed description of the whole methodology and its application on a one-story residential building (archetype F1) can be found herein [69].
2.1. Components’ Fragility and Loss Analysis
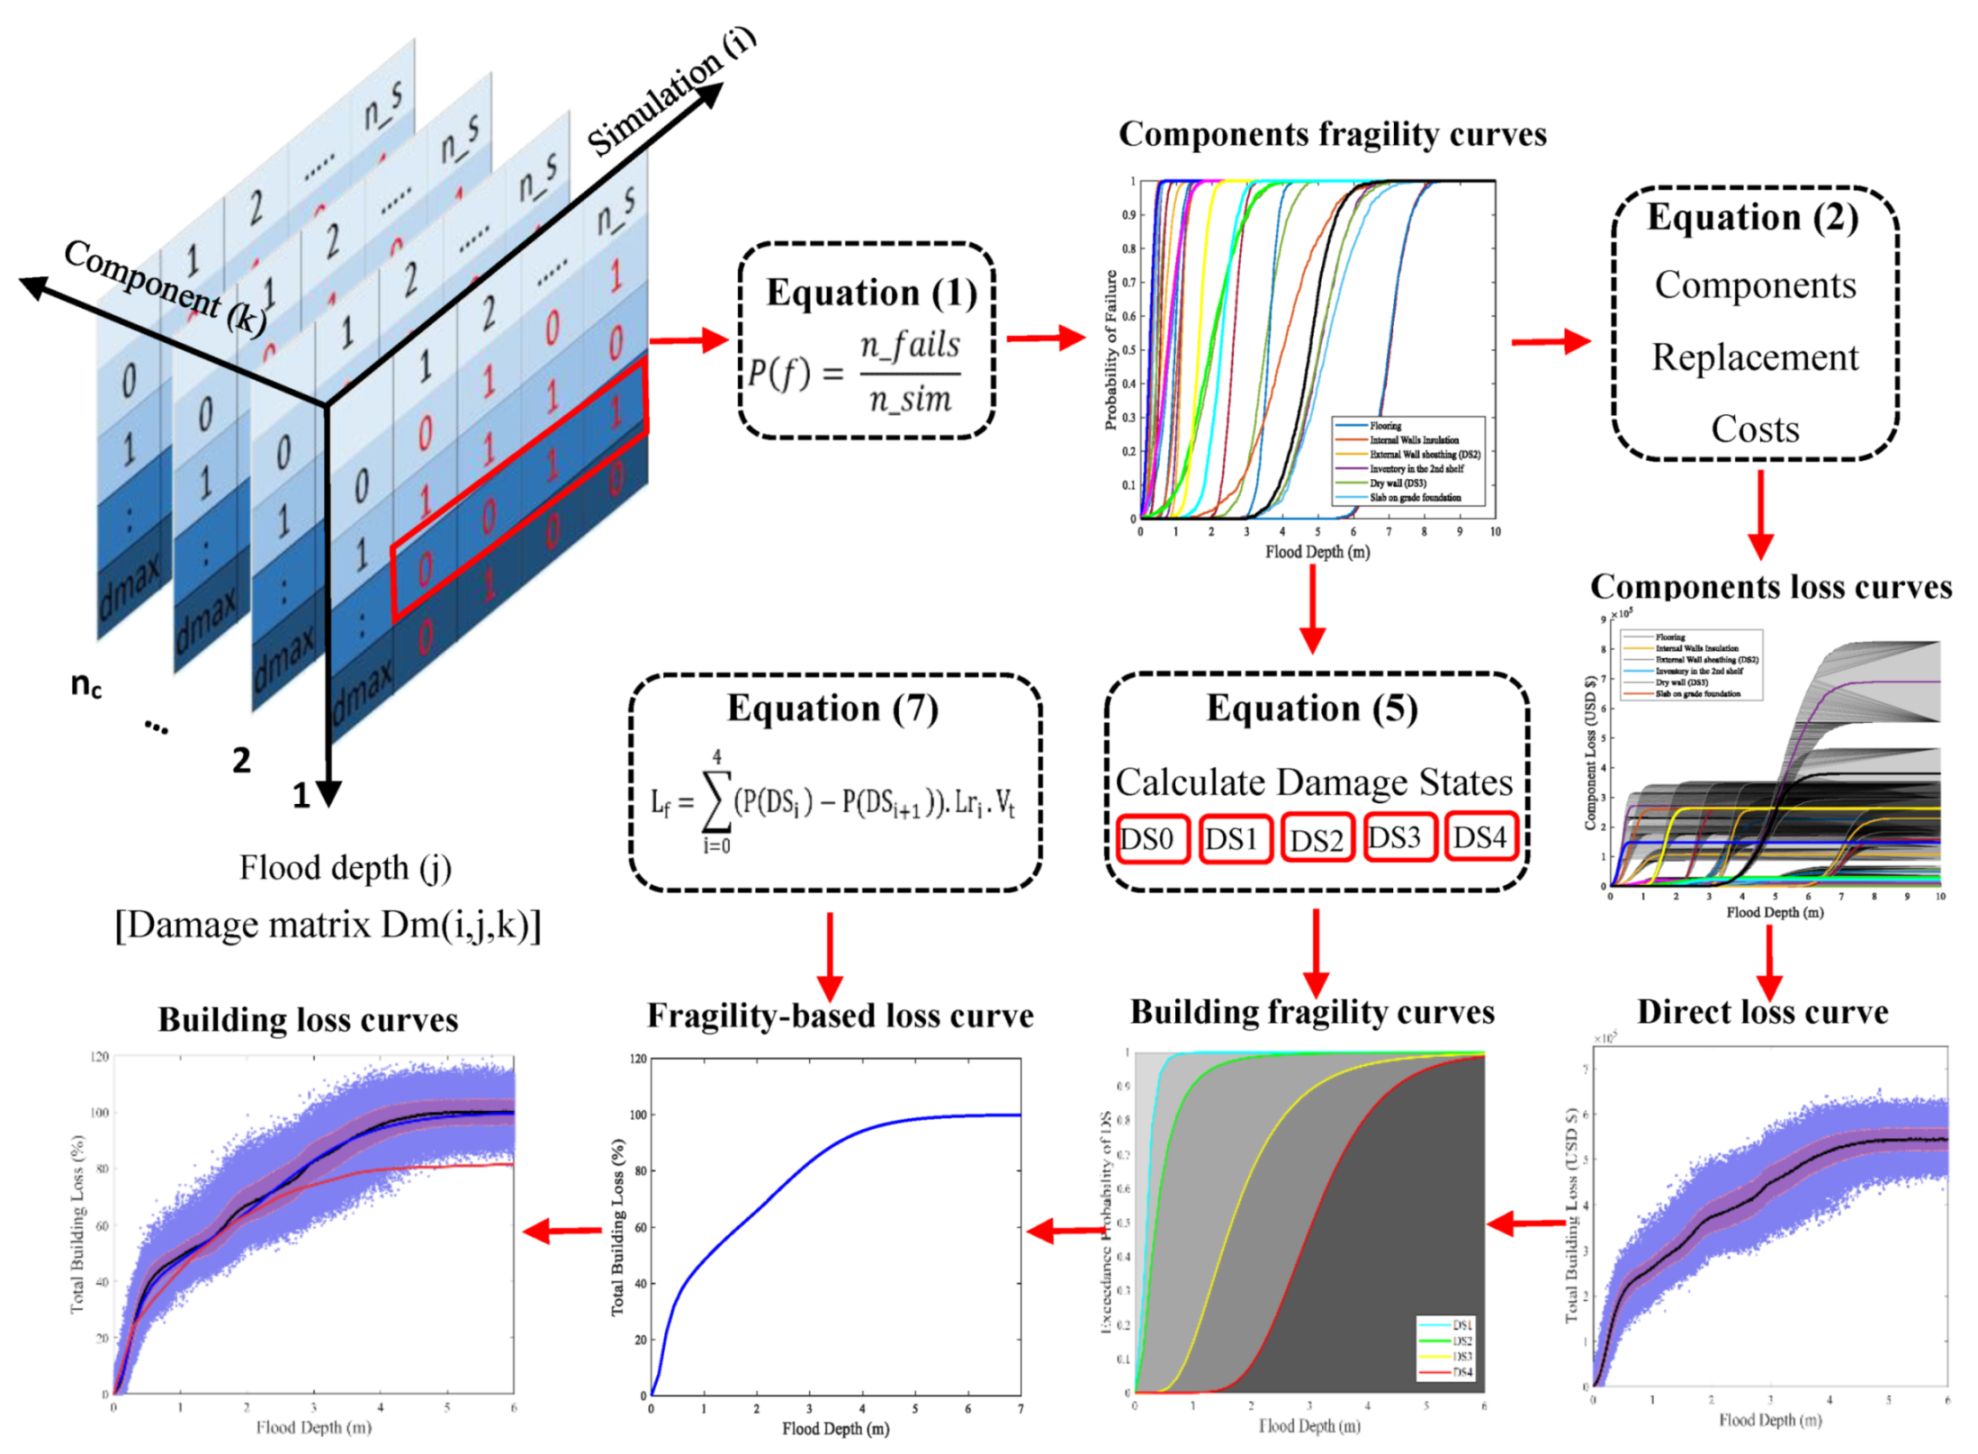
The approach developed in this study to predict the failure probability is similar to performance-based earthquake engineering for buildings. Each building archetype was divided into a set of components. For each component, the upper and lower bounds for the flood depth and flood duration that result in damage were used to develop 1000 normally distributed random samples for each component in between these bounds. Some of the components’ upper and lower bounds for the damaging flood depth and flood duration were collected from the literature [64] and some of them were collected from online sources and others were assumed using the best engineering judgment. This is consistent with the approach described in Nofal and van de Lindt [69]. Monte Carlo simulation (MCS) was used to account for the failure probability for each component at each intensity measure (flood depth and flood duration) using Equation (1) by dividing the number of failed simulations by the total number of simulations. MCS enabled characterizing component damage using a binary damage matrix Dm (i,j,k) (1 = damaged, 0 = not damaged), which represents the damage for each component (k) at each flood depth (i) for each simulation (j). Then, 1000 normally distributed random samples of the replacement cost for each component using the upper and lower bounds were generated. The probabilistic flood loss for each component was then calculated by multiplying the calculated failure probability by a vector of the developed 1000 replacement cost samples using Equation (2). Afterwards, the mean and standard deviation of the replacement cost for each component at each intensity measure were calculated using Equations (3) and (4). It should be mentioned that these equations are written based on one intensity measure (IM = x), which is the flood depth. However, for multi-variate fragility and loss functions, two intensity measures are used (IM1 = x1, IM2 = x2) for both flood depth and flood duration.
where (IM = x) = fragility function (failure probability at IM = x) for component k, D = component demand, R = component resistance, IM(x) is the intensity measure, nf = number of failed simulations, and N = the total number of simulations. Lk (IM = x) = is the component replacement cost vector at (IM = x), k = component number, = an ith random simulation of the replacement cost of component k, and = an ith random simulation of the replacement cost for component k at a specified intensity measure (IM = x). (IM = x) = the mean replacement cost of component k at (IM = x), and (IM = x) = the standard deviation of the replacement cost of component k at (IM = x).
2.2. Building Fragility and Loss Analysis
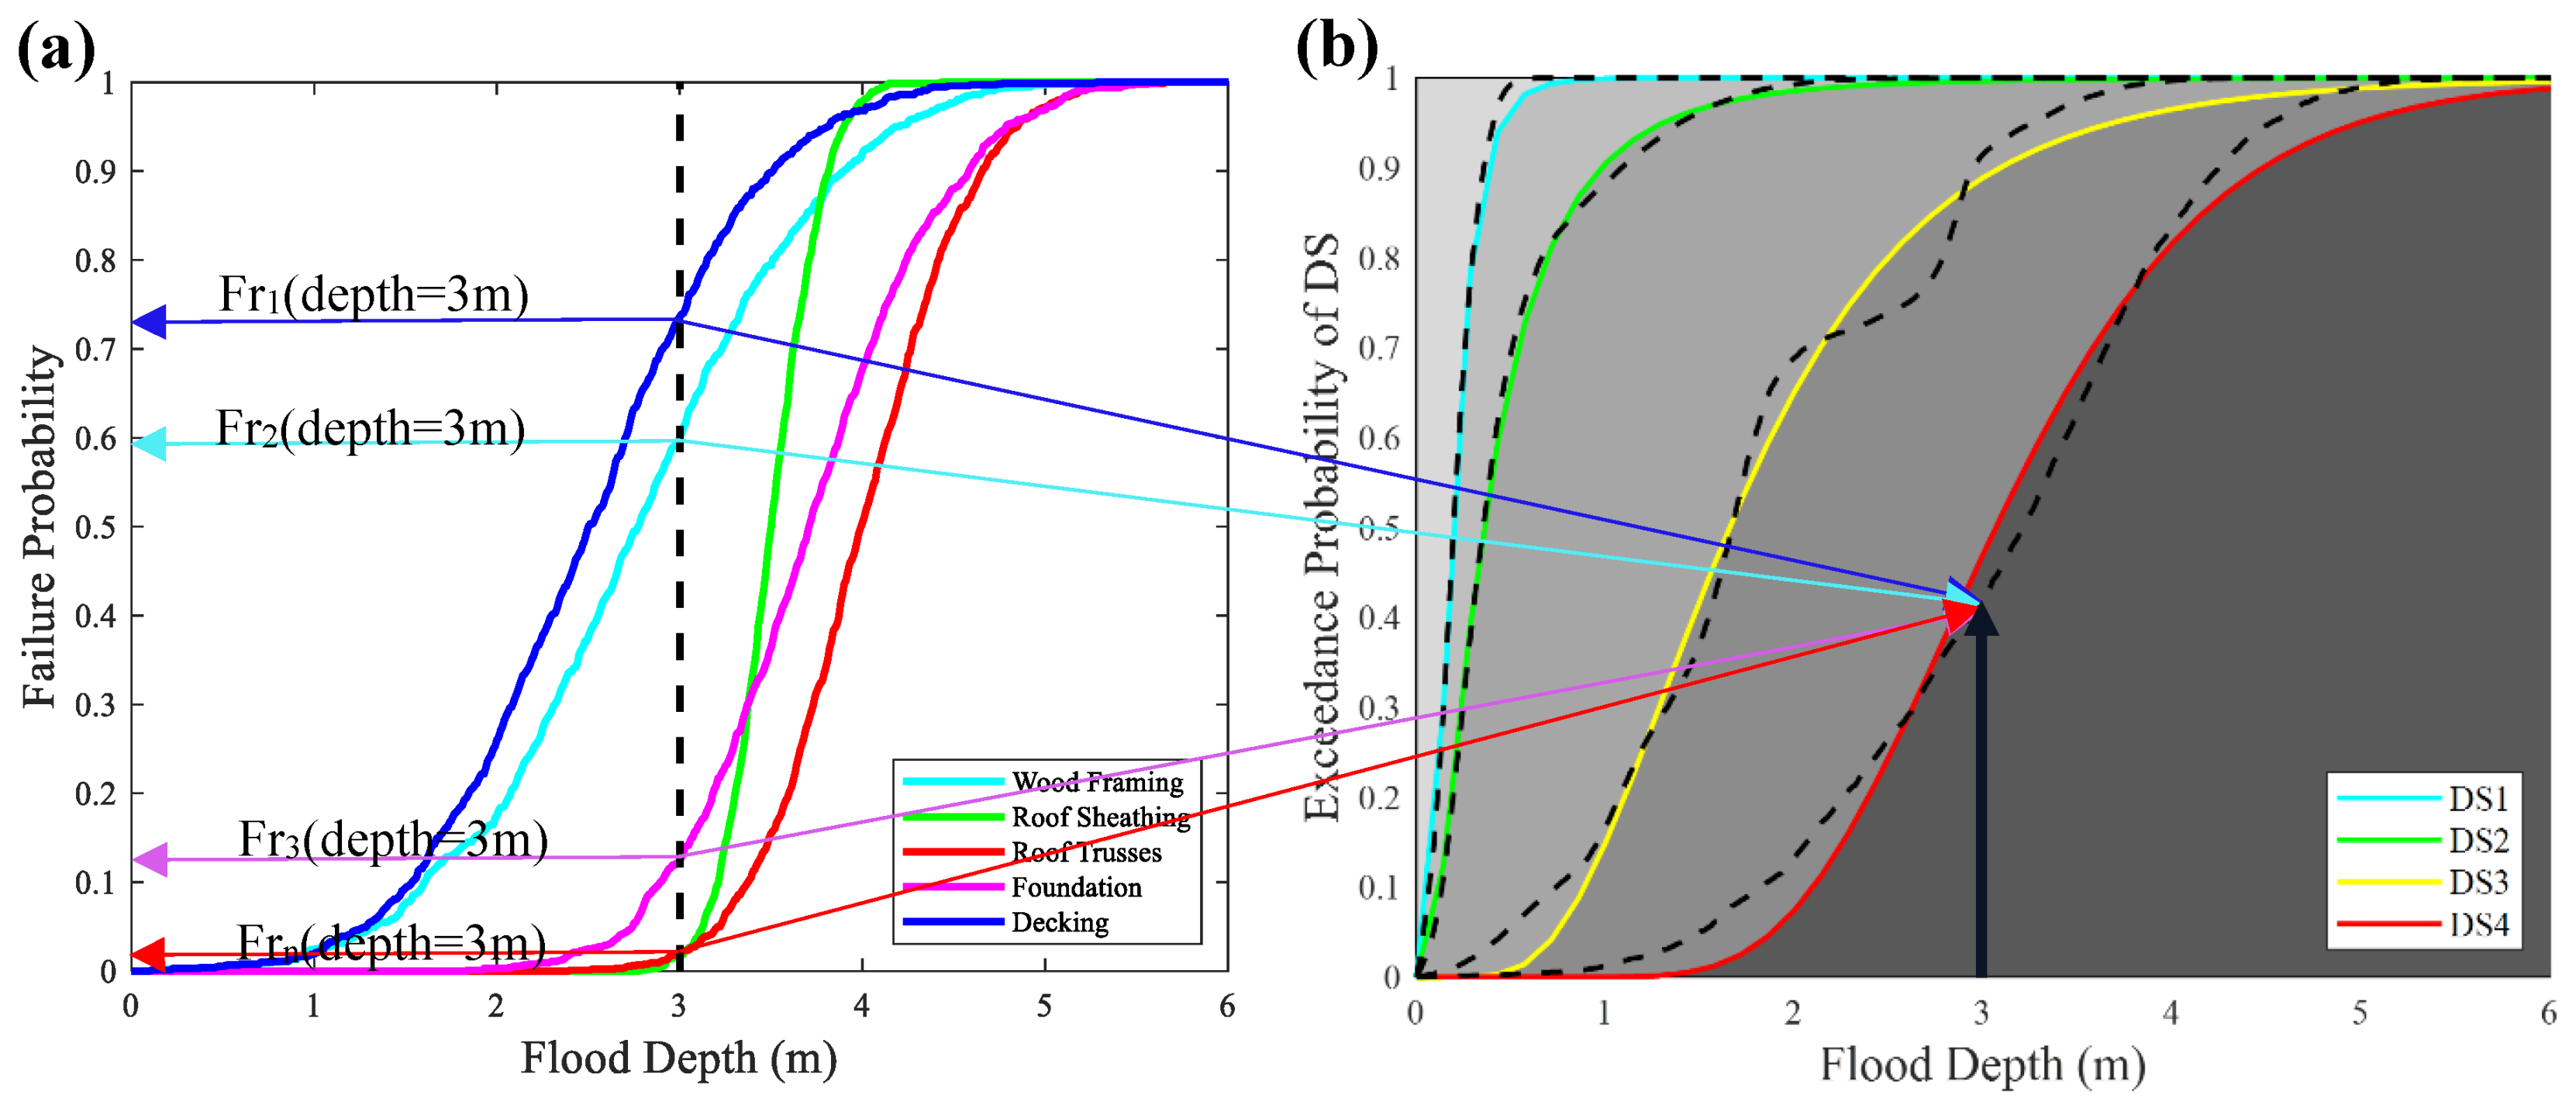
The building flood fragility functions, developed herein, describe the performance of buildings subjected to flood hazards based on specified performance criteria. A set of performance criteria (damage states) for buildings subjected to flood hazards was developed by Nofal et al. [69]. These performance criteria describe flood damage to buildings in terms of five damage states (DSs) ranging from insignificant damage (DS0) up to complete damage (DS4). The exceedance probability for each DS was calculated at each flood hazard intensity (flood depth and/or flood duration) and then fragility curves/surfaces for each building archetype were developed. Table 1 provides the safety and serviceability margins, damage scale, and an estimate for the loss ratio corresponding to each DS. The DSs’ loss ratios were normalized by summing the dollar loss for all components within each DS divided by the total building replacement cost. Table 2 provides a damage description for each DS, which is excerpted from Nofal et al. [69]. These DSs were designed such that they could describe both building functionality and serviceability in terms of the general building performance based on the behavior of a group of components exposed to a certain hazard intensity, thereby informing damage and the consequent level of occupancy. The exceedance probability of each DS was calculated based on the failure probability of each component within each DS and then weighted by the ratio of the replacement cost of each component to the replacement costs of all damageable components making up that DS using Equation (5). Then, the calculated fragility was fitted using the lognormal cumulative distribution function (CDF) using Equation (6). Figure 2 shows an example of how the exceedance probability of DS4 for a one-story residential building archetype (archetype F2) was derived from its components’ fragility with lognormal fitted fragility curves as solid lines.
where P[DSi|(IM = x)] = the exceedance probability of DSi at (IM = x), (IM = x) = fragility function (failure probability at IM = x) for component k, n = the number of components within DSi, Lk = the replacement cost of component k, and = the total replacement cost of DSi. = the lognormal fitted fragility value at (IM = x), = logarithmic median of DSi, = logarithmic standard deviation of DSi.
For losses, two loss methods are used to calculate the mean flood losses in monetary terms (the direct loss approach and a fragility-based flood loss approach). The direct loss approach utilizes the component fragility curves (component failure probability) and their replacement/repair costs directly to develop component loss curves. Subsequently, the replacement cost for each component within the same simulation is summed to calculate the statistical distribution of the total building replacement cost. On the other hand, the fragility-based approach uses the lognormal fitted building fragility curves (exceedance probability of each DS) to account for the total building loss by multiplying the probability of being in each DS by the replacement cost of each DS as shown in Equation (7). The fragility-based flood loss method should give a loss curve similar to the one developed by the direct loss approach because both methods account for components’ failure probability and the weights of the replacement cost of each component. However, there will be a slight difference due to using the lognormal fitted fragility functions in developing the fragility-based flood loss functions (not the empirical values). As a final step, the direct and fragility-based loss functions for each building archetype were compared to their corresponding HAZUS stage–damage functions to serve as validation. Figure 3 shows a schematic of the two approaches used to calculate flood losses for single variable flood losses (based on flood depth). Developing a multi-variate flood loss function follows the same concept using a 4D damage matrix (Dm (i,j,l,k)) to include flood duration as a fourth dimension.
where Lf (IM = x) = total building fragility-based losses in monetary terms at IM = x (replacement or repair cost), P(DSi|IM = x) = exceedance probability of DSi at IM = x, P(DSi+1) = exceedance probability of DSi+1 at IM = x, = cumulative replacement cost ratio corresponding to DSi, and Vt = total building cost (replacement cost).
2.3. Building Archetypes
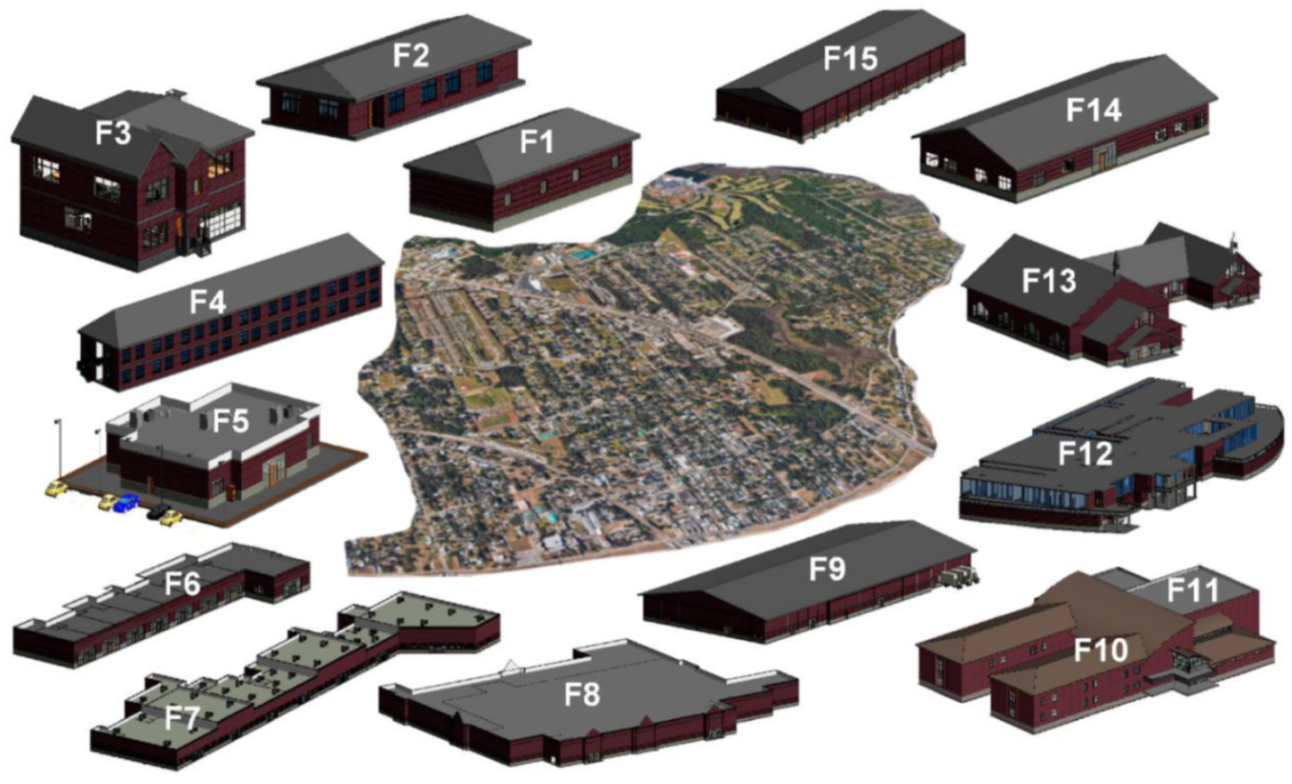
Building sectors within a community including the residential sector, commercial/business sector, and social institutions (e.g., schools, hospitals) were divided into 15 building archetypes as shown in Figure 4. Table 3 shows a list of these archetypes along with a brief description for each one. Full details for each building archetype including dimensions, interior design, plans, 2-D, and 3-D views are all provided in Appendix A of this paper. All data is provided as part of the data portion of this paper as well (see Supplementary Materials). These archetypes are intended to provide a reasonable representation of the buildings within a small to middle size community; however, it is recognized that some buildings and community-specific buildings may not be represented (e.g., water treatment plants, electric power plants or substations, water tanks, etc.). It is planned to eventually include such buildings and facilities, but it is beyond the scope of the current paper. The exterior and interior design of these building archetypes are based on real buildings found in the United States.
These archetypes were selected by navigating more than 20,000 buildings within a typical eastern U.S. community using Google Maps Street view [70] and field-surveying a number of these buildings during a longitudinal field study [66]. The assumed building size and shape can be modified to match other sizes and shapes of buildings as needed to ensure loss calculations are proportional to building size, so simple multipliers can provide relatively straightforward expansion of the archetype portfolio for more accuracy. A building information model (BIM) for each building archetype was created using Autodesk Revit Architecture [71]. BIM models help to visualize building components and enable fast surveying/counting of construction quantities. Building price variability in terms of economy and luxury components is also considered by assuming upper and lower bounds for each component’s replacement/repair cost. Once this process was completed, MCS was used to include these uncertainties to account for a probabilistic building replacement/repair cost. In the next subsections, more detail related to each building archetype including descriptions, dimensions, and interior design is presented. It should be noted that mid- and high-rise buildings are not explicitly included in the suite of archetypes since these are generally very unique and would be handled on a case-by-case assignment basis while setting up a community-level model.
- F1: One-Story Single-Family Residential Building
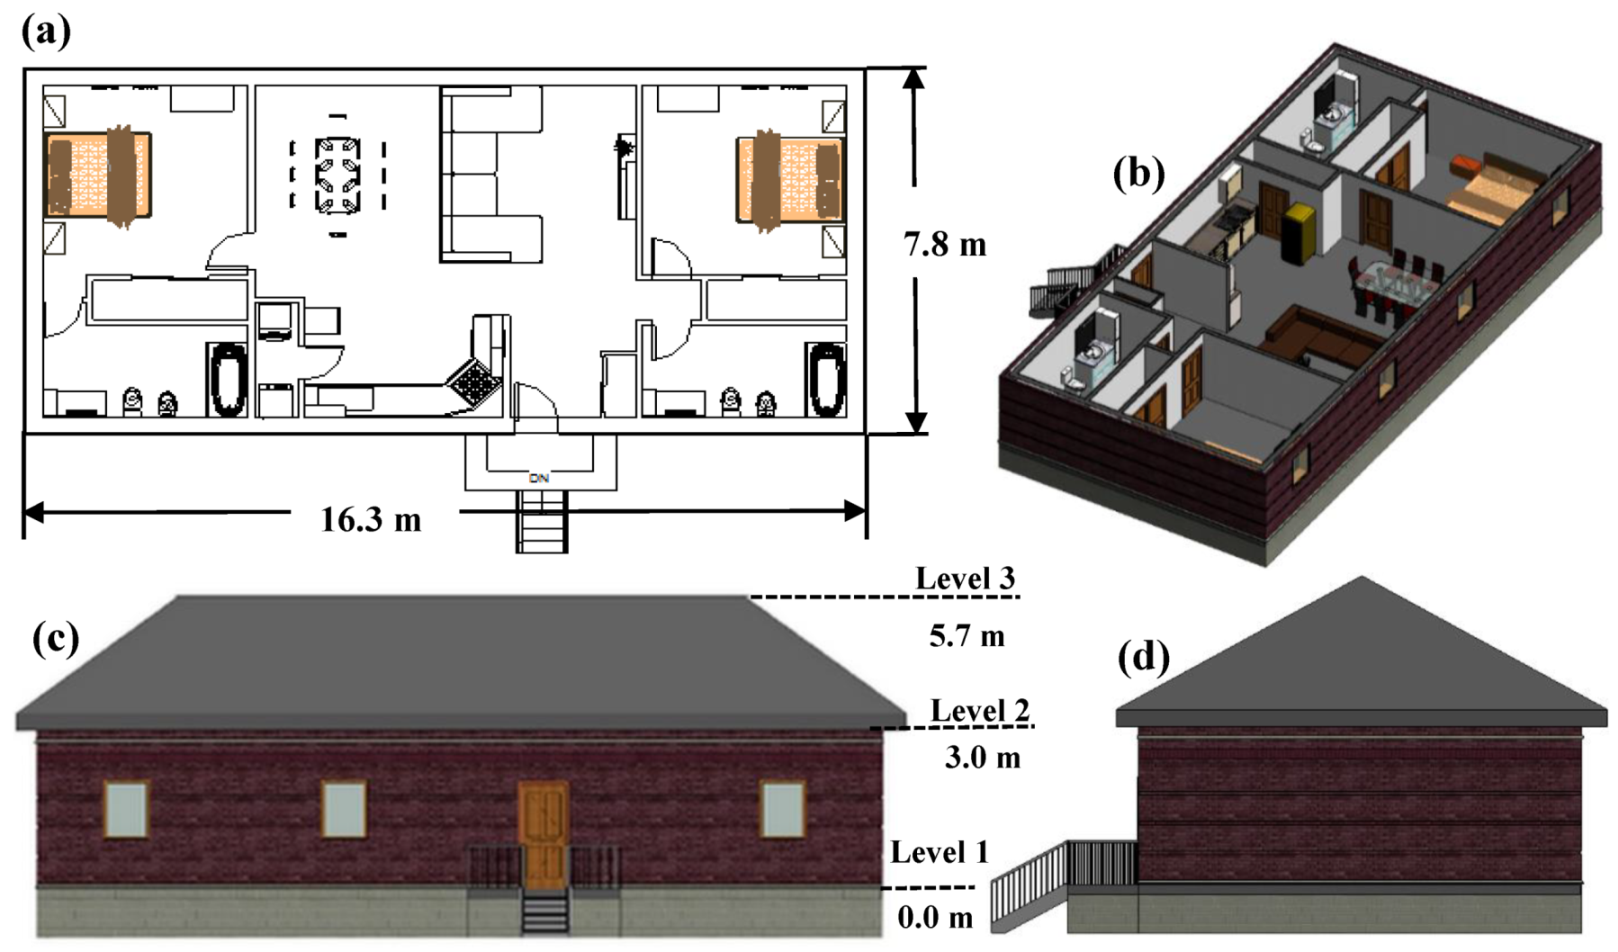
The F1 archetype is considered a typical one-story single-family residential housing unit in the US with a small rectangular plan (16.3 × 7.8) with a total area of 127 m2 (1370 ft2). This housing unit could be in the form of a modular home. It consists of two bedrooms and a medium-size living room with a wood frame structural system and exterior brick walls on a crawlspace foundation. Uncertainties in the structure system type and the component’s flood resistance (flood depth and flood duration resistance) along with its replacement/repair cost were considered. This housing unit can be assigned on a regular one-story single-family residential building. More details on this archetype could be found in a manuscript that details the methodology to develop a flood fragility surface and loss surface as a function of both flood depth and duration [69].
- F2: One-Story Multi-Family Residential Building
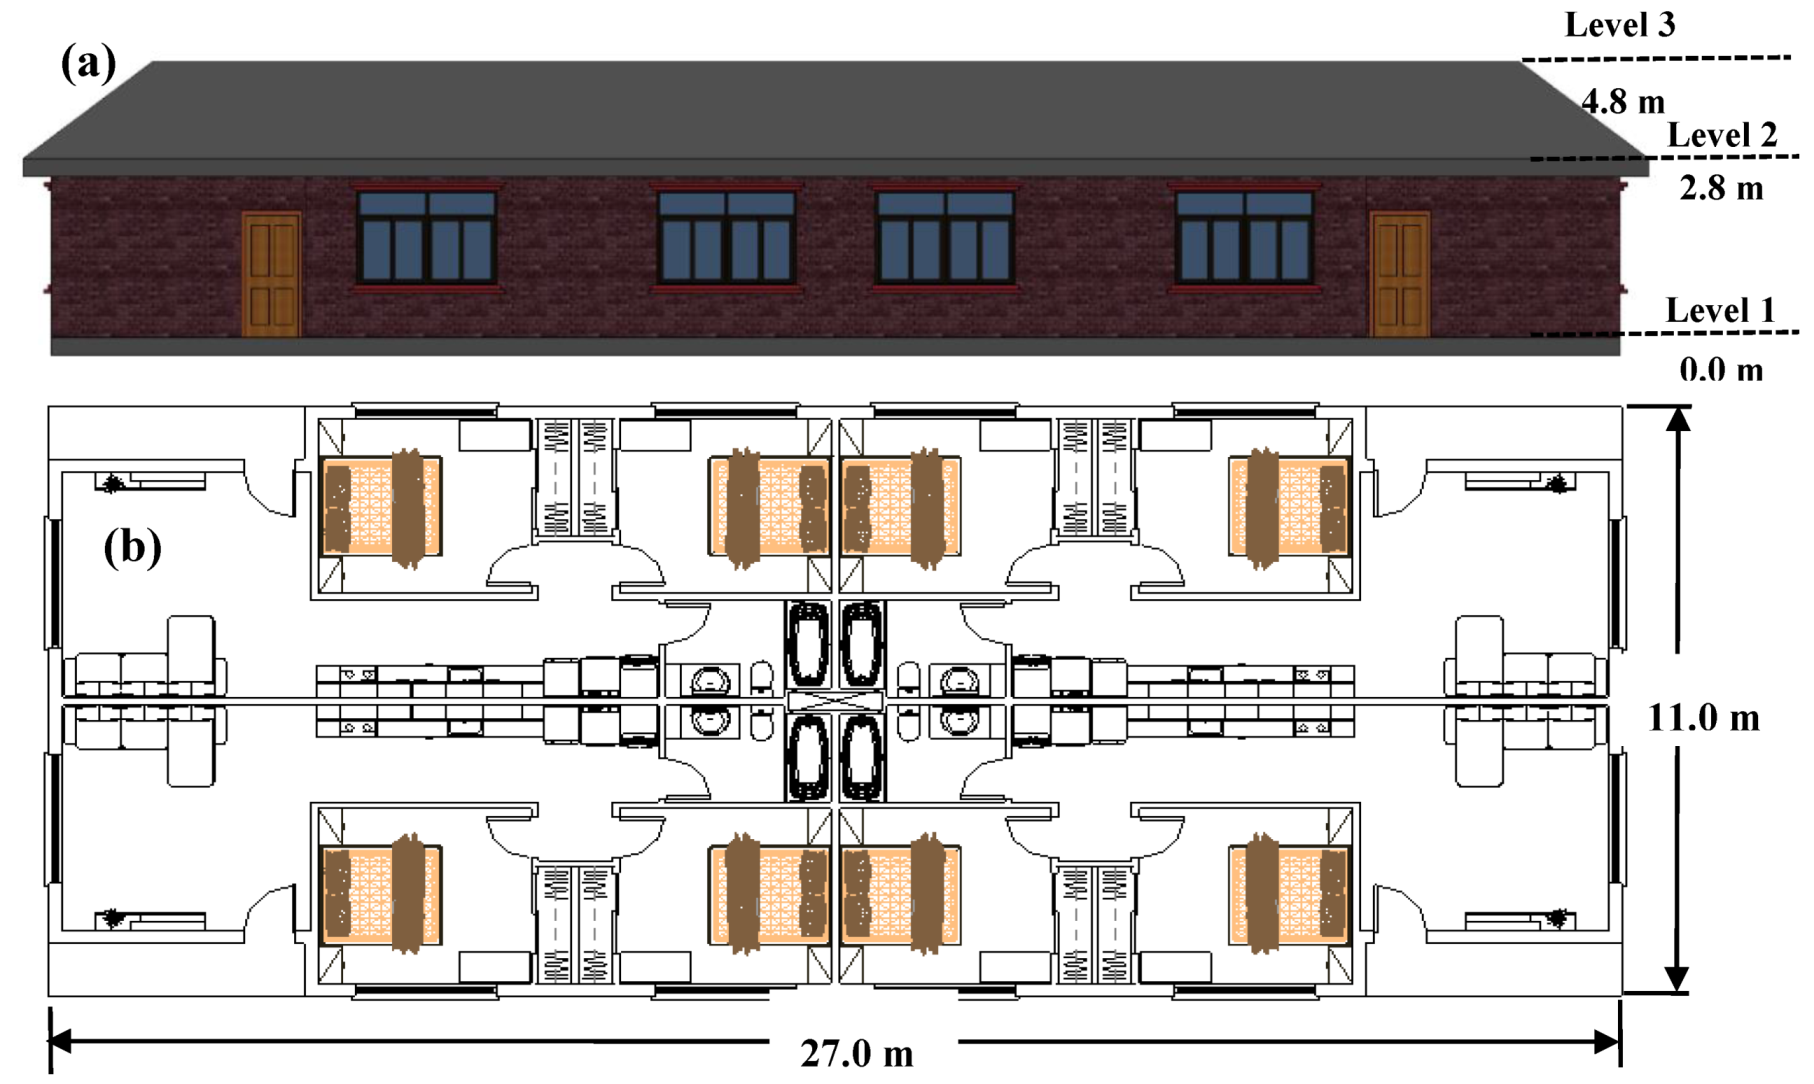
The F2 archetype is a typical one-story multi-family residential archetype has a medium size rectangular building (27 m × 11 m) with a total area of 297 m2 (3200 ft2). Such a building consists of four apartments with an area of 74 m2 (795 ft2) each. The structure system was assumed to be a wood frame with exterior brick walls on a slab-on-grade foundation. The interior design of the building was assumed to account for the components that could be accommodated in this area.
- F3: Two-Story Single-Family Residential Building
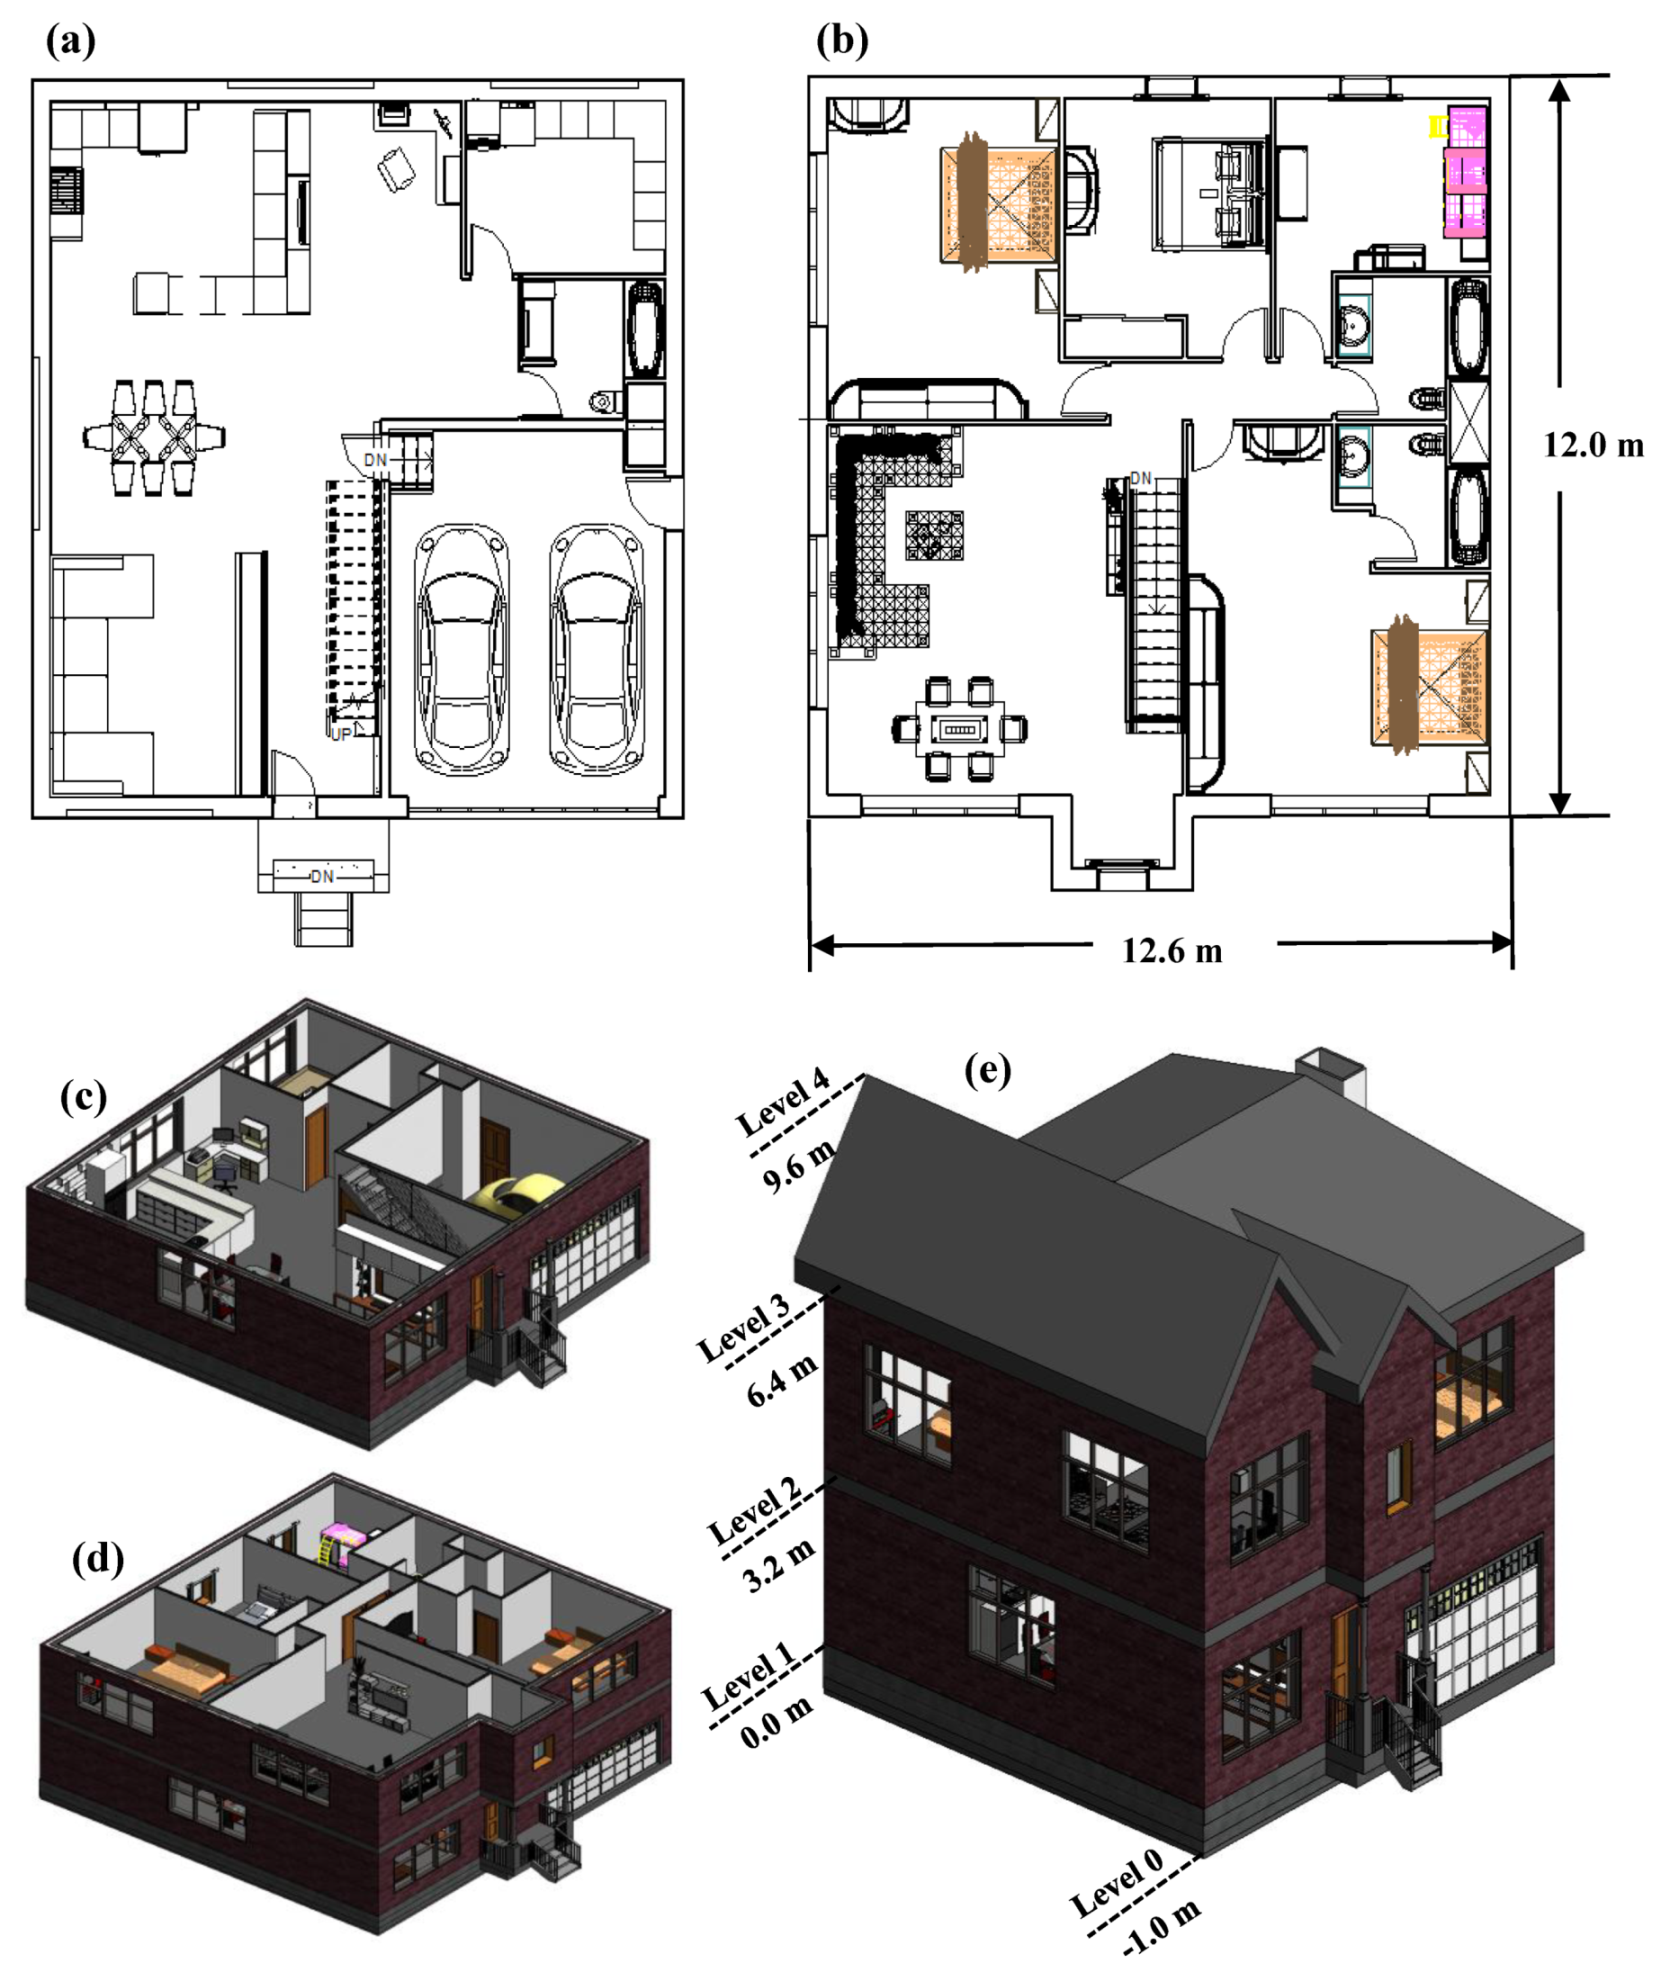
The F3 archetype is a regular two-story single-family residential building in the US with a small size square plan (12.3 m × 11.8 m) with a total area of 145 m2 (1562 ft2). The building structure system is assumed to be a wood frame with exterior brick walls on a crawl space foundation with an interior garage on a slab-on-grade foundation.
- F4: Two-Story Multi-Family Residential Building
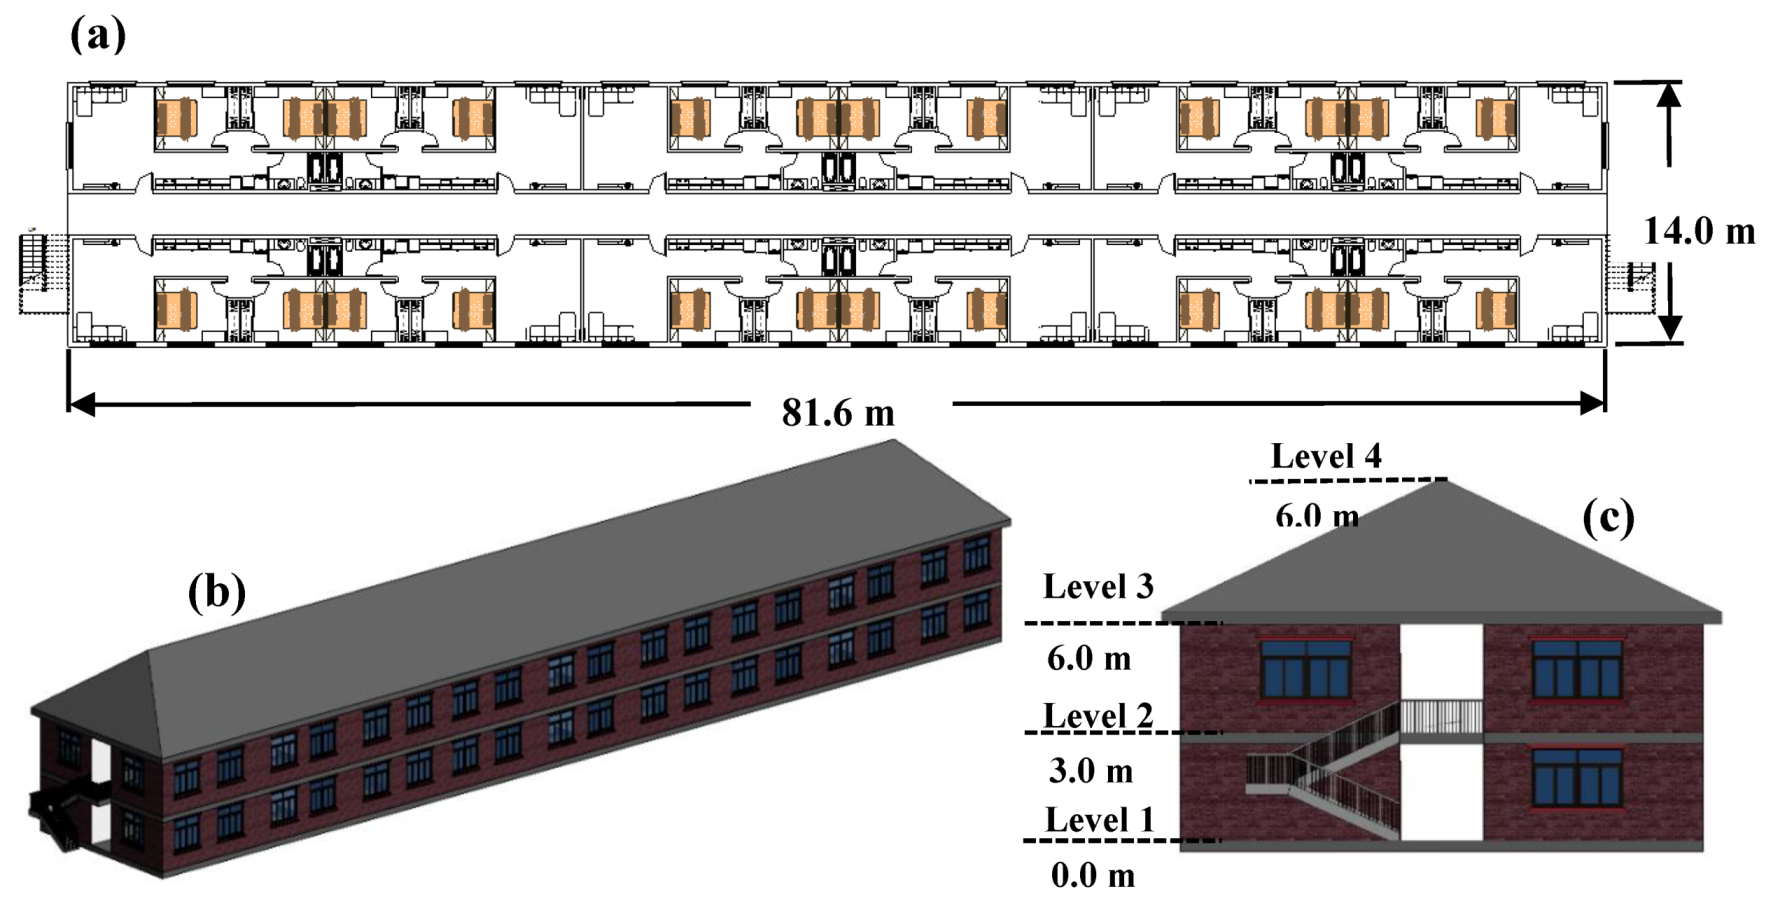
This archetype, F4, is a two-story multi-family residential building with a large rectangular plan (81.6 m × 14.0 m) with a total area of 1142 m2 (12,290 ft2). It consists of 24 apartments with an area of 74 m2 (795 ft2) each. Multi-family residential buildings could be found in other forms such as stacked duplex or multi-story buildings. However, the selected building archetype could represent a number of different two-story buildings within a community. The building structure system was assumed to be a wood frame building with exterior brick walls on a slab-on-grade foundation.
- F5: Small Grocery Store/Gas Station with a Convenience Store
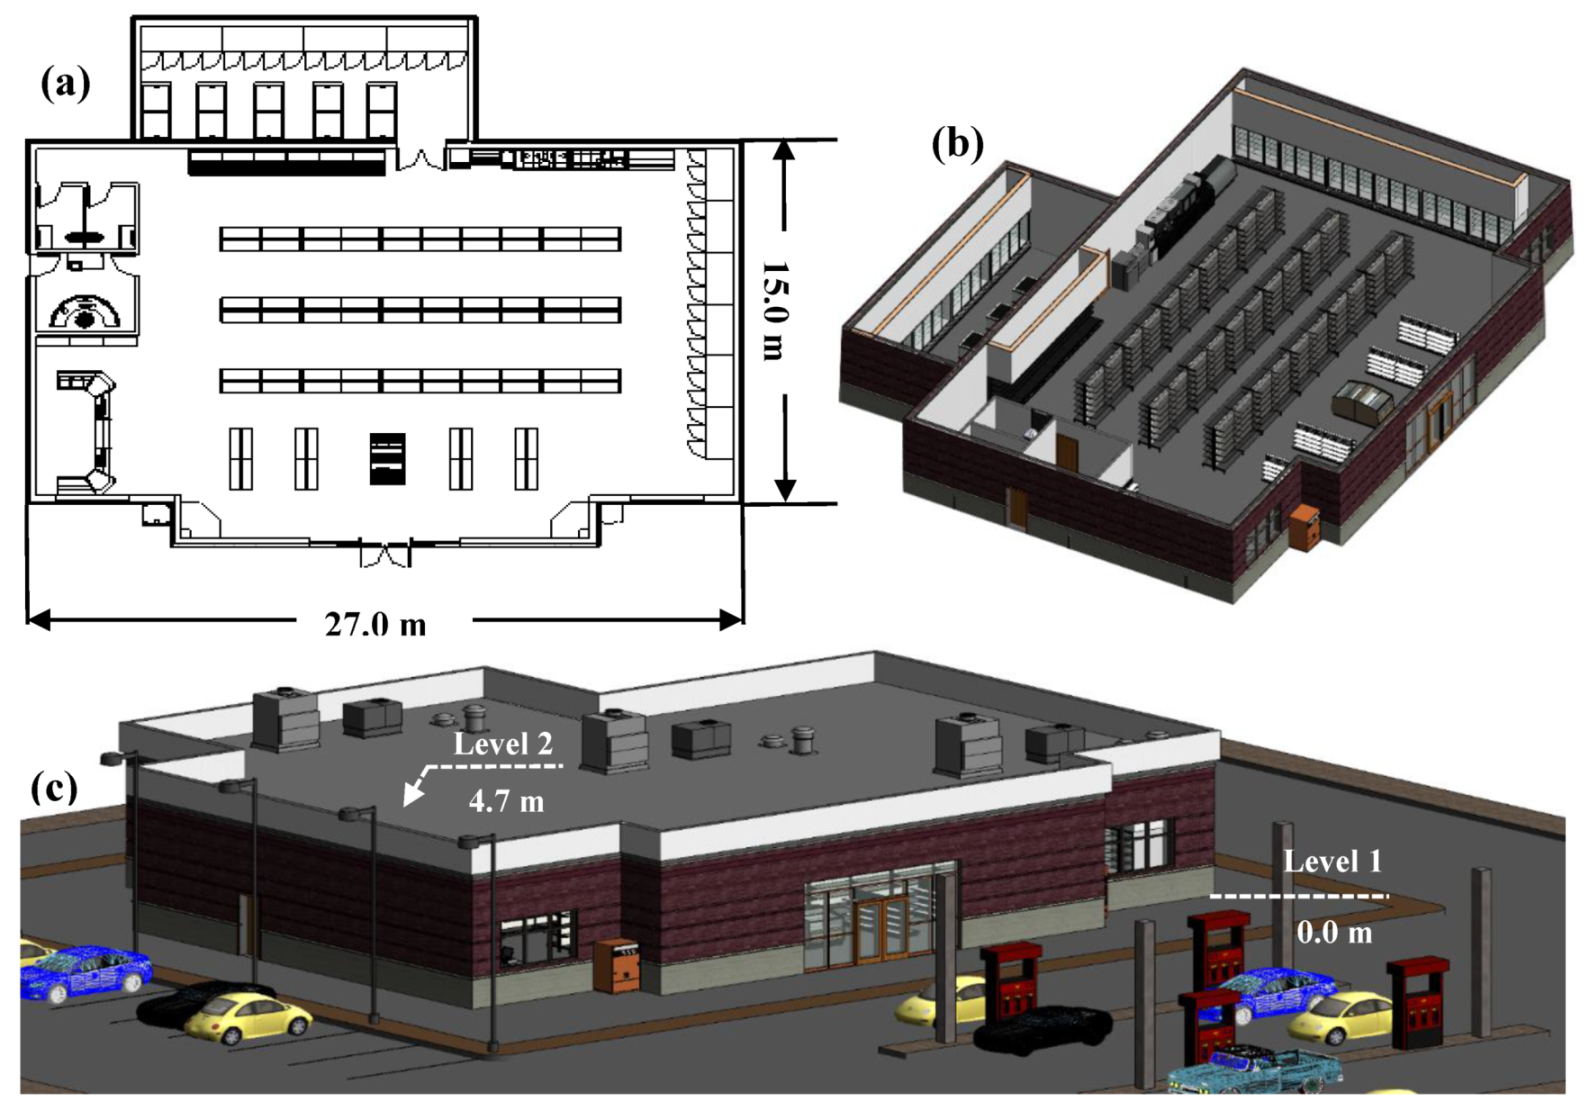
The F5 archetype is a typical small to a medium gas station (as opposed to a truck stop size gas/diesel station) attached with a convenience store that has a medium size rectangular plan (27 m × 15 m) with a total area of 405 m2 (4360 ft2). The same archetype could be assigned to a small size grocery store since the building is under consideration in the damage and loss analyses herein. The structural system is a bolted steel frame with light gauge steel or wood studs along with exterior brick walls resting on a slab-on-grade foundation. Full interior design was assumed based on field visits to a number of gas stations
- F6: Multi-Unit Retail Building (Strip Mall)
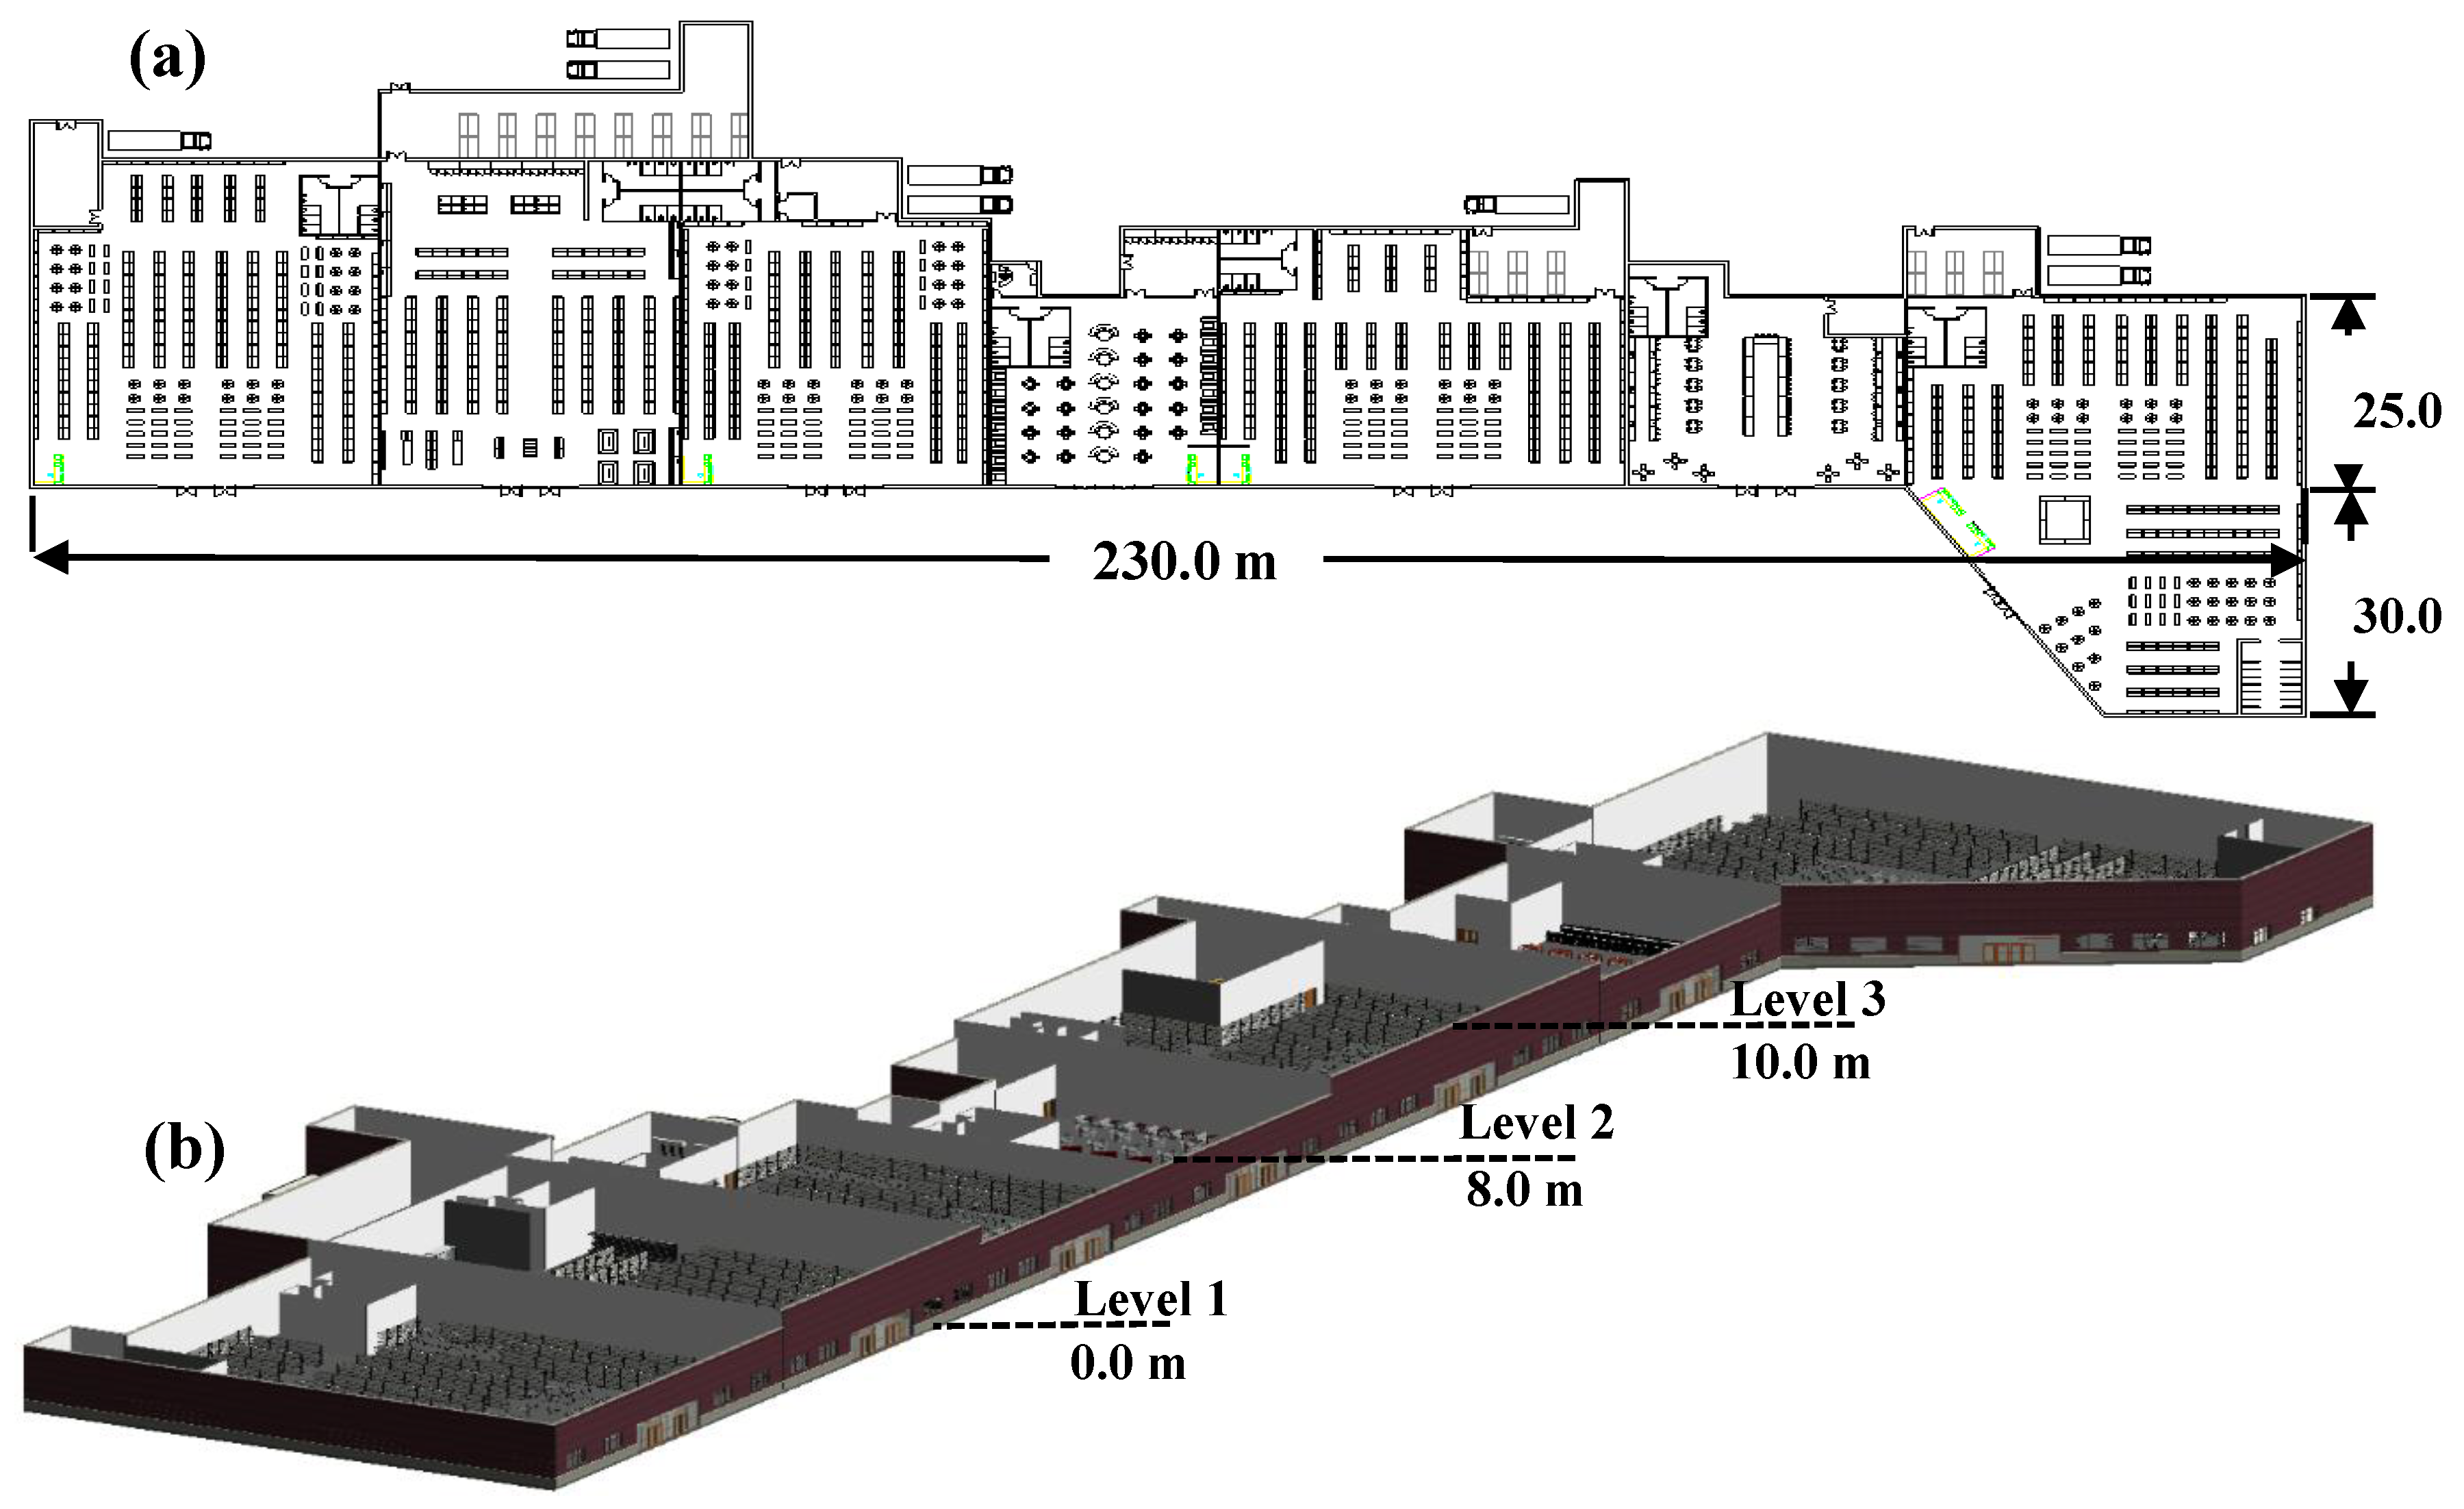
The F6 archetype is a large strip mall that includes a number of large size businesses such as restaurants/café, bars, grocery stores, clothes stores, toy stores, auto parts stores, etc. This archetype has a large size rectangular plan (230 m × 55 m) with a total area of 9370 m2 (100,860 ft2). The F6 archetype could be assigned to large size multi-unit retail/business buildings (strip malls) within a community using proper scaling and factorization based on building size. The structural system is a steel frame with steel/wood studs along with exterior brick walls rested on a slab-on-grade foundation. Full interior design was assumed based on several visits and surveying many strip malls.
- F7: Small Multi-Unit Commercial Building
The F7 archetype is a small size multi-unit commercial building that includes a number of small businesses such as a restaurant/café, grocery store, office, pharmacy, electronics store, etc. This archetype has a small size rectangular plan (68 m × 13 m) with a total area of 1037 m2 (11,160 ft2). The F7 archetype could be assigned to small size buildings with multiple businesses represented within a community again with proper scaling and factorization based on building size. The structural system is a steel frame building along with exterior brick walls rested on a slab-on-grade foundation. Full interior design was assumed based on several visits and surveying small businesses.
- F8: Super Retail Center
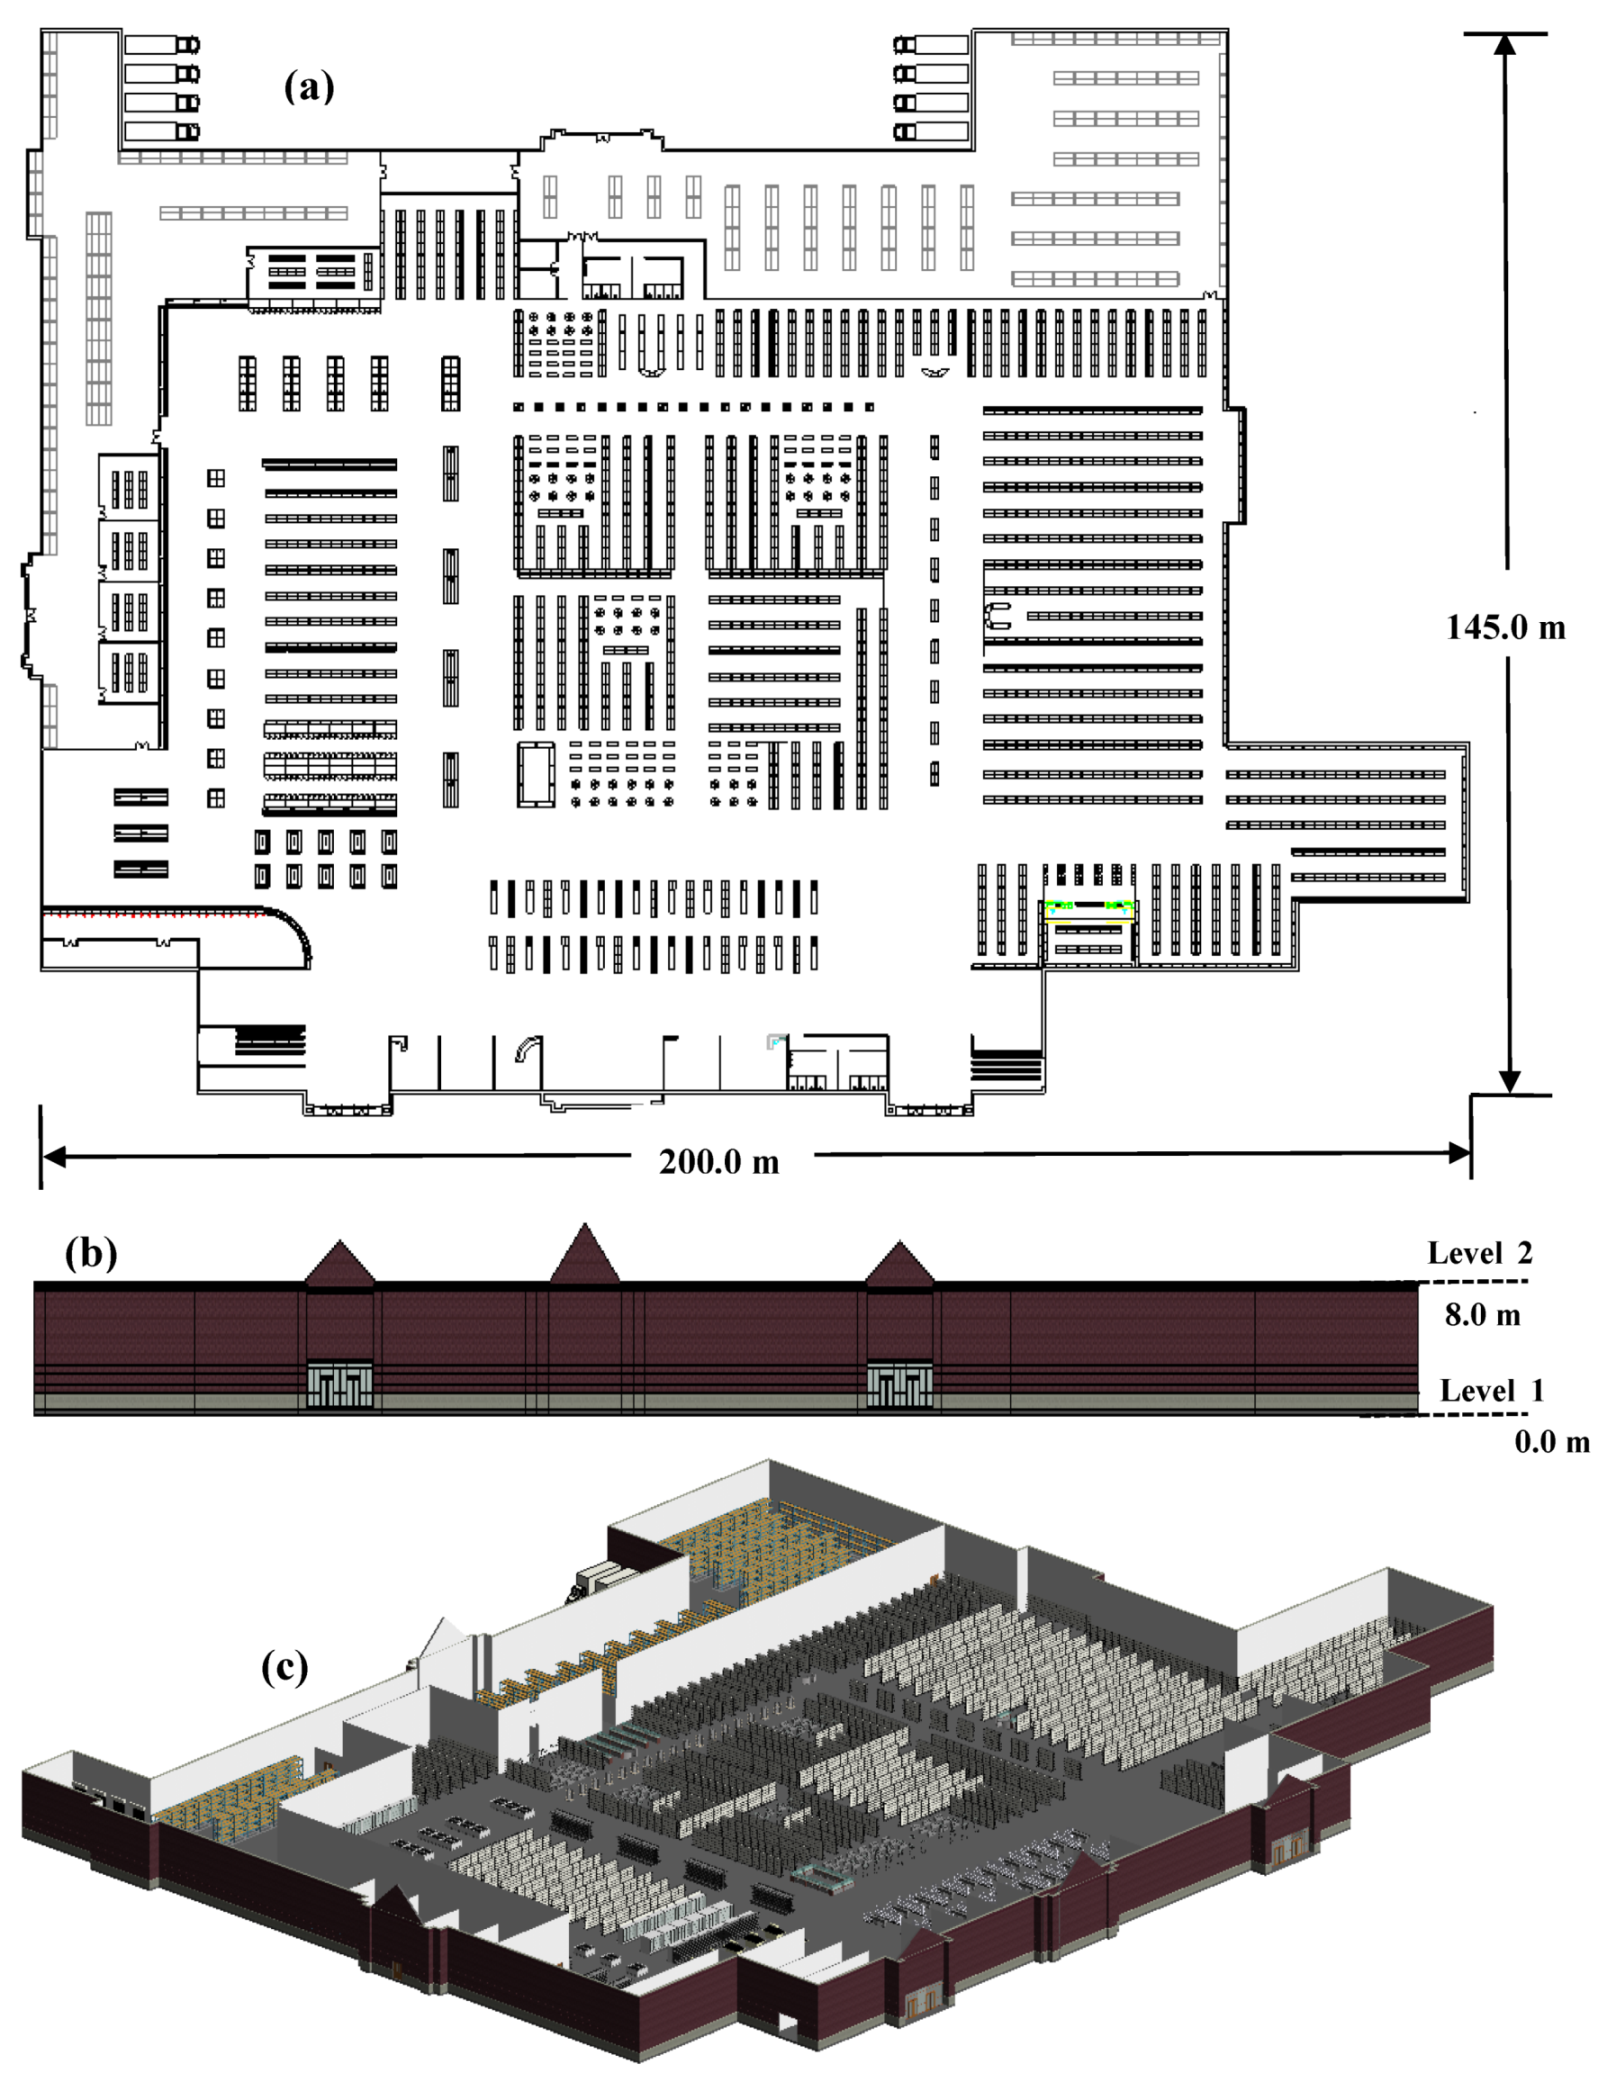
The F8 archetype is a regular mega-market/shopping/retail center (e.g., Walmart or Target in the U.S.) with a large size rectangular plan (200 m × 145 m) with a total area of 29,000 m2 (312,153 ft2). This archetype could be assigned to stores/shopping centers from medium size to big sizes with proper scaling of the buildings’ market value. The structural system is a steel frame with steel/wood studs along with exterior brick walls rested on a slab-on-grade foundation. Full interior design was assumed based on several visits and surveying many supermarkets.
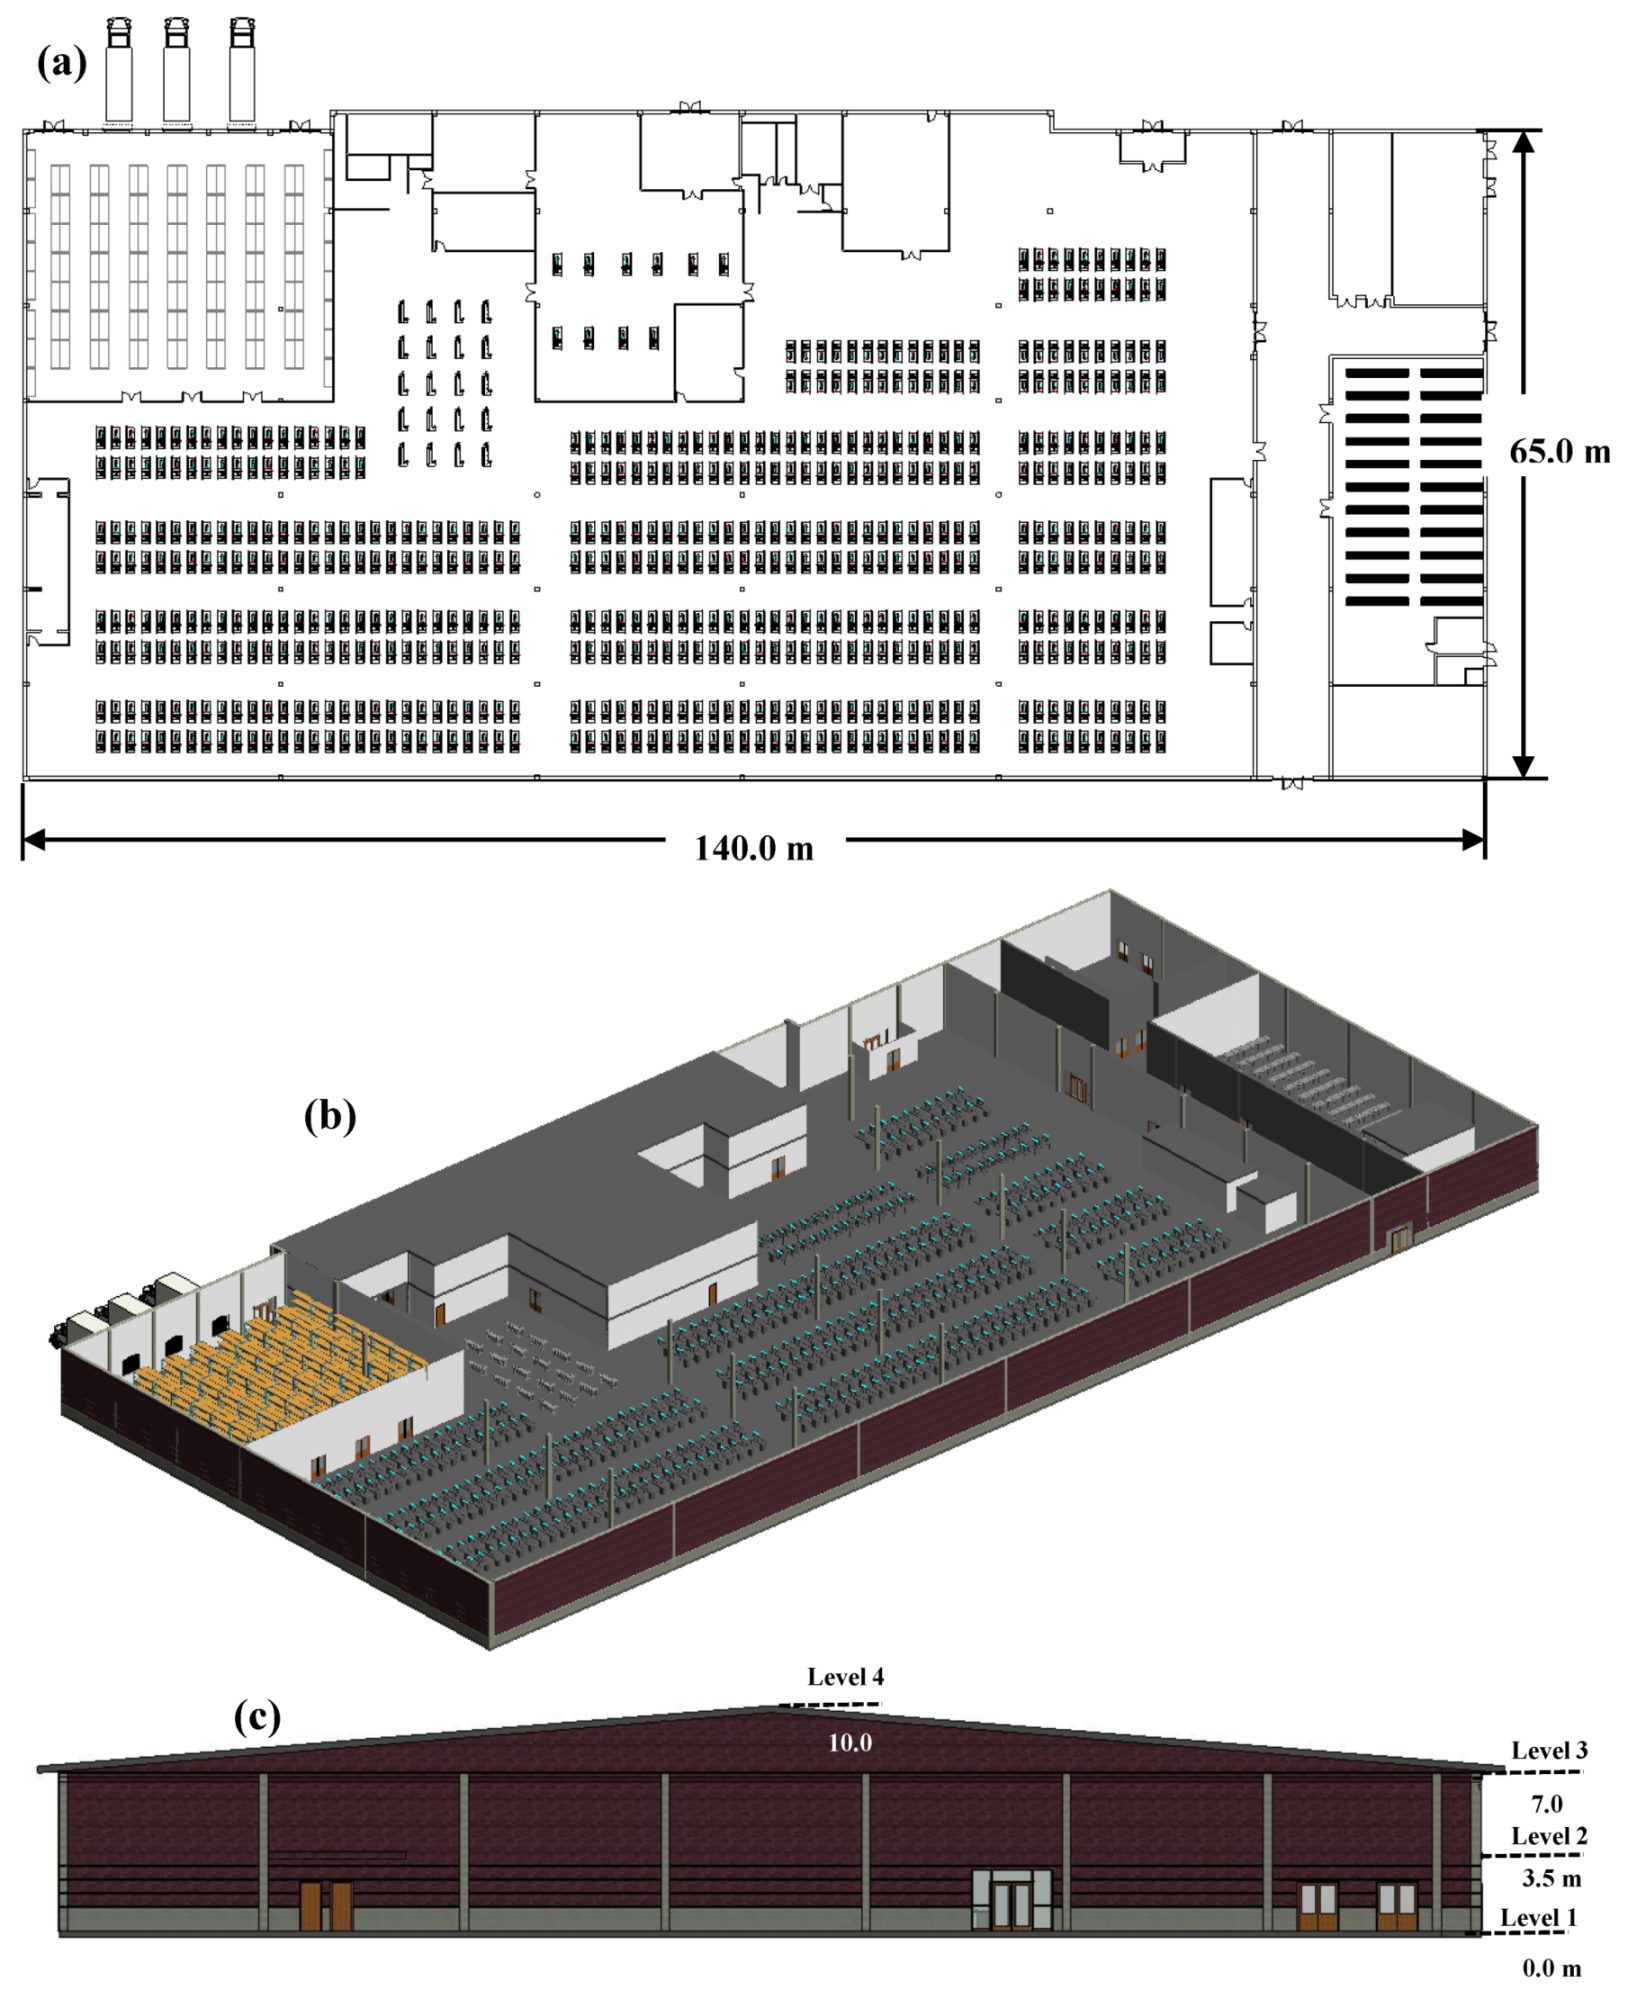
- F9: Industrial Building
The F9 archetype is a medium industrial building (e.g., light bulbs, clothes, pets’ food, etc.) with a large rectangular floor plan (140 m × 65 m) with a total area of 9100 m2 (9800 ft2). This archetype could be assigned to any industrial building ranging from light to heavy industry with proper scaling of the building market value. The structure system is a steel frame along with exterior brick walls resting on a slab-on-grade foundation.
- F10: One-Story School
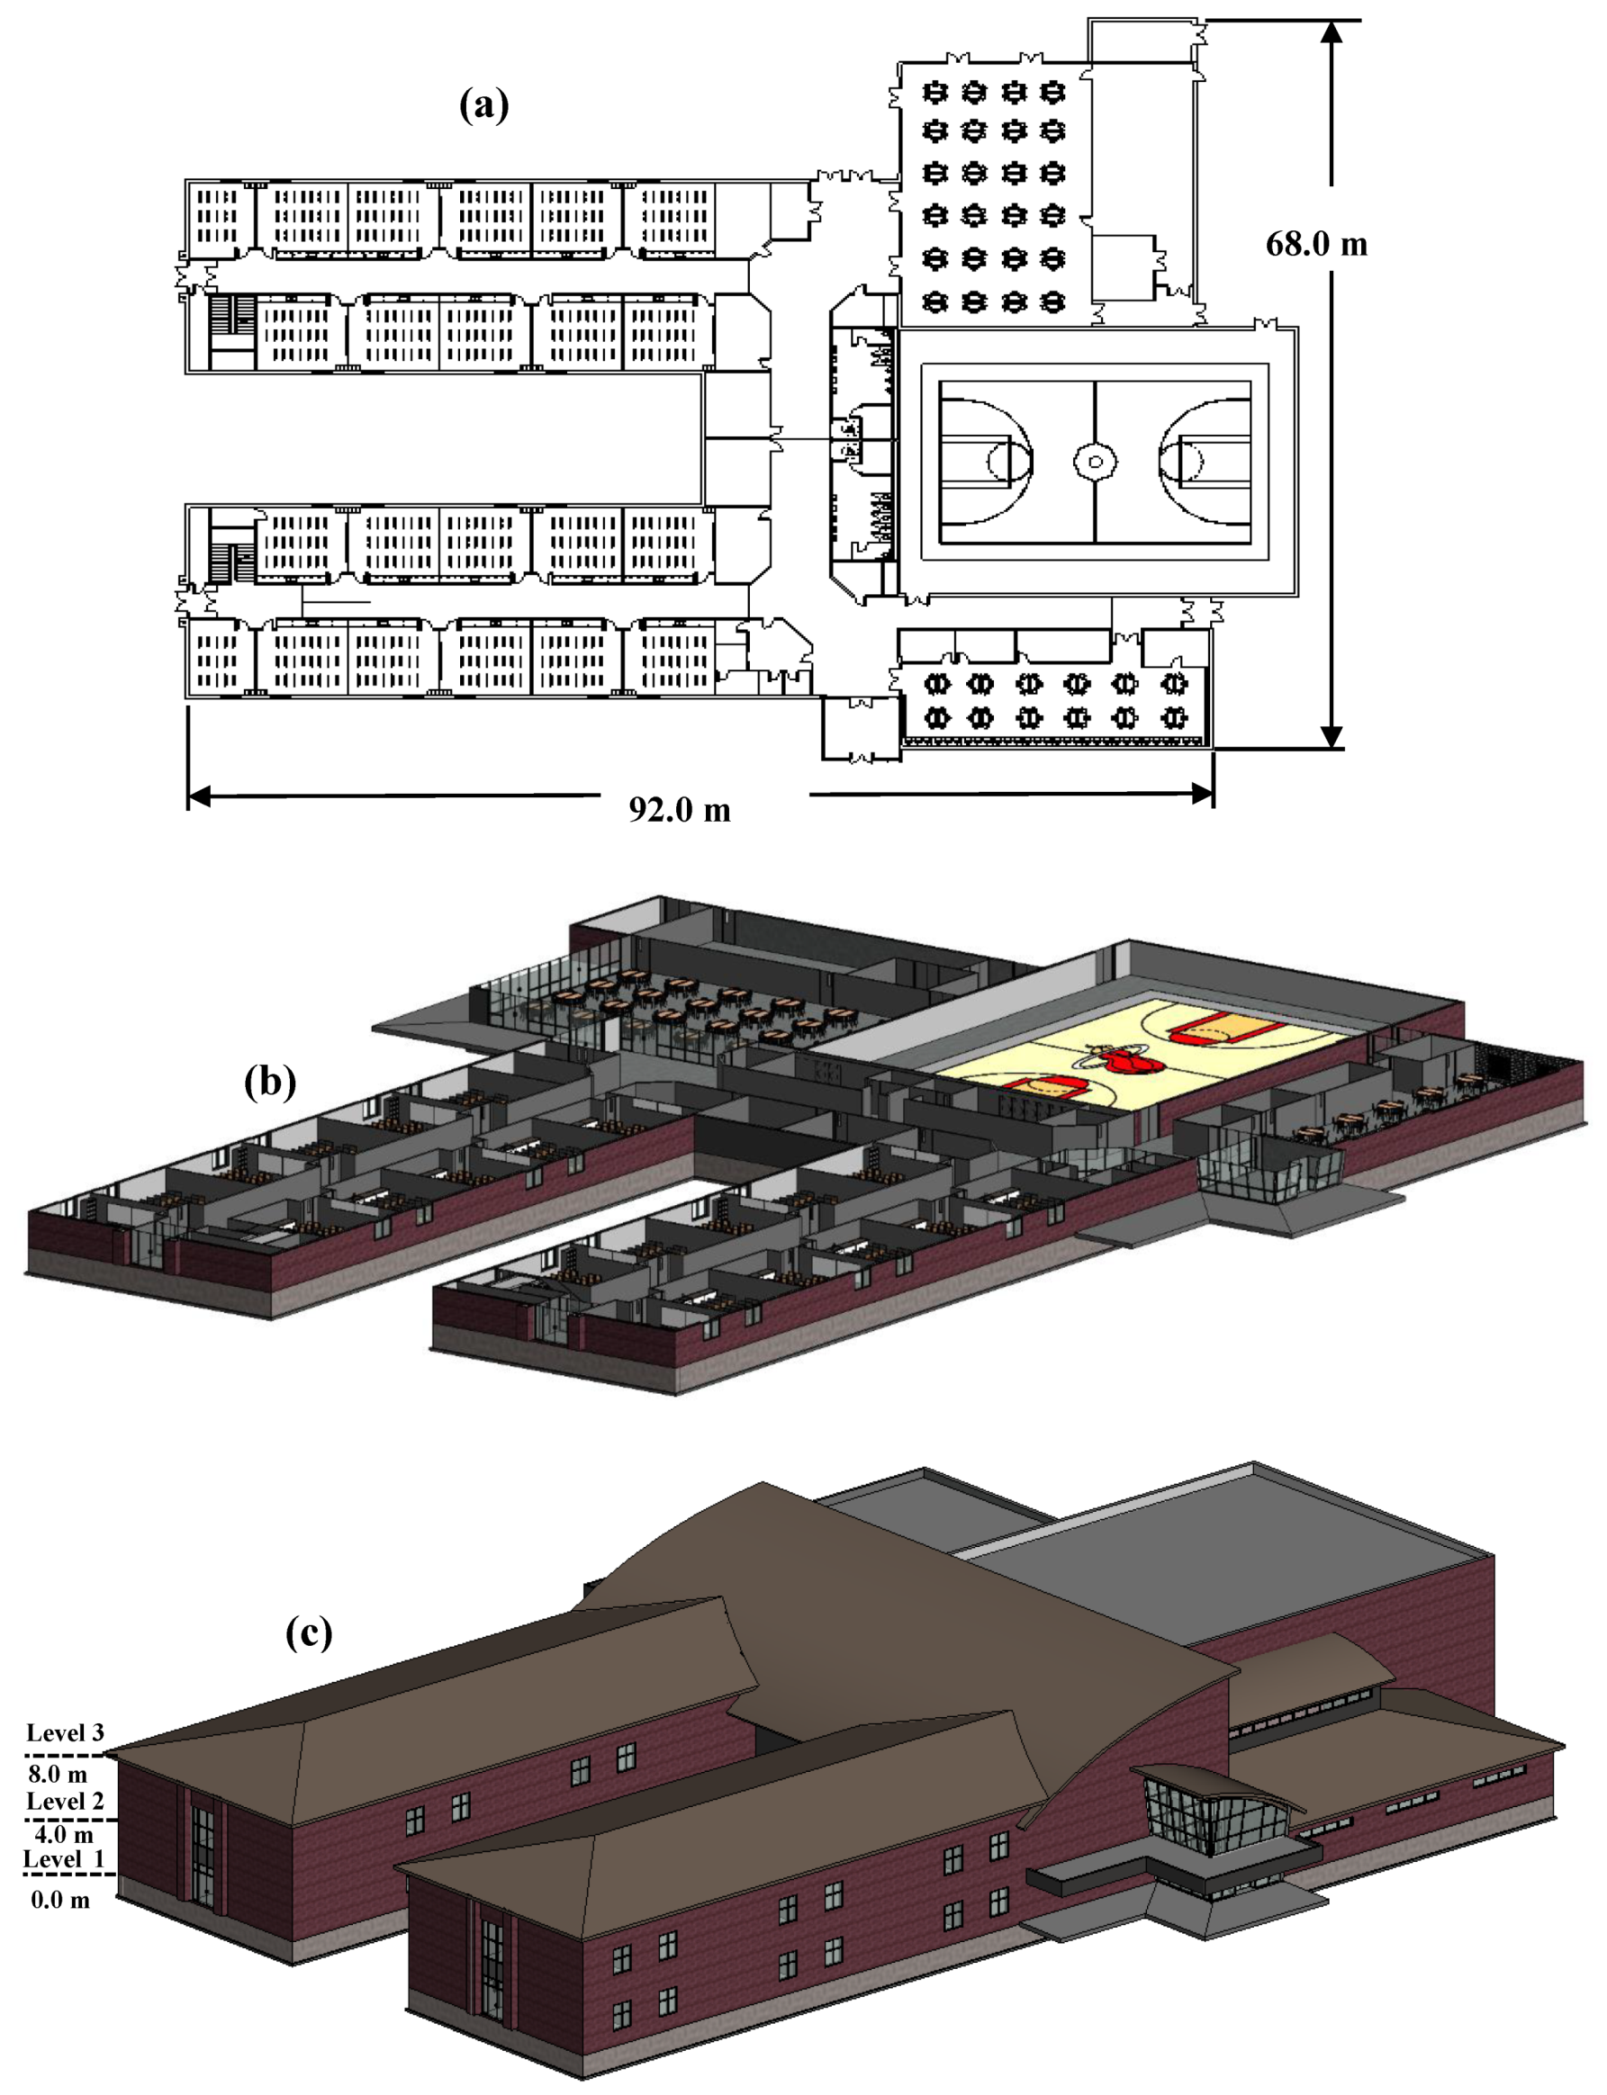
A one-story school building with a large size rectangular floor plan (92 m × 68 m) with a total area of 6256 m2 (67,340 ft2) is assigned as archetype F10. The structural system is assumed to be unreinforced masonry on a slab-on-grade foundation. It could be assigned for any school building (e.g., elementary, middle, high school, etc.) that matches the same size and the archetype properties. The layout of this school will be the same as archetype F11 but one-story other than two stories.
- F11: Two-Story School
The F11 archetype is a two-story school building that has the same characteristics as archetype F10, but it is a two-story school building.
- F12: Hospital/Clinic
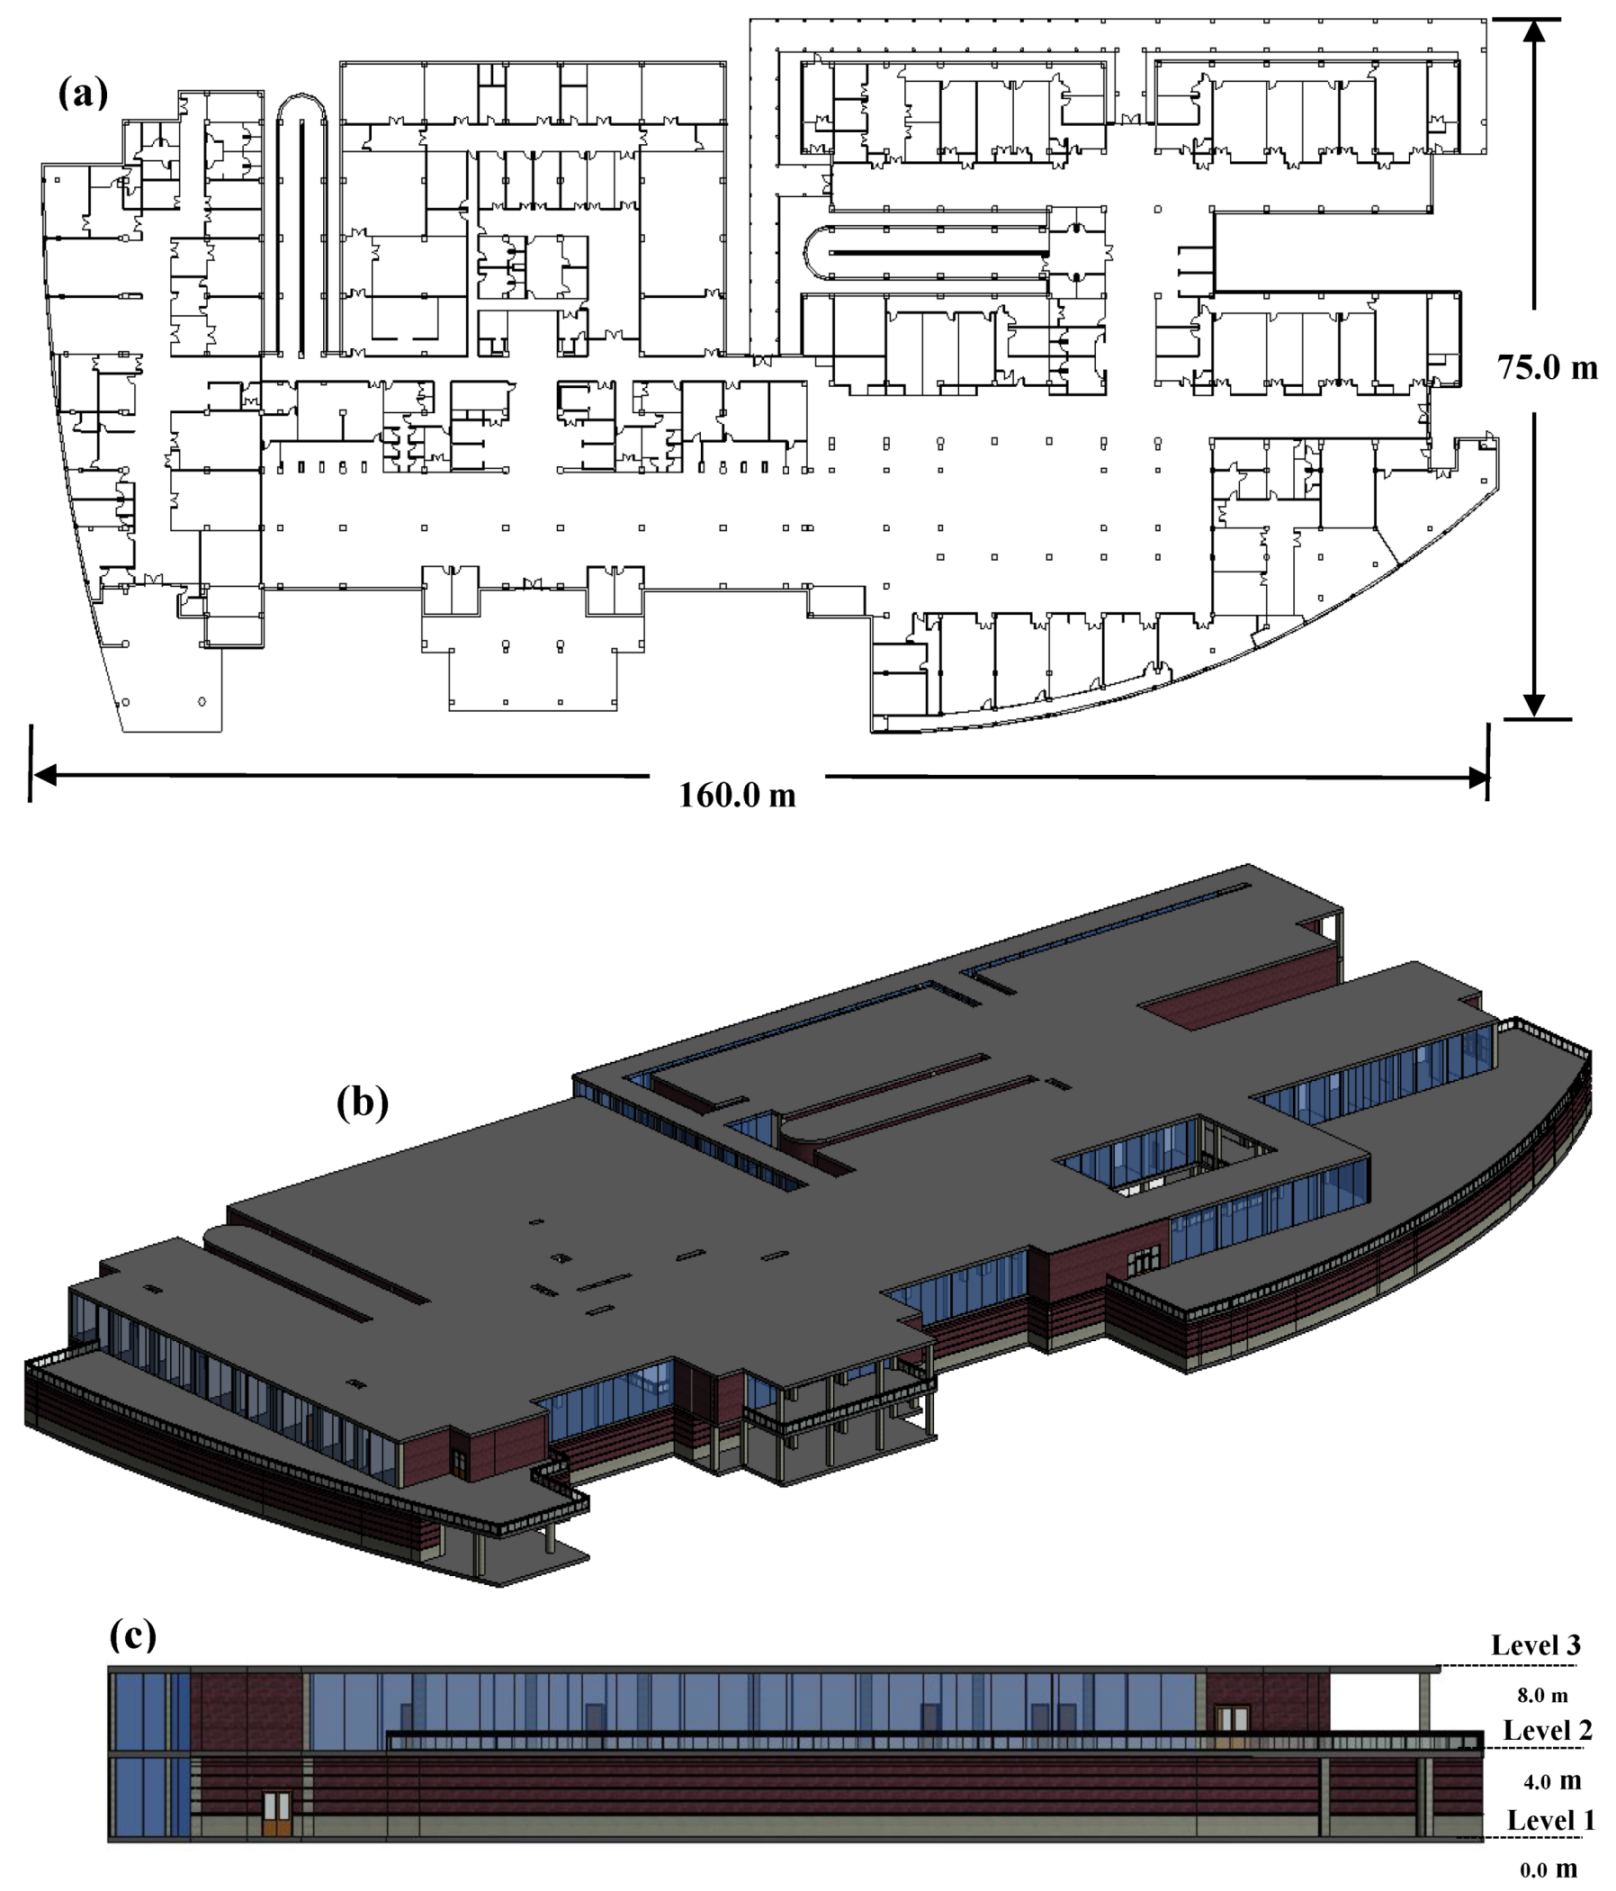
The F12 archetype is a medium-size two-story hospital with a rectangular plan (160 m × 75 m) with a total area of 12,000 m2 (129,160 ft2). The structural system could be a concrete/steel frame on a raft foundation. Prices for hospital units (e.g., X-RAY, ICU, NICU, ER, Mortuary, Dental, etc.), equipment furniture, essential facilities, and materials were retrieved from the published data by the World Health Organization [72] and Cost Finder [73]. Essential units’ prices were scaled down based on hospital size with proper assumed standard deviations. It should be mentioned that the hospital’s essential units are very expensive, representing more than half of the hospital’s total value.
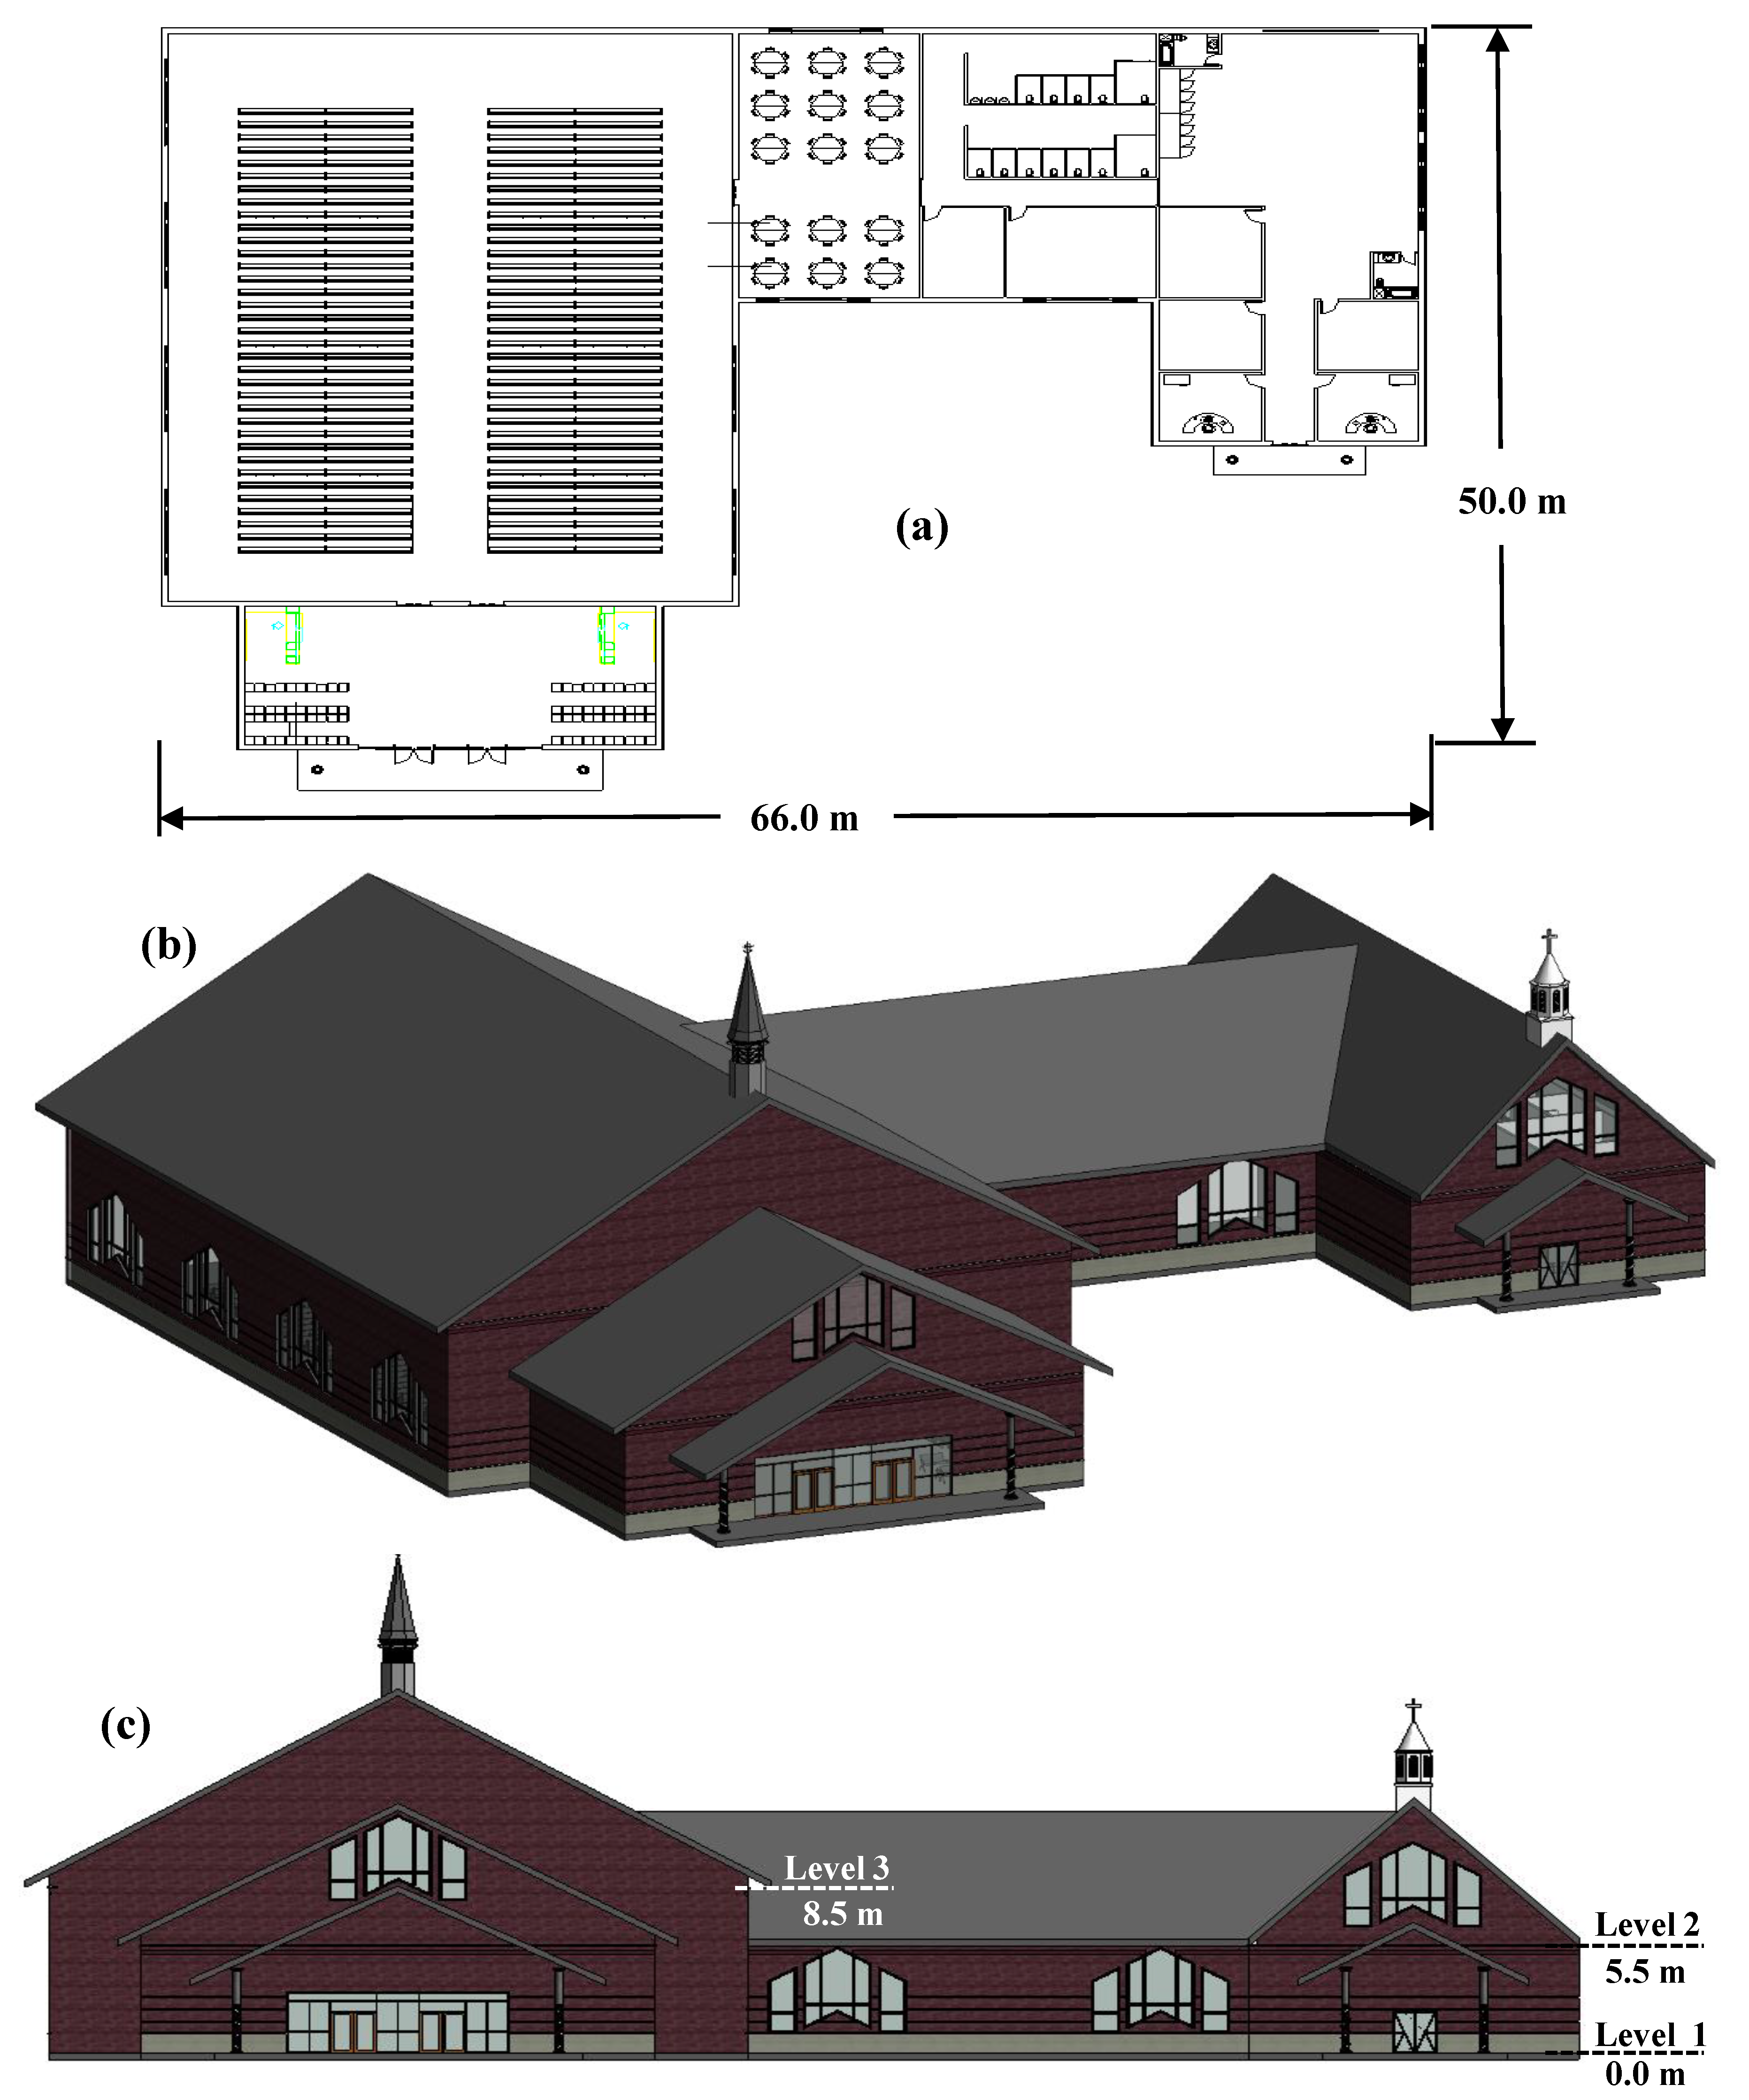
- F13: Community Center (Place of Worship)
The F13 archetype is considered a typical community center or place of worship with a U-shape (66 m × 50 m) and having a total area of 2350 m2 (25,300 ft2). This archetype could be assigned to any community center ranging from a small to a large floor plan with proper scaling based on building footprint. The structural system is a steel frame with steel studs along with exterior brick walls rested on a slab-on-grade foundation. The full interior design was developed based on on-site visits to community centers and churches.
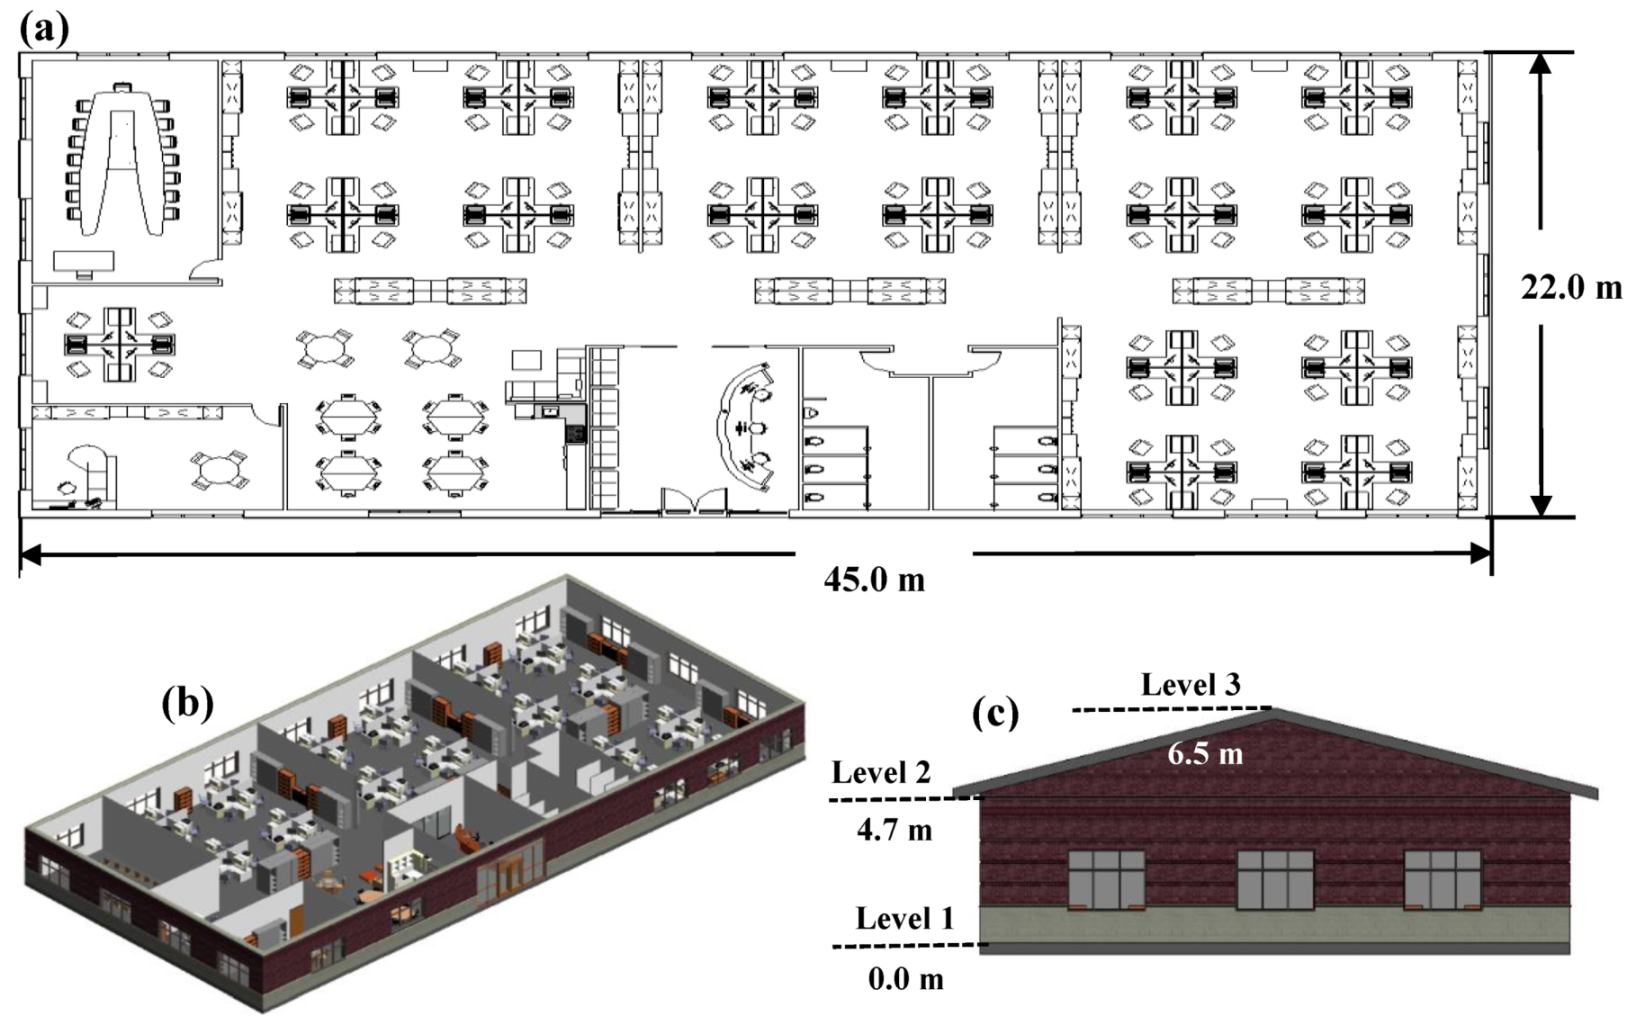
- F14: Office Building
A small office building with a rectangle shape (45.0 m × 22.0 m) having a total area of 990 m2 (10,656 ft2) is archetype F14. This archetype could be assigned to office buildings ranging from small to large floor plans with proper scaling based on building size. The structural system is a wood frame/masonry with wood studs along with exterior brick walls resting on a slab-on-grade foundation.
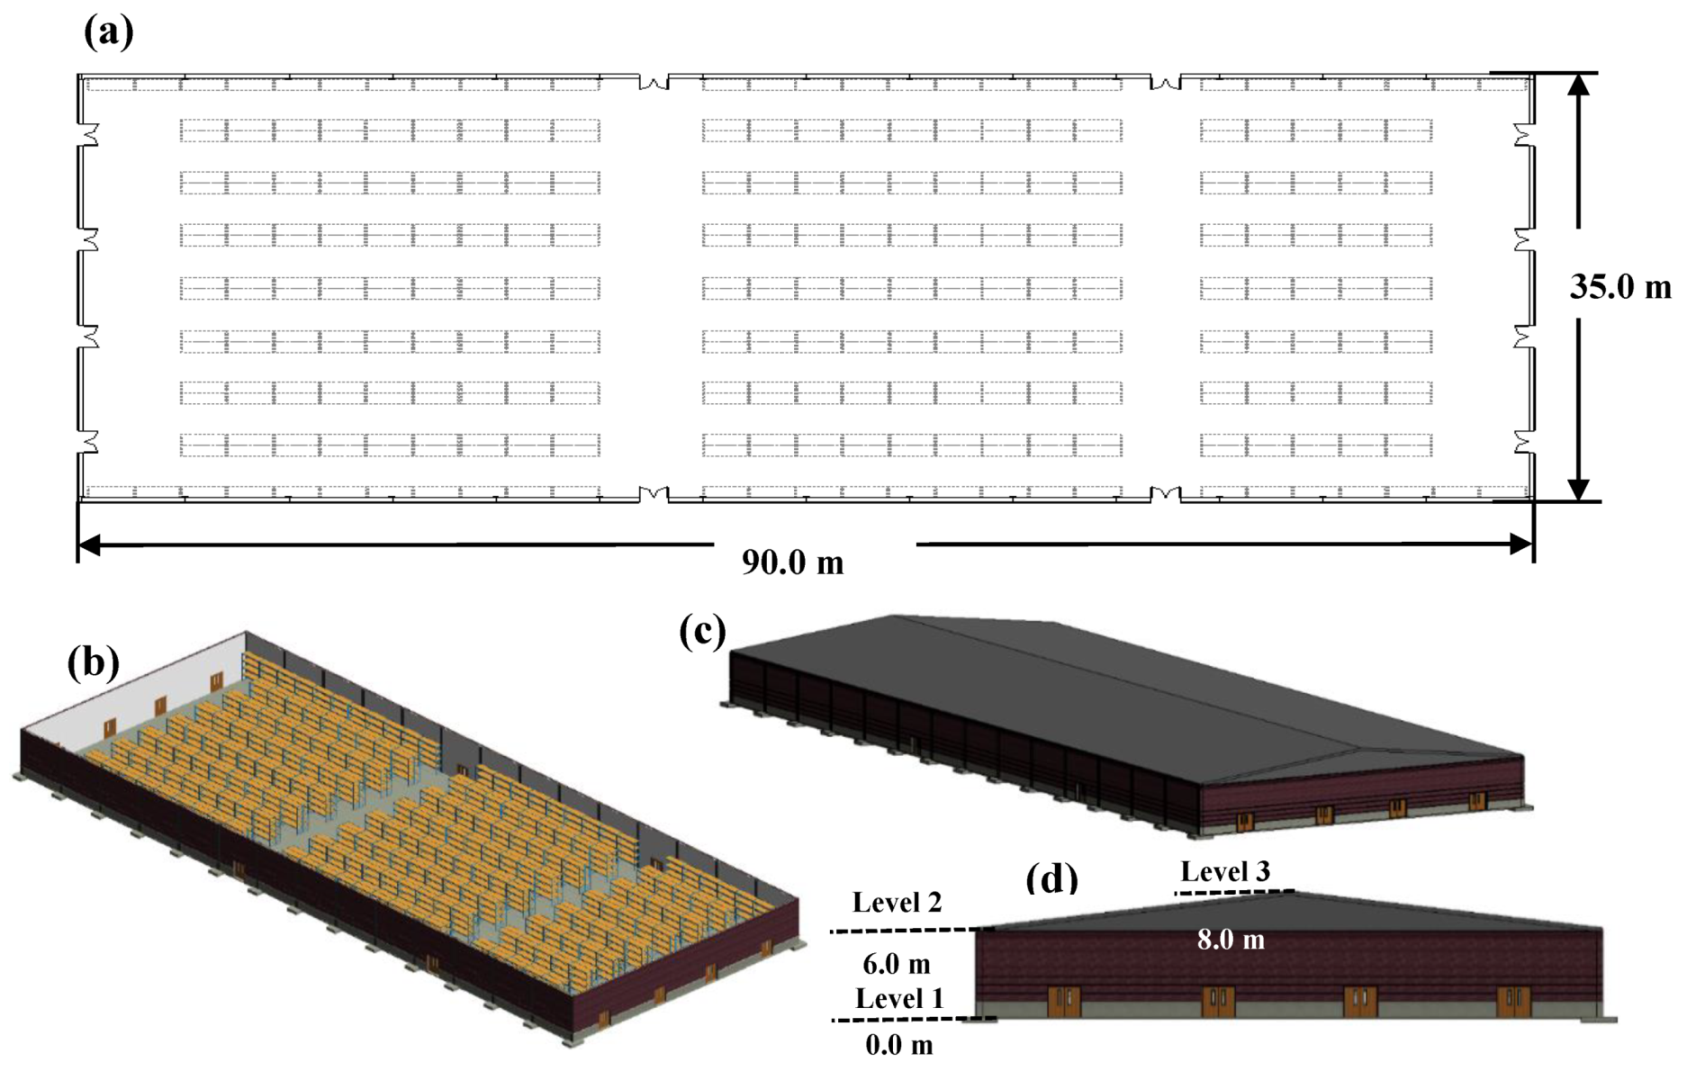
- F15: Warehouse (Small/Large Box)
The F15 archetype represents a medium-size warehouse (medium box building) with a rectangle shape (90.0 m × 35.0 m) having a total area of 3242 m2 (34,895 ft2). This archetype could be assigned to warehouses ranging from small to large size buildings with proper scaling based on building size. The structural system is a steel frame with steel studs along with exterior brick walls or corrugated steel sheets rested on a slab-on-grade foundation.
3. Results
Single-variable flood fragility and loss curves were developed for the whole building archetypes using flood depth as the sole flood damaging characteristic. Additionally, multi-variate flood fragility and loss surfaces were developed based on both flood depth and flood duration. Uncertainties in the components for each building archetype were propagated in terms of flood depth, flood duration, and replacement/repair cost using a series of MCS. A total of 1000 simulations were used to provide an acceptable level of smoothing for the developed curves/surfaces. Investigating 15 building archetypes resulted in a substantial amount of data, and subsequent figures, for components and buildings flood loss and fragility curves/surfaces. Therefore, the results section is organized such that a presentation of a specific results discussion for only one archetype as an example, and then general discussion for all building archetypes, are provided to show that the results are rational and in line with the discussion of the specific results.
3.1. Specific Results to F10: One-Story School Building Archetype
3.1.1. Components’ Fragility and Loss Results
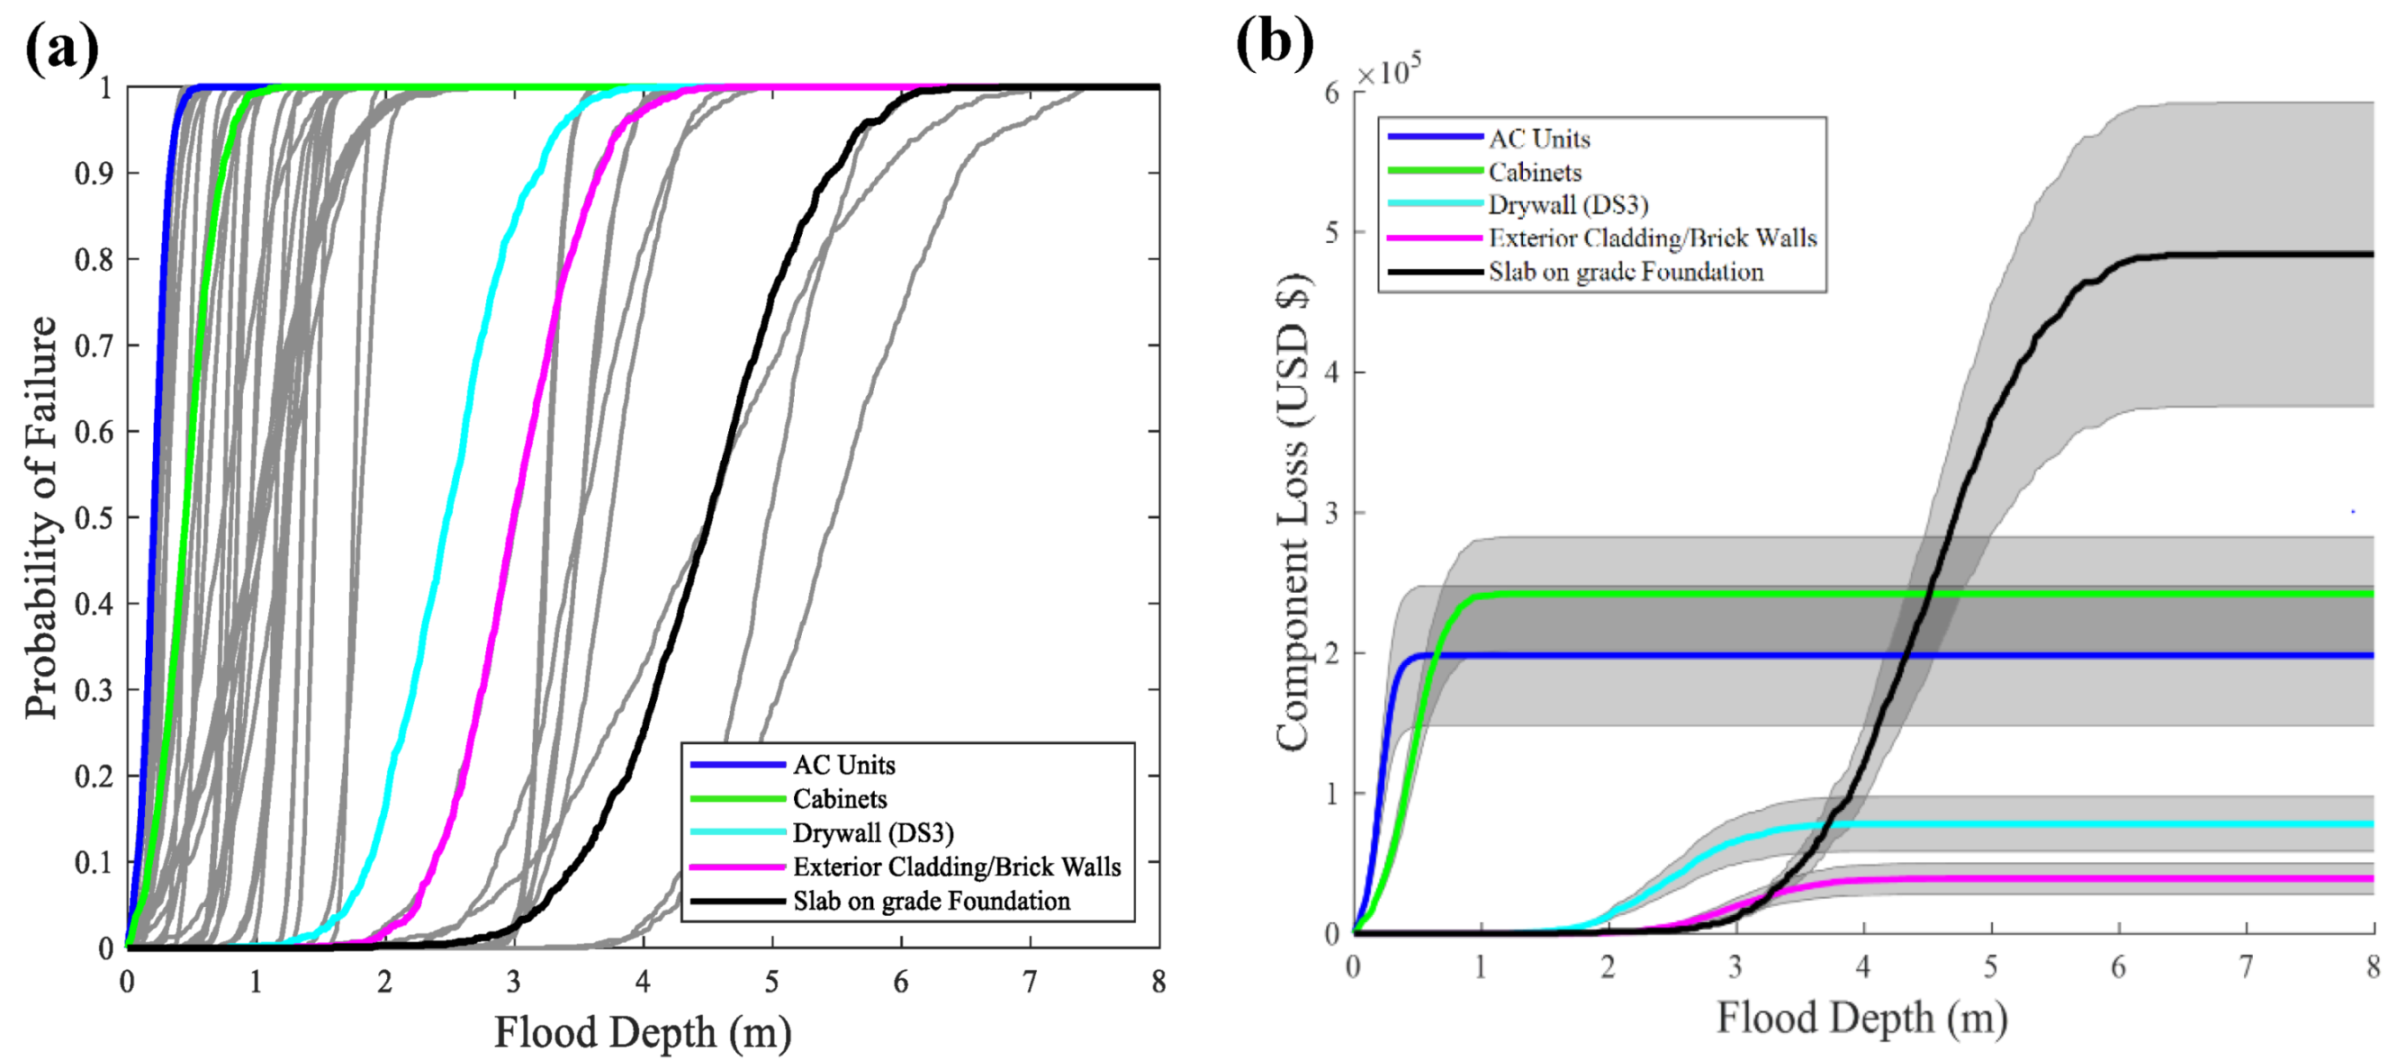
The F10 one-story school building archetype was divided into 60 components including school kitchen appliances, offices, and classroom interiors, non-structural components, and structural components. The failure probability and replacement cost for each component were calculated using flood depth only as an intensity measure to account for the single-variable flood fragility and loss functions. Figure 5a shows the fragility function for each component (60 components) within the F10 school building archetype along with highlighting five selected components in the legend. Figure 5b shows the mean flood loss curves along with one standard deviation shaded area for the five selected components. The component fragility and loss curves reveal the water sensitivity of the components as shown in Figure 5. There are multiple steep fragility curves in the range from 0.0 m up to 1.0 m, which indicates the water-sensitive components (e.g., stove, fridge, TV, etc.). The steeper the fragility/loss curve, the lower the variability in its damaging flood depth (less uncertainty), which is the case with the kitchen appliances and the offices and classrooms’ interiors. On the other hand, structural (and some non-structural) components have much higher variability in the flood damaging depth with less steep fragility/loss depending on the material, structure system, foundation type, etc.
3.1.2. 2-D Building Fragility and Loss Results
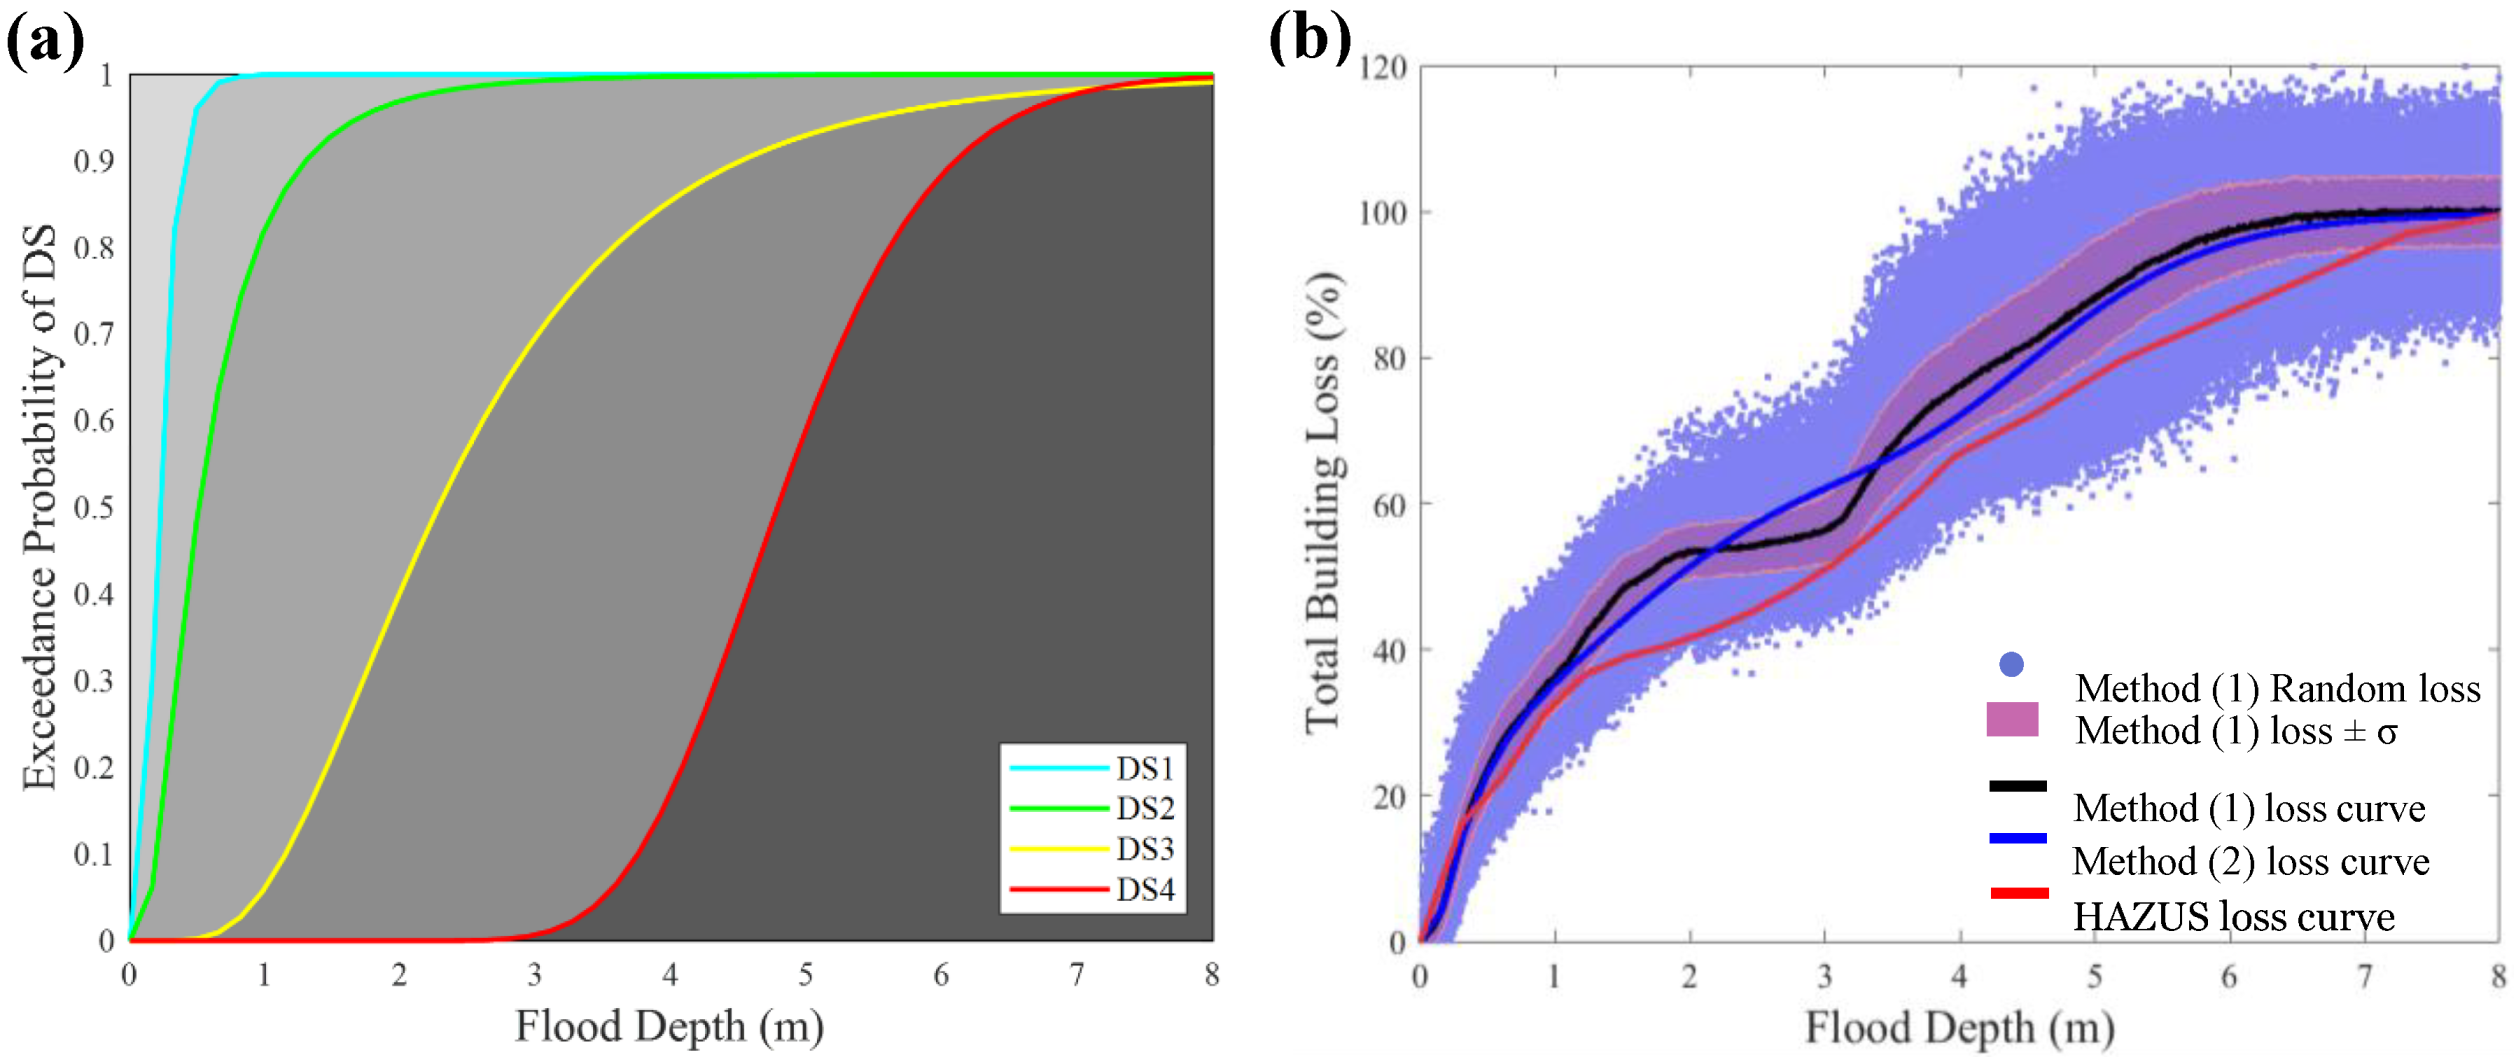
The building components were divided into five DSs based on their contribution to the building functionality. A MCS-based algorithm was developed to account for the exceedance probability of each DS at each intensity measure based on the criteria described in Table 1 and Table 2. The exceedance probability of each DS was calculated using Equation (5) and then lognormal fitted using Equation (6) as shown in Figure 6a. DS1 and DS2 include water-sensitive components with low variability in the value of the flood damaging depth, which explains their steeper slope. However, DS3 and DS4 include structural and non-structural components with high variability in their damaging flood depth, which explains their less steep fragility curves. Then, component-based flood losses (Method 1) were calculated by tracking the damaged components at each intensity measure for each random simulation, and then the losses for the damaged component are summed up to calculate the total flood loss for each specific simulation. The mean and standard deviation for the 1000 random simulations were calculated at each intensity measure as shown in Figure 6b. As mentioned earlier, a second flood loss method (Method 2) was investigated, which is based on the developed fragility curves and the replacement cost for each DS using Equation (7). The small difference between the direct and fragility-based flood loss curve is due to using the lognormal fitted fragility functions in developing the fragility-based flood loss curve. These resulting flood curves were then compared with the HAZUS stage–damage function [23] to provide some level of benchmarking and showed a good match.
3.1.3. 3-D Building Fragility and Loss Results
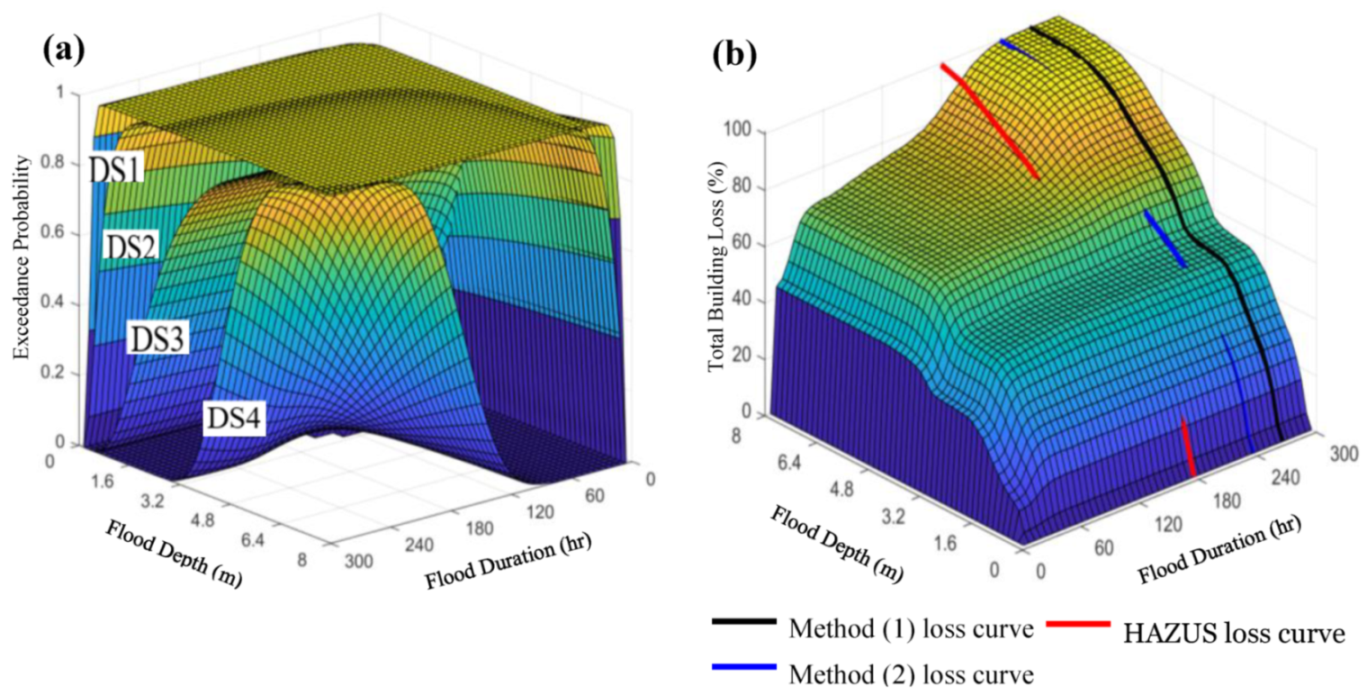
Flood duration was then included as a second damaging characteristic along with flood depth in a multi-variate formulation of flood losses. Each component was set to be damaged if its flood depth and flood duration resistance was exceeded. Then, procedures similar to the single-variable flood fragility and loss analysis were used to account for the failure probability (fragility) and the component loss for each component using a series of MCS for both flood depth resistance and flood duration resistance at each intensity measure. The components’ failure probabilities were then used to account for the exceedance probability of each DS. Figure 7a shows the exceedance probability of each DS in terms of fragility surfaces. Multi-variate component-based flood losses were calculated at each intensity measure as shown in Figure 7b. The 2D loss curves were then projected on the 3D loss surfaces to indicate the impact of flood duration on the total amount of building flood losses.
3.2. General Results for the Whole 15 Building Archetypes
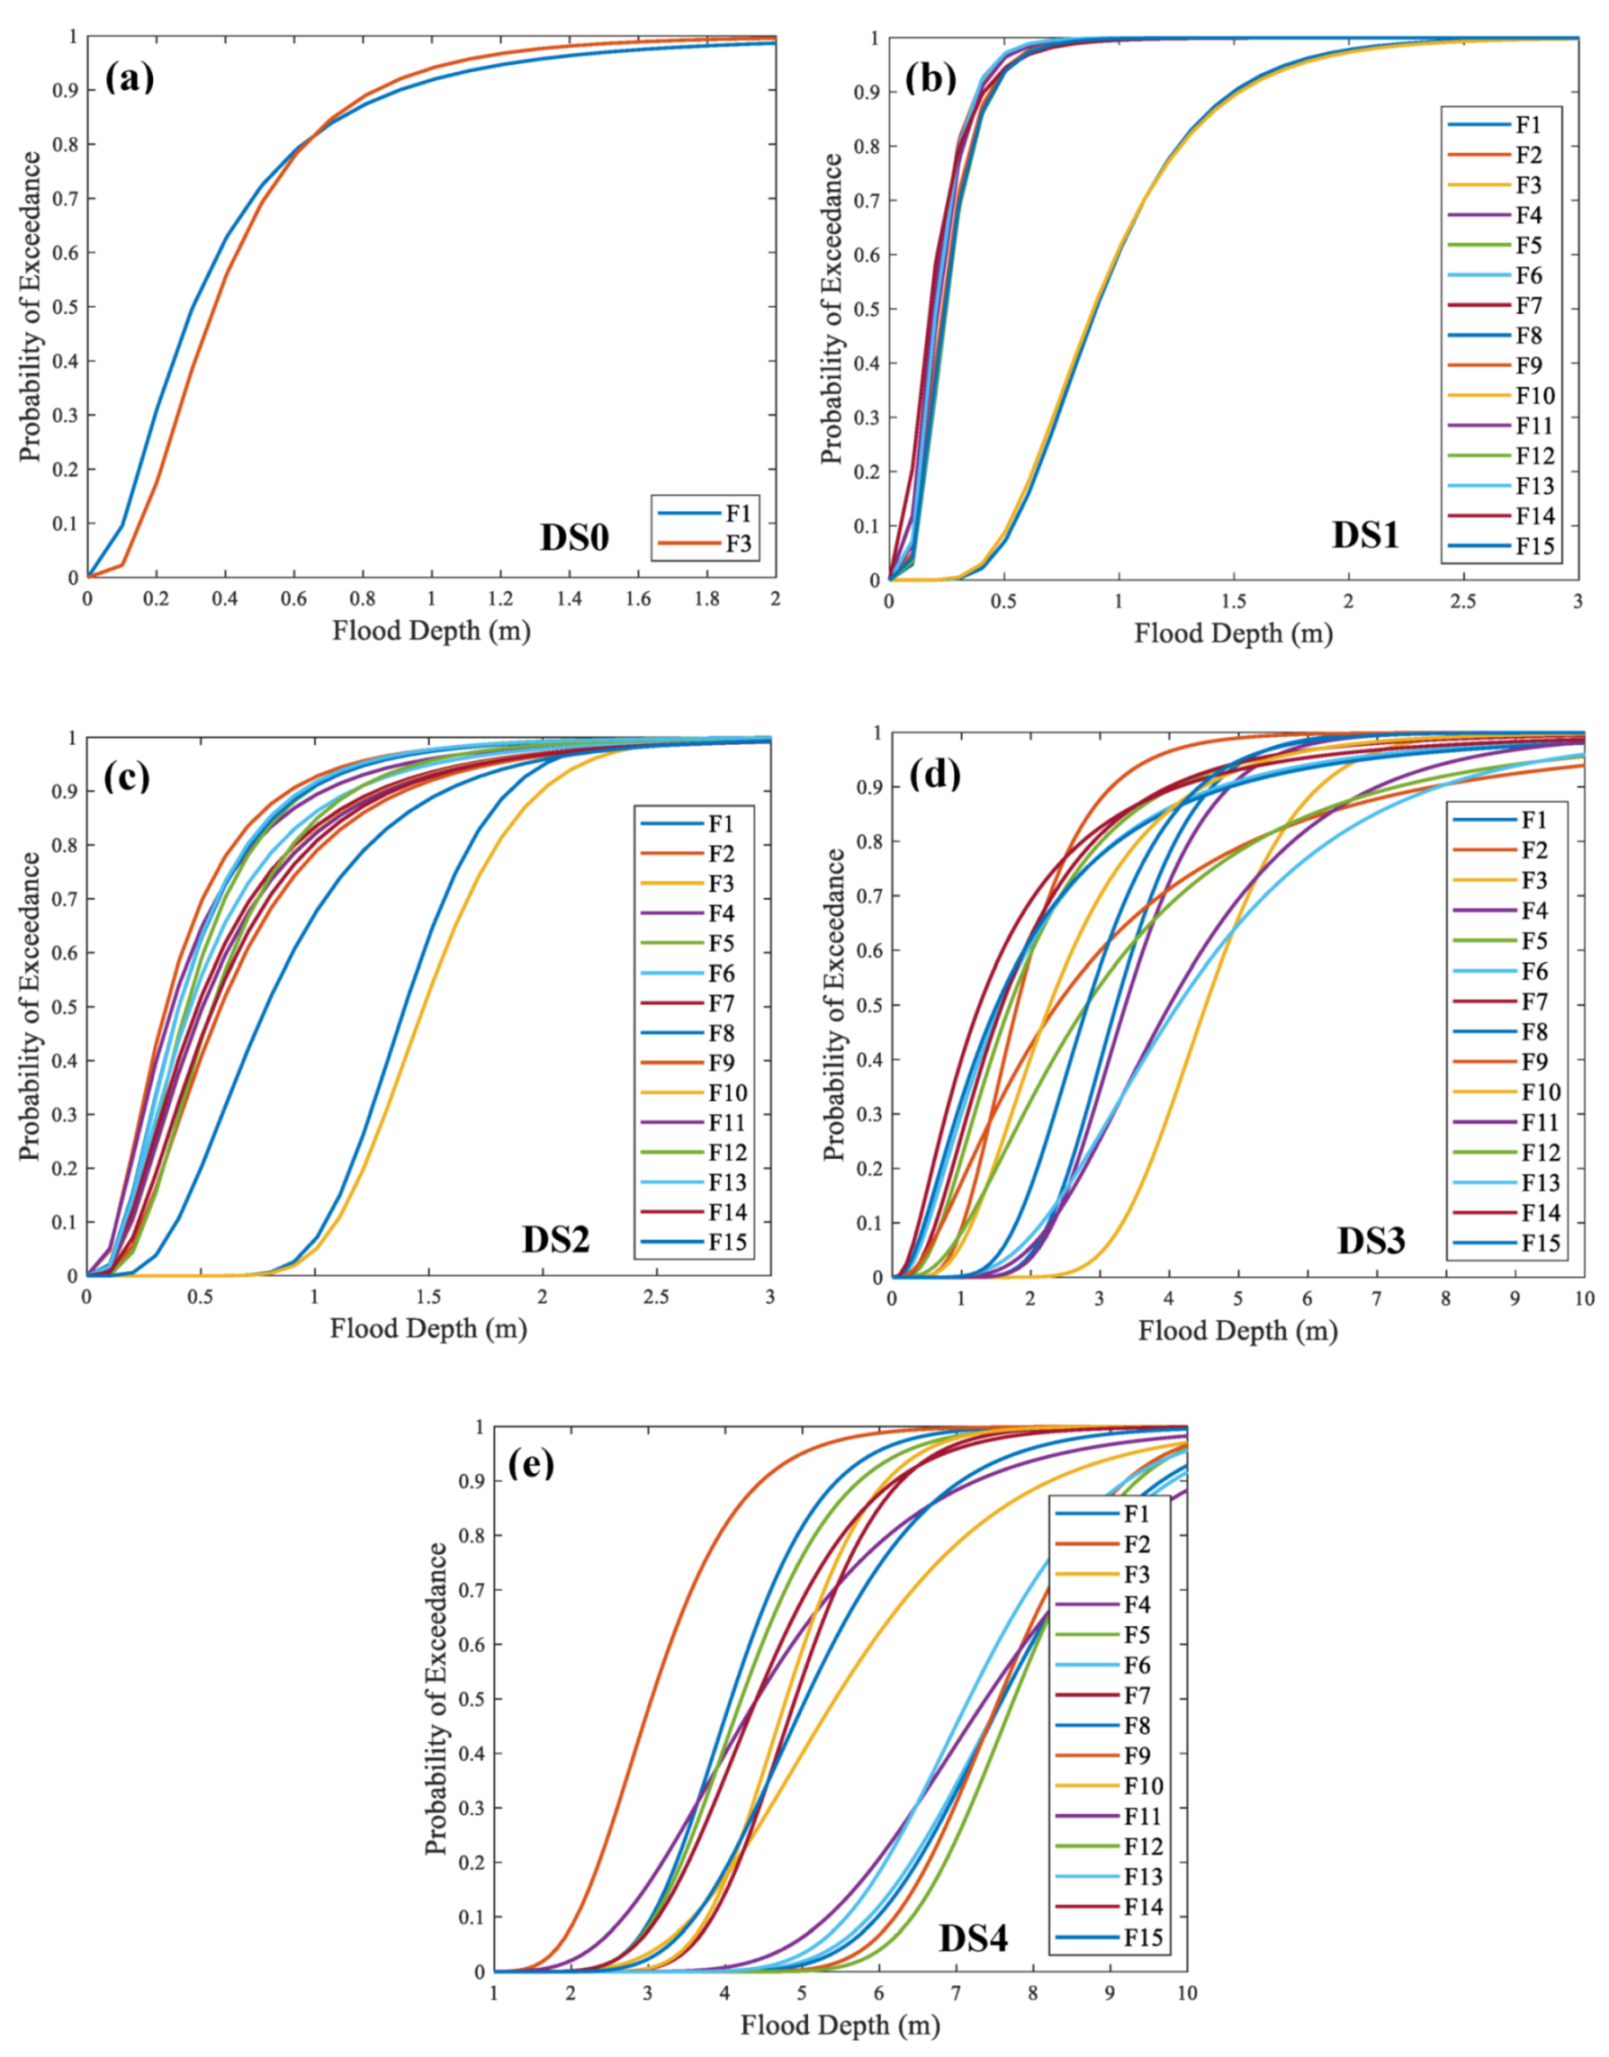
The same procedures described above were applied to the 15 building archetypes to account for the components and develop the 2D and 3D flood fragility and loss functions. Table 4 shows the lognormal parameters for the developed 2-D fragility functions for each building archetype. Figure 8 shows the lognormal fitted fragility curves for the 15 building archetypes for each DS. It should be mentioned that DS0 only exists for archetypes with a crawlspace foundation, which are archetypes F1 and F3. For all building archetypes, flood depth is measured from FFE. However, for the archetypes with crawl space foundation, flood depth is measured from ground elevation and the FFE is assumed to be at 1.0 m from the ground elevation, which explains why DS1 and DS2 for archetypes F1 and F3 are shifted from the suit of fragilities. Detailed results in terms of six figures for each building archetype (component fragility curves, total building fragility curves, selected components’ loss curves, total building loss curves, total building fragility surfaces, and total building loss surface) are provided in Appendix B with this paper. The resulting fragility and loss functions including the 2-D and 3-D functions are organized into user-friendly matrices such that they can be easily used by researchers or be read by any algorithm to account for flood damage/loss at any intensity measure for any building archetype. This output data for these fragilities and loss functions are provided with this article to enable reproduction based on our findings. A brief discussion of these fragility and loss functions will be provided to enable the readers to better understand the rationality of the results.
The results revealed that residential buildings’ damage (fragility curves) does not depend on the occupancy (whether it is single-family or multi-family). This is because damage criteria only depend on the component type (e.g., furniture, appliances, structural and non-structural components, etc.), which are the same for both occupancies but with different component numbers. However, multi-family buildings exhibit more losses than single-family, as flood losses are on the order of the number of components included within each building. Another factor that affects damage and losses is the foundation type (e.g., crawlspace, slab-on-grade, etc.). The analysis shows that buildings with a crawlspace foundation are more vulnerable than the building with a slab-on-grade foundation. This looks rational due to the additional damage to the components below the FFE within the crawlspace area, such as ductwork.
DS1 for all building archetypes is very close in their values to one another due to the similarities in terms of the components within this DS, which is the same case for DS0, and DS2, as shown in Figure 8a–c. However, archetypes F1 and F3 are shifted because flood depth is measured from the ground elevation. For DS3 and DS4, there is much higher variability in the fragility curves between building archetypes, as shown in Figure 8d,e, which is highly controlled by the type and the elevation of the components for each building archetype. The different building heights for each building archetype (for both one- and two-story buildings) allows more components to be located at a higher elevation including interior contents, structural, and non-structural components. Generally, building fragility curves for DS0, DS1, and DS2 are steeper than fragility curves for DS3, and DS4. This can be explained such that most components within DS0, DS1, and DS2 are water-sensitive components (e.g., carpet, insulation, appliances, machinery, electronics, furniture, etc.). This is also evident from the component fragility curves presented in Appendix B, which show that many component fragility curves are encompassed in the first 1.0 m damage range (0.0–1.0 m), which is the depth range for water-sensitive components to be damaged. For two-story archetypes, this damage range will be repeated for the second story with the damage range occurring in depths from 3.2 m up to 4.2 m. For DS3 and DS4, fragility curves are less steep with a larger damage range as shown in Figure 8d,e. This can be explained by the fact that the structural and some non-structural components are non-water sensitive and may be salvageable after being submerged in water, which imposes a large uncertainty in their damaging range. This appears clear upon inspection of the component fragility curves, which have a larger depth range to be fully damaged including framing and the foundation.
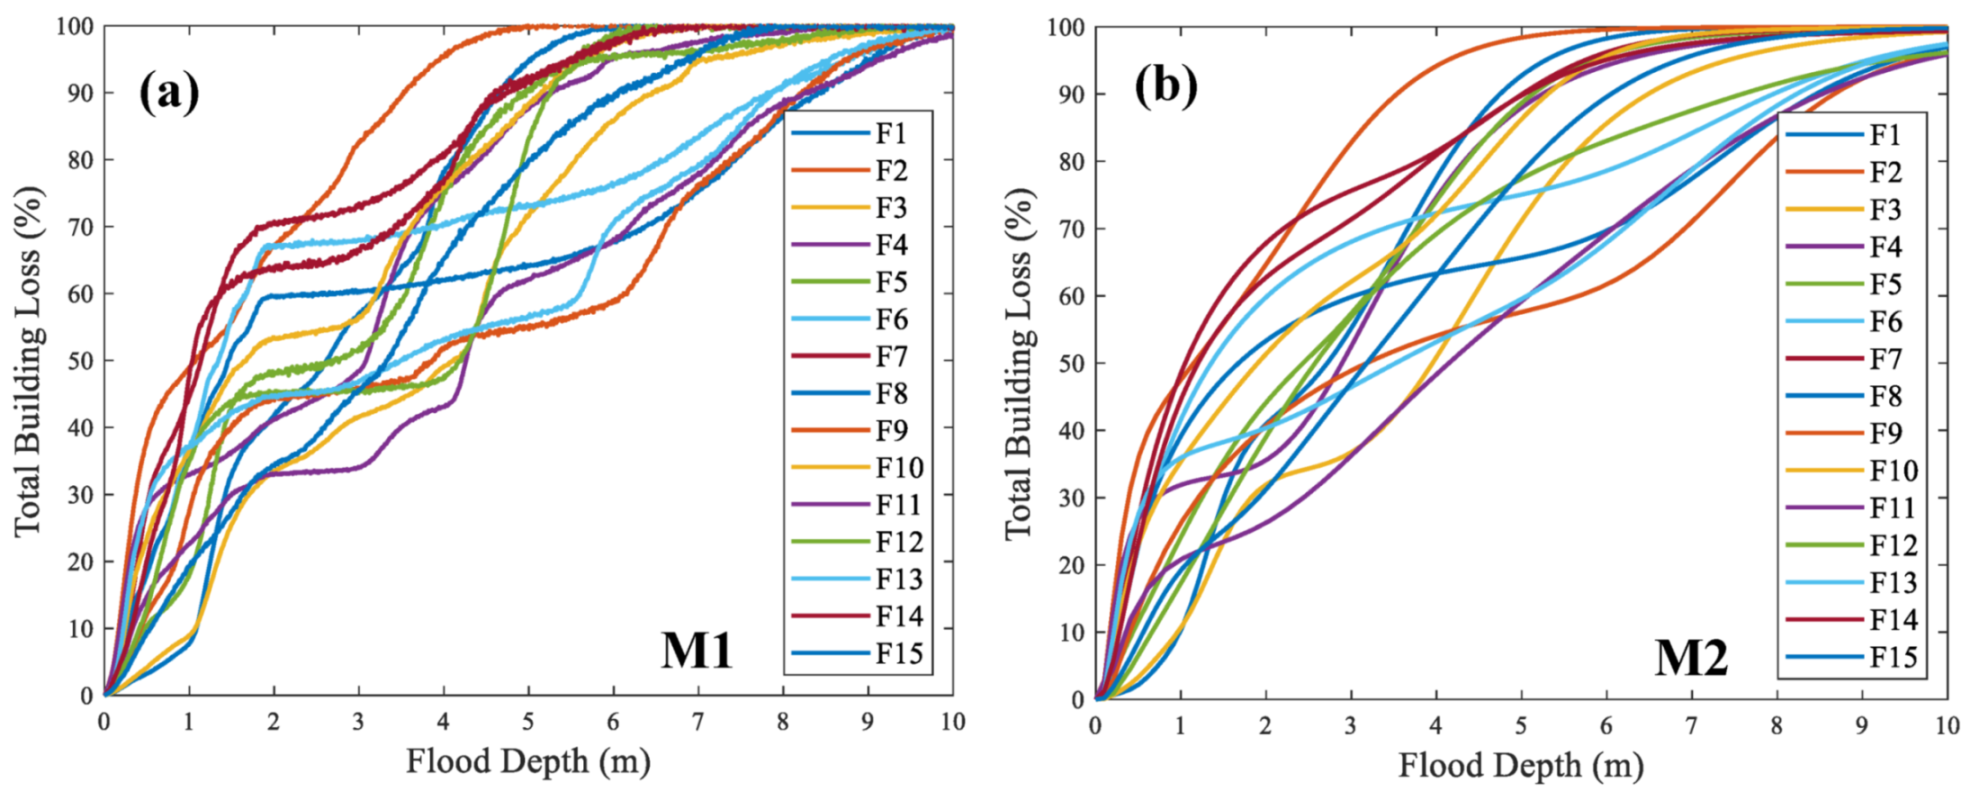
For flood losses, the replacement/repair cost in terms of the mean and standard deviation of the replacement/repair cost for each DS was calculated in an absolute and normalized form as shown in Table 5. This enabled the development of loss functions for the suite of 15 building archetypes using the direct approach and the fragility-based loss approach. The observed difference between the direct and the fragility-based loss approach results from using the lognormal fitted fragilities in deriving the fragility-based flood losses as discussed in Section 3.1.2. However, this difference is minor, as shown in the loss figures in Appendix B, and the fragility approach can be used to assess both damage and loss with acceptable accuracy. Figure 9 shows the flood loss curves for each building archetype using both the direct loss approach (Figure 9a) and the fragility-based loss approach (Figure 9b). Both fragility-based and direct flood loss methods were compared with the HAZUS stage–damage function and showed a good match for almost all building archetypes. However, almost all of the HAZUS stage–damage functions stop short of 100% losses for complete damage, whereas those in the current study do reach 100%, as shown in the loss figures in Appendix B. This is because HAZUS stage–damage functions [23] for the foundation and structure subassembly only reach 20% and 42% damage ratio, respectively.
Most of the building archetypes showed a high dependency on flood duration, and neglecting such a parameter would affect flood loss calculations, as shown in the fragility and loss surfaces in Appendix B. It should be noted that water contamination was not accounted for in any of the analyses and could alter the ability to dry building (and other) components. The 2D flood loss functions developed herein consider a component to be damaged if the water level reaches its damaging depth regardless of water duration, which is not accurate for the water non-sensitive components. Therefore, 3-D loss functions consider a component to be damaged if the water level reaches its damaging depth along with the component-damaging duration. Considering flood duration enhances the accuracy of the fragilities, albeit complicating the analysis. For the hospital archetype (F12), the building’s total value is dominated by the essential hospital facilities, representing more than 80% of the total building replacement cost. The hospital’s essential facilities are water-sensitive components with an average duration resistance of 1 h, which makes fragility and loss surface less dependent on flood duration and highly dependent on flood depth.
4. Summary and Conclusions
The development of flood fragilities for buildings is a challenge because of the limited availability of flood-related data at the component level, particularly statistics. Therefore, a component-based method was used to develop fragility and loss functions for a portfolio of building archetypes. These building archetypes are minimized such that they can represent a community’s residential sector, business sector, and its social institutions. The analysis included the use of a single-variable (depth) and multi-variate (depth and duration) flood fragility and loss functions. Buildings within a community were divided into 15 building archetypes based on the occupancy of each building. A probabilistic flood vulnerability model (fragility and loss function) for each one of these building archetypes was developed and presented in this paper. The loss analysis results for the direct loss method and the fragility-based loss method were compared to HAZUS stage–damage functions for each building archetype, which showed a good match for almost all of the building archetypes. The 2D loss curves were overlaid on the 3-D loss surfaces to highlight the impact of flood duration on the total amount of flood losses. The main contribution of this work is the development of an archival suite of fragility curves/surfaces that can be used in a community-level model to populate building stock. Subsequent analyses could range from flood risk management to community resilience studies, such as investigating the effects of increasing the requirement for buildings’ FFE above the base flood elevation or adding a protective berm, flood gate, or levee. The fragilities are built based on component analysis, which does not require field studies, making the suite extensible for other researchers working in this area. Finally, flood mitigation analysis at the single building level could also be investigated to inform the impacts of modifying or altering components on the whole building damage/loss.
Supplementary Materials
The following are available online at https://www.mdpi.com/2073-4441/12/8/2277/s1, all data is provided.
Author Contributions
O.M.N. built the initial concept of this work, formulated the idea, conducted the whole analysis under the supervision of J.W.v.d.L., O.M.N. wrote the initial version of this manuscript, which was further refined and edited by J.W.v.d.L. All authors have read and agreed to the published version of the manuscript
Funding
This research was funded by the National Institute of Standards and Technology (NIST) Center of Excellence for Risk-Based Community Resilience Planning through a cooperative agreement with Colorado State University [70NANB20H008 and 70NANB15H044] and The APC was funded by the Harold H. Short Endowed Chair Professor funds at Colorado State University.
Acknowledgments
The contents expressed in this paper are the views of the authors and do not necessarily represent the opinions or views of NIST or the U.S Department of Commerce.
Conflicts of Interest
The authors declare no conflict of interest.
Appendix A
- F1: One-Story Single-Family Residential Building
Figure A1.
F1 archetype plans and sections: (a) Plan view; (b) 3-D view; (c) Front view; (d) Side view.
Figure A1.
F1 archetype plans and sections: (a) Plan view; (b) 3-D view; (c) Front view; (d) Side view.

- F2: One-Story Multi-Family Residential Building
Figure A2.
F2 archetype plans and sections: (a) Front view; (b) Plan view.

- F3: Two-Story Single-Family Residential Building
Figure A3.
F3 archetype plans and sections: (a) First-story plan view; (b) Second-story plan view; (c) First-story 3-D view; (d) Second-story 3-D view; (e) Building 3-D view.
Figure A3.
F3 archetype plans and sections: (a) First-story plan view; (b) Second-story plan view; (c) First-story 3-D view; (d) Second-story 3-D view; (e) Building 3-D view.

- F4: Two-Story Multi-Family Residential Building
Figure A4.
F4 archetype plans and sections: (a) Plan view; (b) 3-D view; (c) Side view.

- F5: Small Grocery Store/Gas Station with a Convenience Store
Figure A5.
F5 archetype plans and sections: (a) Plan view; (b) 3-D view for the store; (c) 3-D view for the whole gas station.
Figure A5.
F5 archetype plans and sections: (a) Plan view; (b) 3-D view for the store; (c) 3-D view for the whole gas station.

- F6: Multi-Unit Retail Building (Strip Mall)
Figure A6.
F6 archetype plans and views: (a) Plan view; (b) 3-D view.

- F7: Small Multi-Unit Commercial Building
Figure A7.
F7 archetype plans and views: (a) Plan view; (b) 3-D view.

- F8: Super Retail Center
Figure A8.
F8 archetype plans and sections: (a) Plan view; (b) Side view for the store; (c) 3-D view for the whole Market.
Figure A8.
F8 archetype plans and sections: (a) Plan view; (b) Side view for the store; (c) 3-D view for the whole Market.

- F9: Industrial Building
Figure A9.
F9 archetype plans and sections: (a) Plan view; (b) 3-D view for the industrial building; (c) Side view.
Figure A9.
F9 archetype plans and sections: (a) Plan view; (b) 3-D view for the industrial building; (c) Side view.

- F11: Two-Story School
Figure A10.
F11 archetype plans and sections: (a) Plan view; (b) 3-D view for the interior of the school; (c) 3-D view for the whole school.
Figure A10.
F11 archetype plans and sections: (a) Plan view; (b) 3-D view for the interior of the school; (c) 3-D view for the whole school.

- F12: Hospital/Clinic
Figure A11.
F12 archetype plans and sections: (a) Plan view; (b) 3-D view for the interior of the hospital; (c) 3-D view for the whole hospital.
Figure A11.
F12 archetype plans and sections: (a) Plan view; (b) 3-D view for the interior of the hospital; (c) 3-D view for the whole hospital.

- F13: Community Center (Church)
Figure A12.
F13 archetype plans and sections: (a) Plan view; (b) 3-D view for the church; (c) Side view for the whole church.
Figure A12.
F13 archetype plans and sections: (a) Plan view; (b) 3-D view for the church; (c) Side view for the whole church.

- F14: Office Building
Figure A13.
F14 archetype plans and sections: (a) Plan view; (b) 3-D views for the office building; (c) Side view.
Figure A13.
F14 archetype plans and sections: (a) Plan view; (b) 3-D views for the office building; (c) Side view.

- F15: Warehouse (Small/Large Box)
Figure A14.
F15 archetype plans and sections: (a) Plan view; (b,c) 3-D views for the warehouse; (d) Side view for the warehouse.
Figure A14.
F15 archetype plans and sections: (a) Plan view; (b,c) 3-D views for the warehouse; (d) Side view for the warehouse.

Appendix B
- F1: One-Story Single-Family Residential Building
Figure A15.
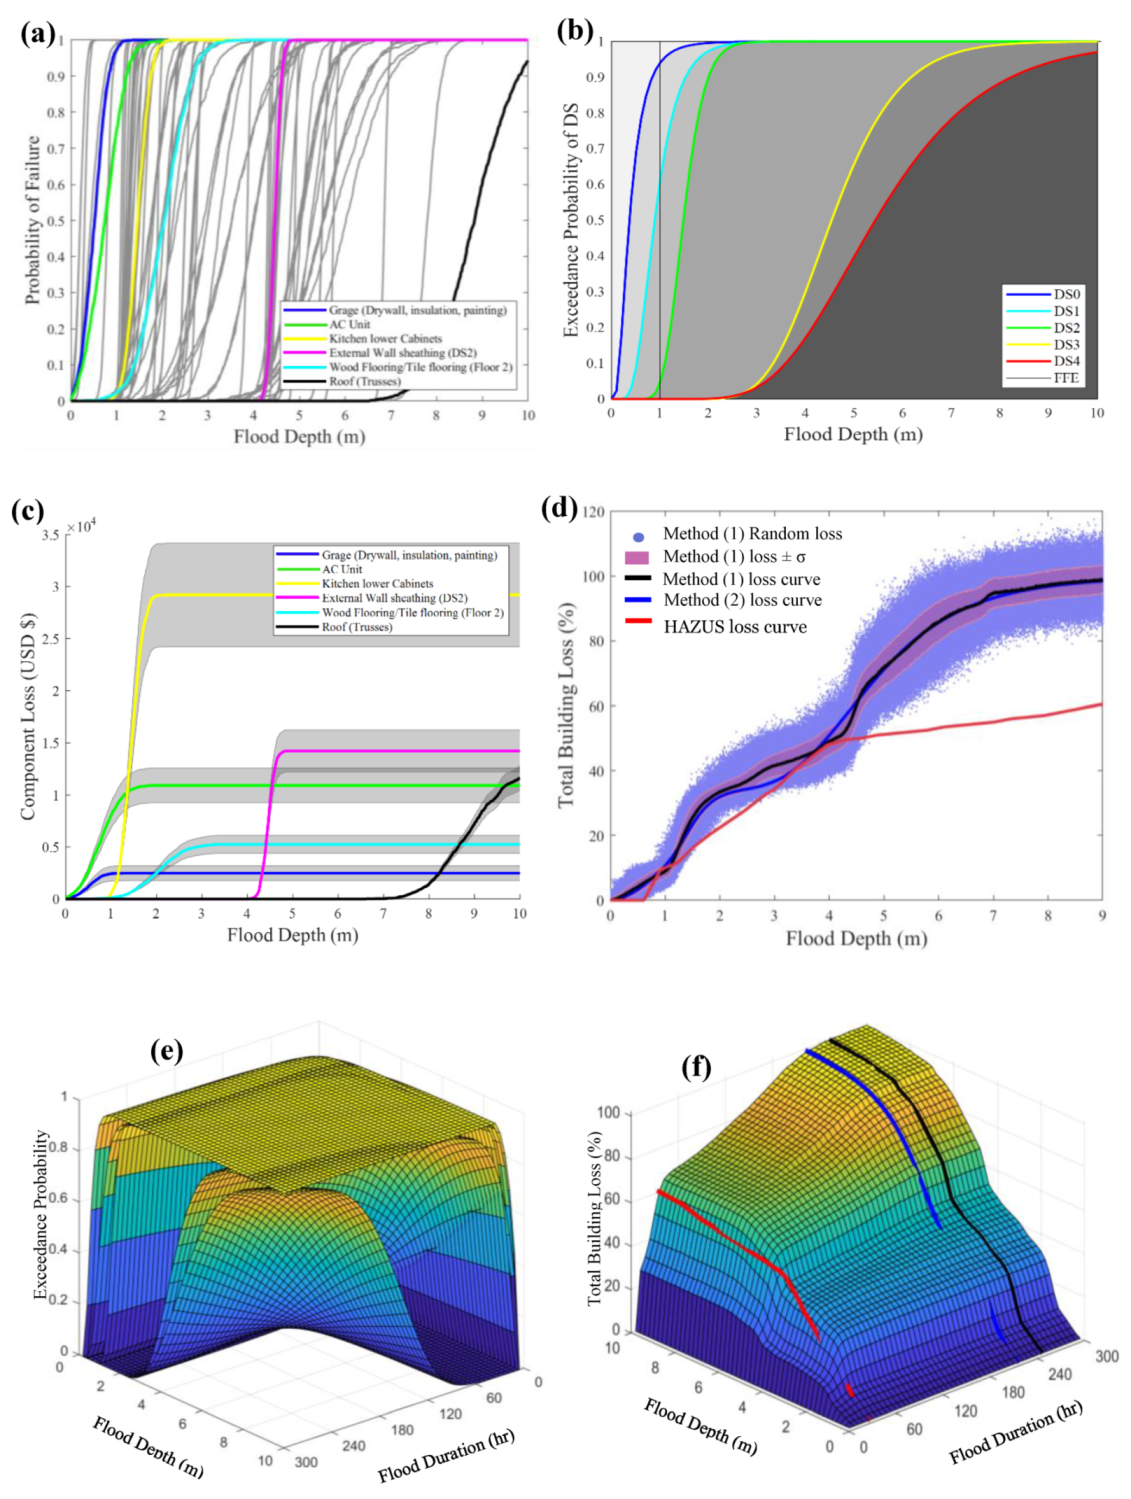
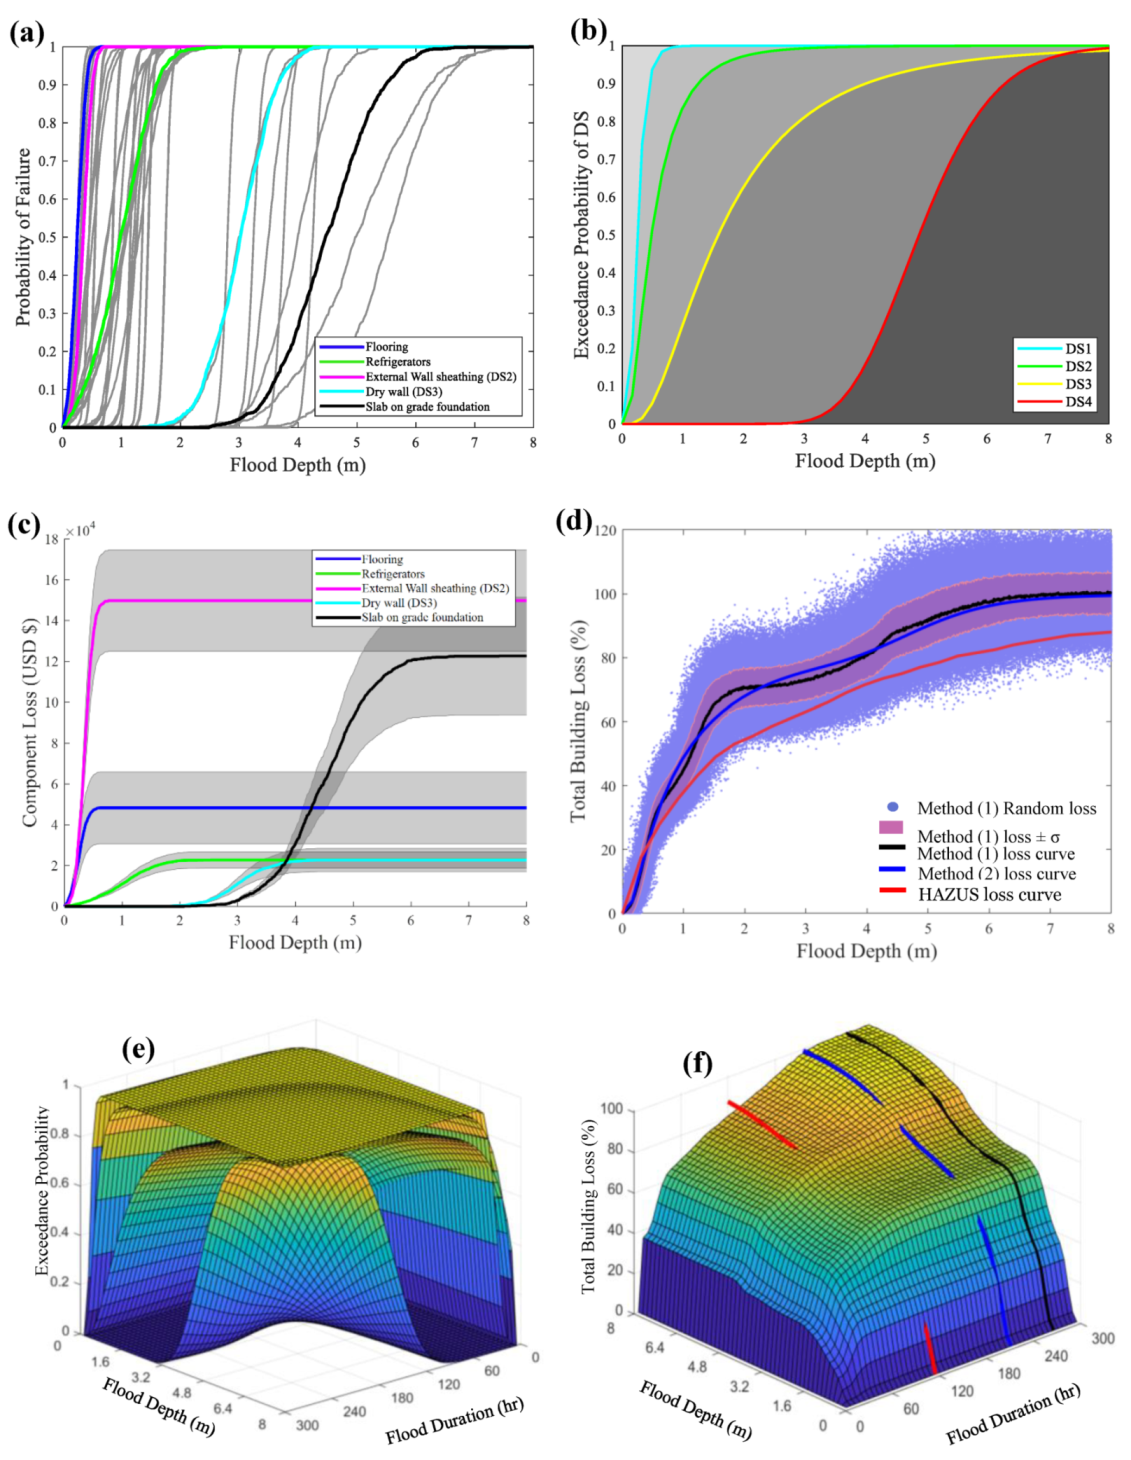
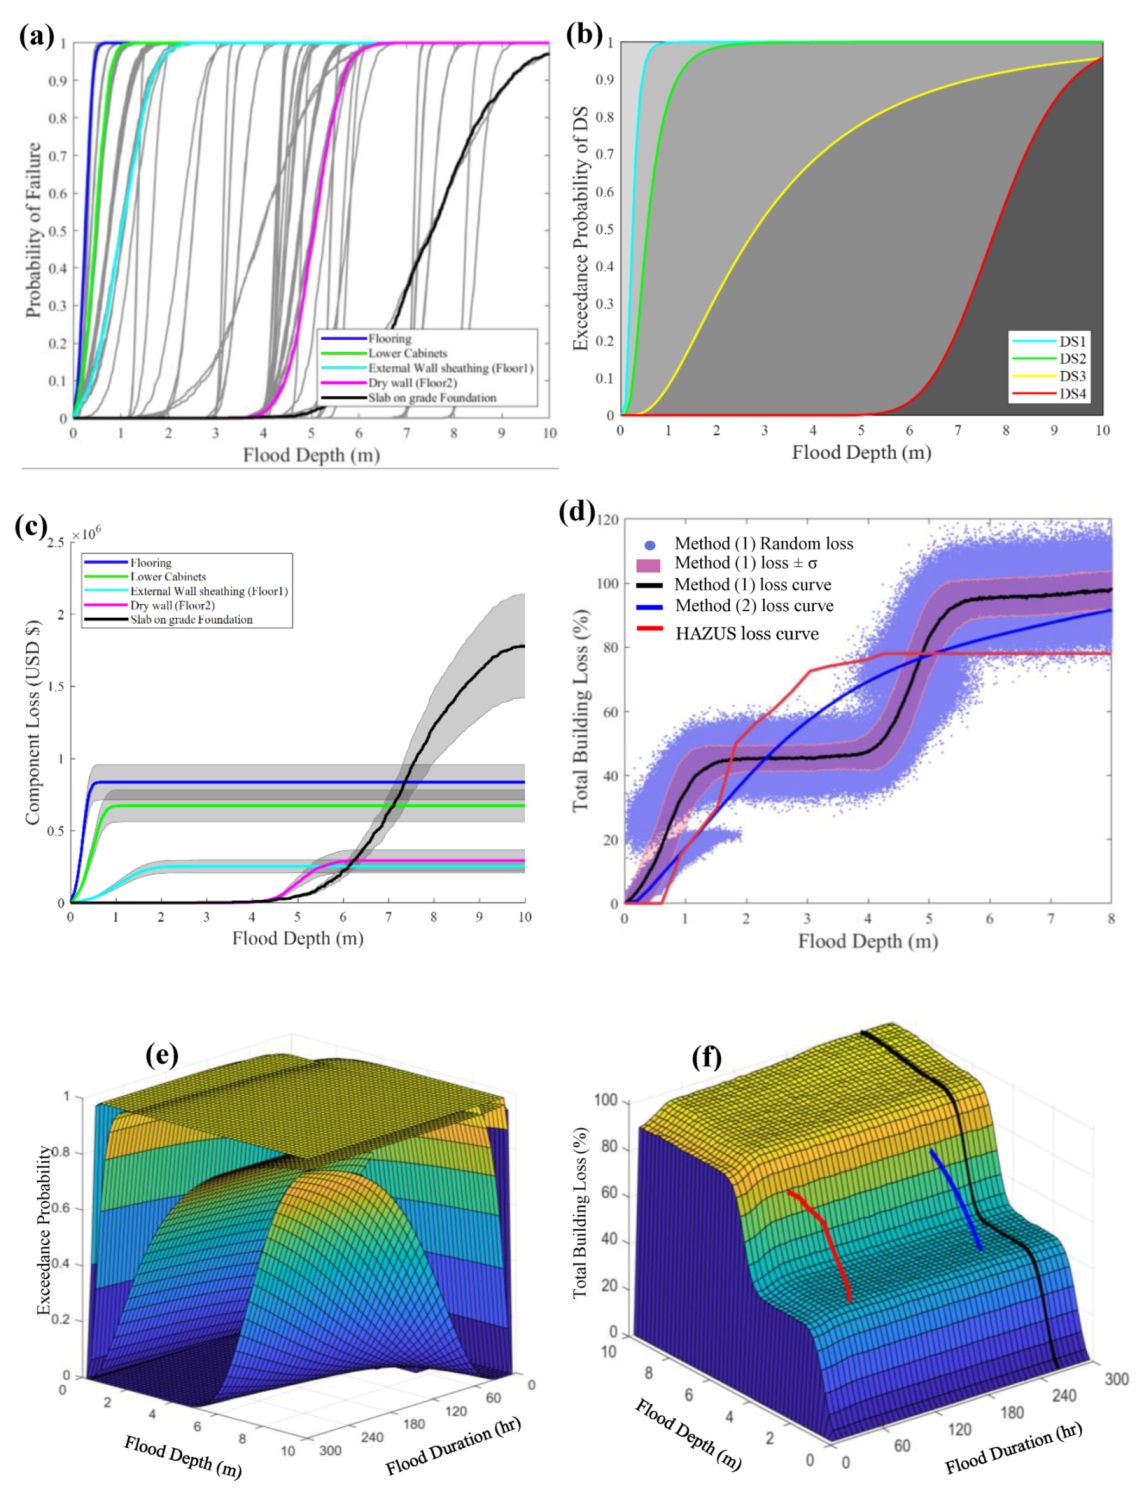
F1 archetype analysis results: (a) Component fragility curves; (b) Building fragility curves; (c) Selected components’ loss curves; (d) Building loss curves; (e) Building fragility surfaces; (f) Building loss surface.
Figure A15.
F1 archetype analysis results: (a) Component fragility curves; (b) Building fragility curves; (c) Selected components’ loss curves; (d) Building loss curves; (e) Building fragility surfaces; (f) Building loss surface.

- F2: One-Story Multi-Family Residential Building
Figure A16.
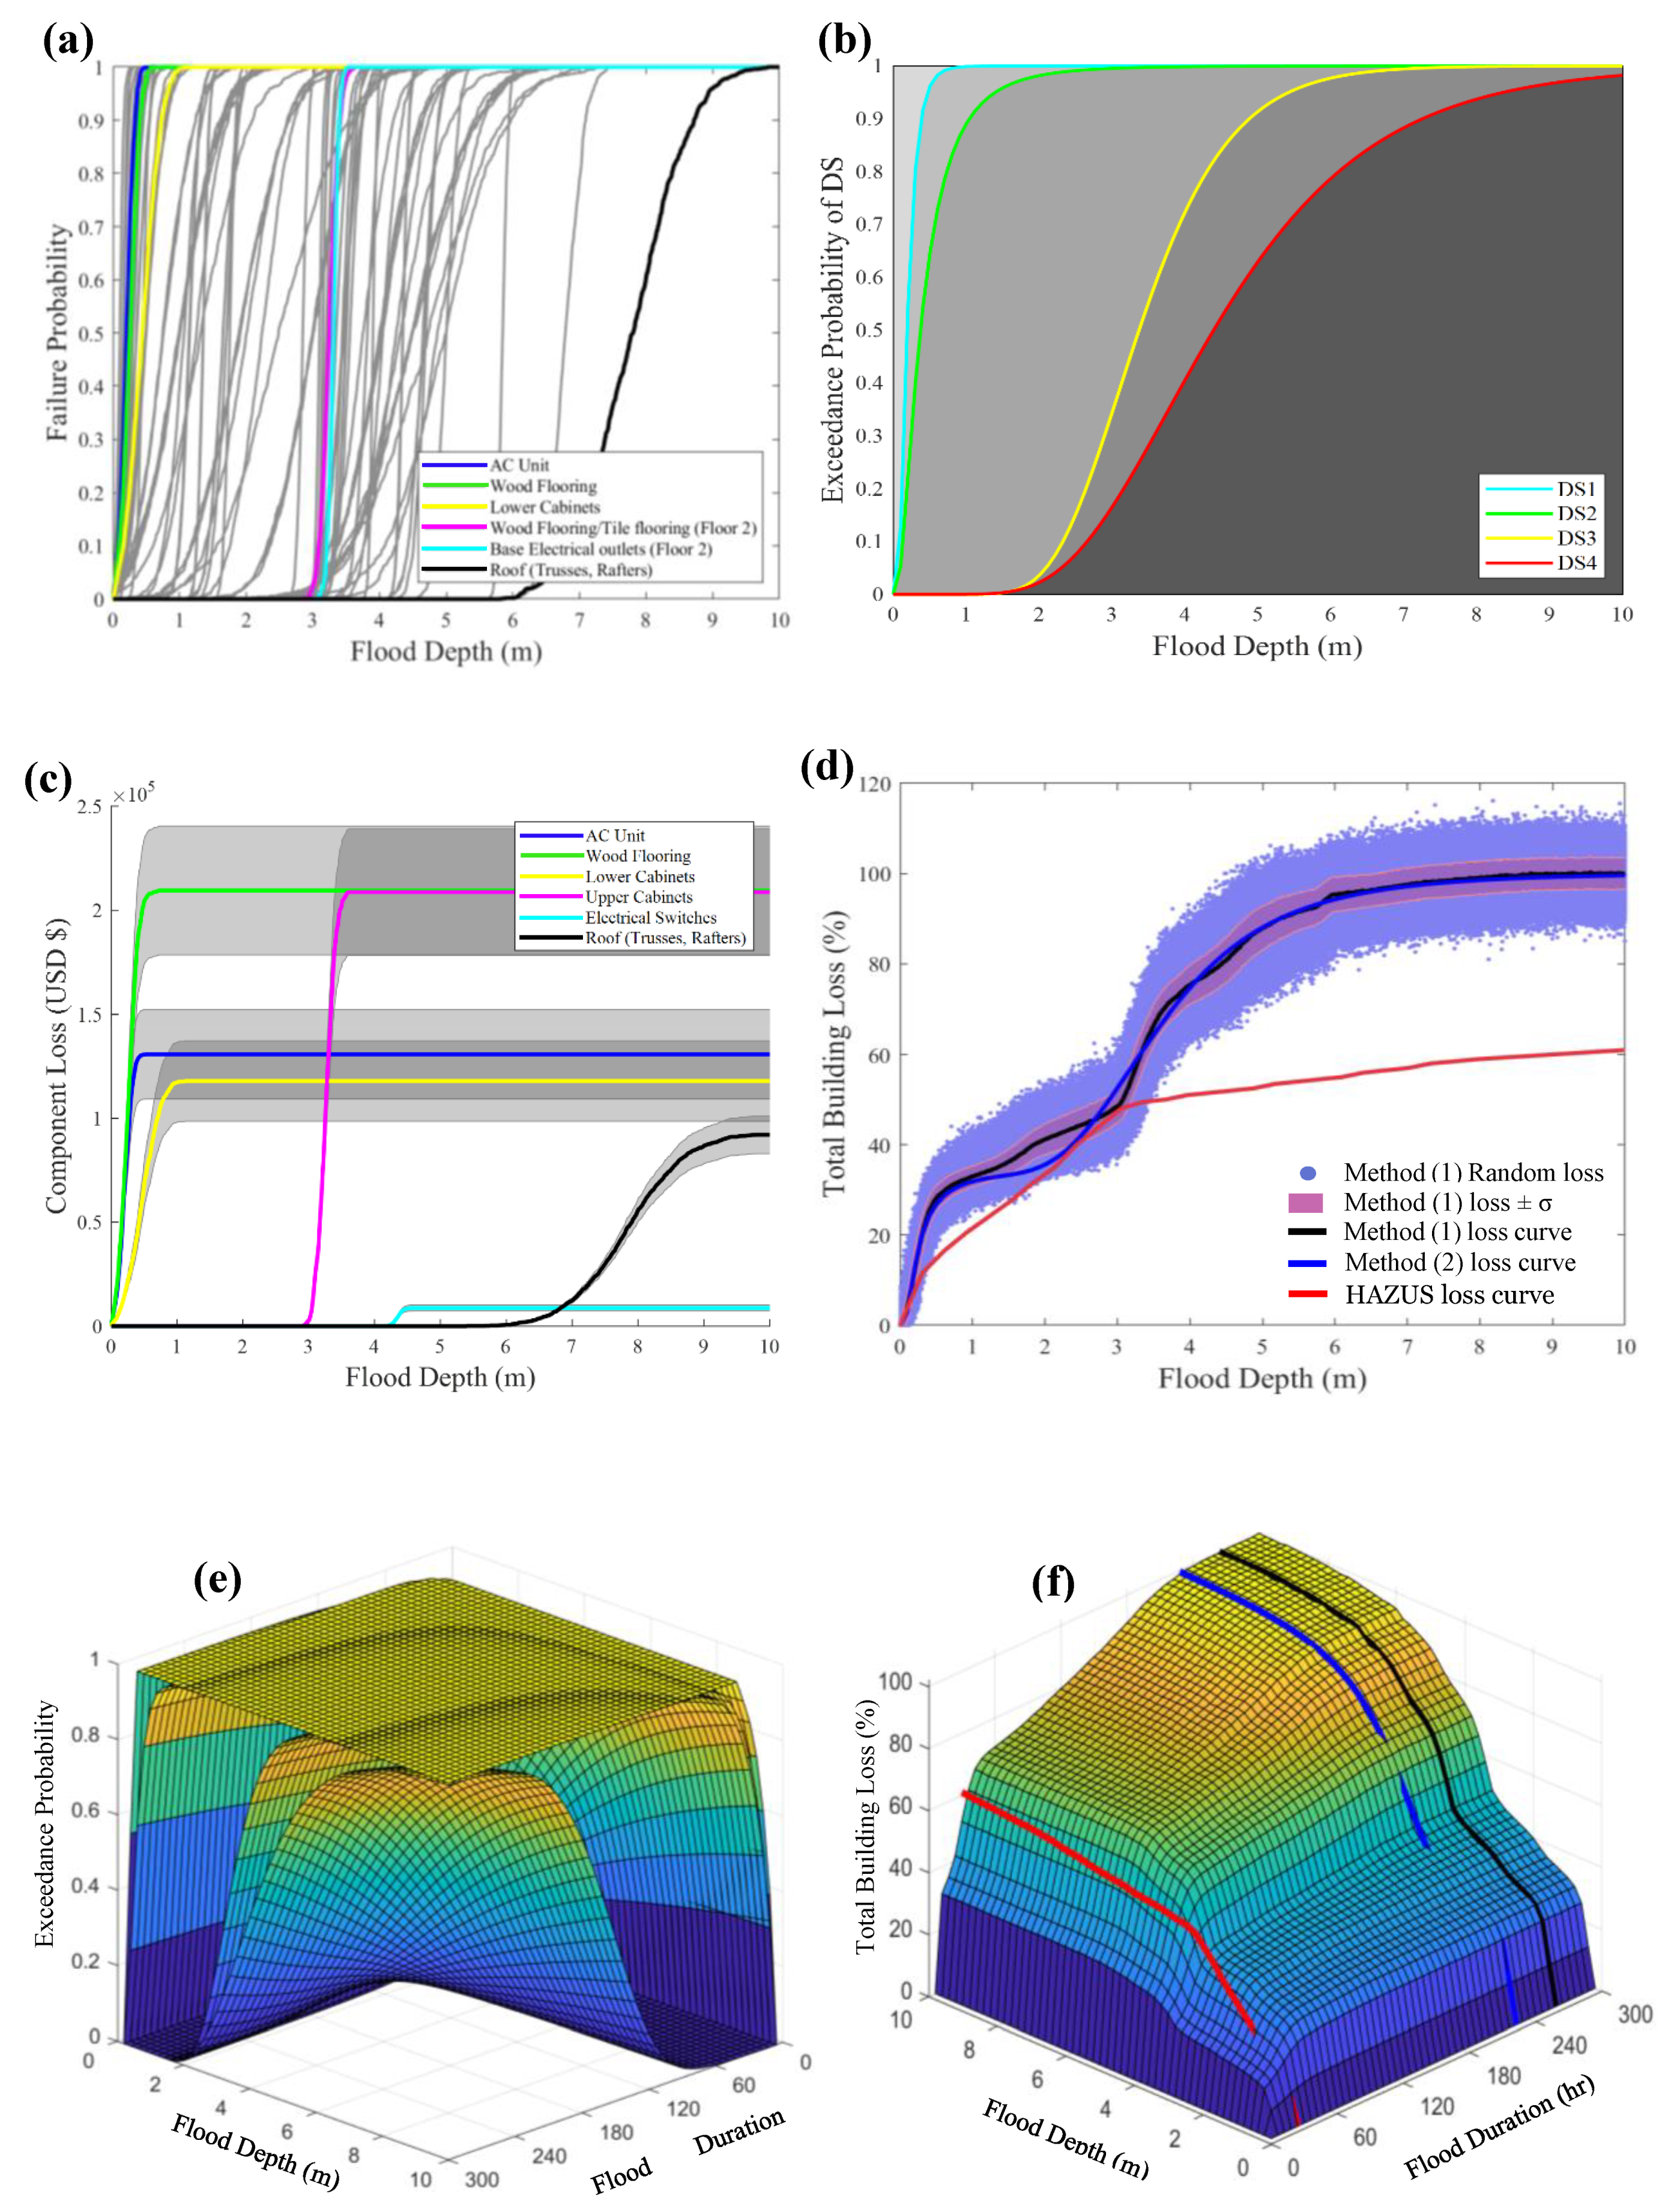
F2 archetype analysis results: (a) Component fragility curves; (b) Building fragility curves; (c) Selected components’ loss curves; (d) Building loss curves; (e) Building fragility surfaces; (f) Building loss surface.
Figure A16.
F2 archetype analysis results: (a) Component fragility curves; (b) Building fragility curves; (c) Selected components’ loss curves; (d) Building loss curves; (e) Building fragility surfaces; (f) Building loss surface.

- F3: Two-Story Single-Family Residential Building
Figure A17.
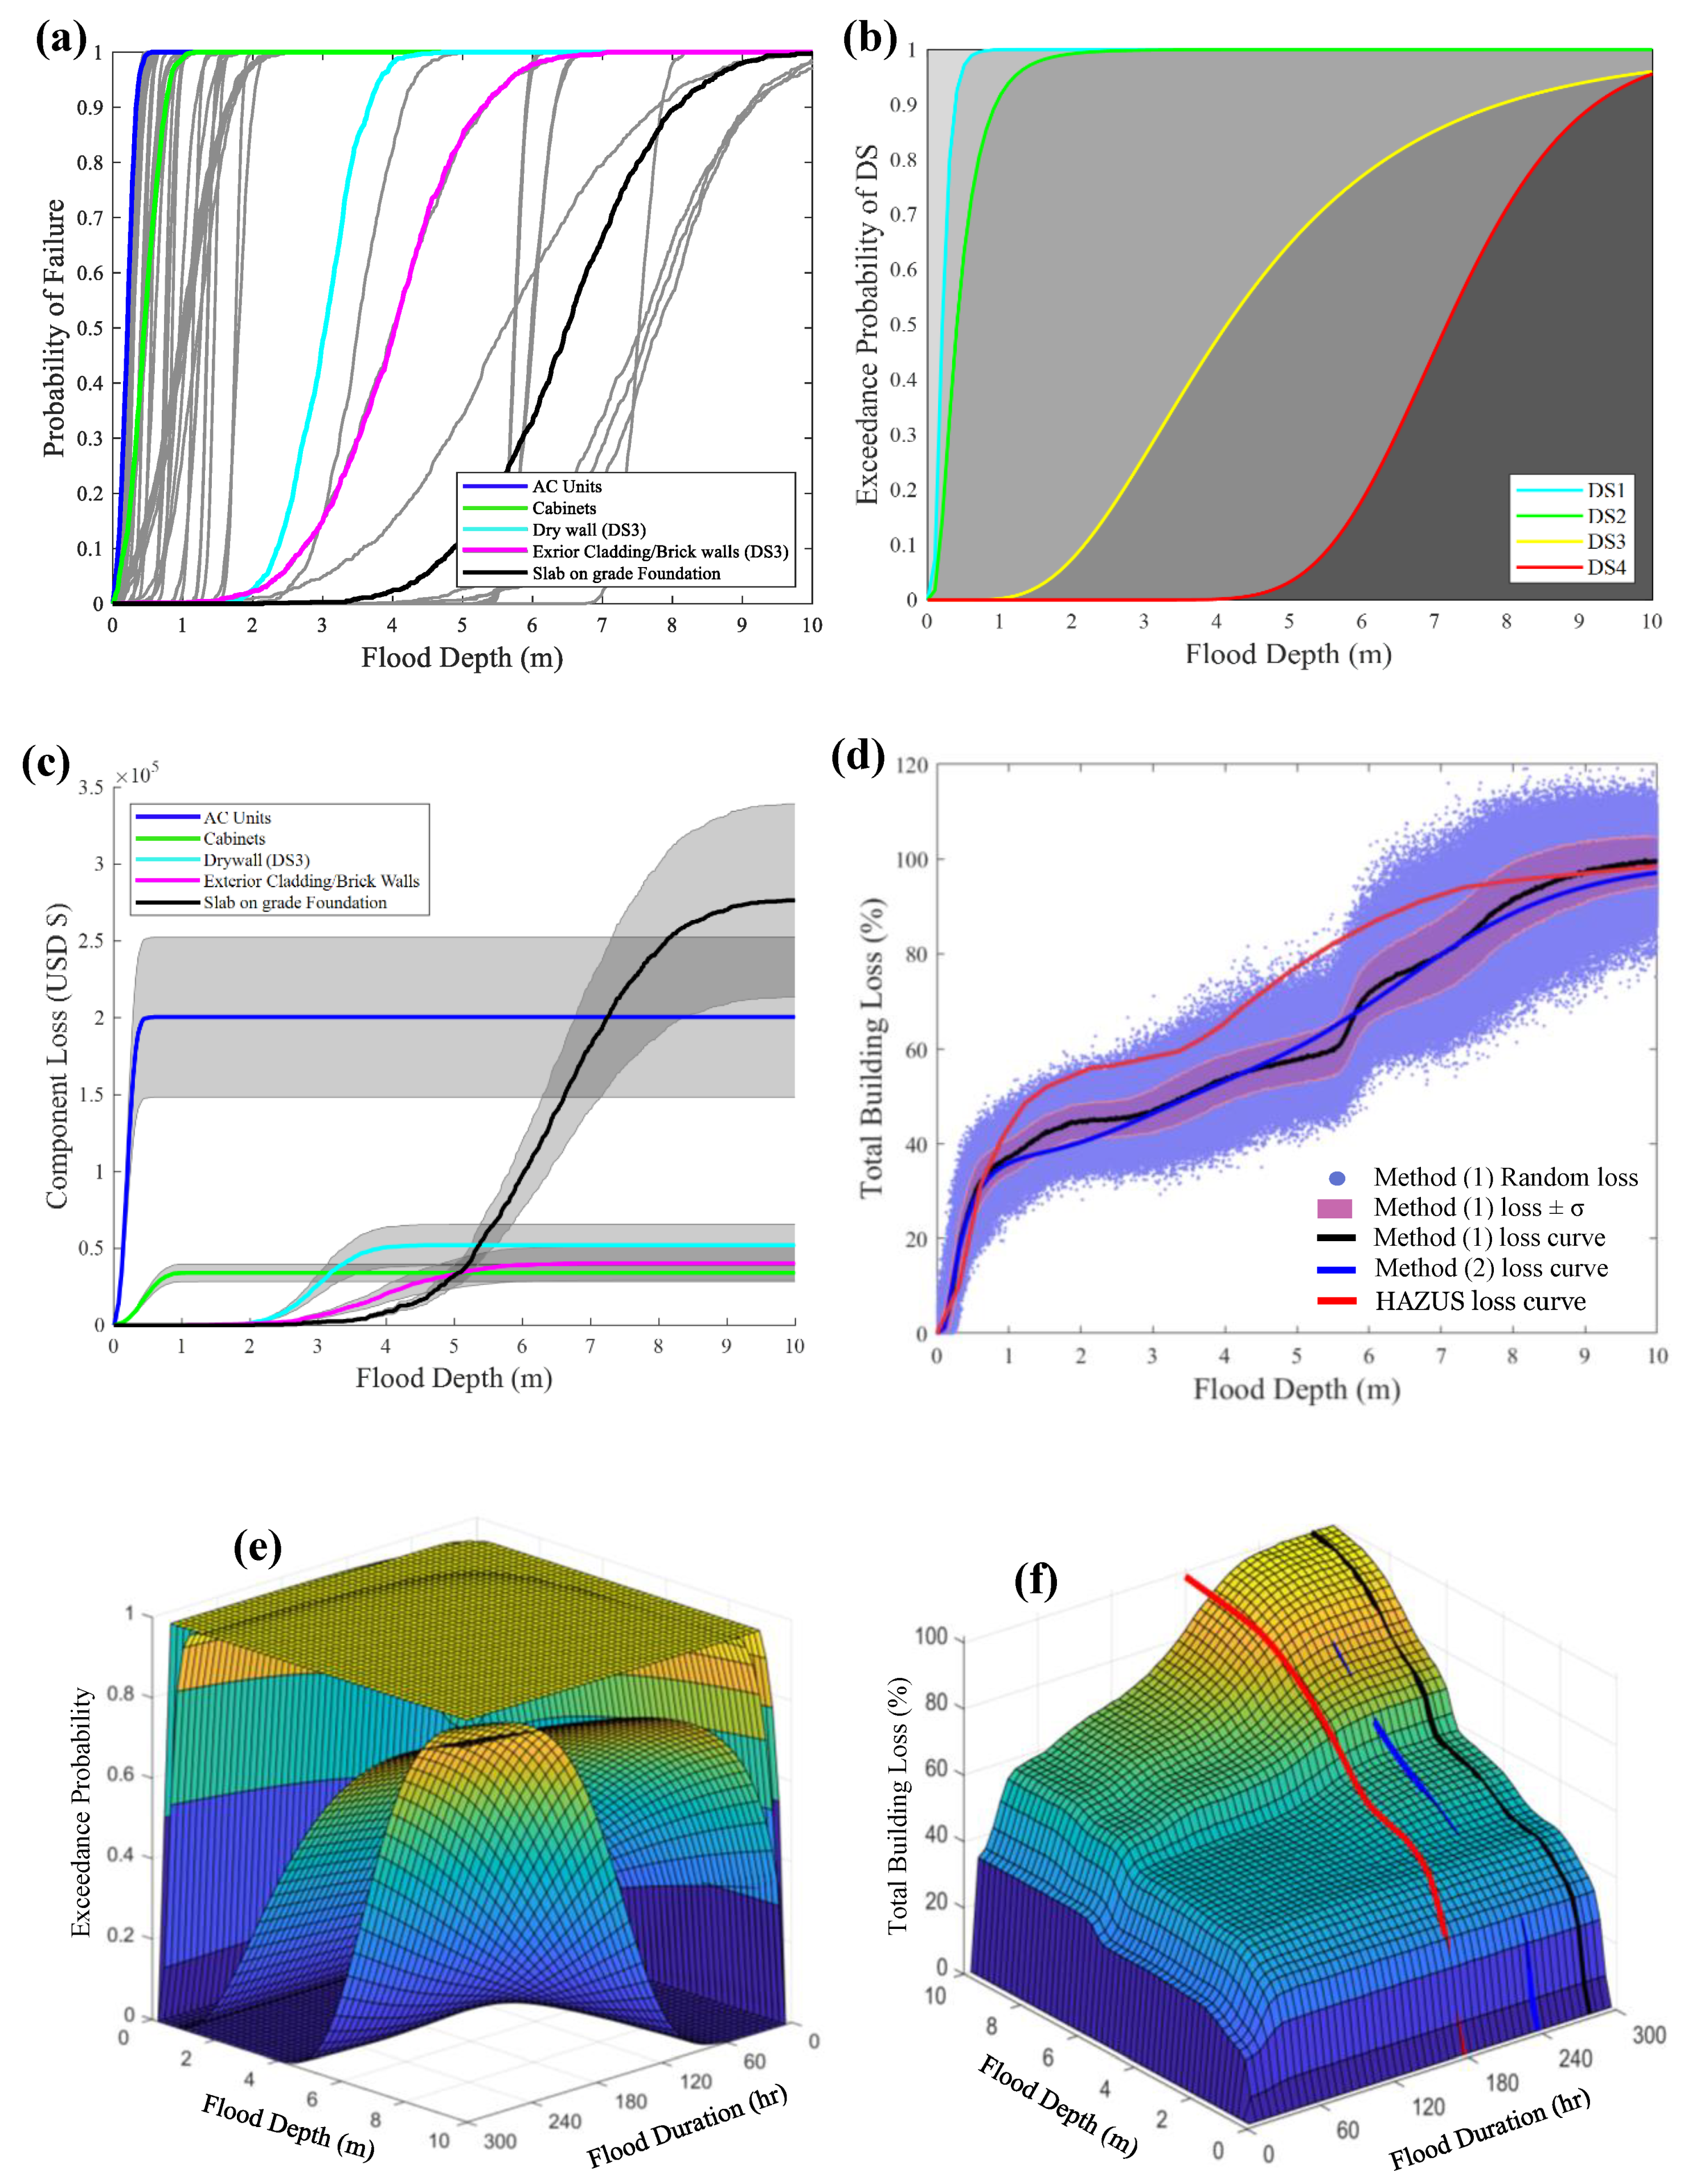
F3 archetype analysis results: (a) Component fragility curves; (b) Building fragility curves; (c) Selected components’ loss curves; (d) Building loss curves; (e) Building fragility surfaces; (f) Building loss surface.
Figure A17.
F3 archetype analysis results: (a) Component fragility curves; (b) Building fragility curves; (c) Selected components’ loss curves; (d) Building loss curves; (e) Building fragility surfaces; (f) Building loss surface.

- F4: Two-Story Multi-Family Residential Building
Figure A18.
F4 archetype analysis results: (a) Component fragility curves; (b) Building fragility curves; (c) Selected components’ loss curves; (d) Building loss curves; (e) Building fragility surfaces; (f) Building loss surface.
Figure A18.
F4 archetype analysis results: (a) Component fragility curves; (b) Building fragility curves; (c) Selected components’ loss curves; (d) Building loss curves; (e) Building fragility surfaces; (f) Building loss surface.

- F5: Small Grocery Store/Gas Station with a Convenience Store
Figure A19.
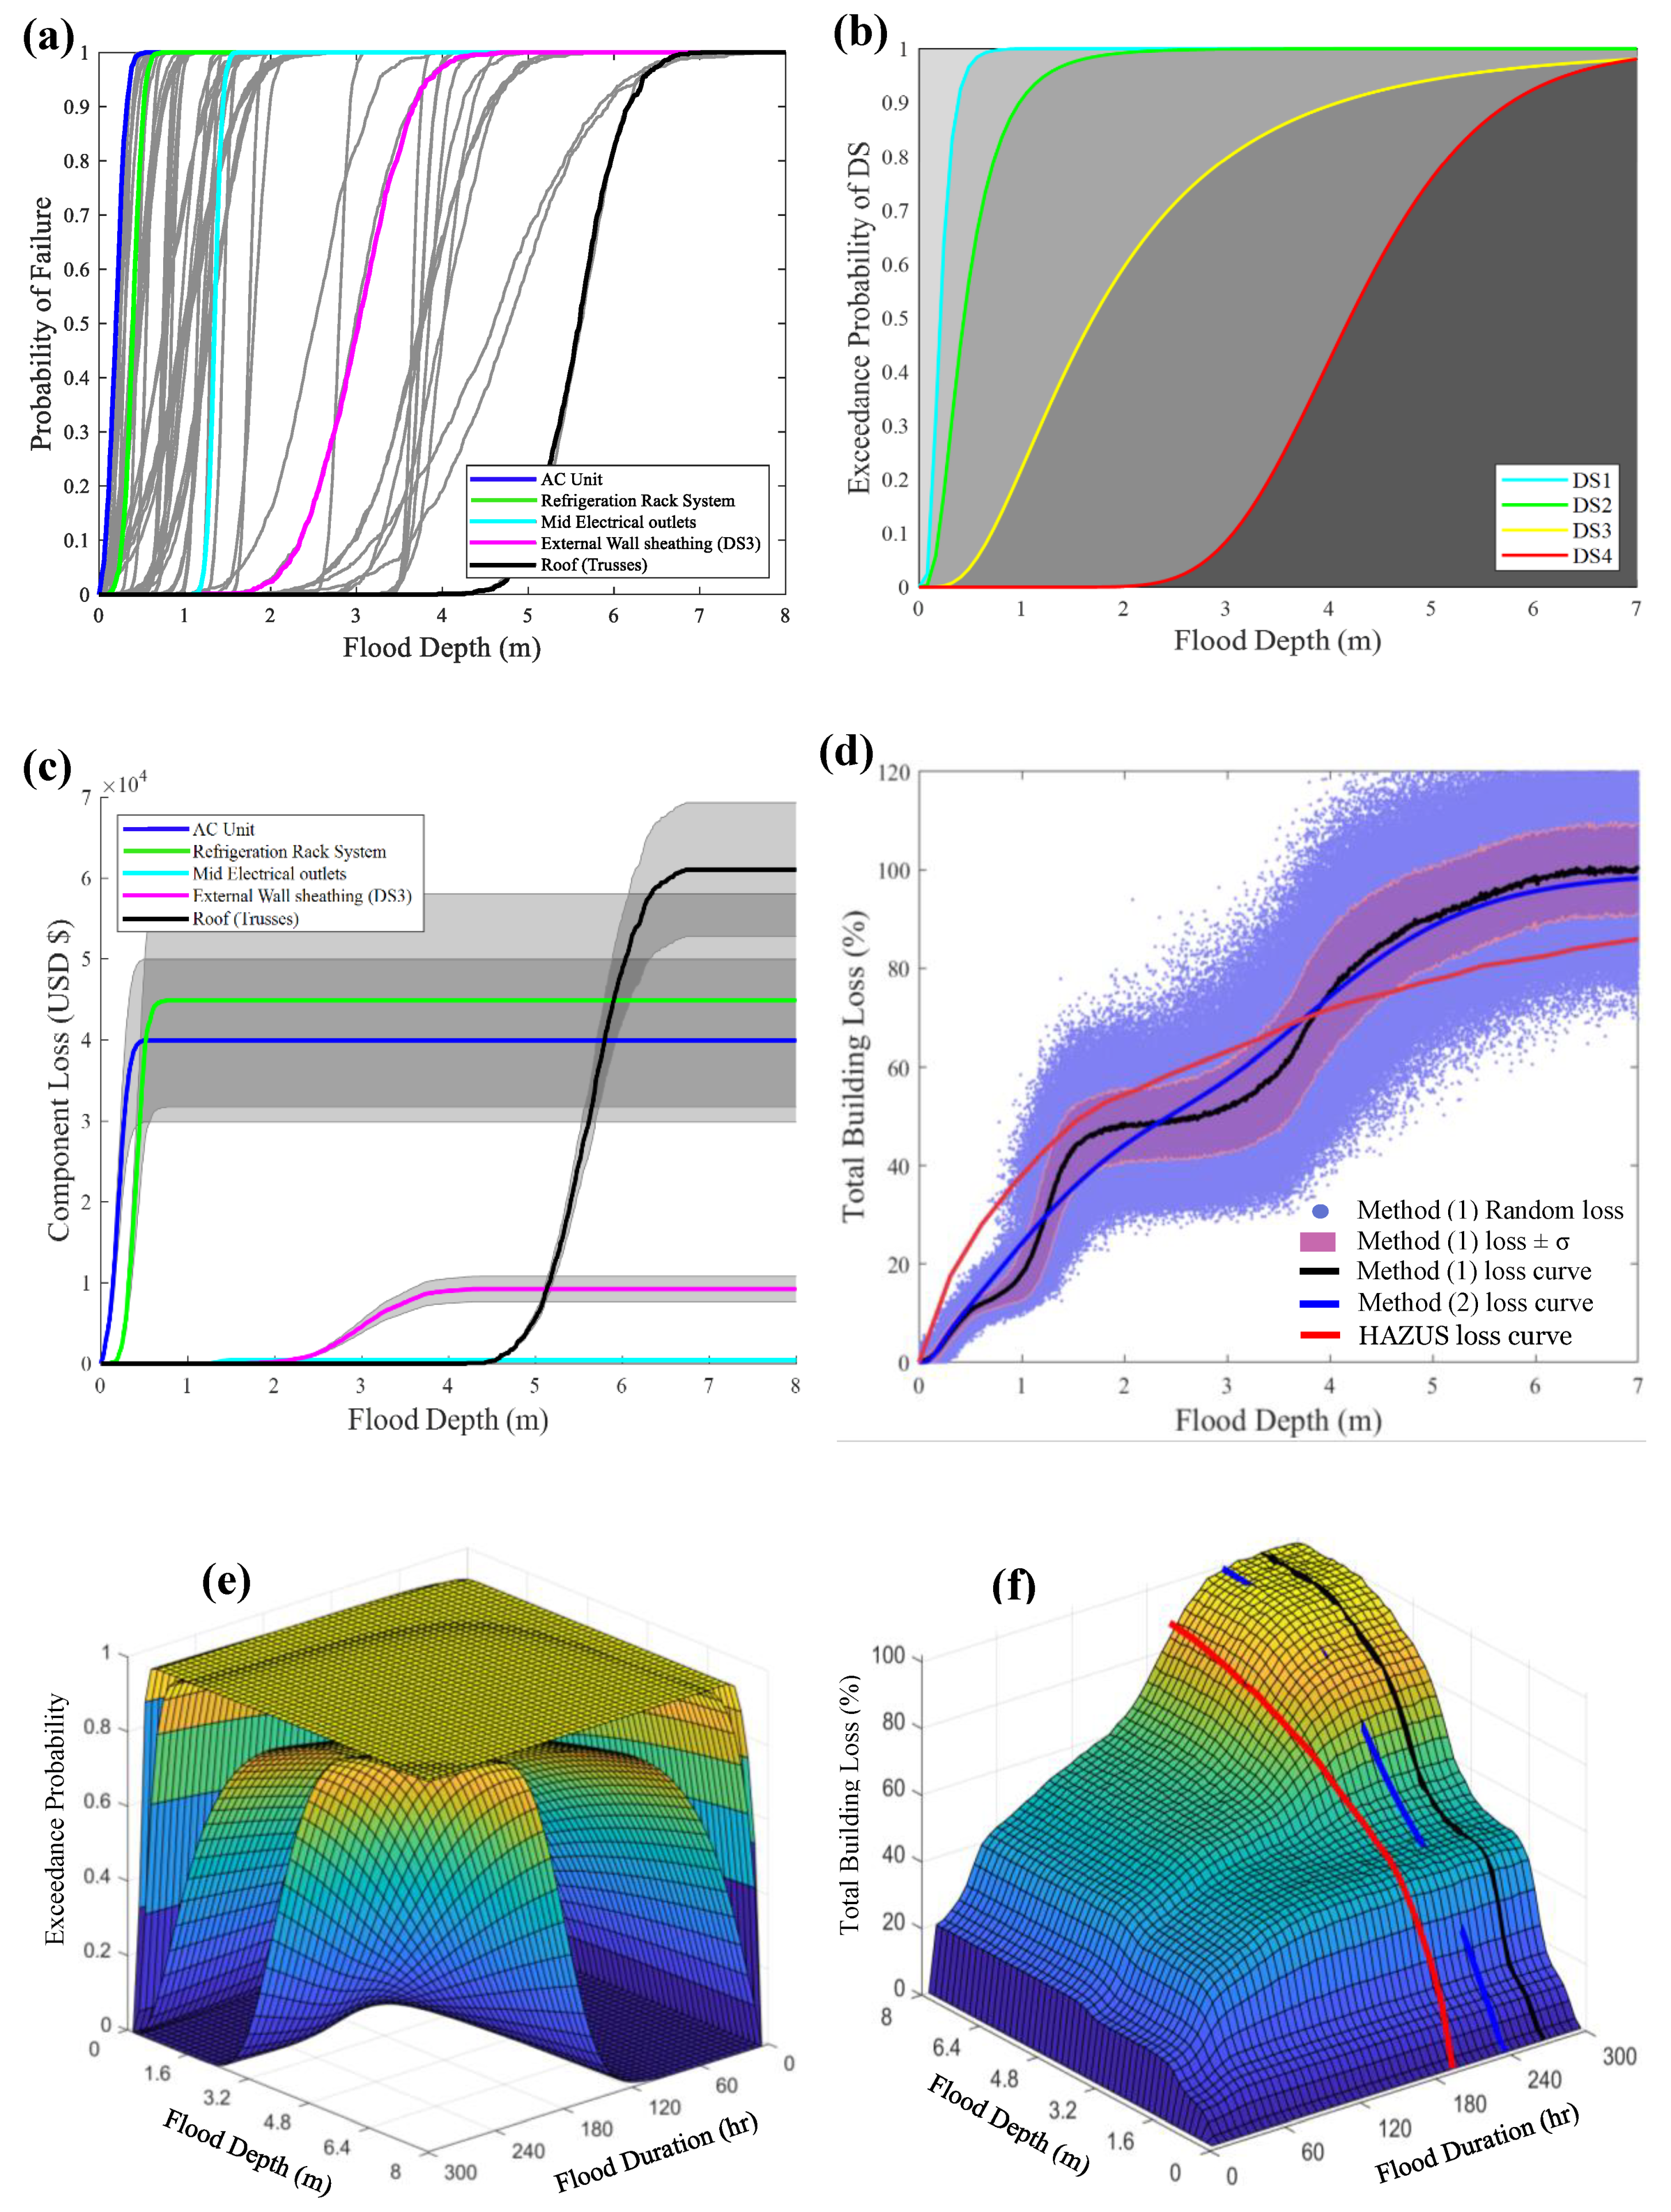
F5 archetype analysis results: (a) Component fragility curves; (b) Building fragility curves; (c) Selected components’ loss curves; (d) Building loss curves; (e) Building fragility surfaces; (f) Building loss surface.
Figure A19.
F5 archetype analysis results: (a) Component fragility curves; (b) Building fragility curves; (c) Selected components’ loss curves; (d) Building loss curves; (e) Building fragility surfaces; (f) Building loss surface.

- F6: Multi-Unit Retail Building (Strip Mall)
Figure A20.
F6 archetype analysis results: (a) Component fragility curves; (b) Building fragility curves; (c) Selected components’ loss curves; (d) Building loss curves; (e) Building fragility surfaces; (f) Building loss surface.
Figure A20.
F6 archetype analysis results: (a) Component fragility curves; (b) Building fragility curves; (c) Selected components’ loss curves; (d) Building loss curves; (e) Building fragility surfaces; (f) Building loss surface.

- F7: Small Multi-Unit Commercial Building
Figure A21.
F7 archetype analysis results: (a) Component fragility curves; (b) Building fragility curves; (c) Selected components’ loss curves; (d) Building loss curves; (e) Building fragility surfaces; (f) Building loss surface.
Figure A21.
F7 archetype analysis results: (a) Component fragility curves; (b) Building fragility curves; (c) Selected components’ loss curves; (d) Building loss curves; (e) Building fragility surfaces; (f) Building loss surface.

- F8: Super Retail Center
Figure A22.
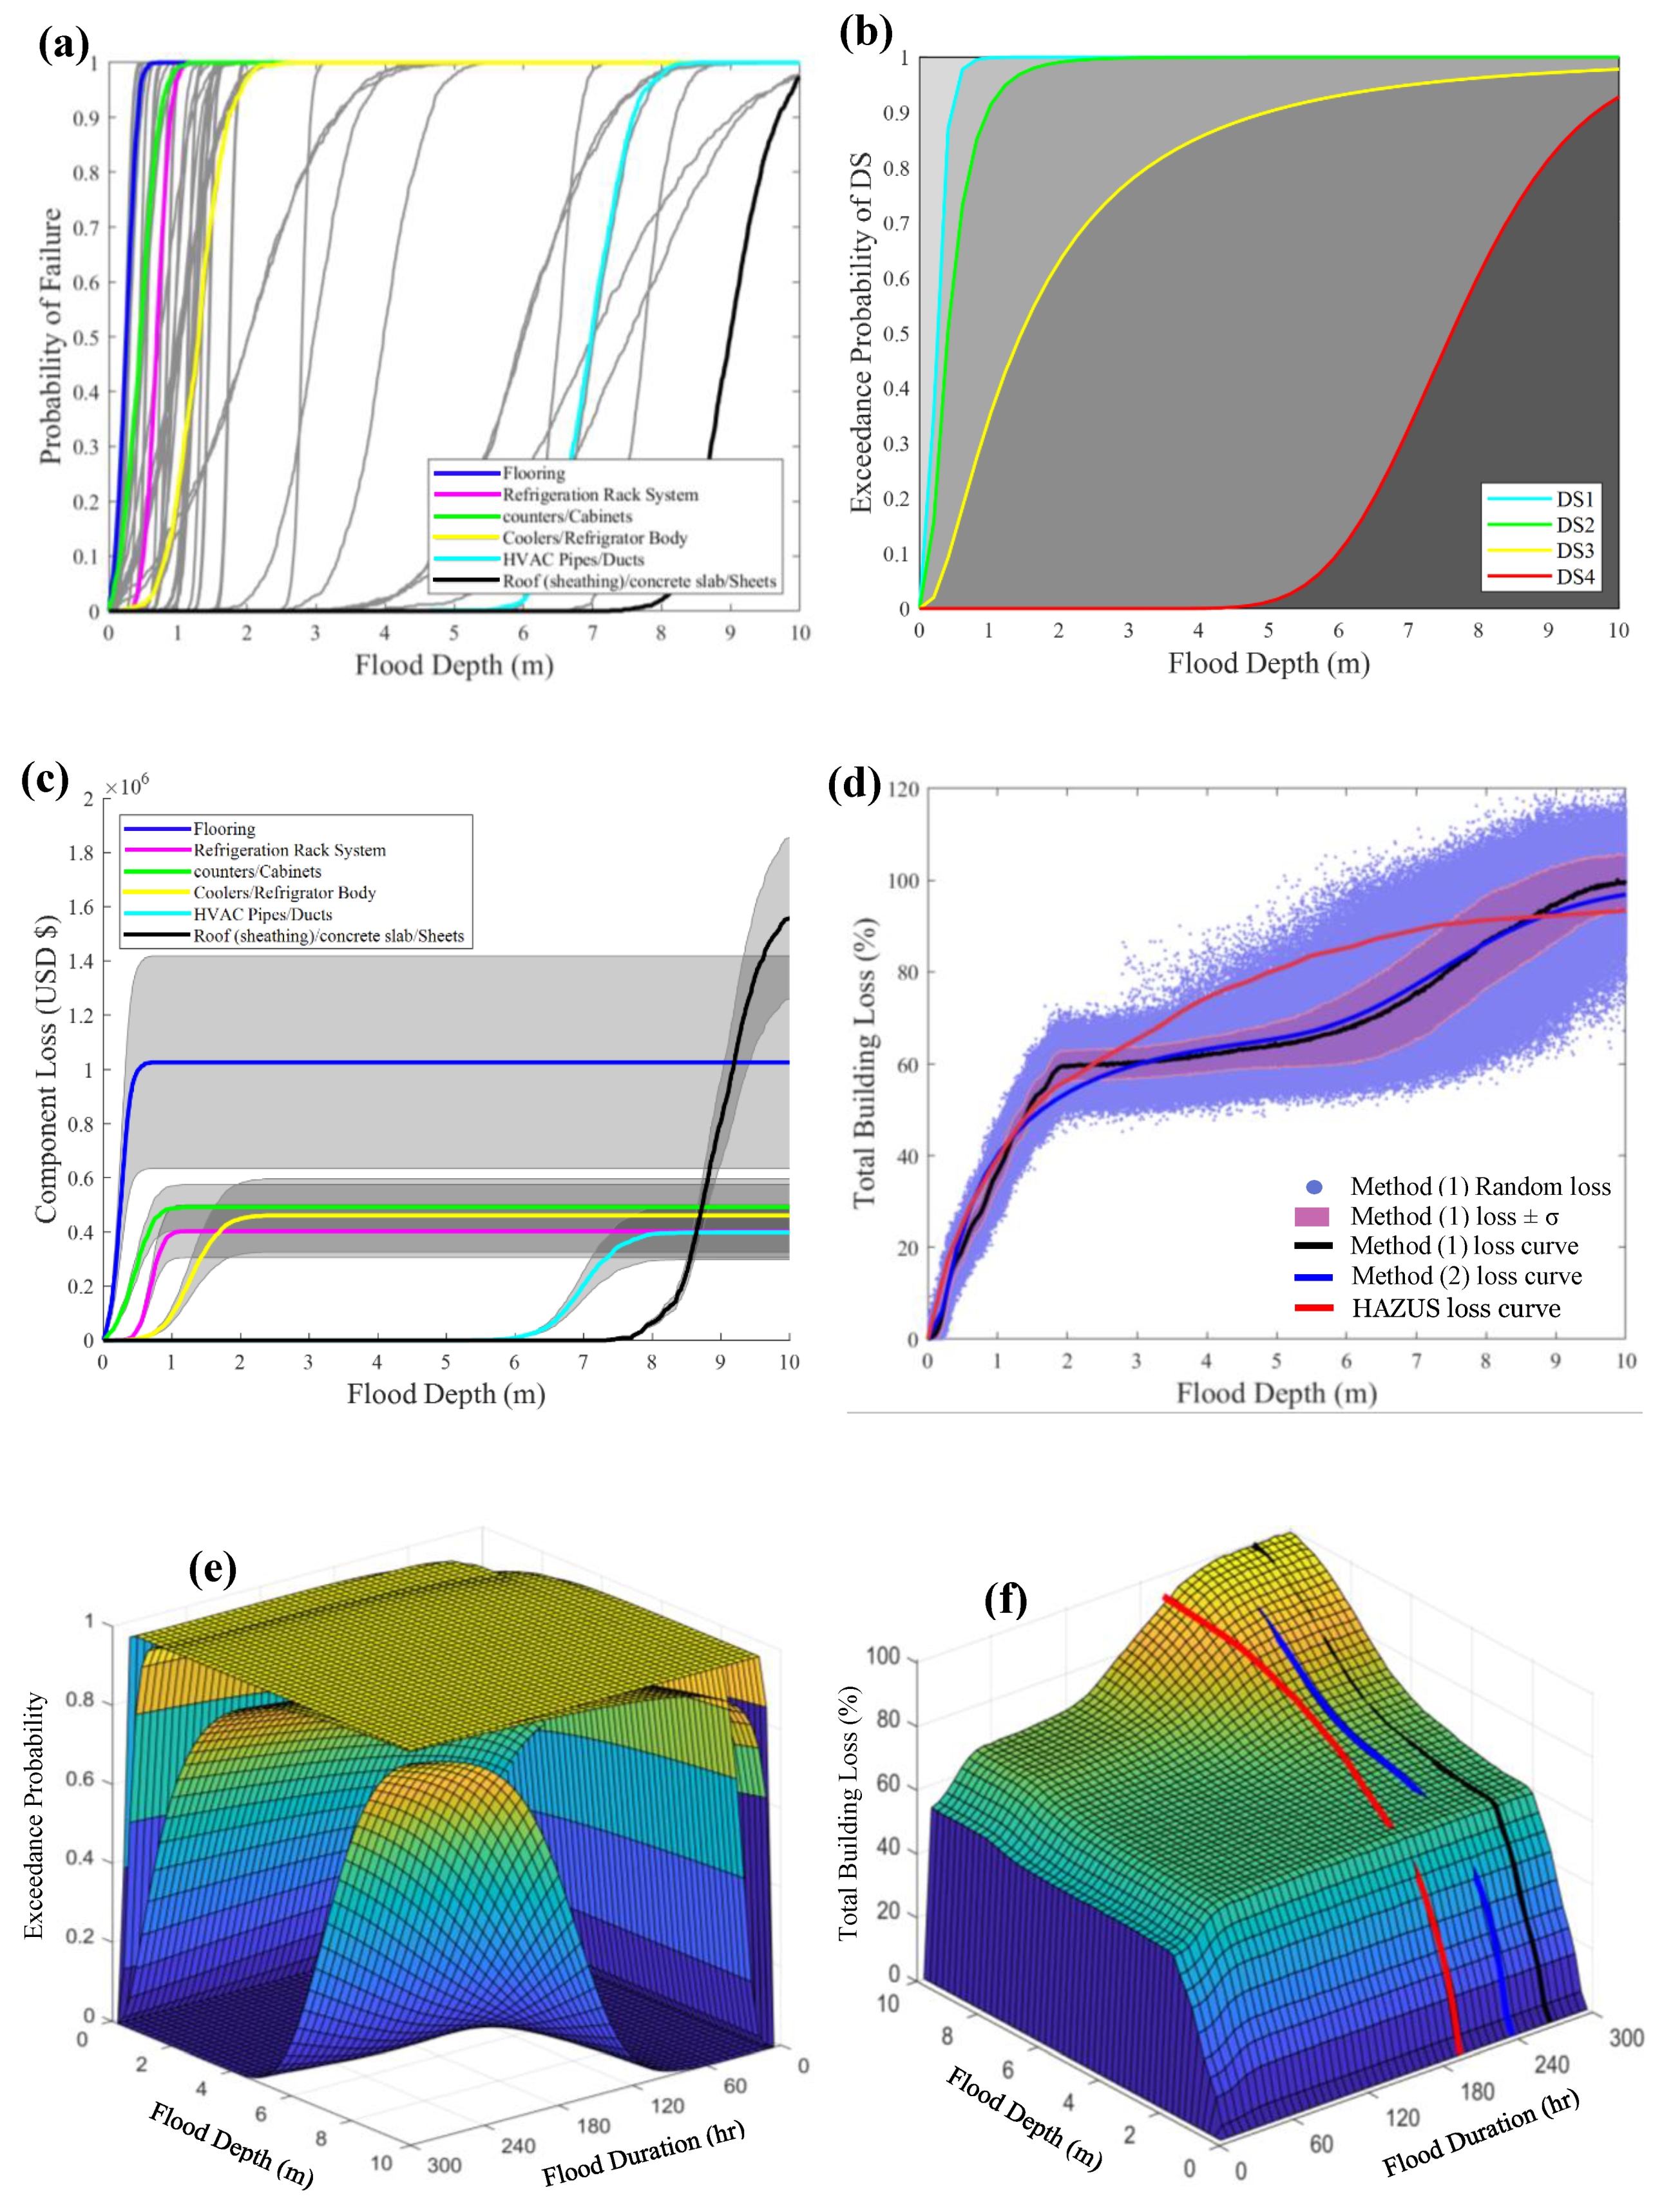
F8 archetype analysis results: (a) Component fragility curves; (b) Building fragility curves; (c) Selected components’ loss curves; (d) Building loss curves; (e) Building fragility surfaces; (f) Building loss surface.
Figure A22.
F8 archetype analysis results: (a) Component fragility curves; (b) Building fragility curves; (c) Selected components’ loss curves; (d) Building loss curves; (e) Building fragility surfaces; (f) Building loss surface.

- F9: Industrial Building
Figure A23.
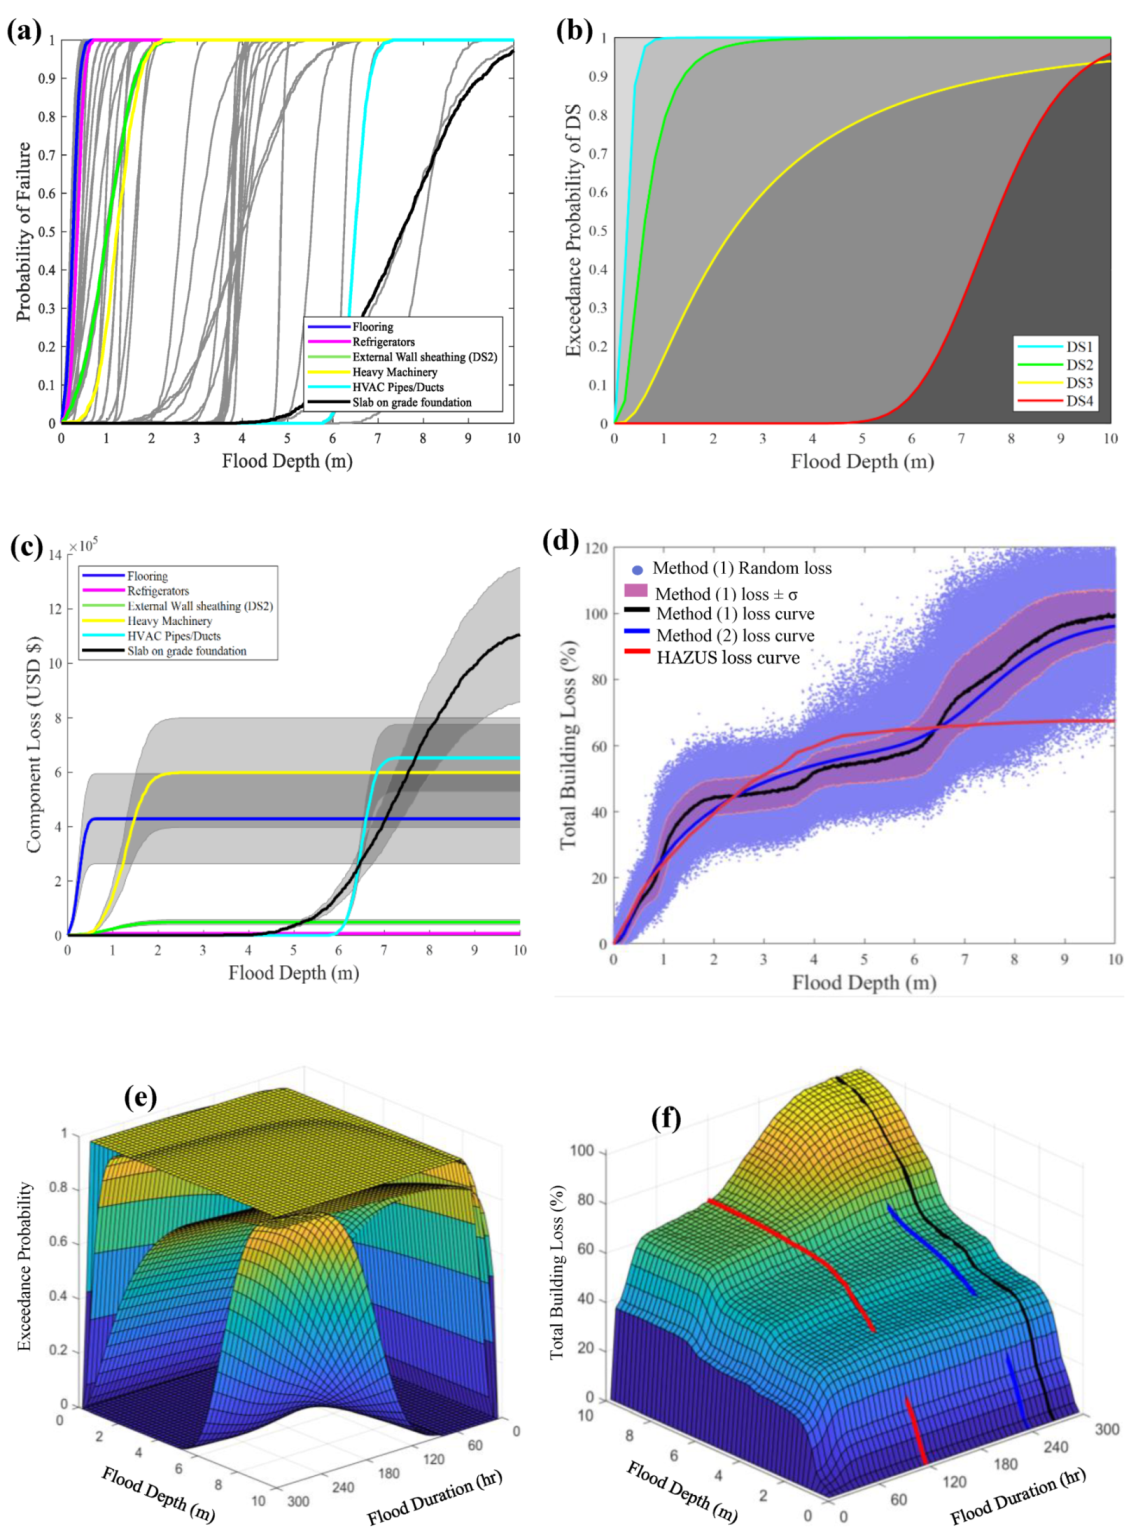
F9 archetype analysis results: (a) Component fragility curves; (b) Building fragility curves; (c) Selected components’ loss curves; (d) Building loss curves; (e) Building fragility surfaces; (f) Building loss surface.
Figure A23.
F9 archetype analysis results: (a) Component fragility curves; (b) Building fragility curves; (c) Selected components’ loss curves; (d) Building loss curves; (e) Building fragility surfaces; (f) Building loss surface.

- F10: One-Story School
Figure A24.
F10 archetype analysis results: (a) Component fragility curves; (b) Building fragility curves; (c) Selected components’ loss curves; (d) Building loss curves; (e) Building fragility surfaces; (f) Building loss surface.
Figure A24.
F10 archetype analysis results: (a) Component fragility curves; (b) Building fragility curves; (c) Selected components’ loss curves; (d) Building loss curves; (e) Building fragility surfaces; (f) Building loss surface.

- F11: Two-Story School
Figure A25.
F11 archetype analysis results: (a) Component fragility curves; (b) Building fragility curves; (c) Selected components’ loss curves; (d) Building loss curves; (e) Building fragility surfaces; (f) Building loss surface.
Figure A25.
F11 archetype analysis results: (a) Component fragility curves; (b) Building fragility curves; (c) Selected components’ loss curves; (d) Building loss curves; (e) Building fragility surfaces; (f) Building loss surface.

- F12: Hospital
Figure A26.
F12 archetype analysis results: (a) Component fragility curves; (b) Building fragility curves; (c) Selected components’ loss curves; (d) Building loss curves; (e) Building fragility surfaces; (f) Building loss surface.
Figure A26.
F12 archetype analysis results: (a) Component fragility curves; (b) Building fragility curves; (c) Selected components’ loss curves; (d) Building loss curves; (e) Building fragility surfaces; (f) Building loss surface.

- F13: Community Center (Place of Worship)
Figure A27.
F13 archetype analysis results: (a) Component fragility curves; (b) Building fragility curves; (c) Selected components’ loss curves; (d) Building loss curves; (e) Building fragility surfaces; (f) Building loss surface.
Figure A27.
F13 archetype analysis results: (a) Component fragility curves; (b) Building fragility curves; (c) Selected components’ loss curves; (d) Building loss curves; (e) Building fragility surfaces; (f) Building loss surface.

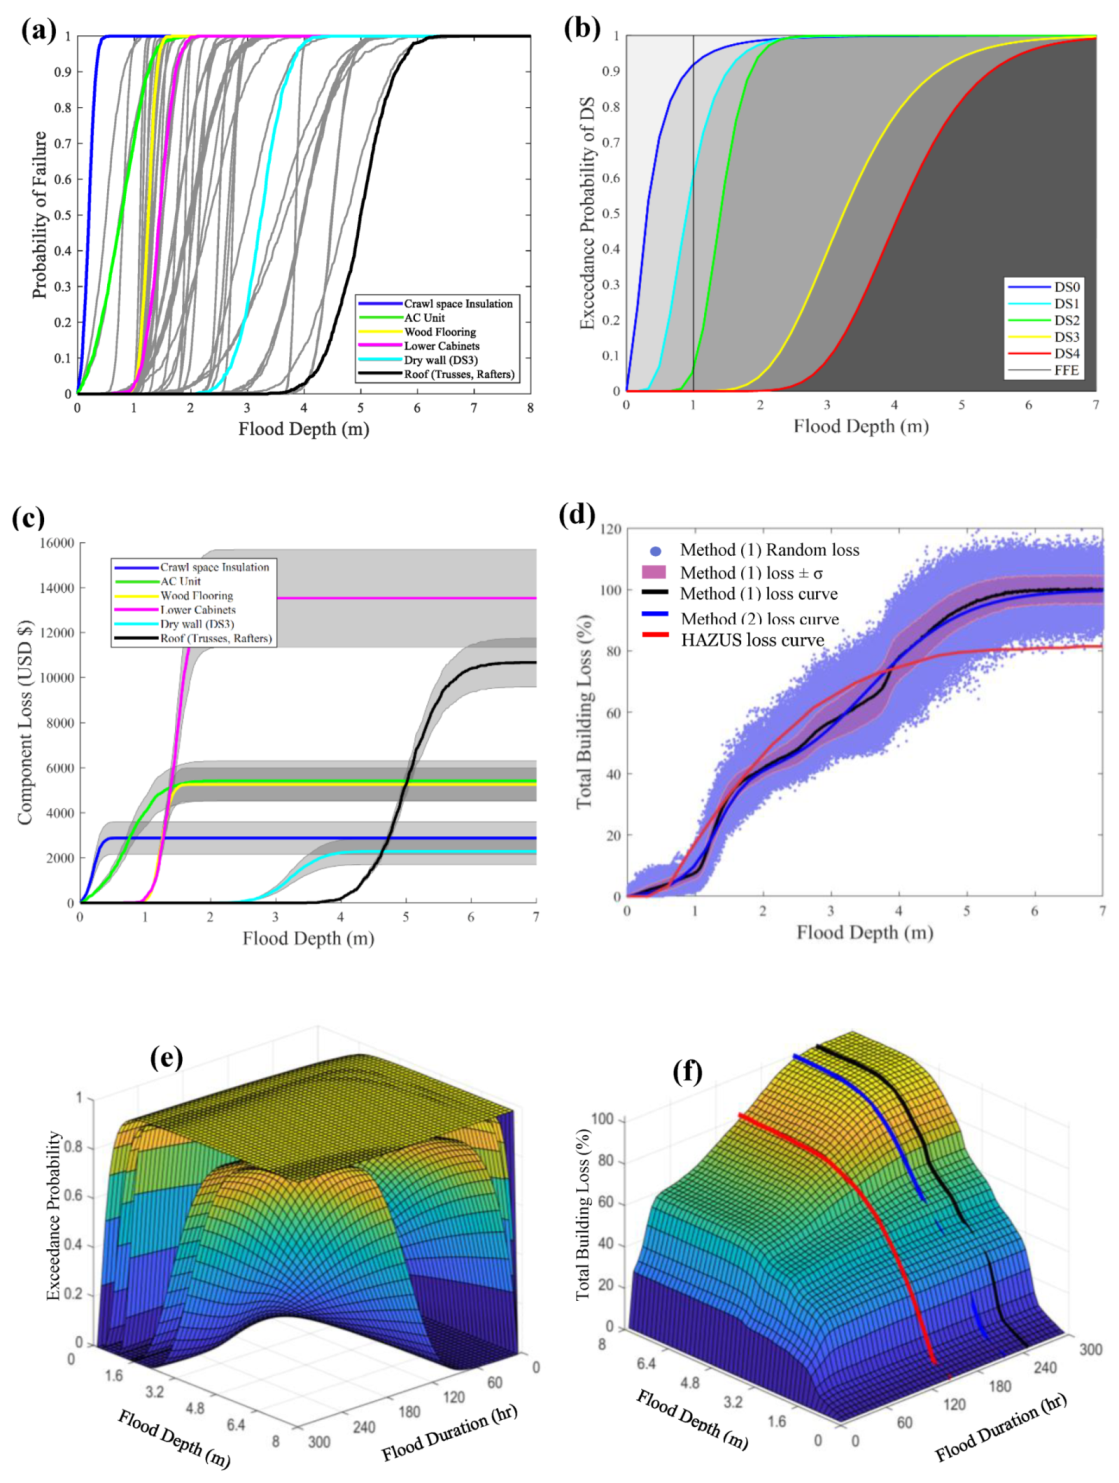
- F14: Office Building
Figure A28.
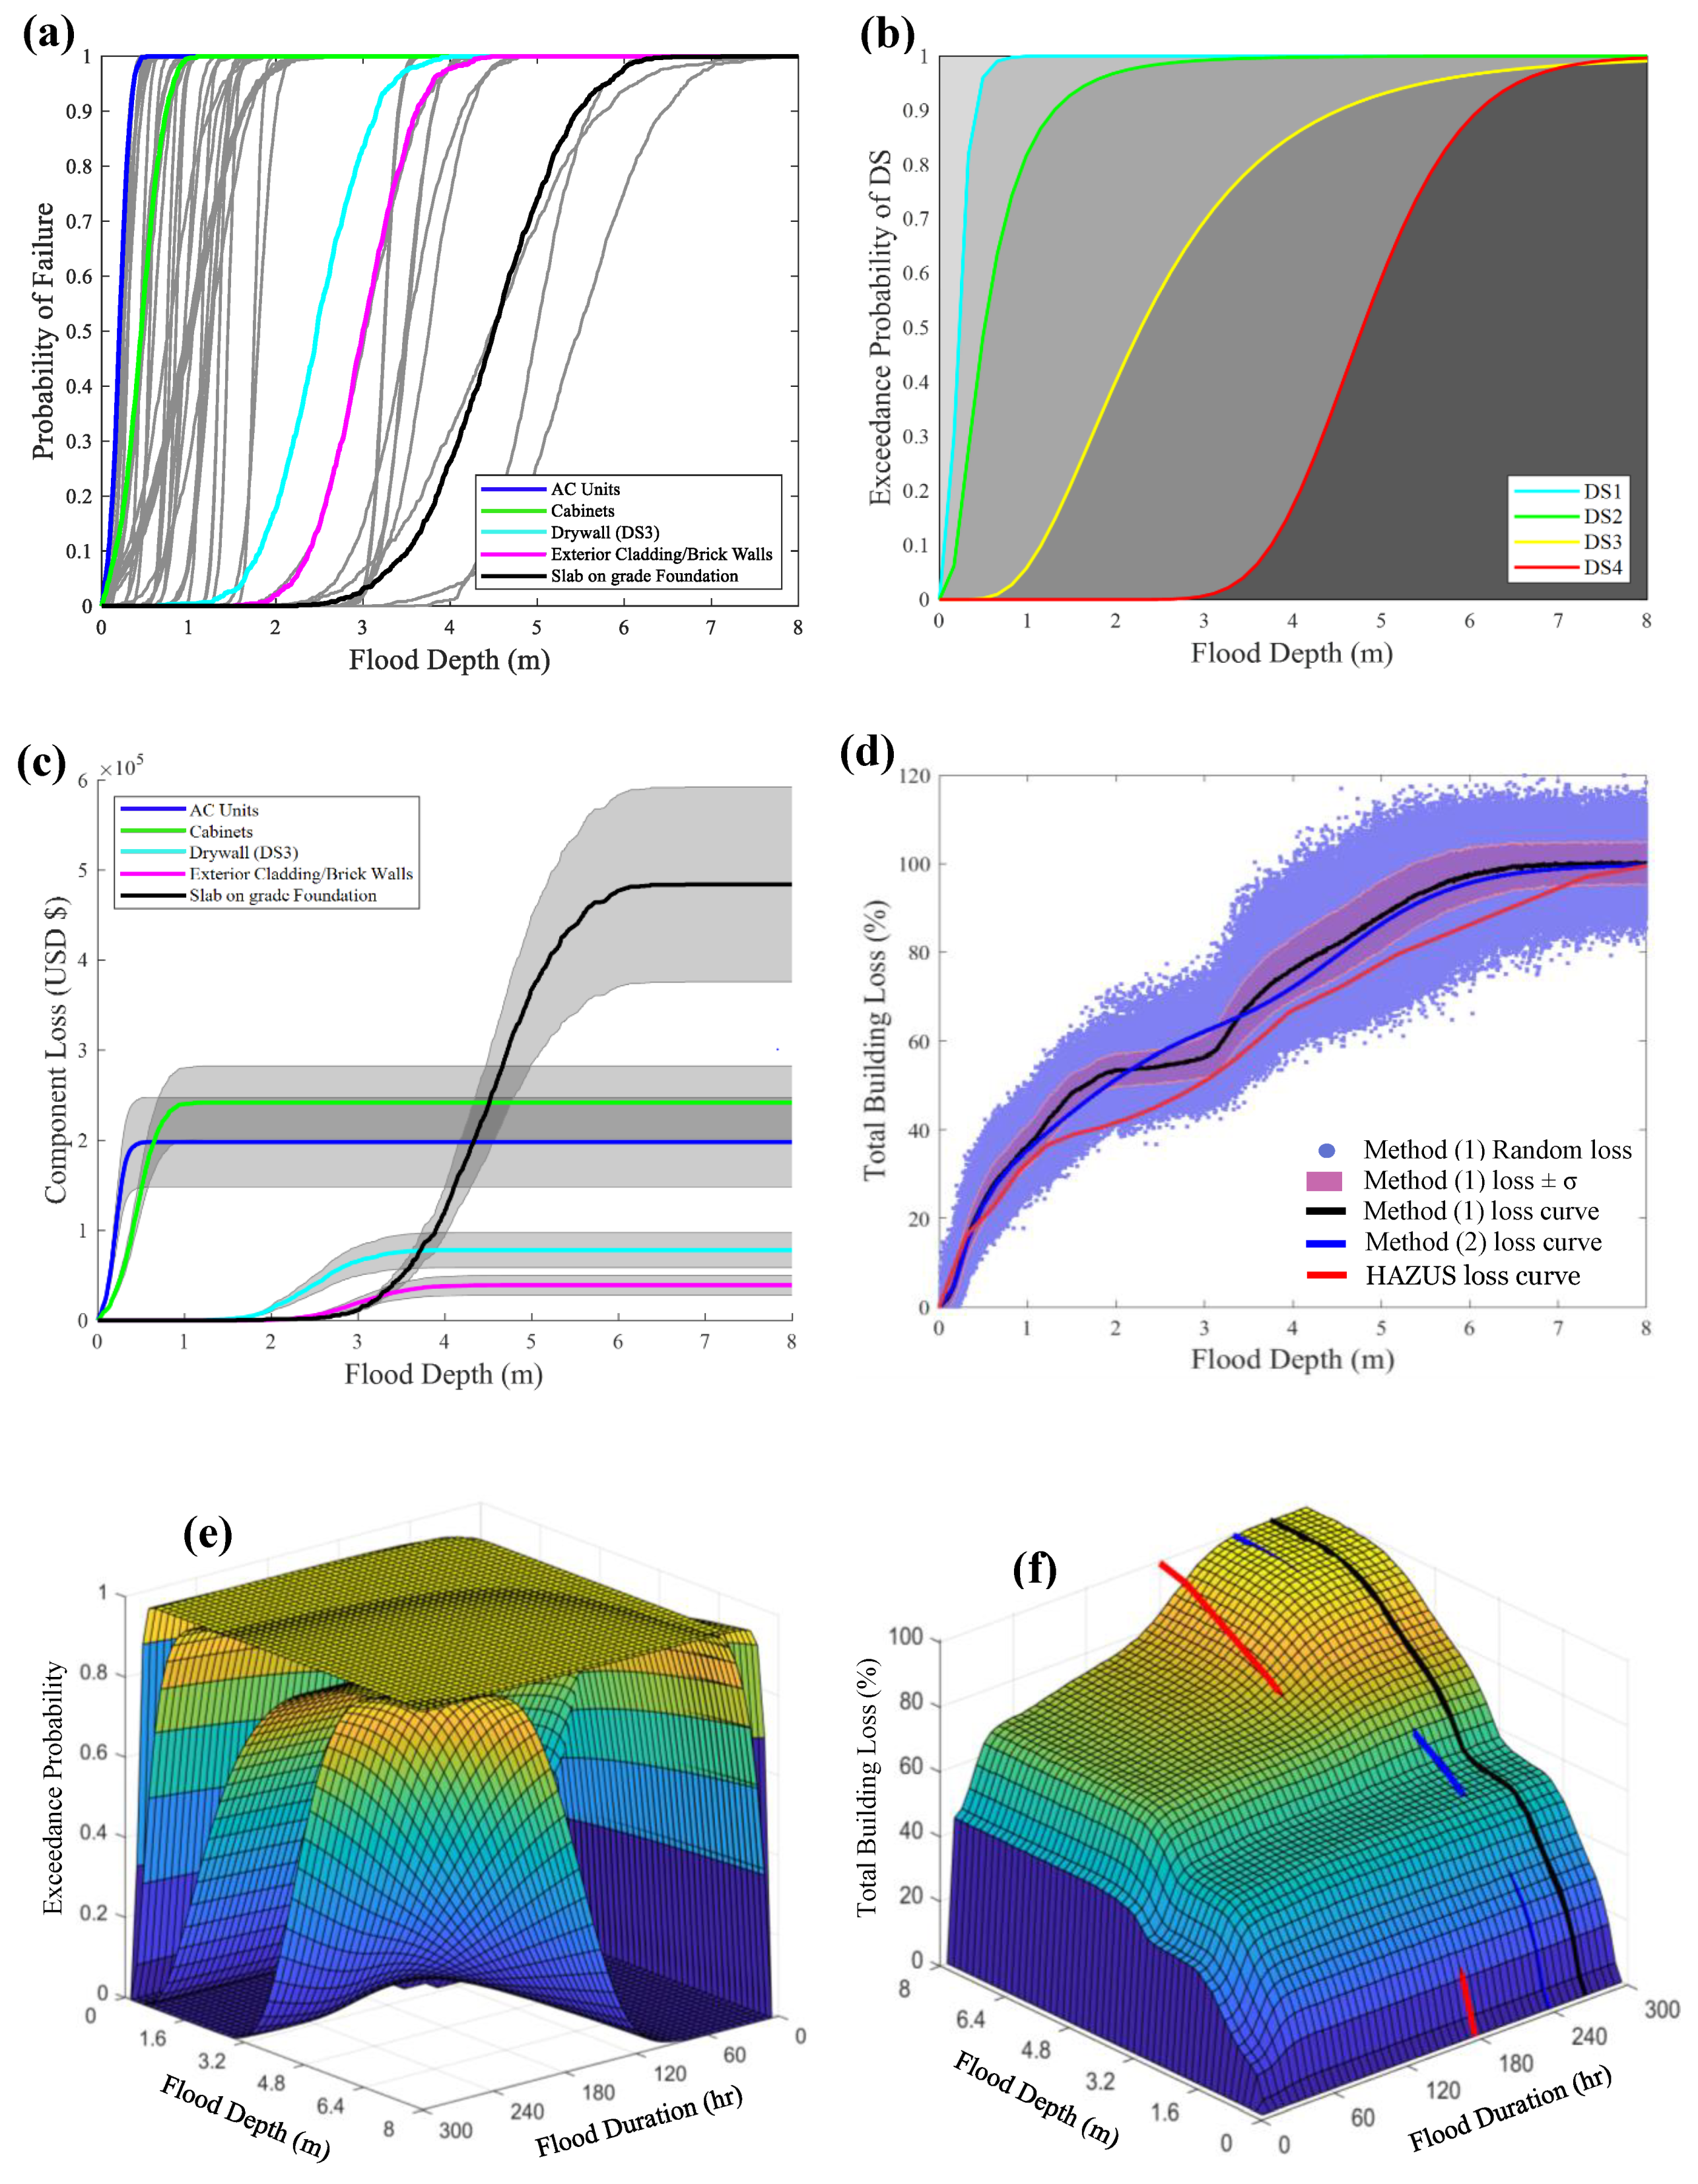
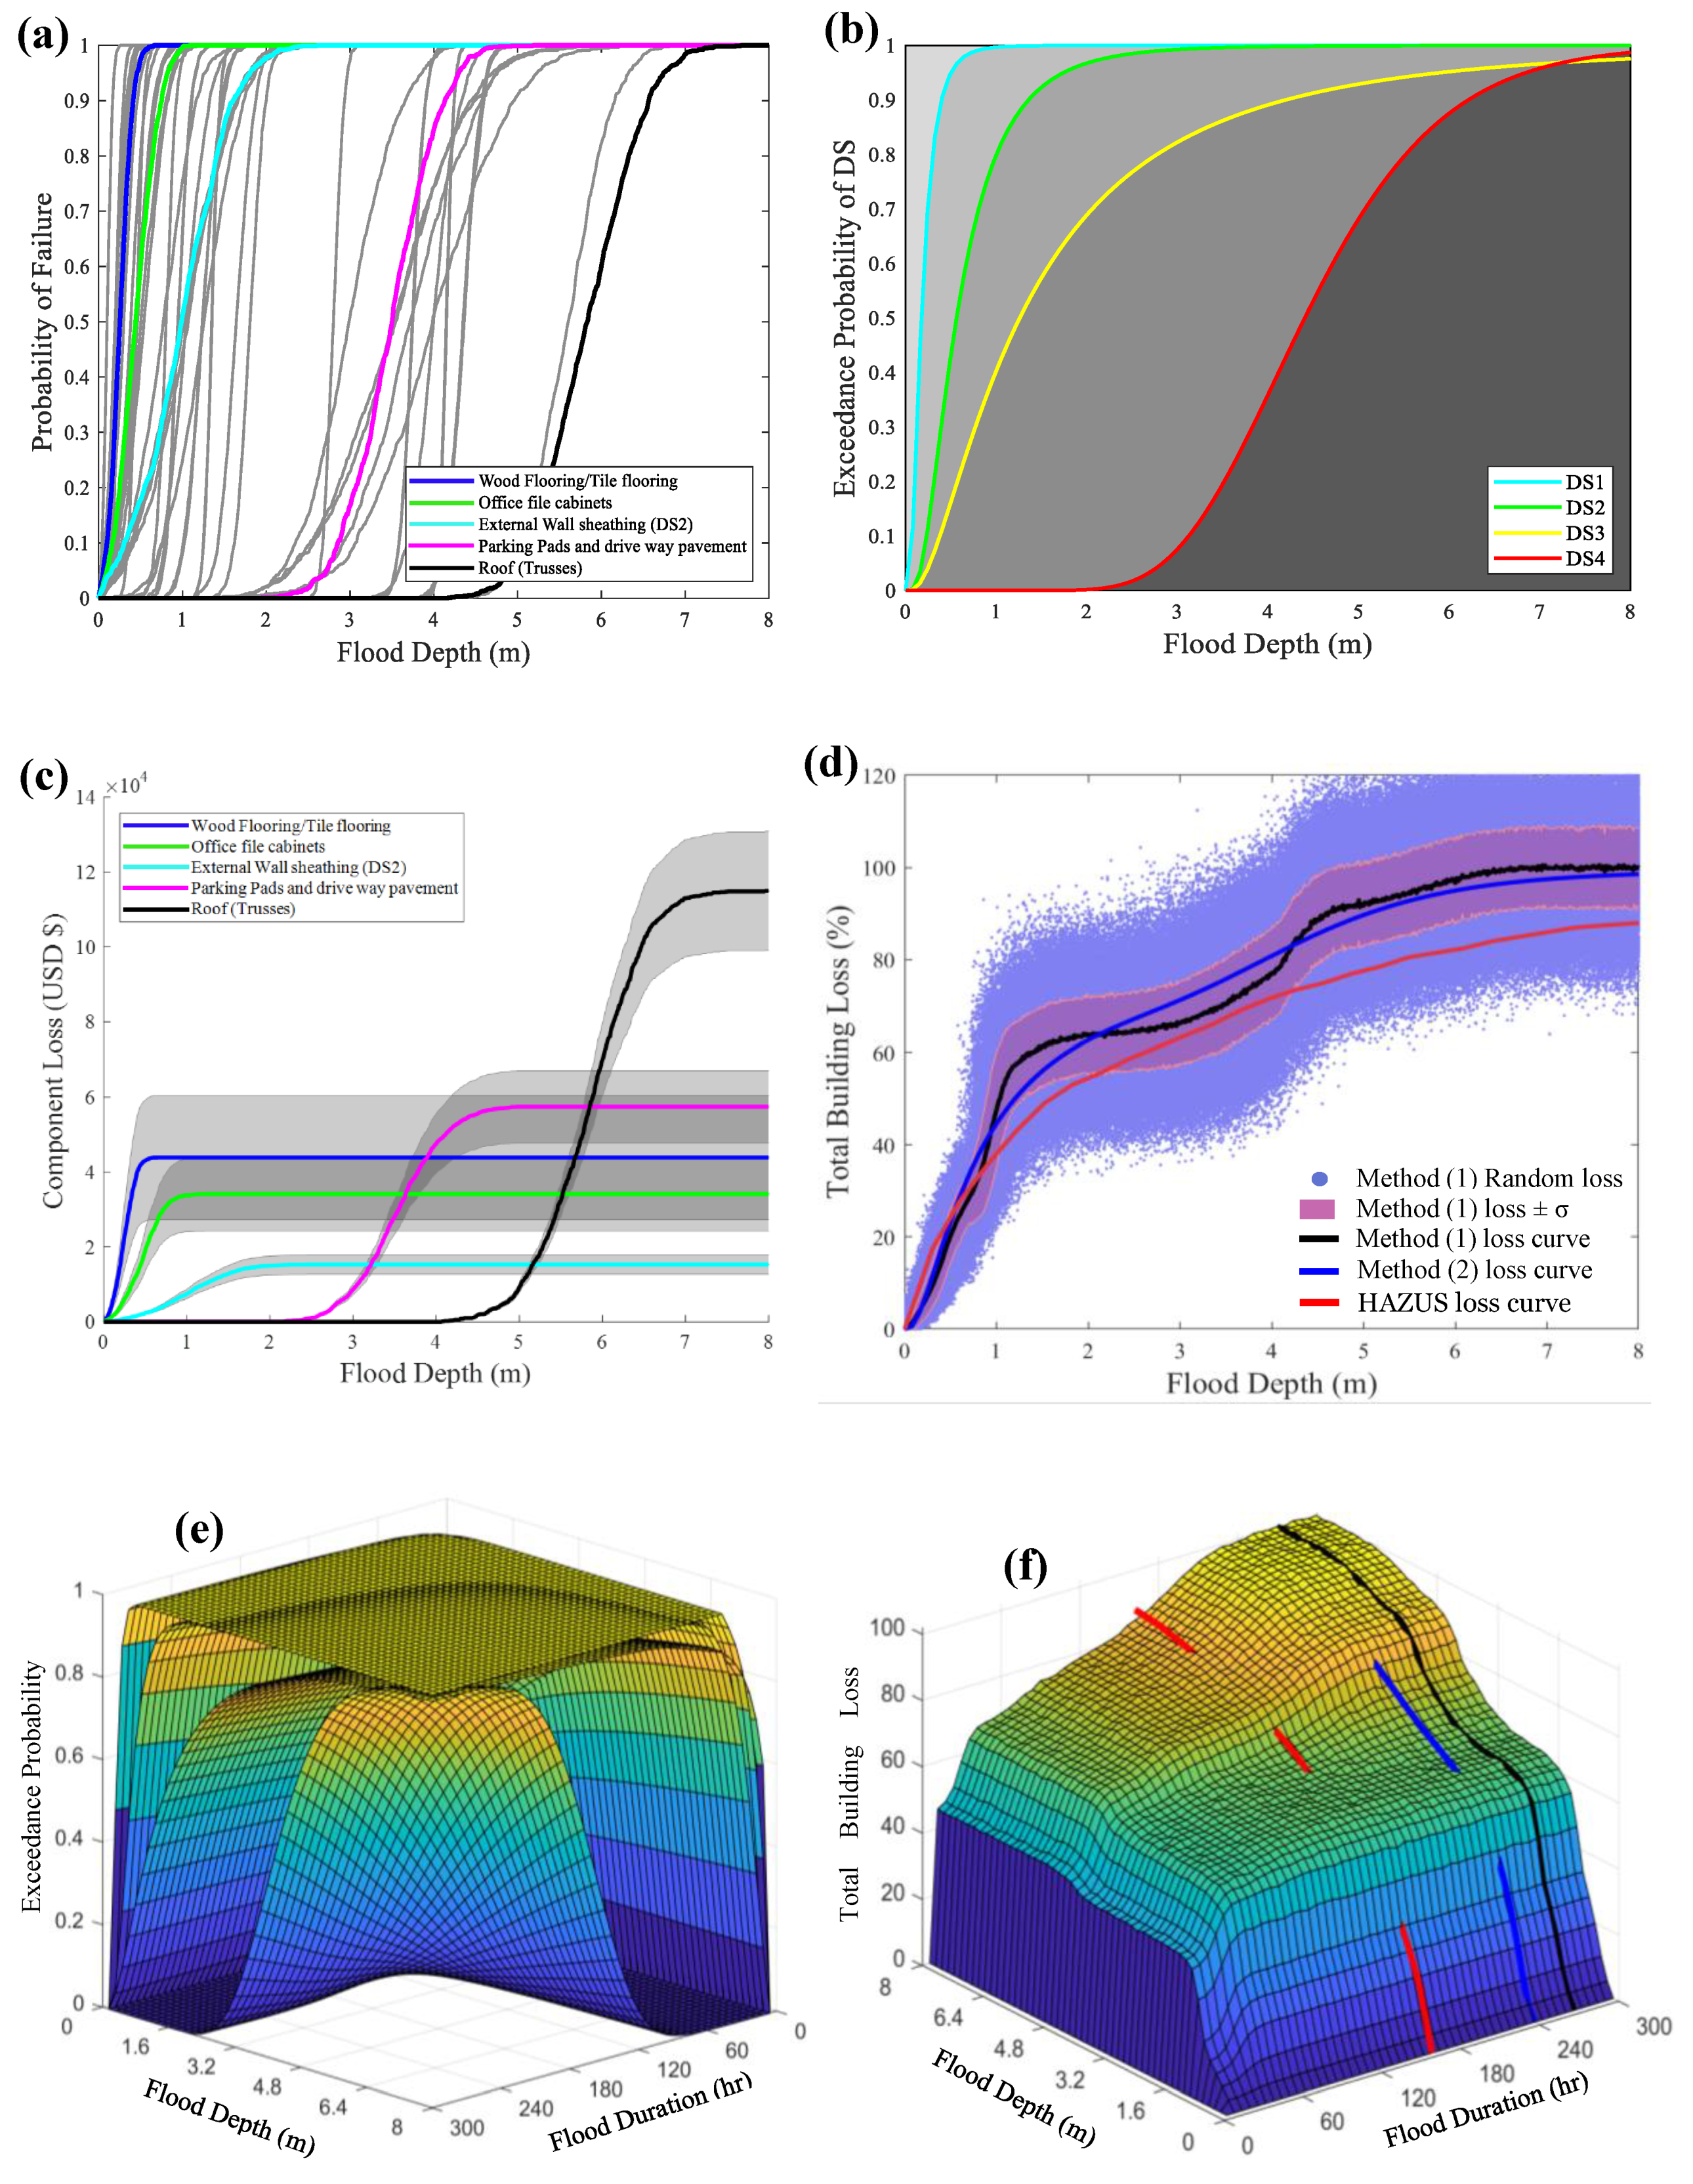
F14 archetype analysis results: (a) Component fragility curves; (b) Building fragility curves; (c) Selected components’ loss curves; (d) Building loss curves; (e) Building fragility surfaces; (f) Building loss surface.
Figure A28.
F14 archetype analysis results: (a) Component fragility curves; (b) Building fragility curves; (c) Selected components’ loss curves; (d) Building loss curves; (e) Building fragility surfaces; (f) Building loss surface.

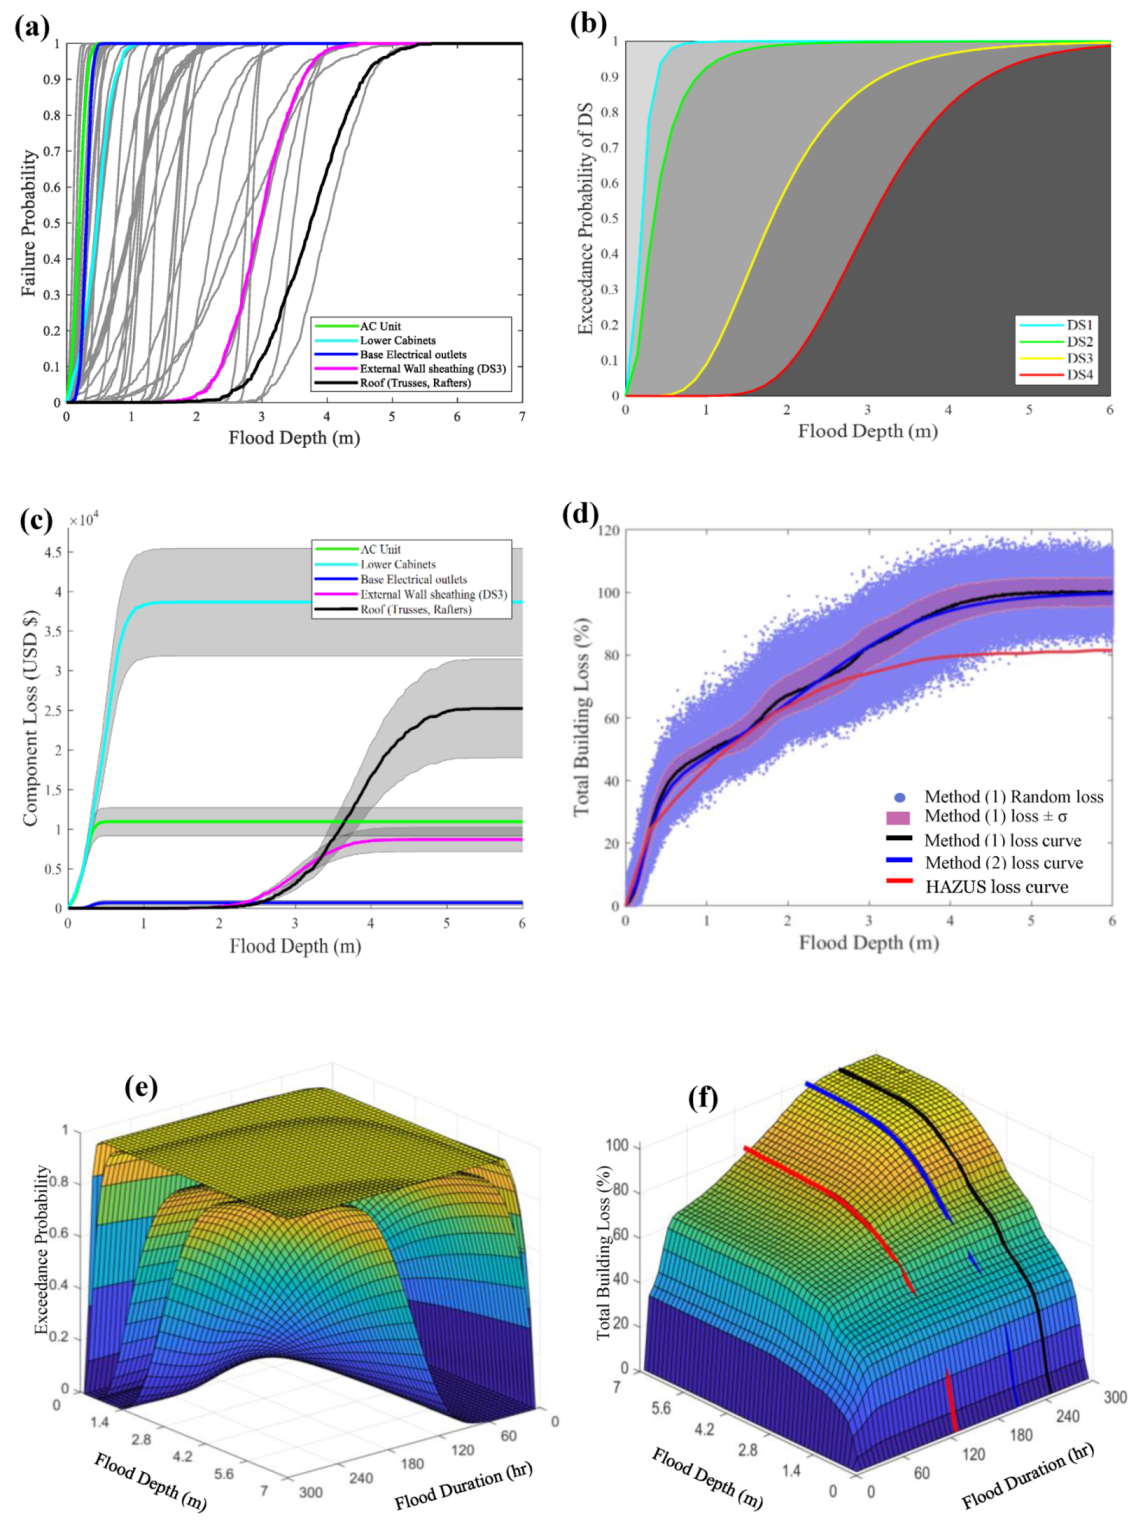
- F15: Warehouse (Small/Large Box)
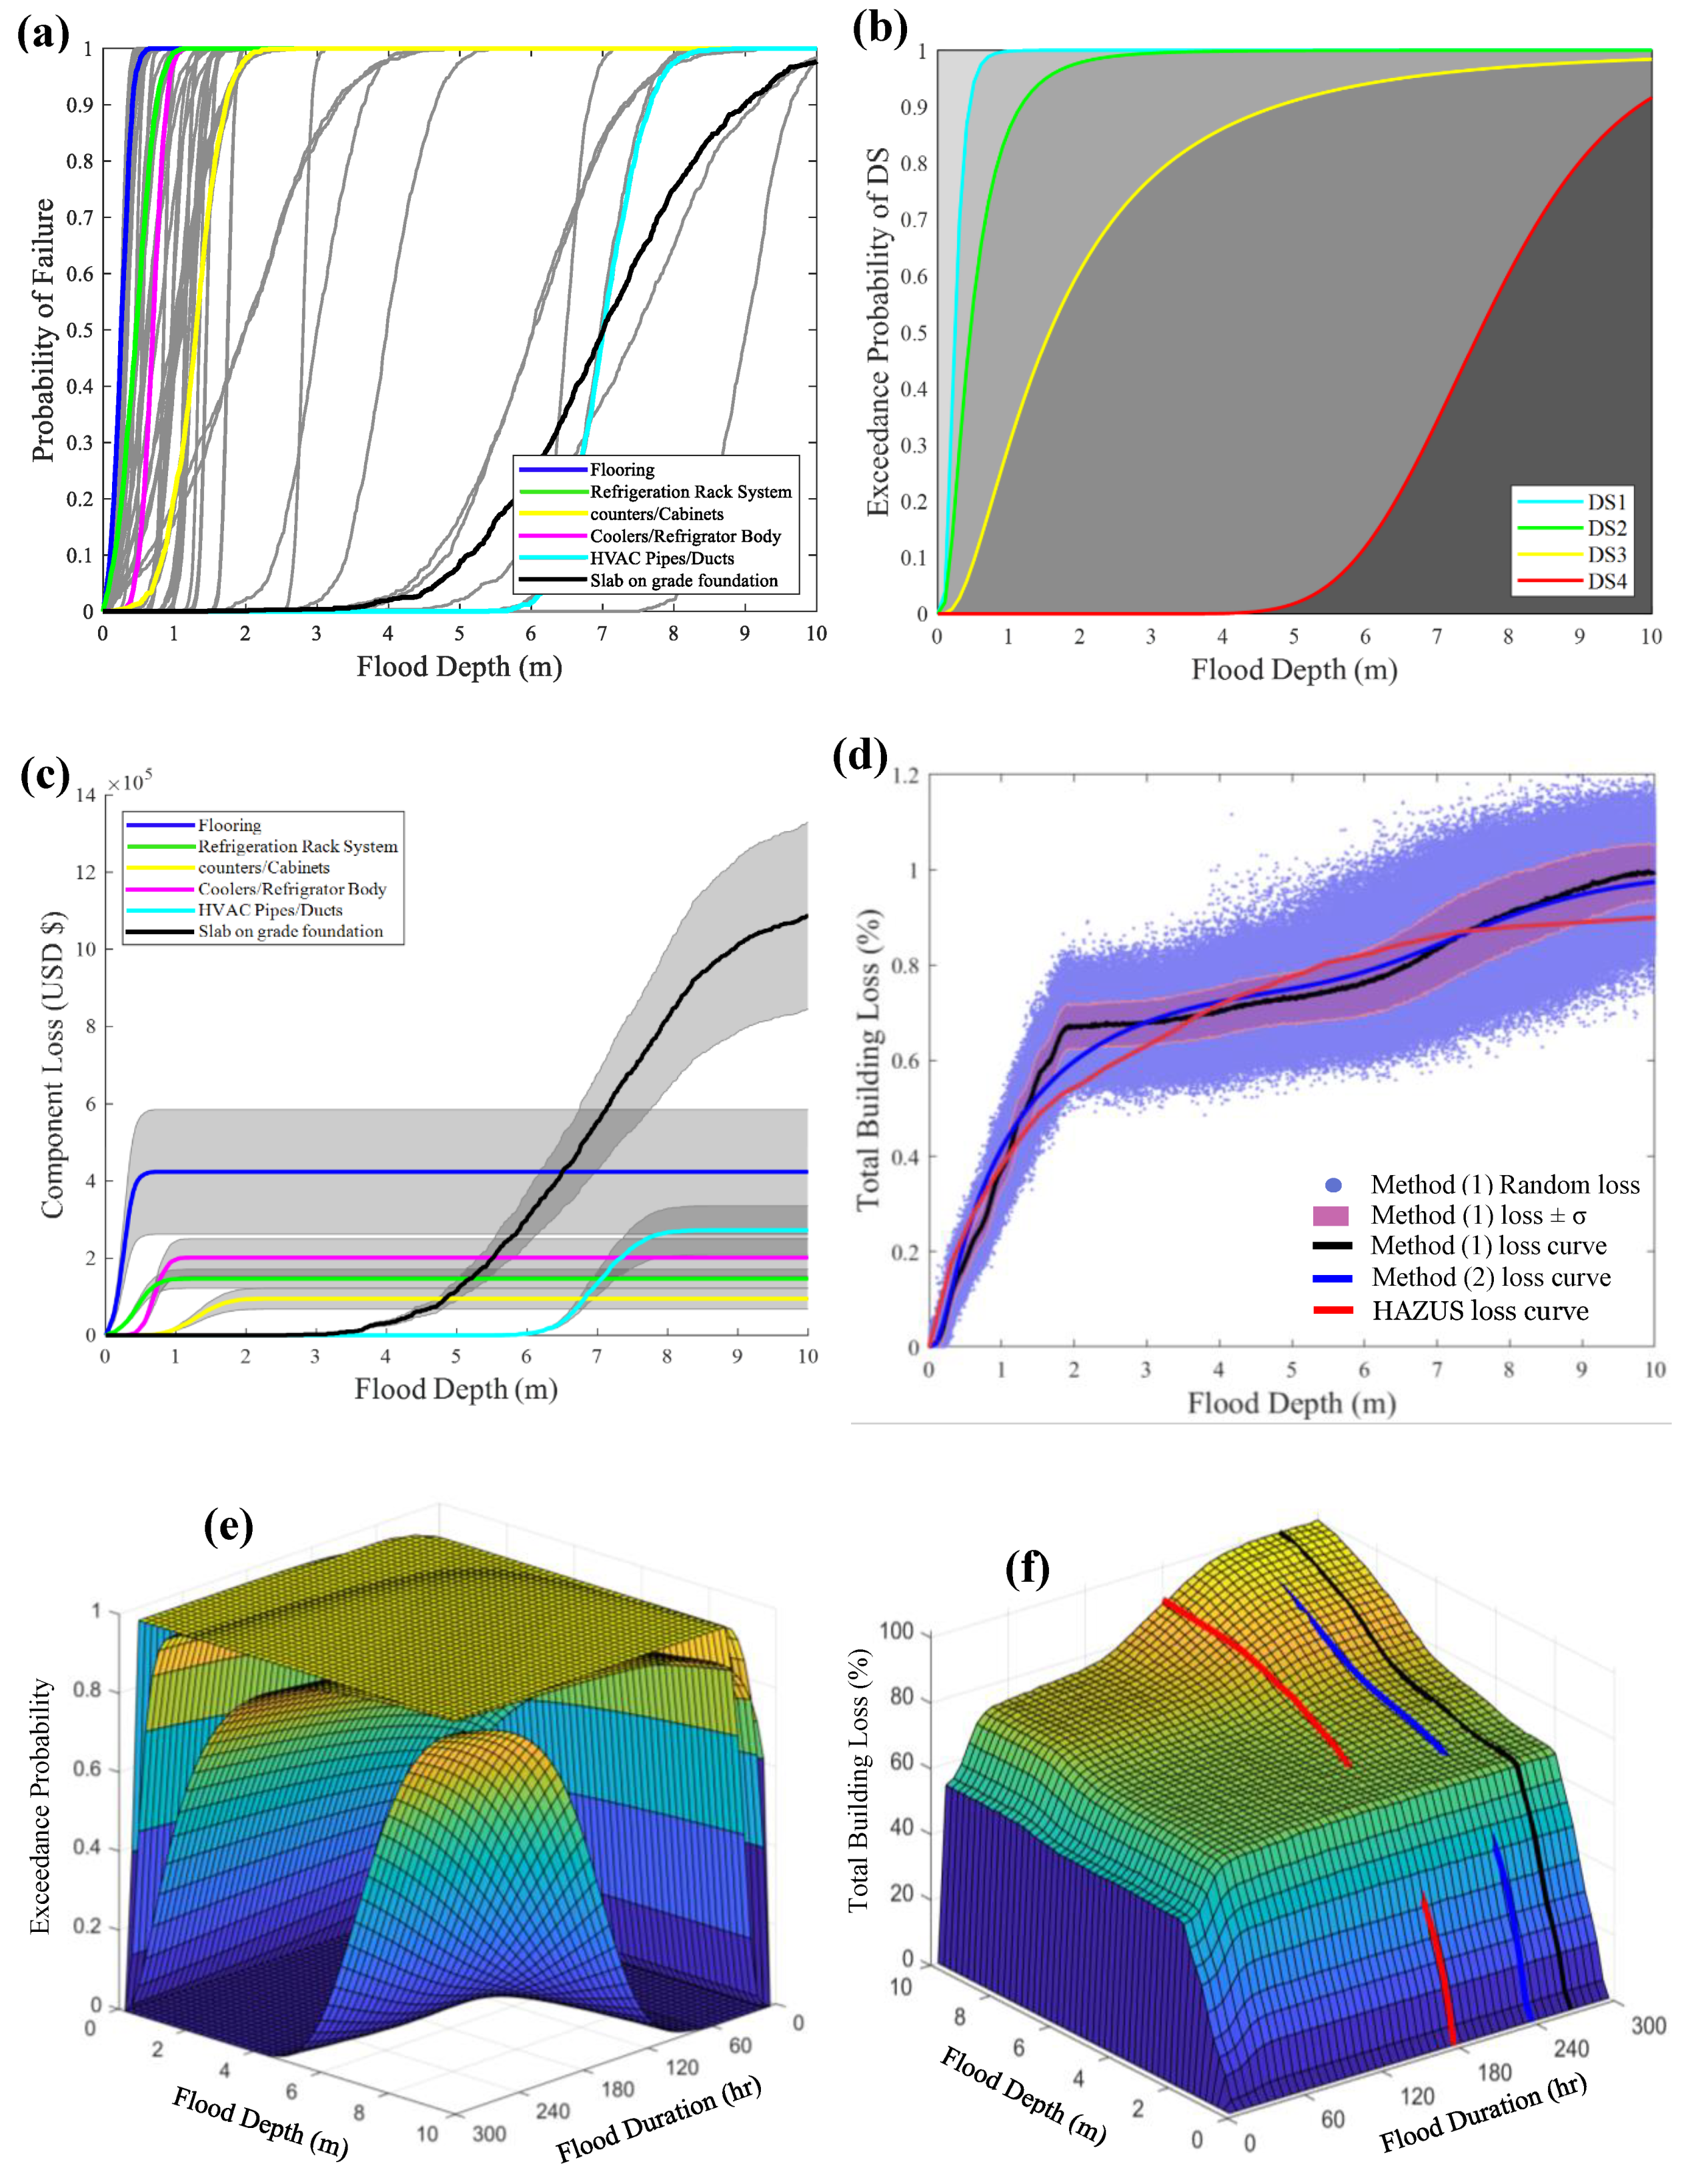
Figure A29.
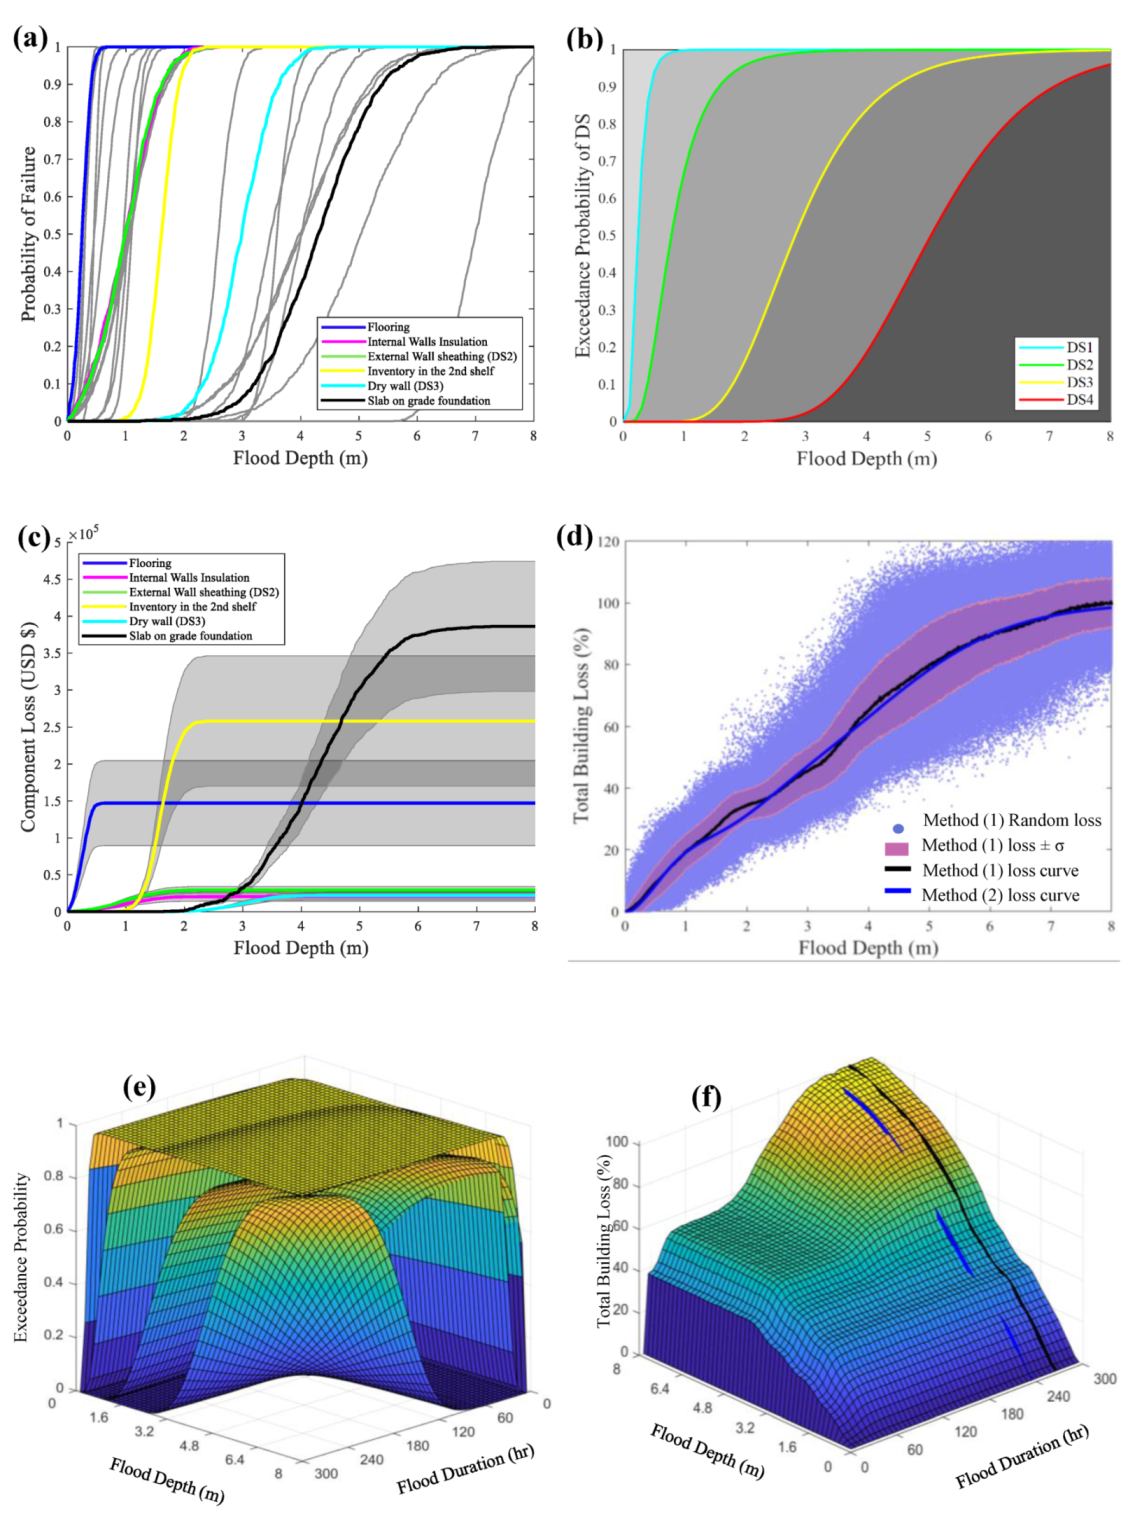
F15 archetype analysis results: (a) Component fragility curves; (b) Building fragility curves; (c) Selected components’ loss curves; (d) Building loss curves; (e) Building fragility surfaces; (f) Building loss surface.
Figure A29.
F15 archetype analysis results: (a) Component fragility curves; (b) Building fragility curves; (c) Selected components’ loss curves; (d) Building loss curves; (e) Building fragility surfaces; (f) Building loss surface.

References
- Jonkman, S.; Kok, M.; Vrijling, J.K. Flood Risk Assessment in the Netherlands: A Case Study for Dike Ring South Holland. Risk Anal. 2008, 28, 1357–1374. [Google Scholar] [CrossRef] [PubMed]
- Veldhuis, M.-C.T.; Clemens, F.H.L.R. Flood risk modelling based on tangible and intangible urban flood damage quantification. Water Sci. Technol. 2010, 62, 189–195. [Google Scholar] [CrossRef]
- Morita, M. Quantification of increased flood risk due to global climate change for urban river management planning. Water Sci. Technol. 2011, 63, 2967–2974. [Google Scholar] [CrossRef] [PubMed]
- Kandilioti, G.; Makropoulos, C. Preliminary flood risk assessment: The case of Athens. Nat. Hazards 2011, 61, 441–468. [Google Scholar] [CrossRef]
- Wyncoll, D.; Gouldby, B. Integrating a multivariate extreme value method within a system flood risk analysis model. J. Flood Risk Manag. 2013, 8, 145–160. [Google Scholar] [CrossRef] [Green Version]
- Pistrika, A.; Tsakiris, G. Flood risk assessment: A methodological framework. Water Resources Management: New Approaches and Technologies. In Proceedings of the European Water Resources Association, Chania, Greece, 14–16 June 2007. [Google Scholar]
- Hemmati, M.; Ellingwood, B.R.; Mahmoud, H.N. The Role of Urban Growth in Resilience of Communities Under Flood Risk. Earth’s Future 2020, 8, 1382. [Google Scholar] [CrossRef] [Green Version]
- Nofal, O.M.; Van De Lindt, J.W. Understanding flood risk in the context of community resilience modeling for the built environment: Research needs and trends. Sustain. Resilient Infrastruct. 2020, 5, 1–17. [Google Scholar] [CrossRef]
- Budiyono, Y.; Aerts, J.; Brinkman, J.; Marfai, M.A.; Ward, P. Flood risk assessment for delta mega-cities: A case study of Jakarta. Nat. Hazards 2014, 75, 389–413. [Google Scholar] [CrossRef]
- Deniz, D.; Arneson, E.E.; Liel, A.B.; Dashti, S.; Javernick-Will, A. Flood loss models for residential buildings, based on the 2013 Colorado floods. Nat. Hazards 2016, 85, 977–1003. [Google Scholar] [CrossRef]
- Romali, N.S.; Yusop, Z.; Ismail, Z. Flood Damage Assessment: A Review of Flood Stage–Damage Function Curve. In ISFRAM 2014; Bakar, W.S.H.A., Tahir, M.A., Wahid, S.R.M., Nasir, R., Hassan, Eds.; Springer: New York, NY, USA, 2015; pp. 147–159. [Google Scholar]
- Scawthorn, C.; Flores, P.; Blais, N.; Seligson, H.; Tate, E.; Chang, S.; Mifflin, E.; Thomas, W.; Murphy, J.; Jones, C.; et al. HAZUS-MH Flood Loss Estimation Methodology. II. Damage and Loss Assessment. Nat. Hazards Rev. 2006, 7, 72–81. [Google Scholar] [CrossRef]
- Oubennaceur, K.; Chokmani, K.; Nastev, M.; Lhissou, R.; El Alem, A. Flood risk mapping for direct damage to residential buildings in Quebec, Canada. Int. J. Disaster Risk Reduct. 2019, 33, 44–54. [Google Scholar] [CrossRef]
- Nascimento, N. Flood-damage curves: Methodological development for the Brazilian context. Water Pract. Technol. 2006, 1. [Google Scholar] [CrossRef]
- Pistrika, A.K.; Jonkman, S.N. Damage to residential buildings due to flooding of New Orleans after hurricane Katrina. Nat. Hazards 2009, 54, 413–434. [Google Scholar] [CrossRef]
- Garrote, J.; Bernal, N. On the Influence of the Main Floor Layout of Buildings in Economic Flood Risk Assessment: Results from Central Spain. Water 2020, 12, 670. [Google Scholar] [CrossRef] [Green Version]
- Martínez-Gomariz, E.; Forero-Ortiz, E.; Hidalga, M.G.; Castán, S.; Gómez, M. Flood Depth‒Damage Curves for Spanish Urban Areas. Sustainability 2020, 12, 2666. [Google Scholar] [CrossRef] [Green Version]
- Naumann, T.; Johannes, N.; Sebastian, G. Synthetic Depth-Damage Functions—A Detailed Tool for Analysing Flood Resilience of Building Types in Road Map towards a Flood Resilient Urban Environment. In Proceedings of the Final Conference of the COST Action C. 2009. Available online: https://www.researchgate.net/publication/259036588_Synthetic_depth-damage_functions_-_A_detailed_tool_for_analysing_flood_resilience_of_building_types (accessed on 10 August 2020).
- Dottori, F.; Figueiredo, R.; Martina, M.; Molinari, D.; Scorzini, A.R. INSYDE: A synthetic, probabilistic flood damage model based on explicit cost analysis. Nat. Hazards Earth Syst. Sci. 2016, 16, 2577–2591. [Google Scholar] [CrossRef] [Green Version]
- Velasco, M.; Cabello, À.; Russo, B. Flood damage assessment in urban areas. Application to the Raval district of Barcelona using synthetic depth damage curves. Urban Water J. 2015, 13, 426–440. [Google Scholar] [CrossRef]
- Chinh, D.T.; Dung, N.V.; Gain, A.K.; Kreibich, H. Flood Loss Models and Risk Analysis for Private Households in Can Tho City, Vietnam. Water 2017, 9, 313. [Google Scholar] [CrossRef]
- Hanák, T.; Tuscher, M.; Přibyl, O. Hybrid Genetic Algorithm-Based Approach for Estimating Flood Losses on Structures of Buildings. Sustainability 2020, 12, 3047. [Google Scholar] [CrossRef] [Green Version]
- FEMA. Multi-Hazard Loss Estimation Methodology: Flood Model (HAZUS-MH MR5) Technical Manual; Federal Emergency Management Agency: Washington, DC, USA, 2009.
- FEMA. Multi-Hazard Loss Estimation Methodology: Earthquake Model (HAZUS-MH MR5) Technical Manual; Federal Emergency Management Agency: Washington, DC, USA, 2009.
- FEMA. Multi-Hazard Loss Estimation Methodology: Hurricane Model(HAZUS-MH MR5) Technical Manual; Federal Emergency Management Agency: Washington, DC, USA, 2009.
- Handmer, J. The chimera of precision: Inherent uncertainties in disaster loss assessment. Int. J. Mass Emerg. Disasters 2002, 20, 325–346. [Google Scholar]
- De Moel, H.; Aerts, J.C.J.H. Effect of uncertainty in land use, damage models and inundation depth on flood damage estimates. Nat. Hazards 2010, 58, 407–425. [Google Scholar] [CrossRef] [Green Version]
- Freni, G.; La Loggia, G.; Notaro, V. Uncertainty in urban flood damage assessment due to urban drainage modelling and depth-damage curve estimation. Water Sci. Technol. 2010, 61, 2979–2993. [Google Scholar] [CrossRef] [PubMed]
- Wagenaar, D.; De Bruijn, K.M.; Bouwer, L.M.; De Moel, H. Uncertainty in flood damage estimates and its potential effect on investment decisions. Nat. Hazards Earth Syst. Sci. 2016, 16, 1–14. [Google Scholar] [CrossRef] [Green Version]
- Hall, J.W.; Solomatine, D. A framework for uncertainty analysis in flood risk management decisions. Int. J. River Basin Manag. 2008, 6, 85–98. [Google Scholar] [CrossRef] [Green Version]
- Molinari, D.; Scorzini, A.R. On the Influence of Input Data Quality to Flood Damage Estimation: The Performance of the INSYDE Model. Water 2017, 9, 688. [Google Scholar] [CrossRef] [Green Version]
- Teng, J.; Jakeman, A.; Vaze, J.; Croke, B.F.; Dutta, D.; Kim, S. Flood inundation modelling: A review of methods, recent advances and uncertainty analysis. Environ. Model. Softw. 2017, 90, 201–216. [Google Scholar] [CrossRef]
- Mukolwe, M.M. Flood Hazard Mapping: Uncertainty and its Value in the Decision-Making Process. Ph.D. Thesis, Delft University of Technology, Delft, The Netherlands, 2017. [Google Scholar]
- Domeneghetti, A.; Vorogushyn, S.; Castellarin, A.; Merz, B.; Brath, A. Probabilistic flood hazard mapping: Effects of uncertain boundary conditions. Hydrol. Earth Syst. Sci. 2013, 17, 3127–3140. [Google Scholar] [CrossRef] [Green Version]
- Merwade, V.; Olivera, F.; Arabi, M.; Edleman, S. Uncertainty in Flood Inundation Mapping: Current Issues and Future Directions. J. Hydrol. Eng. 2008, 13, 608–620. [Google Scholar] [CrossRef] [Green Version]
- Candela, A.; Aronica, G.T. Probabilistic Flood Hazard Mapping Using Bivariate Analysis Based on Copulas. ASCE-ASME J. Risk Uncertain. Eng. Syst. Part A Civ. Eng. 2017, 3, A4016002. [Google Scholar] [CrossRef]
- Dubois, D.; Guyonnet, D. Risk-informed decision-making in the presence of epistemic uncertainty. Int. J. Gen. Syst. 2011, 40, 145–167. [Google Scholar] [CrossRef] [Green Version]
- McAllister, T.P. Research Needs for Developing a Risk-Informed Methodology for Community Resilience. J. Struct. Eng. 2016, 142. [Google Scholar] [CrossRef]
- Rosowsky, D.V.; Ellingwood, B.R. Performance-Based Engineering of Wood Frame Housing: Fragility Analysis Methodology. J. Struct. Eng. 2002, 128, 32–38. [Google Scholar] [CrossRef]
- Memari, M.; Attary, N.; Masoomi, H.; Mahmoud, H.; Van De Lindt, J.W.; Pilkington, S.; Ameri, R. Minimal Building Fragility Portfolio for Damage Assessment of Communities Subjected to Tornadoes. J. Struct. Eng. 2018, 144, 4018072. [Google Scholar] [CrossRef]
- Ellingwood, B.R.; Celik, O.C.; Kinali, K. Fragility assessment of building structural systems in Mid-America. Earthq. Eng. Struct. Dyn. 2007, 36, 1935–1952. [Google Scholar] [CrossRef]
- Suppasri, A.; Mas, E.; Charvet, I.; Gunasekera, R.; Imai, K.; Fukutani, Y.; Abe, Y.; Imamura, F. Building damage characteristics based on surveyed data and fragility curves of the 2011 Great East Japan tsunami. Nat. Hazards 2012, 66, 319–341. [Google Scholar] [CrossRef] [Green Version]
- Rehman, K.; Cho, Y.-S. Building Damage Assessment Using Scenario Based Tsunami Numerical Analysis and Fragility Curves. Water 2016, 8, 109. [Google Scholar] [CrossRef] [Green Version]
- Attary, N.; Unnikrishnan, V.U.; Van De Lindt, J.W.; Cox, D.T.; Barbosa, A.R. Performance-Based Tsunami Engineering methodology for risk assessment of structures. Eng. Struct. 2017, 141, 676–686. [Google Scholar] [CrossRef] [Green Version]
- Ellingwood, B.R.; Cutler, H.; Gardoni, P.; Peacock, W.G.; Van De Lindt, J.W.; Wang, N. The Centerville Virtual Community: A fully integrated decision model of interacting physical and social infrastructure systems. Sustain. Resilient Infrastruct. 2016, 1, 95–107. [Google Scholar] [CrossRef]
- Lin, P.; Wang, N. Building portfolio fragility functions to support scalable community resilience assessment. Sustain. Resilient Infrastruct. 2016, 1, 108–122. [Google Scholar] [CrossRef]
- Soetanto, R.; Proverbs, D. Impact of flood characteristics on damage caused to UK domestic properties: The perceptions of building surveyors. Struct. Surv. 2004, 22, 95–104. [Google Scholar] [CrossRef] [Green Version]
- Middelmann-Fernandes, M. Flood damage estimation beyond stage-damage functions: An Australian example. J. Flood Risk Manag. 2010, 3, 88–96. [Google Scholar] [CrossRef]
- Kelman, I.; Spence, R. An overview of flood actions on buildings. Eng. Geol. 2004, 73, 297–309. [Google Scholar] [CrossRef]
- Pistrika, A.; Tsakiris, G.; Nalbantis, I. Flood Depth-Damage Functions for Built Environment. Environ. Process. 2014, 1, 553–572. [Google Scholar] [CrossRef] [Green Version]
- Scorzini, A.R.; Frank, E. Flood damage curves: New insights from the 2010 flood in Veneto, Italy. J. Flood Risk Manag. 2015, 10, 381–392. [Google Scholar] [CrossRef]
- Frongia, S.; Ruiu, A.; Sechi, G.M. Water depth-damage functions for flood direct tangible damage evaluation in built-up areas in Sardinia (Italy). In Proceedings of the 10th World Congress of EWRA on Water Resources and Environment, Athens, Greece, 5–9 July 2017; pp. 3–10. [Google Scholar]
- Pistrika, A. Flood damage estimation based on flood simulation scenarios and a GIS platform. Eur. Water 2010, 30, 3–11. [Google Scholar]
- Marvi, M.T. A review of flood damage analysis for a building structure and contents. Nat. Hazards 2020, 102, 967–995. [Google Scholar] [CrossRef]
- Tomiczek, T.; Kennedy, A.; Zhang, Y.; Owensby, M.; Hope, M.E.; Lin, N.; Flory, A. Hurricane Damage Classification Methodology and Fragility Functions Derived from Hurricane Sandy’s Effects in Coastal New Jersey. J. Waterw. Port Coastal Ocean Eng. 2017, 143, 4017027. [Google Scholar] [CrossRef]
- Do, T.Q.; Van De Lindt, J.W.; Cox, D.T. Hurricane Surge-Wave Building Fragility Methodology for Use in Damage, Loss, and Resilience Analysis. J. Struct. Eng. 2020, 146, 4019177. [Google Scholar] [CrossRef]
- Masoomi, H.; Van De Lindt, J.W.; Ameri, R.; Do, T.Q.; Webb, B. Combined Wind-Wave-Surge Hurricane-Induced Damage Prediction for Buildings. J. Struct. Eng. 2019, 145, 4018227. [Google Scholar] [CrossRef]
- Charvet, I.; Macabuag, J.; Rossetto, T. Estimating Tsunami-Induced Building Damage through Fragility Functions: Critical Review and Research Needs. Front. Built Environ. 2017, 3, 36. [Google Scholar] [CrossRef]
- Reese, S.; Bradley, B.A.; Bind, J.; Smart, G.; Power, W.; Sturman, J. Empirical building fragilities from observed damage in the 2009 South Pacific tsunami. Earth-Science Rev. 2011, 107, 156–173. [Google Scholar] [CrossRef]
- Massarra, C.C.; Friedland, C.J.; Marx, B.D.; Dietrich, J.C. Predictive multi-hazard hurricane data-based fragility model for residential homes. Coast. Eng. 2019, 151, 10–21. [Google Scholar] [CrossRef]
- Nadal, N.C.; Zapata, R.E.; Pagán, I.; Lopez, R.; Agudelo, J. Building Damage due to Riverine and Coastal Floods. J. Water Resour. Plan. Manag. 2010, 136, 327–336. [Google Scholar] [CrossRef]
- FEMA. Guidance for Flood Risk Analysis and Mapping: Shallow Flooding Analyses and Mapping. 2016. Available online: https://www.fema.gov/media-library-data/1484865782763-4d150592d6eae9fdb5e2c2ab597928a6/Shallow_Flooding_Guidance_Nov_2016.pdf (accessed on 10 August 2020).
- De Risi, R.; Jalayer, F.; De Paola, F.; Iervolino, I.; Giugni, M.; Topa, M.E.; Mbuya, E.; Kyessi, A.; Manfredi, G.; Gasparini, P. Flood risk assessment for informal settlements. Nat. Hazards 2013, 69, 1003–1032. [Google Scholar] [CrossRef]
- Van De Lindt, J.W.; Taggart, M. Fragility Analysis Methodology for Performance-Based Analysis of Wood-Frame Buildings for Flood. Nat. Hazards Rev. 2009, 10, 113–123. [Google Scholar] [CrossRef]
- Deniz, D.; Sutley, E.J.; Lindt, v.d.J.W.; Peacock, W.G.; Rosenheim, N.; Gu, D.; Mitrani-Reiser, J.; Dillard, M.; Koliou, M.; Hamideh, S. Flood Performance and Dislocation Assessment for Lumberton Homes after Hurricane Matthew. In Proceedings of the 13th International Conference on Applications of Statistics and Probability in Civil Engineering (ICASP13), Seoul, Korea, 26–30 May 2019. [Google Scholar] [CrossRef]
- Van de Lindt, J.W.; Peacock, W.G.; Mitrani-Reiser, J.; Rosenheim, N.; Deniz, D.; Dillard, M.K.; Tomiczek, T.; Koliou, M.; Graettinger, A.; Crawford, S.; et al. The Lumberton, North Carolina Flood of 2016: A Community Resilience Focused Technical Investigation; National Institute of Standards and Technology: Gaithersburg, MD, USA, 2018. [Google Scholar]
- Sairam, N.; Schröter, K.; Carisi, F.; Wagenaar, D.; Domeneghetti, A.; Molinari, D.; Brill, F.; Priest, S.; Viavattene, C.; Merz, B.; et al. Bayesian Data-Driven approach enhances synthetic flood loss models. Environ. Model. Softw. 2020, 104798. [Google Scholar] [CrossRef]
- McGrath, H.; El Ezz, A.A.; Nastev, M. Probabilistic depth–damage curves for assessment of flood-induced building losses. Nat. Hazards 2019, 97, 1–14. [Google Scholar] [CrossRef]
- Nofal, O.M.; van de Lindt, J.W.; Do, T.Q. Multi-variate and Single-Variable Flood Fragility and Loss Approaches for Buildings. Reliab. Eng. Syst. Saf. 2020. [Google Scholar] [CrossRef]
- Nofal, O.M.; Van De Lindt, J.W. Probabilistic Flood Loss Assessment at the Community Scale: Case Study of 2016 Flooding in Lumberton, North Carolina. ASCE-ASME J. Risk Uncertain. Eng. Syst. Part A Civ. Eng. 2020, 6. [Google Scholar] [CrossRef]
- Autodesk, Autodesk Revit Architecture. 2020. Available online: https://www.autodesk.com/products/revit/architecture (accessed on 10 August 2020).
- World Health Organization, Medical Devices by Facility Provincial Hospital. 2020. Available online: https://www.who.int/medical_devices/innovation/health_care_facility/en/ (accessed on 10 August 2020).
- Cost Finder. How Much Does It Cost to Build a Hospital. 2020. Available online: http://cost-finder.com/how-much-does-it-cost-to-build-a-hospital/ (accessed on 10 August 2020).
Figure 1.
A schematic representation of the methodology that has been applied in this research to account for fragility and loss curves/surfaces for a portfolio of minimal building archetype.
Figure 1.
A schematic representation of the methodology that has been applied in this research to account for fragility and loss curves/surfaces for a portfolio of minimal building archetype.

Figure 2.
Components and building fragility functions: (a) Component fragility curves for the fourth damage state (DS4) components along with their failure probability at flood depth = 3.0 m; (b) Fitted (Solid lines) and non-fitted (dashed lines) building fragility curves.
Figure 2.
Components and building fragility functions: (a) Component fragility curves for the fourth damage state (DS4) components along with their failure probability at flood depth = 3.0 m; (b) Fitted (Solid lines) and non-fitted (dashed lines) building fragility curves.

Figure 3.
A schematic illustration of the approaches used to develop flood fragility and loss functions.
Figure 3.
A schematic illustration of the approaches used to develop flood fragility and loss functions.

Figure 4.
Schematic representation of using minimum building archetypes portfolio to model a community.
Figure 4.
Schematic representation of using minimum building archetypes portfolio to model a community.

Figure 5.
Components’ results for the F10 one-story school building archetype: (a) Components’ fragility curves; (b) Components’ loss curves.
Figure 5.
Components’ results for the F10 one-story school building archetype: (a) Components’ fragility curves; (b) Components’ loss curves.

Figure 6.
2D building results for the F10 one-story school building archetype: (a) Fragility curves; (b) Loss curves.
Figure 6.
2D building results for the F10 one-story school building archetype: (a) Fragility curves; (b) Loss curves.

Figure 7.
3D building results for the F10 one-story school building archetype: (a) Fragility surfaces; (b) Loss surface.
Figure 7.
3D building results for the F10 one-story school building archetype: (a) Fragility surfaces; (b) Loss surface.

Figure 8.
Building archetypes’ fragility curves: (a) DS0; (b) DS1; (c) DS2; (d) DS3; (e) DS4.

Figure 9.
Building archetypes’ normalized loss curves: (a) Loss curves using direct loss approach (M1); (b) Loss curves using fragility-based approach (M2).
Figure 9.
Building archetypes’ normalized loss curves: (a) Loss curves using direct loss approach (M1); (b) Loss curves using fragility-based approach (M2).


Table 1.
Anticipated functionality level for each damage state along with their damage scale and damage ratio as a percentage of the total building replacement cost.
Table 1.
Anticipated functionality level for each damage state along with their damage scale and damage ratio as a percentage of the total building replacement cost.
| DS Level | Functionality | Damage Scale | Loss Ratio |
|---|---|---|---|
| DS0 | Operational | Insignificant | 0.00–0.03 |
| DS1 | Limited Occupancy | Slight | 0.03–0.15 |
| DS2 | Restricted Occupancy | Moderate | 0.15–0.50 |
| DS3 | Restricted Use | Extensive | 0.50–0.70 |
| DS4 | Restricted Entry | Complete | 0.70–1.00 |
Table 2.
Damage states description.
| DS | Description |
|---|---|
| DS0 | Insignificant damage to components below first-floor elevation. Water enters crawlspace/basement and touches foundation (crawlspace or slab on grade). Damage to components within the crawlspace/basement including base insulation and stored inventory. Minor damage to garage interiors including drywall, cabinets, electrical outlets, wall insulation (Garage is below the first-flood elevation (FFE)). No sewer backup into the living area. |
| DS1 | Water touches floor joists up to minor water entering the building. Damage to carpets, pads, baseboards, flooring. Damage to the external AC unit (if the AC unit is not elevated) and the attached ductworks (if ductworks are in the crawlspace). Complete damage to the garage interior (if the garage is below FFE). No drywall damages with the potential of some mold on the subfloor above the crawlspace. Could have a minor sewer backup and/or minor mold issue. |
| DS2 | Partial damage to drywalls along with damage to electrical components (base-outlets), water heater, and furnace. Complete damage to major equipment, appliances, and furniture on the first floor. Damage to the lower bathroom and kitchen cabinets. Doors and windows may need replacement. Could have a major sewer backup and major mold issues. |
| DS3 | Damage to the non-structural components and interiors within the whole building including (but not limited to) drywall damage to upper stories for multi-story buildings (e.g., attic, second story, etc.). Electrical switches and mid-outlets are destroyed. Damage to bathroom/kitchen upper cabinets, lighting fixtures on walls are destroyed with potential damage to ceiling lighting fixtures. Studs reusable; some may be damaged. Major sewer backup will happen along with major mold issues. Equipment, appliances, and furniture on the upper floors are also damaged (e.g., attic, second floor, etc.). |
| DS4 | Significant structural damage present (e.g., studs, trusses, joists, etc.). Non-structural components and interiors are destroyed including all drywall, appliances, cabinets, furniture, etc. Damage to rooftop units/components including roof insulation, sheathing, and electro-mechanical systems (rooftop AC units, electrical systems, cable railing, sound system, etc.). Foundation could be floated off. The building must be demolished or potentially replaced. |
Table 3.
The building archetypes’ descriptions (more details provided in Appendix A).
Table 3.
The building archetypes’ descriptions (more details provided in Appendix A).
| Building Archetype | Building Description |
|---|---|
| F1 | One-story single-family residential building on a crawlspace foundation |
| F2 | One-story multi-family residential building on a slab-on-grade foundation |
| F3 | Two-story single-family residential building on a crawlspace foundation |
| F4 | Two-story multi-family residential building on a slab-on-grade foundation |
| F5 | Small grocery store/Gas station with a convenience store |
| F6 | Multi-unit retail building (strip mall) |
| F7 | Small multi-unit commercial building |
| F8 | Super retail center |
| F9 | Industrial building |
| F10 | One-story school |
| F11 | Two-story school |
| F12 | Hospital/Clinic |
| F13 | Community center (place of worship) |
| F14 | Office building |
| F15 | Warehouse (small/large box) |
Table 4.
Lognormal parameters of the developed fragility functions for the 15 building archetypes (metric units).
Table 4.
Lognormal parameters of the developed fragility functions for the 15 building archetypes (metric units).
| Archetype | DS0 | DS1 | DS2 | DS3 | DS4 | |||||
|---|---|---|---|---|---|---|---|---|---|---|
| λ | ξ | λ | ξ | λ | ξ | λ | ξ | λ | ξ | |
| F1 | −1.187 | 0.849 | −0.106 | 0.397 | 0.333 | 0.220 | 1.173 | 0.278 | 1.405 | 0.227 |
| F2 | - | - | −1.664 | 0.533 | −1.064 | 0.745 | 0.589 | 0.439 | 1.122 | 0.294 |
| F3 | −1.001 | 0.639 | −0.109 | 0.414 | 0.393 | 0.233 | 1.512 | 0.240 | 1.693 | 0.322 |
| F4 | - | - | −1.666 | 0.553 | −0.984 | 0.798 | 1.214 | 0.288 | 1.477 | 0.389 |
| F5 | - | - | −1.595 | 0.486 | −0.827 | 0.616 | 0.533 | 0.681 | 1.435 | 0.242 |
| F6 | - | - | −1.461 | 0.493 | −0.798 | 0.740 | 0.450 | 0.860 | 2.029 | 0.191 |
| F7 | - | - | −1.419 | 0.462 | −0.736 | 0.745 | 0.456 | 0.724 | 1.585 | 0.198 |
| F8 | - | - | −1.420 | 0.467 | −0.908 | 0.681 | 0.412 | 0.913 | 2.025 | 0.195 |
| F9 | - | - | −1.470 | 0.475 | −0.540 | 0.667 | 0.865 | 0.928 | 2.023 | 0.153 |
| F10 | - | - | −1.570 | 0.502 | −0.681 | 0.738 | 0.824 | 0.531 | 1.573 | 0.186 |
| F11 | - | - | −1.546 | 0.488 | −0.678 | 0.740 | 1.388 | 0.435 | 2.006 | 0.254 |
| F12 | - | - | −1.434 | 0.471 | −0.594 | 0.586 | 1.034 | 0.742 | 2.051 | 0.146 |
| F13 | - | - | −1.622 | 0.492 | −0.911 | 0.660 | 1.418 | 0.506 | 1.968 | 0.187 |
| F14 | - | - | −1.757 | 0.658 | −0.581 | 0.687 | 0.229 | 0.928 | 1.482 | 0.269 |
| F15 | - | - | −1.450 | 0.463 | −0.228 | 0.532 | 1.038 | 0.350 | 1.618 | 0.262 |
The fill color for each table is necessary to match the fill color of each Damage State in Figure 6.
Table 5.
Damage states replacement cost data for each building archetype (µr: mean DS replacement cost USD $, σr: standard deviation of DS replacement cost USD $, µrc: mean cumulative DS replacement cost USD $, Lr %: normalized DS loss ratio, and Lrc %: normalized cumulative DS loss ratio).
Table 5.
Damage states replacement cost data for each building archetype (µr: mean DS replacement cost USD $, σr: standard deviation of DS replacement cost USD $, µrc: mean cumulative DS replacement cost USD $, Lr %: normalized DS loss ratio, and Lrc %: normalized cumulative DS loss ratio).
| Archetype | DS | µr (USD $) | σr (USD $) | µrc (USD $) | Lr % | Lrc % |
|---|---|---|---|---|---|---|
| F1 | DS0 | 4260 | 794 | 4260 | 0.02 | 0.02 |
| DS1 | 23,654 | 2121 | 27,914 | 0.11 | 0.13 | |
| DS2 | 61,560 | 4277 | 89,474 | 0.29 | 0.41 | |
| DS3 | 60,724 | 5032 | 150,199 | 0.28 | 0.70 | |
| DS4 | 65,675 | 7031 | 215,874 | 0.30 | 1.00 | |
| F2 | DS1 | 48,849 | 4135 | 48,849 | 0.09 | 0.09 |
| DS2 | 213,251 | 16,444 | 262,100 | 0.39 | 0.48 | |
| DS3 | 133,569 | 9561 | 395,669 | 0.25 | 0.73 | |
| DS4 | 147,861 | 15,829 | 543,530 | 0.27 | 1.00 | |
| F3 | DS0 | 16,227 | 1736 | 16,227 | 0.04 | 0.04 |
| DS1 | 48,789 | 4053 | 65,016 | 0.11 | 0.14 | |
| DS2 | 92,980 | 6475 | 157,996 | 0.20 | 0.34 | |
| DS3 | 190,569 | 13,622 | 348,565 | 0.41 | 0.75 | |
| DS4 | 114,019 | 11,166 | 462,584 | 0.25 | 1.00 | |
| F4 | DS1 | 598,903 | 49,851 | 598,903 | 0.16 | 0.16 |
| DS2 | 692,169 | 51,262 | 1,291,072 | 0.18 | 0.34 | |
| DS3 | 1,681,135 | 76,270 | 2,972,207 | 0.44 | 0.78 | |
| DS4 | 839,248 | 82,159 | 3,811,456 | 0.22 | 1.00 | |
| F5 | DS1 | 70,250 | 12,515 | 70,250 | 0.04 | 0.04 |
| DS2 | 153,849 | 14,617 | 224,099 | 0.09 | 0.14 | |
| DS3 | 829,515 | 121,483 | 1,053,613 | 0.51 | 0.65 | |
| DS4 | 569,865 | 85,480 | 1,623,478 | 0.35 | 1.00 | |
| F6 | DS1 | 449,721 | 164,013 | 449,721 | 0.03 | 0.03 |
| DS2 | 5,168,222 | 339,949 | 5617,944 | 0.29 | 0.31 | |
| DS3 | 8,543,276 | 770,670 | 14,161,219 | 0.48 | 0.79 | |
| DS4 | 3,782,973 | 492,271 | 17,944,192 | 0.21 | 1.00 | |
| F7 | DS1 | 53,036 | 18,209 | 53,036 | 0.02 | 0.02 |
| DS2 | 1,072,040 | 70,627 | 1,125,076 | 0.44 | 0.46 | |
| DS3 | 878,243 | 129,259 | 2,003,319 | 0.36 | 0.83 | |
| DS4 | 418,985 | 54,522 | 2,422,304 | 0.17 | 1.00 | |
| F8 | DS1 | 1,058,663 | 397,138 | 1,058,663 | 0.04 | 0.04 |
| DS2 | 7,248,632 | 553,895 | 8,307,295 | 0.24 | 0.28 | |
| DS3 | 12,315,180 | 791,378 | 20,622,475 | 0.41 | 0.69 | |
| DS4 | 9,163,981 | 29,786,456 | 1,192,492 | 0.31 | 1.00 | |
| F9 | DS1 | 486,936 | 165,808 | 486,936 | 0.04 | 0.04 |
| DS2 | 2,083,967 | 162,066 | 2,570,903 | 0.18 | 0.22 | |
| DS3 | 5,176,670 | 610,200 | 7,747,573 | 0.45 | 0.67 | |
| DS4 | 3,818,494 | 496,893 | 11,566,066 | 0.33 | 1.00 | |
| F10 | DS1 | 569,036 | 93,693 | 569,036 | 0.08 | 0.08 |
| DS2 | 2,125,013 | 170,009 | 2,694,050 | 0.31 | 0.39 | |
| DS3 | 2,317,758 | 172,624 | 5,011,808 | 0.33 | 0.72 | |
| DS4 | 1,929,440 | 200,005 | 6,941,248 | 0.28 | 1.00 | |
| F11 | DS1 | 569,036 | 936,93 | 569,036 | 0.05 | 0.05 |
| DS2 | 2,125,013 | 170,009 | 2,694,050 | 0.19 | 0.24 | |
| DS3 | 5,362,654 | 270,722 | 8,056,704 | 0.48 | 0.72 | |
| DS4 | 3,080,165 | 323,559 | 11,136,869 | 0.28 | 1.00 | |
| F12 | DS1 | 1,292,430 | 133,099 | 1,292,430 | 0.01 | 0.01 |
| DS2 | 17,919,792 | 1,142,953 | 19,212,222 | 0.11 | 0.12 | |
| DS3 | 132,148,680 | 9,220,348 | 151,360,903 | 0.84 | 0.96 | |
| DS4 | 6,788,170 | 830,969 | 158,149,072 | 0.04 | 1.00 | |
| F13 | DS1 | 413,457 | 69,333 | 413,457 | 0.10 | 0.10 |
| DS2 | 1,109,923 | 124,113 | 1,523,380 | 0.28 | 0.38 | |
| DS3 | 1,252,727 | 80,179 | 2,776,107 | 0.31 | 0.70 | |
| DS4 | 1,211,644 | 104,102 | 3,987,751 | 0.30 | 1.00 | |
| F14 | DS1 | 101,767 | 21,334 | 101,767 | 0.04 | 0.04 |
| DS2 | 609,794 | 63,305 | 711,561 | 0.26 | 0.31 | |
| DS3 | 1,105,491 | 182,337 | 1,817,052 | 0.48 | 0.78 | |
| DS4 | 505,344 | 53,193 | 2,322,396 | 0.22 | 1.00 | |
| F15 | DS1 | 151,644 | 56,713 | 151,644 | 0.04 | 0.04 |
| DS2 | 741,449 | 100,999 | 893,093 | 0.22 | 0.26 | |
| DS3 | 1,190,923 | 170,109 | 208,4016 | 0.35 | 0.61 | |
| DS4 | 1,308,621 | 170,288 | 3,392,637 | 0.39 | 1.00 |
© 2020 by the authors. Licensee MDPI, Basel, Switzerland. This article is an open access article distributed under the terms and conditions of the Creative Commons Attribution (CC BY) license (http://creativecommons.org/licenses/by/4.0/).
Share and Cite
MDPI and ACS Style
Nofal, O.M.; van de Lindt, J.W. Minimal Building Flood Fragility and Loss Function Portfolio for Resilience Analysis at the Community Level. Water 2020, 12, 2277. https://doi.org/10.3390/w12082277
AMA Style
Nofal OM, van de Lindt JW. Minimal Building Flood Fragility and Loss Function Portfolio for Resilience Analysis at the Community Level. Water. 2020; 12(8):2277. https://doi.org/10.3390/w12082277
Chicago/Turabian StyleNofal, Omar M., and John W. van de Lindt. 2020. "Minimal Building Flood Fragility and Loss Function Portfolio for Resilience Analysis at the Community Level" Water 12, no. 8: 2277. https://doi.org/10.3390/w12082277
Note that from the first issue of 2016, this journal uses article numbers instead of page numbers. See further details here.