Protecting Coastlines from Flooding in a Changing Climate: A Preliminary Experimental Study to Investigate a Sustainable Approach


1
School of Energy, Construction and Environment, Coventry University, Coventry CV1 5FB, UK
2
Centre for Agroecology, Water and Resilience, Coventry University, Ryton Gardens, Wolston Lane, Coventry CV8 3LG, UK
*
Author to whom correspondence should be addressed.
Water 2020, 12(9), 2471; https://doi.org/10.3390/w12092471
Submission received: 20 July 2020
/
Revised: 28 August 2020
/
Accepted: 28 August 2020
/
Published: 3 September 2020
(This article belongs to the Special Issue Sustainable Management of Urban Water Resources)
Abstract
:Rising sea levels are causing more frequent flooding events in coastal areas and generate many issues for coastal communities such as loss of property or damages to infrastructures. To address this issue, this paper reviews measures currently in place and identifies possible control measures that can be implemented to aid preservation of coastlines in the future. Breakwaters present a unique opportunity to proactively address the impact of coastal flooding. However, there is currently a lack of research into combined hard and soft engineering techniques. To address the global need for developing sustainable solutions, three specific breakwater configurations were designed and experimentally compared in the hydraulic laboratory at Coventry University to assess their performance in reducing overtopping and the impact of waves, quantifying the effectiveness of each. The investigation confirmed that stepped configurations work effectively in high amplitudes waves, especially with the presence of a slope angle to aid wave reflection. These results provide a very valuable preliminary investigation into novel sustainable solutions incorporating both artificial and natural based strategies that could be considered by local and national authorities for the planning of future mitigation strategies to defend coastal areas from flooding and erosion.
1. Introduction
In the last 140 years, scientific research has established that average sea levels have significantly increased [1,2,3], and this phenomenon is accelerating. This is a critical issue as even small increases can have devastating effects on coastal habitats [4,5,6,7]. Rising sea levels have been identified as a major cause of flooding events across the world [8,9]. Flooding poses a threat to property, safety, and the economic wellbeing of coastal communities [10]. In fact, considering that coastal areas provide a great amount of economic and leisure activities, they contribute significantly to the local and national economy. Thus, more people are continuously attracted to coastal zones contributing to an intense urbanization of these areas. To aggravate this situation, the ecosystems are also threatened by the impact of human activities in coastal areas as well as by the increase of natural extreme weather events (e.g., intensity and duration of storms, floods) generated by climate change, which interfere with local wave climate and changes in morphological beach characteristics [11]. More frequently, high tides reach values that cause costal recession and high sediment transport deficit, and hence, it is necessary to protect these areas with various coastal structures to reduce or at least to mitigate coastal erosion problems. As a result, impacts of climatic variations are usually the greatest along the coast [12,13,14]. However, many of the current coastal protections (e.g., groins, seawalls, and emerged breakwaters) were built with the single purpose of protecting the coast, without environmental or economic concerns, maintenance costs, or the negative consequences that such structures could cause up to considerable distances along the coast. Coastal regions and their managers consequently face ever-increasing challenges to accommodate safely both the growth of these areas and their development [15].
Traditionally, bulkheads, seawalls, and revetments have been the most commonly used type of shoreline infrastructure implemented as a primary response to coastal hazard. Other applications such as shoreline armouring have also been adopted to protect coastal property from hazards like erosion and flooding [16]. However, there has been a growing interest during the last decade in developing sustainable approaches to guarantee solutions that could deal with the daily and emergency issues in parallel with promoting downtown living [17,18,19]. For example, in Hong Kong, the land policy emphasizes ecological protection [20,21,22,23] and reclamation, enhancing the innovative value in sustainable coastal land use management.
In line with these new approaches, recent studies conducted by scientists and practitioners have demonstrated the benefits of nature-based strategies for restoring degraded coastal ecosystems and mitigating risks including natural defences and “living shorelines” [24,25]. Without any human interaction, shorelines are mainly comprised of biogenic habitats (e.g., saltmarshes, mangroves, oyster and coral reefs) in their natural conditions. These natural coastal habitats secure the provision of essential habitat for marine life, promotion of favourable water quality, and reduction of shoreline erosion and flooding by attenuating waves, stabilizing sediments, and dampening surge [24,26,27]. As such, they are widely valued for their environmental benefits. By adopting alternative sustainable approaches, it is possible to enhance the quality of natural environments along the coasts that can help reduce the impact of coastal hazards [28,29,30,31,32].
It is clear that a crucial goal is to identify nature-based structures that can protect coastal areas and provide a low-cost option to effectively reduce the damaging effects of extreme meteorological events on coastal populations by absorbing storm energy [33], thus enhancing the quality of lives of people living in the surrounding areas. These green areas (including vegetation such as coral reefs or aquatic plants) typical of nature-based solutions could aid the production of sediments (sea grass beds and coral reefs) or could store and hold the sand together (mangroves and coastal dunes) [34]. For example, the benefits provided by coastal herbaceous wetlands in helping to reduce economic damages generated by hurricanes and their impacts have already been demonstrated [34,35].
One type of solution that has not been considered is the mix of artificial and green solutions. Human design structures can guarantee resistance to strong wave impacts and reduce the amount of flooding in coastal areas. However, if mixed with natural ecosystems/green solutions that can still help to reduce wave energy, coastal erosion, and flood hazards [36,37,38,39,40,41], it could also be possible to recover the natural functioning of the entire coastal area and target future conservation and restoration processes [35,36,37]. In brief, this option promotes coastal protection through the recovery of the natural functioning of natural ecosystems by means of conservation and restoration actions [38,42]. The trade-offs between socioeconomic development and conservation can be integrated [43,44,45], which will help with improving coastal development and promoting a sustainable coastal development.
This study provides a comprehensive review of existing hard and soft solutions adopted for coastal protection. Furthermore, it will experimentally investigate and compare preliminary sustainable approaches that could deliver both protection from coastal flooding and the added benefit of conserving, sustaining, and restoring valuable ecosystem functions and services to local communities [46,47,48,49,50,51].
Hard and Soft Engineering Solutions for Coastal Protection
To identify structural designs that assess new sustainable approaches for coastal protection and to highlight the advantages and disadvantages of existing hard and soft engineering solutions adopted to protect coastal lines, a review was conducted on the techniques available to date. Table 1 summarises the results obtained.
To date, as previously mentioned, natural solutions have been adopted to preserve and/or restore coastal areas. For example, the presence of wetlands has demonstrated to retard waves and the mass flux of water with the presence of vegetation [87]. Despite a few studies on the effect of these vegetated surface, there are not specific guidelines available to determine the optimal shape of the vegetation to consider, the density to be selected, or the height of the vegetation to make it fully under water or emergent. Therefore, to seek this information, this preliminary experimental study was conducted to propose an approach that could combine hard and soft engineering characteristics; thus, it can be the base for a sustainable solution to be adopted. Despite initially using non-real vegetation due to the limitations explained below, hard and soft engineering techniques should be combined in a more ecological way (e.g., facilitating the growth of aquatic plants next to artificial structures), to achieve a less invasive structure on the environment and mitigate the negative influence of hard engineering on ecosystems [49]. In order to identify a feasible “softer” hard sustainable engineered solution, the paper experimentally compared three solutions tested in a wave tank with a physical model, which are presented in Section 2, on the foreshore of the beach and thus did not impede the wave energy or prevented land to sea interaction. The main purpose of the submerged breakwater systems identified is wave attenuation, with the idea of creating splashing and hydraulic conditions that can support sediment capture, helping at the same time in the mitigation of storm surge [30].
2. Materials and Methods
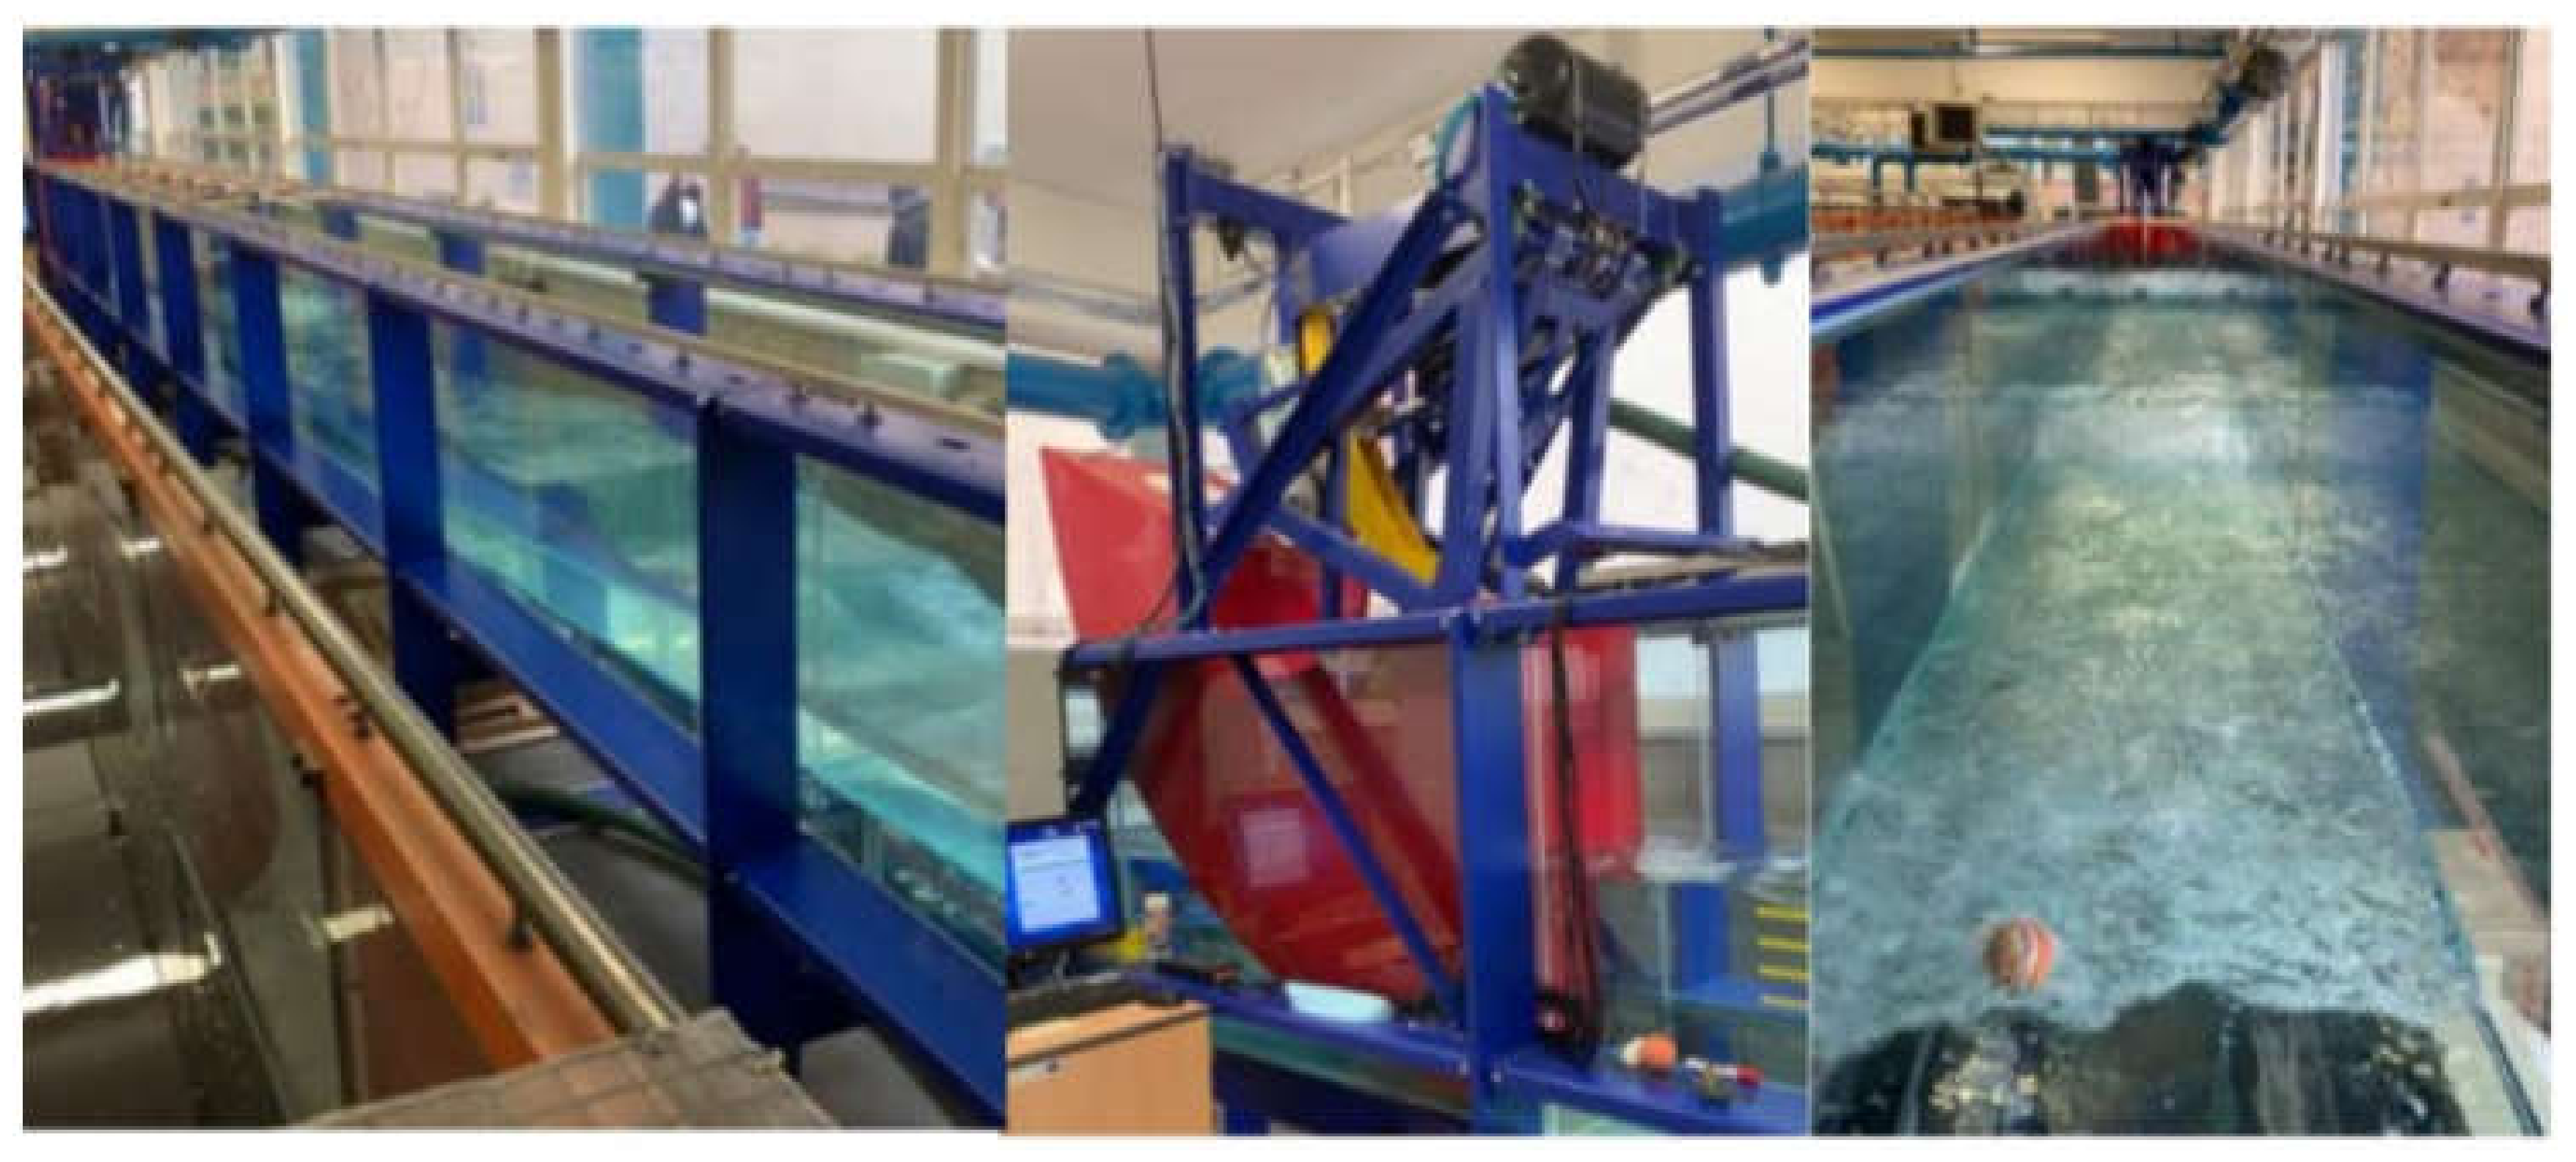
The experimental work presented in this paper was conducted using a wave flume at the Sir John Laing Building, Coventry University (Figure 1). The flume is 18 m long, 1 m deep, and 0.6 m wide. A wave generator is located at the upstream end of the flume while a beach is located at the downstream end to dissipate the energy induced by the waves reproduced.
2.1. Experimental Configurations
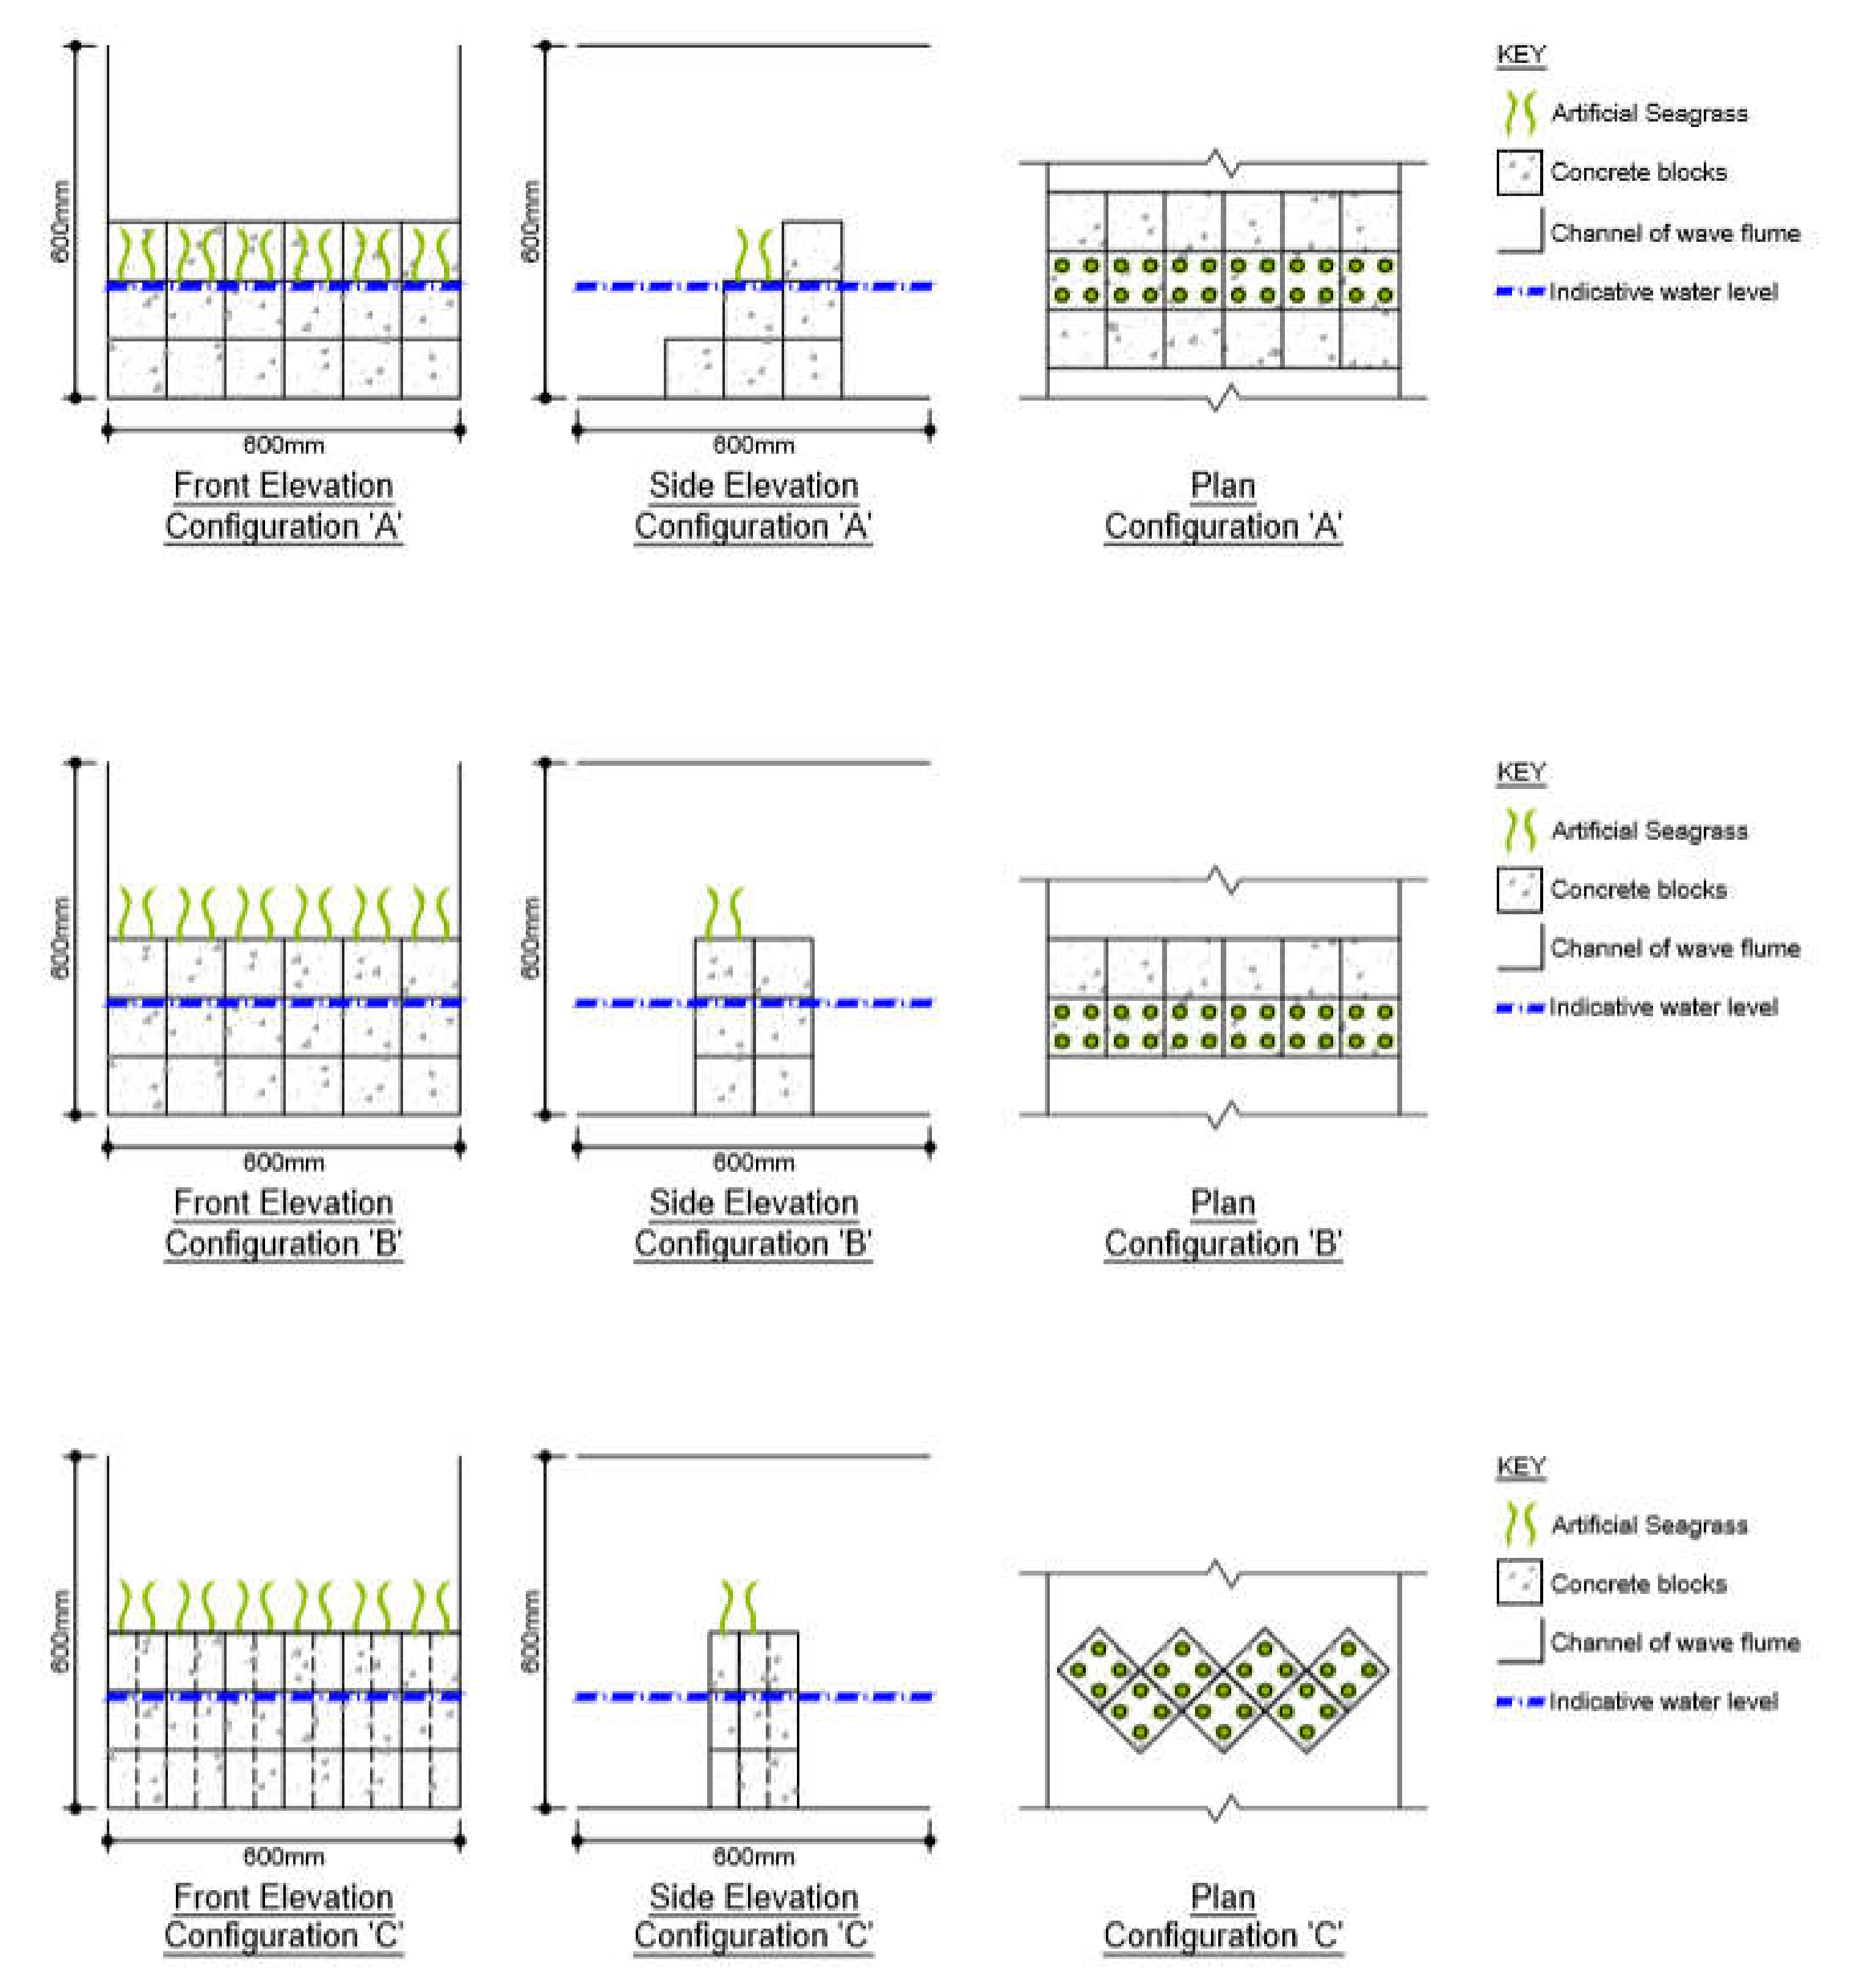
To identify sustainable breakwater solutions previously mentioned in Section 1 and investigate their benefits against the use of hard and soft breakwater strategies, three different configurations of sustainable breakwaters (A, B, and C; Figure 2) have been designed and tested within the flume for their effect on overtopping volume and wave attenuation. These sustainable breakwater solutions were tested under a variety of hydraulic wave conditions characterized by dissimilar frequencies and amplitudes.
Configuration A consists of a partly submerged breakwater wall with three steps and artificial vegetation located on the second step of the structure to simulate thick stem vegetation, as displayed in Figure 2. Studies into the wave overtopping of stepped revetments [64] pinpointed that their effectiveness is due to the introduction of slope roughness. Furthermore, it was highlighted that stepped structures, constituting of a slope with uniform roughness, can reduce overtopping volumes of breaking waves up to 60% compared to a smooth slope [64]. This configuration was therefore designed with uniform steps to gradually take the energy out of the wave as the flow could be channelled up the face of the structure. By utilising this approach, the wave collision could be less direct, and water may pass over the structure with less energy rather than generating intense splashing. Vegetation installed on the second step aims to assist with creating increased friction and dissipate wave energy prior to the overtopping. When thinking about reflected waves, the aim is that the sloped shape of the structure could aid destructive interference once the reflected wave meets the incoming waves that they will be out of phase, resulting in the two waves cancelling each other out and giving a reduced wave impact thereafter.
Configuration B is a flat facing and partly submerged breakwater wall with artificial vegetation located on top of the structure (to simulate thick stem vegetation) as shown in Figure 2. This configuration was used to optimize existing hard infrastructures (sea walls) where it would be possible to notice nature adapting to the existing conditions and growing on surfaces not ideal (concrete). Furthermore, this configuration could also replicate the forces interaction between artificial and natural solution where the last layer of the hard structure (seawall) is an ideal environment for coral reefs and porous structures to develop and grow under control. This configuration has been mainly considered to observe which kind of effects could have vegetation on top of existing structures for the simplest case of seawall.
Configuration C is a partly submerged breakwater wall with angled blocks and artificial vegetation located on the top of the structure (to simulate thick stem vegetation), as shown in Figure 2. A study conducted on breakwaters by Ahmadian, 2016 [88], detected several features influencing the effect of the incident wave impact on structures. This work informed that wave breaking, or turbulent losses, can be increased with geometrical alterations, structural characteristics, and the water to structure depth ratio [88]. By incorporating angled blocks, it provided a streamlined method of cutting through incident waves. In turn, this caused waves to become more turbulent, and energy depleted gradually prior to hitting the main body of the wall, rather than causing an instant impact. This configuration allowed comparison of results against the wall shown in Figure 2, to recognise if geometrical alterations, such as streamlining the concrete blocks, assist in dissipating wave energy, in contrast to the high impact stopping force that the flat facing angular wall can offer. Vegetation on the top was intended to dissipate the energy of any overtopping waves.
For each of the three structural configurations displayed in Figure 3, experiments were conducted both with and without a testing platform. The beach in the flume has a gradient of 4.5%. Existing studies expressed [89,90,91] the importance of a recurved wall profile for high wave return walls, since they define the trajectory of the returned water jet. Shallow angles proved the most effective in attenuating and reflecting waves. Therefore, all the configurations were tested with and without the platform, so that the datasets obtained could have been compared to assess the effectiveness of a slope angle that aims to reflect wave energy.
All the three coastal protection structures tested in this research where built with different configurations of concrete cubes (Figure 3). These had been manufactured from a normal mix with a strength of 20 N/mm2 (fck) and proportions 1:2:3:0.5, Portland cement, fine aggregate, 10mm coarse aggregate and water. A total of 36 (100 × 100 × 100 mm) cubes were cast and left to cure for 28 days to achieve full strength.
To measure overtopping volumes, a vertical overtopping collection board was manufactured from plywood (600 × 300 × 10 mm), with small arcs at the base, allowing the water to pass freely between either side of the structure. This allowed a detachable metal collection tray (600 × 200 × 100 mm) to be hooked on the plywood wall as demonstrated in Figure 4. The wall was located on the foreshore slope in the flume (14 m) and determined the point at which overtopping was being collected. A ruler (accuracy ±1 mm) was used to measure the height of water in the tray prior to testing and after simulation to allow the change in volume collected to be calculated. From this collection method, a volume was provided in litres for resultant graphs by utilising the following calculation:
where Vc is the volume collected = overtopping (litres), Ww is the measuring device width (20 cm), Lw is the measuring device length (60 cm), Hw is the measuring device depth measured (cm), and 1000 is the conversion factor used to transform from cubic metres to litres.
Vc = (Ww × Lw × Hw)/1000
As the collection device had a maximum capacity of 12 litres, a measuring jug was used to empty water back into the flume on the side of the incoming wave to ensure the water levels either side of the wall remained constant. The testing platform (600 × 300 mm) for assessing structures with and without a slope angle can also be noticed in Figure 4. This had a varying thickness across its length to account for the sloping foreshore (1 in 20 gradient).
2.2. Hydraulic Testing Conditions
Two different wave spectrums were used in this study in order to simulate the way different oceans act. This research uses the following wave spectrums within its testing:
- Sine waves simulated regular waves that occur in bodies of water. This aimed to investigate the different structural configurations performed with a regular and repeating low-energy wave. During the tests, frequency and amplitude were varied. To investigate the effect of changing frequency, the frequency ranged from 0.2 Hz up to 0.5 Hz, with overtopping measured at intervals of 20 s. The amplitude was the control variable at 0.05 m. The overall duration of each test was 60 s. The reason for changing the frequency was to assess how each design can influence the reflection of incoming waves to create destructive interference and review its effect on overtopping volumes collected. The experiments then assessed changing amplitudes, where values of amplitude tested ranged from 0.05 m to 0.09 m, in intervals of 0.01 m. As a control measure, the frequency remained at 0.02 Hz throughout (this was the maximum possible due to limitations with the calibration of the equipment tested). Again, the overall testing duration was 60 s. This comprised of a 10 s run time for each experiment, 20 s to allow for the observation of the water, and a further 30 s allowing the water to rest prior to additional testing. The reason for testing change in amplitude was to find patterns to help assess each designs’ effectiveness in attenuating and reflecting wave energy under increasing wave height.
- JONSWAP waves to simulate varying waves patterns found in ocean waters, where there are intermittent waves at different frequencies and irregular amplitudes are of a higher energy. This aimed to mimic realistic water effects of varying wave forms on a structure.
By using an off-the-self computer program associated with the control software for the wave tank piston, irregular patterns in waves could be produced in a synthesis to simulate a JONSWAP wave.
Table 2, shown below, displays the characteristics of these waves.
The figures for the JONSWAP synthesis above were chosen to simulate a higher wave energy, compared to that tested in the sine wave experiments. The chosen JONSWAP wave synthesis had a frequency between 0.2 Hz to 2 Hz (compared to 0.2 Hz to 0.5 Hz tested in sine waves) and an amplitude of up to 0.3 m (which is significantly higher than the amplitudes of 0.05–0.09 m tested in the sine waves testing). The purpose of testing in these more extreme conditions was because a JONSWAP simulation relates to irregular wave patterns, where there would likely be a potential storm situation. Table 3 summarises the conditions for all the experimental tests conducted.
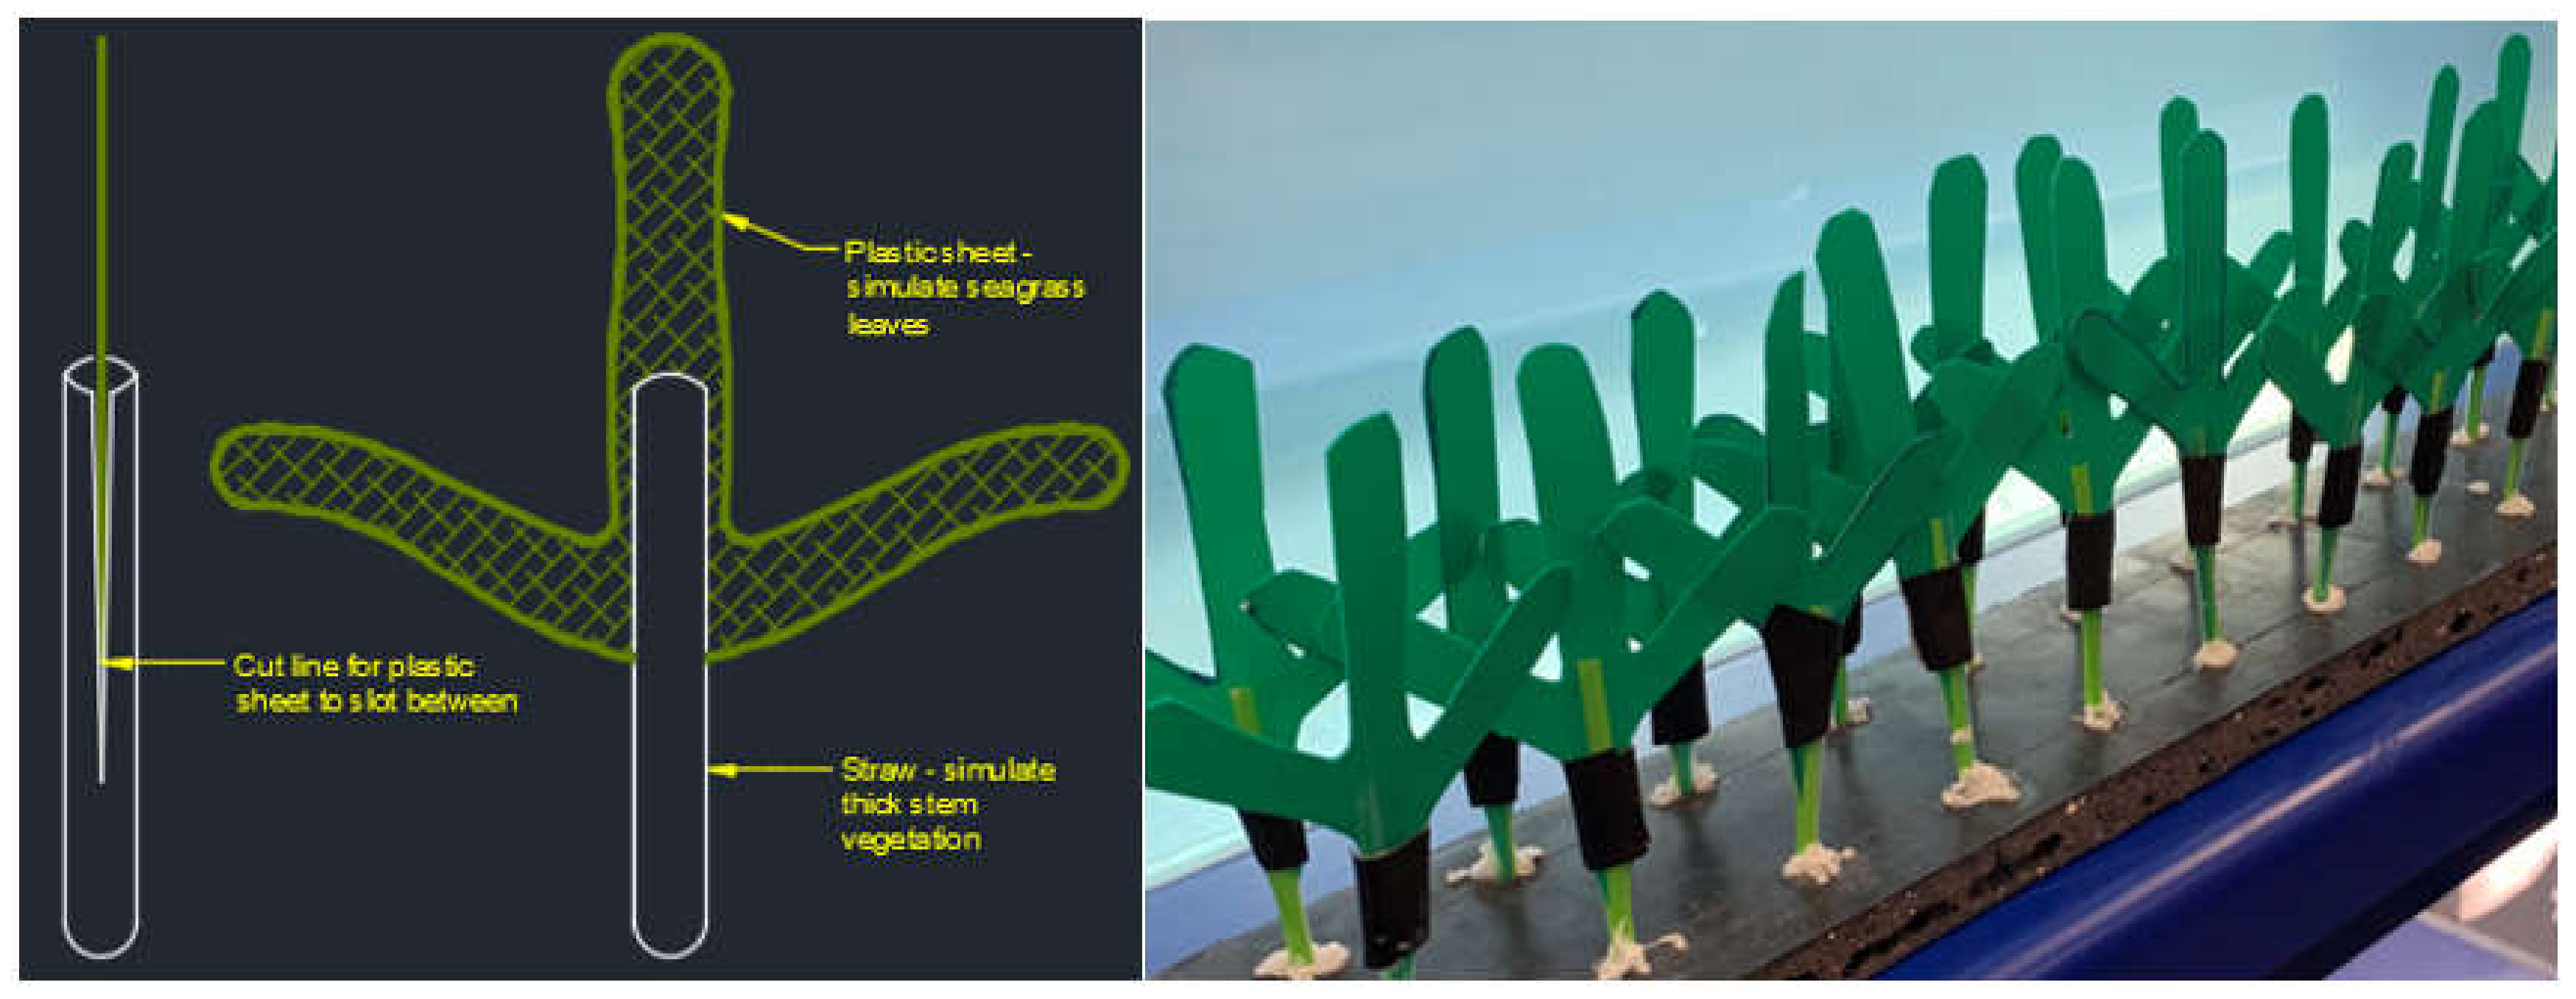
Due to the impracticability of growing real seagrasses, a physical model has been made to reproduce submerged vegetation by using straws and plastic sheets to mimic the thick stem structure and broad narrow leaves as shown in Figure 5. Translucent 100 mm straws were used and cut to replicate the ‘V’ shape for the plastic sheets to slot in. The plastic sheets were fairly stiff and had a course surface providing increased roughness and stood at about 100 mm high making the overall vegetation height 100–150 mm. This was then held together with tape and stuck to the holed board with glue. This kind of flexible setup aimed at representing the binding between interlocking structures that together can create a more sustainable barrier needed to combat the wave energy towards the beach to be protected, as well as miming the behaviours of reefs and submerged vegetation. However, it is also essential to consider the limitations associated with the choice of not using actual seagrass. By using similar structures next to each other, realistic and complex plant morphologies such as flexing elements with varying cross-sectional area over depth could not be replicated, leading to dissimilar flow patterns generated by a variety of stems, branches, roots, and leaves. Even if the height of the stems or the length of the roots can interfere with erosion, deposition patterns, transport of pollutants, stability of the plant, and exchange of nutrients between one type of vegetation to another, this was not the main focus of the study presented in this paper.
The choice of this artificial solution was made to isolate specific responses within the laboratory experiment under controlled conditions and to inform future work with real vegetation. Ideally, future studies will also incorporate the testing of specific patches and geometries which could generate a variety of drag coefficients CD and Reynolds numbers Re.
Testing was repeated three times for each hydraulic condition and corresponding structural configuration simulated. Simulations were also recorded using a camera to allow further analysis of the hydraulic behaviours (e.g., wave impact on the protective structures).
3. Results
This section presents a description of the experimental results, their interpretation, as well as the experimental conclusions that can be drawn.
3.1. Sine Wave Conditions—Frequency Analysis
Resultant data from the testing of overtopping against change in frequency are displayed in Figure 6 (no slope angle) and Figure 7 (with slope angle) below.
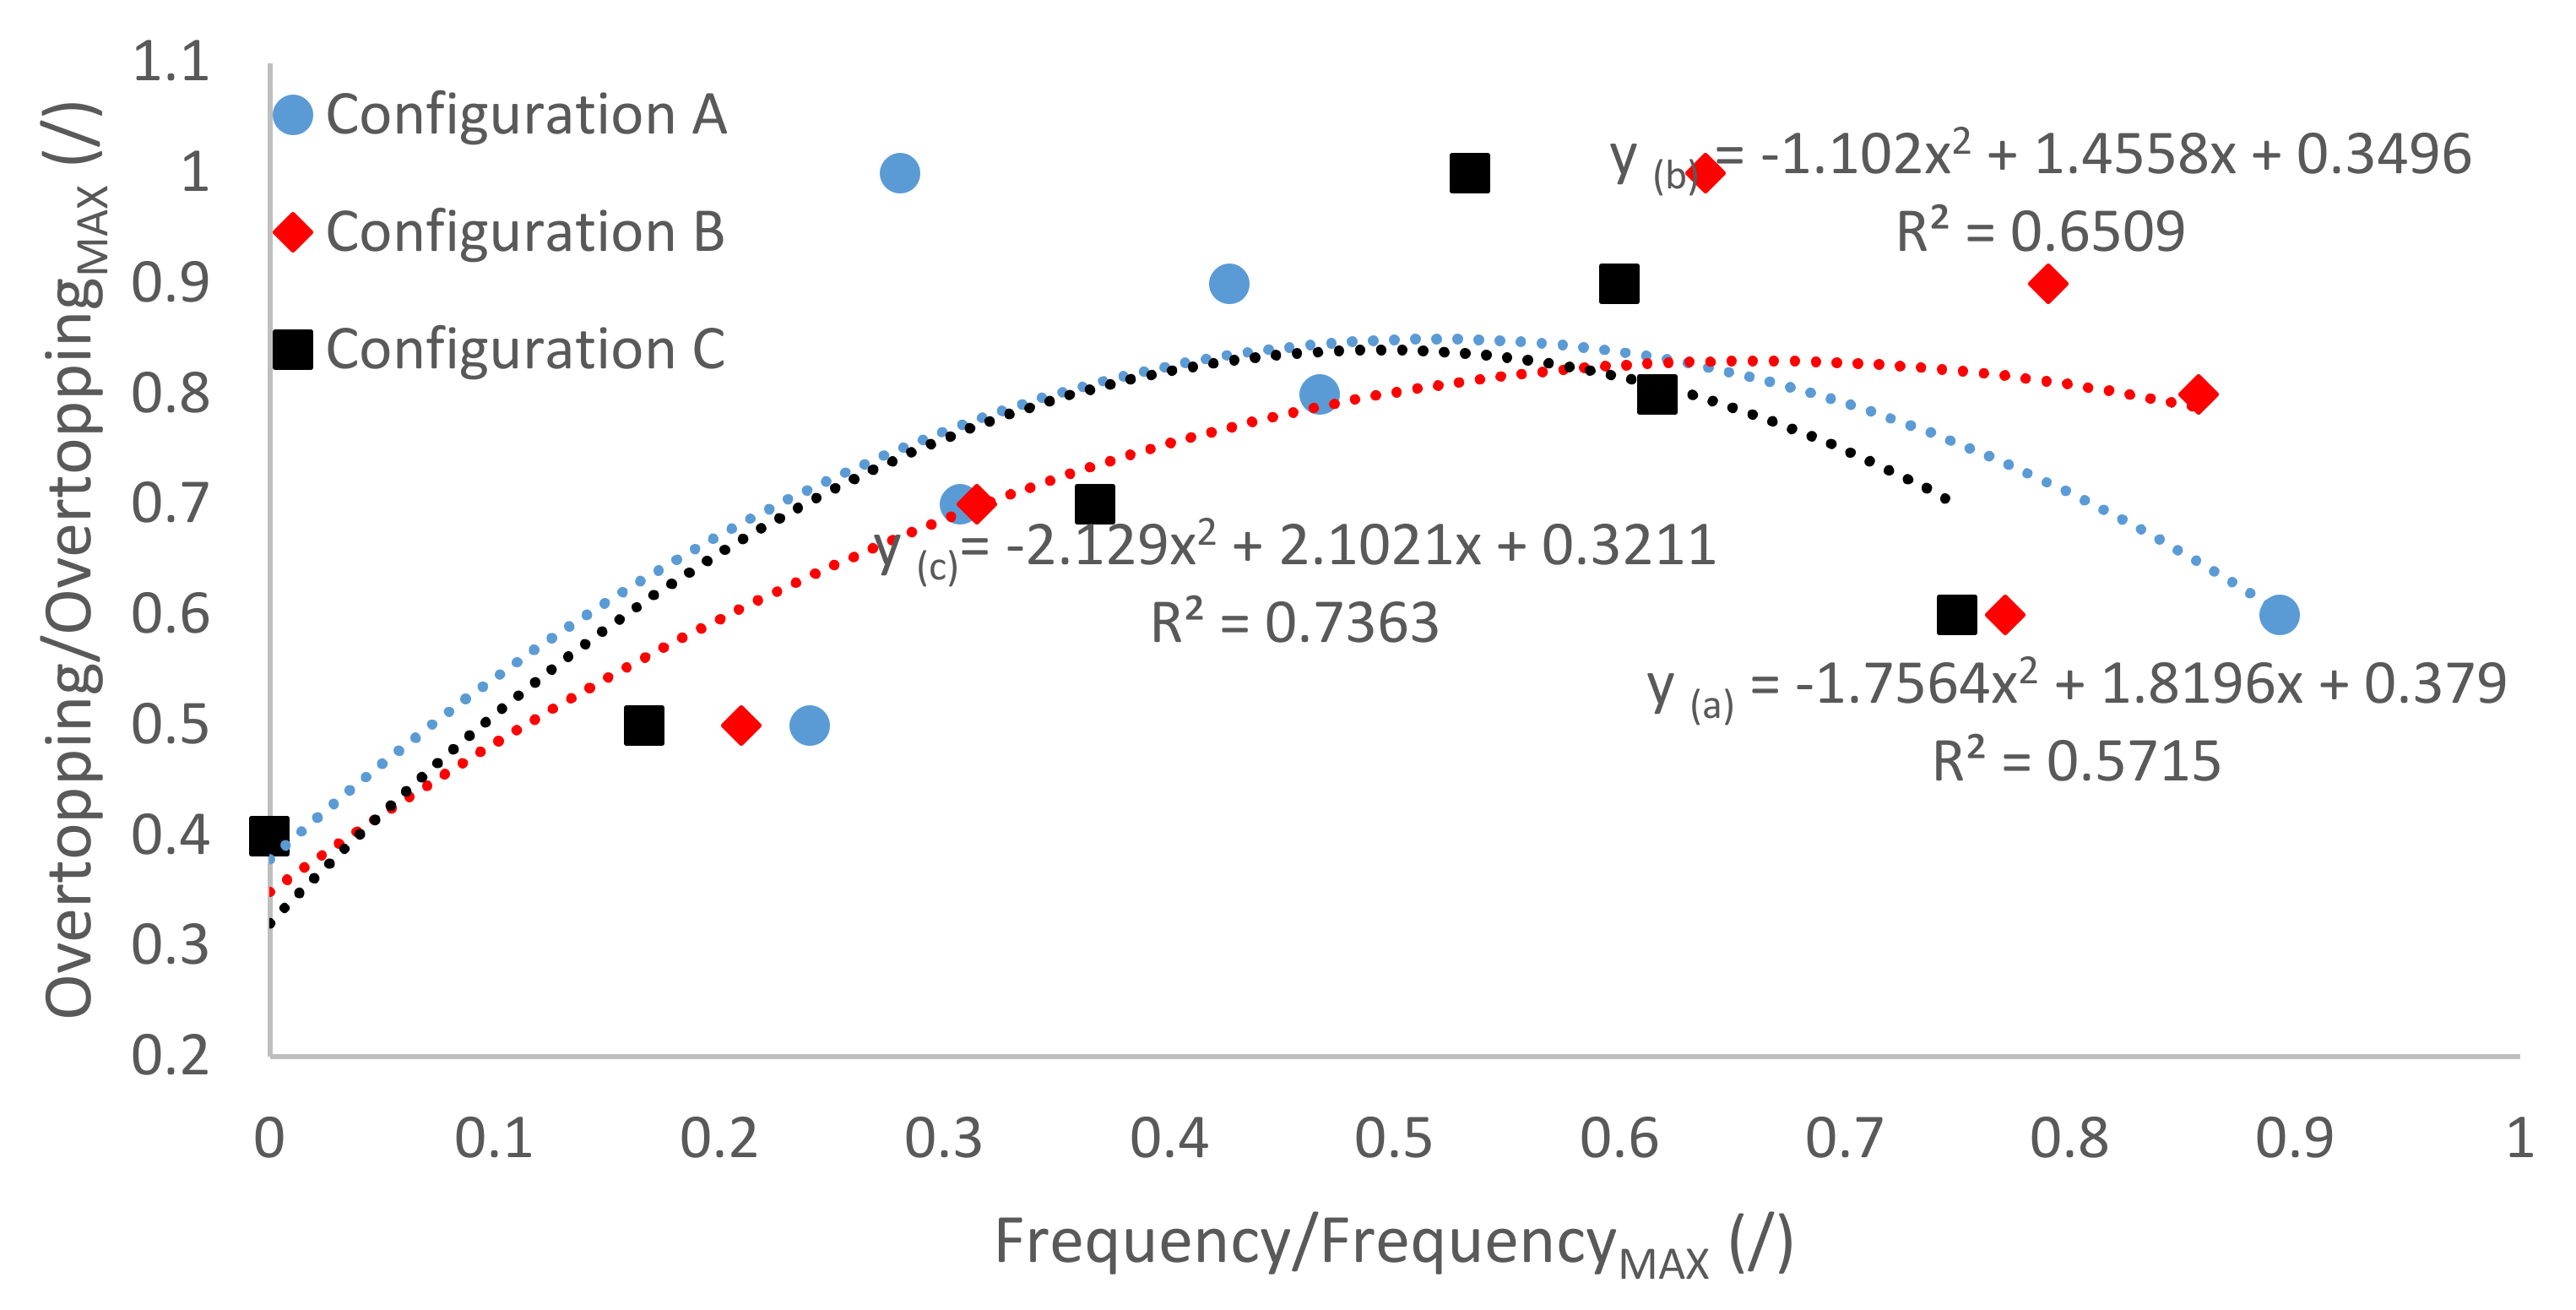
To identify a process which could directly provide a comparison between the performances of each structure tested, for each set of frequencies run within the experimental facility, these values have been normalized by using the maximum frequency used, which corresponds to 0.5 Hz. The same procedure was conducted for the overtopping values, which were normalized by using the maximum overtopping amount recorded within the entire set of tests under each configuration. Table 4 displays the experimental datasets collected for these hydraulic conditions.
From the data presented in and Figure 6 and Figure 7, it can be seen that all data sets show an initial increase in overtopping with wave frequency, which obtains a peak value and then decreases with wave frequency. A polynomial second order trend line has been fitted to the data to demonstrate this trend. For tests with no slope angle, Configuration A first obtains the peak value, followed by C and then B. For tests with a slope angle, the peak of Configuration C shifts notably, meaning that now Configuration C is the first to hit peak value, followed by A and then B.
3.2. Sine Wave Conditions—Amplitude Analysis
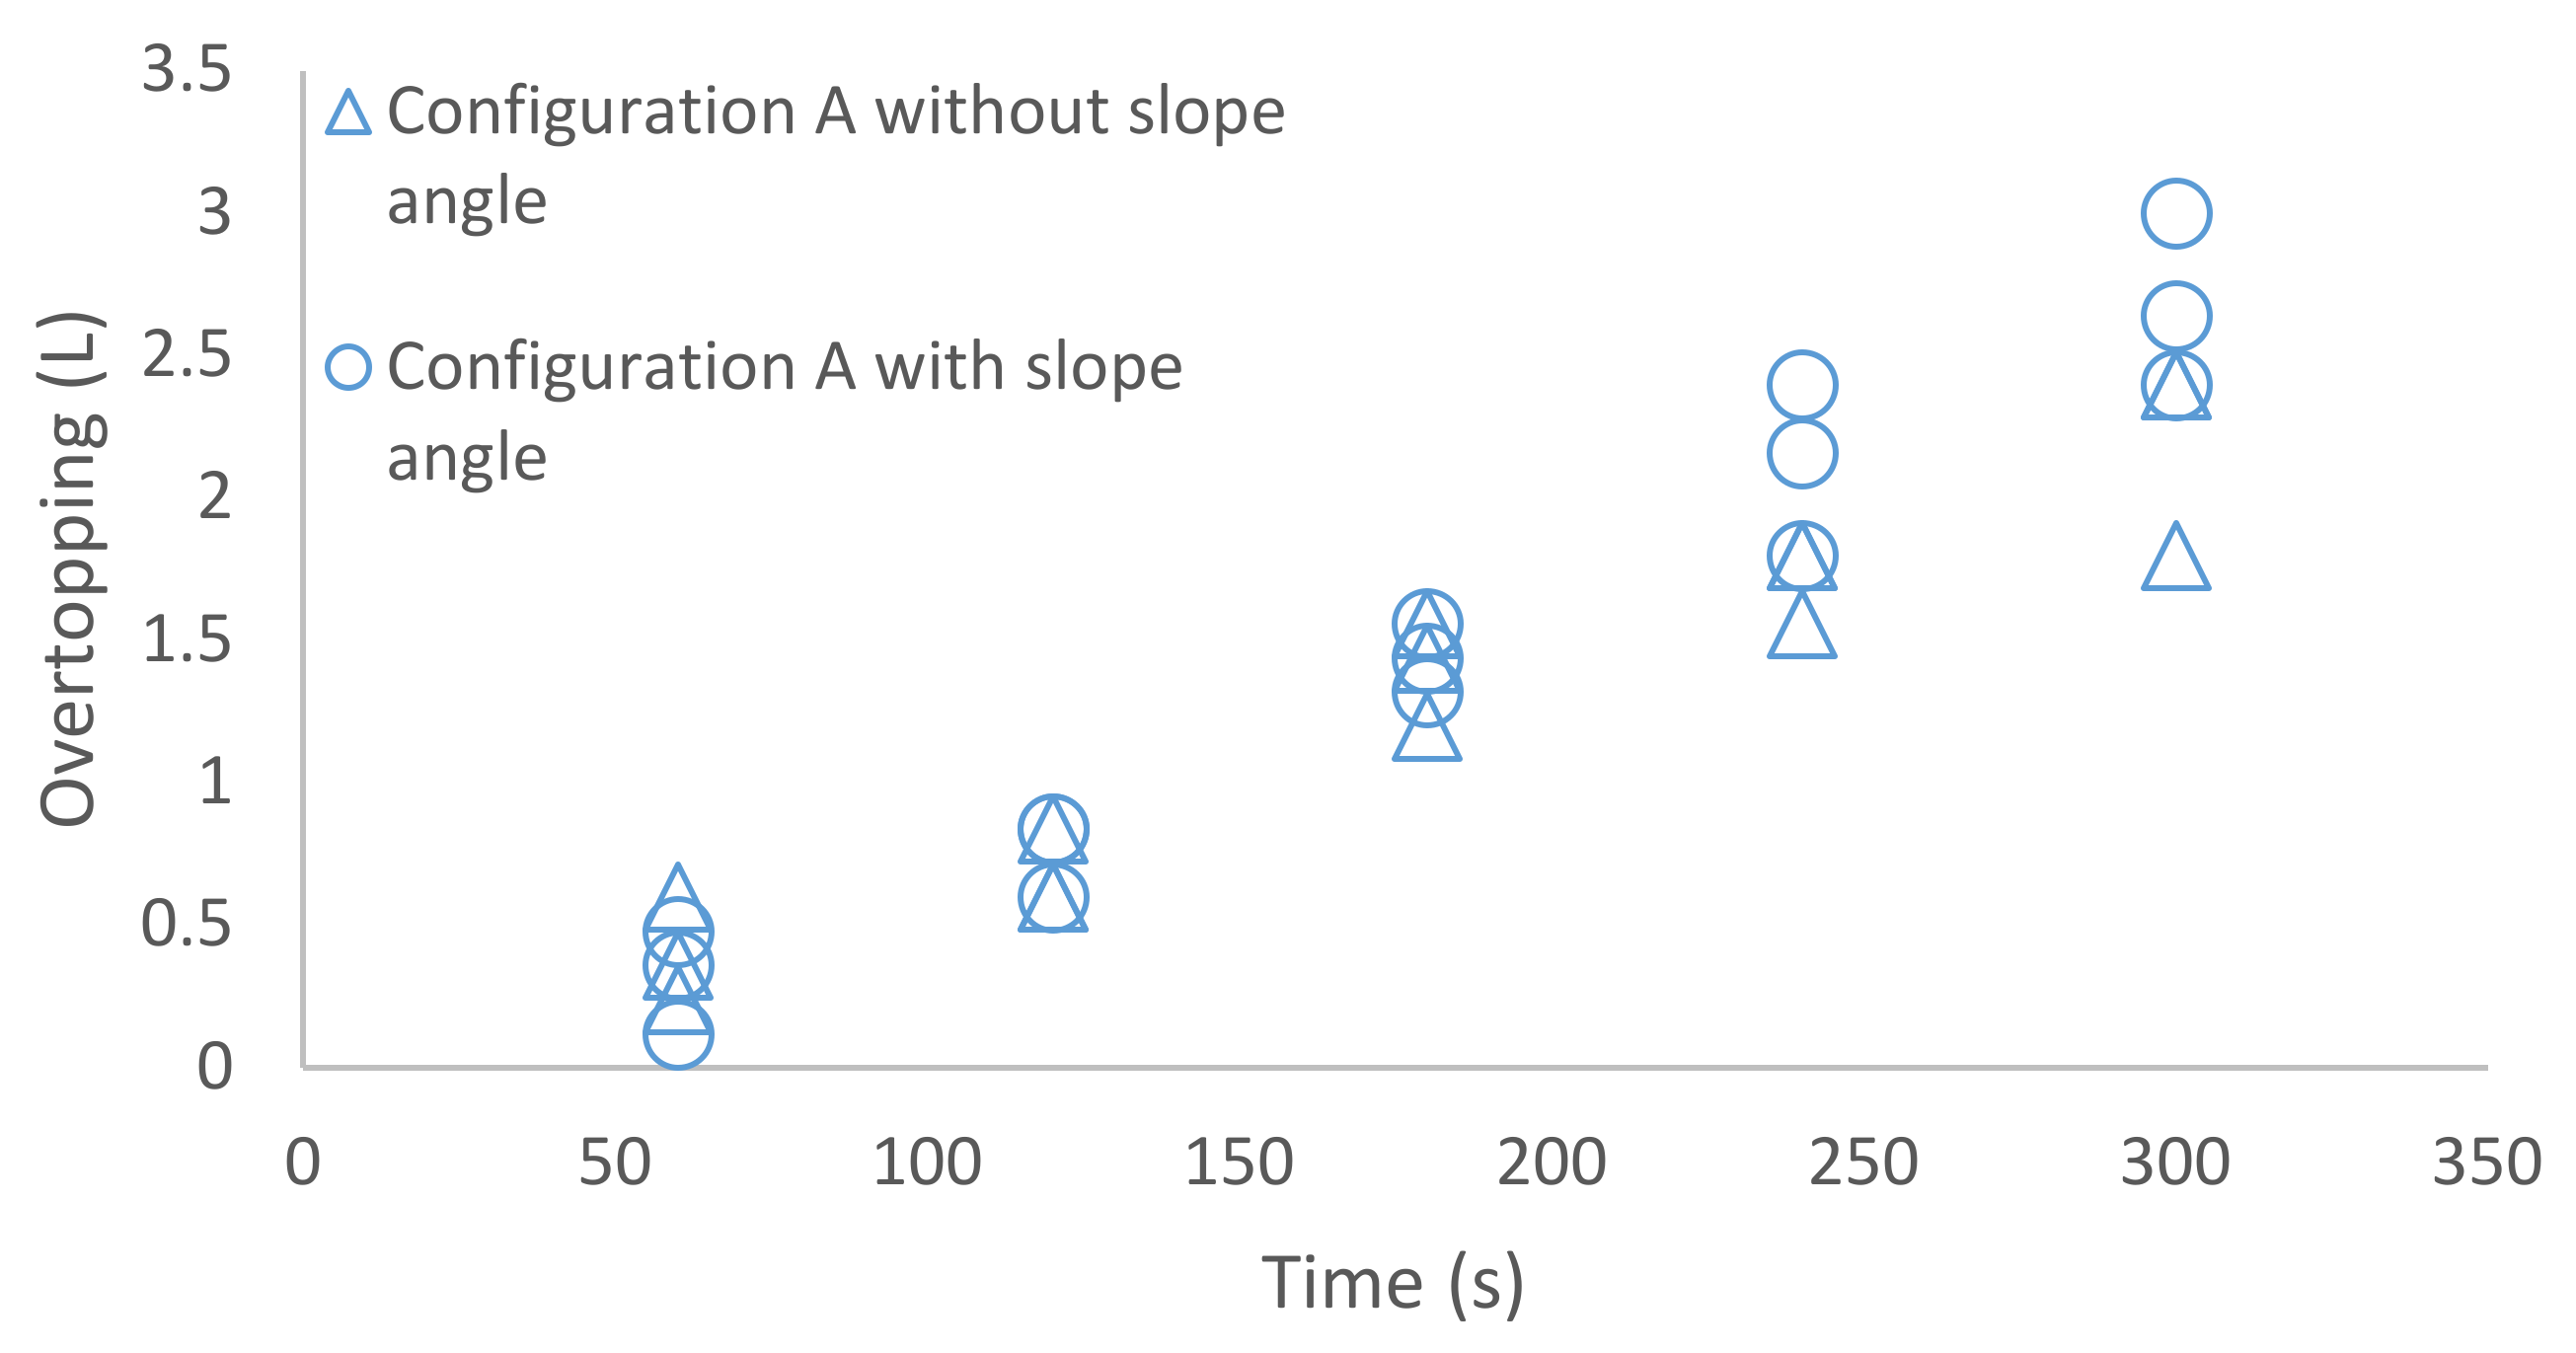
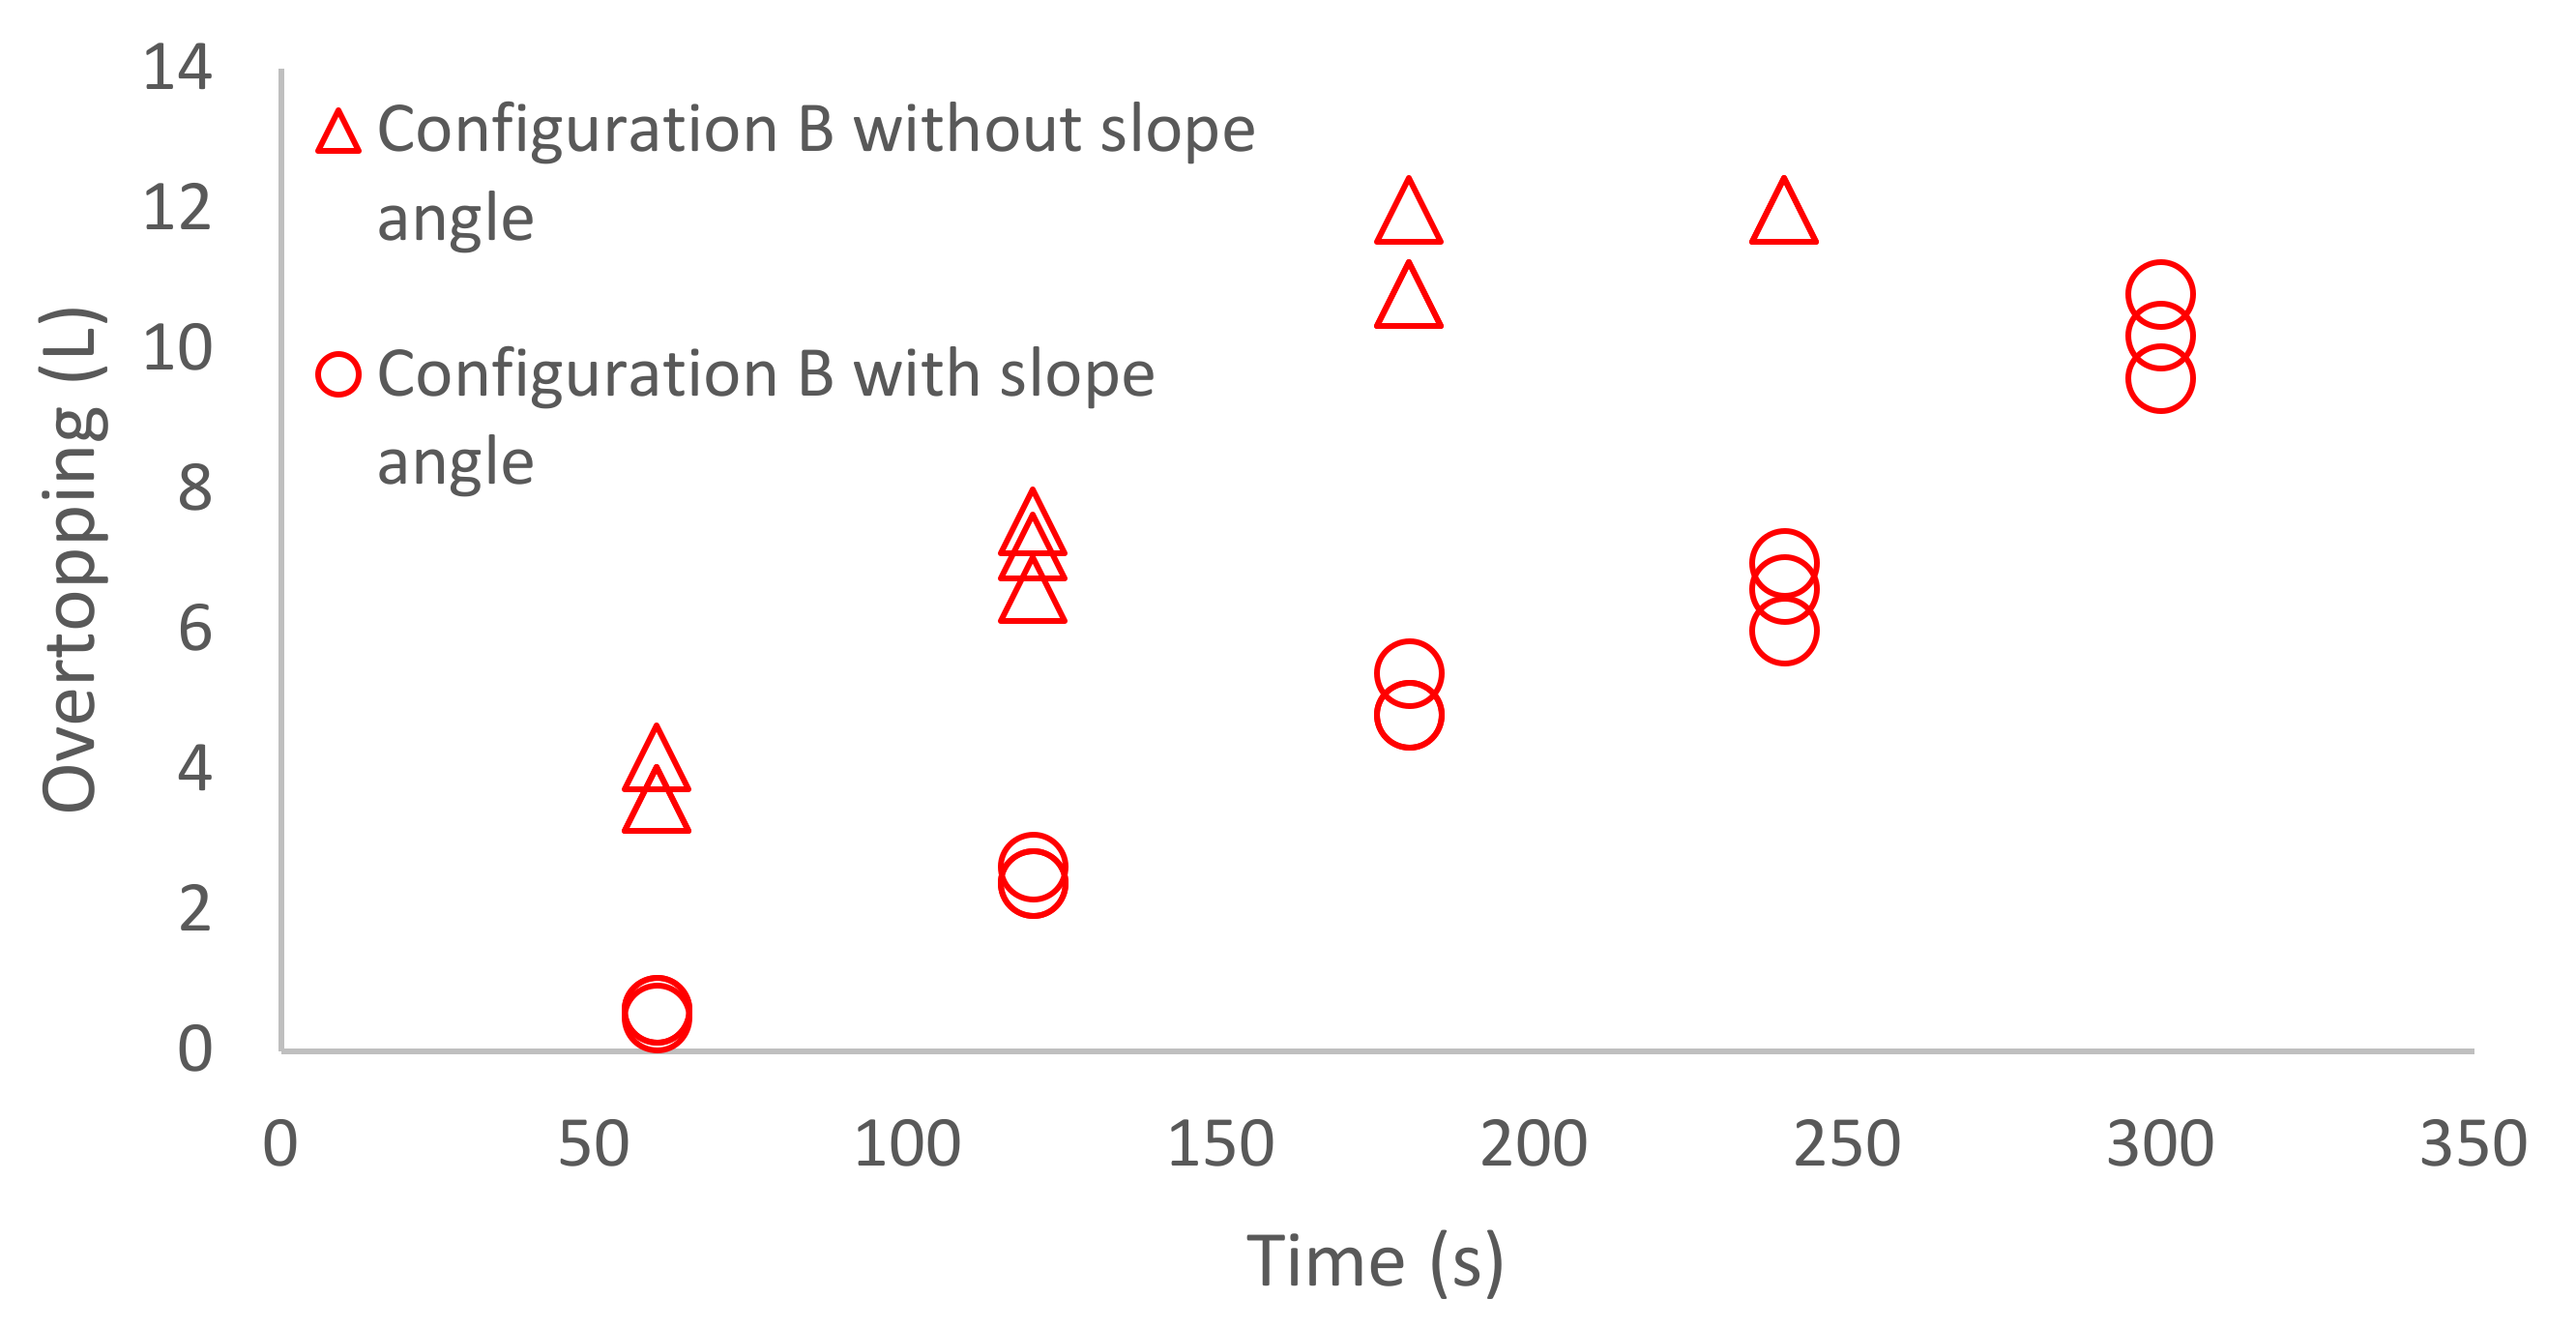
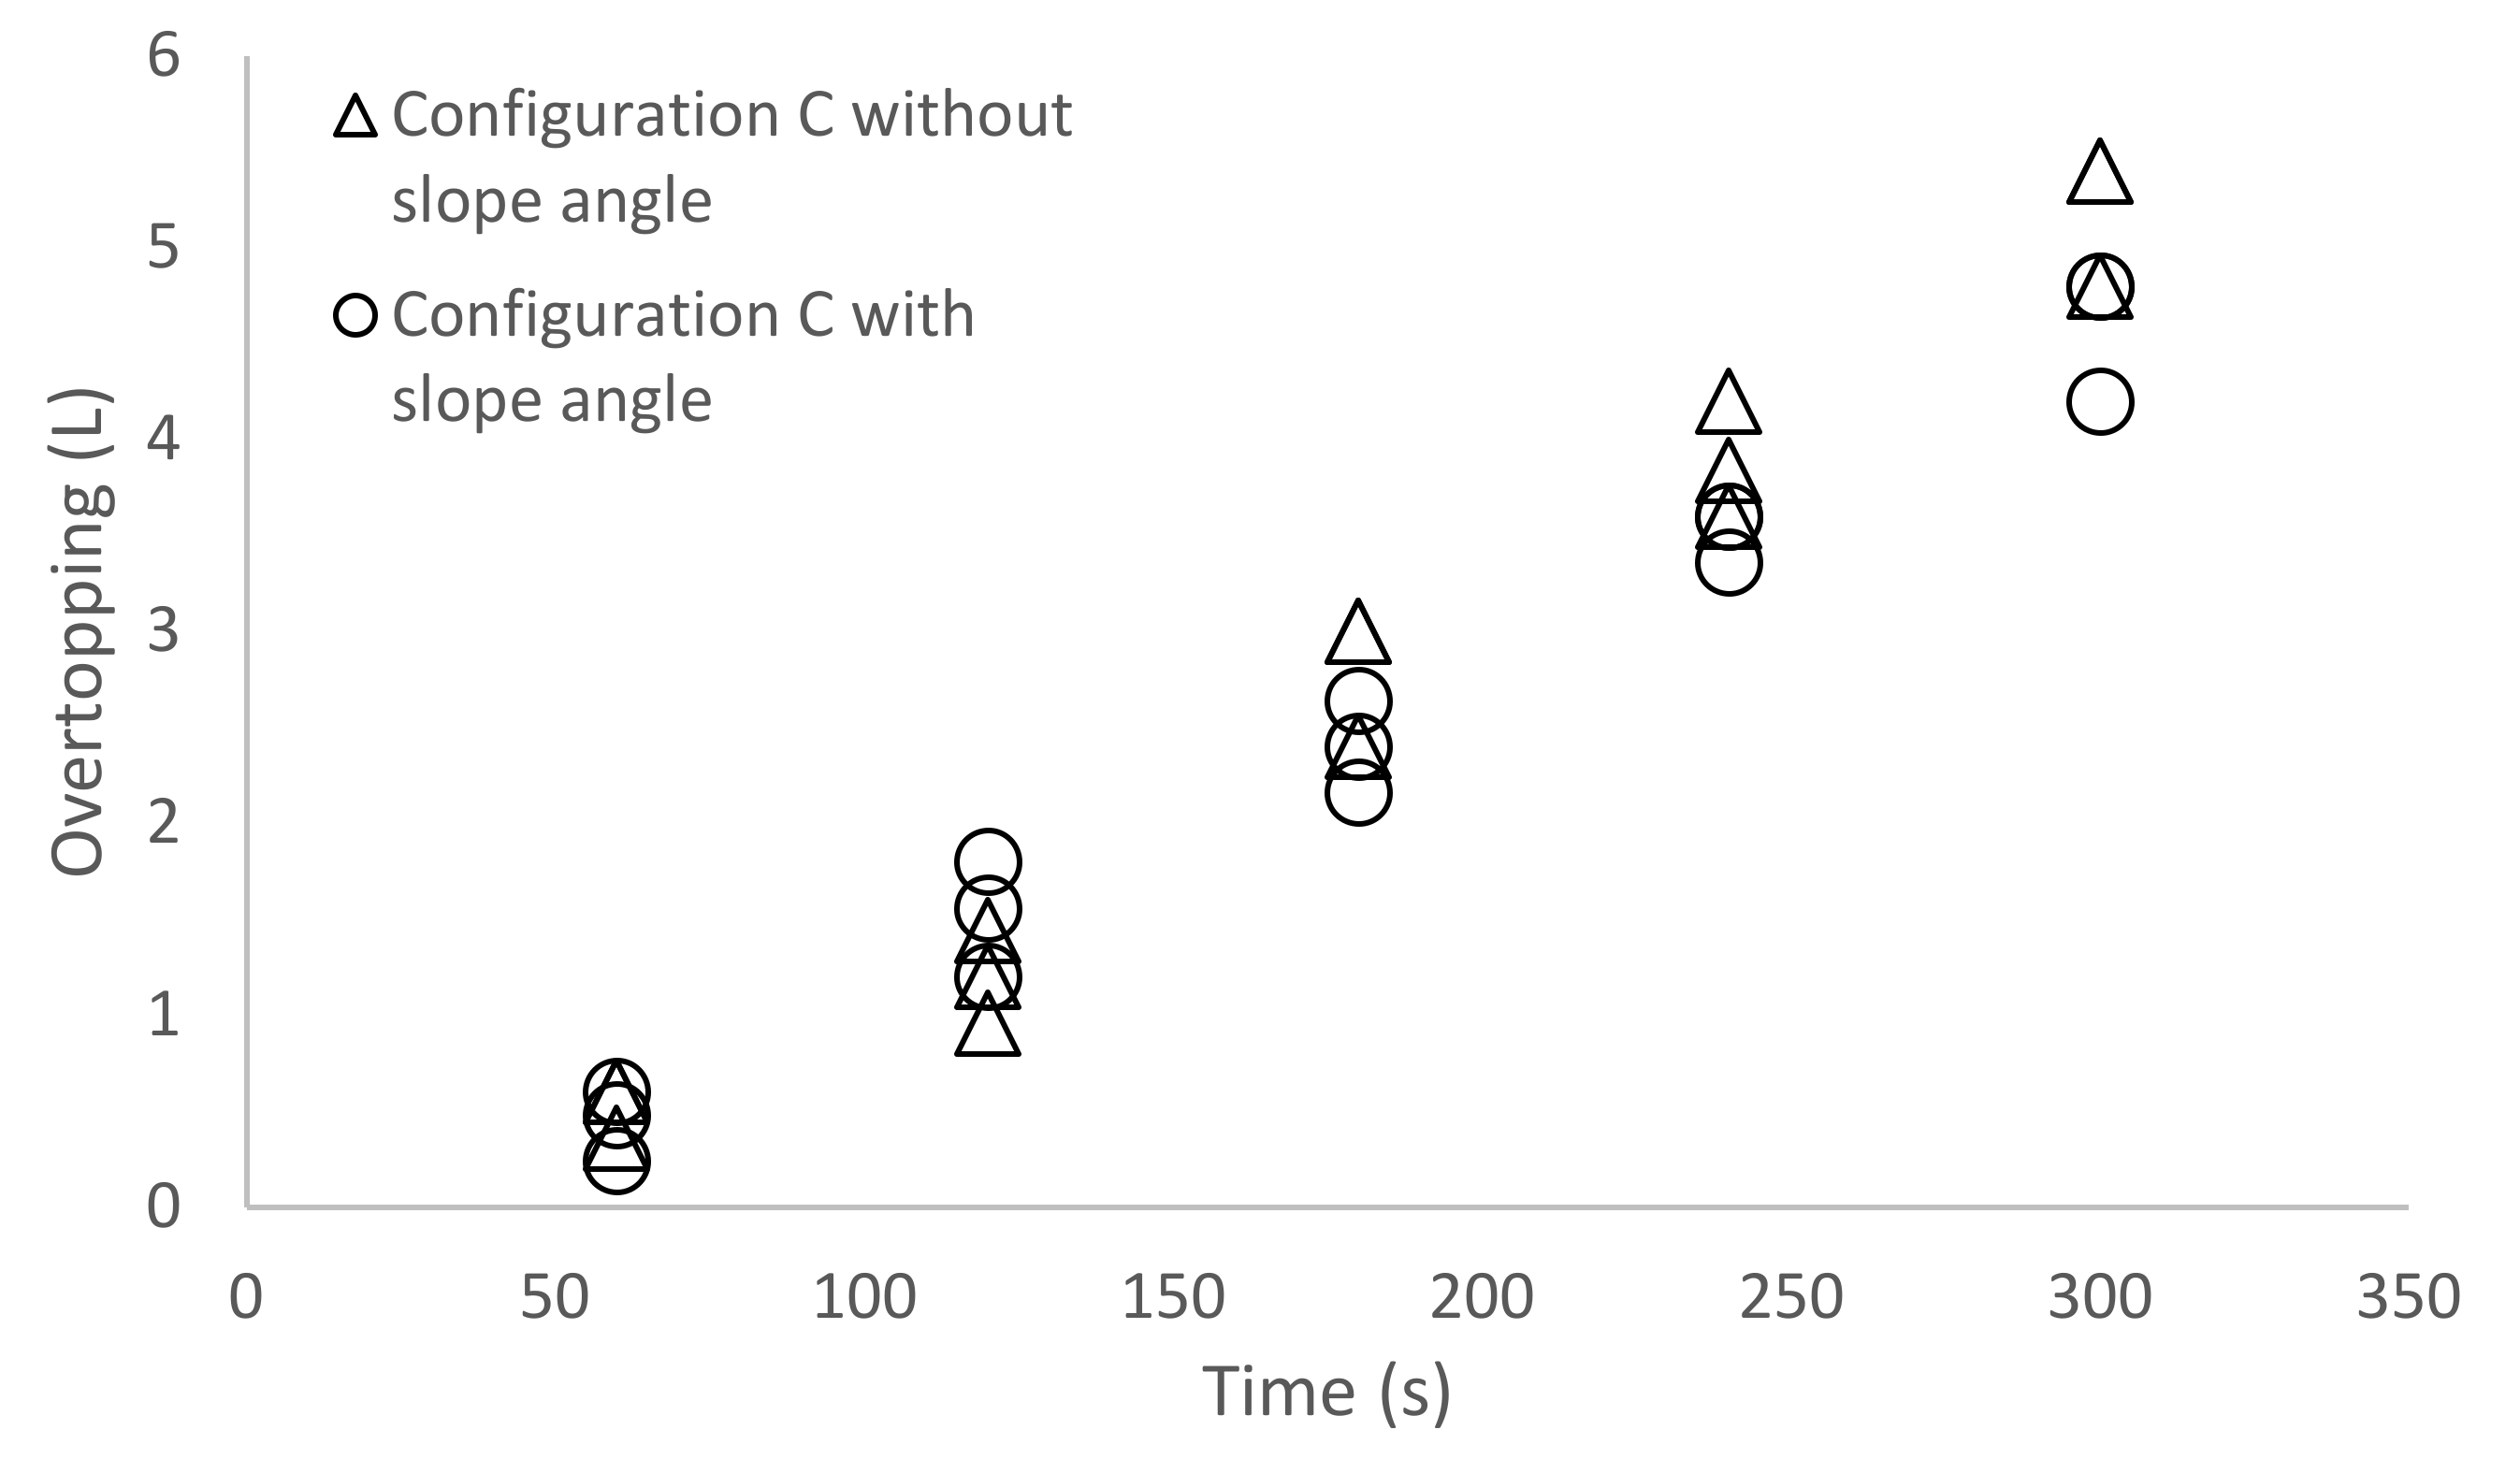
As shown in Figure 8 and Figure 9 (results summarised in Table 5), Configuration C was the most effective at attenuating wave energy and has the least overtopping volume, closely followed by Configuration B.
Configuration A was the least effective at attenuating wave energy, as the overtopping volumes measured greatly exceeded that of the other configurations, often with the overtopping device reaching full capacity in large amplitude waves.
All configurations showed a linear increese in overtopping with wave amplitude.
Regression analyses presented in Figure 8 and Figure 9 all show correlation values of R2 > 0.93. There is only a slight change in results when a slope angle is present that becomes increasingly evident under large amplitudes exceeding 0.07 m. This indicates that when the structures are subject to high amplitude waves, the effect of a slope angle is more important as the resultant wave shape can be reflected back away from the structure rather than in a vertical profile.
High amplitude waves also have increased energy, so the importance of reflecting this wave energy is emphasised.
3.3. JONSWAP Wave Conditions
Figure 10 and Figure 11 display the comparison of experimental datasets collected under JONSWAP hydraulic conditions without and with a slope angle present (measurements are summarised in Table 6).
Results show that Configuration A was the most effective at attenuating wave energy and had the least overtopping volume collected, closely followed by configuration C. Configuration B was the least effective as overtopping measured greatly exceeded that of the other configurations, with it being unable to complete the full simulation without a slope angle present due to the overtopping device being at full capacity at three minutes (180 seconds) in. It is interesting to note that configurations B and C effectively switch places between tests with the sine wave and JONSWAP wave.
A reduction in overtopping volumes of configurations B and C is noticed when a slope angle is present. Configuration A shows a slight increse in overtopping volume when the slope angle is present.
A linear trendline had been used for graphical data to show a direct correlation between the increase in time and overtopping, and R2 values obtained exceed 0.91 and are a strong indicator of direct proportionality, despite varying wave heights and frequencies.
The resultant graphs for the JONSWAP simulation against Configurations A, B, and C reinforce the findings from testing in frequency and amplitude. Configuration A and C did not benefit from having a slope angle present, but Configuration B did, as the nature of its shape allowed the reflected wave to be directed away from the face of the structure. This is also noticeable in Figure 10 where it is clear that Configuration B without any slope angle could not complete the full final simulation. Results recorded after the collection tray had reached full capacity have been omitted from the graphical data to give a more accurate trendline as the data was clearly outlying in Figure 11.
4. Discussion
4.1. Wave Attenuation Mechanisms Observed
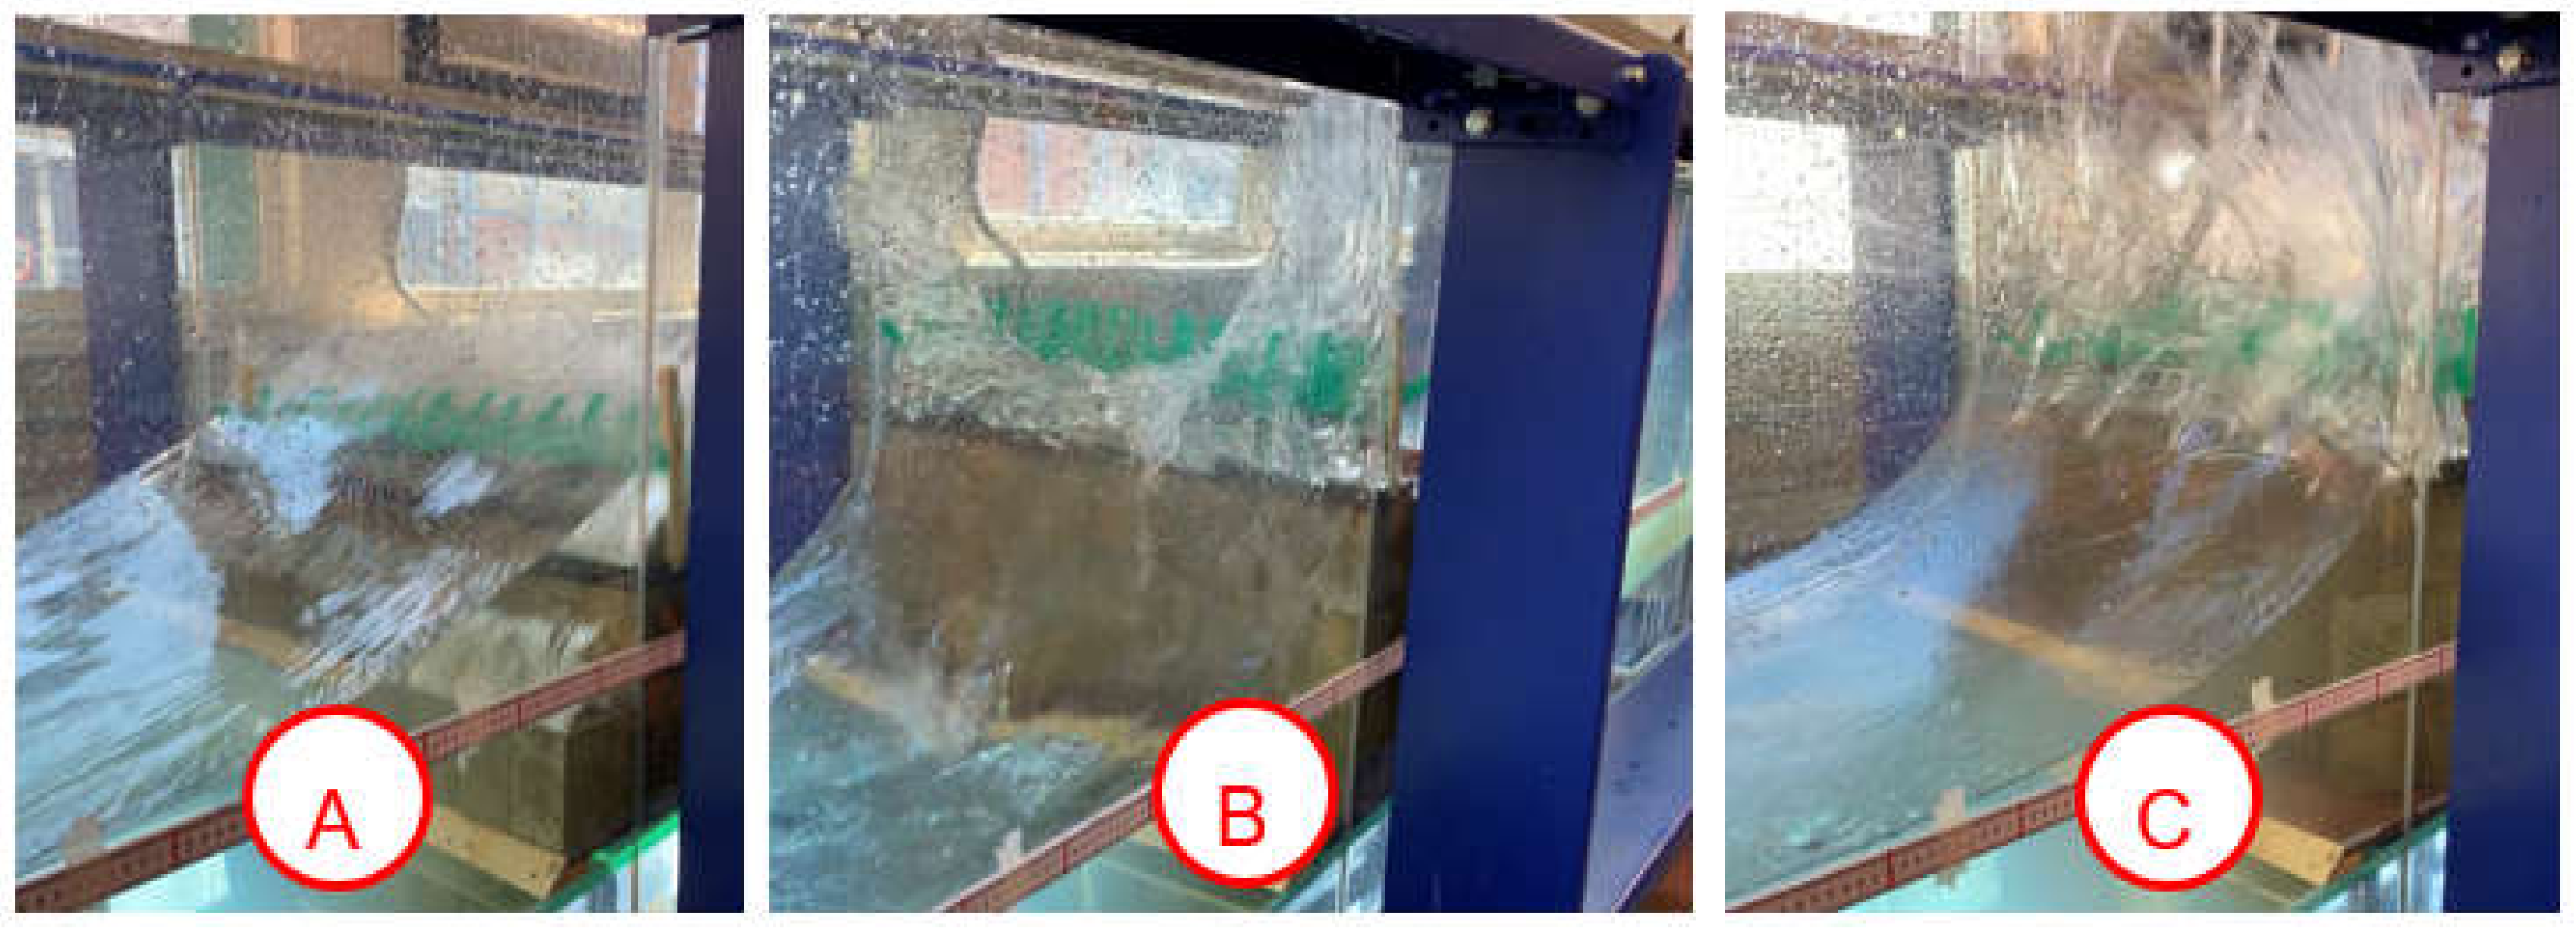
Figure 15 displays images taken from lab recordings of high amplitude waves observed during testing. By observing the wave interaction with the structure, it can help us understand why different shaped structures work better in dissipating wave energy and re-directing the incoming water.
The behaviours of these waves can be described as follows:
Configuration A—Wave impact was low and flat, resulting in wave energy being dissipated on the breakwater structure. The stepped approach acted as a ramp channelling the water over the top of the structure. However air voids between steps helped to increase turbulence and reduce wave energy. The photographs demonstrate that the artificial vegetation reduces the energy of waves as the stems and broad leaves could be seen to bent back in. This supported Kerpen’s claims [64] that stepped structures, constitutive of a slope with uniform roughness, reduce overtopping volumes [64]. Waves were not observed at a great height over the structure and never neared the top of the flume walls.
Configuration B—Wave impact on this structure was sudden and as a result caused the waves to ride up the surface of the flat faced wall. This meant that reflected waves often passed over the structure or collapsed on top in a large wave wall without the presence of a slope angle to direct flow away. The wave height observed was far greater than the other configurations in particular with the configuration tested with 0.8 m amplitude.
Configuration C—The impact of waves was sudden and often had a clapping noise as it impacted the angled block wall and water filled the air voids. The incident wave ran up the surface of the structure and fell in streaks due to the “V” channels created by streamlining the blocks. The wave height observed for a 0.8 m amplitude wave was high, splashing above the flume walls (0.6 m).
Effect of Slope Angles
Having a slope angle was key to real life schemes as often sea defence structures are built on the foreshore and the topographical levels on the ground have varying gradients. At some point in the construction process there will be a decision made whether a platform (structural foundation) is required due to ground conditions and the most suitable angle to aid the protection of the coast and provide stability. From lab testing the key benefits of the shallow slope angle can be summarised as follows.
Surface runoff is directed back out to sea. Potential water that would have overtopped the structure due to surface runoff was directed back towards the incoming waves. Although ultimately this did not make a significant difference to the volume collected within this study, this is important when considering a scaled-up model. Over a longer duration, a large amount of water has the potential to be accumulated, giving an increased importance to last resort defence features, such as sea walls.
Wave reflection is aided and splash is directed back to sea. Rather than the wave splash being at 90° to the water surface and a horizontal splash profile that causes much of the wave to collapse back onto the structure, the introduction of a slope angle means that the resulting splash will be at an acute angle to the water’s surface. The wave energy therefore will be directed back out towards incoming waves. The effect of this can be appreciated in the results from the JONSWAP synthesis analysis that with a slope angle Configuration B performed far better, completing a full five-minute simulation that it was not previously able to.
4.2. Effectiveness in Reducing the Overtopping
In order to evaluate the overall effectiveness of structures and assess how they performed in wave attenuation across the various testing spectra, Table 7 was created. It displays a point scoring system based on the overtopping volume collected in resultant graphs, with structures collecting the least water volume being 1st (3 points), 2nd (2 points) and the structure overtopping the most receiving 3rd (1 point).
The total effectiveness in this study concludes that Configuration C performed the best across the three testing scenarios but does not necessarily mean that it is the most practical to use in every coastal scenario. This is due to effectiveness being dependant on multiple conditions including the type of waves the structures are subject to, the location of the protection measure, and subsequent impacts to the ecosystem from its construction.
After considering the results from the sine testing (changing amplitude and frequency), it would have been reasonable to predict that Configuration C would have also been the most effective in a JONSWAP testing scenario. However, this was not the case in JONSWAP testing where Configuration A outperformed all structures when subject to high energy wave conditions at irregular amplitudes and frequencies. This was mainly because the sine testing was more influenced by friction and gravity (than wave reflection) as the lower energy of the waves had a smaller impact in this respect. In contrast to this, JONSWAP waves simulated high energy waves, which created more interference with each other over the duration. Although friction factors and gravity losses still played a significant part in the JONSWAP simulation, the way the structures reflected wave energy and the resultant wave interception were more important when analysing the performance of configurations tested.
When reviewing the footage of the experiments, interference caused by the reflected wave played a big part in its effectiveness as it created wave interference when two waves from opposite directions meet. When considering Configuration A, the most effective in JONSWAP testing, it could be seen that reflected waves caused destructive interference. The crest of the reflected wave lined up with the trough of the incoming wave, resulting in them cancelling out as they were out of phase and thus creating a reduced wave. On camera footage, the sloped shape of this configuration allowed some overtopping but also allowed some of the incident wave energy to run back down the structure. As a result, this created a rocking motion within the water and aiding the waves sinusoidal wave movement. Another observation during JONSWAP testing is how the reflected wave location moved position in the tank. At the start of testing, the location of reflected waves meeting incoming waves was near to the structure, and as the frequent waves continued, the reflected wave moved back throughout the flume. This indicates that by using structures that are effective at creating destructive interference (Configuration A), the impact on the coastal structure will be lessened and over time overtopping will be greatly reduced as a result of this.
This contrasted to Configuration’s B and C, which were not as effective in this process. Due to the nature of their shape creating a high impact force for waves, the wave reflection was more aggressive, unlike the stepped shape breaking down energy and creating turbulence, as the water energy is re-directed up in the air and crashes down. This would often cause constructive interference, making irregular larger waves as a result of the crests of reflected waves and incoming waves lining up. This would help to explain why wall-like structures (such as Configurations B and C) are more effective as a last resort defence on the shoreline, rather than a breakwater on the foreshore. In amplitude testing, R2 values were taken very close to 1 (direct proportionality). This indicated a very good positive correlation in results, indicating that with increased amplitudes, the wave speed and energy increases, causing a higher overtopping. Configurations with a large impact stopping force, such as B and C, performed far better in these scenarios as they reflected wave energy effectively.
4.3. Real Life Implications
When comparing configuration A to existing structures identified by the literature review, it is possible to see similarities to a coastal revetment. The stepped nature of the structure made it act like a ramp, aiding in dissipating some of the wave energy and proving a direction for the water to travel, so the water runs up its surface, rather than producing a direct impact, by utilising a sloped approach method. Similarities can also be drawn with the tetrapod’s strategy as the nature of waves breaking against the structure aiding its wave attenuation can be drawn, and both structures seem most applicable at low water levels, as the stepped structure did not perform well under high amplitude waves.
On the other hand, Configuration B, if compared to existing structures identified by the literature review, has multiple similarities to a seawall structure. It proved effective against high amplitude waves as it provided a direct stopping force for the energy. For real life implications, seawalls are usually curved at the top as the large wave wall produced can then be directed back out to sea. Instead, artificial seagrass located on top of the wall aimed to re-direct water back away from the structure. This method was effective under low wave amplitudes; however, as the wave energy increased, the water was overpowering and often bypassed the seagrass completely due to the reflected water trajectory. It was noticed that the nature of a seawall is not effective in creating destructive interference as when reflected waves met incoming waves; this often led to the creation of larger waves, with higher wave energy and the potential to cause more erosion.
Finally, when comparing configuration C to existing structures identified by the literature review, you can see similarities to a seawall and a breakwater. It could effectively manage high amplitude waves as it could take the high impact of the waves and channel the water up the wall like a seawall. As with Configuration B, the artificial seagrasses located on top appeared to be most effective under low wave energy, where splash height was low and overtopping less aggressive. It also acted in a similar way to breakwater, as the concrete blocks in breakwater are often in random arrangements causing the water to interact with the edges of blocks causing a streamlined effect and channelling the water round them rather than a direct impact with their flat face. This causes the wave energy to disperse rather than a direct impact.
When investigating the sustainability of all the configurations tested, they can be deliberately considered to manipulate the shoreline to satisfy human need [92] and so are still largely seen as hard from an engineering perspective. However, they can all be considered ideal for the development of coral reefs and natural ecosystems that could replace the “green areas” simulated on this study, in line with the theory of incorporating natural habitats into hard solutions by permitting space for coastal adjustments. By implementing sea life and habitat restoration on the foreshore of beaches to combine with engineering options, a combined solution can be found where the ecosystem and engineering methods can act together to provide effective wave attenuation [93,94].
4.4. Limitations
4.4.1. Importance of Slope Factors
The slope of the coast is a key factor that could largely influence the inundation during a flooding event (permanent or sporadic) generated by sea level rise. Additionally, the angle of the beaches could actually control the velocity with which the sea withdraw in case of inland water running for flooding due to other types (e.g., river or urban). This is a crucial factor that was not considered in this study but that will require an extensive experimental campain to produce map of slopes and the consequent hydraulics conditions associated for varius flow rates and velocities to be used to calibrate and validate numerical models and to identify solutions, which could reduce the vulnerability of lower slopes (in the case of flooding from the sea) or higher slopes (in the case of inland flooding) [95,96]. Furthermore, to accurately quantify wave energy and other crucial parameters, more sophisticated equipment is needed. For example, for quantifying the wave energy, an instrument more accurate than a ruler would be necessary to estimate the significant wave height. Low-cost techniques recently published and applied to other fields [97,98,99,100] will provide a support in improving the accuracy of the measurement within this study. For example, by using low cost cameras (GoPro), it will be possible to implementing Particle Image Velocimetry and Planar Concentration Analysis techniques to better quantify velocity field and pollutant maps to assess the performance of coastal structures in terms of wave attenuation and pollutant transport.
4.4.2. Importance of Permeability Factors
Studies conducted to date have confirmed that tsunamis and storms have generated washover deposits across beaches or dunes in the last decade [101]. The deposition of sediments therefore continues to alter the morphology of coastal areas after each storm event [102,103,104,105,106,107,108], penetrating into existing material and causing various levels of stratification which vary the permeability of the site. This is another aspect that was beyond the scope of this study but would require the characterization of sedimentary characteristics of varius type of washover successions for multiple coastal tophography configurations, including the beach ridge elevation and backshore tophography. The presence of specific permeable material within the first layers of the stratification could in face, if characterized, be used as a sustainable solution for storing part of the water that inundates communities living in coastal areas.
4.4.3. Importance of Marine Currents and Bathymeric Factors
Wind waves, storm surges and ocean circumation play a significan contribution to to risk of flooding in coastal areas [109]. All these aspects can alter the mechanical force of the storm surge [110,111,112,113], generating different erosion effects and flooding conditions [114,115]. Despite being typical and dissimilar for each site conditions, concurrence of astronomical high tides and energetic waves can influence the likelihood of overtopping and consequent inundation, posing a hugh threat for coastal population and urbanisation. This aspect requires the quantification of velocity vector maps, quantification of tide rise and the characterization of waves induces by strong winds, and this was not possible to replicate within the experimental facility adopted in this study. However, it is also vital to estimate the interaction between these natural and environmental conditions and the frequency and magnitude of flooding events to target specific schemes that could better perform and are less sensitive to the natural processes involved and their interaction [116].
4.4.4. Importance of Real Vegetation Studies
As previously written, due to the impracticability of growing real seagrasses, a physical model has been made to reproduce submerged vegetation by using straws and plastic sheets to mimic the thick stem structure and broad narrow leaves. The choice of this artificial solution was made to isolate specific responses within the laboratory experiment under controlled conditions and to inform future work with real vegetation. Ideally, future studies will also incorporate the testing of specific patches and geometries, which could generate a variety of drag coefficients CD and Reynolds numbers Re.
5. Conclusions
The purpose of the research was to assess the viability of a combined hard and soft engineered breakwater solution for coastline protection. A comprehensive literature review was conducted to identify existing structures to aid the protection of coastlines and innovative solutions being investigated worldwide. Advantages and disadvantages for each solution were discussed and combined into three newly designed configurations. Experimental tests were then conducted testing these three different configurations for overtopping performance against a range of varying wave simulations that were designed to replicate different real-life conditions.
The tests were performed at the same testing location, with overtopping measured at the end of each wave simulation to judge the amount of wave attenuation of each structural configuration. The results showed that configurations with a high impact stopping force (such as Configurations B and C) outperformed a stepped structure (Configuration A) in lower energy sine waves that simulate shallower water. During the JONSWAP simulation, however (with higher energy waves, such as would be found in conditions in the North Sea), a stepped configuration outperformed the walled configurations as it attenuated the waves further and hence allowed less overtopping. It was identified that the contributing factor influencing the increased effectiveness was the structure’s ability to reflect waves in a nature that causes destructive interference of the reflected wave and the incident wave. This resulted in reduced waves as they cancelled each other out.
In addition to measuring overtopping volumes, a video camera was used to observe the hydraulic behaviours for each structural configuration. These could best be seen under the high amplitude (0.09 m) sine spectrum waves tested, where the increased wave height resulted in increased wave energy. Images provided demonstrate the resultant wave shape of the stepped configuration was low and flat, making it suitable as a breakwater; however, wave impact on a flat faced wall was sudden and caused the waves to ride up the surface. To build further on this, the experiments also explored the performance of each structural configuration with and without using a testing platform. This modification was incorporated to create an angle to the structure in the water, to match that of the sloping foreshore. It was found that the presence matching the sloping foreshore (4.5% gradient) aided structural protection measures with a high impact stopping force (Configurations B and C), with key benefits to the reflected wave trajectory and surface runoff. The findings of this work helped provide recommendations for future research needed to achieve sustainable approaches in coastal defence design.
Future research could explore the performance of the breakwater structures in the remaining ranges of the JONSWAP wave that were not covered in the initial sine testing (by testing frequencies between 0.5–2 Hz and amplitudes from 0.1–0.3 m), in order to better understand and predict the exact frequency and amplitude values, at which the stepped breakwater began to outperform the wall-like structures. Furthermore, in order to further understand sustainable design of submerged breakwaters, future research should focus on the following criteria to be analysed:
- The use of different materials to identify how material roughness influences overtopping and if a sustainable material can be utilized for practical implications.
- The use of real vegetation to investigate effects of flexible coral reefs and underwater vegetation for the wave attenuation and the spread of pollutants in the proximity of coastal areas.
- The testing of structural configurations with different vegetation appropriate for saltwater to assess their effectiveness in reducing overtopping, decreasing wave energy and the structure’s effect on their longevity.
- Further experimentation with slope angles to determine a best shape/angle to reflect wave energy with each breakwater design.
- Investigation into sediment movements by testing structures with a hit and miss concrete base.
By allowing these open channels within the structure, the flow of water will work with the natural movement of sands and waves to allow sand deposition further along the coast. This way, the sea defence will not prevent the beach from replenishing its supply of sand as a natural defence to dissipate wave energy. This method will also allow the possibility to investigate longshore drift and the effect of the structure on the movement of beach sediment.
Author Contributions
Conceptualization, M.R.; methodology, M.R. and J.H. (Jacob Heyworth); validation, M.R., J.H. (Jacob Heyworth), and J.H. (James Hart); formal analysis, J.H. (Jacob Heyworth) and M.R.; investigation, J.H. (Jacob Heyworth) and M.R.; resources, M.R.; data curation, M.R., J.H. (Jacob Heyworth), and J.H. (James Hart); writing—original draft preparation, M.R., J.H. (Jacob Heyworth), and J.H. (James Hart); writing—review and editing, M.R., J.H. (Jacob Heyworth), and J.H. (James Hart); visualization, J.H. (Jacob Heyworth); supervision, M.R.; project administration, M.R. All authors have read and agreed to the published version of the manuscript.
Funding
This research received no external funding.
Acknowledgments
The authors would like to thank Ian Breakwell and Craig Harrison for technical support with this project.
Conflicts of Interest
The authors declare no conflict of interest.
References
- Scardino, G.; Sabatier, F.; Scicchitano, G.; Piscitelli, A.; Milella, M.; Vecchio, A.; Anzidei, M.; Mastronuzzi, G. Sea-Level Rise and Shoreline Changes Along an Open Sandy Coast: Case Study of Gulf of Taranto, Italy. Water 2020, 12, 1414. [Google Scholar] [CrossRef]
- Martínez-Graña, A.; Gómez, D.; Santos-Francés, F.; Bardají, T.; Goy, J.L.; Zazo, C. Analysis of Flood Risk Due to Sea Level Rise in the Menor Sea (Murcia, Spain). Sustainability 2018, 10, 780. [Google Scholar] [CrossRef] [Green Version]
- Chen, W.-B.; Chen, H.; Lin, L.-Y.; Yu, Y.-C. Tidal Current Power Resources and Influence of Sea-Level Rise in the Coastal Waters of Kinmen Island, Taiwan. Energies 2017, 10, 652. [Google Scholar] [CrossRef] [Green Version]
- Melo de Almeida, L.P.; Almar, R.; Meyssignac, B.; Viet, N.T. Contributions to Coastal Flooding Events in Southeast of Vietnam and their link with Global Mean Sea Level Rise. Geosciences 2018, 8, 437. [Google Scholar] [CrossRef] [Green Version]
- White, E.D.; Meselhe, E.; Reed, D.; Renfro, A.; Snider, N.P.; Wang, Y. Mitigating the Effects of Sea-Level Rise on Estuaries of the Mississippi Delta Plain Using River Diversions. Water 2019, 11, 2028. [Google Scholar] [CrossRef] [Green Version]
- Van De Lageweg, W.I.; Slangen, A.B.A. Predicting Dynamic Coastal Delta Change in Response to Sea-Level Rise. J. Mar. Sci. Eng. 2017, 5, 24. [Google Scholar] [CrossRef] [Green Version]
- Davtalab, R.; Mirchi, A.; Harris, R.J.; Troilo, M.X.; Madani, K. Sea Level Rise Effect on Groundwater Rise and Stormwater Retention Pond Reliability. Water 2020, 12, 1129. [Google Scholar] [CrossRef] [Green Version]
- Kumbier, K.; Carvalho, R.C.; Woodroffe, C.D. Modelling Hydrodynamic Impacts of Sea-Level Rise on Wave-Dominated Australian Estuaries with Differing Geomorphology. J. Mar. Sci. Eng. 2018, 6, 66. [Google Scholar] [CrossRef] [Green Version]
- Hsu, T.-W.; Shih, D.-S.; Li, C.-Y.; Lan, Y.-J.; Lin, Y.-C. A Study on Coastal Flooding and Risk Assessment under Climate Change in the Mid-Western Coast of Taiwan. Water 2017, 9, 390. [Google Scholar] [CrossRef]
- Masud, M.M.; Sackor, A.S.; Ferdous Alam, A.S.A.; Al-Amin, A.Q.; Ghani, A.B.A. Community responses to flood risk management—An empirical Investigation of the Marine Protected Areas (MPAs) in Malaysia. Mar. Policy 2018, 97, 119–126. [Google Scholar] [CrossRef]
- Vieira, B.F.V.; Pinho, J.L.S.; Barros, J.A.O.; Antunes do Carmo, J.S. Hydrodynamics and Morphodynamics Performance Assessment of Three Coastal Protection Structures. J. Mar. Sci. Eng. 2020, 8, 175. [Google Scholar] [CrossRef] [Green Version]
- Kron, W. Coasts: The high-risk areas of the world. Nat. Hazards 2013, 66, 1363–1382. [Google Scholar] [CrossRef]
- Storch, H.; Downes, N.K. A scenario-based approach to assess Ho Chi Minh City’s urban development strategies against the impact of climate change. Cities 2011, 28, 517–526. [Google Scholar] [CrossRef]
- Fu, X.; Song, J. Assessing the Economic Costs of Sea Level Rise and Benefits of Coastal Protection: A Spatiotemporal Approach. Sustainability 2017, 9, 1495. [Google Scholar] [CrossRef] [Green Version]
- Jabareen, Y. Planning the resilient city: Concepts and strategies for coping with climate change and environmental risk. Cities 2013, 31, 220–229. [Google Scholar] [CrossRef]
- Scyphers, S.B.; Beck, M.W.; Furman, K.L.; Haner, J.; Josephs, L.I.; Lynskey, R.; Keeler, A.G.; Landry, C.E.; Powers, S.P.; Webb, B.M.; et al. A Waterfront View of Coastal Hazards: Contextualizing Relationships among Geographic Exposure, Shoreline Type, and Hazard Concerns among Coastal Residents. Sustainability 2019, 11, 6687. [Google Scholar] [CrossRef] [Green Version]
- Ito, T.; Setoguchi, T.; Miyauchi, T.; Ishii, A.; Watanabe, N. Sustainable Downtown Development for the Tsunami-Prepared Urban Revitalization of Regional Coastal Cities. Sustainability 2019, 11, 1020. [Google Scholar] [CrossRef] [Green Version]
- Wijaya, N.; Nitivattananon, V.; Shrestha, R.P.; Kim, S.M. Drivers and Benefits of Integrating Climate Adaptation Measures into Urban Development: Experience from Coastal Cities of Indonesia. Sustainability 2020, 12, 750. [Google Scholar] [CrossRef] [Green Version]
- Ge, Y.; Dou, W.; Liu, N. Planning Resilient and Sustainable Cities: Identifying and Targeting Social Vulnerability to Climate Change. Sustainability 2017, 9, 1394. [Google Scholar] [CrossRef] [Green Version]
- Xie, H.; He, Y.; Xie, X. Exploring the factors influencing ecological land change for China’s Beijing-Tianjin-Hebei Region using big data. J. Clean. Prod. 2017, 142, 677–687. [Google Scholar] [CrossRef]
- Yao, G.; Xie, H. Rural spatial restructuring inecologically fragile mountainous areas of Southern China: A case study of Changgang Town, Jiangxi Province. J. Rural Stud. 2016, 47, 435–448. [Google Scholar] [CrossRef]
- Wang, P.; Yao, G.; Liu, G. Spatial evaluation of the ecological importance based on GIS for environmental management: A case study in Xingguo county of China. Ecol. Indic. 2015, 51, 3–12. [Google Scholar]
- Wong, K.; Zhang, Y.; Tsou, J.Y.; Li, Y. Assessing Impervious Surface Changes in Sustainable Coastal Land Use: A Case Study in Hong Kong. Sustainability 2017, 9, 1029. [Google Scholar] [CrossRef] [Green Version]
- Gittman, R.K.; Peterson, C.H.; Currin, C.A.; Joel Fodrie, F.; Piehler, M.F.; Bruno, J.F. Living shorelines can enhance the nursery role of threatened estuarine habitats. Ecol. Appl. 2016, 26, 249–263. [Google Scholar] [CrossRef]
- Scyphers, S.B.; Powers, S.P.; Heck, K.L.; Byron, D., Jr. Oyster reefs as natural breakwaters mitigate shoreline loss and facilitate fisheries. PLoS ONE 2011, 6, e22396. [Google Scholar] [CrossRef]
- Piazza, B.P.; Banks, P.D.; La Peyre, M.K. The Potential for Created Oyster Shell Reefs as a Sustainable Shoreline Protection Strategy in Louisiana. Restor. Ecol. 2005, 13, 499–506. [Google Scholar] [CrossRef]
- Smith, C.S.; Puckett, B.; Gittman, R.K.; Peterson, C.H. Living shorelines enhanced the resilience of saltmarshes to Hurricane Matthew (2016). Ecol. Appl. 2018, 28, 871–877. [Google Scholar] [CrossRef] [Green Version]
- Feagin, R.A.; Figlus, J.; Zinnert, J.C.; Sigren, J.; Martínez, M.L.; Silva, R.; Smith, W.K.; Cox, D.; Young, D.R.; Carter, G. Going with the flow or against the grain? The promise of vegetation for protecting beaches, dunes, and barrier islands from erosion. Front. Ecol. Environ. 2015, 13, 203–210. [Google Scholar] [CrossRef] [Green Version]
- Maun, M.A. The Biology of Coastal Sand Dunes; Oxford University Press: Oxford, UK, 2009; ISBN 978-0-19-857036-3. [Google Scholar]
- Spalding, M.D.; Ruffo, S.; Lacambra, C.; Meliane, I.; Hale, L.Z.; Shepard, C.C.; Beck, M.W. The role of ecosystems in coastal protection: Adapting to climate change and coastal hazards. Ocean Coast. Manag. 2014, 90, 50–57. [Google Scholar] [CrossRef]
- Reguero, B.G.; Beck, M.W.; Bresch, D.N.; Calil, J.; Meliane, I. Comparing the cost effectiveness of nature-based and coastal adaptation: A case study from the Gulf Coast of the United States. PLoS ONE 2018, 13, e0192132. [Google Scholar] [CrossRef] [Green Version]
- Martínez, M.L.; Vázquez, G.; White, D.A.; Thivet, G.; Brengues, M. Effects of burial by sand and inundation by fresh- and seawater on seed germination of five tropical beach species. Can. J. Bot. 2002, 80, 416–424. [Google Scholar] [CrossRef]
- Costanza, R.; Pérez-Maqueo, O.; Martinez, M.L.; Sutton, P.; Anderson, S.J.; Mulder, K. The Value of Coastal Wetlands for Hurricane Protection. Ecol. Econ. 2008, 37, 241–248. [Google Scholar] [CrossRef]
- Salgado, K.; Martinez, M.L. Is ecosystem-based coastal defense a realistic alternative? Exploring the evidence. J. Coast. Conserv. 2017, 21, 837–848. [Google Scholar] [CrossRef]
- Narayan, S.; Beck, M.W.; Wilson, P.; Thomas, C.J.; Guerrero, A.; Shepard, C.C.; Reguero, B.G.; Franco, G.; Ingram, J.C.; Trespalacios, D. The Value of Coastal Wetlands for Flood Damage Reduction in the Northeastern USA. Sci. Rep. 2017, 7, 9463. [Google Scholar] [CrossRef] [PubMed]
- Sutton-Grier, A.E.; Wowk, K.; Bamford, H. Future of our coasts: The potential for natural and hybrid infrastructure to enhance the resilience of our coastal communities, economies and ecosystems. Environ. Sci. Policy 2015, 51, 137–148. [Google Scholar] [CrossRef] [Green Version]
- Arkema, K.K.; Guannel, G.; Verutes, G.; Wood, S.A.; Guerry, A.; Ruckelshaus, M.; Kareiva, P.; Lacayo, M.; Silver, J.M. Coastal habitats shield people and property from sea-level rise and storms. Nat. Clim. Chang. 2013, 3, 1–6. [Google Scholar] [CrossRef]
- Barbier, E.B.; Koch, E.W.; Silliman, B.R.; Hacker, S.D.; Wolanski, E.; Primavera, J.; Granek, E.F.; Polasky, S.; Aswani, S.; Cramer, L.A.; et al. Coastal ecosystem-based management with nonlinear ecological functions and values. Science 2008, 319, 321–323. [Google Scholar] [CrossRef]
- Möller, I.; Kudella, M.; Rupprecht, F.; Spencer, T.; Paul, M.; van Wesenbeeck, B.K.; Wolters, G.; Jensen, K.; Bouma, T.J.; Miranda-Lange, M.; et al. Wave attenuation over coastal salt marshes under storm surge conditions. Nat. Geosci. 2014, 7, 727–731. [Google Scholar] [CrossRef] [Green Version]
- Spalding, M.D.; McIvor, A.L.; Beck, M.W.; Koch, E.W.; Möller, I.; Reed, D.J.; Rubinoff, P.; Spencer, T.; Tolhurst, T.J.; Wamsley, T.V.; et al. Coastal Ecosystems: A Critical Element of Risk Reduction. Conserv. Lett. 2013, 7, 293–301. [Google Scholar] [CrossRef]
- Narayan, S.; Beck, M.W.; Reguero, B.G.; Losada, I.J.; van Wesenbeeck, B.; Pontee, N.; Sanchirico, J.N.; Ingram, J.C.; Lange, G.-M.; Burks-Copes, K.A. The Effectiveness, Costs and Coastal Protection Benefits of Natural and Nature-Based Defenses. PLoS ONE 2016, 11, e0154735. [Google Scholar] [CrossRef] [Green Version]
- Perez-Maqueo, O.; Martinez, M.L.; Sanchez-Barrandas, F.C.; Kolb, M. Assessing Nature-Based Coastal Protection against Disasters Derived from Extreme Hydrometeorological Events in Mexico. Sustainability 2018, 10, 1317. [Google Scholar] [CrossRef] [Green Version]
- Chua, T.-E.; Bonga, D.; Bermas-Atrigenio, N. Dynamics of Integrated Coastal Management: PEMSEA’s Experience. Coast. Manag. 2006, 34, 303–322. [Google Scholar] [CrossRef]
- Duarte, C.M.; Losada, I.J.; Hendriks, I.E.; Mazarrasa, I.; Marbà, N. The role of coastal plant communities for climate change mitigation and adaptation. Nat. Clim. Chang. 2013, 3, 961–968. [Google Scholar] [CrossRef] [Green Version]
- McLeod, K.L.; Lubchenco, J.; Palumbi, S.; Rosenberg, A.A. Scientific Consensus Statement on Marine Ecosystem-Based Management; Communication Partnership for Science and the Sea; Duke University: Durham, NC, USA, 2005. [Google Scholar]
- Bridges, T.S.; Wagner, P.W.; Burks-Copes, K.A.; Bates, M.E.; Collier, Z.A.; Fischenich, J.C.; Gailani, J.Z.; Leuck, L.D.; Piercy, C.D.; Rosati, J.D.; et al. Use of Natural and Nature-Based Features (NNBF) for Coastal Resilience; The US Army Engineer Research and Development Center (ERDC): Vicksburg, MS, USA, 2015; pp. 1–479. [Google Scholar]
- Palmer, M.A.; Liu, J.; Matthews, J.H.; Mumba, M.; D’Odorico, P. Manage water in a green way. Science 2015, 349, 584–585. [Google Scholar] [CrossRef] [PubMed] [Green Version]
- Temmerman, S.; Kirwan, M.L. Building land with a rising sea. Science 2015, 349, 588–589. [Google Scholar] [CrossRef]
- Van der Nat, A.; Vellinga, P.; Leemans, R.; van Slobbe, E. Ranking coastal flood protection designs from engineered to nature-based. Ecol. Eng. 2016, 87, 80–90. [Google Scholar] [CrossRef]
- Scyphers, S.B.; Powers, S.P.; Heck, K.L. Ecological value of submerged breakwaters for habitat enhancement on a residential scale. Environ. Manag. 2014, 55, 383–391. [Google Scholar] [CrossRef]
- Ridge, J.T.; Rodriguez, A.B.; Fodrie, F.J.; Lindquist, N.L.; Brodeur, M.C.; Coleman, S.E.; Grabowski, J.H.; Theuerkauf, E.J. Maximizing oyster-reef growth supports green infrastructure with accelerating sea-level rise. Sci. Rep. 2015, 5, 14785. [Google Scholar] [CrossRef] [Green Version]
- French, P. Coastal Defenses, 1st ed.; Routledge: London, UK, 2001; pp. 51–301. [Google Scholar]
- Lee, W.-D.; Yoo, Y.-J.; Jeong, Y.-M.; Hur, D.-S. Experimental and Numerical Analysis on Hydraulic Characteristics of Coastal Aquifers with Seawall. Water 2019, 11, 2343. [Google Scholar] [CrossRef] [Green Version]
- Contestabile, P.; Crispino, G.; Russo, S.; Gisonni, C.; Cascetta, F.; Vicinanza, D. Crown Wall Modifications as Response to Wave Overtopping under a Future Sea Level Scenario: An Experimental Parametric Study for an Innovative Composite Seawall. Appl. Sci. 2020, 10, 2227. [Google Scholar] [CrossRef] [Green Version]
- Argente, G.; Gómez-Martín, M.E.; Medina, J.R. Hydraulic Stability of the Armor Layer of Overtopped Breakwaters. J. Mar. Sci. Eng. 2018, 6, 143. [Google Scholar] [CrossRef] [Green Version]
- Iuppa, C.; Contestabile, P.; Cavallaro, L.; Foti, E.; Vicinanza, D. Hydraulic Performance of an Innovative Breakwater for Overtopping Wave Energy Conversion. Sustainability 2016, 8, 1226. [Google Scholar] [CrossRef] [Green Version]
- Gomes, A.; Pinho, J.L.S.; Valente, T.; Antunes do Carmo, J.S.; Hegde, V.A. Performance Assessment of a Semi-Circular Breakwater through CFD Modelling. J. Mar. Sci. Eng. 2020, 8, 226. [Google Scholar] [CrossRef] [Green Version]
- Lee, B.W.; Seo, J.; Park, W.-S.; Won, D. A Hydraulic Experimental Study of a Movable Barrier on a Revetment to Block Wave Overtopping. Appl. Sci. 2020, 10, 89. [Google Scholar] [CrossRef] [Green Version]
- Chybowski, L.; Grządziel, Z.; Gawdzińska, K. Simulation and Experimental Studies of a Multi-Tubular Floating Sea Wave Damper. Energies 2018, 11, 1012. [Google Scholar] [CrossRef] [Green Version]
- Nishold, S.S.P.; Sundaravadivelu, R.; Saha, N. Physical model study on geo-tube with gabion boxes for the application of coastal protection. Arab. J. Geosci. 2019, 12, 164. [Google Scholar] [CrossRef]
- Cherkasova, L. Application of gabions for strengthening marine coastal slopes. J. Phys. Conf. Ser. 2019, 1425, 012206. [Google Scholar] [CrossRef] [Green Version]
- Chen, Y.; Tang, X.; Zhan, L. Advances in Environmental Geotechnics, 1st ed.; Springer: Berlin, Germany, 2009; pp. 805–920. [Google Scholar]
- Pilarczyk, L. Dikes and Revetments, 1st ed.; A.A. Balkema: Rotterdam, The Netherlands, 1998. [Google Scholar]
- Kerpen, N.B.; Schoonees, T.; Schlurmann, T. Wave Overtopping of Stepped Revetments. Water 2019, 11, 1035. [Google Scholar] [CrossRef] [Green Version]
- Kerpen, N.B.; Schoonees, T.; Schlurmann, T. Wave Impact Pressures on Stepped Revetments. J. Mar. Sci. Eng. 2018, 6, 156. [Google Scholar] [CrossRef] [Green Version]
- Wu, Y.; Dai, H.; Wu, J. Comparative Study on Influences of Bank Slope Ecological Revetments on Water Quality Purification Pretreating Low-Polluted Waters. Water 2017, 9, 636. [Google Scholar] [CrossRef] [Green Version]
- Ware, D.; Buckwell, A.; Tomlinson, R.; Foxwell-Norton, K.; Lazarow, N. Using Historical Responses to Shoreline Change on Australia’s Gold Coast to Estimate Costs of Coastal Adaptation to Sea Level Rise. J. Mar. Sci. Eng. 2020, 8, 380. [Google Scholar] [CrossRef]
- Hamza, W.; Tomasicchio, G.R.; Ligorio, F.; Lusito, L.; Francone, A. A Nourishment Performance Index for Beach Erosion/Accretion at Saadiyat Island in Abu Dhabi. J. Mar. Sci. Eng. 2019, 7, 173. [Google Scholar] [CrossRef] [Green Version]
- Cox, R.; Jahn, K.; Watkins, O.; Cox, P. Extraordinary boulder transport by storm waves (west of Ireland, winter 2013–2014), and criteria for analyzing coastal boulder deposit. Earth-Sci. Rev. 2018, 177, 623–636. [Google Scholar] [CrossRef]
- Ávila, S.P.; Johnson, M.E.; Rebelo, A.C.; Baptista, L.; Melo, C.S. Comparison of Modern and Pleistocene (MIS 5e) Coastal Boulder Deposits from Santa Maria Island (Azores Archipelago, NE Atlantic Ocean). J. Mar. Sci. Eng. 2020, 8, 386. [Google Scholar] [CrossRef]
- Othman, M. Value of mangroves in coastal protection. Hydrobiologia 1994, 285, 277–282. [Google Scholar] [CrossRef]
- Verhagen, H.J. Financial Benefits of Mangroves for Surge Prone High-Value Areas. Water 2019, 11, 2374. [Google Scholar] [CrossRef] [Green Version]
- Ma, C.; Ai, B.; Zhao, J.; Xu, X.; Huang, W. Change Detection of Mangrove Forests in Coastal Guangdong during the Past Three Decades Based on Remote Sensing Data. Remote Sens. 2019, 11, 921. [Google Scholar] [CrossRef] [Green Version]
- Gilman, E.; Ellison, J.; Duke, N.; Field, C. Threats to mangroves from climate change and adaptation options. A review. Aquat. Bot. 2008, 89, 237–250. [Google Scholar] [CrossRef]
- Angeletti, L.; Taviani, M. Offshore Neopycnodonte Oyster Reefs in the Mediterranean Sea. Diversity 2020, 12, 92. [Google Scholar] [CrossRef] [Green Version]
- Zhao, M.; Zhang, H.; Zhong, Y.; Jiang, D.; Liu, G.; Yan, H.; Zhang, H.; Guo, P.; Li, C.; Yang, H.; et al. The Status of Coral Reefs and Its Importance for Coastal Protection: A Case Study of Northeastern Hainan Island, South China Sea. Sustainability 2019, 11, 4354. [Google Scholar] [CrossRef] [Green Version]
- Christianen, M.; van Belzen, J.; Herman, P.; van Katwijk, M.; Lamers, L.; van Leent, P.; Bouma, T. Low-canopy seagrass beds still provide important coastal protection. PLoS ONE 2013, 8, e62413. [Google Scholar] [CrossRef] [PubMed] [Green Version]
- Ondiviela, B.; Losada, I.; Lara, J.; Maza, M.; Galvan, C.; Bouma, T.; van Belzen, J. The role of seagrasses in coastal protection in a changing climate. Coast. Eng. 2014, 87, 158–168. [Google Scholar] [CrossRef]
- Saponieri, A.; Valentini, N.; Di Risio, M.; Pasquali, D.; Damiani, L. Laboratory Investigation on the Evolution of a Sandy Beach Nourishment Protected by a Mixed Soft–Hard System. Water 2018, 10, 1171. [Google Scholar] [CrossRef] [Green Version]
- Herbert, D.; Astrom, E.; Bersoza, A.C.; Batzer, A.; McGovern, P.; Angelini, C.; Wasman, S.; Dix, N.; Sheremet, A. Mitigating Erosional Effects Induced by Boat Wakes with Living Shorelines. Sustainability 2018, 10, 436. [Google Scholar] [CrossRef] [Green Version]
- Muñoz-Perez, J.J.; Gallop, S.L.; Moreno, L.J. A Comparison of Beach Nourishment Methodology and Performance at Two Fringing Reef Beaches in Waikiki (Hawaii, USA) and Cadiz (SW Spain). J. Mar. Sci. Eng. 2020, 8, 266. [Google Scholar] [CrossRef] [Green Version]
- Bitan, M.; Zviely, D. Sand Beach Nourishment: Experience from the Mediterranean Coast of Israel. J. Mar. Sci. Eng. 2020, 8, 273. [Google Scholar] [CrossRef] [Green Version]
- Escudero, M.; Mendoza, E.; Silva, R. Micro Sand Engine Beach Stabilization Strategy at Puerto Morelos, Mexico. J. Mar. Sci. Eng. 2020, 8, 247. [Google Scholar] [CrossRef] [Green Version]
- French, P. Managed retreat: A natural analogue from the Medway estuary, UK. Ocean Coast. Manag. 1999, 42, 49–62. [Google Scholar] [CrossRef]
- Lawrence, J.; Bell, R.; Stroombergen, A. A Hybrid Process to Address Uncertainty and Changing Climate Risk in Coastal Areas Using Dynamic Adaptive Pathways Planning, Multi-Criteria Decision Analysis & Real Options Analysis: A New Zealand Application. Sustainability 2019, 11, 406. [Google Scholar]
- Hanna, C.; White, I.; Glavovic, B. The Uncertainty Contagion: Revealing the Interrelated, Cascading Uncertainties of Managed Retreat. Sustainability 2020, 12, 736. [Google Scholar] [CrossRef] [Green Version]
- Allen, J.R.L. Morphodynamics of holocene salt marshes: A review sketch from the atlantic and Southern North Sea coasts of Europe. Quat. Sci. Rev. 2000, 19, 1155–1231. [Google Scholar] [CrossRef]
- Ahmadian, A. Numerical Models for Submerged Breakwaters, 1st ed.; Butterworth-Heinemann: Oxford, UK, 2016. [Google Scholar]
- Ravindar, R.; Sriram, V.; Schimmels, S.; Stagonas, D. Characterization of breaking wave impact on vertical wall with recurve. ISH J. Hydraul. Eng. 2017, 25, 153–161. [Google Scholar] [CrossRef]
- Castellino, M.; Lara, J.L.; Romano, A.; Losada, I.J.; De Girolamo, P. Wave loading for recurved parapet walls in non-breaking wave conditions: Analysis of the induced impulsive forces. Coast. Eng. Proc. 2018, 1, 34. [Google Scholar] [CrossRef] [Green Version]
- Castellino, M.; Sammarco, P.; Romano, A.; Martinelli, L.; Ruol, P.; Franco, L.; De Girolamo, P. Large impulsive forces on recurved parapets under non-breaking waves. A numerical study. Coast. Eng. 2018, 136, 1–15. [Google Scholar] [CrossRef]
- Cooper, J.; Mckenna, J. Working with natural processes: The challenge for coastal protection strategies. Geogr. J. 2008, 174, 315–331. [Google Scholar] [CrossRef]
- Rubinato, M.; Nichols, A.; Peng, Y.; Zhang, J.; Lashford, C.; Cai, Y.; Lin, P.; Tait, S. Urban and river flooding: Comparison of flood risk management approaches in the UK and China and an assessment of future knowledge needs. Water Sci. Eng. 2019, 12, 274–283. [Google Scholar] [CrossRef]
- Rubinato, M.; Luo, M.; Zheng, X.; Shao, S. Advances in modelling and prediction on the impact of human activities and extreme events on environments. Water 2020, 12, 1768. [Google Scholar] [CrossRef]
- Pilkey, O.H.; Davis, T.W. An analysis of coastal recession models, North Carolina coast. In Sea-Level Fluctuation and Coastal Evolution; Nummendal, D., Pilkey, O.H., Howard, J.D., Eds.; SEPM (Society for Sedimentary Geology); Special Publications: Tulsa, OK, USA, 1987; Volume 41, pp. 59–68. [Google Scholar]
- Martinez-Grana, A.M.; Boski, T.; Goy, J.L.; Zazo, C.; Dabrio, C.J. Coastal-flood risk management in central Algarve: Vulnerability and flood risk indices (South Portugal). Ecol. Indic. 2016, 71, 302–316. [Google Scholar] [CrossRef] [Green Version]
- Nichols, A.; Rubinato, M.; Cho, Y.H.; Wu, J. Optimal use of titanium dioxide colourant to enable water surfaces to be measured by Kinect Sensors. Sensors 2020, 20, 3507. [Google Scholar] [CrossRef]
- Rojas, S.; Rubinato, M.; Nichols, A.; Shucksmith, J. Cost effective measuring technique to simultaneously quantify 2D velocity fields and depth-averaged solute concentrations in shallow water flows. J. Flow Meas. Instrum. 2018, 64, 213–223. [Google Scholar] [CrossRef]
- Martins, R.; Rubinato, M.; Kesserwani, G.; Leandro, J.; Djordjevic, S.; Shucksmith, J. On the characteristics of velocity fields on the vicinity of manhole inlet grates during flood events. Water Resour. Res. 2018, 54, 6408–6422. [Google Scholar] [CrossRef]
- Rubinato, M.; Seungsoo, L.; Martins, R.; Shucksmith, J. Surface to sewer flow exchange through circular inlets during urban flood conditions. J. Hydroinform. 2018, 20, 564–576. [Google Scholar] [CrossRef] [Green Version]
- Phantuwongraj, S.; Choowong, M.; Nanayama, F.; Hisada, K.I.; Charusiri, P.; Chutakositkanon, V.; Pailoplee, S.; Chabangbon, A. Coastal geomorphic conditions and styles of storm surge washover deposit from Southern Thailand. Geomorphology 2013, 192, 43–58. [Google Scholar] [CrossRef]
- Claudino-Sales, V.; Wang, P.; Horwitz, M.H. Factors controlling the survival of coastal dunes during multiple hurricane impacts in 2004 and 2005: Santa Rosa barrier island, Florida. Geomorphology 2008, 95, 295–315. [Google Scholar] [CrossRef]
- Wang, P.; Horwitz, M.H. Erosional and depositional characteristics of regional overwash deposits caused by multiple hurricanes. Sedimentology 2007, 54, 545–564. [Google Scholar] [CrossRef]
- Naylor, L.A.; Spencer, T.; Lane, S.N.; Darby, S.E.; Magiligan, F.J.; Macklin, M.G.; Moller, I. Stormy geomorphology: Geomorphic contributions in an age of climate extremes. Earth Surf. Process. Landf. 2017, 42, 166–190. [Google Scholar] [CrossRef]
- Bernatchez, P.; Fraser, C.; Lefaivre, D.; Dugas, S. Integrating anthropogenic factors, geomorphological indicators and local knowledge in the analysis of coastal flooding and erosion hazards. Ocean Coast. Manag. 2011, 54, 621–632. [Google Scholar] [CrossRef]
- Wu, S.; Rubinato, M.; Gui, Q. SPH Simulation of interior and exterior flow field characteristics of porous media. Water 2020, 12, 918. [Google Scholar] [CrossRef] [Green Version]
- Zhang, Y.; Rubinato, M.; Kazemi, E.; Pu, J.H.; Huang, Y.; Lin, P. Numerical and experimental analysis of shallow turbulent flow over complex roughness beds. Int. J. Comput. Fluid Dyn. 2019, 33, 202–221. [Google Scholar] [CrossRef]
- Shu, A.; Duan, G.; Rubinato, M.; Tian, L.; Wang, M.; Wang, S. An Experimental Study on Mechanisms for Sediment Transformation Due to Riverbank Collapse. Water 2019, 11, 529. [Google Scholar] [CrossRef] [Green Version]
- Xie, L.; Liu, H.; Peng, M. The effect of wave-current interactions on the storm surge and inundation in Charleston Harbor during Hurricane Hugo, 1989. Ocean Model. 2008, 20, 252–269. [Google Scholar] [CrossRef]
- Donelan, W.A.; Dobson, F.W.; Smith, S.D. On the dependence of sea surface roughness on wave development. J. Phys. Oceanogragr. 1993, 23, 2143–2149. [Google Scholar] [CrossRef] [Green Version]
- Mellor, G.L. The three-dimensional current and surface wave equations. J. Phys. Oceanogragr. 2003, 33, 1978–1989. [Google Scholar] [CrossRef]
- Komen, G.J.; Cavaleri, L.; Donelan, M.; Hasselmann, K.; Hasselmann, S.; Jansenn, P.A.E.M. Dynamics and Modelling of Ocean Waves; Cambridge University Press: New York, NY, USA, 1994; p. 532. [Google Scholar]
- Lin, R.Q.; Huang, N.E. The Goddart coastal wave model, 1, Numerical method. J. Phys. Oceanogragr. 1996, 26, 833–847. [Google Scholar] [CrossRef] [Green Version]
- Jokiel, P.L. Impact of storm waves and storm floods on Hawaiian reefs. In Proceedings of the 10th International Coral Reef Symposium, Okinawa, Japan, 28 June–2 July 2006; pp. 282–284. [Google Scholar]
- Carter, R.W.G.; Lowry, P.; Stone, G.W. Sub-tidal ebb-shoal control of shoreline erosion via wave refraction, Magilligan Foreland, Northern Ireland. Mar. Geol. 1982, 48, M17–M25. [Google Scholar] [CrossRef]
- Lyddon, C.E.; Brown, J.M.; Leonardi, N.; Saulter, A.; Plater, A.J. Quantification of the uncertainty in coastal storm hazard predictions due to wave-current interaction and wind forcing. Geophys. Res. Lett. 2019, 46. [Google Scholar] [CrossRef] [Green Version]
Figure 1.
Wave flume apparatus. Example of wave generation along the flume (left), wave generator at the upstream section of the flume (centre), and dissipation beach at the downstream section of the flume (right).
Figure 1.
Wave flume apparatus. Example of wave generation along the flume (left), wave generator at the upstream section of the flume (centre), and dissipation beach at the downstream section of the flume (right).

Figure 2.
Sustainable coastal protections. Configurations A–C identified in this study.

Figure 3.
Overall geometrical configurations.

Figure 4.
Overtopping collection device. The red box highlights the testing platform.

Figure 5.
Artificial sea grass reproduced.

Figure 6.
Sine wave hydraulic conditions; relationship between wave crest amplitude A and overtopping volume Q (averaged results); no slope angle adopted within the experimental facility.
Figure 6.
Sine wave hydraulic conditions; relationship between wave crest amplitude A and overtopping volume Q (averaged results); no slope angle adopted within the experimental facility.

Figure 7.
Sine wave hydraulic conditions; relationship between wave crest amplitude A and overtopping volume Q (averaged results); slope angle adopted within the experimental facility.
Figure 7.
Sine wave hydraulic conditions; relationship between wave crest amplitude A and overtopping volume Q (averaged results); slope angle adopted within the experimental facility.

Figure 8.
Sine wave hydraulic conditions; overtopping measure vs. amplitude; no slope angle adopted within the experimental facility.
Figure 8.
Sine wave hydraulic conditions; overtopping measure vs. amplitude; no slope angle adopted within the experimental facility.

Figure 9.
Sine wave hydraulic conditions; overtopping measure vs. amplitude; slope angle adopted within the experimental facility.
Figure 9.
Sine wave hydraulic conditions; overtopping measure vs. amplitude; slope angle adopted within the experimental facility.

Figure 10.
JONSWAP hydraulic conditions, overtopping measure; no slope angle adopted within the experimental facility.
Figure 10.
JONSWAP hydraulic conditions, overtopping measure; no slope angle adopted within the experimental facility.

Figure 11.
JONSWAP hydraulic conditions; overtopping measure; slope angle adopted within the experimental facility.
Figure 11.
JONSWAP hydraulic conditions; overtopping measure; slope angle adopted within the experimental facility.

Figure 12.
Performance of Configuration A with and without slope angle for JONSWAP hydraulic conditions.
Figure 12.
Performance of Configuration A with and without slope angle for JONSWAP hydraulic conditions.

Figure 13.
Performance of Configuration B with and without slope angle for JONSWAP hydraulic conditions.
Figure 13.
Performance of Configuration B with and without slope angle for JONSWAP hydraulic conditions.

Figure 14.
Performance of Configuration C with and without slope angle for JONSWAP hydraulic conditions.
Figure 14.
Performance of Configuration C with and without slope angle for JONSWAP hydraulic conditions.

Figure 15.
Resultant wave shapes for Configurations A–C.


Table 1.
A review of existing coastal protection measures with advantages and disadvantages identified for each solution.
Table 1.
A review of existing coastal protection measures with advantages and disadvantages identified for each solution.
| Engineering Method | Hard (H) or Soft (S) | Brief Description | Advantages | Disadvantages |
|---|---|---|---|---|
| Sea wall [52,53,54] | H | Wall built by the coastline (usually built along the front of cliffs to protect settlements and often curved to reflect wave energy). |
|
|
| Breakwater [55,56,57] | H | When waves hit the breakwaters, the power of the wave is dissipated on the breakwater structure so the erosion impact on the cliffs is much less. |
|
|
| Tetrapods [58,59] | H | Multi angular concrete shaped that are preformed and tipped onto the beach to form interlocking components. |
|
|
| Gabions [60,61,62] | H | Wire cage with pebbles stones and rocks inside. Protect the coastline by reducing the energy of the wave before it directly hits the cliffs |
|
|
| Revetments [62,63,64,65,66] | H | Sloping structures on banks or cliffs built in such a way to absorb some of the energy from the incoming water. |
|
|
| Groynes [52,67,68] | H | Wooden barrier built at right angles to the beach to retain material and prevent longshore drift. |
|
|
| Boulder Barrier [69,70] | H | Large boulders piled up on the beach. |
|
|
| Mangrove Planting [71,72,73,74] | S | Mangroves planted along coastline to dissipate wave energy, trap sediment, and control water levels |
|
|
| Offshore Reefs [75,76] | S | Artificial sand/gravel offshore deposits designed to intercept wave action and dissipate energy. |
|
|
| Seagrasses [77,78] | S | Submerged aquatic vegetation ecosystem with thick stems. |
|
|
| Sills [79,80] | S | Shingle or sand beach that is often submerged. |
|
|
| Beach nourishment [52,81,82,83] | S | Replacing beach or cliff material that has been removed by erosion. |
|
|
| Managed retreat [52,84,85,86] | S | Allocated areas of the coast that can erode and flood naturally (low value areas) |
|
|
| Beach Dewatering [75] | S | The artificial lowering of the water table within beaches by a system of drains and pumps |
|
|
Table 2.
JONSWAP simulation parameters.
| Gamma (γ) | Height of Waves | Amplitude | Period of Waves (Tp) | Max Frequency | Min Frequency |
|---|---|---|---|---|---|
| 6.6 | 0.6 m | 0.3 m | 0.9 s | 2 Hz | 0.2 Hz |
Table 3.
Experimental testing conditions.
| Analysis | Hydraulic Conditions | Structural Configuration | Testing Platform Used |
|---|---|---|---|
| Frequency Vs Overtopping | Sine Spectrum | A | Yes |
| Frequency Vs Overtopping | Sine Spectrum | B | Yes |
| Frequency Vs Overtopping | Sine Spectrum | C | Yes |
| Frequency Vs Overtopping | Sine Spectrum | A | No |
| Frequency Vs Overtopping | Sine Spectrum | B | No |
| Frequency Vs Overtopping | Sine Spectrum | C | No |
| Amplitude Vs Overtopping | Sine Spectrum | A | Yes |
| Amplitude Vs Overtopping | Sine Spectrum | B | Yes |
| Amplitude Vs Overtopping | Sine Spectrum | C | Yes |
| Amplitude Vs Overtopping | Sine Spectrum | A | No |
| Amplitude Vs Overtopping | Sine Spectrum | B | No |
| Amplitude Vs Overtopping | Sine Spectrum | C | No |
| Overtopping Vs Time | JONSWAP Spectrum | A | Yes |
| Overtopping Vs Time | JONSWAP Spectrum | B | Yes |
| Overtopping Vs Time | JONSWAP Spectrum | C | Yes |
| Overtopping Vs Time | JONSWAP Spectrum | A | No |
| Overtopping Vs Time | JONSWAP Spectrum | B | No |
| Overtopping Vs Time | JONSWAP Spectrum | C | No |
Table 4.
Experimental testing parameters collected for sine wave (F = frequency) with and without slope angle.
Table 4.
Experimental testing parameters collected for sine wave (F = frequency) with and without slope angle.
| F | Conf. A | Conf. B | Conf. C | Conf. A | Conf. B | Conf. C |
|---|---|---|---|---|---|---|
| (Hz) | Overtopping Volume (L) | Overtopping Volume (L) | Overtopping Volume (L) | Overtopping Volume (L) | Overtopping Volume (L) | Overtopping Volume (L) |
| No slope angle | With slope angle | |||||
| 0.2 | 0 | 0 | 0 | 0 | 0 | 0 |
| 0.2 | 0 | 0 | 0 | 0 | 0 | 0 |
| 0.2 | 0 | 0 | 0 | 0 | 0 | 0 |
| 0.25 | 0.6 | 0.6 | 0.36 | 0.6 | 1.2 | 0.24 |
| 0.25 | 0.6 | 1.2 | 0.24 | 0.96 | 1.44 | 0.6 |
| 0.25 | 0.96 | 0.84 | 0.6 | 0.72 | 0.96 | 0.36 |
| 0.3 | 3 | 3 | 1.8 | 3 | 2.4 | 0.6 |
| 0.3 | 2.4 | 3.6 | 1.2 | 3.6 | 3 | 1.2 |
| 0.3 | 2.64 | 3.12 | 2.4 | 3.84 | 2.64 | 1.44 |
| 0.35 | 0.6 | 1.2 | 0.6 | 1.2 | 1.8 | 0.6 |
| 0.35 | 1.2 | 1.56 | 1.2 | 1.44 | 2.4 | 1.2 |
| 0.35 | 0.96 | 1.2 | 0.84 | 1.8 | 2.04 | 1.2 |
| 0.4 | 1.2 | 3.6 | 1.2 | 1.2 | 1.8 | 0.24 |
| 0.4 | 1.2 | 4.2 | 1.8 | 1.8 | 2.4 | 0.6 |
| 0.4 | 1.8 | 3 | 1.44 | 1.2 | 1.8 | 0.36 |
| 0.45 | 1.2 | 3.6 | 1.2 | 2.4 | 2.4 | 0.24 |
| 0.45 | 1.2 | 3 | 1.44 | 1.8 | 1.8 | 0.36 |
| 0.45 | 1.44 | 3.36 | 1.68 | 2.16 | 2.04 | 0.24 |
| 0.5 | 0.6 | 2.4 | 1.2 | 1.8 | 1.8 | 0.36 |
| 0.5 | 1.2 | 3 | 1.44 | 1.56 | 2.4 | 0.24 |
| 0.5 | 0.72 | 2.64 | 1.2 | 2.04 | 2.4 | 0.6 |
Table 5.
Experimental testing parameters collected for sine wave (A = amplitude) with and without slope angle.
Table 5.
Experimental testing parameters collected for sine wave (A = amplitude) with and without slope angle.
| A | Conf. A | Conf. B | Conf. C | Conf. A | Conf. B | Conf. C |
|---|---|---|---|---|---|---|
| (m) | Overtopping Volume (L) | Overtopping Volume (L) | Overtopping Volume (L) | Overtopping Volume (L) | Overtopping Volume (L) | Overtopping Volume (L) |
| No slope angle | With slope angle | |||||
| 0.05 | 0 | 0 | 0 | 0 | 0 | 0 |
| 0.05 | 0 | 0 | 0 | 0 | 0 | 0 |
| 0.05 | 0 | 0 | 0 | 0 | 0 | 0 |
| 0.06 | 0.6 | 1.2 | 0.36 | 0.6 | 1.2 | 0.24 |
| 0.06 | 0.84 | 1.44 | 0.36 | 0.6 | 1.56 | 0.6 |
| 0.06 | 0.6 | 0.84 | 0.6 | 0.84 | 0.96 | 0.36 |
| 0.07 | 4.2 | 2.4 | 1.2 | 3.6 | 3 | 1.2 |
| 0.07 | 4.8 | 3 | 1.44 | 4.2 | 3.24 | 1.56 |
| 0.07 | 4.2 | 2.64 | 1.2 | 4.56 | 3.6 | 1.56 |
| 0.08 | 7.2 | 3.6 | 1.8 | 7.2 | 3.6 | 1.8 |
| 0.08 | 7.8 | 3.84 | 2.4 | 6.6 | 3.84 | 2.4 |
| 0.08 | 8.4 | 4.2 | 2.4 | 7.56 | 4.2 | 1.8 |
| 0.09 | 12 | 4.2 | 3 | 12 | 4.2 | 2.4 |
| 0.09 | 12 | 4.8 | 2.4 | 10.8 | 4.8 | 3 |
| 0.09 | 12 | 4.56 | 3 | 9.6 | 4.8 | 2.88 |
Table 6.
Experimental testing parameters collected for JONSWAP waves with and without slope angle.
| Conf. A | Conf. B | Conf. C | Conf. A | Conf. B | Conf. C | |
|---|---|---|---|---|---|---|
| Time (s) | Overtopping Volume (L) | Overtopping Volume (L) | Overtopping Volume (L) | Overtopping Volume (L) | Overtopping Volume (L) | Overtopping Volume (L) |
| No slope angle | With slope angle | |||||
| 60 | 0.24 | 3.6 | 0.6 | 0.12 | 0.48 | 0.48 |
| 60 | 0.6 | 4.2 | 0.6 | 0.36 | 0.6 | 0.6 |
| 60 | 0.36 | 3.6 | 0.36 | 0.48 | 0.6 | 0.24 |
| 120 | 0.6 | 7.2 | 1.2 | 0.6 | 2.4 | 1.56 |
| 120 | 0.84 | 6.6 | 0.96 | 0.84 | 2.4 | 1.2 |
| 120 | 0.6 | 7.56 | 1.44 | 0.84 | 2.64 | 1.8 |
| 180 | 1.2 | 10.8 | 2.4 | 1.32 | 4.8 | 2.4 |
| 180 | 1.56 | 12 | 3 | 1.44 | 5.4 | 2.16 |
| 180 | 1.44 | 10.8 | 3 | 1.56 | 4.8 | 2.64 |
| 240 | 1.56 | 12 | 3.6 | 1.8 | 6 | 3.6 |
| 240 | 1.8 | / | 3.84 | 2.16 | 6.6 | 3.36 |
| 240 | 1.8 | 12 | 4.2 | 2.4 | 6.96 | 3.6 |
| 300 | 1.8 | / | 4.8 | 2.4 | 9.6 | 4.2 |
| 300 | 2.4 | / | 5.4 | 2.64 | 10.8 | 4.8 |
| 300 | 2.4 | / | 5.4 | 3 | 10.2 | 4.8 |
Table 7.
Effectiveness scoring.
| Configuration | Frequency Testing | Amplitude Testing | JONSWAP Testing | Points Total | Total | |||
|---|---|---|---|---|---|---|---|---|
| Slope Angle | No Slope Angle | Slope Angle | No Slope Angle | Slope Angle | No Slope Angle | (/) | % | |
| A | 2 | 1 | 1 | 1 | 3 | 3 | 11 | 30.56 |
| B | 1 | 2 | 2 | 2 | 1 | 1 | 9 | 25.00 |
| C | 3 | 3 | 3 | 3 | 2 | 2 | 16 | 44.44 |
© 2020 by the authors. Licensee MDPI, Basel, Switzerland. This article is an open access article distributed under the terms and conditions of the Creative Commons Attribution (CC BY) license (http://creativecommons.org/licenses/by/4.0/).
Share and Cite
MDPI and ACS Style
Rubinato, M.; Heyworth, J.; Hart, J. Protecting Coastlines from Flooding in a Changing Climate: A Preliminary Experimental Study to Investigate a Sustainable Approach. Water 2020, 12, 2471. https://doi.org/10.3390/w12092471
AMA Style
Rubinato M, Heyworth J, Hart J. Protecting Coastlines from Flooding in a Changing Climate: A Preliminary Experimental Study to Investigate a Sustainable Approach. Water. 2020; 12(9):2471. https://doi.org/10.3390/w12092471
Chicago/Turabian StyleRubinato, Matteo, Jacob Heyworth, and James Hart. 2020. "Protecting Coastlines from Flooding in a Changing Climate: A Preliminary Experimental Study to Investigate a Sustainable Approach" Water 12, no. 9: 2471. https://doi.org/10.3390/w12092471
Note that from the first issue of 2016, this journal uses article numbers instead of page numbers. See further details here.