Recommended vs. Practice: Smallholder Fertilizer Decisions in Central Myanmar
by
 ,
,
So Pyay Thar
1,* ,
,
Robert J. Farquharson
1,
Thiagarajah Ramilan
1,2,
Sam Coggins
3 and
Deli Chen
1 1
School of Agriculture and Food, University of Melbourne, Parkville Campus, Melbourne, VIC 3010, Australia
2
School of Agriculture and Environment, Massey University, Palmerston North 4474, New Zealand
3
College of Engineering and Computer Science, Australian National University, Canberra, ACT 0200, Australia
*
Author to whom correspondence should be addressed.
Agriculture 2021, 11(1), 65; https://doi.org/10.3390/agriculture11010065
Submission received: 26 December 2020
/
Revised: 7 January 2021
/
Accepted: 11 January 2021
/
Published: 14 January 2021
Abstract
:Agriculture in Myanmar has substantial development potential given the abundance of land, water, and labor resources in the country. Despite this, agricultural productivity in Myanmar is low and farm incomes are amongst the lowest in Asia. The underperformance of crops and low yield is widely reported to be due to low fertilizer use by smallholders. This study investigated the perceptions of smallholders about fertilizer use for cereal crops by considering their motives and decision making. We reported results of a 600 smallholders’ survey and tested whether the reportedly low fertilizer use by smallholders is generally true for central Myanmar. We compared the fertilizer application timing against recommended “good management practices”. Among the surveyed rice farmers, the average fertilizer applied was much higher than previously reported national average fertilizer rates while the majority of the surveyed maize farmers were found to be applying less than the national recommended rates. With respect to timing, nearly half of the surveyed smallholders were not applying nitrogen at the estimated panicle initiation stage, which is often crucial to increase yield, and the majority (82%) of smallholders were applying phosphorus throughout the growth stages, when earlier applications are desirable. Smallholders may be able to reduce the cost of labor by reducing the number of P applications and avoiding late applications.
1. Introduction
Myanmar is an agricultural country with an abundance of natural resources and substantial potential for development. The agricultural sector plays a vital role in the country’s economy, contributing 38% of the country’s GDP (Gross domestic product), accounting for 25–30% of total export earnings and employing more than 60% of the labor force [1]. Despite this, agricultural productivity in Myanmar is low and farm profits are amongst the lowest in Asia [2].
During the Green Revolution, new plant varieties plus modern agricultural technologies such as utilization of fertilizers along with policies supporting price and investments in seed technology, irrigation, roads, and extension were the main factors to boost agricultural production [3]. Fertilizer application is an important strategy in increasing crop yield [4]. It has been responsible for an average of 30 to 50 percent increase in yield in the USA and England and much higher increases in the tropics [5]. According to the World Bank [6], the use of fertilizer in crop production has increased world-wide crop yields by 40 to 60 percent. Nitrogen (N), phosphorus (P), and potassium (K) are the major elements necessary to boost agricultural plant productivity and quality [7]. N is needed for plant growth as it increases protein content and grain yield [8]. P is required during early growth stages as it supports flower production, anthesis, grain setting, strong roots and stems, and ripening of plant [7]. K affects the number of spikelet per panicle, percentage of filled grains and grain weight, and increases plant tolerance to adverse climatic conditions, lodging, insect pests, and diseases [9].
According to the 2016 World Bank database, the use of fertilizer in Myanmar is estimated at 17.9 kg/ha of arable land which is low compared to neighboring countries such as 289 kg/ha in Bangladesh, 503 kg/ha in China, 166 kg/ha in India, 162 kg/ha in Thailand and 430 kg/ha in Vietnam [10]. Other reports have documented the use of fertilizer by smallholders in Myanmar:
A household survey conducted by Stuart et al. [19] in Bago observed very low levels of N use due to uncertainty in fertilizer decisions and suggested that N application rates were one of the reasons for the rice yield gap. According to the Livelihoods and Food Security Funds (LIFT) [20], most fertilizer decisions in Myanmar are made based on observations and advice of other farmers in the village. A survey by the International Fertilizer Development Centre, IFDC [21] stated that Myanmar farmers have strong demand for fertilizer but they have very limited understanding of the correct balance between plant nutrients and maintaining soil fertility, with restricted access to affordable credit. On the other hand, there are concerns over the national data quality with very limited representative survey data [22,23]. Therefore, in this study we tested whether the reportedly low fertilizer use by smallholders is generally true for central Myanmar by comparing it with national government agricultural agency recommendations.
The rates in Table 1 show the national recommended rates provided by the Land Use Division, Department of Agriculture (DoA) [24] and Agricultural Extension Division, Ministry of Agriculture and Irrigation Myanmar (MOAI) [25]. These general recommended rates are aimed at achieving a target yield of 5.2 t/ha for rice and 4.9 t/ha for maize.
To achieve economic, social, and environmental goals, the global 4R Nutrient Stewardship Framework, developed by the fertilizer industry, has also stated that “Right Time” of fertilizer application is also important [26]. The timing of fertilizer applications can significantly influence yields and profits of rainfed and irrigated rice farms [27,28]. For example, on-farm testing of fertilizer recommendations in Senegal increased irrigated rice yields by 1 to 2.3 Ton/ha and profitability by 216 to 640 USD/ha (compared to farmer practices) [28]. Much of the observed yield and profit increase was attributed to different fertilizer timing [28]. Changing the timing of fertilizer application has environmental impacts such as pollution of water systems and emissions of potent greenhouse gases [29]. Unlike the rate of fertilizer, farmers rarely need to invest more capital to improve fertilizer timing. In this study, we compared the fertilizer application timing practices of smallholders with the recommended “good management practices”.
Several researchers have analyzed factors affecting farmer decisions on fertilizer use intensity. They found that fertilizer adoption is affected by prices, marketing, credit access, agro-climatic conditions, and farmer characteristics. Characteristics of the farmer or farm such as age, education, farming experience, and farm resources have been found to be important [30,31,32,33,34]. Social scientists have argued for considering farmer perceptions in influencing adoption behavior [35]. The uncertainty in yield responses to added fertilizer as well as the time of application remain important in farmer decision making [36]. Therefore, this study investigates the perception of smallholders towards fertilizers and considers farmer motives and decision making to apply fertilizer in terms of two dimensions, namely, quantity applied, and timing of application based on a household survey of 600 smallholders in central Myanmar. It is widely noted that policy strategies for sustainable agriculture are best promoted by understanding the perceptions of those involved in the process [37]. Understanding the perceptions of smallholders regarding utilization and management of fertilizers, experiences, and their livelihood remains crucial in designing and implementing successful interventions. Such understanding will help inform strategies aimed at enhancing productivity and profitability of smallholders in Myanmar. The results from this study are valuable in clarifying how fertilizer management is being conducted by smallholders. Moreover, this is the first substantive study to compare and clarify how fertilizer management is being conducted by Myanmar smallholders and provides a sound basis for further research and development and agricultural policy considerations in Myanmar.
2. Methods
A household survey was conducted during May to July 2018 to collect data on fertilizer management by smallholder farmers in central Myanmar. In this study, the term “smallholders” is used for farmers who not only possess relatively small plots of land but are generally less well-resourced than commercial-scale farmers, practice farming as a main livelihood activity, depend on family labor and/or may hire workers, and are often vulnerable in the supply chain [38]. Myanmar’s agricultural sector largely comprises smallholder farms between one and five hectares [18].
2.1. Study Area
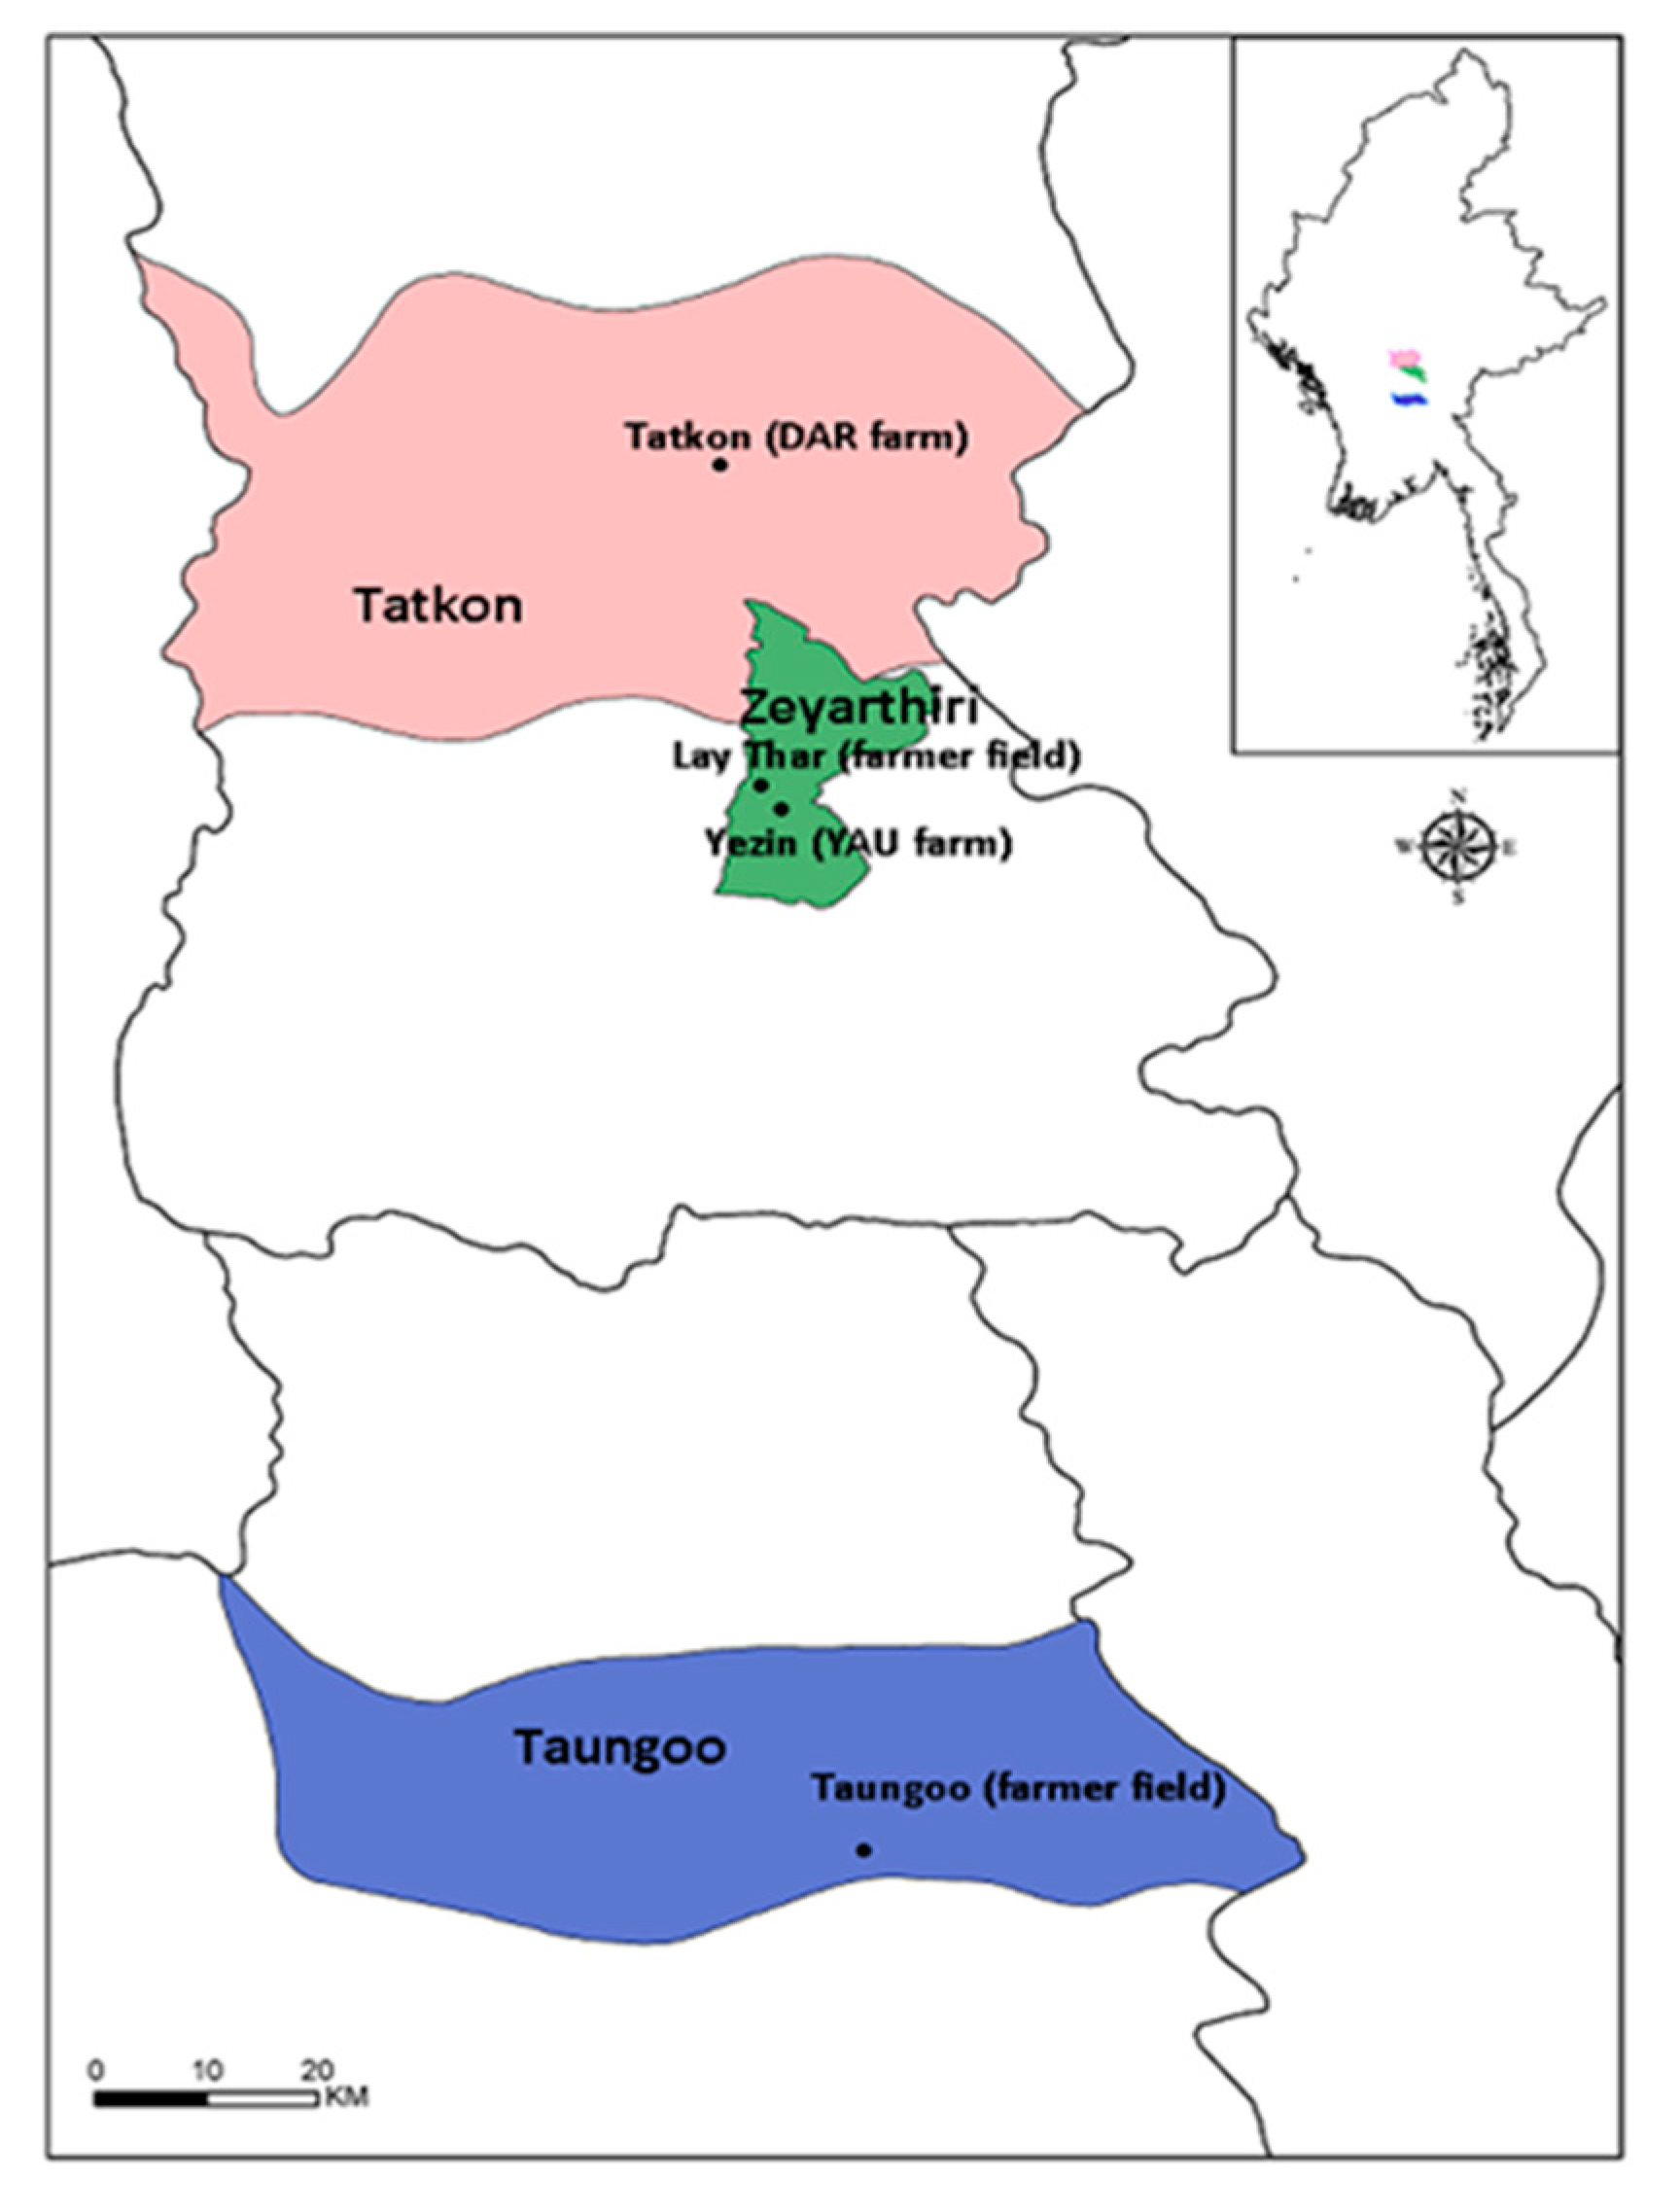
The study area is based on the field trial sites of a project [39], studying soil and crop fertility management for cereal crops in central Myanmar. The average farm size of smallholders in central Myanmar is small with more than half of the farmers (54%) owning less than five hectares and 83% less than 10 hectares [40]. Field trial sites were established in three townships; Tatkon (1 site), Zeyarthiri (2 sites) and Taungoo (1 site) (Figure 1). This study contributes to the project and focusses on the population of smallholders in these townships surrounding the project trial sites, shown by black dots in Figure 1.
2.2. Household Survey Sampling
A multi-stage sampling technique [41] was used to select the sample and the respondent smallholders. In the first stage, grids of 1000 m × 1000 m were overlaid for each trial site. The purpose of the grid was to identify villages that would provide representative contextual settings from which to access farmer opinions and practices regarding fertilizer use. Then, within the grids, we identified village tracts, which are combinations of villages and the villages included in the selected village tracts. The villages were selected based on the number of farmers and the distance to the trial sites. Ten villages were selected from each township, providing 30 villages in total.
The total number of farmers within the grid for each township was identified with the help of the local DoA extension officers. To generate a representative sample of the farmer populations in each township, a 20:1 sample-to-item ratio [42] was used. The questionnaire contained 30 items/topics; hence, 600 respondents were randomly selected for the study [43]. In order to have equal respondents from each township, 6% of the farmers from each township were specified, comprising 258 respondents in Tatkon, 196 respondents in Zeyarthiri and 146 respondents in Taungoo.
A stratified systematic sampling technique [44] was used to randomly select the sample. Farmer population was stratified by crop type and gender. Farmers cultivating the focus cereal crops (rice and maize) were selected. The criteria for the sample farmers included those who were head of the household, were the household member who led the farm work, or were actively cultivating land either as a landowner or land tenant and were available and willing to participate. A ratio of 8:2 for male and female farmers was selected based on the gender ratio within the population in the study area.
2.3. Data Collection
A structured questionnaire was used to collect data from 600 farmers. The questionnaire included questions about socio-economic characteristics of the household, crop production information including crops grown, management practices, inputs and labor used, crop yields, marketing information and financing information such as borrowing amount, sources of credit, and interest rate. Also included were questions specific to each farmer about fertilizer management practices and decisions. The questionnaire was structured to understand how farmers make fertilizer decisions, their perception towards fertilizers, and management practices. The survey was conducted using CommCare®, a mobile application for data collection [45]. A questionnaire was initially drafted and built in the CommCare HQ and then deployed to mobile phones/tablets. Survey enumerators were used to conduct the survey with CommCare®. The draft questionnaire was pre-tested with 10 non-sampled farmers.
2.4. Analytical Methods
We compared the fertilizer practices and application rates against the national recommendation by the DoA and MOAI given in Table 2. The fertilizer timing practices were compared with generalized “good management practices”, which were synthesized from peer-reviewed and mostly on-farm research on rice fertilizer timing. The “good management practices” in Table 2 are a synthesis which is unvalidated and may not be best in individual situations.
Survey respondents with missing data for critical variables were excluded from analysis. For example, respondents who transplanted rice were excluded from analysis of “good management practices” #2 and #4 because data for seedling age at transplanting were required and unavailable for estimating time of panicle initiation [48]. We assumed all applied N and P were in the form of mineral fertilizer. Few respondents reported application of organic fertilizers, and these were typically in small quantities and areas. We also assumed all applied compound fertilizers contained 15% N and P as the nutrient composition of most compound fertilizers sold in Myanmar is N:P:K (15:15:15). Finally, we truncated the number of urea or compound fertilizer applications to the maximum of three. Very few respondents reported four applications of the same type of fertilizer.
3. Results and Discussion
Smallholders in Myanmar have used fertilizers since 1965 when they were first introduced into the country, but widespread use did not occur until 1978 when fertilizer prices were subsidized by the government [55].
3.1. Perceptions about and Factors Influencing Fertilizer Decisions
We first asked about the perceptions of smallholders in central Myanmar concerning use of fertilizer for crop growth (see Table 3). Ninety-three percent of farmers considered that fertilizer increases crop yield, and 99% agreed that fertilizer quality is important. Seventy-two percent of the surveyed farmers stated that they wanted to use more fertilizers than the rates they were applying. Farmers were asked to specify the barriers preventing them from using the desired amount and the responses can be summarized into three main factors; lack of credit, limited repayment time, and uncertainty of seasonal weather patterns. With respect to the fertilizer quality, 89% of the surveyed farmers were happy with the quality of the fertilizers which was consistent with the findings from Nyi et al. [56], who reported that most commercial fertilizers in local markets are true to label. Fertilizer decisions are made mostly (55%) by males with 33% making joint decisions (males and females together).
Farmer perceptions about fertilizer application practices are in Table 4. Most of the sample agreed or strongly agreed that basal applications and split applications are important, and that fertilizer is important for plant growth and tillering.
The factors affecting farmer fertilizer decision making are in Table 5. Among the respondents, 42% stated that decisions on the rate and time of fertilizer application are made based on their personal decision depending on their experience. When deciding the choice of fertilizer to use, farmers rely mostly on popular brands (45%). Only 9% of the smallholders stated that price is considered in deciding the type of fertilizer, because most farmers explained that they have no control over the fertilizer price and would choose to apply good quality fertilizer regardless of the price because they consider that yields can increase by 5% to 50% by using fertilizers. This finding was consistent with a study in northern China [57].
The supply of fertilizer in the surveyed areas is reported to be adequate, with smallholders having one to five fertilizer suppliers or retail shops to choose from. Most have one or two regular suppliers. Ninety-two percent of farmers can buy the required amount of fertilizer at the required time, and most (93%) were happy with their current suppliers. Some smallholders change supplier depending on the delivery waiting period, up to 10 days. Accessibility is important as smallholders prefer input suppliers located in/near the village so that it is cheaper for transportation and easier to get credit for repayment after harvest.
3.2. Fertilizer Use
Of the 600 smallholders interviewed in our study, 99% used fertilizers. Most smallholders reported that they use urea and compound fertilizers for rice and maize. Fertilizers were applied as basal and split applications. Basal applications are applied a day prior to sowing or planting, while split applications are applied after sowing/planting once the plants are established [58]. Broadcasting, in which fertilizers are spread across the surface of the crop field by hand [59], was the method used to apply fertilizer by most farmers due to lack of alternative methods.
3.2.1. Basal Fertilizer Application
When applying basal doses, compound fertilizer was mainly used with 26% applied to monsoon rice, 25% applied to summer rice, and 79% applied to maize. Urea fertilizer was not used as basal fertilizer application by smallholders in the study area.
The average basal fertilizer application rates applied by surveyed smallholders compared with the recommended rate from Agricultural Extension Division [25] are shown in Table 6.
Although 79% of the farmers cultivating maize reported that they use basal fertilizer applications, the rates that they apply were very low compared to the rates recommended by MOAI [25]. The amount of manure applied by survey farmers was also found to be lower than the recommended rates for both rice and maize crops. This is due to a decline in number of cattle associated with increased mechanization; one farmer stated “We no longer used oxen for ploughing anymore as it is more efficient to use tractors. Farmers who normally owned six oxen will now have two or none at all”.
3.2.2. Split Fertilizer Application
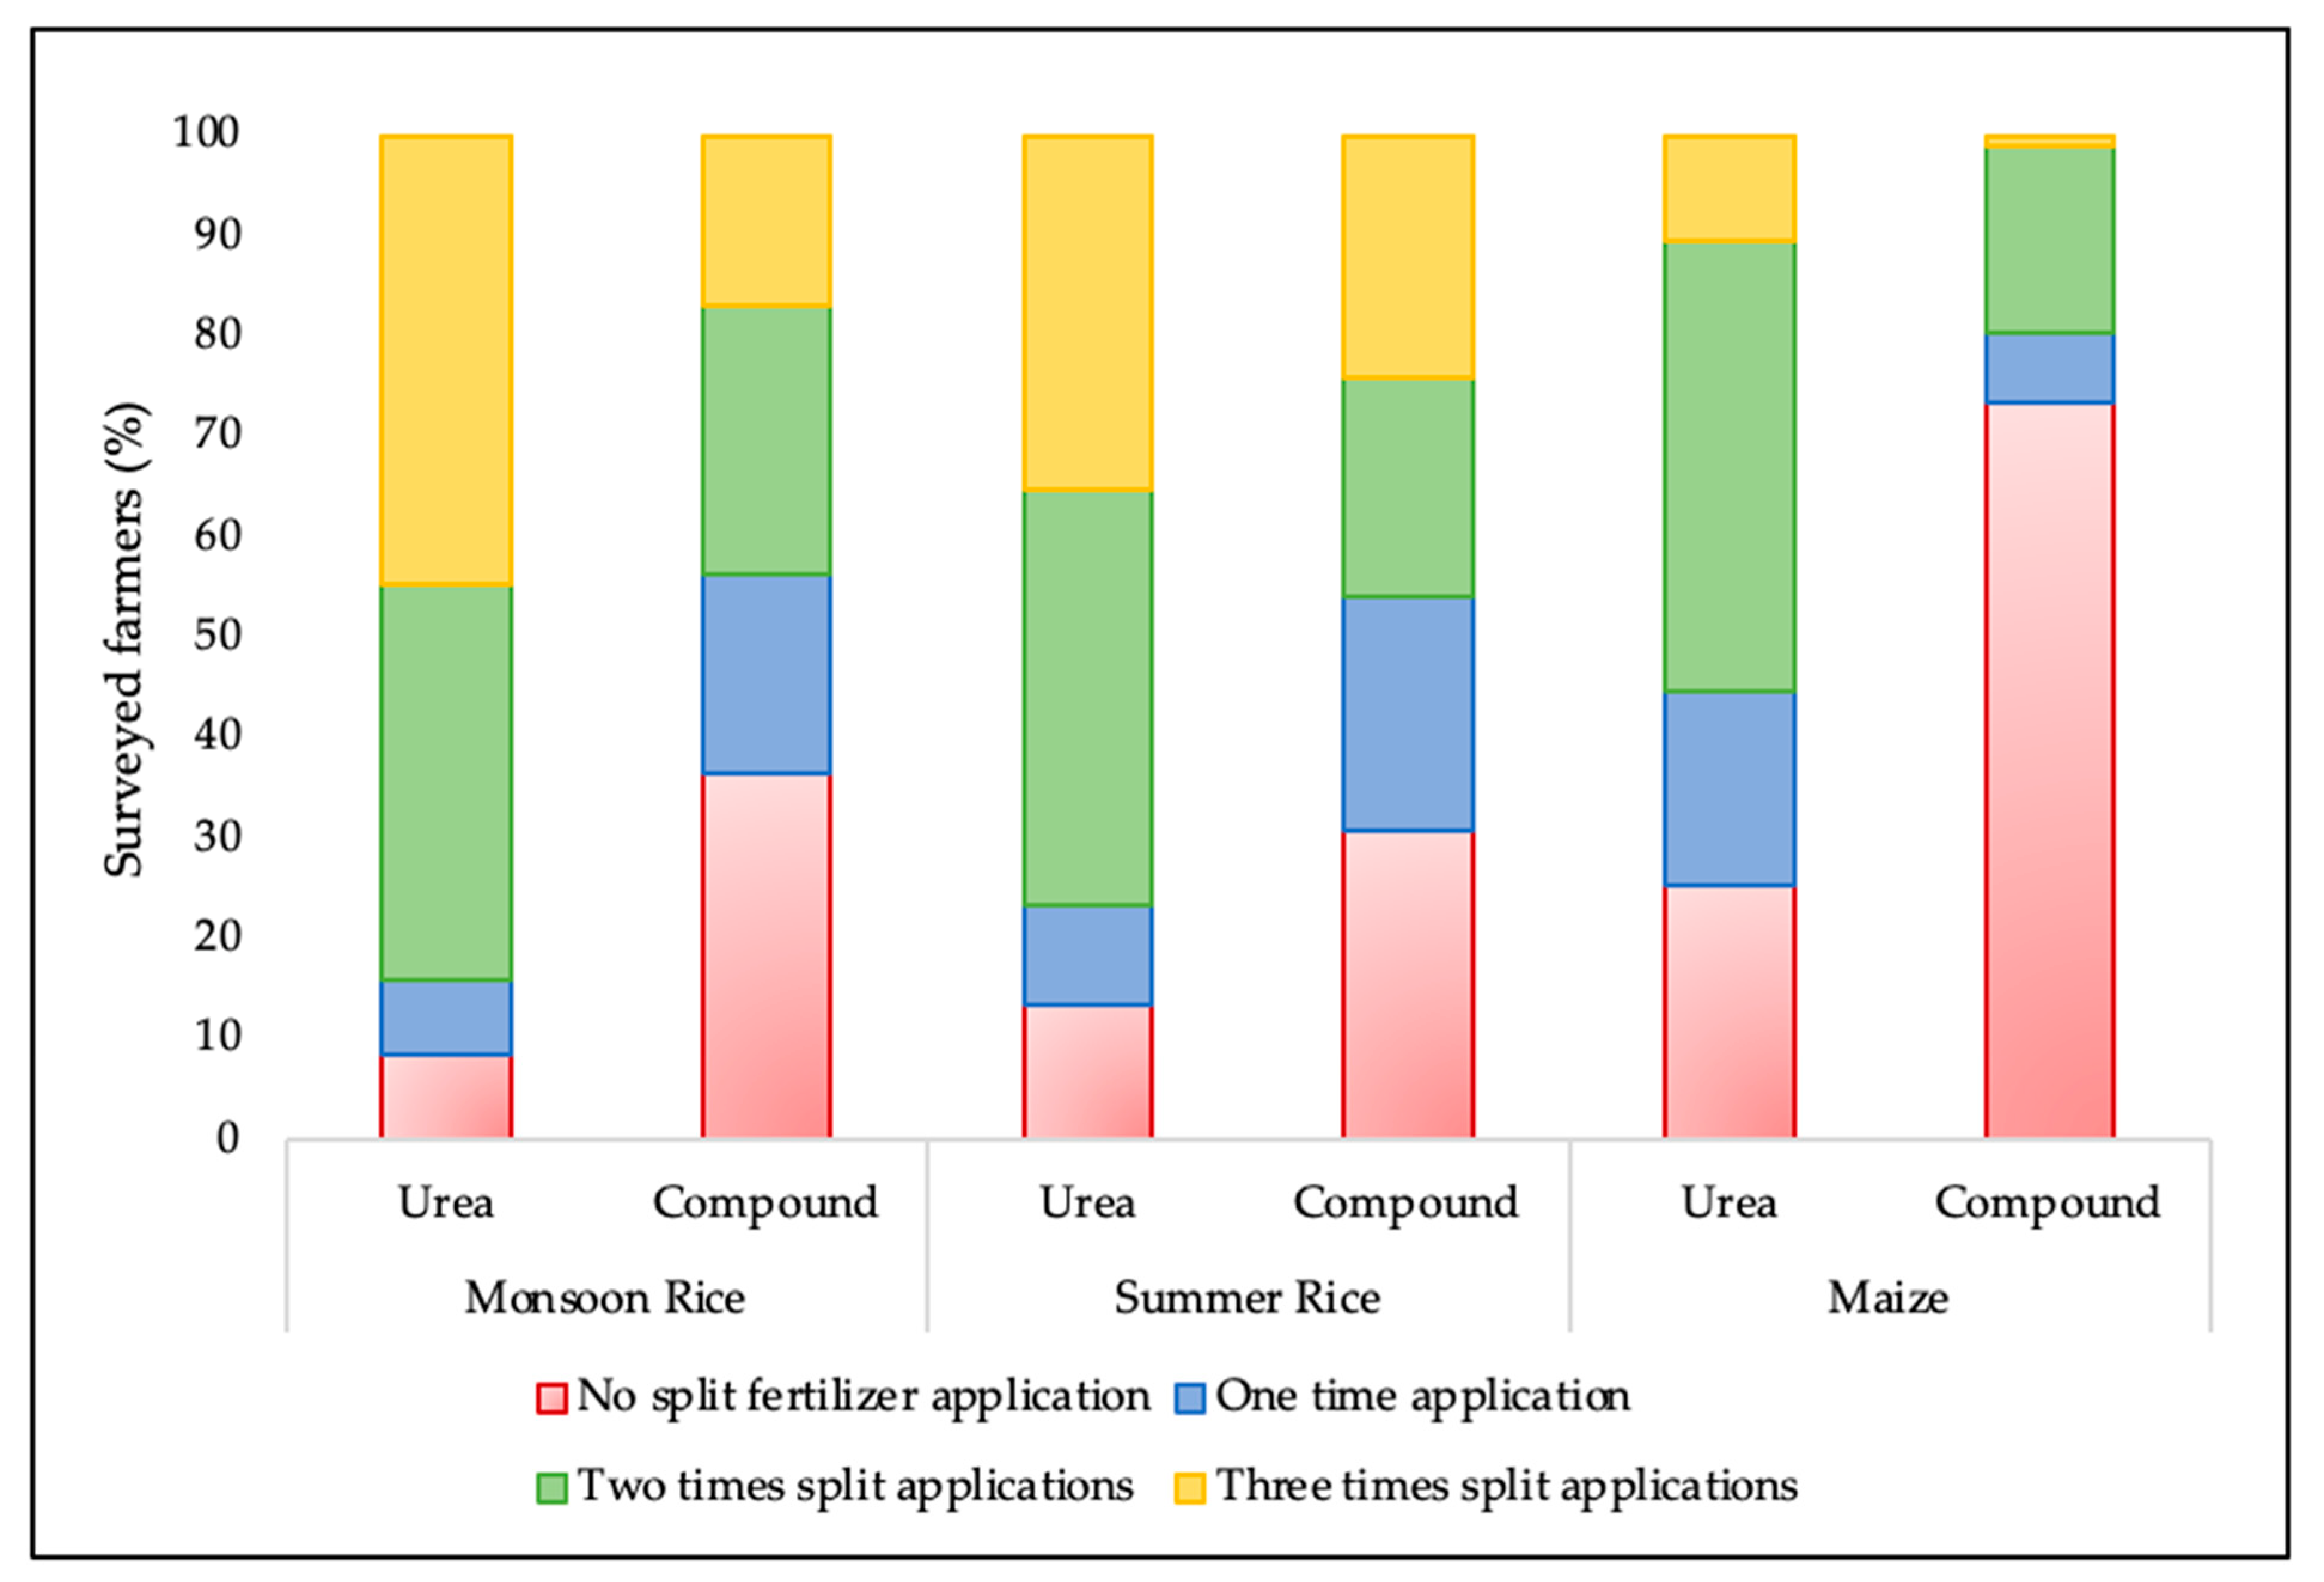
With respect to split fertilizer application, most smallholders agreed that it is best to practice split fertilizer applications rather than applying once, although the number of applications varied according to the type of crop and the type of fertilizer (Figure 2).
For monsoon rice, most farmers applied urea two or three times after sowing/planting. The use of compound fertilizer was practiced by 64% of the smallholders growing monsoon rice. For summer rice, 86% of the fertilizer used urea and 69% of the farmers used compound as split applications. For maize, most smallholders were split applying urea fertilizer while very few farmers practiced split application of compound fertilizer, as many were applying as basal application.
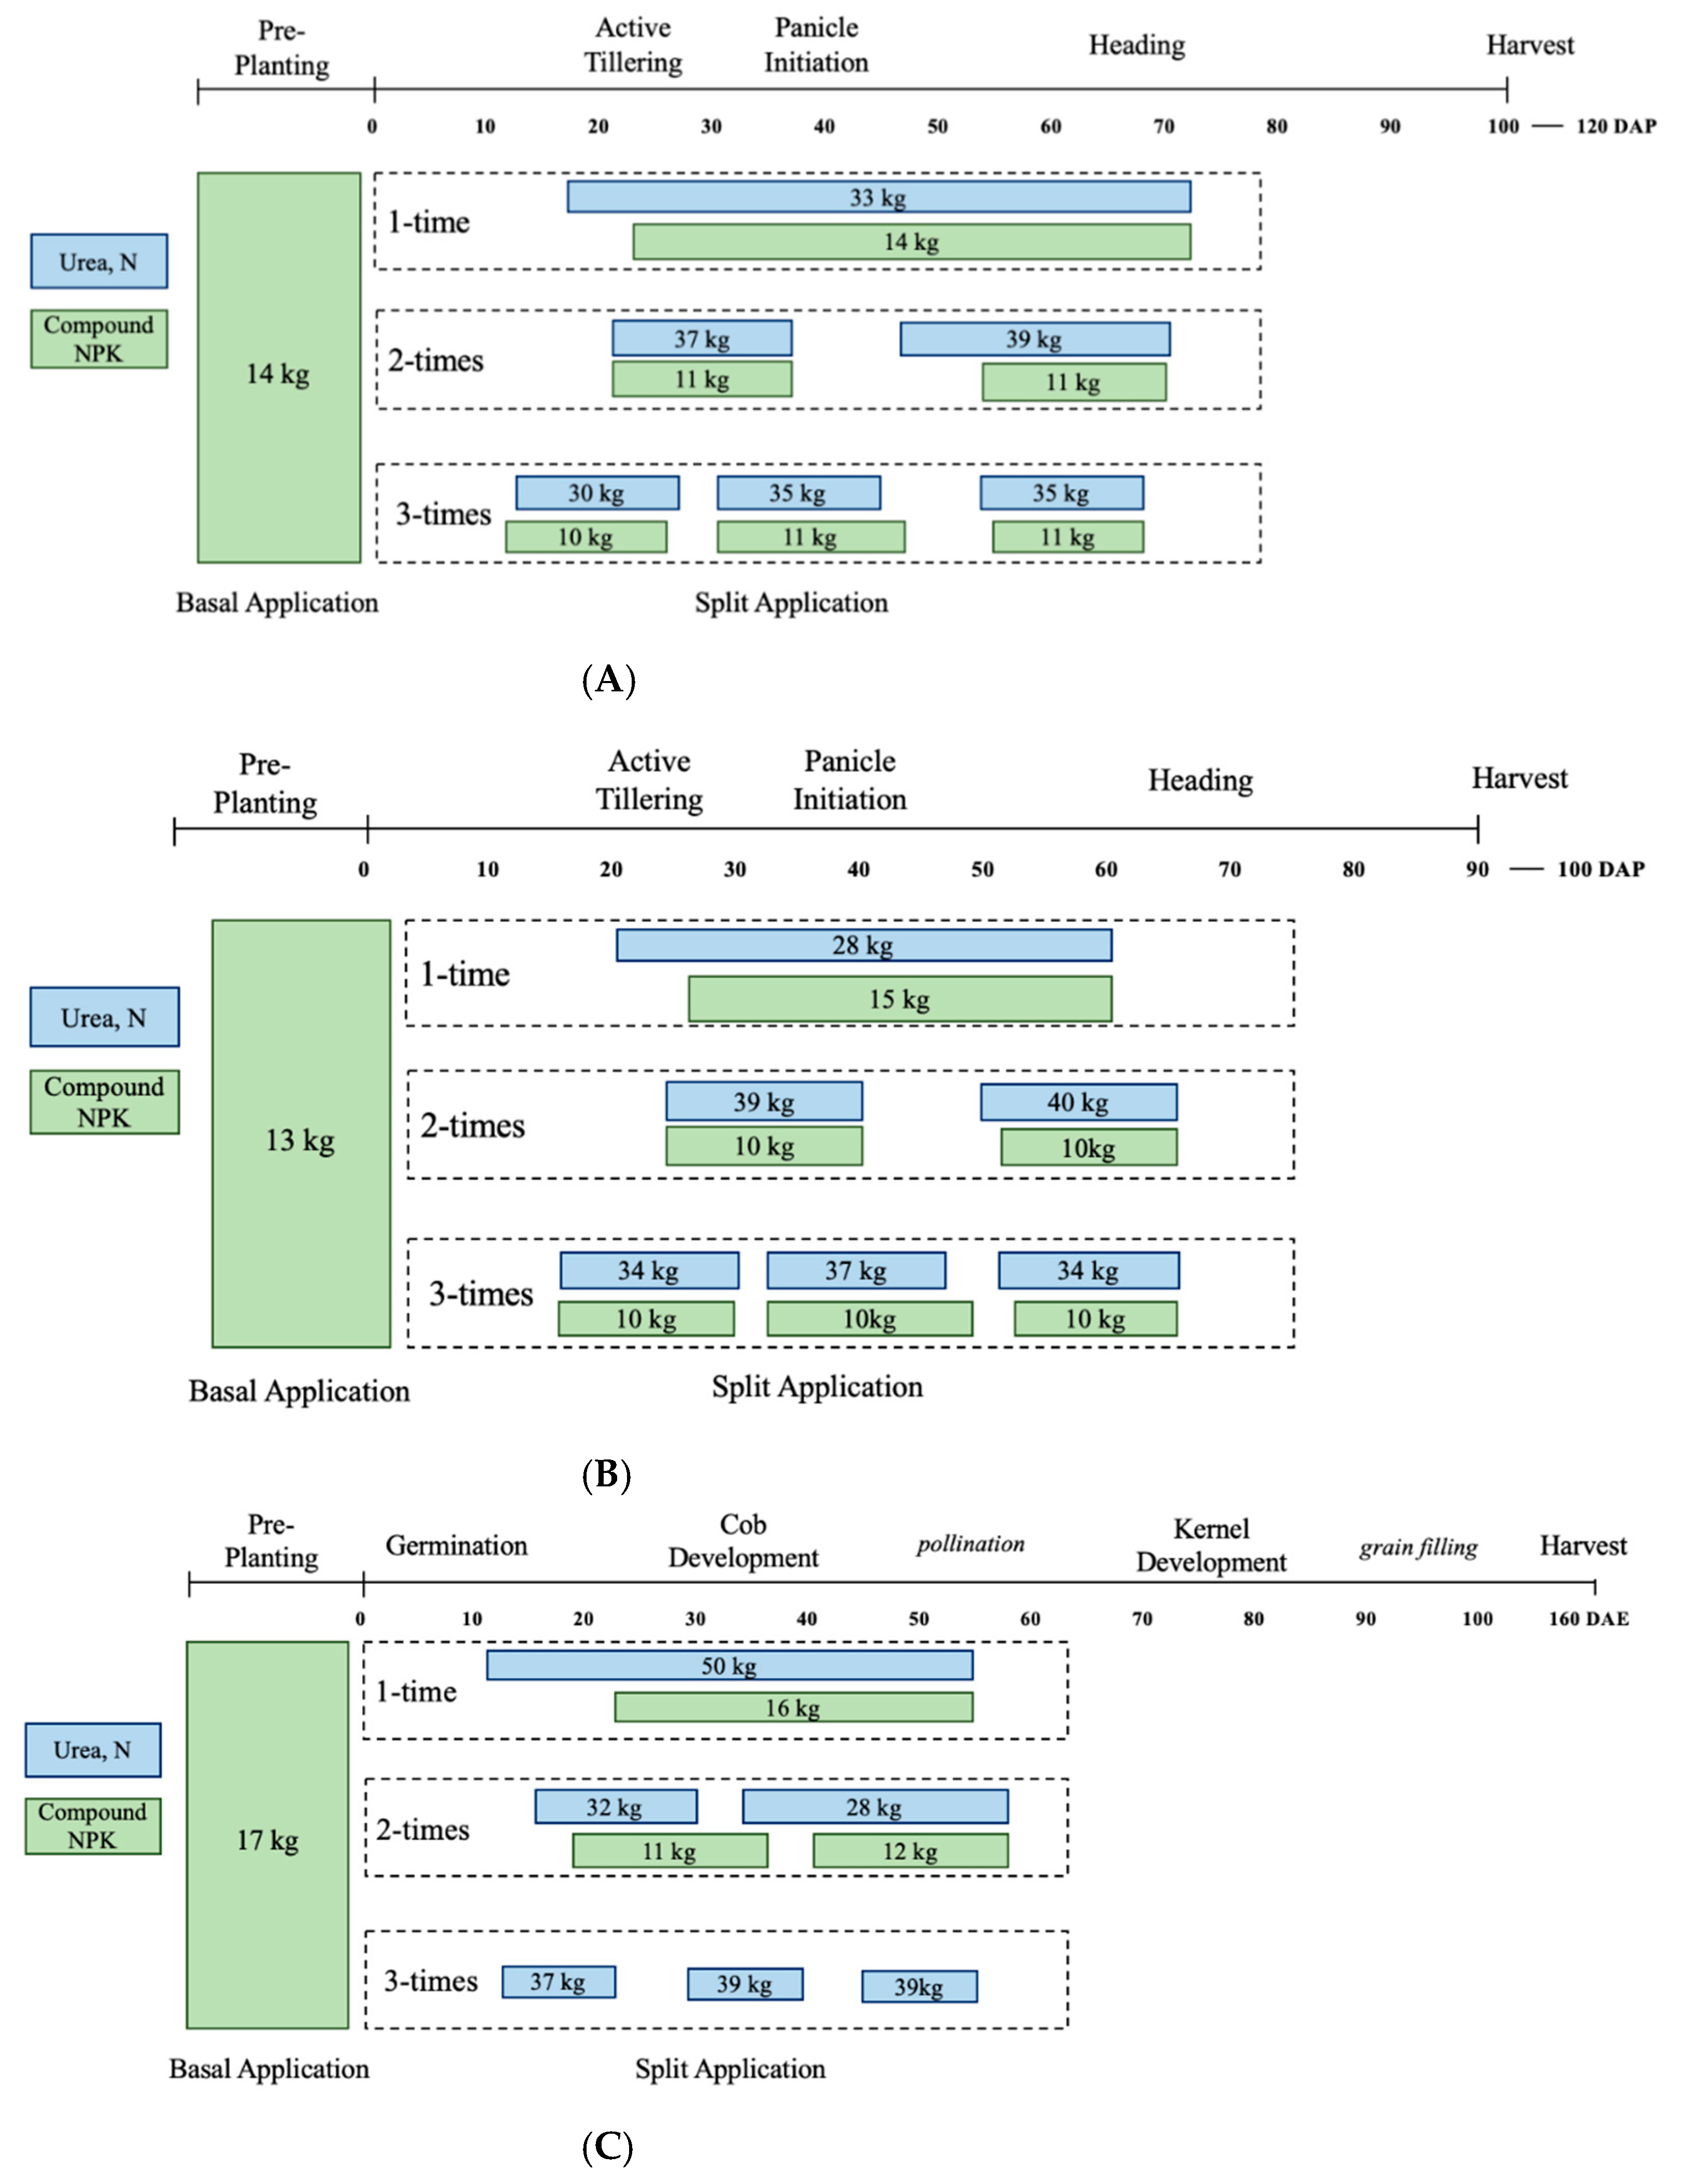
The average amounts of fertilizers applied by the surveyed farmers, based on the number of split applications over various time periods, are in Figure 3 for each crop type.
Most smallholders applied fertilizer at the tillering and flowering stages of rice with some farmers applying after panicle initiation (Figure 3A,B). For urea applied to monsoon rice, 45% of surveyed smallholders applied an average of 100 kg N/ha in three applications. Thirty-nine percent applied 76 kg N/ha in two applications, 7% applied 33 kg N/ha in one application and 9% applied no urea fertilizer. For compound fertilizers, 17% of the surveyed farmers applied 32 kg/ha in three applications, 27% applied 22 kg/ha on two applications, 20% applied 14 kg/ha once and 36% applied no compound fertilizer. These are average amounts applied in units of nutrient rates (i.e., kg/ha of N, P, or K). For summer rice, the application rates were similar to monsoon rice for both urea and compound fertilizers.
For maize, smallholders applied fertilizer during cob development with some applying till pollination (Figure 3C). Forty-five percent of farmers applied an average of 60 kg N/ha as urea in two applications. These results generally imply that these smallholders apply substantial amounts of fertilizer to cereal crops and the rates are significantly higher than previously reported rates in Table 1.
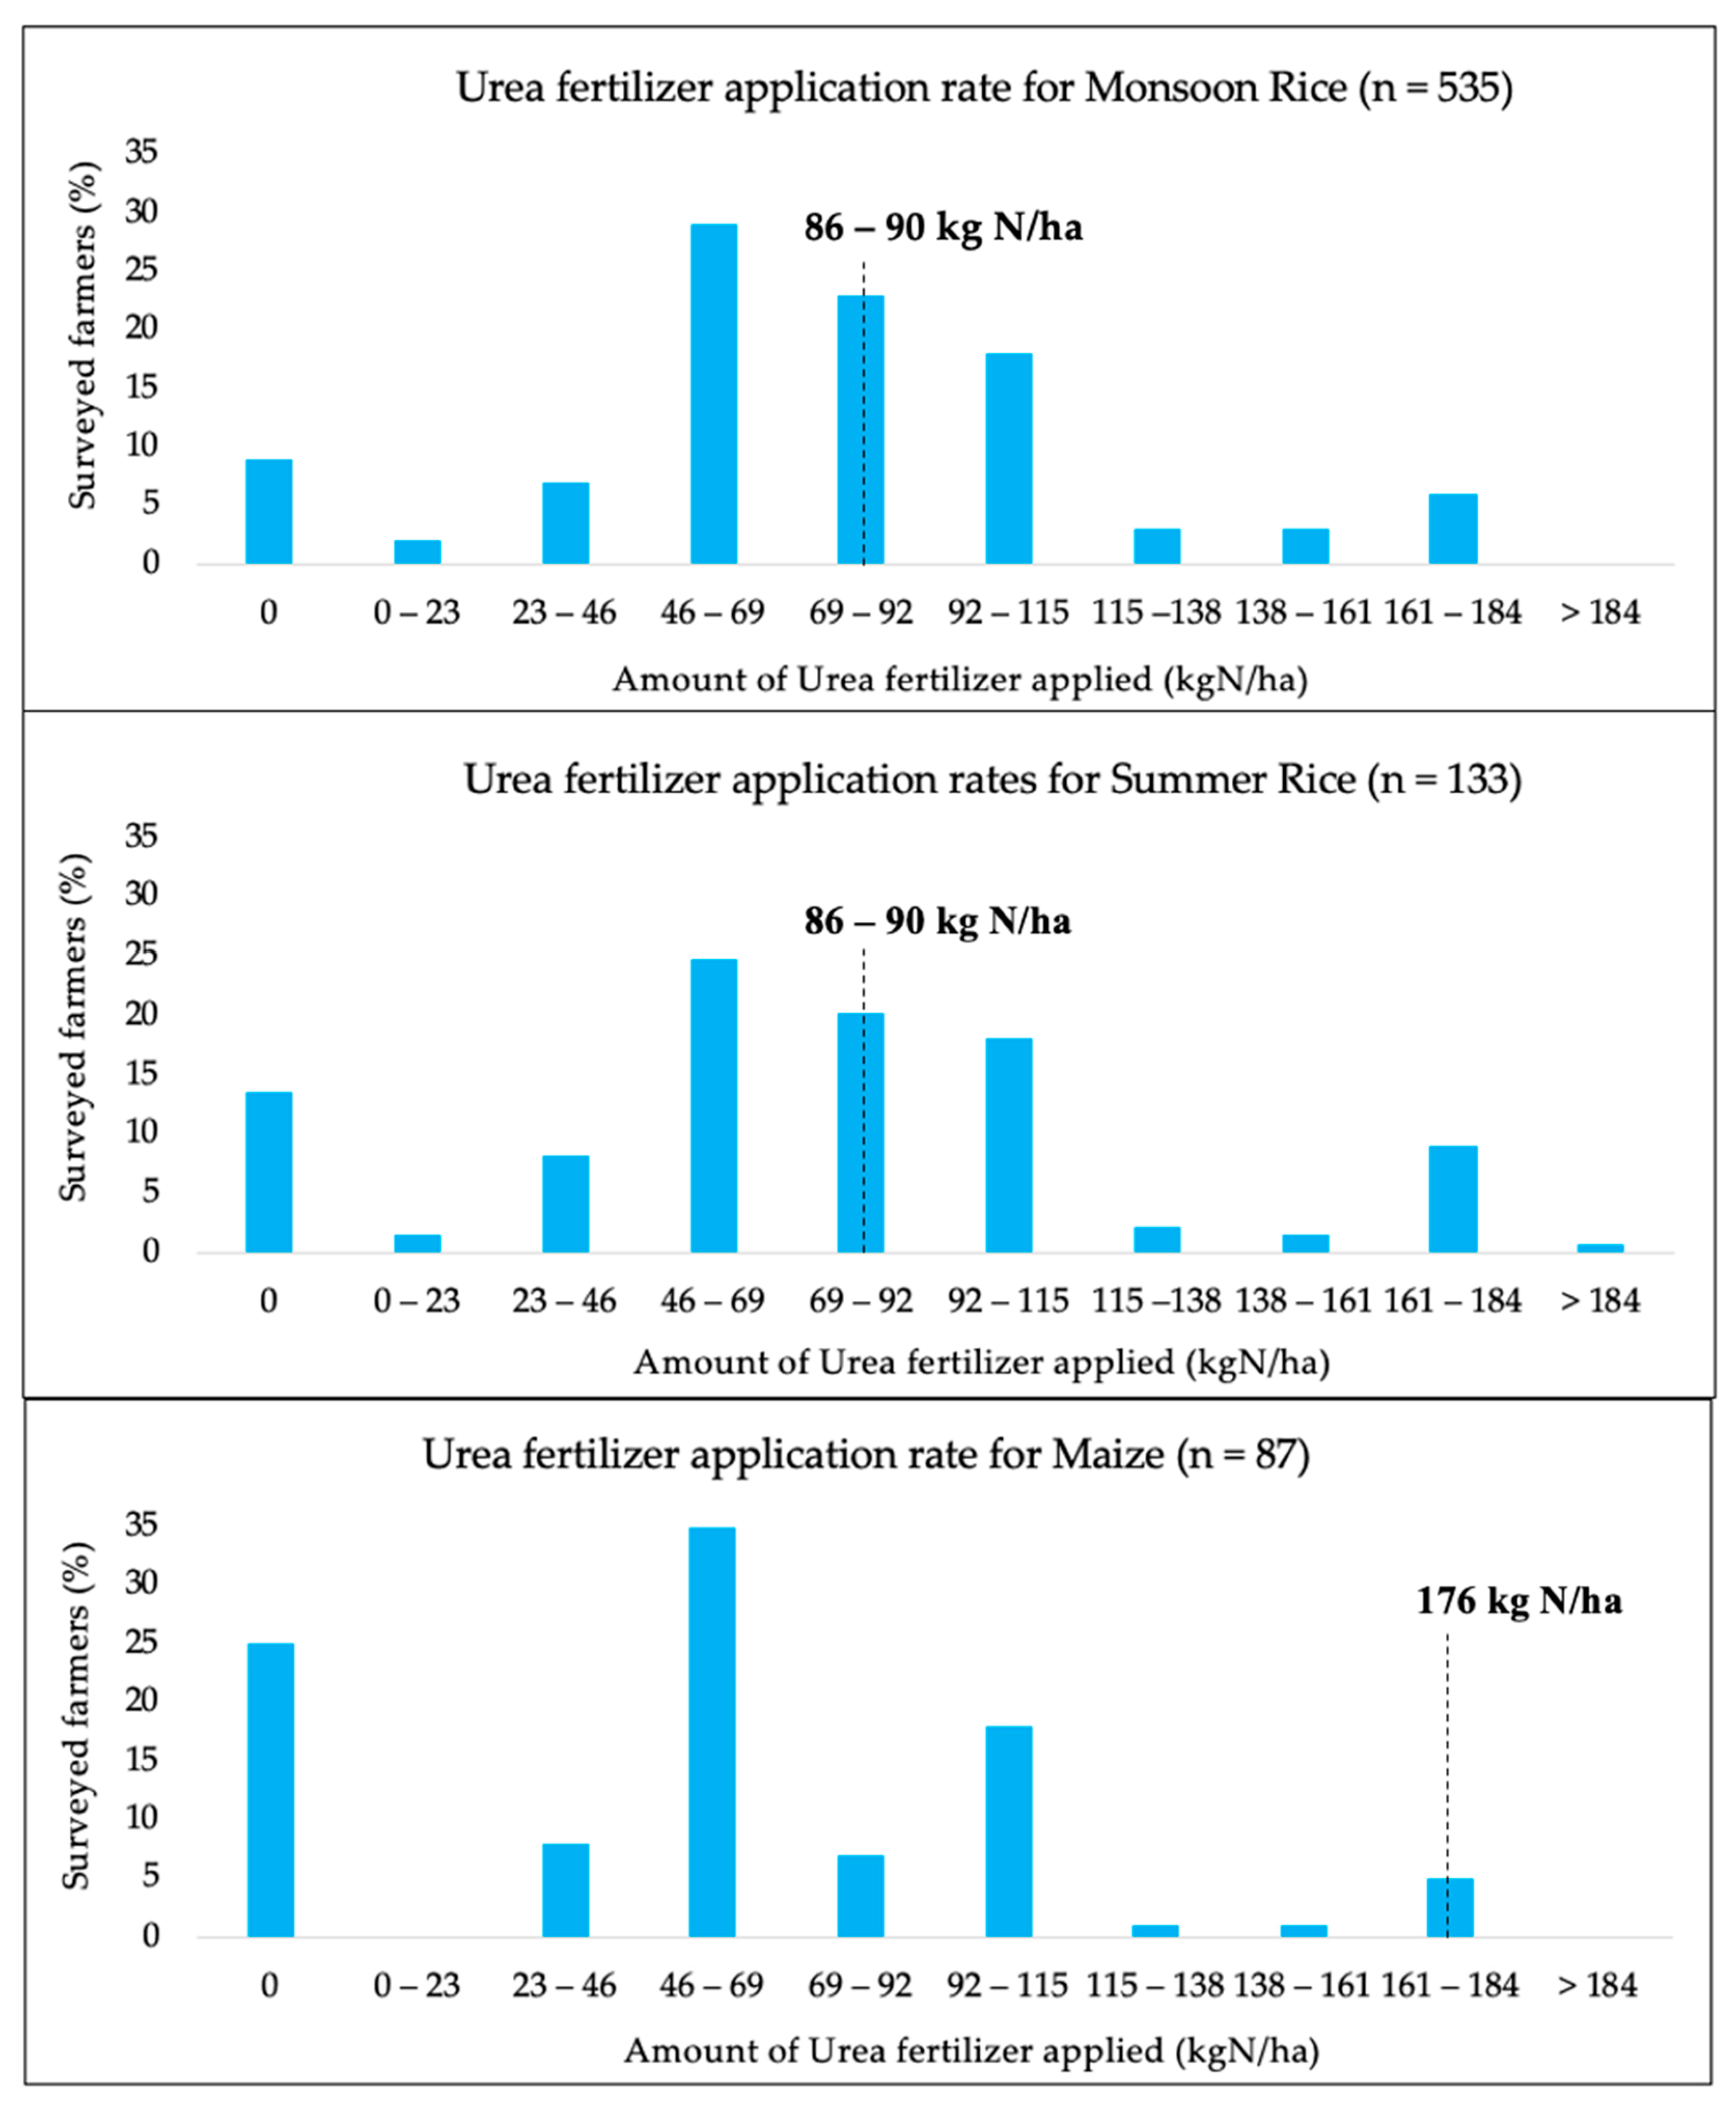
The distribution of urea fertilizer application rates by the surveyed farmers was compared with the national recommended rates provided in Table 1. For this comparison, we used recommended rates of 86 to 90 kg N/ha for rice (MOAI, rice split 3 times (86 kg N/ha) and DoA median soil test value (90 kg N/ha)) and 176 kg N/ha for maize (DoA medium soil test value). The comparisons are in Figure 4.
Monsoon rice was cultivated by 89% of the smallholders in the survey sample. Twenty-three percent of farmers were applying within the range of 69 to 92 kg N/ha while 47% of the farmers were applying lower and 30% of the farmers were applying higher than the recommended rates (Figure 4). Nine percent of farmers applied no urea fertilizer.
Summer rice was cultivated by 22% of the farmers in the survey due to limited access to irrigation and only 20% applied urea fertilizer within the recommended range, while 49% of the farmers were applying lower and 31% higher than recommended rates.
While there were smallholders applying substantial amounts of fertilizer in the study area, there were also some farmers applying no fertilizer, or less than the recommended rates, and some who were applying urea fertilizer at higher rates to their rice crops. While the low use of N fertilizers is a sustainable challenge to increase the overall food production, especially in developing countries where production is required to be doubled [60], high use of N fertilizers is regarded as unsustainable for the environment since it can lead to air pollution, degradation of water quality, damage to soil, and fertilizer waste [61,62]. Hence, the concept of sustainability provides the definition of “right” in the source, rate, time, and place of application which conveys how fertilizer applications can be managed to achieve economic, social, and environmental goals [63]. Rahman and Zhang [59] reported that fertilizer placement is one solution for sustainable fertilizer management in Bangladesh and can be utilized by Myanmar smallholder farmers, given the similar socioeconomic and demographic status. Site-specific nutrient management (SSNM), such as urea deep placement (UDP), is a one-time application that allow plants to access N when required [26] and has been introduced to Myanmar farmers since 2014 [64]. However, adoption of SSNM has been slow and was not observed by farmers in the study area.
Maize was cultivated by only 15% of farmers in the survey. With respect to urea fertilizer application, 25% of the farmers did not apply any urea fertilizer and 95% applied less than the recommended rate. The practice of low fertilizer use on maize has also been observed in other countries [65,66]. Maize is typically known as a heavy feeder crop and increased fertilizer application is necessary to increase productivity [67]. Many African countries have adopted fertilizer subsidy programs to encourage fertilizer use after the success of the program in Malawi [68]. Although these subsidy programs were successful in increasing fertilizer use, improvements in yield were very limited [69,70]. Increases in crop yield depend not only on the use of fertilizer. Other factors preventing higher yields include unavailability of suitable high-yielding varieties (HYVs), poor infrastructure and related high transport costs, inadequate institutional support (extension), political instability, and diverse agro-ecological complexities, including climate change [71,72].
3.2.3. Economic Considerations
The national recommended fertilizer rates in Table 1 are based on soil and agronomy targets and may not include the economic dimensions of farm-level decisions [73,74,75]. Studies have discussed the economics of optimum fertilizer inputs [75,76,77]. Anderson [78] noted that the level of net benefit is small when management practices are varied within the optimal region because the economic profit functions are relatively flat. Pannell [79] also described the economic pay-off functions for many agricultural inputs as being relatively flat around the optimum. The implication of flat rate pay-off functions is that it is unnecessary to be precise about the optimal rate of an input such as fertilizer at the top of the input–profit response curve. This allows for flexibility for farmers to adjust rates by considering other factors such as risk, labor, soil type, climate, and availability of finance or environmental impacts. Farquharson [80] accommodated the flatness of response issue by requiring a minimum target Return on Investment (ROI) (or Marginal Rate of Return) for cereal fertilizer decisions. In the face of uncertainties “it is better to be approximately right than precisely wrong” [81]. Despite the imprecision in assessing economic rates for fertilizer, accounting for the economics means that application rates are likely to be less than agronomic recommendations for maximum yield.
Farmers also react to uncertainties by adopting a level of input in the suboptimal region (for maximum economic profits) to avoid irrecoverable damage or loss [82]. Risk and risk aversion by decision makers have been used to describe the amounts of inputs used [83]. Many authors have considered risk [84,85], risk analysis [74,86] and risk in utility analysis [87], uncertainty and decisions in adopting new technology [83,88], processes of adaptation in farm decision making [89], managerial decision making [90,91], and approaches such as the use of intuition [92] in making real-life decisions [93]. Accounting for risk in farm decision making is important [94] when deciding or recommending input rates for fertilizer.
3.3. Fertilizer Timing Analysis for Rice
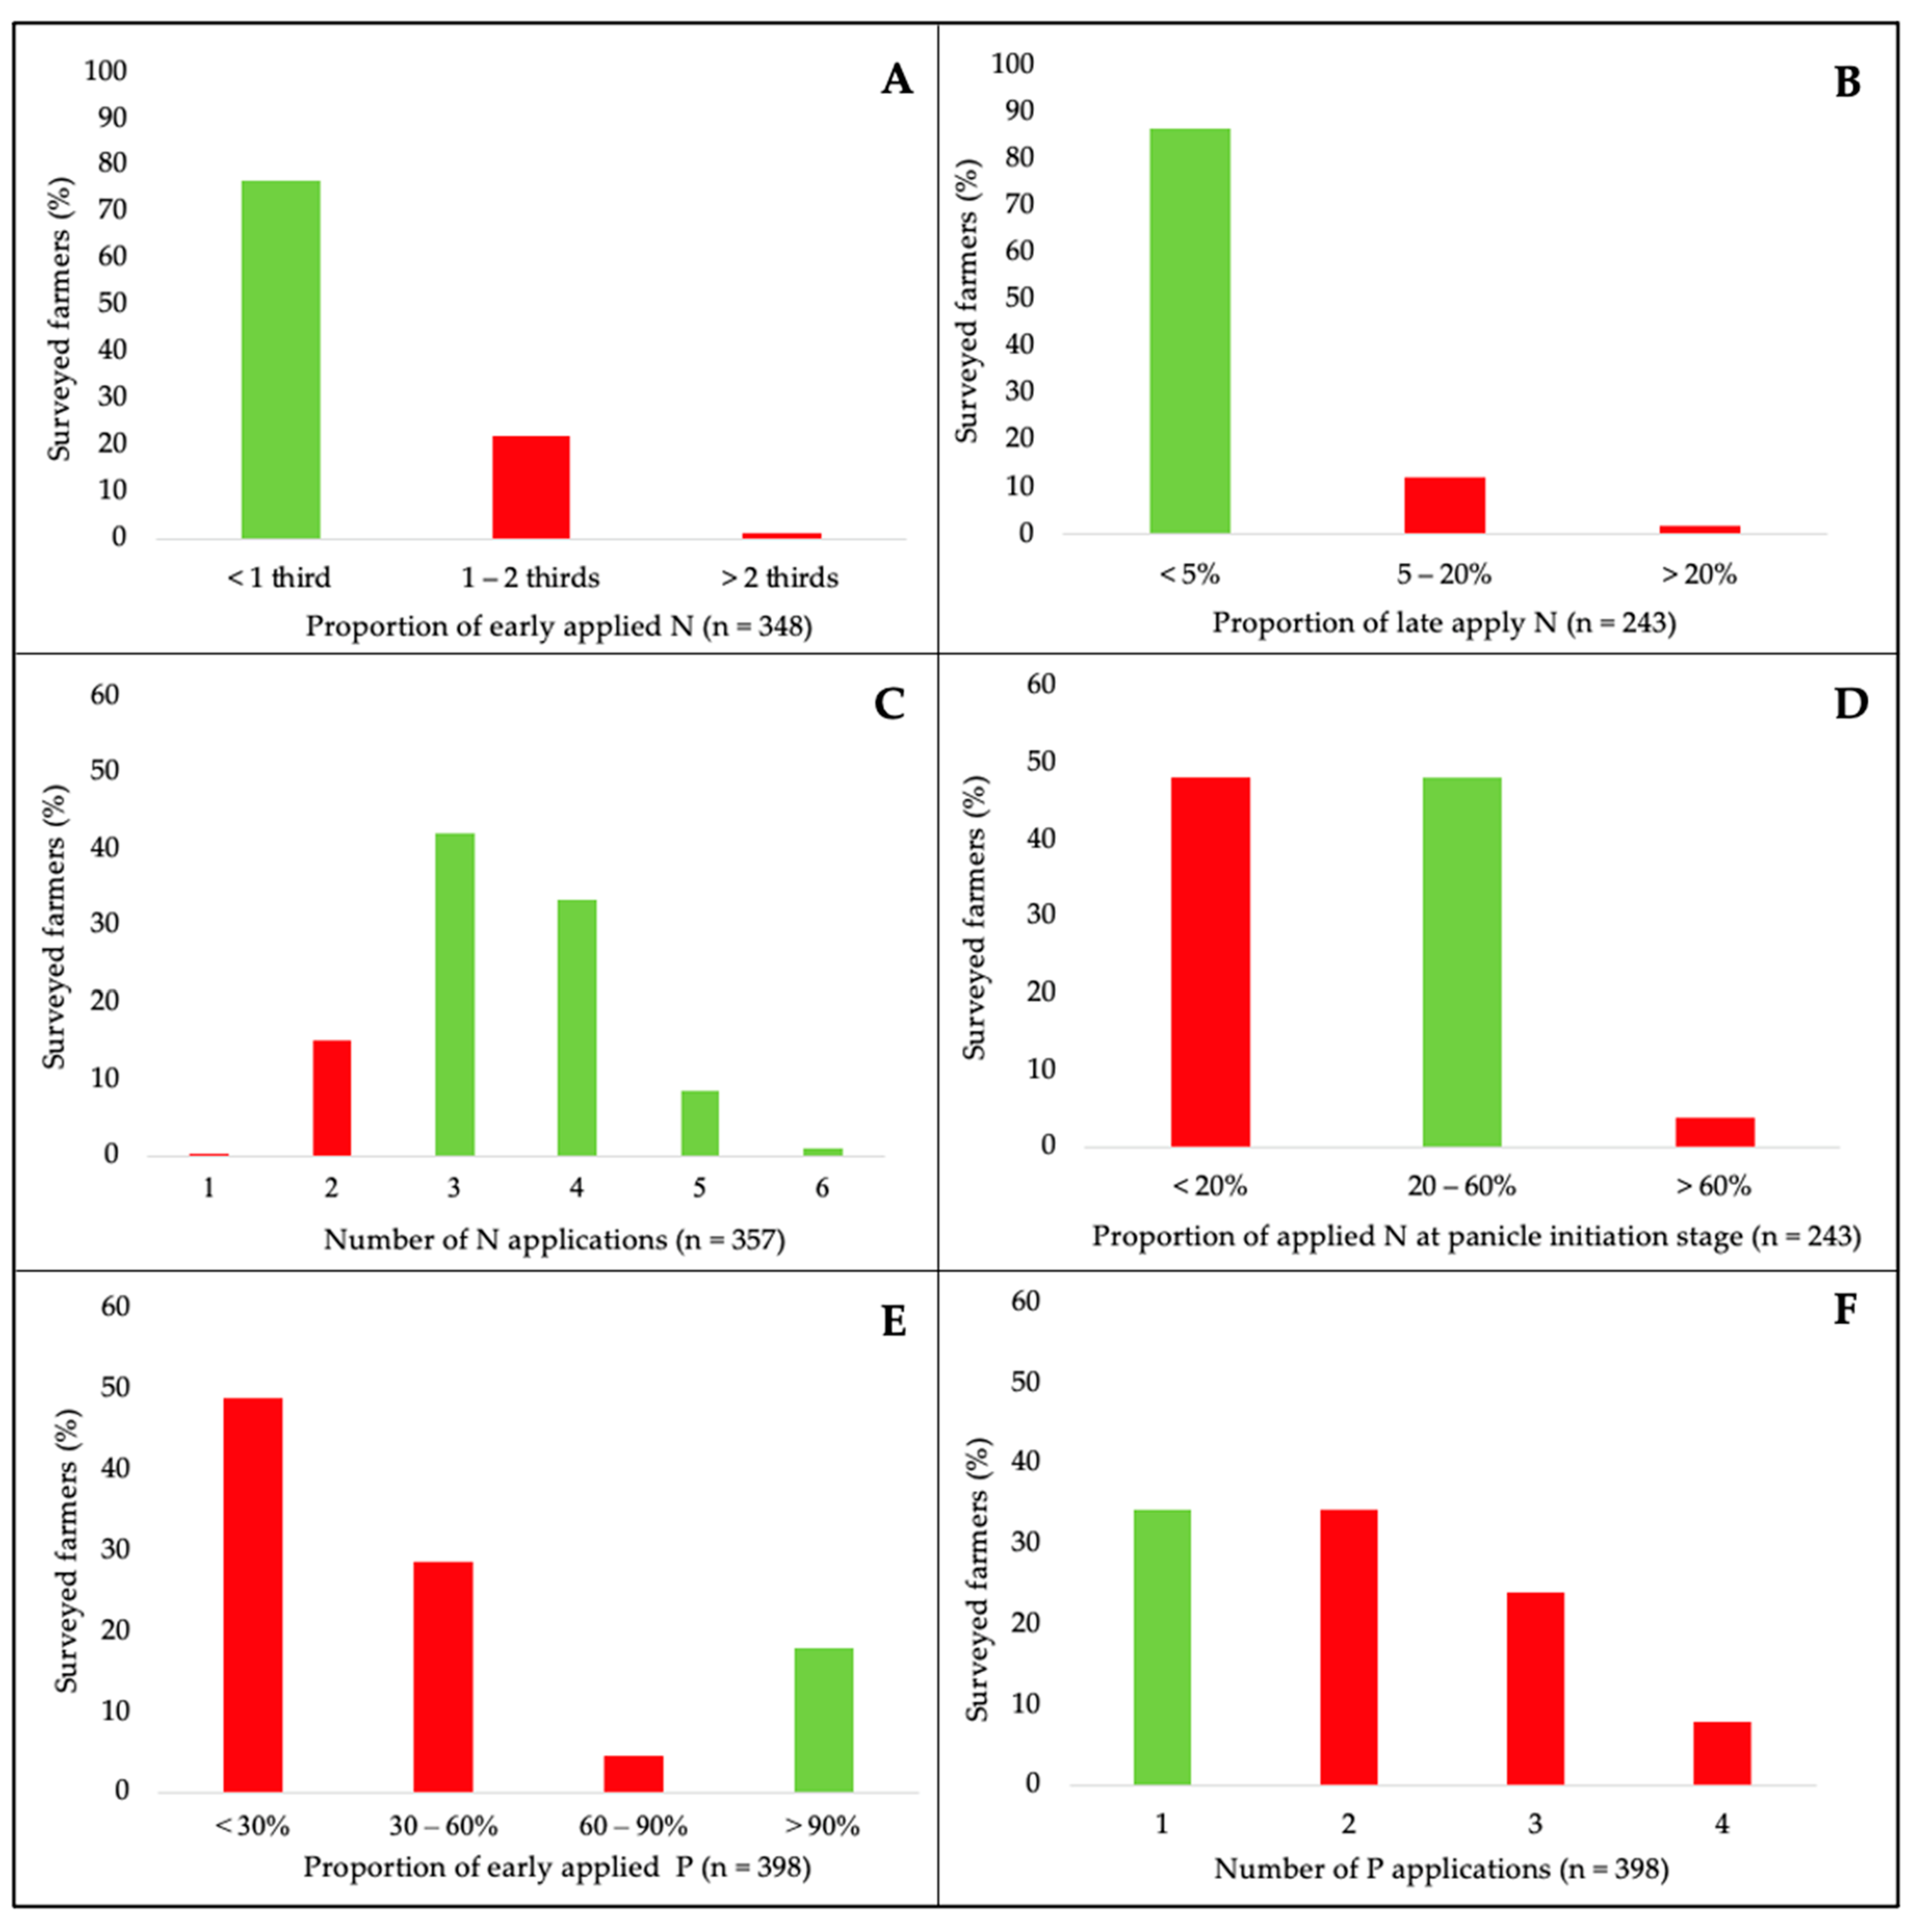
The timing of fertilizer applications practiced by surveyed smallholders was compared with the six recommended timing “good management practices” for rice production described in Table 2. There has been no study in Myanmar considering the fertilizer application timing in cereal crops. The results are in Figure 5.
Most reported farmer practices were aligned with the first three “good management practices”. More than 75% of analyzed farmers avoided excess early application of N (Figure 5A), approximately 90% avoided late applications of N fertilizer (Figure 5B), and approximately 85% applied N fertilizer at least three times (including basal applications). In this analysis, multiple applications on the same day or multiple basal applications were counted as one application (Figure 5C). The high number of N splits is mainly due to the high number of compound fertilizer applications. Thind, et al. [95] reported that increases in number of N applications beyond three did not increase yield in an Indian research trial. Hence, many smallholders could reduce the number of compound fertilizer split applications and save labor costs as it is likely to have negligible impacts on rice yield. In contrast, nearly half of the surveyed farmer practices did not align with the fourth analyzed “good management practices” (apply N at panicle initiation between 55 to 65 days before crop maturity) (Figure 5D).
When applying P, farmer practices generally did not align with the recommended “good management practices” (apply P during the early growth stages of rice as it supports flower, root, and stem development [7]). Only 18% of the farmers applied total P early (within 21 days after seeding or 14 days after planting) (Figure 5E). Most farmers (82%) were applying P throughout the growth stages when it may have been needed earlier. It is also recommended to apply P only once as it is relatively immobile [25,53] and so the cost of labor for fertilizer application can be saved by applying only once. Only 34% of the farmers were found to be applying P once (Figure 5F).
Smallholders could improve the timing of fertilizer application if they stopped applying compound fertilizer and instead applied single nutrient fertilizer such as urea, T super, and potash when individual N, P, and K nutrients are needed throughout the crop growth stages. However, compound fertilizers also commonly contain micronutrients. The decisions on compound fertilizer applications appear to be associated with labor-saving considerations.
4. Policy Implications
The current fertilizer law in Myanmar focusses on fertilizer trade, registration and licensing, and quality control. Some implementing regulations are deficient in terms of completeness and clarity based upon international standards [96]. Agricultural policies in Myanmar have been focused on increasing yield by encouraging increased use of fertilizers [97] but care should be taken to avoid excessive recommendations. From this study, 30–31% of the surveyed farmers were applying more than the recommended urea fertilizer recommendations for rice. Increased fertilizer use is necessary for sustainable intensification by reducing deforestation and preserving production potential of the land. However, it must be combined with land conservation [98]. Application of fertilizer by the broadcasting method can lead to excessive use of fertilizers [59]. Hence, blanket recommendations should be avoided, and SSNM practices should be encouraged. Accurate and accessible soil assessments combined with programs to increase farmer literacy on soil and environmental health will assist with fertilizer management. Studies on farm typology can distinguish specific farmer groups, based on the levels of fertilizer use, to enable training to increase smallholder fertilization knowledge and adoption of advanced fertilizer management technologies. Policies aimed at not only increasing fertilizer application but also reducing over-fertilization, are desirable. Fertilizer policies which emphasize the implementation of placement methods may be valuable.
Issues of sustainable development focus on three pillars, namely environment, economy, and society [99]. Porter and van der Linde [100] implied that “the best choice for sustainability should meet the needs of society and are environmentally and economically viable, economically and socially equitable as well as socially and environmentally bearable”. There is a trade-off between the three pillars where there is a choice between aiming for economic growth, environmental conservation, or social equality [101]. This trade-off is more prominent in developing countries where economic growth is commonly prioritized as the population needs money to survive and economic growth means more jobs in the economy [102].
However, the reality in many countries, including Myanmar, is that reducing poverty and improving food security are the primary aims. The main objective of many projects from international organizations in Myanmar focuses on reducing poverty and improving food security [18,103] with less attention on the environment. Focus on economic development, such as increasing yield for the growing population, can lead to increased use of fertilizers which inevitably causes pollution.
Policies can be developed to include a charge in the price of N for excessive use of chemical fertilizers. However, an integrated modelling approach by Wei, et al. [104] found that raising the price of N delivers little benefit to society and increasing the water prices is the better policy instrument. In Myanmar, the existing policy and administration of water resources is scattered and unfocused [105,106]. Studies have found that one of the main reasons for farmers overusing fertilizers is due to lack of knowledge in the N application rates [107], and hence training and educational programs for sustainable fertilizer management may improve the sustainability of the agro-ecosystem.
From the study, 95% of the surveyed maize farmers were found to be applying less than the national recommended rates. Evidence from other countries has shown that fertilizer subsidy programs have been effective in increasing fertilizer use but have had little success in increasing yield. In particular, the Green Revolution productivity increases were predicated on using more N, while there is enough (irrigation) water and use of HYVs [108]. Although more N might be used through subsidies, if the crop varieties used are not able to fully express this enhanced fertility in increased crop yields, then the policy aim of yield improvement cannot be achieved. Farmers in the study area were found to be using CP888, a hybrid maize variety, which may help explain why an increase in N use might not lead to an increase in yield [109]. In the case of rice, farmers in the study area were found to be mainly using HYVs [109]; however, the quality of the HYVs may be of concern. In Myanmar, shortage of good quality seeds has been identified, with there being only about 10% of the supply of improved seeds and 90% from farmers’ saved seeds from the previous season’s harvest [106]. There is a need for cost-effectively generating and delivering improved seed varieties to farmers. Hence, policies need to address more than just increasing fertilizer usage.
In Myanmar there is a limited credit supply for maize farmers from the Myanma Agricultural Development Bank (MADB). MADB is the largest institution financing agricultural activities at a subsidized interest rate [110]. However, it only finances farmers with formalized land tenure and to produce certain crops, and the amounts are specified by crop type. Maize farmers can only borrow USD 95 per ha, substantially less than rice farmers (USD 280 per ha). According to Fang and Belton [111], this amount covers only 4% of the total maize production cost. This may explain the low use of fertilizer by maize farmers. A study by Tadesse [112] provided evidence that the probability and intensity of fertilizer use increased significantly with better access to credit. Hence, there is a need for maize farmers to have better credit access and to identify ways of disbursing formal agricultural credit to smallholders without formal documentation of land tenure or title. Innovations to improve rural credit access are worth further study.
Another reason for the low use of N in maize compared to rice by farmers could be due to cash flow implications. The country’s rice self-sufficiency policy has led farmers to consider that rice is a more important crop than any other crops [113]. This remained consistent with the survey results where rice was cultivated by 89% of the farmers while only 15% cultivated maize in the study area. Hence, when farmers have limited money for fertilizers, they will use the limited budget for N fertilizer primarily on rice.
Some limitations of this study need to be noted. Although the sample size of the study covers 6% of the population of the project area, the study location had greater than average access to input retailers and agricultural support services. The field trial locations were located at sites associated with or close to government research stations or university land. This provided easier access for local extension officers but not for all farmers. Study areas for further research could be located at remote and under-resourced areas covering a wider landscape. The study mainly focused on applications of urea and compound (N:P:K) fertilizers by smallholder farmers and did not consider other micro-nutrients, manure, and organic fertilizers. Further studies on these can be useful.
5. Conclusions
In this study we report results of a survey of 600 smallholders in central Myanmar. Smallholder perceptions that fertilizers increase cereal crop yields have been the primary motivation for fertilizer use. There are many types of fertilizer brands available in central Myanmar. When deciding which fertilizer to use, smallholders mainly rely on popular brands and opinions of other farmers. Most fertilizer decisions were made by male farmers. Fertilizer quality was not of concern to most of the smallholders.
The second part of the study highlighted the fertilizer practices of smallholders in the study area. We tested whether the reportedly low fertilizer use by Myanmar smallholders is generally true in the study area. We compared their fertilizer practices to national agricultural agency recommendations. We also compared the timing of fertilizer application against recommended “good management practices”. This is the first study to compare and clarify how fertilizer management is conducted by Myanmar smallholders, and the findings are valuable in discussing whether, and what type of, interventions could be developed.
The survey results revealed that 99% of the smallholders in the study area were using fertilizers. Smallholders understand the crop yield responses to basal and split fertilizer applications of N. They apply compound fertilizers to ensure that other nutrients, apart from N, are not limiting. The average fertilizer application rates were generally found to be substantial. Hence, the reported national-level data and farm-level research implying low fertilizer use by Myanmar farmers is not confirmed by this contemporary study in central Myanmar. However, the distribution of fertilizer applications showed that there were farmers applying no fertilizer and others were over-applying fertilizer. Only 20 to 23% of the surveyed farmers were found to be applying within the national recommended range of urea fertilizer in rice. Smallholders were found to be applying substantially lower N levels than the recommendations for maize.
But smallholders are rational; they have good reasons for doing what they do. Farmers applying no fertilizer may be in a subsistence mode and the others who are using fertilizers are in a semi-subsistence or commercial mode. An understanding of the economics and risk associated with farm-level decisions is important when considering practices of farm input usage by smallholders.
With respect to fertilizer application timing, smallholders’ practices were generally aligned with the first three N timing “good management practices”. However, nearly half of the surveyed farmer practices did not align with the fourth practice (apply to N at panicle initiation). This was an important recommendation for farmers in the study area in Myanmar. With respect to P timing, most farmers were applying throughout the growth stages, when earlier applications are desirable. Smallholder farmers may also be able to save the cost of labor for fertilizer application by reducing the number of P applications and avoiding late application. Overall, these farmers are using better fertilizer management than indicated by the literature and careful consideration is needed to improve smallholder fertilizer management.
Author Contributions
Conceptualization, S.P.T., R.J.F. and T.R.; methodology, S.P.T., R.J.F., T.R. and S.C.; writing—original draft, S.P.T. and R.J.F.; writing—review and editing, S.P.T., R.J.F., T.R., S.C. and D.C.; funding acquisition, R.J.F. and D.C.; resources, S.P.T., R.J.F., T.R. and S.C.; supervision, R.J.F., T.R. and D.C. All authors have read and agreed to the published version of the manuscript.
Funding
This research was funded by ACIAR, grant number SMCN/2014/044 and the University of Melbourne Doctoral Research Scholarship.
Institutional Review Board Statement
The study was conducted according to the guidelines of the Declaration of Helsinki, and approved by the Institutional Review Board (or Ethics Committee) of the University of Melbourne (Ethics ID: 1851136 approved on 27 March 2018).
Informed Consent Statement
Informed consent was obtained from all subjects involved in the study.
Data Availability Statement
The data presented in this study are available on request from the corresponding author.
Acknowledgments
We gratefully acknowledge the support from the University of Melbourne Doctoral Research Scholarship and ACIAR project (SMCN/2014/044). We are grateful to all the farmers for their active participation in the survey and the local extension officers for helping invite the farmers.
Conflicts of Interest
The authors declare no conflict of interest.
References
- World Bank. Myanmar Poverty and Living Conditions Suryey. Available online: https://www.worldbank.org/en/country/myanmar/publication/myanmar-poverty-reports. (accessed on 19 August 2020).
- Findlay, R.; Park, C.Y.; Verbiest, J.P.A. Myanmar: Unlocking the Potential—A Strategy for High, Sustained, and Inclusive Growth; Asian Development Bank: Manila, Philippines, 2015. [Google Scholar]
- Hazell, P.B.R. The Asian Green Revolution; FPRI Discussion Paper 00911; International Food Policy Research Institute (IFPRI): Washington, DC, USA, 2009; Available online: https://core.ac.uk/download/pdf/6257689.pdf (accessed on 29 September 2020).
- Hirel, B.; Tetu, T.; Lea, P.J.; Dubois, F. Improving nitrogen use efficiency in crops for sustainable agriculture. Sustainability 2011, 3, 1452–1485. [Google Scholar] [CrossRef]
- Stewart, W.M.; Dibb, D.W.; Johnston, A.E.; Smyth, T.J. The contribution of commercial fertilizer nutrients to food production. Agron. J. 2005, 97, 1–6. [Google Scholar] [CrossRef] [Green Version]
- World Bank. Enabling the Business of Agriculture 2017; World Bank: Washington, DC, USA, 2017. [Google Scholar]
- Place, G.A.; Sims, J.L.; Hall, U.L. Effects of nitrogen and phosphorous on the growth yield and cooking, characteristics of rice. Agron. J. 1970, 62, 239–241. [Google Scholar] [CrossRef]
- Kropff, M.J.; Cassman, K.; Laar, H.H.V.; Peng, S. Nitrogen and yield potential of irrigated rice. Plant Soil 1993, 155, 391–394. [Google Scholar] [CrossRef] [Green Version]
- Dobermann, A.; Fairhurst, T. Rice: Nutrient Disorders and Nutrient Management; Potash and Phosphate Institute (PPI): Los Baños, Phillippines, 2000. [Google Scholar]
- World Bank. Fertilizer Consumption (Kilograms Per Hectare of Arable Land). Available online: https://www.worldbank.org/indicator/Ag.CON.FERT.ZS (accessed on 14 December 2020).
- Maclean, J.; Hardy, B.; Hettel, G. Rice Almanac, 4th ed.; International Rice Research Institute (IRRI): Los Banos, Phillippines, 2013. [Google Scholar]
- Rice Almanac: Source Book for the Most Important Economic Activity on Earth; Global Rice Science Partnership: Los Baños, Philippines, 2013.
- FAOSTAT. Fertilizers Indicators. Available online: http://www.fao.org/faostat/en/#data/EF/visualize (accessed on 5 November 2020).
- Gregory, I.; Shwe, T.M.; Oo, N. Myanmar Fertiliser Policy Evaluation; International Fertiliser Development Center (IFDC). 2014. Available online: https://ifdcorg.files.wordpress.com/2015/09/myanmar-fertilizer-policy-evaluation-9-17-14-kg-edits-4.pdf (accessed on 22 November 2019).
- Denning, G.; Baroang, K.; Sandar, T.M. Background Paper No.2 Rice Productivity Improvement in Myanmar; Michigan State University: East Lansing, MI, USA, 2013; Available online: https://www.themimu.info/sites/themimu.info/files/documents/Ref_Doc_Background_Paper_2_Rice_Productivity_Improvement_Mar2013.pdf (accessed on 1 July 2020).
- Garcia, A.; Garcia, Y.; Aung, T.; Swe, A.; Hossain, M. Constraints to increased rice production in Myanmar: Implications for future research priorities and policies. In Proceedings of the Prioritization of Rice Research Problem Areas, Los Banos, Philippines, 20–22 April 1998. [Google Scholar]
- Naing, T.A.A.; Kingsbury, A.J.; Buerkert, A.; Finckh, M.R. A survey of Myanmar rice production and constraints. J. Agric. Rural Dev. Trop. Subtrop. 2008, 109, 151–168. [Google Scholar]
- LIFT. Myanmar: Analysis of Farm Production Economics. Livelihoods and Food Security Trust Fund (LIFT). 2016. Available online: http://www.lift-fund.org/sites/lift-fund.org/files/publication/MM%20Farm%20Production%20Economics%20-%20online%20version.pdf (accessed on 22 November 2019).
- Stuart, A.M.; Pame, A.R.P.; Silva, J.o.V.; Dikitanan, R.C.; Rutsaert, P.; Malabayabas, A.J.B.; Lampayan, R.M.; Radanielson, A.M.; Singleton, G.R. Yield gaps in rice-based farming systems: Insights from local studies and prospects for future analysis. Field Crops Res. 2016, 194, 43–56. [Google Scholar] [CrossRef] [Green Version]
- LIFT. Chemical and Organic Fertilizer Market in Relation to the Interests of Small Farmers in Myanmar. Food Security Working Group (FSWG). 2015. Available online: https://www.myanmarfswg.org/sites/myanmarfswg.org/files/fertilizer_report_eng.pdf (accessed on 22 November 2019).
- IFDC. Fertiliser Sector Improvement Project: Fertiliser Dealer Survey. International Fertilizer Development Center (IFDC). 2015. Available online: https://ifdc.org/wp-content/uploads/2016/05/1-fertilizer-sector-improvement-project-retailer-survey-report.pdf (accessed on 21 November 2020).
- Haggblade, S.; Boughton, D.; Denning, G.; Kloeppinger-Todd, R.; Cho, K.M.; Wilson, S.; Wong, L.C.Y.; Oo, Z.; Than, T.M.; Wai, N.E.M.A.; et al. A Strategic Agricultural Sector and Food Security Diagnostic for Myanmar; MSU International Development Working Paper No. 131; Michigan State University: East Lansing, MI, USA, 2013; Available online: https://www.canr.msu.edu/fsg/papers/idwp131_revised.pdf (accessed on 13 April 2020).
- Weil, R.R. Soil fertility and fertilizers in sustainable agricultural development: What is the way forward for Myanmar? In Proceedings of the Myanmar Soil Fertility and Fertilizer Management, Nay Pyi Taw, Myanmar, 18–19 October 2017. [Google Scholar]
- Nyi, T.; Department of Agriculture, Land Use Division LUD, Ministry of Agriculture, Naypyitaw, Myanmar. Personal communication, 2020.
- MOAI. Methods to Achieve Targeted Yield (Translated); Agricultural Extension Division, Ministry of Agriculture and Irrigation (MOAI): Yangon, Myanmar, 2006.
- Johnston, A.M.; Bruulsema, T.W. 4R Nutrient Stewardship for improved nutrient use efficiency. Procedia Eng. 2014, 83, 365–370. [Google Scholar] [CrossRef] [Green Version]
- Wang, H.; Hu, R.; Chen, X.; Zhong, X.; Zheng, Z.; Huang, N.; Xue, C. Reduction in nitrogen fertilizer use results in increased rice yields and improved environmental protection. Int. J. Agric. Sustain. 2017, 15, 681–692. [Google Scholar] [CrossRef]
- Saito, K.; Diack, S.; Dieng, I.; N’Diaye, M.K. On-farm testing of a nutrient management decision-support tool for rice in the Senegal River valley. Comput. Electron. Agric. 2015, 116, 36–44. [Google Scholar] [CrossRef]
- Byrnes, B.H. Environmental effects of N fertilizer use—An overview. Fertil. Res. 1990, 26, 209–215. [Google Scholar] [CrossRef]
- Feder, G.; Just, R.E.; Zilberman, D. Adoption of Agricultural Innovations in Developing Countries: A Survey. Econ. Dev. Cult. Chang. 1985, 33, 255. [Google Scholar] [CrossRef] [Green Version]
- Adesina, A.A.; Zinnah, M.M. Technology characteristics, farmers’ perceptions and adoption decisions: A Tobit model application in Sierra Leone. Agric. Econ. 1993, 9, 297–311. [Google Scholar] [CrossRef]
- Coady, D.P. An empirical analysis of fertilizer use in Pakistan. Economica 1995, 62, 213–234. [Google Scholar] [CrossRef]
- Nkamleu, G.B.; Adesina, A.A. Determinants of chemical input use in peri- urban lowland systems: Bivariate probit analysis in Cameroon. Agric. Syst. 2000, 63, 111–121. [Google Scholar] [CrossRef]
- Chianu, J.N.; Tsujii, H. Determinants of farmers’ decision to adopt or not adopt inorganic fertilizer in the savannas of northern Nigeria. Nutrient Cycling in Agroecosystems. Nutr. Cycl. Agroecosystems 2004, 70, 293–301. [Google Scholar] [CrossRef]
- Koundouri, P.; Nauges, C.; Tzouvelekas, V. Technology adoption under production uncertainty: Theory and application to irrigation technology. Am. J. Agric. Econ. 2006, 88, 657–670. [Google Scholar] [CrossRef] [Green Version]
- Majumdar, K.; Johnston, A.M.; Dutt, S.; Satyanarayana, T.; Roberts, T.L. Fertiliser best management practices: Concept, global perspectives and application. Indian J. Fertil. 2013, 9, 14–31. [Google Scholar] [CrossRef]
- Rahman, S. Environmental impacts of modern agricultural technology diffusion in Bangladesh: An analysis of farmers’ perception and their determinants. J. Environ. Manag. 2003, 68, 183–191. [Google Scholar] [CrossRef] [Green Version]
- ACIAR. Management of Nutrients for Improved Profitability and Sustainability of Crop Production in Central Myanmar. Available online: https://www.aciar.gov.au/project/SMCN-2014-044 (accessed on 25 August 2020).
- Ethical Trading Initiative. Smallholder Guidelines: Recommendations for Working with Smallholders. 2005. Available online: https://www.ethicaltrade.org/sites/default/files/shared_resources/eti_smallholder_guidelines_english.pdf (accessed on 25 August 2020).
- Mercy Corps. The Dry Zone of Myanmar: A Strategic Resilience Assessment of Farming Communities. 2018. Available online: https://themimu.info/sites/themimu.info/files/documents/Report_Resilience_Assessment_of_Farming_Communities_Dry_Zone_MercyCorps.pdf (accessed on 18 December 2020).
- Sukhatme, P.V.; Sukhatme, B.V.; Sukhatme, S.; Asok, C. Sampling Theory of Surveys with Applications; ISAS: New Deli, India, 1984. [Google Scholar]
- Costello, A.B.; Osborne, J. Best practices in exploratory factor analysis: Four recommendations for getting the most from your analysis. Pract. Assess. Res. Eval. 2005, 10, 1–9. [Google Scholar] [CrossRef]
- Memon, M.A.; Ting, H.; Hwa, C.J.; Ramayah, T. Sample size for survey research: Review and recommendations. J. Appl. Struct. Equ. Modeling 2020, 4, 1–20. [Google Scholar] [CrossRef]
- Levy, P.S.; Lemeshow, S. Sampling of Populations: Methods and Applications; John Wiley & Sons: Hoboken, NJ, USA, 2013. [Google Scholar]
- Flaming, A.; Canty, M.; Javetski, G.; Lesh, N. The CommCare Evidence Base for Frontline Workers. 2016. Available online: http://www.dimagi.com/wp-content/uploads/2016/06/CommCare-Evidence-Base-July-2016.pdf (accessed on 22 November 2019).
- Silva, J.V.; Reidsma, P.; Laborte, A.G.; Van Ittersum, M.K. Explaining rice yields and yield gaps in Central Luzon, Philippines: An application of stochastic frontier analysis and crop modelling. Eur. J. Agron. 2017, 82, 223–241. [Google Scholar] [CrossRef]
- Banayo, N.P.; Bueno, C.S.; Haefele, S.M.; Desamero, N.V.; Kato, Y. Site-specific nutrient management enhances sink size, a major yield constraint in rainfed lowland rice. Field Crops Res. 2018, 224, 76–79. [Google Scholar] [CrossRef]
- Buresh, R.J.; Castillo, R.L.; Torre, J.C.D.; Laureles, E.V.; Samson, M.I.; Sinohin, P.J.; Guerra, M. Site-specific nutrient management for rice in the Philippines: Calculation of field-specific fertilizer requirements by Rice Crop Manager. Field Crops Res. 2019, 239, 56–70. [Google Scholar] [CrossRef]
- Sharma, R.P.; Pathak, S.K.; Singh, R.C. Effect of nitrogen and weed management in direct-seeded rice (Oryza sativa) under upland conditions. Indian J. Agron. 2007, 52, 114–119. [Google Scholar]
- Haden, V.R.; Xiang, J.; Peng, S.; Bouman, B.A.; Visperas, R.; Ketterings, Q.M.; Duxbury, J.M. Relative effects of ammonia and nitrite on the germination and early growth of aerobic rice. J. Plant Nutr. Soil Sci. 2011, 174, 292–300. [Google Scholar] [CrossRef]
- Peng, S.; Buresh, R.J.; Huang, J.; Zhong, X.; Zou, Y.; Yang, J.; Cui, K. Improving nitrogen fertilization in rice by site specific N management. A review. Agron. Sustain. Dev. 2010, 30, 649–656. [Google Scholar] [CrossRef]
- Qi, X.; Nie, L.; Liu, H.; Peng, S.; Shah, F.; Huang, J.; Sun, L. Grain yield and apparent N recovery efficiency of dry direct-seeded rice under different N treatments aimed to reduce soil ammonia volatilization. Field Crop. Res. 2012, 134, 138–143. [Google Scholar] [CrossRef]
- Fairhurst, T.; Witt, C.; Buresh, R.; Dobermann, A. Rice: A Practical Guide to Nutrient Management; International Rice Resarch Institute (IRRI): Los Baños, Philippines, 2007. [Google Scholar]
- Banayo, N.P.; Haefele, S.M.; Desamero, N.V.; Kato, Y. On-farm assessment of site-specific nutrient management for rainfed lowland rice in the Philippines. Field Crops Res. 2018, 220, 88–96. [Google Scholar] [CrossRef]
- Lwin, H.Y.; Myint, T.; Than, S.M.; Aung, N.M.; San, C.C.; Htut, T. Role of Fertiliser Policy in Transforming Agriculture of Myanmar. International Food Policy Research Institute (IFPRI): Policy Note 01. Department of Agricultural Economics, Yezin Agricultural University. 2014. Available online: http://www.ifpri.org/publication/role-fertilizer-policy-transforming-agriculture-myanmar (accessed on 20 November 2019).
- Nyi, T.; Weatherley, A.J.; Farquharson, R. Nitrogen Content and Fertilizer Quality in Central Myanmar. In Proceedings of the Soil Fertility and Fertilizer Management Conference, IFDC, Nay Pyi Taw, Myanmar, 18–19 October 2017. [Google Scholar]
- Zhou, Y.; Yang, H.; Mosler, H.-J.; Abbaspour, K.C. Factors affecting farmers’ decisions on fertiliser use: A case study for the Chaobai watershed in northern China. J. Sustain. Dev. 2010, 4, 80–102. [Google Scholar]
- Pandey, D.T. Methods of Fertilizer Application. Available online: http://agropedia.iitk.ac.in/content/methods-fertilizer-application-0 (accessed on 5 November 2020).
- Rahman, K.M.A.; Zhang, D. Effects of fertilizer broadcasting on the excessive use of inorganic fertilizers and environmental sustainability. Sustainability 2018, 10, 759. [Google Scholar] [CrossRef] [Green Version]
- FAO. Global Agriculture towards 2050. In Proceedings of the How to Feed the World 2050, High-level Expert Forum, Rome, Italy, 12–13 October 2009. [Google Scholar]
- Deckers, J.; Steines, E. State of the art on soil-related geo-medical issues in the world. Adv. Agron. 2004, 84, 1–35. [Google Scholar]
- Liu, X.; Zhang, W.; Zhang, M.; Ficklin, D.L.; Wang, F. Spatio-temporal variations of soil nutrients influenced by an altered land tenure system in China. Geoderma 2009, 152, 23–34. [Google Scholar] [CrossRef]
- Reetz, H.F.; Heffer, P.; Bruulsema, T.W. 4R nutrient stewardship: A global framework for sustainable fertilizer management. In Managing Water and Fertilizer for Sustainable Agricultural Intensification; Drechsel, P., Heffer, P., Magen, H., Mikkelsen, R., Wichelns, D., Eds.; International Fertilizer Industry Association (IFA): Paris, France; International Water Management Institute (IWMI): Sri Lanka, Columbia; International Plant Nutrition Institute (IPNI): Peachtree Corners, GA, USA; International Potash Institute (IPI): Horgen, Switzerland, 2015. [Google Scholar]
- Aung, H.H.; Aung, T.H.; Aung, T.T.; Cho, A.A.; Naing, T.; Kyaw, M.M.; Hlyan, Z.H. Urea deep placement technology and its extension to farmers in Myanmar. In Proceedings of the Myanmar Soil Fertility and Fertilizer Management, Nay Pyi Taw, Myanmar, 18–19 October 2017; Available online: https://ifdc.org/wp-content/uploads/2018/03/Conference-Proceedings-3-22-2018.pdf (accessed on 7 December 2020).
- Ogeto, R.M.; Jiong, G. Fertilizer underuse in Sub Saharan Africa: Evidence from Maize. J. Agric. Econ. Dev. 2019, 7, 11–28. [Google Scholar]
- Karkia, M.; Pantha, B.P.; Subedia, P.; GCa, A.; Regmi, R. Effect of different doses of nitrogen on production of spring maize in Gulmi, Nepal. Sustain. Food Agric. 2020, 1, 1–5. [Google Scholar] [CrossRef]
- Adhikari, P.; Baral, B.R.; Shrestha, J. Maize response to time of nitrogen application and planting seasons. J. Maize Res. Dev. 2016, 2, 83–93. [Google Scholar] [CrossRef] [Green Version]
- Jayne, T.S.; Rashid, S. Input subsidy programs in sub-Saharan Africa: A synthesis of recent evidence. Agric. Econ. 2013, 44, 547–562. [Google Scholar] [CrossRef]
- Liverpool-Tasie, L.S.O.; Omonona, B.T.; Sanou, A.; Ogunleye, W.O. Is increasing inorganic fertilizer use for maize production in SSA a profitable proposition? Evidence from Nigeria. Food Policy 2017, 67, 41–51. [Google Scholar] [PubMed] [Green Version]
- Scheiterle, L.; Birner, R. Assessment of Ghana’s comparative advantage in maize production and the role of fertilizers. Sustainability 2018, 10, 4181. [Google Scholar] [CrossRef] [Green Version]
- Evenson, R.E.; Gollin, D. Assessing the impact of the Green Revolution, 1960 to 2000. Science 2003, 3000, 758–762. [Google Scholar] [CrossRef] [Green Version]
- Denning, G.; Kabambe, P.; Sanchez, P.; Malik, A.; Flor, R.; Harawa, R.; Nkhoma, P.; Zamba, C.; Banda, C.; Magombo, C.; et al. Input subsidies to improve smallholder maize productivity in Malawi: Toward an African green revolution. PLoS Biol. 2009, 7, e1000023. [Google Scholar] [CrossRef] [Green Version]
- Anderson, J.; Dillon, J.L.; Hardaker, B. Agricultural Decision Analysis; Iowa State University Press: Ames, IA, USA, 1977. [Google Scholar]
- Anderson, J.; Hardaker, B. Economic Analysis in Design of New Technologies for Small Farmers. In Economics and the Design of Small-Farmer Technology; Valdes, A., Scobie, G.M., Dillon, J.L., Eds.; Iowa State University Press: Ames, IA, USA, 1979. [Google Scholar]
- Roumasset, J.A. Rice and Risk: Decision-Making among Low-Income Farmers; Elsevier: Amsterdam, Netherlands, 1976. [Google Scholar]
- Kennedy, J.O.S. An alternative method for deriving optimal fertiliser rates: Comment and extension. Rev. Mark. Agric. Econ. 1981, 49, 203–209. [Google Scholar] [CrossRef]
- Lanzer, E.A.; Paris, Q. A new analytical framework for the fertilization problem. Am. J. Agric. Econ. 1981, 63, 93–103. [Google Scholar] [CrossRef]
- Anderson, J.R. One more or less cheer for optimality. J. Aust. Inst. Agric. Sci. 1975, 41, 195–197. [Google Scholar]
- Pannell, D.J. Flat earth economics: The far-reaching consequences of flat payoff functions in economic decision making. Rev. Agric. Econ. 2006, 28, 553–566. [Google Scholar] [CrossRef]
- Farquharson, R.J. Production response and input demand in decision making: Nitrogen fertiliser and wheat growers. Australas. Agribus. Rev. 2006, 14, 1–11. [Google Scholar]
- Keynes, J.M. The General Theory of Employment, Interest and Money; Palgrave Macmillan: London, UK, 1936. [Google Scholar]
- Jardine, R. Two cheers for optimality. J. Aust. Inst. Agric. Sci. 1975, 41, 30–34. [Google Scholar]
- Feder, G. Farm size, risk aversion and the adoption of new technology under uncertainty. Oxf. Econ. Pap. 1980, 32, 263–283. [Google Scholar] [CrossRef]
- Harwood, J.; Heifner, R.; Coble, K.; Perry, J.; Somwaru, A. Managing Risk in Farming: Concepts, Research and Analysis; U.S. Department of Agriculture, Economic Research Service: Washington, DC, USA, 1999.
- Roosen, J.; Hennessy, D.A. Tests for the role of risk aversion on input use. Am. J. Agric. Econ. 2003, 85, 30–43. [Google Scholar] [CrossRef] [Green Version]
- Hardaker, J.B.; Lien, G. Rationalising risk assessment: Applications to agricultural business. Australas. Agribus. Rev. 2007, 15, 75–93. [Google Scholar] [CrossRef]
- Dillon, J.L. An expository review of Bernoullian decision theory in agriculture: Is utility futility? Rev. Mark. Agric. Econ. 1971, 39, 3–80. [Google Scholar] [CrossRef]
- Marra, M.; Pannell, D.J.; Ghadim, A.A. The economics of risk, uncertainty and learning in the adoption of new agricultural technologies: Where are we on the learning curve? Agric. Syst. 2003, 75, 215–234. [Google Scholar] [CrossRef]
- Robert, M.; Thomas, A.; Bergez, J.E. Processes of adaptation in farm decision-making models. A review. Agron. Sustain. Dev. 2016, 36, 64–79. [Google Scholar] [CrossRef] [Green Version]
- Dillon, J.L. Interpreting systems simulation output for managerial decision making. In Systems Analysis in Agricultural Management; Dent, J.B., Anderson, J.R., Eds.; The Griffin Press: Adelaide, Australia, 1971. [Google Scholar]
- Samuelson, W.F.; Marks, S.G. Managerial Economics; John Wiley & Sons, Inc.: Hoboken, NJ, USA, 2015. [Google Scholar]
- Nuthall, P.L.; Old, K.M. Intuition, the farmers’ primary decision process. A review and analysis. J. Rural Stud. 2018, 58, 28–38. [Google Scholar] [CrossRef]
- Gladwin, C.H. A theory of real-life choice: Applications to agricultural decision making. In Agricultural Decision Making; Barlett, P.F., Ed.; Academic Press: New York, NY, USA, 1980; pp. 45–85. [Google Scholar]
- Backus, C.B.G.; Eidman, R.V.; Diikhuizen, A.A. Farm decision making under risk and uncertainty. Neth. J. Agric. Sci. 1997, 45, 307–328. [Google Scholar] [CrossRef]
- Thind, H.S.; Singh, Y.; Sharma, S.; Goyal, D.; Singh, V.; Singh, B. Optimal rate and schedule of nitrogen fertilizer application for enhanced yield and nitrogen use efficiency in dry-seeded rice in north-western India. Arch. Agron. Soil Sci. 2018, 64, 196–207. [Google Scholar] [CrossRef]
- IFDC. Soil Fertility and Fertilizer Management Strategy for Myanmar. 2018. Available online: https://ifdc.org/wp-content/uploads/2018/11/A-Soil-Fertility-and-Fertilizer-Management-Strategy-for-Myanmar-11-16-2018.pdf (accessed on 21 November 2020).
- MOALI. Myanmar Agriculture Development and Investment Plan (2018-19~2022-23). 2018. Available online: https://www.lift-fund.org/download/file/fid/3787 (accessed on 22 November 2020).
- Holden, S.T. Fertilizer and sustainable intensification in Sub-Saharan Africa. Glob. Food Secur. 2018, 18, 20–26. [Google Scholar]
- Taylor, S.J. A review of Sustainable Development Principles: Centre for Environmental Studies; University of Pretoria: Hatfield, South Africa, 2016. [Google Scholar]
- Porter, M.E.; van der Linde, C. Toward a new conception of the environment competitiveness relationship. J. Econ. Perspect. 1995, 9, 97–118. [Google Scholar] [CrossRef]
- Mensah, J. Sustainable development: Meaning, history, principles, pillars, and implications for human action: Literature review. Cogent Soc. Sci. 2019, 5, 1653531. [Google Scholar] [CrossRef]
- Ma, X.; Jiang, Q. How to balance the trade-off between economic development and climate change? Sustainability 2019, 11, 1638. [Google Scholar] [CrossRef] [Green Version]
- LIFT. Annual Report 2014: Myanmar; Livelihood and Food Security Trust Fund (LIFT). 2014. Available online: https://www.lift-fund.org/sites/lift-fund.org/files/uploads/Publications/%21LIFT_AR%202014_long-web.pdf (accessed on 22 November 2019).
- Wei, Y.; Davidson, B.; Chen, D.; White, R. Balancing the economic, social and environmental dimensions of agro-ecosystems: An integrated modeling approach. Agric. Ecosyst. Environ. 2009, 13, 263–273. [Google Scholar]
- AQUASTAT. Irrigation in Southern and Eastern Asia in figures—AQUASTAT Survey. 2011. Available online: http://www.fao.org/nr/water/aquastat/countries_regions/mmr/MMR-CP_eng.pdf (accessed on 5 January 2020).
- Tun, T.; Kennedy, A.; Nischan, U. Promoting Agricultural Growth in Myanmar: A Review of Policies and Assessment of Knowledge Gaps. International Food Policy Research Institute (IFPRI). Working Paper 07. Department of Agricultural, Food, and Resource Economics, Michigan State University. 2015. Available online: http://www.ifpri.org/publication/promoting-agricultural-growth-myanmar-review-policies-and-assessment-knowledge-gaps (accessed on 22 November 2019).
- Sonntag, B.H.; Norse, D. Impediments to Sustainable Agriculture in China; Australian Centre ForInternational Agricultural Research: Canberra, Australia, 2005. [Google Scholar]
- Janvry, A.D.; Emerick, K.; Sadoulet, E.; Dar, M. The Agricultural Technology Adoption Puzzle: What Can We Learn from Field Experiments? FERDI Working paper 178. Policy Brief. Fondation Pour Les Etudes et Recherges Sur Le Development International (FERDI). 2016. Available online: https://ferdi.fr/dl/df-fp2tipEP79TxRtujbBYbr5Ke/ferdi-p178-the-agricultural-technology-adoption-puzzle-what-can-we-learn.pdf (accessed on 5 December 2020).
- Than, S.M.; Thar, S.P.; Ramilan, T.; Farquharson, R.; Aung, N.M. Economic and social issues for fertiliser decisions of smallholder farmers in Myanmar. In Proceedings of the Myanmar Soil Fertility and Fertiliser Management Conference, IFDC, Nay Pyi Taw, Myanmar, 18–19 October 2017; Available online: https://ifdc.org/wp-content/uploads/2018/03/Conference-Proceedings-3-22-2018.pdf (accessed on 7 December 2020).
- World Bank. Myanmar Agricultural Development Bank: Initial Assessment and Restructuring Options. 2014. Available online: http://documents1.worldbank.org/curated/en/241951468060547171/pdf/866300Revised0000MADB0Final0April08.pdf (accessed on 18 December 2020).
- Fang, P.; Belton, B. Maize Production, Farm Size, and Tied Credit in Southern Shan State, Myanmar. 2020. Available online: https://papers.ssrn.com/sol3/papers.cfm?abstract_id=3684540 (accessed on 18 December 2020).
- Tadesse, M. Fertilizer adoption, credit access, and safety nets in rural Ethiopia. Agric. Financ. Rev. 2014, 74, 290–310. [Google Scholar] [CrossRef]
- Cunningham, W.; Munoz, R. Myanmar’s Future Jobs: Embracing Modernity. World Bank Group. 2017. Available online: http://documents.worldbank.org/curated/en/958621536141390299/pdf/129754-Myanmar-Future-Jobs-Main-Report-Final.pdf (accessed on 22 November 2019).
Figure 1.
Study area, townships, and trial sites in central Myanmar.

Figure 2.
Split application of fertilizer based on the type of crop and fertilizer.

Figure 3.
Average fertilizer application rates for each number of split applications at different times for monsoon rice (A), summer rice (B), and maize (C); DAP = days after planting; DAE = days after emergence.
Figure 3.
Average fertilizer application rates for each number of split applications at different times for monsoon rice (A), summer rice (B), and maize (C); DAP = days after planting; DAE = days after emergence.

Figure 4.
Distribution of urea fertilizer application rates by surveyed farmers compared with national recommendation (----- represents the national recommended urea fertilizer application rates from Department of Agriculture (DoA) and Ministry of Agriculture and Irrigation (MOAI)).
Figure 4.
Distribution of urea fertilizer application rates by surveyed farmers compared with national recommendation (----- represents the national recommended urea fertilizer application rates from Department of Agriculture (DoA) and Ministry of Agriculture and Irrigation (MOAI)).

Figure 5.
Timing of fertilizer application practices by surveyed rice farmers compared to “good management practices”. Graphs (A–F) refer to fertilizer management practices. Green columns represent practices that are aligned with the generalized “good management practices” and red columns represent those not aligned.


Table 1.
Recommended fertilizer application rates from national government agricultural agencies.
| Recommended Fertilizer Application Rates from Land Use Division, DoA (2020) | |||||
| Crop | Soil Test Value | Urea | T Super | Potash | |
| kg N/ha | kg P2O5/ha | kg K2O/ha | |||
| Rice | Low | 102 | 27 | 117 | |
| Medium | 90 | 22 | 59 | ||
| High | 57 | 11 | 15 | ||
| Maize | Low | 187 | 92 | 152 | |
| Medium | 176 | 86 | 95 | ||
| High | 142 | 27 | 22 | ||
| Recommended Fertilizer Application Rates from Agricultural Extension Division, [25] | |||||
| Crop | Application | Manure | Urea | T Super | Potash |
| Ton/ha | kg N/ha | kg P2O5/ha | kg K2O/ha | ||
| Rice | Basal | 2 to 6 | 51 | ||
| Split (3 times) | 86 | 112 | |||
| Maize | Basal | 7 | 29 | 57 | 37 |
| Split (2 times) | 57 | 36 | |||
Table 2.
Generalized “good management practices” for rice fertilizer amounts and timing.
| “Good Practice” | Threshold | Supporting References |
|---|---|---|
| 1. Limit early N applications | Apply <1 third of applied N before 21 days (if direct seeded) or 14 days (if transplanted) after planting. | [28,46,47,48,49,50,51,52] |
| 2. Avoid late N applications | Apply <5% of N < 55 days before crop maturity for non-hybrid variety. | [47,53] |
| 3. Split apply N | Apply N at least three times (including basal application). | [28,46,47,48,53] |
| 4. Apply N at panicle initiation | Apply 20 to 60% of applied N between 55 to 65 days before crop maturity. | [47,54] |
| 5. Apply P early | Apply all P within 14 days of transplanting or 21 days of direct seeding. | [25,53] |
| 6. Apply P once | Apply P once (including basal application). | [25,53] |
Table 3.
Perceptions about fertilizers.
| Fertilizer | Question | Response | % Overall |
|---|---|---|---|
| Users (n = 594) | Do you think fertilizer increases crop yield? | Yes | 93% |
| No | 6% | ||
| Do not Know | 1% | ||
| Do you want to use more fertilizers? | Yes | 72% | |
| No | 28% | ||
| Is fertilizer quality important? | Yes | 99% | |
| No | 1% | ||
| Are you happy with the quality of the fertilizers you are currently using? | Yes | 89% | |
| No | 11% | ||
| Who makes fertilizer decisions? | Male | 55% | |
| Female | 12% | ||
| Both | 33% | ||
| Non-users (n = 6) | Do you want to start using fertilizers? | Yes | 33% |
| No | 67% |
Table 4.
Farmers’ response to fertilizer application practices.
| Questions | Response (%) | ||||
|---|---|---|---|---|---|
| Strongly Agree | Agree | Neither Agree/Disagree | Disagree | Strongly Disagree | |
| Do you think you can receive higher yield with basal application of fertilizer? | 13% | 62% | 1% | 23% | 1% |
| Do you think it is best to use split application of fertilizer? | 23% | 73% | 1% | 3% | 0% |
| Do you think urea fertilizer boosts plant growth and tillering? | 20% | 69% | 1% | 10% | 0% |
Table 5.
Factors affecting farmers’ decisions on fertilizer.
| Questions | Responses | (%) |
|---|---|---|
| How do you decide what type of fertilizer to use? | Use popular brands | 45% |
| Use what neighboring farmers are using | 28% | |
| Use what fertilizer retailers suggest | 12% | |
| Low price | 9% | |
| Use what agricultural extension officers suggest | 6% | |
| How do you make decision on how much or how often to apply fertilizer? | Personal decision | 42% |
| Suggestion from other farmers | 24% | |
| Recommendation from fertilizer companies | 15% | |
| Recommendation from agricultural extension officers | 17% | |
| Fertilizer package labels | 2% |
Table 6.
Basal compound fertilizer and manure applications compared to recommended rates.
| Crops | Farmer Application Rates | Recommended Application Rates a | ||||
|---|---|---|---|---|---|---|
| Manure Ton/ha | Compound Kg NPK/ha | Manure Ton/ha | N | P2O5 | K2O | |
| Monsoon Rice | 1.4 | 14 | 2 to 6 | 51 | ||
| Summer Rice | 1.2 | 13 | 2 to 6 | 51 | ||
| Maize | 2.1 | 17 | 7 | 29 | 57 | 37 |
a From Table 1.
Publisher’s Note: MDPI stays neutral with regard to jurisdictional claims in published maps and institutional affiliations. |
© 2021 by the authors. Licensee MDPI, Basel, Switzerland. This article is an open access article distributed under the terms and conditions of the Creative Commons Attribution (CC BY) license (http://creativecommons.org/licenses/by/4.0/).
Share and Cite
MDPI and ACS Style
Thar, S.P.; Farquharson, R.J.; Ramilan, T.; Coggins, S.; Chen, D. Recommended vs. Practice: Smallholder Fertilizer Decisions in Central Myanmar. Agriculture 2021, 11, 65. https://doi.org/10.3390/agriculture11010065
AMA Style
Thar SP, Farquharson RJ, Ramilan T, Coggins S, Chen D. Recommended vs. Practice: Smallholder Fertilizer Decisions in Central Myanmar. Agriculture. 2021; 11(1):65. https://doi.org/10.3390/agriculture11010065
Chicago/Turabian StyleThar, So Pyay, Robert J. Farquharson, Thiagarajah Ramilan, Sam Coggins, and Deli Chen. 2021. "Recommended vs. Practice: Smallholder Fertilizer Decisions in Central Myanmar" Agriculture 11, no. 1: 65. https://doi.org/10.3390/agriculture11010065
Note that from the first issue of 2016, this journal uses article numbers instead of page numbers. See further details here.