
Utilization of Mango, Apple and Banana Fruit Peels as Prebiotics and Functional Ingredients


School of Agriculture and Food, Faculty of Veterinary and Agricultural Sciences, The University of Melbourne, Parkville, VIC 3010, Australia
*
Author to whom correspondence should be addressed.
Agriculture 2021, 11(7), 584; https://doi.org/10.3390/agriculture11070584
Submission received: 24 May 2021
/
Revised: 19 June 2021
/
Accepted: 22 June 2021
/
Published: 24 June 2021
(This article belongs to the Section Agricultural Product Quality and Safety)
Abstract
:Among the waste by-products generated by the fruit industry (peels, seeds, and skins), fruit peel constitutes the major component. It is estimated that fruit peel accounts for at least 20% of the fresh fruit weight. Fruit peels are considered as major sources of dietary fiber and anticipated to be successfully utilized as prebiotics. This study examined the chemical composition, functional properties and the prebiotic effects of three major tropical fruit peels (apple, banana and mango). The prebiotic effect was tested using three commercial probiotic strains (Lactobacillus rhamnosus, L. casei and Bifidobacterium lactis) individually and in combination. Each probiotic culture was fortified with different concentration (0%, 2% and 4%) of selected fruit peel powder (FPP). Results revealed that all tested FPP significantly (p < 0.05) enhanced the probiotics viable counts, which reached >10 logs after 24 h of incubation. However, the concentration of 2% and 4% FPP showed no significant differences (p > 0.05) on the probiotic viable counts. Additionally, the prebiotic effects of FPP were the same when applied to individual and mixed cultures. This investigation demonstrated that small amount (2%) of apple, banana and mango peel powder could be successfully utilized as prebiotics to enhance the growth of lactic acid bacteria (LAB). Additionally, the studied physical and chemical characteristics of FPP demonstrated their potential applications in the food and pharmaceutical industries as functional ingredients.
1. Introduction
Fruits play crucial roles in human diets and health, and the demand for such commodities increases continuously. However, huge amounts of various fruit waste by-products (peel, core and damaged fruits) are generated during fresh consumption and food processing [1]. Most fruits contain approximately 10–20% peel, which are discarded as wastes during the post-harvest handling and industrial processing [2]. These fruit wastes can be altered into a promising source of functional compounds because of their favorable nutritional and functional properties. Various valuable and functional components have been identified in the fruit peels (FP) including, polysaccharides, polyphenols, dietary fibers (DF) and flavor components [3]. The recovery of these highly valuable compounds could be economically attractive as these ingredients may be considered as sources of potential prebiotics and antioxidants, which are beneficial to human health as well as the food and pharmaceutical industries. For example, the byproducts such as peels of mango (Mangifera indica), apple (Malus domestica) and banana (Musa acuminata) have been extensively applied as functional food ingredient in various industrial formulations such as bakery and confectionary products [3,4,5,6]. In addition, the total DF content in fruit waste by-products can range from 40–90% of their dry weight [7], and the consumption of DF has associations with reduced risk of heart ailments and certain cancer types [8]. For example, mango fruit peel accounts for about 20% of the fruit and is reported to be the main source (28–78%) of mango total dietary fiber [9]. The DF can potentially be used in human diet as prebiotics to enhance the growth, survival and metabolic functions of beneficial gut microflora, including Lactobacillus spp. and Bifidobacterium spp. [10], and these two bacteria are recognized as the most abundant and widely studied probiotic lactic acid bacteria (LAB) [11].
This study aimed to examine the chemical composition of three common fruit peels powders (FPP) of apple, banana and mango and investigate their suitability as prebiotics. The fermentative ability and growth of three strains of probiotic LAB: L. casei and L. rhamnosus (LGG), and B. animalis subsp. lactis (BB-12) both individually and in mixed cultures were tested in the presence and absence of the three types of FPP.
2. Materials and Methods
2.1. Fruit Peels and Probiotic Cultures
The ripen fruits of mango (cultivar Kensington pride), apple (cultivar Pink lady) and banana (cultivar Cavendish) were bought from a local fruit market in Melbourne, Australia. The pure strains of probiotic LAB of Lactobacillus casei (431) and L. rhamnosus (LGG), and Bifidobacterium animalis subsp. lactis (BB-12) were kindly provided by Chr. Hansen (Chr. Hansen Pty. Ltd., Melbourne, VIC, Australia).
2.2. Chemicals and Reagents
All the media, reagents and solvents were analytical grade purchased from Thermo Fisher Scientific (Thermo Fisher Scientific Pty. Ltd., Melbourne, VIC, Australia) and ChemSupply (ChemSupply Pty. Ltd., Gillman, SA, Australia).
2.3. Preparation of Fruit Peel Powders (FPP)
The fruits (5 ± 1 kg) were washed with tap water and peeled by a knife, cut into small pieces (about 1 × 1 cm) and frozen at −20 °C followed by freeze drying (FD3 Freeze Drier, Dyanavac Engineering, Melbourne, Australia) at −50 °C till constant weight. The freeze-dried peels were ground into powder using a coffee blender (MultiGrinder II, Sunbeam, Sydney, Australia). The generated FPP was then sieved using mesh size 250 μm to maintain a uniform particle size and avoid sedimentation when incorporated in the culture media, packed in airtight bags and stored in a desiccator until further use [12].
2.4. Proximate Composition of FPP
Moisture, crude fat and total ash were determined following the AOAC methods (AOAC, 2000). A precise weight of each FPP sample (about 1 g) in triplicate was placed in pre-weighed crucibles and dried in hot air oven (Qualtex Universal series 2000, Watson victor Ltd., Brisbane, QLD, Australia). The temperature was set at 102 °C until constant weight was obtained, and the moisture content was calculated as percentage.
The crucibles containing oven dried samples were carbonized inside an enclosed cabinet over a Bunsen burner until it ceased smoking. The charred crucibles were then carefully positioned in the muffle furnace Tetlow MF3 (Tetlow kilns and furnaces Pty. Ltd., Melbourne, VIC, Australia) set at 550 °C for 5 h. The ashed samples were weighed immediately to prevent the moisture absorption, and the ash content was calculated as percentage.
A Soxhlet extractor housing a round bottom flask and a water bath was used to determine fat contents in the FPP. The flask was filled with 100 mL n-hexane and the water bath temperature was set at 80 °C. After about 2–3 h of extraction, the solvent containing the fat extract was fully evaporated using a vacuum rotary evaporator (safeGuardPro TM 1800) at 70 °C. The fat percentage was measured using the expression below:
w2 = weight of flask containing extracted oil, w1 = weight of empty flask, S = sample weight.
FPP were analysed for total protein using nitrogen combustion (Dumas method) as described in the official method (AOAC, 2000). In brief, the samples (0.15 ± 0.1 g) were loaded into the furnace (950 °C) (LECO TruMac CN) for rapid combustion. These products were further swept through hot copper for the conversion of nitrogen oxides to nitrogen, which was then quantitated through the process of thermal conductivity. Total protein (%) was then calculated by employing a conversion factor of 6.25.
Total dietary fiber (TDF) of the FPP was analyzed following the enzymatic gravimetric method (AOAC, 2000). In this method, triplicate portions of FPP (~1 g) were partially digested with α-amylase followed by enzymatic digestion with protease and amyloglucosidase for the removal of protein and starch. Soluble fiber was precipitated using ethanol and the resulting residue was filtered, washed, dried and weighed. The samples were then analyzed for protein and ash. TDF was calculated as weight of residue with weight of protein and ash subtracted and reported as percentage of sample weight.
The total available carbohydrates were estimated following the method of Horwitz [13]. Total carbohydrates contents = 100 − (% moisture + % crude protein + % crude fat + % total ash + % total dietary fiber).
2.5. Antioxidant Properties of FPP
2.5.1. Preparation of Extract
FPP (1 g ± 0.2) was extracted in 20 mL of 30% ethanol. The mix was subjected to homogenization and incubation with shaking (120 rpm, 4 °C for 16 h. Thereafter, the contents were centrifuged at 5000 rpm, 4 °C for 20 min and the supernatant was collected and stored at −20 °C for further analysis. Extraction and subsequent phenolic determinations were carried out according to the method described by Peng, et al. [14].
2.5.2. Total Polyphenolic Content (TPC)
An aliquot 25 µL was mixed with Folin Ciocalteu reagent (25 µL), 200 µL milli-Q water and 25 µL sodium carbonate (10%, w/v) in a 96-well microplate. The contents were incubated at room temperature for 60 min and the absorbance was measured at 760 nm by using a Multiskan® Go spectrophotometer (Thermo Fisher Scientific, Waltham, MA, USA). The sample absorbance was calibrated by comparing with a standard curve that was generated using gallic acid solution (0–200 µg/mL). Total polyphenolic content (TPC) of the samples was expressed as mg GAE/g (on dry weight basis).
2.5.3. Total Flavonoid Content (TFC)
The total flavonoid content (TFC) in fruit peel powder extracts was analysed using modified colorimetric method of Ali, et al. [15]. A known dilution of extract (80 µL) was mixed with 5% sodium nitrite solution (120 µL) and 80 µL of 2% aluminium chloride in a microplate (96-well). The mixture was incubated for 2.5 h at room temperature followed by reading the absorbance at 440 nm using a microplate reader. The quantification was performed for triplicate extracts of samples and compared to a standard curve of prepared quercetin dilutions (0–50 µg/mL). The TFC of the sample extracts was expressed as milligram quercetin equivalents per gram dry sample (mg QE/g dw).
2.5.4. ABTS Scavenging Capacity
The preparation of 2,2′-azino-bis(3-ethylbenzothiazoline-6-sulfonic acid) (ABTS) solutions and methodology was adopted from Iqbal, et al. [16]. ABTS (7 mM) and potassium persulfate (140 mM) methanolic solutions were mixed and allowed to stand in dark at room temperature for 12–16 h to generate ABTS+ cation radical. Further dilutions of the ABTS+ solution was carried out until it attained an absorbance of 0.70 ± 0.02 at 734 nm. After addition of 10 µL sample to 290 µL ABTS+ solution and the absorbance was measured following incubation for 6 min. An aqueous solution of ascorbic acid (0–200 µg/mL) was used to generate the standard curve and the samples were quantified based on that.
2.5.5. Diphenyl-2-Picrylhydrazyl (DPPH) Scavenging Assay
The scavenging activity of diphenyl-2-picrylhydrazyl (DPPH) radicals of fruit peel powder extracts was recorded according to the method reported by Ali, et al. [15]. An assay was performed in a 96-well plate where 40 µL sample extract was mixed with 260 µL 0.1 M DPPH solution in methanol and the reaction mixture were subjected to incubation at 25 °C for 30 min. After incubation, the absorbance was read at 517 nm. Ascorbic acid aqueous solution (0–50 µg/mL) was used to plot the calibration curve at R2 = 0.999. Quantification of the sample was performed as milligram ascorbic acid equivalent per gram sample (mg AAE/g dw).
2.6. Water Holding Capacity and Oil Holding Capacity of FPP
Water holding capacity (WHC) and oil holding capacity (OHC) of FPP were measured according to the method described by Salih, et al. [17]. Briefly, 30 mL of Milli-Q water for WHC or 30 mL commercial olive oil for OHC were added to exactly 1 g of the FPP samples, vortexed for 1 min and stored at room temperature for 24 h. The tubes were centrifuged at 3000× g for 20 min (Allegra® X-12R Centrifuge, Beckman Coulter, NSW, Australia). The supernatant was decanted, and weight of the residue was measured and compared with the original weight. WHC and OHC were calculated as g of water or oil absorbed by one g dry samples, respectively.
2.7. Solubility of FPP
The solubility (Sol.) of FPP was determined following the method described by Garcia-Amezquita, et al. [7]. Briefly, the samples (1 g) were suspended in Milli-Q water in 50 mL beaker and stirred for 3 h at 25 °C. The supernatant and pellet were separated by centrifugation at 3000× g at 22 °C for 20 min (Allegra® X-12R Centrifuge, Beckman Coulter). The collected pellet was then washed with Milli-Q water using a Whatman No. 1 filter paper. The pellet and filter paper were oven dried for 24 h at 60 °C and the solubility was calculated with the following equation:
where, Sol. is the percentage (%) of FPP solubility, WS and WDP are the weight (g) of sample and dried pellet (excluded filter paper), respectively.
2.8. Color Measurement of FPP
The color of the freeze-dried FPP was measured using a tristimulus portable CR-400 colorimeter (Minolta chromameter CR-400, Osaka, Japan). The spectral software was set at L*, a* and b* mode according to Khandaker, et al. [18]. L* is indicative of lightness or brightness, a* indicates chromacity on a green to red axis whereas b* indicates chromacity on a blue to yellow axis. The numerical values of a* and b* are converted to chroma (C = (a*2 + b*2)½) and hue angle (H° = tan−1 (b*/a*).
2.9. Assessment of the FPP Prebiotic Effect
The strains of Lactobacillus and Bifidobacterium were propagated anaerobically in sterile de Man Rogosa Sharp (MRS) broth at their optimal growth temperature of 37 °C for 24 h and sub-culturing was done twice for 24 h (early stationary phase of growth). Prior to each assay, the respective strain was grown in MRS broth for 20–24 h and the cultures were harvested after centrifugation at 4500× g for 10 min at 4 °C followed by two successive washings with sterile saline solution (Duarte, Rodrigues, da Costa Lima, Lima, Pacheco, Pintado, de Souza Aquino and de Souza) [12]. Remaining stock cultures were stored in the MRS broth containing 40% glycerol and stored at −20 °C.
The apple, banana and mango FPP were assessed for their prebiotic potential using pure strains of LAB in their individual and combined format. The bacterial broth growth medium was enriched with the freeze-dried FPP at concentrations 0% (control), 2% and 4%. The weighed amounts of mango peel powder (MPP), apple peel powder (APP) and banana peel powder (BPP) were added to the bacterial growth broth MRS before sterilization at 121 °C for 30 min using a bench top autoclave (HS-3041 VD, Australia). The sterilized media were cooled to room temperature before inoculation with the tested probiotic cultures. The final prepared MRS broth media included the following nine treatments: apple FPP (MRS-a 0%, MRS-a 2% and MRS-a 4%), banana FPP (MRS-b 0%, MRS-b 2% and MRS-b 4%) and mango FPP (MRS-m 0%, MRS-m 2% and MRS-m 4%). The same procedures were followed with bifidobacteria, with the exception that 0.05% cysteine was added to the growth medium.
The individually activated cultures of L. rhamnosus, L. casei and B. lactis and their mixed cultures (1:1:1 ratios) were inoculated into the prepared MRS broth media containing the known concentrations of FPP. The inoculation was performed in duplicate at a 1:10 ratio. The inoculated media were then incubated anaerobically at 37 °C for various time intervals, i.e., 1–2, 24, 48 and 72 h. Aliquots (1 mL) from each inoculated medium were then aseptically collected and diluted in 9 mL of sterile 0.1% peptone water. Serial 10-fold dilutions were then made and 100 μL from each dilution was subsequently spread plated onto the MRS agar (and MRS agar + 0.05% cysteine, in the case of mixed cultures only) and incubated anaerobically at 37 °C (Vieira, et al.) [19].
2.10. Statistical Analysis
General linear model (GLM) analysis of variance (ANOVA) was carried out to examine the effect of multiple groups of the two independent variables (FPP and their concentrations) on the dependent variable (probiotic counts) using Minitab® 8.1 statistical package. Compositional and antioxidant evaluations of fruit peel powder involved the application of one-way ANOVA. Tukey’s test was used to separate the means among various treatments at 95% confidence level.
3. Results and Discussions
3.1. Proximate Composition of Fruit Peel Powder
A proximate analysis can provide valuable information about the chemical composition and helps to assess the quality and possible functional properties of the sample. As expected, data in Table 1 show that freeze-dried FPP contained negligible amounts of moisture ranging from 0.54% to 0.61%. Powders and other products with such low moisture content can have a long shelf life with the least chance for microbial degradation or chemical variations due to lower water activities associated with such low moisture contents (Hausmann, et al.) [20]. Ash content represents the inorganic matter remaining after burning all organic content in a sample (Moniruzzaman, et al.) [21].
Data in Table 1 show that BPP had the highest ash content (16.07%) followed by APP (8.44%) and MPP (3.94%). The ash content in banana peel was significantly (p < 0.05) higher than the amount (6.4–12.8%) reported by Emaga, et al. [22]. Similarly, the ash content in APP was significantly (p < 0.05) larger than the value (1.39%) reported by Romelle, et al. [23]. Such variations in ash contents could be attributed to differences among cultivars, degree of ripening, and climate conditions. For example, Romelle, et al. [23] used Red Delicious apple peel, while Pink Lady cultivar was used in the current study. However, the reported ash contents in mango (3.94%) was close to the value (2.59%) reported by Imran, et al. [24]. Since ash is composed of various types of minerals, such high contents of ash in these FPP suggest their possible use and functional ingredients. For example, FPP can potentially be used as natural source of Ca, Zn and Fe to improve these mineral contents in some diets.
Results from fat quantitation in FPP showed that BPP has the highest amount of crude fat (7.85%), followed by MPP (6.23%) and APP (4.53%). The results of the crude fat content of MPP and BPP were comparable with the findings of Romelle, et al. [23]. However, it was noted that the fat content in BPP reported by these authors (9.96%) was greater than that in the current study (Table 1). Similar to the interpretation of variations in ash contents, differences in fat contents could also be related to various factors including different cultivars, and degree of ripening. The APP showed the lowest fat content among the three tested fruit peel samples. Such low-fat content in apple peel is expected, since apples in general do not contain large amounts of fat [25].
Protein contents in the three analyzed FPP were 7.17%, 2.36% and 2.87% in BPP, APP and MPP, respectively (Table 1). The protein contents in BPP and APP were comparable with the amounts (8.3%) obtained by Morais, et al. [26] in BPP, and (2.80%) reported by Romelle et al. [23] in APP. Likewise, the protein content detected in MPP was in agreement with the crude protein values (2.36%) reported by Imran, et al. [24]. It is vital to mention here that most fruits are low in protein and fat contents [27].
As shown in Table 1, the total dietary fiber in the freeze-dried fruit peel ranged from the highest (47.01%) in MPP to the lowest (19.29%) in APP, with BPP fiber content in the middle (42.39%). The total dietary fiber content found in MPP (47.01%) was within the range (40.6% to 72.5%) reported by Ajila and Rao [28].
Fibers from plant sources are the component of plant cell walls, and made mainly of cellulose, hemicellulose, polysaccharides, and oligosaccharides. Fibers are well known for their health benefit. Barber, et al. [29] reported that increasing dietary fiber intake can reduce the risk of obesity and certain cancer diseases, prevent diabetes, and facilitate healthier bowel function. Consequently, the reported high fiber contents in the tested FPP can have significant application in the food processing industry. For example, fiber can increase the production yield, water holding capacity, and viscosity of various food such as soups and minced meat mix. Fiber can also improve the texture and color of bread and cookies [30].
The reported carbohydrates contents in FPP were 64.83%, 39.56% and 25.98% in BPP, APP and MPP, respectively. It should be emphasized here that carbohydrate contents were assessed by calculation as explained in Section 2.4. These results confirmed the fact that fruit and their peel could be rich sources of fiber and carbohydrates but, less appropriate sources of fat or protein. As fibers were analyzed and reported as total dietary fiber (Section 2.4), the calculated and reported carbohydrates contents represent soluble sugars such as glucose only. Such carbohydrate contents in FPP could also be utilized by microorganisms, producing some short chain fatty acids and potentially contribute to healthier gut microbiota [31]. In general, the variability in the composition of the fruits peels is affected by other factors such as geographic and cultivar variations.
3.2. Antioxidant Properties of Fruit Peel Powder
The antioxidant potential and polyphenolic contents of the three FPP are summarized in Table 2. The results revealed that the three freeze dried fruit peels have varying capacities of total phenolics and antioxidants. The highest concentrations of TPC were detected in MPP (23.49 mg GAE/g dw) whereas the lowest TPC values were exhibited by BPP (1.21 mg GAE/g dw). A significant difference in TPC was observed (p ≤ 0.05) among the tested FPP (Table 2). On the other hand, the highest (p ≤ 0.05) flavonoid contents were found in APP (2.88 mg QE/g dw) followed by MPP (1.91 mg QE/g dw) and BPP (1.06 mg QE/g dw). The TPC values of MPP and TFC of APP and BPP are quite similar to the values reported by Suleria, et al. [32]. Also, they identified a similar trend of escalated TPC values for mango peels as compared to the other fruit peels including apple and banana peels. However, the values of TPC detected for BPP (6.13 ± mg GAE/g dw) and APP (10.82 mg GAE/g dw) by the same authors do not correspond with our findings. These variations in the content of extracted polyphenols from plant matrices could be attributed to the difference in the concentration of extraction solvent used [33]. The present study employed aqueous ethanol as an extraction solvent where, ethyl alcohol improves the solubility of the compounds, while water expedites the elution of bioactive compounds from the plant matrix [34]. A previous study on polyphenol contents of peanut skins investigated the effects of various concentrations of ethanol, and reported that the highest extracted polyphenols were cultivated with 50% ethanol, whereas the TPC values were reported to be reduced as the concentration of ethanol goes beyond 70% [35].
The prospective applications of fruit by-products in the food and medicinal industry is determined by their potential to prevent the oxidation of biomolecules. Considering this fact, the antioxidant potential of FPP was quantified by means of DPPH and ABTS assays. The hydroethanolic extracts of the MPP presented greater antioxidant potential in terms of DPPH and ABTS (5.51 mg AAE/g dw) and (12.37 mg AAE/g dw) respectively, than APP and BPP. Comparison of the antioxidant parameters among tested FPP indicated that MPP had values which were statistically significant (p ≤ 0.05) than others. The least amount of DPPH (0.74 mg AAE/g dw) and ABTS (2.03 mg AAE/g dw) was observed in BPP. Previously, it was reported that the banana peel even at reduced concentrations (DPPH IC50 71.74 µg/mL) could demonstrate excellent antioxidant ability in neutralizing non physiological moieties such as DPPH and ABTS+ [36]. These values of DPPH and ABTS for the tested FPP are comparable to those observed by Suleria, et al. [32].
3.3. Functional Properties and Color of Fruit Peel Powder
3.3.1. Water and Oil Holding Capacities
Water and oil holding capacities and solubility are studied in food functionality owing to their importance in food processing and product development. Data in Table 2 showed that WHCs expressed as g water/g peel powder were 5.94, 2.84 and 1.96 in BPP, MPP and APP, respectively. These results revealed that WHC in banana and mango FPP were significantly (p < 0.05) larger than that of APP (Table 2). Similarly, the fiber contents in BPP and MPP were significantly (p < 0.05) larger than that in APP (Table 1). These findings may indicate that WHC is attributed mostly to the fiber contents. The results of banana peel WHC were in agreement with those mentioned by Salih, et al. [17] who reported that WHC ranged from 1.02 to 7.30 g water/g sample for both banana peel and pulp flours. However, the WHC of mango peel (2.84 g water/g) in this study was lower than those reported by Wanlapa, et al. [37], in which WHC ranged from 5.90 to 6.94 in two different cultivars of mango peel. The WHC of APP agreed with the values reported by Figuerola, et al. [38] which ranged from 1.62 to 1.87 g water/g sample for fiber concentrates of apple pomace. However, these results were significantly (p < 0.05) lower than those (8.12 g water/g sample) obtained by Rana, et al. [39] for freeze dried apple pomace. Such variations in WHC values among various investigations may be due to the differences in the method of analysis, chemical structure, particle size, ionic strength, pH and temperature, which could affect the materials’ hydration properties [40]. Rodríguez-Ambriz, et al. [41] reported that WHC could be related to the physical condition of starch, dietary fiber and protein in the flour. Another study by Alkarkhi, et al. [42] suggested that as starch content is low in banana peel, the higher WHC could be attributed to the presence of protein and dietary fiber.
The OHC in all tested fruit peel powders were smaller than the WHC and ranged from 1.09 (MPP) to 1.04 g oil/g sample (BPP). Additionally, no significant differences (p > 0.05) were found among the OHC values in the three fruit peel samples. The OHC of MPP in the current study was closer to the value reported by Das, et al. [43] for mango kernel flour (0.94 g oil/g sample). Similarly, the OHC of BPP was similar to the finding of Salih, et al. [17]. Such low OHC in the tested fruit peel powders may indicate poor hydrophobic nature. However, as FPPs represented good WHC and smaller OHC, they can function as hydrophilic and hydrophobic at the same time. Consequently, they can be mixed with various oilseed powders and utilized as emulsifiers at a lower cost than other traditionally used emulsifiers such as lecithin.
3.3.2. Solubility
Solubility (Sol.) is among the most important properties that affect food ingredients’ physiochemical and sensory characteristics [44]. The percentage solubility of BPP, APP and MPP were 73.71%, 84.68% and 85.23%, respectively. BPP showed the lowest percentage solubility that was a significantly smaller (p < 0.05) than that of MPP and APP. As all these fruit peel powders were prepared using freeze drying, they are expected to have low bulk and compaction density, which usually contribute to better solubility [45].
3.3.3. Colour of FPP
The color of the product is the principal factor that determines its quality attributes and consumer preferences. Various color parameters of the tested FPP are given in Table 2. The values of L* indicated a significant difference (p < 0.05) among the three FPPs, which were 67.51, 63.21 and 54.43, in MPP, APP and BPP, respectively. The higher L* value in MPP indicated the greater degree of light yellowness as seen also by the positive values of b*. The positive a* values in the FPP indicated a red coloration although not so intense, with the largest value (13.85) in APP (Pink lady variety with reddish color). The L* and b* values in APP were similar to those reported by Henríquez, et al. [46]. However, there were some differences in the reported a*, which represents degree of redness. Such differences might be attributed to the various drying processes and varietal variations. Similarly, the color parameters observed for MPP (L*, a* and b*) were in agreement with those stated by Coelho, et al. [47] with only minor differences. Chroma values are indicative of overall color saturation and reflects color purity. The chroma value was the highest in MPP (39.23) representing more intense yellowish color in MPP in comparison to the intensity of color in BPP (26.97) and APP (26.05) (Table 2).
The hue angle value is measured in degree of the color circle, which ranges from 0 to 360 degrees. The MPP demonstrated highest values of hue angle (80.39) followed by BPP (77.13) and APP (57.87). These values indicate that the colors of the FPP were between yellow (60°) and green (90°). Guine and Barroca [48] observed a similar range of hue angle values for the color of banana fruit at various temperatures.
3.4. Prebiotic Effects of Tested Fruit Peel Powders
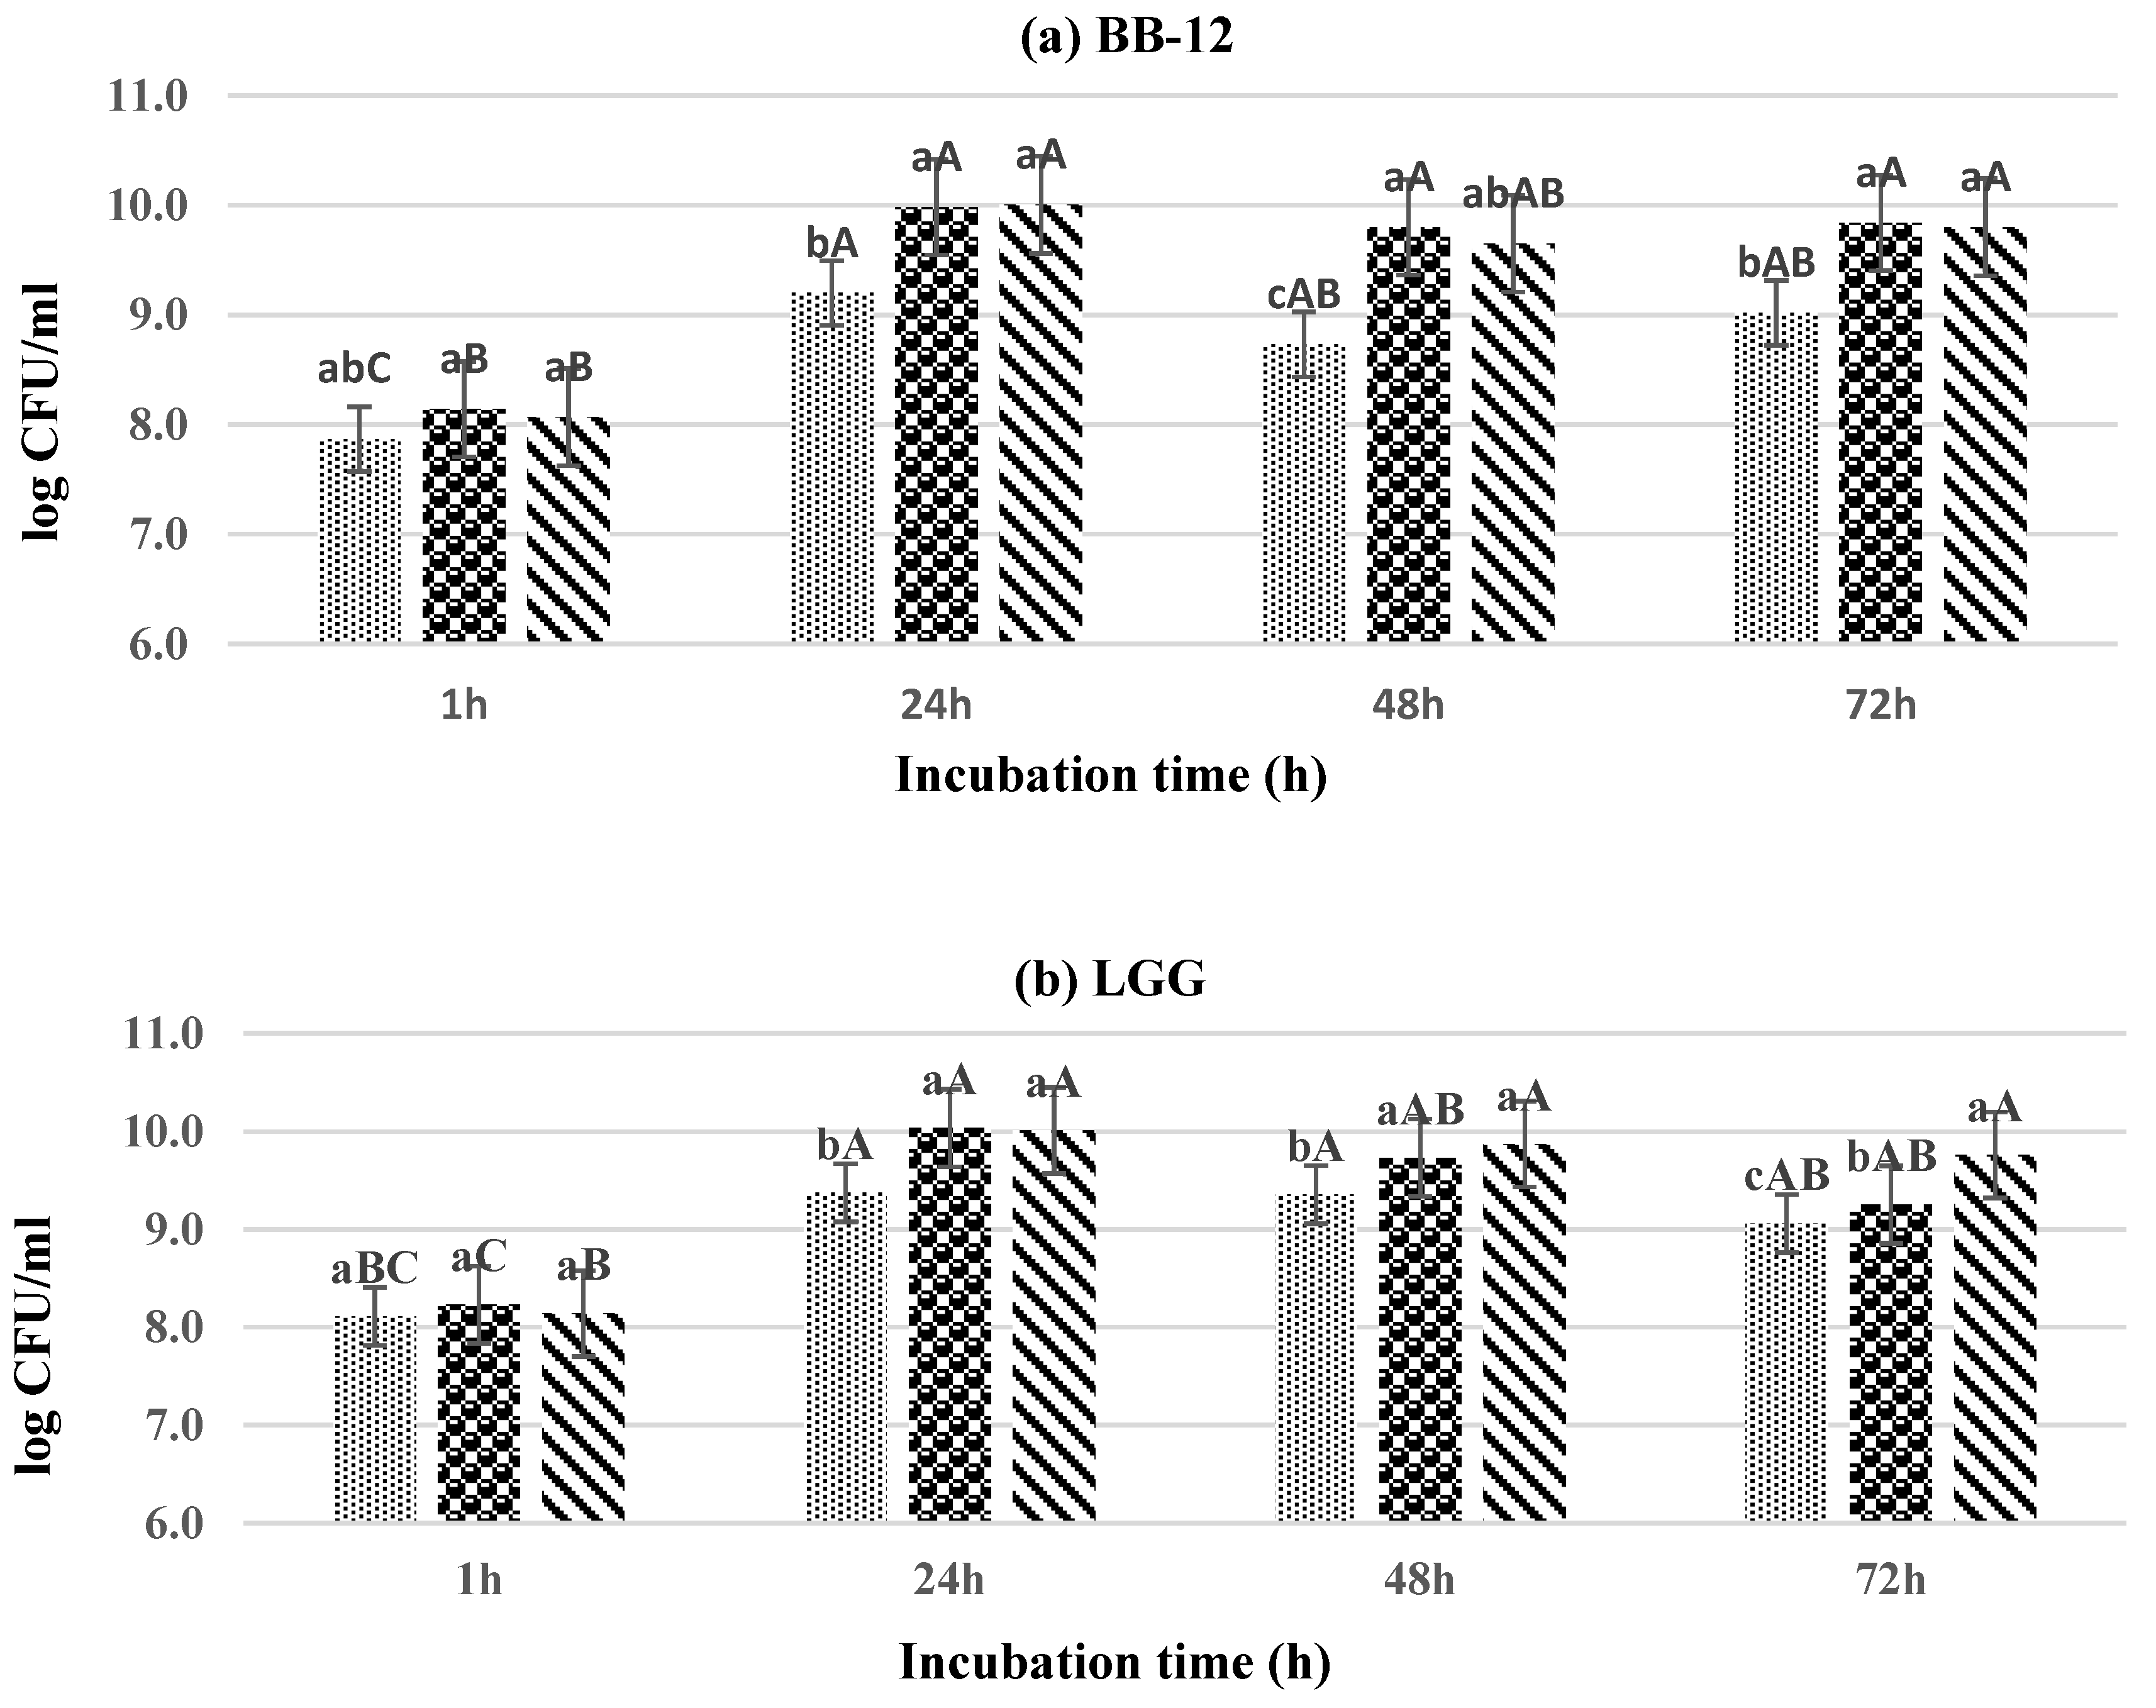
The efficacy of various freeze-dried FPPs in promoting the growth of representative probiotic strains were examined. Data in Figure 1 represent the effects of various concentrations (0%, 2% and 4%) of APP on the growth of various probiotic bacteria during 72 h of anaerobic incubation. The results showed a significant (p < 0.05) increase in the number of probiotics in every tested strain. Such a significant increase in the probiotic counts confirmed the functions of added FPP as a prebiotic supporting the growth of all tested probiotic LAB. The BB-12 counts increased by 1.33 and 1.84 Log colony-forming units (CFU)/mL after 24 h of incubation in the control and samples enriched with 2% APP, respectively. However, the net increment in treated samples as compared with the control were 0.78 and 0.8 logs when APP was added to the MRS medium at 2% and 4%, respectively, after 24 h anaerobic incubation. Similar increments (1.07 and 0.92 log CFU/mL) were also detected after 48 h of incubation with the BB-12 strain (Figure 1a). These results clearly demonstrated that the APP can be used as prebiotics. However, increasing the added APP concentration from 2% to 4% did not show any improvement in the prebiotic efficacy. Similarly, extending the incubation time beyond 24 h led to no further significant (p > 0.05) increase in the LAB counts.
Comparing the efficacy of the added APP on the growth of each tested individual LAB clearly revealed that all tested strains (BB-12, LGG and L. casei) responded to the added APP in a similar way with largest count (about 10 logs CFU/mL) detected using 2% APP and 24 h of storage (Figure 1a–c). Additionally, such a positive effect was constant throughout the 72 h of incubation and maintained larger counts than in the control.
The positive and significant prebiotic impact of APP on the growth of LAB at 24 h of incubation could be attributed to the high carbohydrate contents in APP (64.83 ± 1.12) which could be more readily available for utilization by the LAB than fiber (Table 1). A study by Duarte, et al. [12] on cashew apple waste by-product powder (CAP) investigated the potential prebiotic effects on three probiotic Lactobacillus strains. The authors concluded that CAP showed a positive prebiotic effect in terms of viable cell count which was reflected by lowered pH values and increased organic acids production as indicative of enhanced metabolic response of the tested strains.
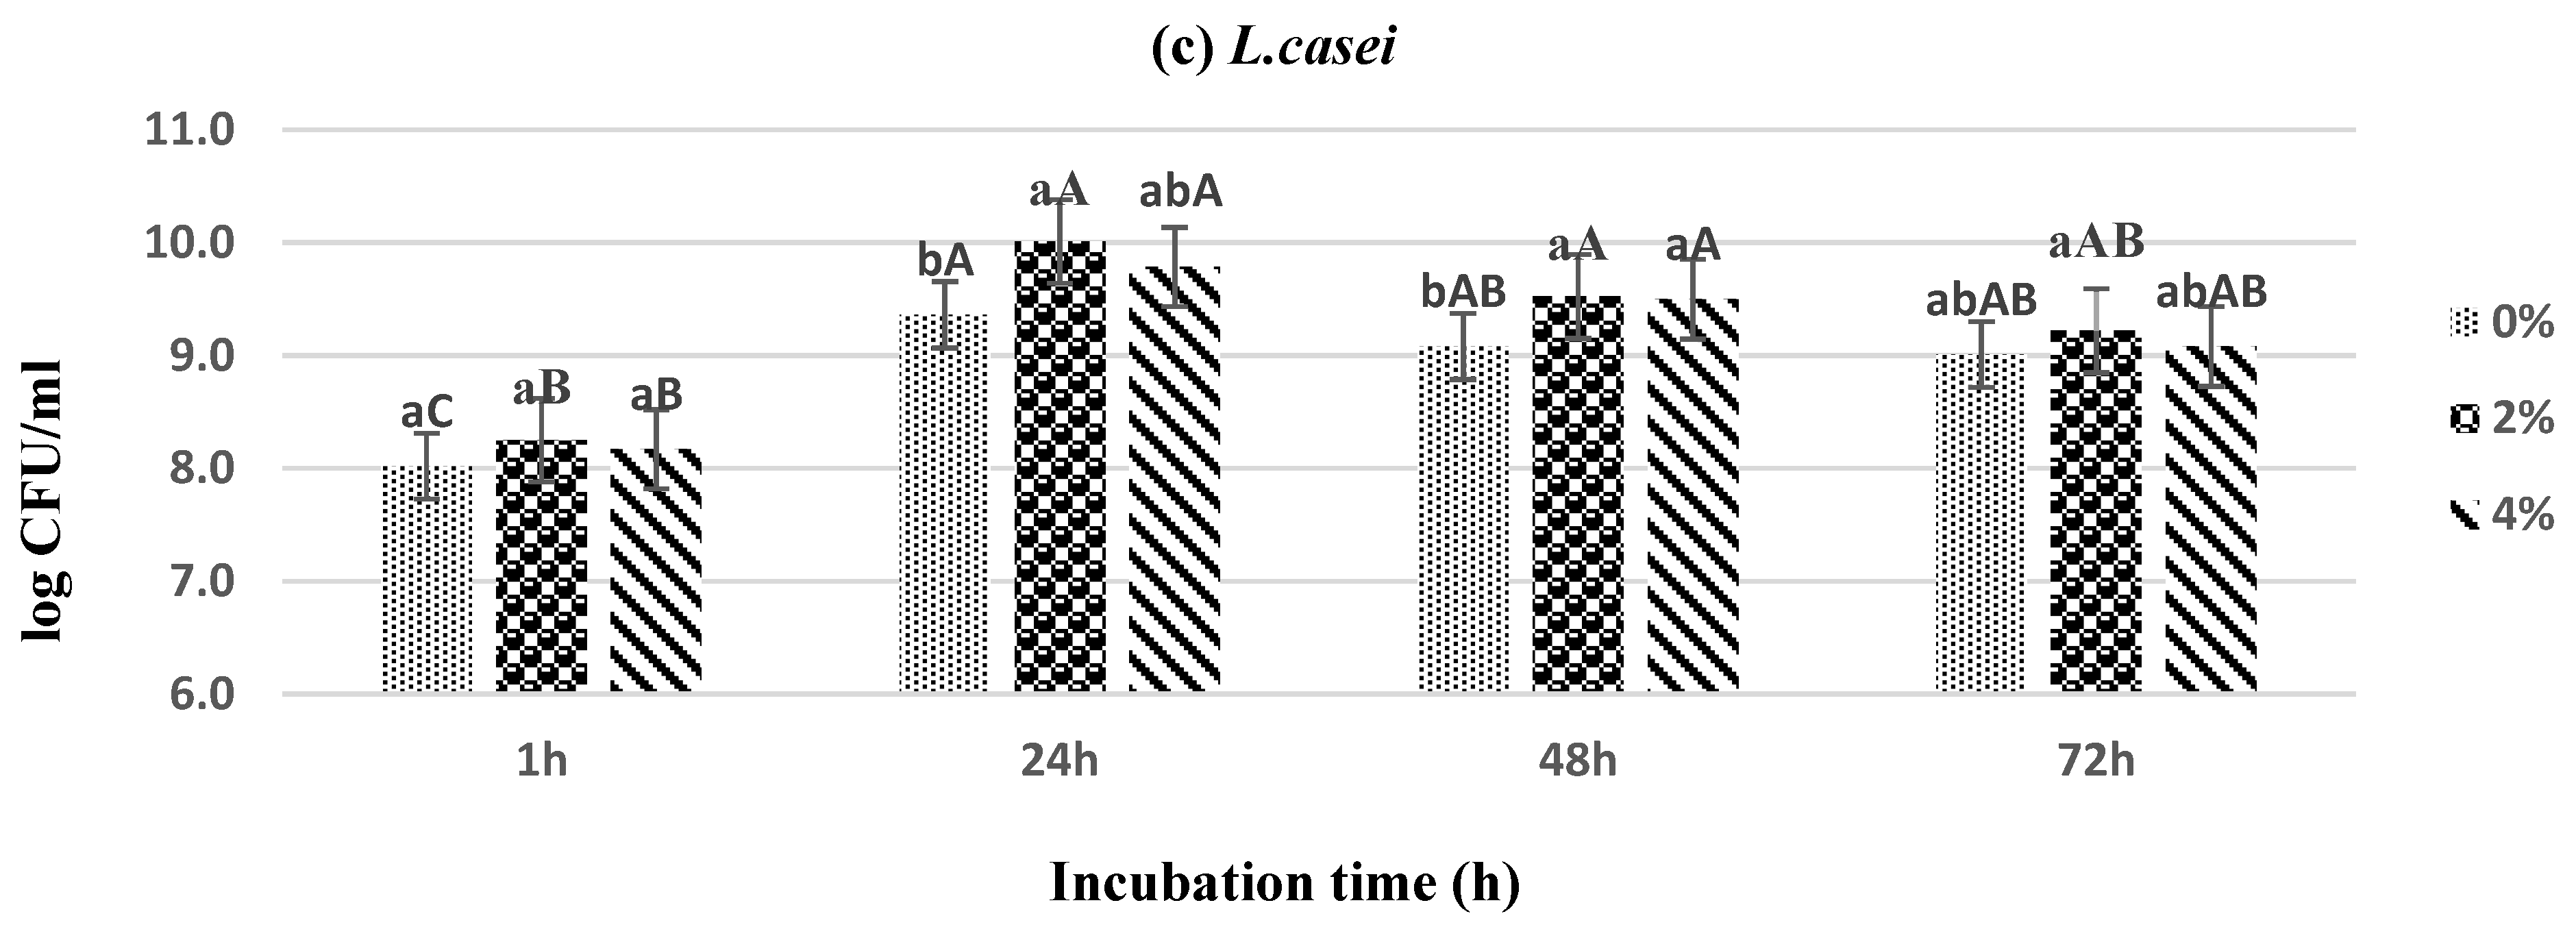
Similar to the prebiotic effects detected using APP, supplementing the MRS culture media with BPP (Figure 2), increased the LAB counts in each tested strain at 24 h of incubation. Nevertheless, the greatest significant (p < 0.05) increment in bacterial count was observed in L. casei (1.25 log CFU/mL) after 24 h of incubation with a 2% concentration of BPP in MRS culture broth. The highest increment in BB-12 and LGG were 0.88 log CFU/mL and 0.75 log CFU/mL), respectively. Similar to the pattern reported in APP, no significant (p > 0.05) difference was detected between the two applied concentrations of BPP (2% and 4%). Additionally, all tested strains maintained stable counts (>9 logs) at 24 h of incubation.
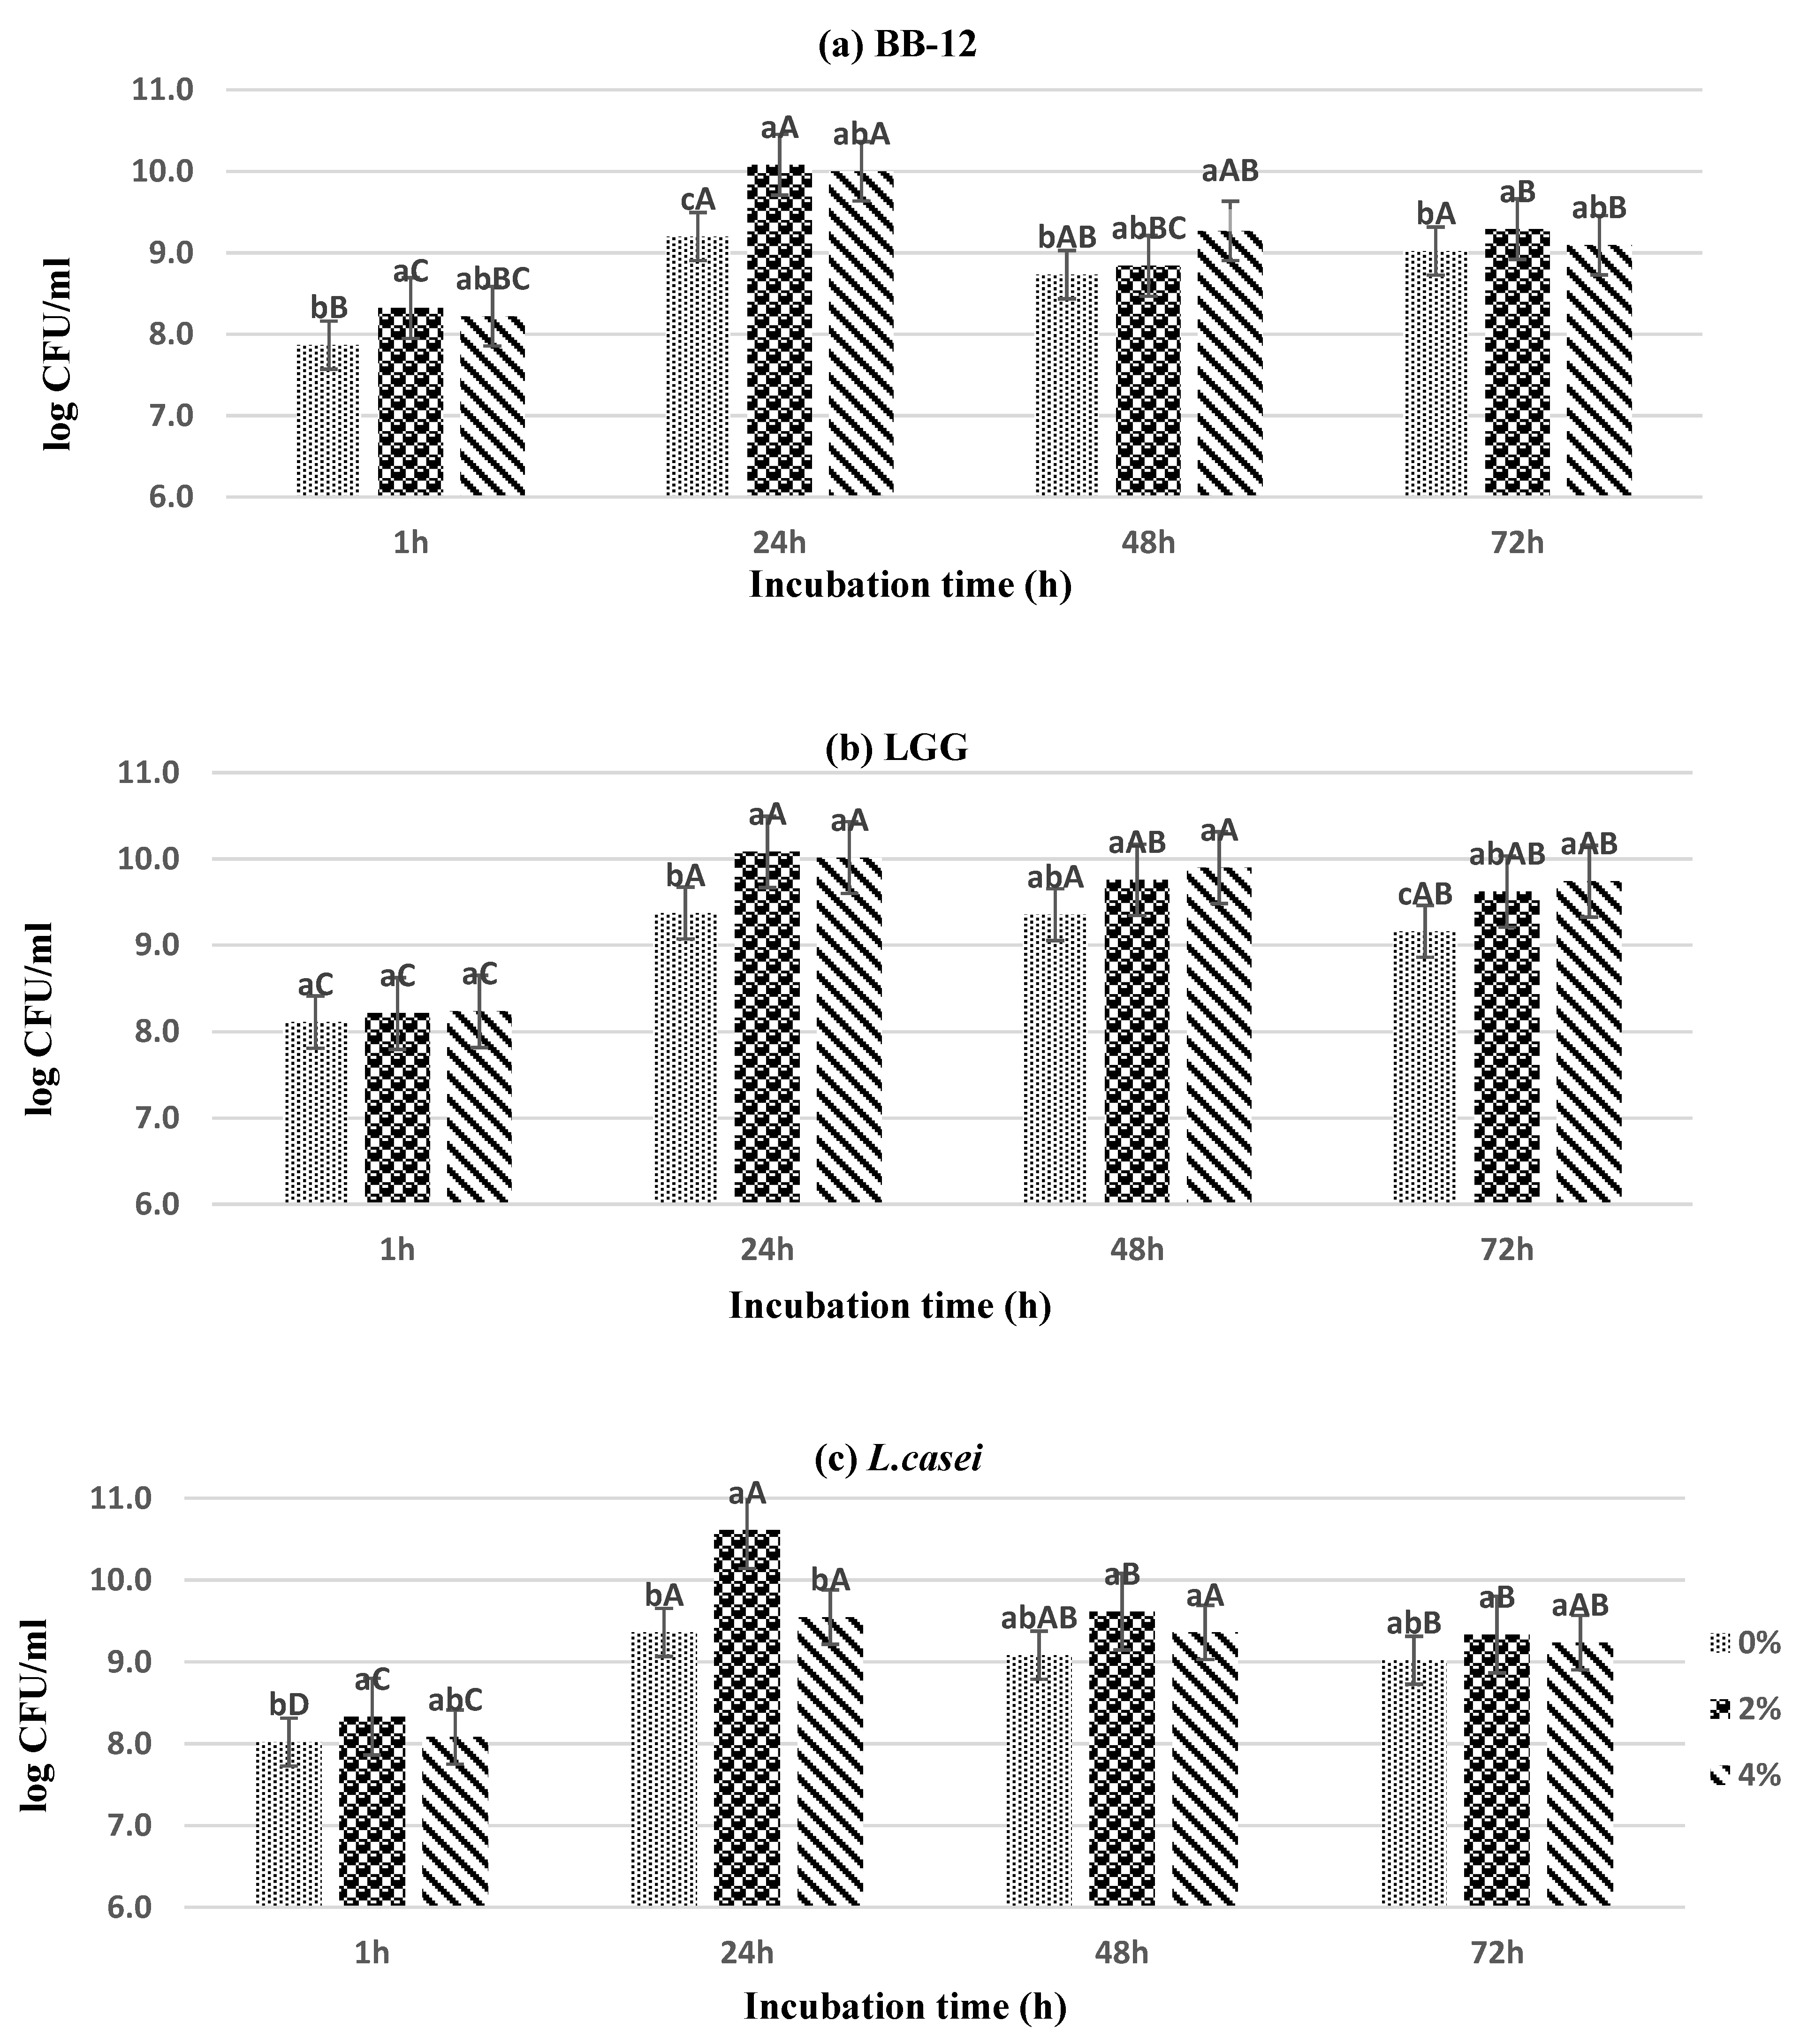
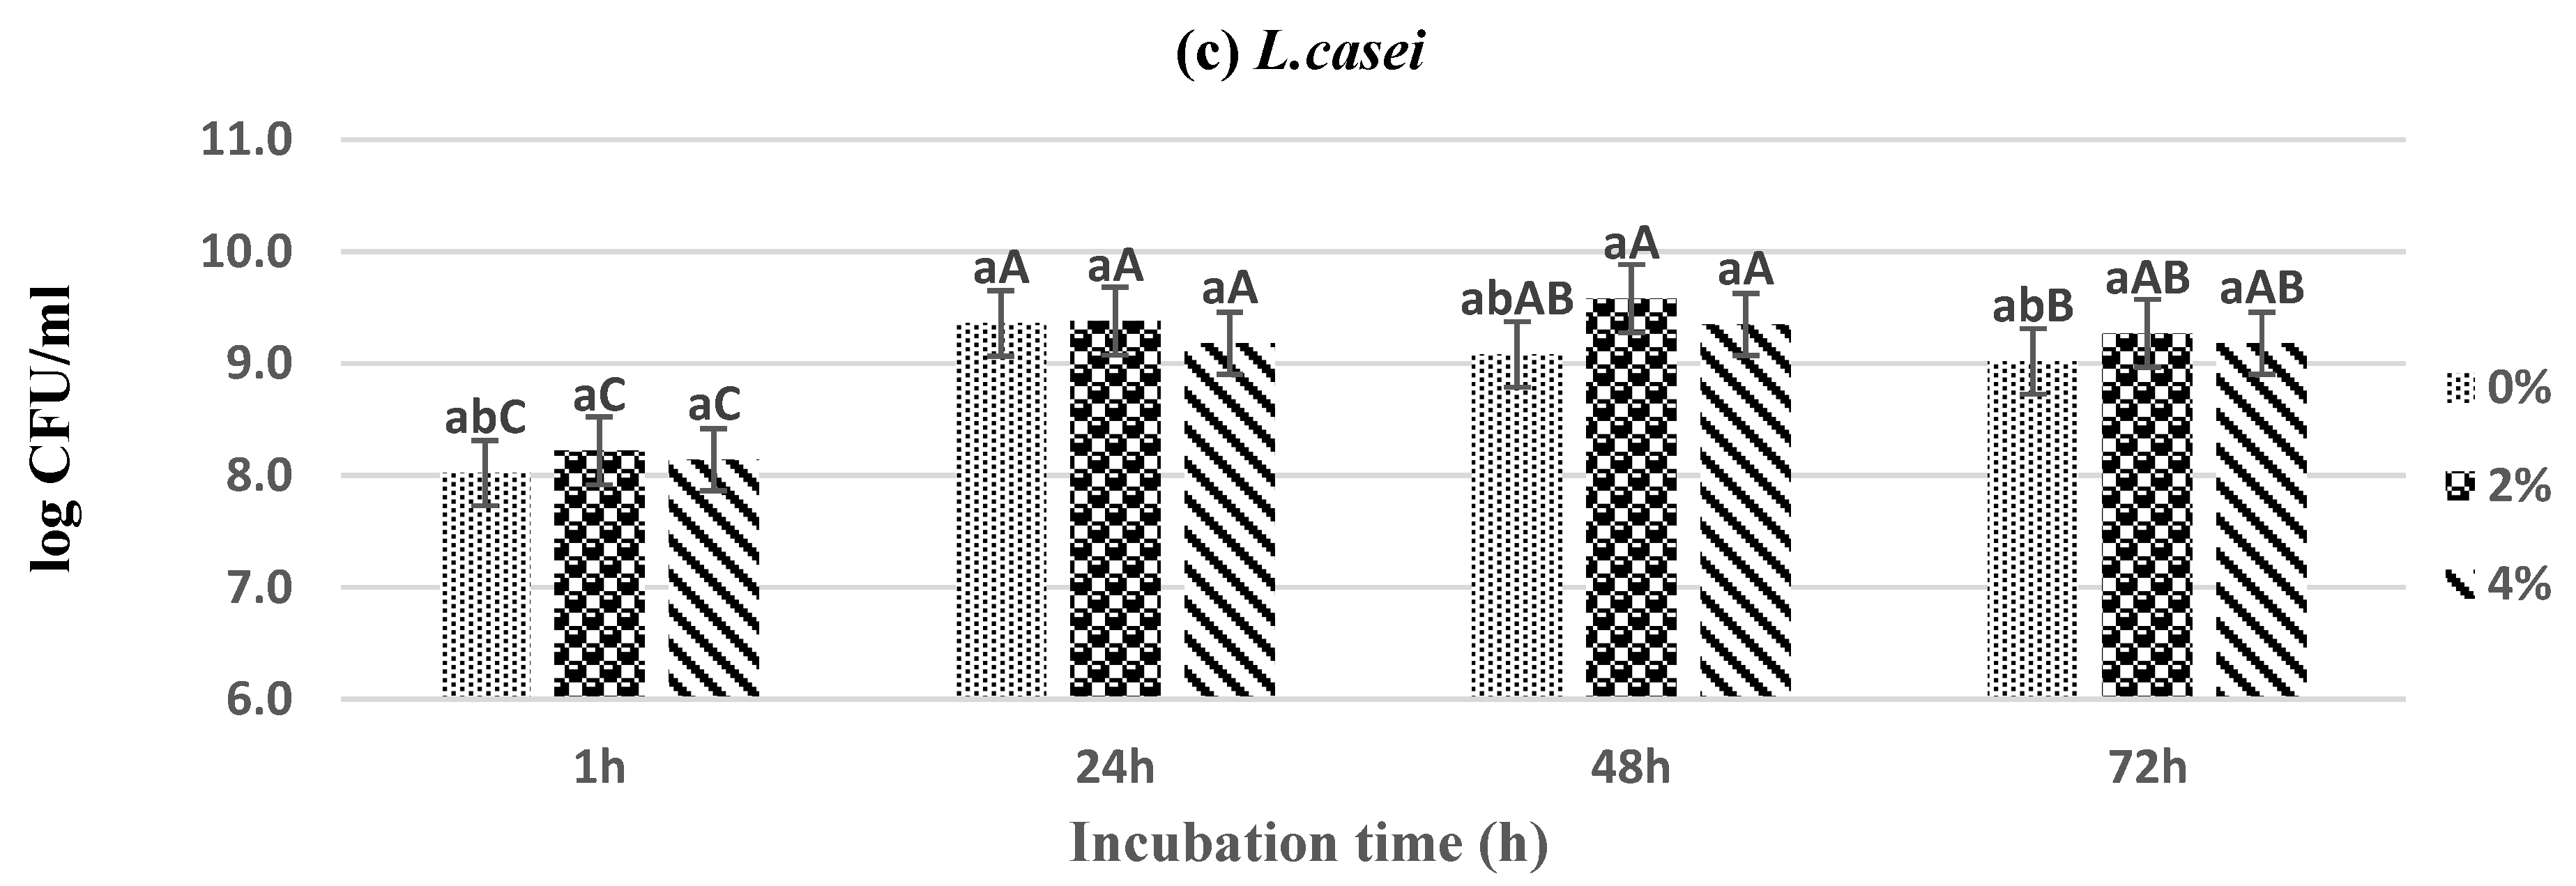
The possible prebiotic effects of banana peel waste were reported before by Farees et al. [49]. However, these authors investigated the potential of banana peel waste as culture medium (not a supplement) for the growth of two probiotic Lactobacillus strains. Their results confirmed that banana peel waste medium could be employed as a substitute of MRS medium in terms of its efficacy as a prebiotic source. In another study, Esivan, et al. [50] examined two different lignocellulosic biomasses i.e., rice bran (RB) and banana peel (BP) as a source of carbon to evaluate the effect of each on the viability of L. casei. However, the probiotic strain showed better performance in RB as compared to BP. Supplementing the MRS broth growth medium with 2% MPP resulted in significant (p < 0.05) increases of B. lactis (BB-12) counts (0.84, 0.77 and 0.82 log CFU/mL) after 24, 48 and 72 h of incubation (Figure 3a). Figure 3a also showed a decline of the viability of Bb-12 at 48 h but spiked again at 72 h of incubation. This decline was detected with BB-12 strain only. Consequently, such a decline in the counts after 48 h of incubation could be possibly due to a diauxic growth or two growth phases under these conditions. The diauxic growth is usually attributed to the occurrence of numerous substrates in the growth medium. The least promising compound is used after the ample utilization of the preferred substrate Kompala, et al. [51]. Aside from that observation in case of BB-12 strain, using MPP (Figure 3) showed a similar trend of growth as those reported previously using APP and BPP during the extended incubation beyond 24 h.
Similar studies on the possible prebiotic effects of mango juice and peel have been reported in the literature. Sayago-Ayerdi, et al. [52] assessed the in vitro colonic fermentation of predigested mango peel using human feces and revealed the abundance of the Bifidobacterium among all the tested genera. Another study by Acevedo-Martínez, et al. [53] investigated the viability of three representative Lactobacillus strains in mango beverage and observed that L. casei was more stable than L. rhamnosus and L. paracasei. These studies along with the finding of the current investigation confirmed the fact that mango peel powder could be a good prebiotic supplement.
3.5. Impact of Added Fruit Peel Powder on the Growth of Mixed Bacterial Strains
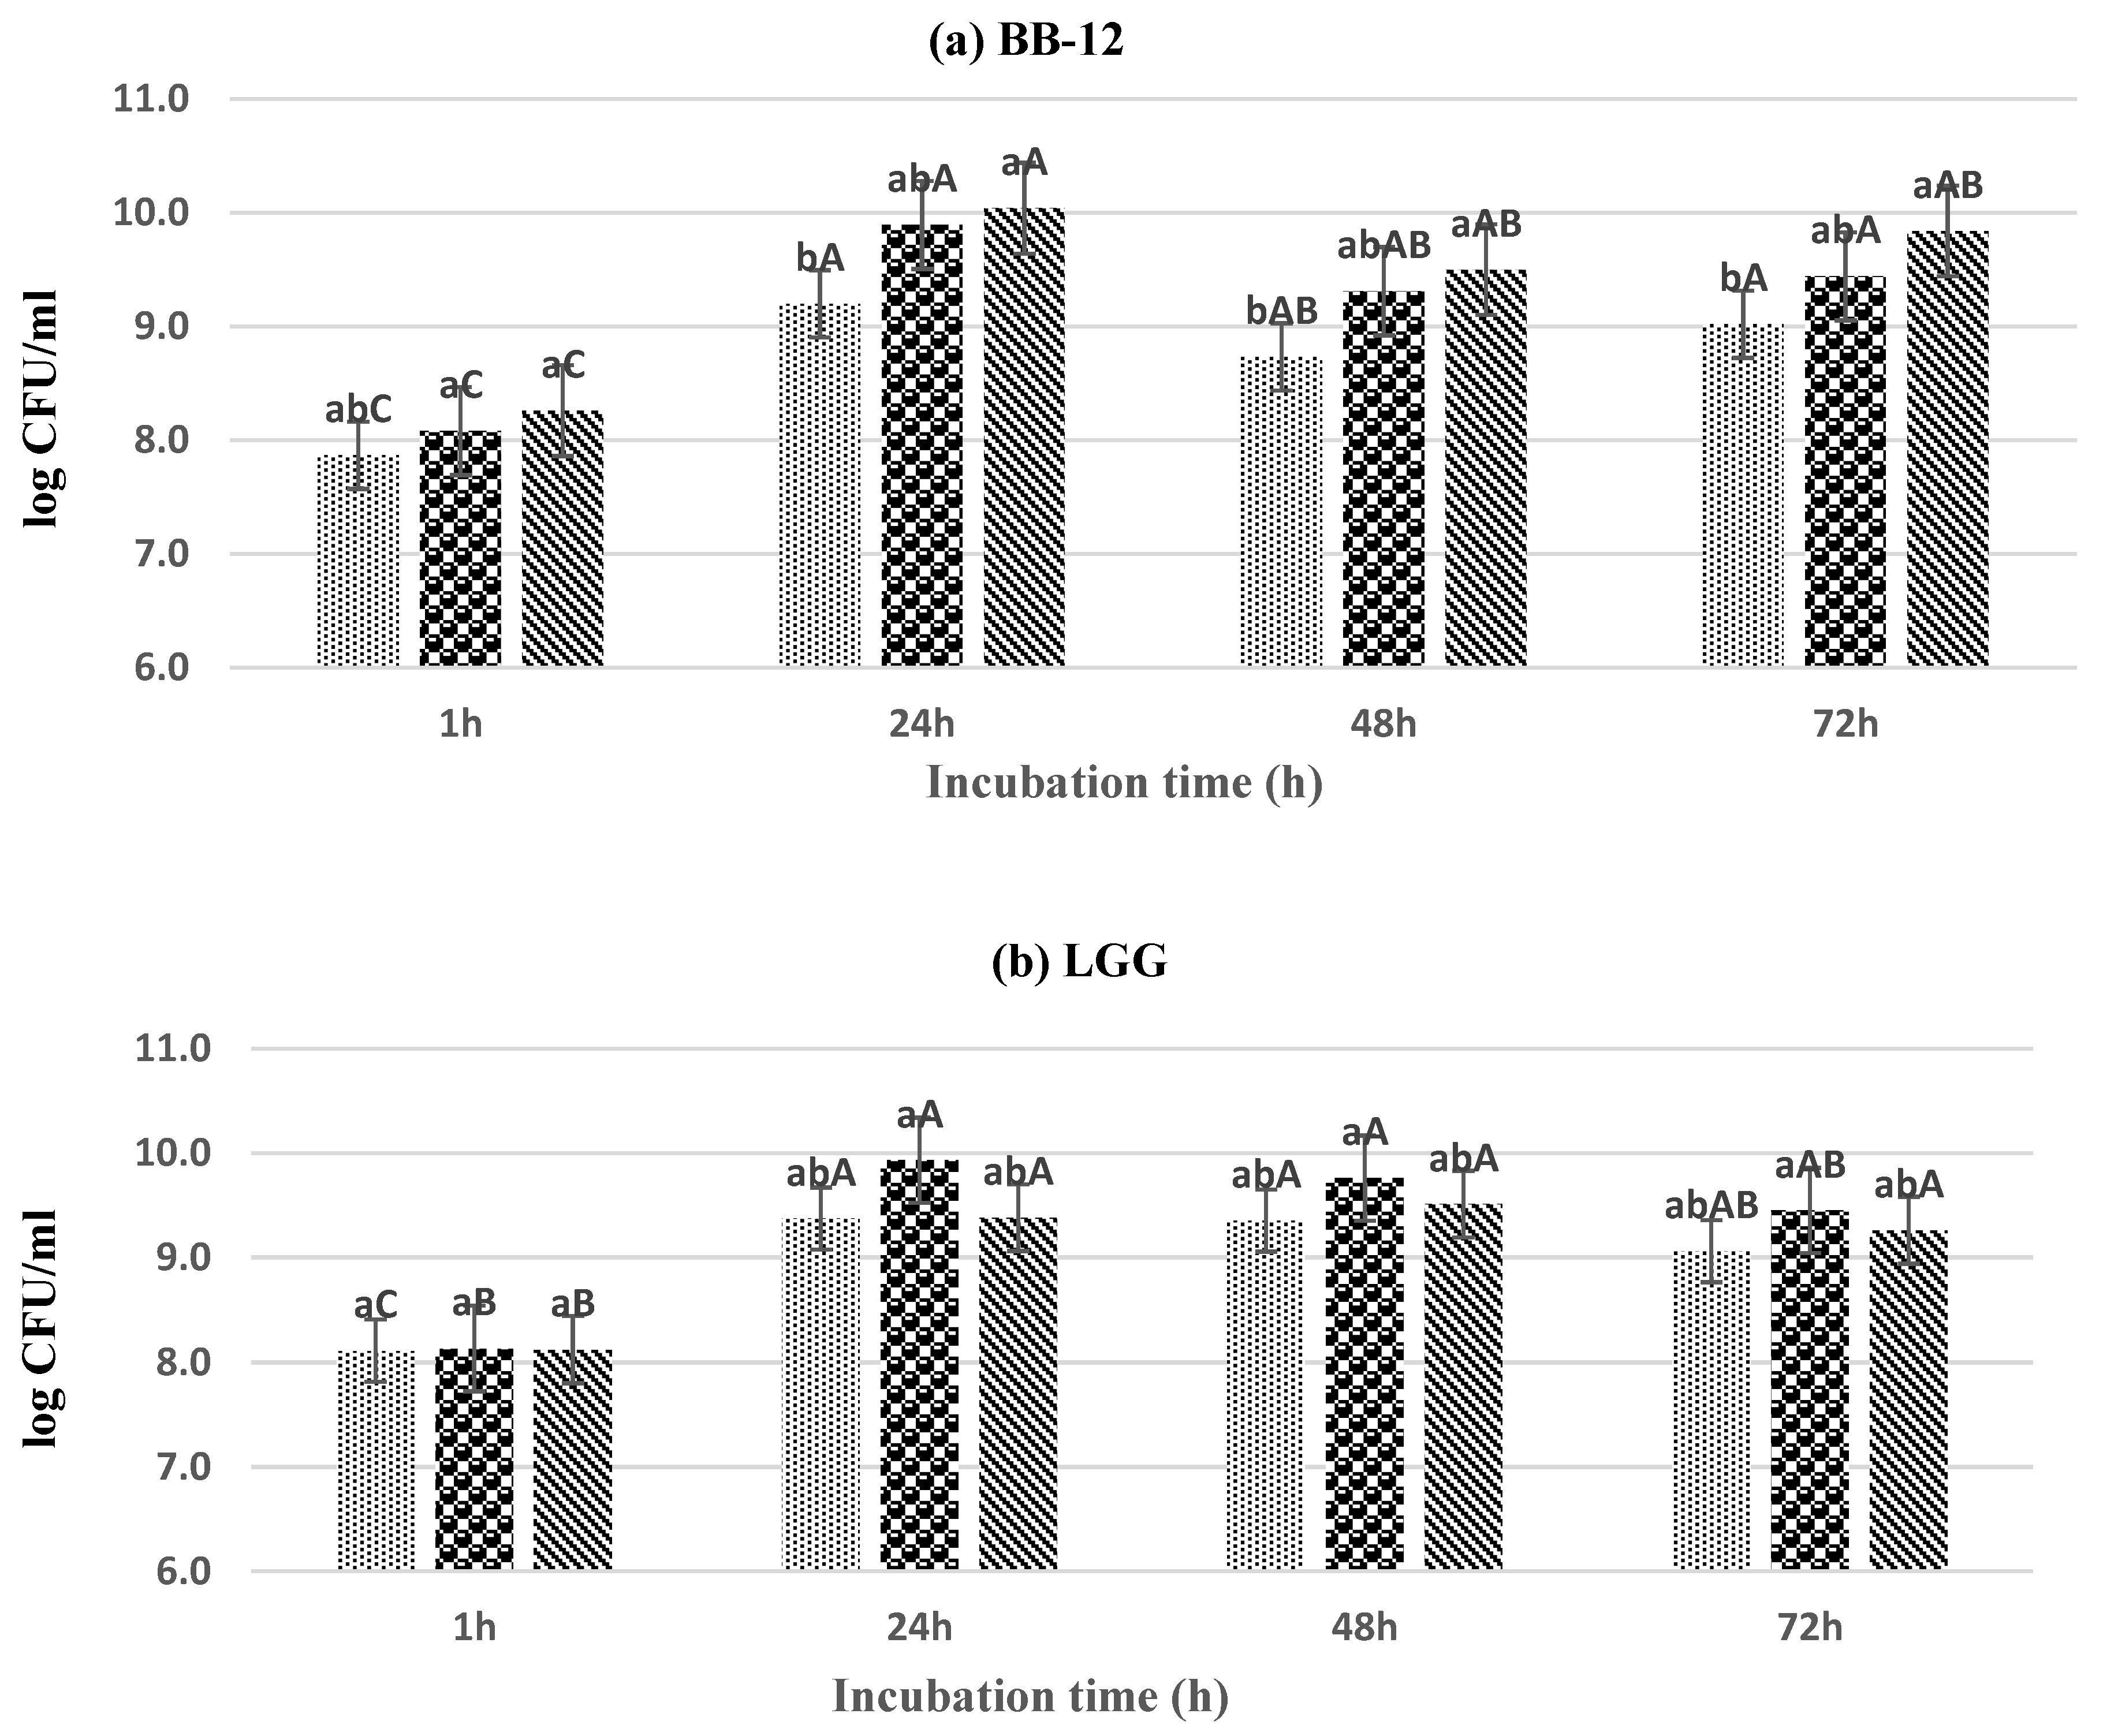
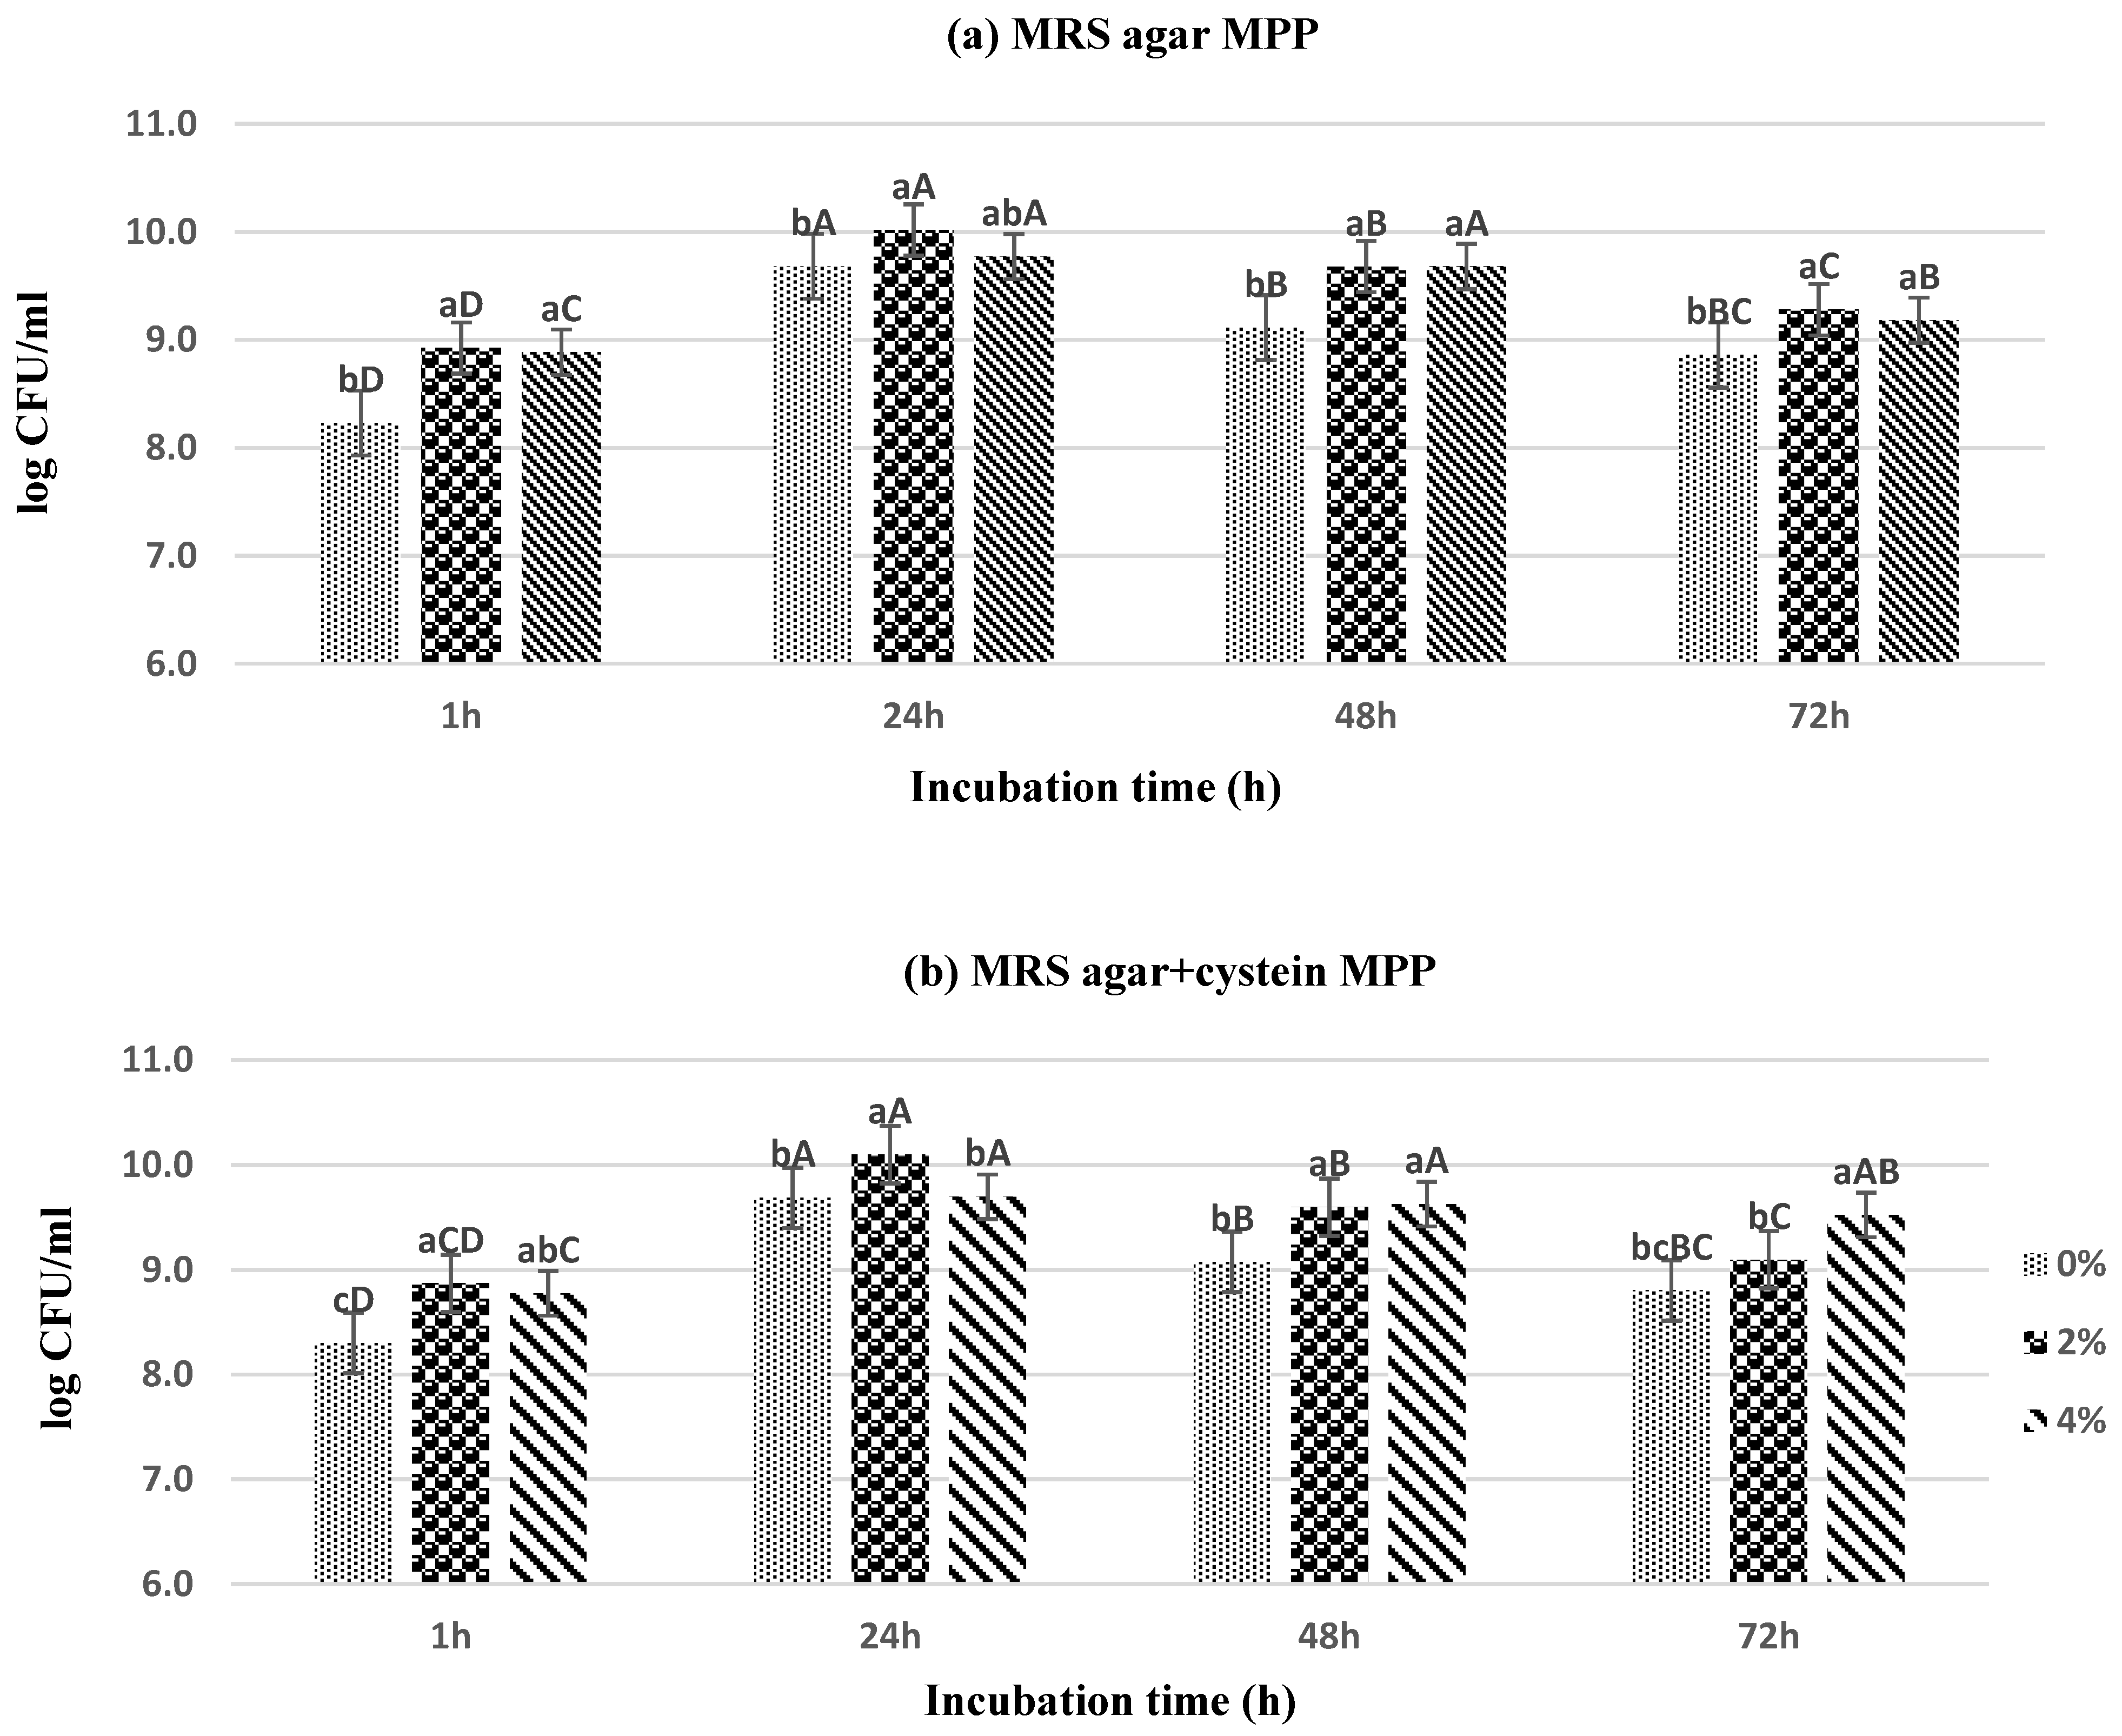
The current study investigated the growth dynamics of possible synergism among the three tested probiotics when present together. The mixed culture formulation was designed by mixing the already activated strains (two Lactobacillus and one Bifidobacterium) at 1:1:1 ratios. Similar to the procedures with individual strains, the pebiotic effects of MPP, APP and BPP was tested using the mixed probiotic strains. The effects of all FPPs as prebiotics on the mixed culture at different concentrations (0%, 2% and 4%) were similar to those reported previously (Section 3.4) using individual probiotic strains, hence, the following discussion focused only on the MPP, and the APP and BPP results were presented as supplementary data (Figure S1). The microbial populations of mixed probiotic strains in the MRS medium supplemented with mango peel powder (Figure 4) were similar to the mono-strain analyses.
The MRS medium with 2% MPP was not statistically different (p > 0.05) from the MRS medium with 4% concentration. However, data in Figure 4 revealed that the positive prebiotic effect of MPP on mixed cultures started during the early hours of incubation. Again, similar to the effect of MPP on individual probiotic strains, the probiotic count of mixed strains was the highest (10.27 log CFU/mL) at 24 h of incubation, followed by small declines in LAB counts at 48 and 72 h of incubation. However, the final counts after 72 h of incubation were >9 logs in the presence of 2% and 4% of MPP. Addition of 0.5% cysteine to the MRS growth medium had no significant (p > 0.05) effects on the probiotic counts (Figure 4b). Apparently, adding 0.5% cysteine to MRS to support the growth of bifidobacteria was not necessary when the bacteria are present in the mixed culture status.
Results from individual and mixed probiotics strains in this experiment clearly demonstrated the greatest probiotic LAB counts after 24 h of incubation. In general, this incubation time (24 h) can be considered as the optimal fermentation time for probiotics. Similar results were recently reported by Bujna, et al. [54] who observed that the various combinations of commercially available LAB strains yielded the highest LAB counts from 2.29 × 10⁹ CFU/L to 4.17 × 10¹⁰ CFU/L at 24 h of fermentation in apricot juice.
4. Conclusions
The adaptability and convenience of using fruit processing by-products for improved enumeration of probiotics was established in this study. From the results obtained it can be concluded that the selected substrates at their tested concentrations can be used to improve growth of L. rhamnosus (LGG), L. casei and B. animalis susp. lactis (BB-12) both as mono-strain and mixed strains. The results of the study further reinforced the fact that the capacity to metabolize different substrates was not strain dependent. Additionally, the proximate analysis of the functional ingredients’ properties of these FPP confirmed the fact that the high fiber contents in FPP and their good water and oil holding capacities suggest their potential application in the food and pharmaceutical industries such as thickening agents, for texture improvement and as sources of natural fiber. Furthermore, the antioxidant capacities of the FPP confirmed that the minimally processed freeze-dried agri-food wastes could make a substantial contribution towards the commercialization of these peels as food and feed ingredients.
Supplementary Materials
The following are available online at https://www.mdpi.com/article/10.3390/agriculture11070584/s1, Figure S1: Multi-strain probiotic counts on MRS agar and MRS agar +cysteine during 72h of anaerobic incubation on banana (a & b) and apple (c & d) peel supplemented culture media. Different lowercase letters indicate significant difference (p < 0.05) based on the concentration of FPP (0%, 2%, 4%) within same incubation time points and similar probiotic strain. Various uppercase letters indicate significant differences at same concentrations at different incubation time points. Data represents mean values ± standard error. (n = 4).
Author Contributions
Conceptualization, S.A. and H.F.Z.; methodology, S.A., C.S.R. and Z.F.; software, H.F.Z.; validation, S.A., C.S.R. and Z.F.; formal analysis, H.F.Z.; investigation, H.F.Z.; resources, H.F.Z. and S.A.; data curation, writing—original draft preparation, H.F.Z.; writing—review and editing, S.A., C.S.R. and Z.F.; visualization, S.A., C.S.R. and Z.F.; supervision, S.A., C.S.R. and Z.F. project administration, S.A.; funding acquisition, This project was not funded. All authors have read and agreed to the published version of the manuscript.
Funding
This research received no external funding.
Institutional Review Board Statement
Not applicable.
Informed Consent Statement
Not applicable, this study didn’t involve humans.
Data Availability Statement
The data presented in this study are available on request from the corresponding author. The data will be made publicly available upon publication.
Acknowledgments
The authors would like to thank the administrative and technical support at The University of Melbourne for the help provided to the Ph.D. student. Additionally, the authors would acknowledge the scholarship provided to the student by the Pakistani government.
Conflicts of Interest
None of the authors has any conflict of interest.
References
- Kodagoda, K.H.G.K.; Marapana, R.A.U.J. Utilization of fruit processing by-products for industrial applications: A review. Int. J. Food Sci. Nutr. 2017, 2, 24–30. [Google Scholar]
- Sagar, N.A.; Pareek, S.; Sharma, S.; Yahia, E.M.; Lobo, M.G. Fruit and vegetable waste: Bioactive compounds, their extraction, and possible utilization. Compr. Rev. Food Sci. Food Saf. 2018, 17, 512–531. [Google Scholar] [CrossRef] [Green Version]
- Helkar, P.B.; Sahoo, A.; Patil, N. Review: Food industry by-products used as a functional food ingredients. Int. J. Waste Resour. 2017, 6, 1–6. [Google Scholar]
- Lazari, M.; Aguiar-Oliveira, E.; de Oliveira, D.S.; Kamimura, E.S.; Maldonado, R.R. Production of low-calorie ice cream utilizing apple peel and pulp. J. Culin. Sci. Technol. 2019, 17, 481–490. [Google Scholar] [CrossRef]
- Manoj Kumar, C.; Chauhan, O.; Rajani, C.; Sabikhi, L. Effect of coconut milk, skim milk powder, and banana pulp on sensory and functional properties of coconut curd and its applicability as a carrier for probiotic microorganisms. J. Food Process. Preserv. 2018, 42, 13460. [Google Scholar] [CrossRef]
- Bajwa, U.; Mittal, S. Quality characteristics of no added sugar ready to drink milk supplemented with mango pulp. J. Food Sci. Technol. 2015, 52, 2112–2120. [Google Scholar] [CrossRef] [PubMed] [Green Version]
- Garcia-Amezquita, L.E.; Tejada-Ortigoza, V.; Serna-Saldivar, S.O.; Welti-Chanes, J. Dietary fiber concentrates from fruit and vegetable by-products: Processing, modification, and application as functional ingredients. Food Bioprocess Technol. 2018, 11, 1439–1463. [Google Scholar] [CrossRef]
- Diaz-Vela, J.; Totosaus, A.; Cruz-Guerrero, A.E.; de Lourdes Pérez-Chabela, M. In vitro evaluation of the fermentation of added-value agroindustrial by-products: Cactus pear (Opuntia ficus-indica L.) peel and pineapple (Ananas comosus) peel as functional ingredients. Int. J. Food Sci. Technol. 2013, 48, 1460–1467. [Google Scholar] [CrossRef]
- Serna-Cock, L.; García-Gonzales, E.; Torres-León, C. Agro-industrial potential of the mango peel based on its nutritional and functional properties. Food Rev. Int. 2016, 32, 364–376. [Google Scholar] [CrossRef]
- da Silva, J.K.; Cazarin, C.B.B.; Junior, S.B.; Augusto, F.; Junior, M.R.M. Passion fruit (Passiflora edulis) peel increases colonic production of short-chain fatty acids in wistar rats. LWT-Food Sci. Technol. 2014, 59, 1252–1257. [Google Scholar] [CrossRef]
- Liu, H.; Zhang, J.; Zhang, S.; Yang, F.; Thacker, P.A.; Zhang, G.; Qiao, S.; Ma, X. Oral administration of Lactobacillus fermentum i5007 favors intestinal development and alters the intestinal microbiota in formula-fed piglets. J. Agric. Food Chem. 2014, 62, 860–866. [Google Scholar] [CrossRef]
- Duarte, F.N.D.; Rodrigues, J.B.; da Costa Lima, M.; Lima, M.D.S.; Pacheco, M.T.B.; Pintado, M.M.E.; de Souza Aquino, J.; de Souza, E.L. Potential prebiotic properties of cashew apple (Anacardium occidentale L.) agro-industrial byproduct on lactobacillus species. J. Sci. Food Agric. 2017, 97, 3712–3719. [Google Scholar] [CrossRef] [PubMed]
- Horwitz, W. Official Methods of Analysis of Aoac International. Volume I, Agricultural Chemicals, Contaminants, Drugs/Edited by William Horwitz; AOAC International 1997: Gaithersburg, MD, USA, 2010. [Google Scholar]
- Peng, D.; Zahid, H.F.; Ajlouni, S.; Dunshea, F.R.; Suleria, H.A. LC-ESI-QTOF/MS profiling of australian mango peel by-product polyphenols and their potential antioxidant activities. Processes 2019, 7, 764. [Google Scholar] [CrossRef] [Green Version]
- Ali, A.; Wu, H.; Ponnampalam, E.N.; Cottrell, J.J.; Dunshea, F.R.; Suleria, H.A.R. Comprehensive profiling of most widely used spices for their phenolic compounds through LC-ESI-QTOF-MS2 and their antioxidant potential. Antioxidants 2021, 10, 721. [Google Scholar] [CrossRef] [PubMed]
- Iqbal, Y.; Ponnampalam, E.N.; Suleria, H.A.R.; Cottrell, J.J.; Dunshea, F.R. LC-ESI/QTOF-MS profiling of Chicory and Lucrene polyphenols and their antioxidant activities. Antioxidants 2021, 10, 932. [Google Scholar] [CrossRef]
- Salih, Z.A.; Siddeeg, A.; Taha, R.T.; Bushra, M.; Ammar, A.-F.; Ali, A.O. Physicochemical and functional properties of pulp and peel flour of dried green and ripe banana (Cavendish). Int. J. Res. Agric. Sci. 2017, 4, 2348–3997. [Google Scholar]
- Khandaker, M.M.; Amirah, F.N.; Majrashi, A.; Sajili, M.H.; Mohd, K.S.; Mat, N. Peel colour, anthocyanin, tss content and sensory evaluation of some common fruits: A comparative study. Aust. J. Crop Sci. 2018, 12, 1788. [Google Scholar] [CrossRef]
- Vieira, A.D.S.; Bedani, R.; Albuquerque, M.A.C.; Biscola, V.; Saad, S.M.I. The impact of fruit and soybean by-products and amaranth on the growth of probiotic and starter microorganisms. Food Res. Int. 2017, 97, 356–363. [Google Scholar] [CrossRef]
- Hausmann, B.; Knorr, K.-H.; Schreck, K.; Tringe, S.G.; del Rio, T.G.; Loy, A.; Pester, M. Consortia of low-abundance bacteria drive sulfate reduction-dependent degradation of fermentation products in peat soil microcosms. ISME J. 2016, 10, 2365–2375. [Google Scholar] [CrossRef]
- Moniruzzaman, M.; Chowdhury, M.A.Z.; Rahman, M.A.; Sulaiman, S.A.; Gan, S.H. Determination of mineral, trace element, and pesticide levels in honey samples originating from different regions of malaysia compared to manuka honey. BioMed Res. Int. 2014, 2014, 1–11. [Google Scholar] [CrossRef]
- Emaga, T.H.; Andrianaivo, R.H.; Wathelet, B.; Tchango, J.T.; Paquot, M.J.F. Effects of the stage of maturation and varieties on the chemical composition of banana and plantain peels. Food Chem. 2007, 103, 590–600. [Google Scholar] [CrossRef]
- Romelle, F.D.; Rani, A.P.; Manohar, R.S. Chemical composition of some selected fruit peels. Eur. J. Food Sci. Technol. 2016, 4, 12–21. [Google Scholar]
- Imran, M.; Butt, M.S.; Anjum, F.M.; Sultan, J.I. Chemical profiling of different mango peel varieties. Pak. J. Nutr. 2013, 12, 934. [Google Scholar] [CrossRef] [Green Version]
- Skinner, R.C.; Gigliotti, J.C.; Ku, K.M.; Tou, J.C. A comprehensive analysis of the composition, health benefits, and safety of apple pomace. Nutr. Rev. 2018, 76, 893–909. [Google Scholar] [CrossRef]
- Morais, D.R.; Rotta, E.M.; Sargi, S.C.; Bonafe, E.G.; Suzuki, R.M.; Souza, N.E.; Matsushita, M.; Visentainer, J.V. Proximate composition, mineral contents and fatty acid composition of the different parts and dried peels of tropical fruits cultivated in brazil. J. Braz. Chem. Soc. 2017, 28, 308–318. [Google Scholar] [CrossRef]
- Slavin, J.L.; Lloyd, B. Health benefits of fruits and vegetables. Adv. Nutr. 2012, 3, 506–516. [Google Scholar] [CrossRef] [PubMed] [Green Version]
- Ajila, C.M.; Rao, U. Mango peel dietary fibre: Composition and associated bound phenolics. J. Funct. Food 2013, 5, 444–450. [Google Scholar] [CrossRef]
- Barber, T.M.; Kabisch, S.; Pfeiffer, A.F.H.; Weickert, M.O. The health benefits of dietary fibre. Nutrients 2020, 12, 3209. [Google Scholar] [CrossRef]
- Lyu, F.; Luiz, S.F.; Azeredo, D.R.P.; Cruz, A.G.; Ajlouni, S.; Ranadheera, C.S. Apple pomace as a functional and healthy ingredient in food products: A review. Processes 2020, 8, 319. [Google Scholar] [CrossRef] [Green Version]
- Ryan, J.; Hutchings, S.C.; Fang, Z.; Bandara, N.; Gamlath, S.; Ajlouni, S.; Ranadheera, C.S. Microbial, physico-chemical and sensory characteristics of mango juice enriched probiotic dairy drinks. Int. J. Dairy Technol. 2019, 73, 182–190. [Google Scholar] [CrossRef]
- Suleria, H.A.R.; Barrow, C.J.; Dunshea, F.R. Screening and characterization of phenolic compounds and their antioxidant capacity in different fruit peels. Foods 2020, 9, 1206. [Google Scholar] [CrossRef] [PubMed]
- Hayouni, E.A.; Abedrabba, M.; Bouix, M.; Hamdi, M. The effects of solvents and extraction method on the phenolic contents and biological activities in vitro of Tunisian Quercus coccifera L. And Juniperus phoenicea L. Fruit extracts. Food Chem. 2007, 105, 1126–1134. [Google Scholar] [CrossRef]
- Mustafa, A.; Turner, C. Pressurized liquid extraction as a green approach in food and herbal plants extraction: A review. Anal. Chim. Acta 2011, 703, 8–18. [Google Scholar] [CrossRef]
- Nepote, V.; Grosso, N.R.; Guzmán, C.A. Optimization of extraction of phenolic antioxidants from peanut skins. J. Sci. Food Agric. 2004, 85, 33–38. [Google Scholar] [CrossRef]
- Pereira, G.A.; Molina, G.; Arruda, H.S.; Pastore, G.M. Optimizing the Homogenizer-Assisted Extraction (HAE) of total phenolic compounds from banana peel. J. Food Process Eng. 2017, 40, e12438. [Google Scholar] [CrossRef]
- Wanlapa, S.; Wachirasiri, K.; Sithisam-ang, D.; Suwannatup, T. Potential of selected tropical fruit peels as dietary fiber in functional foods. Int. J. Food Prop. 2015, 18, 1306–1316. [Google Scholar] [CrossRef]
- Figuerola, F.; Hurtado, M.a.L.; Estévez, A.M.a.; Chiffelle, I.; Asenjo, F. Fibre concentrates from apple pomace and citrus peel as potential fibre sources for food enrichment. Food Chem. 2005, 91, 395–401. [Google Scholar] [CrossRef]
- Rana, S.; Gupta, S.; Rana, A.; Bhushan, S. Functional properties, phenolic constituents and antioxidant potential of industrial apple pomace for utilization as active food ingredient. Food Sci. Hum. Wellness 2015, 4, 180–187. [Google Scholar] [CrossRef] [Green Version]
- Elleuch, M.; Bedigian, D.; Roiseux, O.; Besbes, S.; Blecker, C.; Attia, H. Dietary fibre and fibre-rich by-products of food processing: Characterisation, technological functionality and commercial applications: A review. Food Chem. 2011, 124, 411–421. [Google Scholar] [CrossRef]
- Rodríguez-Ambriz, S.; Islas-Hernández, J.; Agama-Acevedo, E.; Tovar, J.; Bello-Pérez, L. Characterization of a fibre-rich powder prepared by liquefaction of unripe banana flour. Food Chem. 2008, 107, 1515–1521. [Google Scholar] [CrossRef]
- Alkarkhi, A.F.; Saifullah, R.; Yong, Y.; Azhar, M.E. Physicochemical properties of banana peel flour as influenced by variety and stage of ripeness: Multivariate statistical analysis. Asian J. Food Agro-Ind. 2010, 3, 349–362. [Google Scholar]
- Das, P.C.; Khan, M.J.; Rahman, M.S.; Majumder, S.; Islam, M.N. Comparison of the physico-chemical and functional properties of mango kernel flour with wheat flour and development of mango kernel flour based composite cakes. NFS J. 2019, 17, 1–7. [Google Scholar] [CrossRef]
- Shittu, T.; Lawal, M. Factors affecting instant properties of powdered cocoa beverages. Food Chem. 2007, 100, 91–98. [Google Scholar] [CrossRef]
- Naknaen, P.; Charoenthaikij, P.; Kerdsup, P. Physicochemical properties and nutritional compositions of foamed banana powders (Pisang awak, musa sapientum L.) dehydrated by various drying methods. Walailak J. Sci. Technol. (WJST) 2015, 13, 177–191. [Google Scholar]
- Henríquez, M.; Almonacid, S.; Lutz, M.; Simpson, R.; Valdenegro, M. Comparison of three drying processes to obtain an apple peel food ingredient. CyTA-J. Food 2013, 11, 127–135. [Google Scholar] [CrossRef]
- Coelho, E.M.; de Souza, M.E.A.O.; Corrêa, L.C.; Viana, A.C.; de Azevêdo, L.C.; dos Santos Lima, M. Bioactive compounds and antioxidant activity of mango peel liqueurs (Mangifera indica L.) produced by different methods of maceration. Antioxidants 2019, 8, 102. [Google Scholar] [CrossRef] [Green Version]
- Guine, R.P.F.; Barroca, J.M. Evaluation of the browning kinetics for bananas and pears submitted to convective drying. Curr. Biochem. Eng. 2014, 1, 165–172. [Google Scholar] [CrossRef]
- Farees, N.; Abateneh, D.D.; Geneto, M.; Naidu, N.V. Evaluation of banana peel waste as growth medium for probiotic lactobacillus species. Int. J. Appl. Biol. Pharm. Technol. 2017, 8, 19–23. [Google Scholar]
- Esivan, S.M.M.; Rashid, R.; Zaharudin, N.A.; Mahmood, N.A.N. Growth and survival of lactobacillus casei in rice bran and banana peel medium. Int. J. Nano Biomater. 2016, 6, 151–161. [Google Scholar] [CrossRef]
- Kompala, D.S.; Ramkrishna, D.; Tsao, G.T. Cybernetic modeling of microbial growth on multiple substrates. Biotechnol. Bioeng. 1984, 26, 1272–1281. [Google Scholar] [CrossRef]
- Sayago-Ayerdi, S.G.; Zamora-Gasga, V.M.; Venema, K. Prebiotic effect of predigested mango peel on gut microbiota assessed in a dynamic in vitro model of the human colon (Tim-2). Food Res. Int. 2019, 118, 89–95. [Google Scholar] [CrossRef] [PubMed]
- Acevedo-Martínez, E.; Gutiérrez-Cortés, C.; García-Mahecha, M.; Díaz-Moreno, C. Evaluation of viability of probiotic bacteria in mango (Mangifera indica L. Cv.“Tommy atkins”) beverage. Dyna 2018, 85, 84–92. [Google Scholar] [CrossRef]
- Bujna, E.; Farkas, N.A.; Tran, A.M.; Dam, M.S.; Nguyen, Q.D. Lactic acid fermentation of apricot juice by mono- and mixed cultures of probiotic Lactobacillus and Bifidobacterium strains. Food Sci. Biotechnol. 2018, 27, 547–554. [Google Scholar] [CrossRef] [PubMed]
Figure 1.
Prebiotic effects of different concentrations of apple peel powder (APP) on the number (log colony-forming units (CFU)/mL) of tested individual probiotic bacteria; Bifidobacterium animalis subsp. Lactis BB-12 (a), Lactobacillus rhamnosus (LGG) (b) and L. casei (c) during 72 h of anaerobic incubation. Different lowercase letters within each incubation time and probiotic strain indicate significant difference (p < 0.05) based on the concentration of fruit peel powder (FPP) (0%, 2%, 4%) within same incubation time points and similar probiotic strain. Various uppercase letters indicate significant differences within the same concentrations at different incubation time points. Data represent mean values ± standard error (n = 4).


Figure 2.
Prebiotic effects of different concentrations of banana peel powder (BPP) on the number (log CFU/mL) of tested individual probiotic bacteria; Bifidobacterium animalis subsp. Lactis BB-12 (a), Lactobacillus rhamnosus LGG (b) and L. casei (c) during 72 h of anaerobic incubation. Different lowercase letters within each incubation time and probiotic strain indicate significant difference (p < 0.05) based on the concentration of FPP (0%, 2%, 4%) within same incubation time points and similar probiotic strain. Various uppercase letters indicate significant differences within the same concentrations at different incubation time points. Data represent mean values ± standard error (n = 4).

Figure 3.
Prebiotic effects of different concentrations of mango peel powder (MPP) on the number (log CFU/mL) of tested individual probiotic bacteria; Bifidobacterium animalis subsp. Lactis BB-12 (a), Lactobacillus rhamnosus LGG (b) and L. casei (c) during 72 h of anaerobic incubation. Different lowercase letters within each incubation time and probiotic strain indicate significant difference (p < 0.05) based on the concentration of FPP (0%, 2%, 4%) within same incubation time points and similar probiotic strain. Various uppercase letters indicate significant differences within the same concentrations at different incubation time points. Data represent mean values ± standard error (n = 4).


Figure 4.
Multi-strain probiotic counts on de Man Rogosa Sharp (MRS) agar (a) and MRS agar + cysteine (b) during 72 h of anaerobic incubation in MPP supplemented culture media. Different lowercase letters indicate significant difference (p < 0.05) based on the concentration of FPP (0%, 2%, 4%) within same incubation time points and similar probiotic strain. Various uppercase letters indicate significant differences at same concentrations at different incubation time points. Data represent mean values ± standard error (n = 4).


Table 1.
Results of proximate composition in the three tested fruit peel powders reported as % in dry weight.
Table 1.
Results of proximate composition in the three tested fruit peel powders reported as % in dry weight.
| Fruit Peel | Proximate Composition (%) Based on Dry Weight | |||||
|---|---|---|---|---|---|---|
| Moisture | Ash | Fat | Protein | Dietary Fiber | Carbohydrate | |
| BPP | 0.54 ± 0.04 c | 16.07 ± 0.55 a | 7.85 ± 0.34 a | 7.17 ± 0.06 a | 42.39 ± 0.80 b | 25.98 ± 0.76 c |
| APP | 0.57 ± 0.02 b | 8.44 ± 0.48 b | 4.53 ± 0.28 c | 2.37 ± 0.04 c | 19.29 ± 1.30 c | 64.83 ± 1.12 a |
| MPP | 0.61 ± 0.02 a | 3.94 ± 0.75 c | 6.23 ± 0.30 b | 2.89 ± 0.10 b | 47.01 ± 1.53 a | 39.56 ± 1.85 b |
BPP: banana peel powder, APP: apple peel powder, MPP: mango peel powder. Means ± standard deviation (n = 9) Means within the same column followed by different superscript letters are significantly different (p < 0.05).
Table 2.
Results of antioxidant potential, functional properties and color analyses of fruit peel powders.
Table 2.
Results of antioxidant potential, functional properties and color analyses of fruit peel powders.
| Parameters | MPP | BPP | APP | |
|---|---|---|---|---|
| TPC (mg GAE/g dw) | 23.49 ± 0.38 a | 1.21 ± 0.02 c | 4.85 ± 0.21 b | |
| TFC (mg QE/g dw) | 1.91 ± 0.43 b | 1.06 ± 0.23 b | 2.88 ± 0.34 a | |
| DPPH (mg AAE/g dw) | 5.51 ± 0.45 a | 0.74 ± 0.02 b | 1.69 ± 1.04 b | |
| ABTS (mg AAE/g dw) | 12.37 ± 2.71 a | 2.03 ± 0.05 c | 8.57 ± 0.25 b | |
| WHC (g water/g sample) | 2.84 ± 0.04 b | 5.94 ± 0.29 a | 1.96 ± 0.05 c | |
| OHC (g oil/g sample) | 1.09 ± 0.09 a | 1.04 ± 0.04 a | 1.06 ± 0.071 a | |
| Solubility (%) | 85.23 ± 2.84 a | 73.71 ± 1.44 b | 84.68 ± 1.71 a | |
| Colour | L* | 67.51 ± 1.04 a | 54.43 ± 0.94 c | 63.21 ± 0.81 b |
| a* | 6.52 ± 0.29 b | 6.01 ± 0.24 c | 13.85 ± 0.54 a | |
| b* | 38.55 ± 0.95 a | 26.29 ± 1.06 b | 22.07 ± 0.96 c | |
| Chroma (C) | 39.23 ± 1.00 a | 26.97 ± 1.04 b | 26.05 ± 0.90 b | |
| Hue angle (h°) | 80.39 ± 0.50 a | 77.13 ± 0.68 b | 57.87 ± 1.42 c | |
BPP: banana peel powder, APP: apple peel powder, MPP: mango peel powder; Means ± standard deviation (n = 9); Means within each row followed by different superscript letters are significantly different (p < 0.05).
Publisher’s Note: MDPI stays neutral with regard to jurisdictional claims in published maps and institutional affiliations. |
© 2021 by the authors. Licensee MDPI, Basel, Switzerland. This article is an open access article distributed under the terms and conditions of the Creative Commons Attribution (CC BY) license (https://creativecommons.org/licenses/by/4.0/).
Share and Cite
MDPI and ACS Style
Zahid, H.F.; Ranadheera, C.S.; Fang, Z.; Ajlouni, S. Utilization of Mango, Apple and Banana Fruit Peels as Prebiotics and Functional Ingredients. Agriculture 2021, 11, 584. https://doi.org/10.3390/agriculture11070584
AMA Style
Zahid HF, Ranadheera CS, Fang Z, Ajlouni S. Utilization of Mango, Apple and Banana Fruit Peels as Prebiotics and Functional Ingredients. Agriculture. 2021; 11(7):584. https://doi.org/10.3390/agriculture11070584
Chicago/Turabian StyleZahid, Hafza Fasiha, Chaminda Senaka Ranadheera, Zhongxiang Fang, and Said Ajlouni. 2021. "Utilization of Mango, Apple and Banana Fruit Peels as Prebiotics and Functional Ingredients" Agriculture 11, no. 7: 584. https://doi.org/10.3390/agriculture11070584
Note that from the first issue of 2016, this journal uses article numbers instead of page numbers. See further details here.