Article

Development and Application of a Loop-Mediated Isothermal Amplification (LAMP) Assay for the Detection of Pseudomonas syringae Pathovars pisi and syringae

1
Agriculture Victoria, AgriBio, 5 Ring Road, Bundoora, VIC 3083, Australia
2
Biometry Hub, Waite Campus, University of Adelaide, Urrbrae, SA 5064, Australia
3
Agriculture Victoria, 110 Natimuk Road, Horsham, VIC 3400, Australia
*
Author to whom correspondence should be addressed.
Agriculture 2021, 11(9), 875; https://doi.org/10.3390/agriculture11090875
Submission received: 2 August 2021 / Revised: 7 September 2021 / Accepted: 9 September 2021 / Published: 13 September 2021
(This article belongs to the Section Crop Protection, Diseases, Pests and Weeds)

Abstract

:
Pseudomonas syringae causes bacterial blight (BB) disease worldwide on economically important fruit and vegetable crops including field pea (Pisum sativum L.). The two pathovars responsible for BB in field pea are Pseudomonas syringae pathovar pisi (Psp) and syringae (Pss). In the field, both pathovars cause indistinguishable symptoms on field pea and require laboratory diagnosis to determine the causal pathovar. To aid in-field and laboratory diagnosis, accurate, and robust loop-mediated isothermal amplification (LAMP) assays for Psp and Pss were developed. The assays were able to detect Psp or Pss on live or heat-killed bacterial cells, plant exudates, seeds, and DNA extracts with no inhibitory effects. The two specific LAMP assays developed detected Psp and Pss accurately in less than 20 min and no cross-reaction was observed with 18 strains of closely related species of Pseudomonas syringae. Compared to the conventional PCR assays, the two LAMP assays were equally specific but have advantages of producing quicker and visual live results, enabling early detection and differentiation of Psp and Pss. Our results suggested a potential use of LAMP assays for laboratory testing and can be applied for in-field surveys.

1. Introduction

Pseudomonas syringae is a gram-negative phytopathogenic bacterium within the gamma subgroup of the Proteobacteria, and up to 60 pathovars have been characterized based on their host range [1,2]. Pseudomonas syringae can be found both as a harmless epiphyte and as a plant pathogen, causing disease in most cultivated plant species [2]. In field pea (Pisum sativum L.), Bacterial Blight (BB) is caused by both Pseudomonas syringae pathovar pisi (Psp) and Pseudomonas syringae pv. syringae (Pss). Pss is more aggressive than Psp, affecting winter sown field pea in high severity frost affected areas worldwide [3,4] and causing epidemics that result in high yield losses [4,5]. The symptoms caused by Psp and Pss are often indistinguishable in the field. However, both pathovars have different pathogenicity mechanisms. Psp has a narrow host range of field pea only, has an epiphytic phase [6] and consists of eight currently identified races [7,8,9,10]. In contrast, Pss is a heterogenous pathovar whose members are collectively able to cause disease in >200 different plant species [11]. Pss isolates from field pea can be differentiated based on pathogenicity and virulence response on a host and non-host plants such as field pea, other legume crops and non-legumes crops. Molecular testing such as repetitive PCR, multi-locus sequence typing (MLST) and syrB gene also differentiate them. Pss isolates from field pea are highly virulent on field pea, suggesting a possible pathogenic specialization in this group [12].
Traditionally, characterization of the Psp and Pss involved morphological studies and biochemical tests such as LOPAT profiling [13,14] which was time-consuming and couldn’t separate closely related isolates. Molecular testing such as endpoint PCR assays can distinguish between pathovars Psp [15] and Pss [16,17] accurately, but they require the processing of plant tissue either via DNA extraction or colony isolation, conducting a PCR reaction and gel electrophoresis. The application of one technology that has become increasingly popular in recent years for rapid laboratory and in-field detection of human, animal, and plant pathogens is loop-mediated isothermal amplification (LAMP) [18,19]. There are many advantages of LAMP over conventional PCR. LAMP is less sensitive to inhibitors. Therefore, it is adaptable for use with un-purified clinical and field samples [18].
In recent years, Pss has become the dominant pathogen causing BB of field peas in Australia [4,20] and outbreaks have become more frequent and destructive. To minimize the losses due to these outbreaks, the field pea breeding program actively breeds resistance against both Psp and Pss. Field pea surveys are conducted annually to determine the population dynamics of pathogens causing BB to inform the breeding program. Determining the causal pathogen associated with BB of field peas rapidly in-field would further aid the resistance breeding program. The objective of this study was to develop LAMP assays that could provide a rapid screening approach to detect and differentiate between Psp and Pss isolates in field pea and also provide the capability of in-field testing for the early detection of these pathogens. The approaches utilised in this study were (i) to design two separate LAMP assays for detection of Pss and Psp, (ii) validate these tests for both specificity and limit of detection (LOD), and (iii) evaluate the LAMP assays as a surveillance tool on field-collected plant and seed samples.

2. Materials and Methods

2.1. Bacterial Isolates

Bacterial isolates used in this study were sourced from culture collections of the Victorian Plant Pathology Herbarium (VPRI), Bundoora (Agriculture Victoria); and the Plant Pathology Herbarium (DAR), Department of Primary Industries, New South Wales (Table 1). The list contained 37 isolates each of Psp and Pss; 18 closely related isolates; and two Pseudomonas viridiflava (Pv) and one Pseudomonas cichorii (Pc). Pv and Pc were included in the study as an outgroup for genomic comparison and to validate LAMP assays. Fifty historical BB isolates from the Field Crops Pathology Laboratory at Horsham collections that were previously identified as Psp or Pss based on pathogenicity test on a bean, field pea and lemon stab according to Mazarei and Kerr 1990 [21] and maintained from the 1980s as a freeze-dried filter paper disc in vacuumed glass ampules, were revived and submitted to VPRI collection for use in this study.
In this study, the identity of isolates listed as Psp and Pss was confirmed with pathovar-specific PCR, targeting AN3/AN7 [15] and syrB [16] genes, respectively. All bacterial isolate cultures were initiated from single-colonies and maintained by monthly transfers on King’s B medium [23] at 28 °C for 3 to 5 days and stored long term at −80 °C in 20% glycerol in nutrient yeast broth (NYB).

2.2. Bioinformatics Pipeline for LAMP Primer Design

The unique genomic regions used for the Psp LAMP primer design were identified by whole-genome sequence data comparison of 23 isolates of the Pseudomonas syringae species complex. Ten isolates of Psp, comprising of Race 2 (VPRI 42161 and 42165), Race 3 (VPRI 42162), Race 4 (VPRI 42163), Race 6 (VPRI 42167, 42168, 42170, and 42171) and Race 7 (VPRI 42164) and ten isolates of Pss from different hosts (VPRI 22505, 32448, 42143, 42146, 42147, 42148, 42149, 42150, 42151, and 42607) as well as two isolates of Pseudomonas viridiflava (Pv) (VPRI 42172 and 42173), and one isolate of Pseudomonas cichorii (Pc), VPRI 42174, were included for comparison (Table 1). Firstly, the 10 sequences of the Psp were compared using the pairwise alignment tool Lastz, (www.bx.psu.edu/~rsharris/lastz/, 17 May 2021) [24] for extraction of the common sequences. These sequences were compared with the corresponding concatenated sequence from 10 Pss isolate sequences and three outgroup isolates sequences. The pipeline for the alignment and genome comparison has been submitted to GitHub (https://github.com/Pragya2019/Lamp-, 17 May 2021). Further, the sequences were compared to the NCBI public non-redundant nucleotide database using BLASTn [25] to ensure sequence specificity to Psp and not with other bacteria.
Pss-specific LAMP primers were designed using conserved sequences from the salA gene based on the previous work of Busot et al. (2015) [26] as it is associated with the regulation of syringomycin production explicit to Pss [27]. This region was identified in the Pss Type strains B301D and B728a with a single amino acid change between them and compared using BLASTn algorithm [25] to all sequences of Pss isolates sequenced in this study (see above).
Psp and Pss-specific LAMP primers were designed using PrimerExplorerV5 in http://primerexplorer.jp/lampv5e/index.html (accessed date 17 May 2021) following the default settings. Each primer set consisted of forward outer (F3), backward outer (B3), forward inner (FIP), backward inner (BIP), loop forward (LF) and loop backward (LB) primers (Table 2). The primers were synthesized from Sigma–Aldrich (Castle Hill, NSW, Australia).

2.3. LAMP Assay Validation

Initially, conventional PCR reactions using the outer primers, F3 and B3, of each LAMP primer set were run on two representative isolates, Psp (VPRI 42167) and Pss (VPRI 42143), and the resulting amplicons were sequenced to confirm the correct DNA target region was being amplified. Colony PCR reactions totalled 25 µL consisting of 12.5 µL MyTaq™ master mix (Bioline), 1 µL forward (F3) and reverse (B3) primers at a concentration of 1 µM each. Templates were prepared from 2 µL of heat-killed bacterial cells (concentration at the O.D of 0.2) and were run with the following conditions; 5 min at 94 °C followed by 35 cycles of 30 s at 94 °C, 30 s at 63 °C, and 30 s at 72 °C, and a final extension cycle at 72 °C for 5 min. Amplification of the correctly sized PCR products for Psp and Pss (251 and 273 bp, respectively) was confirmed by gel electrophoresis on 2% w/v agarose gel at 100 amp volt for 40 min. The target specificity of these PCR products was confirmed by Sanger sequencing.
LAMP reactions were done in a portable LAMP machine, Genie III® (OptiGene) using the assay profile of 65 °C for 30 min followed by melting curve analysis step (98–80 °C ramping at 0.1 per/min) for 10 min, or in a QuantStudio™ 3 Real-Time PCR machine (Thermo Fisher Scientific) creating the same profile with 120 cycles (30 min) at 65 °C and an in-built melt, was added at the end at 98 °C at 1.6 °C/s. LAMP reactions consisted of 20 µL volume containing 2 µL of the bacterial DNA sample, 10 µL GspSSD2.0 Isothermal Master Mix iso-004 buffer (OptiGene Ltd., West Sussex, UK), 0.2 µM each F3/B3 primer, 1.6 µM each FIP/BIP primer, 0.8 µM each LF/LB primer and 6 µL of water. A positive amplification plot showed an ‘S’ shaped sigmoid curve reflecting the increase in fluorescence detected and negative results stayed relatively flat. The amplification time or Time to positive (Tp) was determine in mins. The temperature of the anneal curve (Tm) was also recorded, indicating the product specificity (Figure 1).

2.3.1. Specificity Analysis

The specificity of the two LAMP assays was evaluated using 95 isolates of plant-associated bacteria (Table 1). Specifically, 37 isolates of Psp, 37 isolates of Pss and 18 isolates of closely related Pseudomonas species and other bacteria were tested to validate the Psp and Pss LAMP assays. Single bacterial colonies were diluted in 100 µL of water and a 2 µL sample of the bacterial suspensions were directly tested or heat-treated at 95 °C for 10 min and detection was done in the Genie III or QuantStudio™ PCR machine as previously described.

2.3.2. Limit of Detection

To determine the sensitivity of the LAMP assays, a 10-fold serial dilution (1 × 100 to 1 × 10⁻⁶) of bacterial cultures of Psp (VPRI 42167) and Pss (VPRI 42143) was prepared from a bacterial suspension of each isolate with an optical density of 0.2 (equivalent to 6.5 × 10⁸ CFU/mL) and tested using Psp and Pss LAMP assays as described above. One hundred microlitres of each serially diluted bacterial cell suspension were cultured in duplicate on KB media [23] and incubated for 48 h at 25 °C to determine the number CFU/mL.

2.4. LAMP as Surveillance and Diagnostic Tool

2.4.1. Early Detection of Bacterial Blight

To determine if a LAMP assay could detect the presence of Psp or Pss before the visual symptoms of BB appear on plants, an experiment was designed using the BB susceptible field pea variety Kaspa inoculated with Psp (VPRI 42166) and Pss (VPRI 42607) separately in the glasshouse conditions using the bacterial inoculation protocol described by Rodda et al. (2015) [20]. In brief, the experiment was designed in three replicates with three plants per pot and spray inoculated with a bacterial suspension of optical density of A600 = 0.2 supplemented with 0.05% v/v Pulse® Penetrant (Nufarm, Australia) as a surfactant. Plants were kept under misting for 5 min every 3 h for 3 days. Two leaves per plant from each replicate were taken each day from day one to seven post-inoculation or until visual symptoms were obvious. Plant tissues were washed with mild soap and rinsed three times with sterilized water before incubated overnight in 5 mL of sterilized water in a 4 °C fridge and 2 µL suspension was tested with the LAMP assays as described above. The non-inoculated and plants inoculated with water containing surfactant were used as a negative control.

2.4.2. Seed Testing

Seeds of BB susceptible variety Kaspa and the moderately BB resistant variety PBA Percy were used to examine if the LAMP assay could detect bacteria in BB infected seed. The seeds were sourced from naturally infected field peas from the Plant Breeding Center, Horsham in 2019. One hundred thrashed seeds were submerged in 300 mL of sterile phosphate saline buffer pH 7.0 in a 500 mL Schott bottle for 24 h at a cool temperature below 20 °C. The homogenate was serially diluted to 10−3 in sterile phosphate saline, and each dilution was tested using the Psp and Pss LAMP assays and plated out in triplicate on the semi-selective media containing sucrose-nutrient agar supplemented with boric acid, cefuroxime, cycloheximide and cephalexin [28]. The plates were incubated for 48 h at 25 °C and assessed for colony growth. A random 10 colonies were tested from each plate with the Psp and Pss-specific LAMP assays as described above.

2.4.3. Field Sample Testing

The two LAMP assays were applied on field pea plants from the field to identify which pathogen, Psp and/or Pss, was associated with the disease. In 2019, naturally infected 50 leaf samples from a field trial comprising 50 varieties were collected. Infected leaves and stems were washed with mild soap, rinsed three times with RO (reverse osmosis) water before wrapped with paper towels and kept in a plastic bag to store in a fridge and processed within one week. Two to three symptomatic leaves were submerged in 5 mL sterile distilled water overnight at 4 °C and 2 µL of the exudate suspension was directly used as a test for each sample using the Psp and Pss LAMP assays. Bacteria were also isolated from the infected leaves by plating on a semi-selective media. The colonies were tested as Psp or Pss and confirmed with PCR as described above.

3. Results

3.1. Primer Design and Development of the LAMP Assays

The Lastz alignment of all Psp isolates in this study identified a highly conserved sequence region of 507 bp, which was not identified in Pss isolates and closely related species of Pseudomonas species. The Blastn analysis indicated that this region shared 99.61% nucleotide identify with Psp strain PP1 [29] genome accession number NZ_CP034078.1 and nucleotide region of 1736718-1737224 bp. This region encodes for a 92 amino acid hypothetical protein GenBank accession RML51337.1. This 507 bp sequence was used for the primer design.
A 2347 bp region of the salA gene (Genebank number AF02280) from Pss strain B728a (Genbank accession N_007005.1) was conserved to all Pss. An 809 bp region spanning from nucleotide 3052738-3053546 (Genbank accession N_007005.1) showed 100% sequence similarity among the 10 Pss isolates sequenced in this study. This region was targeted for Pss-specific LAMP primer design using the custom Blastn comparisons in Geneious Prime (Auckland, New Zealand).
LAMP outer primers Psp_F3 and Psp_B3 (Table 2) amplified a 251 bp region when tested with Psp isolate (VPRI 42167), and amplification was observed when Pss isolate (VPRI 42143) was tested. Similarly, the outer primers Pss_F3 and Pss_B3 primers amplified a band of 273 bp when tested with bacterial cells of Pss isolate (VPRI 42143) and did not amplify any band with Psp isolates. Specificity was also confirmed by direct sequencing of the PCR products. The broader regions used for the LAMP assays primer designs were submitted to the GenBank with the accession number MZ043758 for Psp and MZ043758 for Pss.

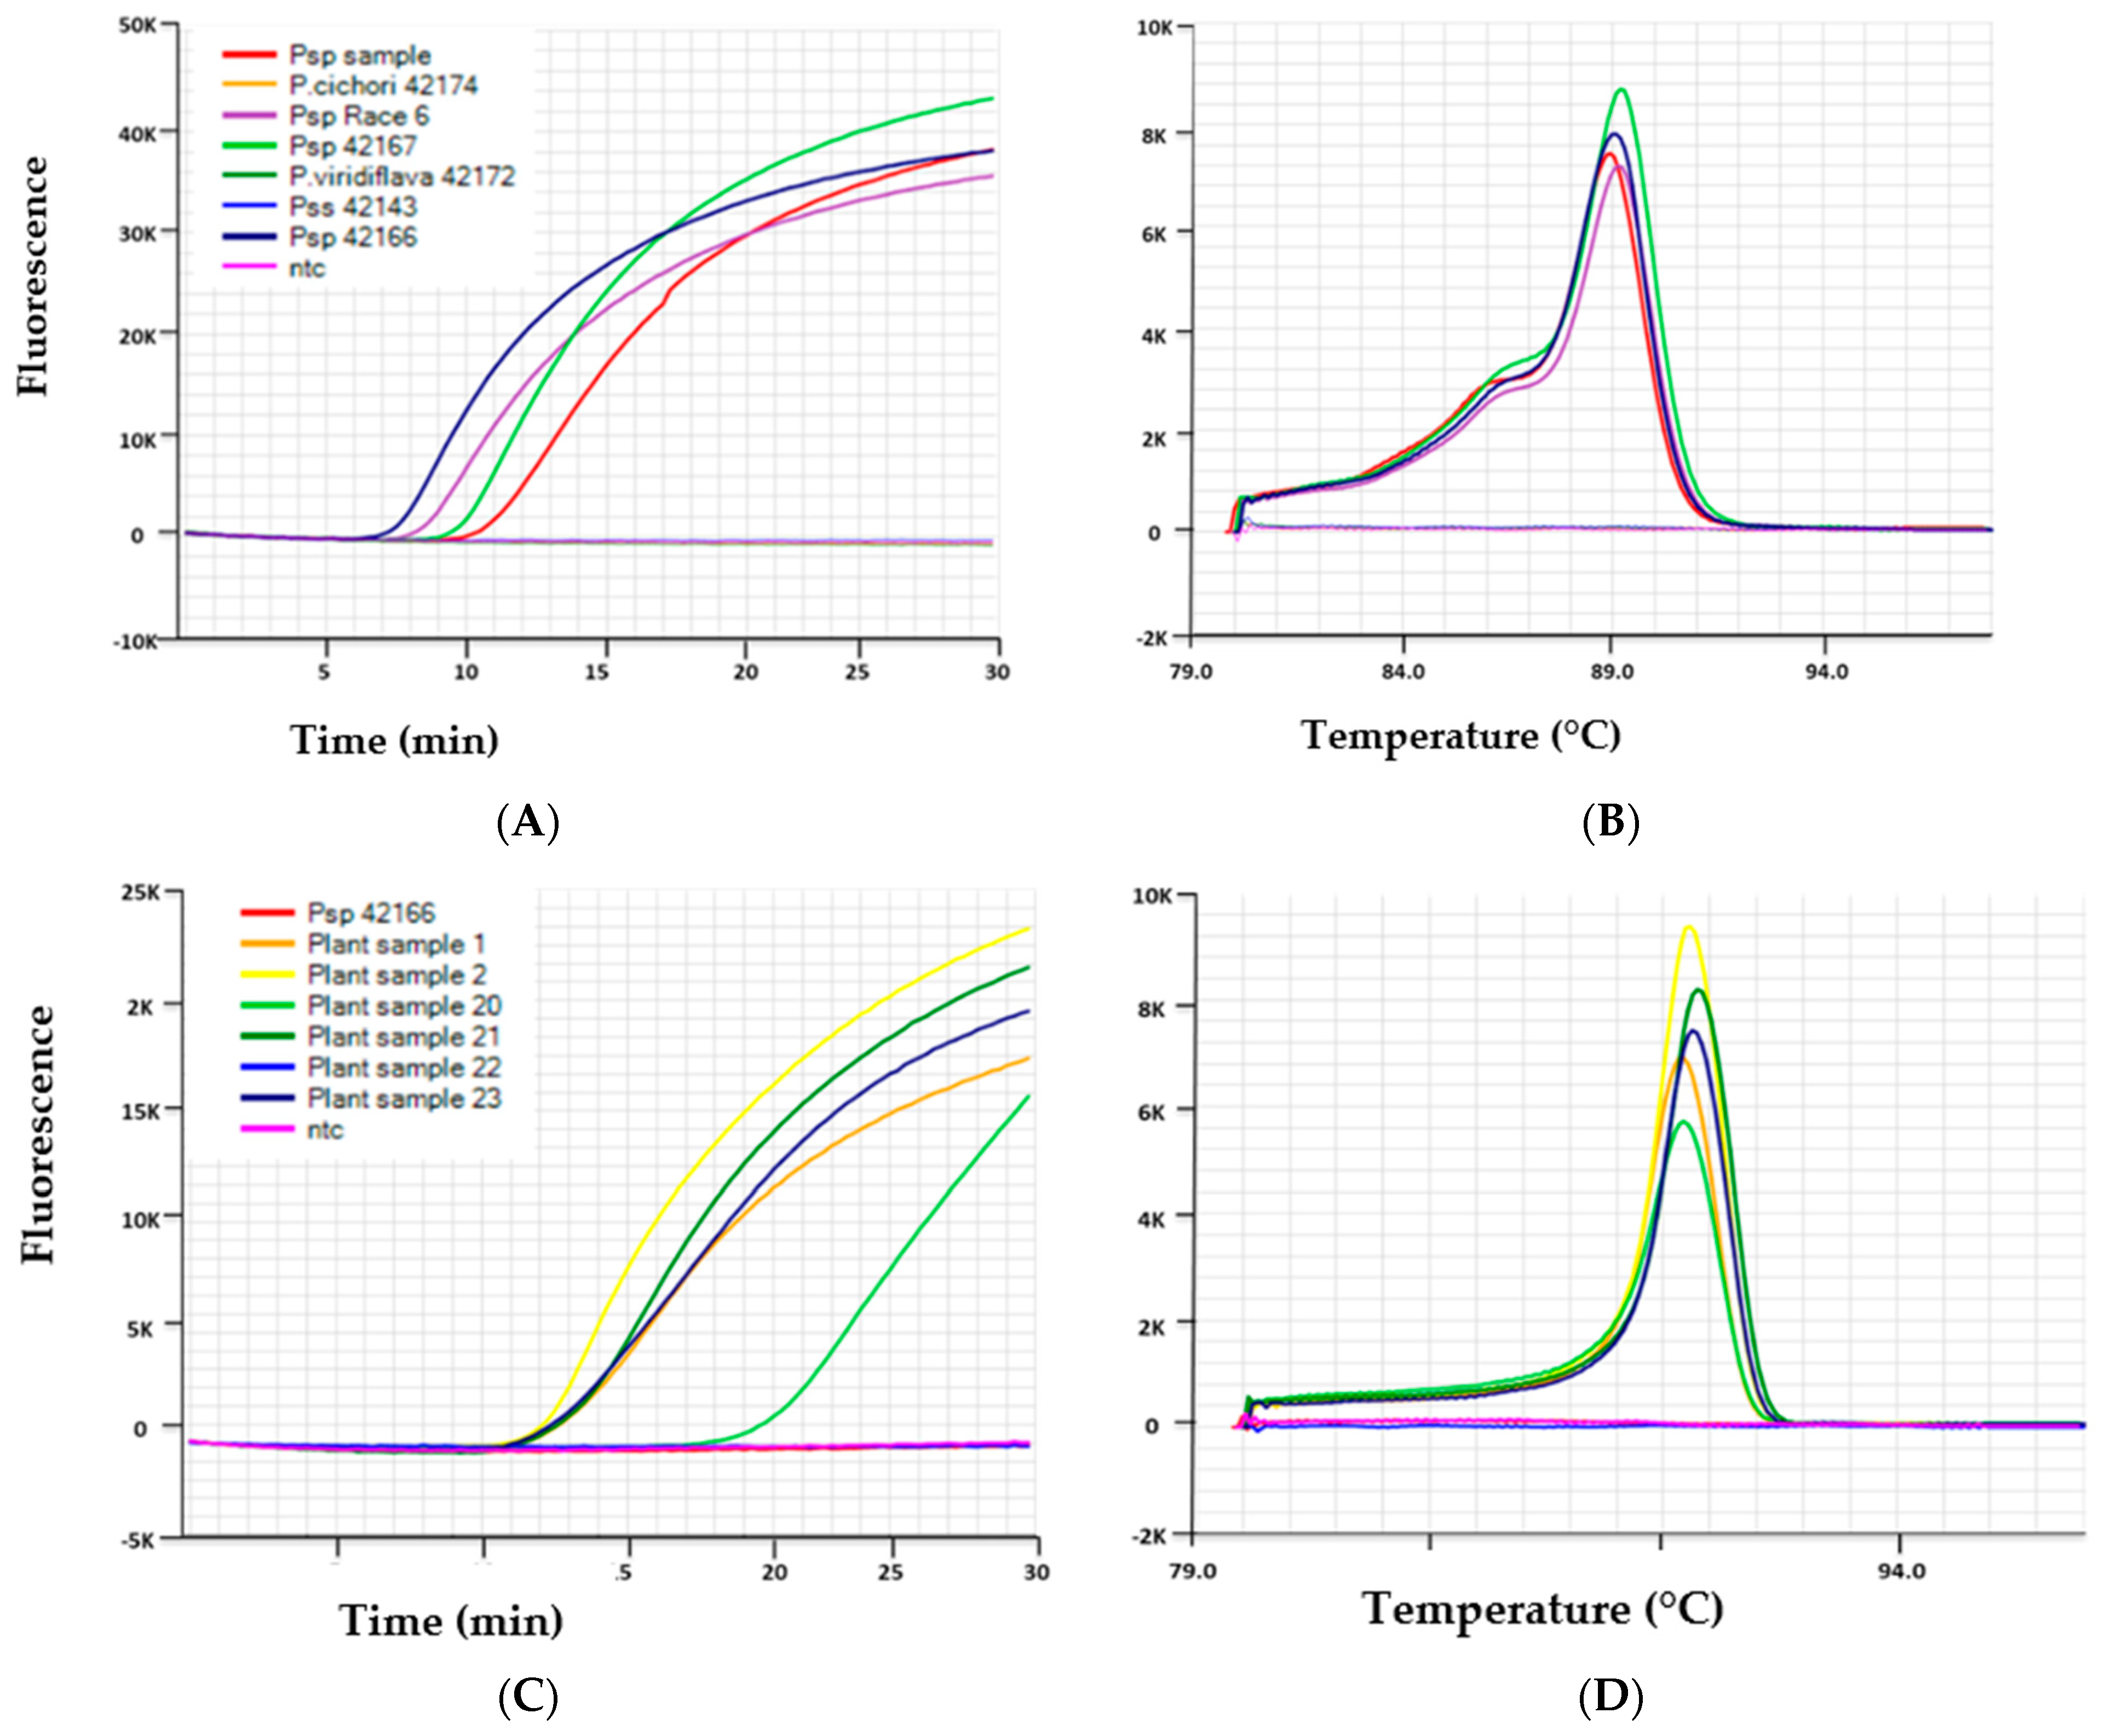
3.2. Specificity of the LAMP Assays

The LAMP assays for Psp and Pss were highly specific and did not show any amplification with closely related Pseudomonas species strains including Pv, Pc, P. corrugate, P. fluorescens, P. marginalis, P. putida, P. flectens, P. agarici, P. aeruginosa, P. pickettii, P. chlororaphis, P. tolaasii, as well as P. syringae pathovar coriandricola (Table 1). No amplification was observed for other bacterial species tested including Xanthomonas campestri, Erwinia chrysanthemi, and Ralstonia solanacearum.
Results for the Psp and Pss LAMP assays correlated with results of the specific PCR assays targeting the AN7 fragment (Psp) and syrB (Pss). The Psp specific LAMP generated positive amplification curves for all 37 Psp isolates included in this study but did not amplify any of the Pss or other bacterial isolates. A positive amplification curve was confirmed with an anneal derivative ranging from 89.6–90.1 for each positive sample. The Pss specific LAMP generated positive amplification curves for all 37 Pss isolates included in this study but did not amplify any of the Psp or other bacterial isolates. A positive amplification curve was confirmed with an anneal derivative ranging from 90.1–90.7 for each positive sample (Table 1). The Pss LAMP assay also detected Pss that were isolated from hosts other than field pea (Table 1).

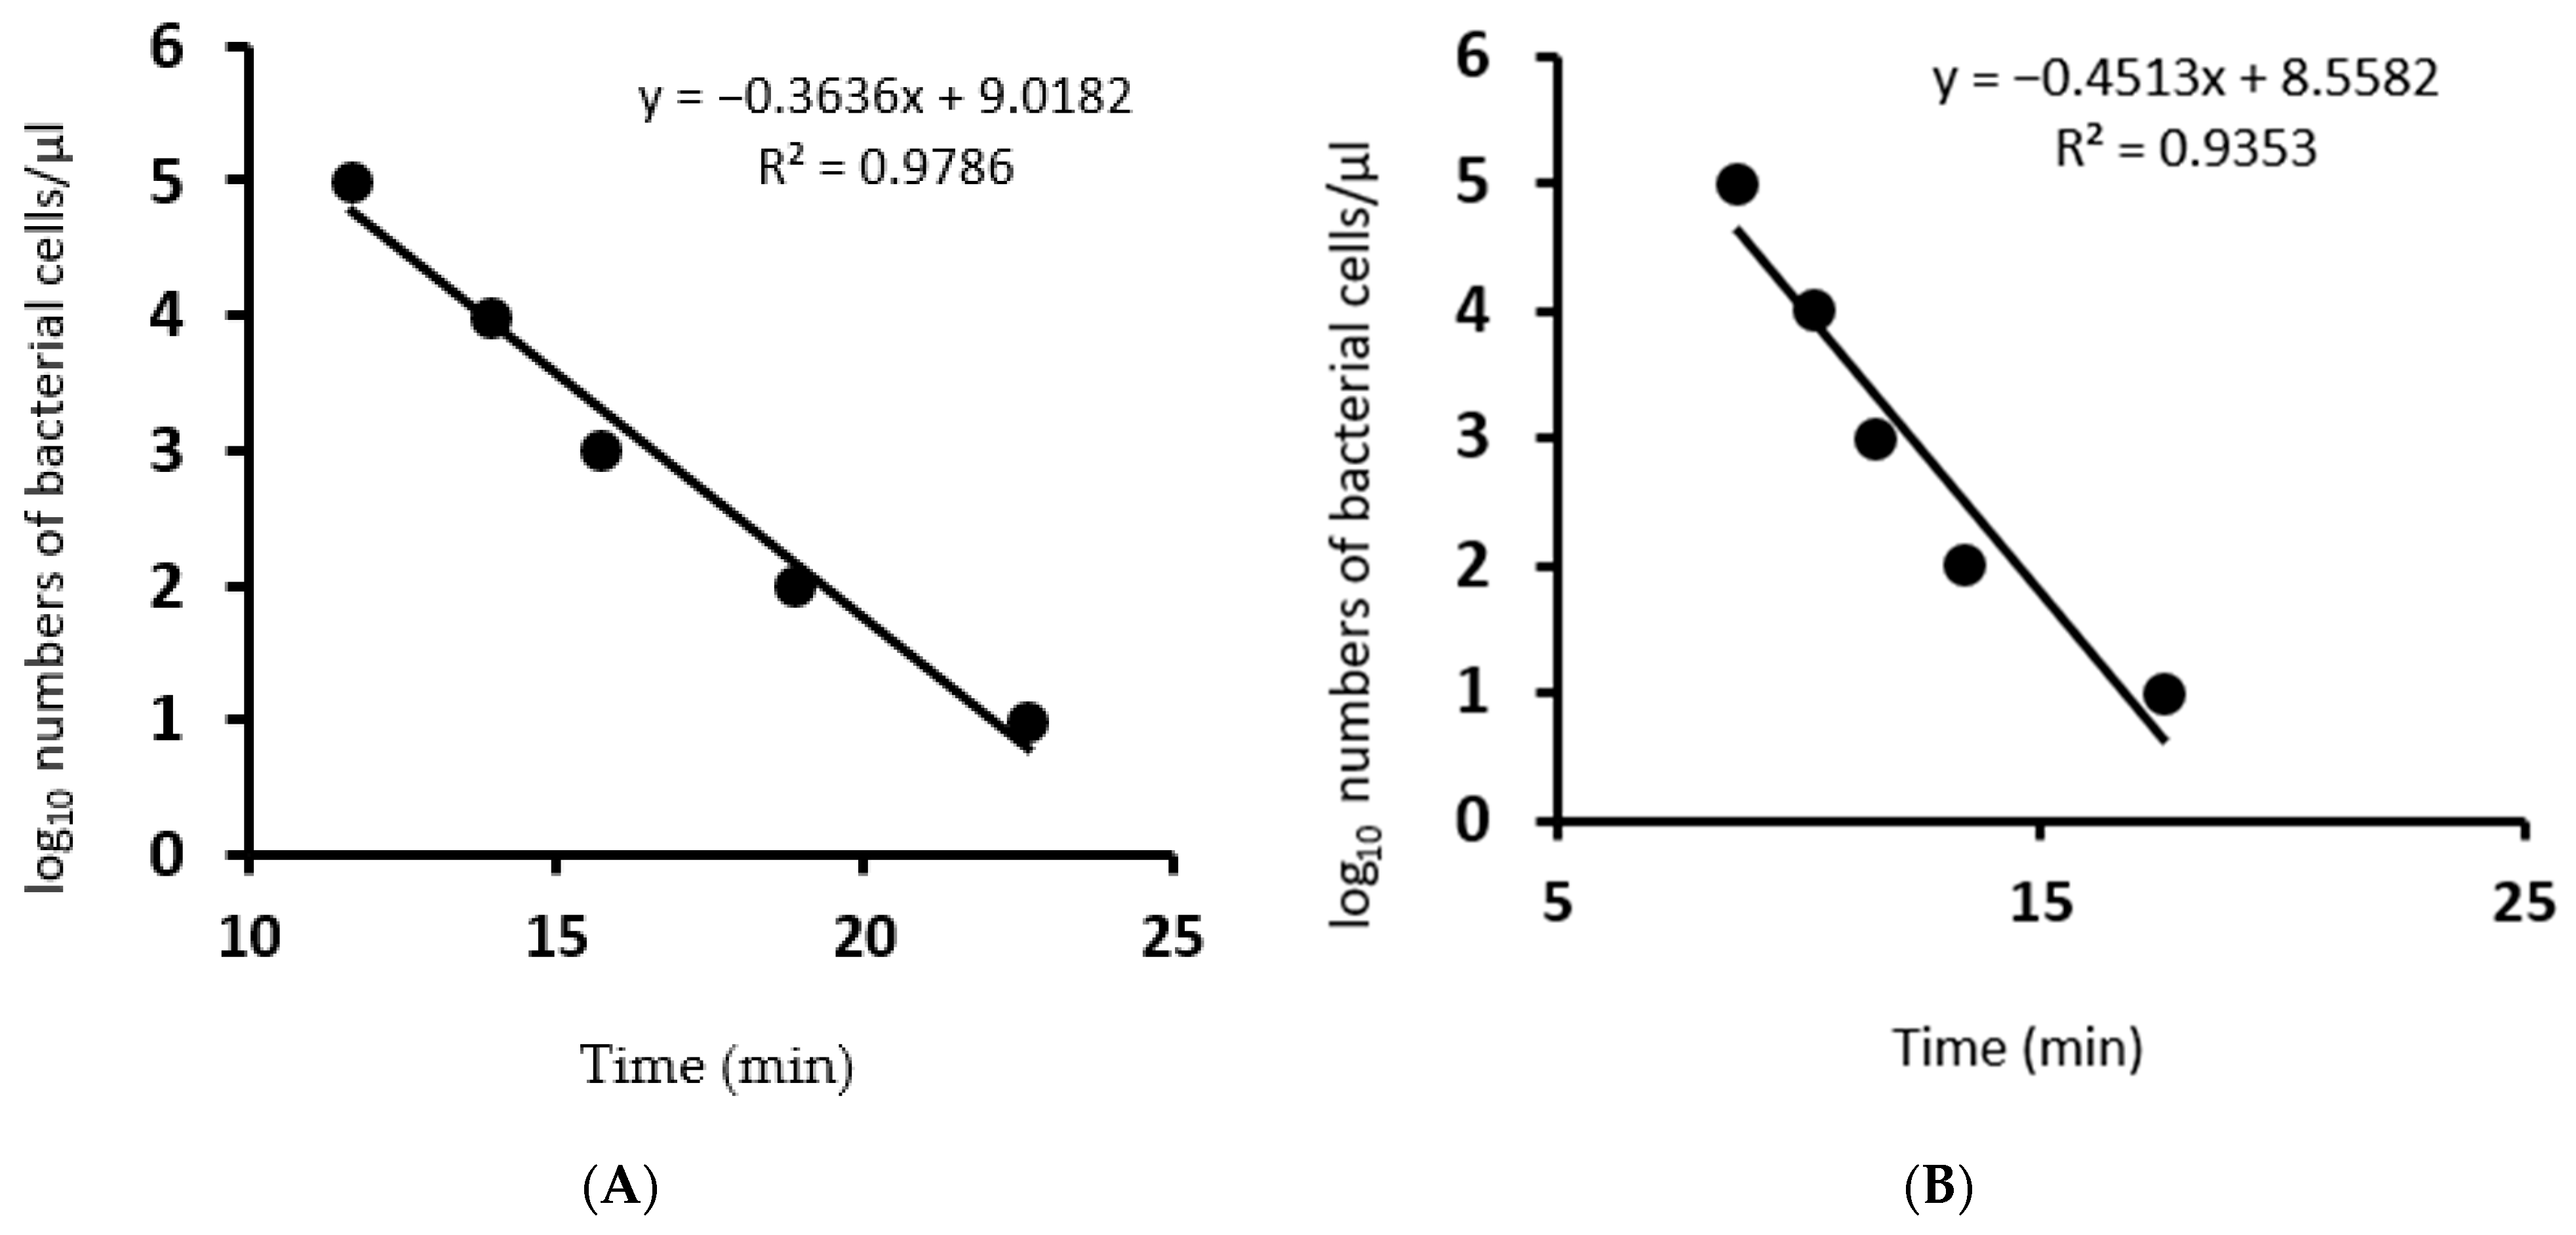
3.3. Limit of Detection

Specific LAMP assays for both Psp and Pss were highly sensitive achieving a limit of detection of 2.5 × 10² CFU/mL for isolate Psp (VPRI 42167) and 1.7 × 10² CFU/mL for Pss (VPRI 42143), respectively. The limit of detection was calculated by correlation of CFU concentration per micro litres and the number of PCR cycles required for serial dilution of Psp (R2 = 0.9786) and Pss (R2 = 0.9587) using the QuantStudio™ real-time PCR (Figure 2).

3.4. LAMP as Surveillance and Diagnostic Tool

3.4.1. Early Detection of Bacterial Blight

A time-course experiment showed the Psp- and Pss-specific LAMP assays were able to detect the presence of Pss and Psp in planta before the visual symptoms became obvious. Precautions were taken to use washed leaves so that the bacteria multiplying in the plant cells were detected. LAMP assays detected the presence of bacteria as early as four- and three days post-inoculation for Psp and Pss, respectively (Table 3). The Time to positive (Tp) was gradually decreased from 27 min to 10 min from three days to ten days post-infection, respectively for Psp. The plants infected with Pss had lower Tp as compared to the plants infected with Psp on each day after inoculation. Although there were no significant differences in the Tp between the days after inoculation, an average time for the amplification in the LAMP assays decreased with the increase in the days after inoculation (Table 3), suggesting the increase in bacteria multiplying in the plant. The initial visual symptoms of water soaking developed in seven days post-inoculation for both pathogens and took 10 days to develop obvious symptoms of BB where the infected tissues became pale and started to develop necrosis. No amplification was observed from either test when leaves from uninoculated negative control plants or plants treated with surfactant alone were tested.

3.4.2. Detection of Bacteria from Seeds

The serial dilution of 10−1, 10−2 and 10−3 of the seed suspensions showed an average Tp from 12 ± 5.1, 14 ± 2.9 and 17 ± 2.5 min in Pss LAMP assays. Seed suspensions of 10−3 had an average of 373 ± 35 CFU mL−1 when isolates from Kaspa were plated, whereas the bacterial suspension from PBA Percy had and 244 ± 15 CFU mL−1. All representative colonies tested were positive in the Pss LAMP assay and negative in the Psp LAMP assay.

3.4.3. Field Sample Testing

As a surveillance tool, the two LAMP assays were applied on the 50 BB naturally infected field pea varieties from the historical variety trial PHIST19. All the samples were found to be infected with Pss and not with Psp (Table 4). There was variability in the Tp recorded, ranging from 5.4 to 22.6. Interestingly, the susceptible Kaspa had, on average, a lower Tp than other field pea varieties suggesting higher bacterial colonies. The colonies isolated from these samples were confirmed with syrB gene amplification in a PCR as Pss.

4. Discussion

The LAMP assays described here are rapid and reliable detection methods for Pss and Psp from field pea in-field and in the laboratory. The LAMP assays worked efficiently on the BB infected plant and seed suspensions without requiring any specialised equipment for sample preparation. This enabled testing on-farm, thus obviating the extra cost and time utilised for DNA extraction kits or plating in the laboratory. The LAMP assays were shown to be extremely sensitive, with a detection limit of 2.5 × 10² CFU mL−1 for the Psp-specific assay and 1.7 × 10² CFU mL−1 for the Pss-specific assay directly from a bacterial suspension. If the sample was identified as Psp, no cross-reactivity was observed with the Pss LAMP assay and vice versa. This provided confidence in applying these LAMP tests to support large surveillance programs for rapid testing. Both pathovars were detected in-planta from infected samples within 5 to 20 min using the LAMP assays, which clearly demonstrates the utility of this method as an accurate, consistent, efficient and simple in-field assay when compared to existing lab-based PCR protocols [15,16].
Detection of the pathovars causing BB in field pea was confirmed as early as 3–4 days after infection which was one week earlier than the characteristic visual BB symptoms appeared [3,20]. Early detection of BB in the field can help in studying host-pathogen interactions for the two pathovars and phenotyping resistance in field pea breeding trials. These LAMP assays also accurately detected the presence of Psp or Pss in seed samples, further broadening their potential use.
Both assays achieved 100% specificity on our validation panel of 95 bacterial isolates. No false positives or false negatives were observed when the assays were validated with the alternate field pea pathovar, 37 isolates each of Psp and Pss and 18 strains of Pseudomonas species and other bacteria. The results for the two LAMP assays also correlated with established lab-based culturing and PCR methodology.
Ten isolates that represented Psp races 2, 3, 4, 6, and 7 were incorporated into this study to ensure the genetic diversity within the target group would be detected by the Psp LAMP assay. This is particularly important for Pseudomonads, which are a biologically and genetically diverse group [30]. Races 2, 3, and 6 are present in Australia and Race 4, which is present in the UK, was also included. The Psp LAMP assay identified isolates of these races correctly indicating that the LAMP assay can be applied in other parts of the world.
For Pss, the salA gene was a good target for primer design as it is present in all Pss representative genomes available in NCBI and Pss used in this study. The salA gene is a key regulatory element for syringomycin production which is essential for virulence, growth, and survival for Pss [31]. The salA gene functions as a transcriptional activator of more than one gene or operon for three major toxins syringomycin, syringopeptin and syringolin responsible for virulence effects in Pss [27]. The LAMP assay for Pss was validated on isolates that were collected from various hosts including field pea and bean as well as horticulture crops such as Orange (Citrus sinensis), Plum (Prunus domestica) and Impatiens species, showing the potential capability of the LAMP assay for Pss surveillance activities in other crops (although this has not been validated). In this study, the Pss LAMP assay was able to differentiate Pss, Pseudomonas viridiflava and Pseudomonas cichorii, all species that can infect a broad range of plant species and cause blight diseases [32,33].
Testing of naturally infected field pea tissue and seed samples from Victorian surveillance dating from 1983 to 2019 with the Psp and Pss-specific LAMP assays only detected the presence of Pss. This result was confirmed using PCR. It was reported previously for the first time by Richardson et al., (2011) that reports from the 1990′s showed Psp as the most devastating of the two pathovars in Australia [7,9]. LAMP assays detected Pss, which were reconfirmed with PCR shows that these LAMP assays can be utilized for the large sample testing efficiently and to provide clear knowledge of the pathovar prevalence in field pea pre-breeding research, breeding trials, and farmers crops.
In summary, two LAMP assays were developed that have been successfully shown to identify Pseudomonas syringae infecting field pea to the pathovar level, as Psp or Pss. These assays offer portability to conduct tests in the laboratory or in field. The assays have rapid time to positive outputs, within 20 min, which is significantly quicker than the conventional PCR methods available for pathovar specificity. The assays were suitable for testing naturally infected plant tissue and seed samples for the presence of Psp and Pss without isolating the bacteria. The assays were shown to be rapid and sensitive, being capable of detecting their target pathogens in-planta before visual symptoms were observed. The suitability of these tests for surveillance is further evident by the assays already being taken up by BB field pea surveillance that informs the Australian breeding program.

Author Contributions

Conceptualization, P.K., G.R., B.R.; methodology, P.K., R.M.; bioinformatics, P.K., M.F.; experiments, P.K.; writing and review P.K., B.R., R.M., G.H., G.R. All authors have read and agreed to the published version of the manuscript.

Funding

This research received joined funding from Grains Research and Development Corporation (GRDC) and Agriculture Victoria under project “DAV1607-010BLX 9176093 PulseBio 3 Stable grain yield in pulses through improved stress tolerance”.

Conflicts of Interest

The authors declare no conflict of interest.

References

  1. Bull, C.T.; De Boer, S.H.; Denny, T.P.; Firrao, G.; Fisher-Le Saux, M.; Saddler, G.S.; Scortichini, M.; Stead, D.E.; Takikawa, Y. Comprehensive list of names of plant pathogenic bacteria, 1980–2007. J. Plant Pathol. 2010, 92, 551–592. [Google Scholar]
  2. Young, J. Taxonomy of Pseudomonas syringae. J. Plant Pathol. 2010, 92 (Suppl. 1), S5–S14. [Google Scholar]
  3. Martín-Sanz, A.; Palomo, J.; Pérez de la Vega, M.; Caminero, C. Identification of pathovars and races of Pseudomonas syringae, the main causal agent of bacterial disease in pea in North-Central Spain, and the search for disease resistance. Eur. J. Plant Pathol. 2011, 129, 57–69. [Google Scholar] [CrossRef]
  4. Richardson, H.J.; Hollaway, G.J. Bacterial blight caused by Pseudomonas syringae pv. syringae shown to be an important disease of field pea in south eastern Australia. Australas. Plant Pathol. 2011, 40, 9. [Google Scholar] [CrossRef]
  5. Roberts, S.; Phelps, K.; McKeown, B.; Heath, M.; Cockerell, V. Effect of pea bacterial blight (Pseudomonas syringae pv. pisi) on the yield of spring sown combining peas (Pisum sativum). Ann. Appl. Biol. 1995, 126, 61–73. [Google Scholar] [CrossRef]
  6. Grondeau, C.; Mabiala, A.; Ait-Oumeziane, R.; Samson, R. Epiphytic life is the main characteristic of the life cycle of Pseudomonas syringae pv. pisi, pea bacterial blight agent. Eur. J. Plant Pathol. 1996, 102, 353–363. [Google Scholar] [CrossRef]
  7. Taylor, J.; Dye, D. A survey of the organisms associated with bacterial blight of peas. N. Z. J. Agric. Res. 1972, 15, 432–440. [Google Scholar] [CrossRef] [Green Version]
  8. Bevan, J.R.; Taylor, J.D.; Crute, I.R.; Hunter, P.J.; Vivian, A. Genetics of specific resistance in pea (Pisum sativum) cultivars to seven races of Pseudomonas syringae pv. pisi. Plant Pathol. 1995, 44, 98–108. [Google Scholar] [CrossRef]
  9. Hollaway, G.J.; Bretag, T.W.; Price, T.V. The epidemiology and management of bacterial blight (Pseudomonas syringae pv. pisi) of field pea (Pisum sativum) in Australia: A review. Aust. J. Agric. Res. 2007, 58, 1086–1099. [Google Scholar] [CrossRef]
  10. Martín-Sanz, A.; Pérez de la Vega, M.; Caminero, C. Resistance to Pseudomonas syringae in a collection of pea germplasm under field and controlled conditions. Plant Pathol. 2011, 61, 375–387. [Google Scholar] [CrossRef]
  11. Bradbury, J. Guide to Plant Pathogenic Bacteria; CAB International Mycological Institute: London, UK, 1986; 334p. [Google Scholar]
  12. Martín-Sanz, A.; de la Vega, M.P.; Murillo, J.; Caminero, C. Strains of Pseudomonas syringae pv. syringae from pea are phylogenetically and pathogenically diverse. Phytopathology 2013, 103, 673–681. [Google Scholar] [CrossRef] [Green Version]
  13. Schaad, N.W.; Jones, J.B.; Chun, W. Laboratory Guide for the Identification of Plant Pathogenic Bacteria; APS Press: St. Paul, MN, USA, 2001. [Google Scholar]
  14. Lelliott, R.; Billing, E.; Hayward, A. A determinative scheme for the fluorescent plant pathogenic Pseudomonads. J. Appl. Bacteriol. 1966, 29, 470–489. [Google Scholar] [CrossRef]
  15. Arnold, D.L.; Athey-Pollard, A.; Gibbon, M.J.; Taylor, J.D.; Vivian, A. Specific oligonucleotide primers for the identification of Pseudomonas syringae pv. pisi yield one of two possible DNA fragments by PCR amplification: Evidence for phylogenetic divergence. Physiol. Mol. Plant Pathol. 1996, 49, 233–245. [Google Scholar] [CrossRef]
  16. Sorensen, K.N.; Kim, K.-H.; Takemoto, J.Y. PCR Detection of Cyclic Lipodepsinonapeptide-Producing Pseudomonas syringae pv. syringae and Similarity of Strains. Appl. Environ. Microbiol. 1998, 64, 226–230. [Google Scholar] [CrossRef] [PubMed] [Green Version]
  17. Bultreys, A.; Gheysen, I. Biological and molecular detection of toxic lipodepsipeptide-producing Pseudomonas syringae strains and PCR identification in plants. Appl. Environ. Microbiol. 1999, 65, 1904–1909. [Google Scholar] [CrossRef] [Green Version]
  18. Best, N.; Rawlin, G.; Suter, R.; Rodoni, B.; Beddoe, T. Optimization of a Loop Mediated Isothermal Amplification (LAMP) Assay for In-Field Detection of Dichelobacter nodosus with aprV2 (VDN LAMP) in Victorian Sheep Flocks. Front. Vet. Sci. 2019, 6. [Google Scholar] [CrossRef] [Green Version]
  19. Li, X.; Nie, J.; Ward, L.J.; Nickerson, J.; De Boer, S.H. Development and evaluation of a loop-mediated isothermal amplification assay for rapid detection and identification of Pectobacterium atrosepticum. Can. J. Plant Pathol. 2011, 33, 447–457. [Google Scholar] [CrossRef]
  20. Rodda, M.; Kant, P.; Lindbeck, K.; Gnanasambandam, A.; Hollaway, G. A high-throughput glasshouse based screening method to evaluate bacterial blight resistance in field pea (Pisum sativum). Australas. Plant Pathol. 2015, 44, 515–526. [Google Scholar] [CrossRef]
  21. Mazarei, M.; Kerr, A. Distinguishing pathovars of Pseudomonas syringae on peas: Nutritional, pathogenicity and serological tests. Plant Pathol. 1990, 39, 278–285. [Google Scholar] [CrossRef]
  22. Jakob, K.; Kniskern, J.M.; Bergelson, J. The role of pectate lyase and the jasmonic acid defense response in Pseudomonas viridiflava virulence. Mol. Plant-Microbe Interact. 2007, 20, 146–158. [Google Scholar] [CrossRef] [Green Version]
  23. King, E.O.; Ward, M.K.; Raney, D.E. Two simple media for the demonstration of pyocyanin and fluorescin. J. Lab. Clin. Med. 1954, 44, 301–307. [Google Scholar] [PubMed]
  24. Harris, R.S. Improved Pairwise Alignmnet of Genomic DNA; The Pennsylvania State University: University Park, PA, USA, 2007. [Google Scholar]
  25. Chen, Y.; Ye, W.; Zhang, Y.; Xu, Y. High speed BLASTN: An accelerated MegaBLAST search tool. Nucleic Acids Res. 2015, 43, 7762–7768. [Google Scholar] [CrossRef] [Green Version]
  26. Busot, G.; Arif, M.; Stack, J. Genome analysis of nonpathogenic Pseudomonas syringae: Secretion systems, effectors and toxins. In Proceedings of the APS Annual Meeting, Pasadena, CA, USA, 1–5 August 2015; p. 758. [Google Scholar]
  27. Lu, S.-E.; Scholz-Schroeder, B.K.; Gross, D.C. Characterization of the salA, syrF, and syrG regulatory genes located at the right border of the syringomycin gene cluster of Pseudomonas syringae pv. syringae. Mol. Plant-Microbe Interact. 2002, 15, 43–53. [Google Scholar] [CrossRef] [PubMed] [Green Version]
  28. Hollaway, G.J.; Bretag, T.W. The occurrence of Pseudomonas syringae pv. pisi in field pea (Pisum sativum) crops in the Wimmera region of Victoria, Australia. Australas. Plant Pathol. 1995, 24, 133–136. [Google Scholar] [CrossRef]
  29. Baltrus, D.A.; Dougherty, K.; Beckstrom-Sternberg, S.M.; Beckstrom-Sternberg, J.S.; Foster, J.T. Incongruence between multi-locus sequence analysis (MLSA) and whole-genome-based phylogenies: Pseudomonas syringae pathovar pisi as a cautionary tale. Mol. Plant Pathol. 2014, 15, 461–465. [Google Scholar] [CrossRef]
  30. Silby, M.W.; Winstanley, C.; Godfrey, S.A.; Levy, S.B.; Jackson, R.W. Pseudomonas genomes: Diverse and adaptable. FEMS Microbiol. Rev. 2011, 35, 652–680. [Google Scholar] [CrossRef] [Green Version]
  31. Lu, S.-E.; Wang, N.; Wang, J.; Chen, Z.J.; Gross, D.C. Oligonucleotide microarray analysis of the salA regulon controlling phytotoxin production by Pseudomonas syringae pv. syringae. Mol. Plant-Microbe Interact. 2005, 18, 324–333. [Google Scholar] [CrossRef]
  32. Wilkie, J.P.; Dye, D.W.; Watson, D.R.W. Further hosts of Pseudomonas viridiflava. N. Z. J. Agric. Res. 1973, 16, 315–323. [Google Scholar] [CrossRef]
  33. Paula Wilkie, J.; Dye, D.W. Pseudomonas cichorii causing tomato and celery diseases in New Zealand. N. Z. J. Agric. Res. 1974, 17, 123–130. [Google Scholar] [CrossRef]
Figure 1. Results of LAMP assays shown as amplification curves (A,C) and melt curves (B,D) performed on Genie® III with representative samples. (A): The Psp LAMP assay generated positive amplification curves from Psp isolates VPRI 42166 (Race 3), VPRI 42167 (Race 6), Psp plant sample, and no amplification (depicted by a flat line) from isolates of Pss VPRI 42143, P. viridiflava VPRI 42172 and P. cichorii VPRI 42174. (B): Melt curves produced anneal derivative from the positive samples of Psp with a range of 89.6–90.1 which is indicative of a positive result for this assay. (C): The Pss LAMP assay generated positive amplification curves from Pss positive plant samples 1, 2, 20, 21 and 23 and no amplification from Psp 42166 and ntc. (D): Melt curves produced from the positive samples of Pss with an anneal derivative range of 90.1–90.7, which is indicative of a positive result for this assay.
Agriculture 11 00875 g001
Figure 2. Regression curves generated in the LAMP assays for serial dilutions of live bacterial culture. Time to positive (Tp) is plotted against the log10 bacterial cells µL−1. (A): Pseudomonas syringae pathovar pisi primers, (B): Pseudomonas syringae pathovar syringae primers.
Agriculture 11 00875 g002
Table 1. Description of isolates used for designing and validation of the loop-mediated isothermal amplification (LAMP) assays for the detection of Pseudomonas syringae pathovars pisi (Psp) and Pseudomonas syringae pathovars syringae (Pss).
IdentityCollectionNumbersYear of CollectionHost PlantPathovar-Specific PCRTime to Positive for Psp Anneal DerivativeTime to Positive for Pss Anneal DerivativeReference
P. cichoriiVPRI42,1741986Lactuca sativa (Lettuce)NDUDUDUDUD
P. viridiflavaVPRI42,1722003Pisum sativum (Field Pea)PELUDUDUDUD
P. viridiflavaVPRI42,1731987Ranunculus sp. (Buttercup)PELUDUDUDUD[22]
Psp Race2VPRI42,1611944Pisum sativum (Field Pea)Psp5.690.1UDUD[22]
Psp Race2VPRI42,1651992Pisum sativum (Field Pea)Psp7.790.1UDUD[23]
Psp Race3VPRI42,1621975Pisum sativum (Field Pea)Psp8.089.9UDUD[22]
Psp Race3VPRI42,1661992Pisum sativum (Field Pea)Psp5.489.6UDUD[20]
Psp Race4VPRI42,1631975Pisum sativum (Field Pea)Psp4.689.6UDUD[22]
Psp Race6VPRI42,1672003Pisum sativum (Field Pea)Psp4.989.9UDUD[20]
Psp Race6VPRI42,1682001Pisum sativum (Field Pea)Psp9.689.7UDUD
Psp Race6VPRI42,1701993Pisum sativum (Field Pea)Psp8.089.8UDUD
Psp Race6VPRI42,1711993Pisum sativum (Field PeaPsp9.689.7UDUD[23]
Psp Race7VPRI42,164NAPisum sativum (Field Pea)Psp9.289.7UDUD[3]
PssVPRI42,1461981Phaseolus vulgaris (French Bean)PssUDUD5.590.7
PssVPRI42,1471978Prunus domestica (Plum)PssUDUD3.790.3
PssVPRI22,505NAPrunus domestica (Rosaceae)PssUDUD4.690.1
PssVPRI32,448NAImpatiens sp. [Balsaminaceae]PssUDUD4.891.7
PssVPRI42,1481983Pisum sativum (Field Pea)PssUDUD4.890.5[21]
PssVPRI42,1491984Pisum sativum (Field Pea)PssUDUD5.790.7[21]
PssVPRI42,1502003Pisum sativum (Field Pea)PssUDUD3.890.7
PssVPRI42,1432012Phaseolus vulgaris (French Bean)PssUDUD6.790.7[20]
PssVPRI42,1512003Pisum sativum (Field Pea)PssUDUD5.690.7[20]
PssVPRI42,6072014Pisum sativum (Field Pea)PssUDUD5.690.6
PssVPRI21,2251996Prunus persica [Rosaceae]PssUDUD5.790.5
PssVPRI42,8272016Vicia faba [Fabaceae]PssUDUD4.690.6
PssVPRI41,5261999Brassica oleracea [Brassicaceae]PssUDUD5.690.7
PssVPRI32,6622006Grevillea sp. [Proteaceae]PssUDUD8.590.7
Pseudomonas marginalisVPRI32,7822006Pastinaca sativa [Apiaceae]NDUDUDUDUD
Pseudomonas fluorescensVPRI41,5641996Lactuca sativa [Asteraceae]NDUDUDUDUD
Pseudomonas fluorescensVPRI41,2132007Beta vulgaris [Chenopodiaceae]NDUDUDUDUD
Pseudomonas corrugataVPRI41,5701997Solanum lycopersicum [Solanaceae]NDUDUDUDUD
Pseudomonas marginalisVPRI32,6832006Hesperis matronalis [Brassicaceae]NDUDUDUDUD
Pseudomonas syringae pv. coriandricolaVPRI41,5692003Coriandrum sativum [Apiaceae]NDUDUDUDUD
Pseudomonas putidaVPRI32,3992002Solanum tuberosum [Solanaceae]NDUDUDUDUD
Pseudomonas agariciDAR41,3211982Agaricus bisporus (Lange) ImbachNDUDUDUDUD
Pseudomonas pickettiiDAR65,900NAClavicipitaceaeNDUDUDUDUD
Pseudomonas aeruginosaDAR41,3541983ClavicipitaceaeNDUDUDUDUD
Pseudomonas tolaasiiDAR35,636NAClavicipitaceaeNDUDUDUDUD
Pseudomonas chlororaphisDAR76,1222001Brassica napus L. var napusNDUDUDUDUD
Xanthomonas campestrisVPRI32,436NANANDUDUDUDUD
Xanthomonas campestrisVPRI41,5211997Eriostemon sp.NDUDUDUDUD
Erwinia chrysanthemiVPRI42,3931998Zingiber officinale RoscoeNDUDUDUDUD
Erwinia chrysanthemiVPRI42,3921978Solanum tuberosum LNDUDUDUDUD
Ralstonia solanacearumVPRI42,6792015Solanum tuberosum L.NDUDUDUDUD
Ralstonia solanacearumVPRI42,6772015Solanum tuberosum LNDUDUDUDUD
PssVPRI43,4442007Pisum sativum (Field Pea)PssUDUD7.490.2
PssVPRI43,4452007Pisum sativum (Field Pea)PssUDUD7.490.6
PssVPRI43,4462007Pisum sativum (Field Pea)PssUDUD7.490.5
PssVPRI43,4491990Pisum sativum (Field Pea)PssUDUD8.290.7
PssVPRI43,4501983Pisum sativum (Field Pea)PssUDUD17.490.3
PssVPRI43,4512007Pisum sativum (Field Pea)PssUDUD10.390.5
PssVPRI43,4521989Pisum sativum (Field Pea)PssUDUD8.490.5
PssVPRI43,4531989Pisum sativum (Field Pea)PssUDUD10.490.5
PssVPRI43,4542007Pisum sativum (Field Pea)PssUDUD8.190.7
PssVPRI43,4551989Pisum sativum (Field Pea)PssUDUD7.990.7
PssVPRI43,4561989Pisum sativum (Field Pea)PssUDUD8.390.7
PssVPRI43,4571989Pisum sativum (Field Pea)PssUDUD10.390.6
PssVPRI43,4581989Pisum sativum (Field Pea)PssUDUD7.590.5
PssVPRI434601989Phaseolus vulgaris (French Bean)PssUDUD7.590.4
PssVPRI43,4611991NAPssUDUD8.090.5
PssVPRI43,4621989NAPssUDUD5.790.4
PssVPRI43,4631991NAPssUDUD8.890.5
PssVPRI43,4641991Pisum sativum (Field Pea)PssUDUD8.190.3
PssVPRI43,4651991Pisum sativum (Field Pea)PssUDUD8.690.5
PssVPRI43,4662007Pisum sativum (Field Pea)PssUDUD10.490.5
PssVPRI43,4671991Pisum sativum (Field Pea)PssUDUD8.690.4
PssVPRI43,4981991Pisum sativum (Field Pea)PssUDUD8.490.5
PssVPRI43,4821991Pisum sativum (Field Pea)PssUDUD6.890.4
PspVPRI43,4681991Pisum sativum (Field Pea)Psp11.489.8UDUD
PspVPRI43,4751991Pisum sativum (Field Pea)Psp5.689.7UDUD
PspVPRI43,4761991Pisum sativum (Field Pea)Psp6.589.7UDUD
PspVPRI43,4772007Pisum sativum (Field Pea)Psp5.889.9UDUD
PspVPRI43,4781991Pisum sativum (Field Pea)Psp6.089.9UDUD
PspVPRI43,4791991Pisum sativum (Field Pea)Psp6.589.6UDUD
PspVPRI43,4801991Pisum sativum (Field Pea)Psp6.290.1UDUD
PspVPRI43,4811991Pisum sativum (Field Pea)Psp6.290.1UDUD
PspVPRI43,4831991Pisum sativum (Field Pea)Psp11.390.1UDUD
PspVPRI43,4841991Pisum sativum (Field Pea)Psp6.190.1UDUD
PspVPRI43,4851991Pisum sativum (Field Pea)Psp6.389.9UDUD
PspVPRI43,4861991Pisum sativum (Field Pea)Psp6.389.6UDUD
PspVPRI43,4871991Pisum sativum (Field Pea)Psp6.489.6UDUD
PspVPRI43,4881991Pisum sativum (Field Pea)Psp7.589.9UDUD
PspVPRI43,4891991Pisum sativum (Field Pea)Psp6.189.7UDUD
PspVPRI43,4901991Pisum sativum (Field Pea)Psp5.789.8UDUD
PspVPRI43,4472007Pisum sativum (Field Pea)Psp5.789.7UDUD
PspVPRI43,4481983Pisum sativum (Field Pea)Psp5.789.8UDUD
PspVPRI43,4911991Pisum sativum (Field Pea)Psp7.989.7UDUD
PspVPRI43,4921991Pisum sativum (Field Pea)Psp7.490.1UDUD
PspVPRI43,4931991Pisum sativum (Field Pea)Psp7.390.1UDUD
PspVPRI43,4941991Pisum sativum (Field Pea)Psp12.989.8UDUD
PspVPRI43,4952007Pisum sativum (Field Pea)Psp6.790.1UDUD
PspVPRI43,4961991Pisum sativum (Field Pea)Psp8.590.0UDUD
PspVPRI43,4971991Pisum sativum (Field Pea)Psp7.589.9UDUD
PspVPRI43,4991991Pisum sativum (Field Pea)Psp8.589.9UDUD
PspVPRI43,5001991Pisum sativum (Field Pea)Psp7.389.8UDUD
The identity of isolates listed as Psp and Pss was confirmed with pathovar-specific PCR tests that target AN3 and AN7 for Pseudomonas syringae pathovar pisi (Psp) [15] and syrB for Pseudomonas syringae pathovar syringae (Pss) [16]. For P. viridiflava, PEL primers were used [22]. ND (not done), NA (not available) UD (Undetected). VPRI- Plant Pathology Herbarium of Victoria, AgriBio, Bundoora, Victoria. DAR-Plant Pathology Herbarium, Department Primary Industries, New South Wales.
Table 2. Details of LAMP primers for Pseudomonas syringae pathovar pisi and Pseudomonas syringae pathovar syringae.
PrimersSequence (5′ to 3′)Nucleotide Start PositionNucleotide End Position
Pseudomonas syringae pathovar pisi sequence submitted to GenBank accession no. MZ043759
Psp_F3CTCGTGCACGATTCACCAT198219
Psp_B3CGCCTTACTCATTAGTACGCTAA426488
Psp_FIP *(F1c) CGTCTACAGCTAATCATGCCTCT278300
(F2) AGTCTCCTACCTCTATCCGTCAT227248
Psp_BIP *(B1c) TAGCGCTTTCGCACAGCCT316334
(B2) AGGCATCTTGCTCCACGCAT393422
Psp_LFTGCTCCACGTGGGTTCACAG253272
Psp_LBGAGGCCATGAGTGGGCTGAGA363383
Pseudomonas syringae pathovar syringae to GenBank accession no. MZ043758
Pss_F3CATCCTTGACCTCCGAAGCG148167
Pss_B3CAAGCCATCGAGGCCAATGG401420
Pss_FIP *(F1c) CACCGCGCCGTAGTTGAACCT262282
(F2) ATGCGCAACGGTTGATGGGTA173193
Pss_BIP *(B1c) TACCTTGCCGATGTGCTGCGCA310331
(B2) ATTGCAACGGTAGTCGCCA381399
Pss_LFATCAGCCCTGTACGACTCGCTC210231
Pss_LBGCATCGGCAAATTTGAATGTCC359380
* A forward inner primer (FIP) consisted of the complementary sequence of F1c and F2, and the backward inner primer (BIP) consisted of B1c and complementary sequence of B2.
Table 3. Early detection of Pseudomonas syringae pathovar pisi (Psp) and Pseudomonas syringae pathovar syringae (Pss) from the inoculated field pea variety PBA Kaspa before the visual symptoms appeared.
InoculatedControls
DAI 2DAI 3DAI 4DAI 5DAI 6DAI 7DAI 8DAI 9DAI 10SurfactantUn-Inoculated
Pseudomonas syringae pathovar pisi
Tp (min)*UD27.32 ± 3.121.61 ± 2.219.84 ± 3.717.00 ± 2.514.54 ± 3.913.97 ± 2.012.07 ± 1.59.55 ± 2.1UDUD
AD (°C)-90.090.289.590.190.190.090.090.0--
Pseudomonas syringae pathovar syringae
Tp (min)21.75 ± 5.119.79 ± 3.219.22 ± 2.717.28 ± 2.115.60 ± 3.115.19 ± 2.212.57 ± 3.812.19 ± 2.87.035 ± 1.1UDUD
AD (°C)90.190.590.090.390.290.090.390.090.1--
Plants were inoculated with Psp and Pss isolates separately. Samples were taken each day after inoculation (DAI). Tp (Time to positive), AD (anneal derivative), UD (undetected).
Table 4. Naturally infected bacterial blight samples of field pea collected from PHIST19 variety trial at Horsham for the detection Pseudomonas syringae pathovar pisi (Psp) and Pseudomonas syringae pathovar syringae (Pss) with the LAMP assays.
Year of ReleaseField Pea VarietyPsp LAMPPss LAMP Tp (min)Bacteria IsolatedPathovar Specific PCR
1985WirregaUD7.5YesPss
1996BohatyarUD11.4YesPss
1993JupiterUD8.5YesPss
2000MuktaUD9.4YesPss
2010PBA TwilightUD8.6YesPss
2003MoonlightUD12.5YesPss
1998MagnetUD15.6YesPss
2003SturtUD10.5YesPss
1985AlmaUD8.9YesPss
1992BonzerUD11.5YesPss
2000CookeUD12.8YesPss
1979WheroUD17.8YesPss
2000SnowpeakUD19.5YesPss
1995LauraUD14.7YesPss
2002DunwaUD18.9YesPss
2000ExcelUD16.9YesPss
1964DerrimutUD19.0YesPss
1920White BrunswickUD20.1YesPss
2000SoupaUD13.8YesPss
1998ParafieldUD17.4YesPss
1985GlenroyUD8.0YesPss
2002KaspaUD5.8YesPss
2010PBA OuraUD19.3YesPss
1893DunUD11.3YesPss
2014PBA PearlUD22.6YesPss
2011PBA PercyUD12.5YesPss
1989DiakumUD14.2YesPss
1999HelenaUD17.8YesPss
2013PBA WhartonUD10.9YesPss
2000ParavicUD11.8YesPss
1998KingUD8.9YesPss
2000SantiUD5.4YesPss
1970DundaleUD6.7YesPss
1992BlueyUD5.7YesPss
2000YarrumUD12.8YesPss
1939ColligianUD17.8YesPss
2002KileyUD12.5YesPss
1986MaitlandUD14.6YesPss
2011MakiUD12.6YesPss
1998MorganUD13.5YesPss
2002KaspaUD6.5YesPss
2014PBA PearlUD19.8YesPss
2017PBA ButlerUD18.0YesPss
2010PBA GanyahUD5.6YesPss
2011PBA PercyUD16.7YesPss
2002KaspaUD7.8YesPss
1939CollegianUD10.3YesPss
1976Cressy BlueUD10.7YesPss
2010PBA OuraUD15.6yesPss
2017PBA ButlerUD17.1YesPss
All isolates were reconfirmed with pathovar-specific PCR tests for Pseudomonas syringae pathovar pisi [15] (Psp) and Pseudomonas syringae pathovar syringae [16] (Pss). UD: Undetermined. Tp: Time to positive.
Publisher’s Note: MDPI stays neutral with regard to jurisdictional claims in published maps and institutional affiliations.

