Article

The Effect of Sowing Density and Different Harvesting Stages on Yield and Some Forage Quality Characters of the White Sweet Clover (Melilotus albus)

by
Patrycja Sowa-Borowiec
1,2,
Wacław Jarecki
3,* and
Małgorzata Dżugan
1
1
Department of Chemistry and Food Toxicology, University of Rzeszów, Ćwiklińskiej 1a, 35-601 Rzeszów, Poland
2
Department of General and Inorganic Chemistry, Faculty of Chemical Engineering and Technology, Cracow University of Technology, Warszawska 24, 31-155 Cracow, Poland
3
Department of Crop Production, University of Rzeszów, Zelwerowicza 4, 35-601 Rzeszów, Poland
*
Author to whom correspondence should be addressed.
Agriculture 2022, 12(5), 575; https://doi.org/10.3390/agriculture12050575
Submission received: 27 February 2022 / Revised: 15 April 2022 / Accepted: 19 April 2022 / Published: 20 April 2022
(This article belongs to the Section Crop Production)

Abstract

:
White sweet clover (Melilotus albus) cultivation, despite its many positive features such as the high yield of green mass, as well as protein content, is currently not widespread. This study aimed to determine the effect of the different sowing densities (500, 1000, and 1500 seeds per m2) and harvesting at different growth stages (before budding, budding, and full flowering) on the quality of fodder from the white sweet clover (Adela variety). The field experiment was carried out in the years 2018–2020 in a split-plot design. Plant biometric measurements, green and dry yield, the content of total protein, crude fat, crude fiber, ash, macro and microelements, and coumarin content were determined. The results show that an increase in the sowing density significantly increased the plant population after emergence and green and dry matter. However, it does not affect the total protein, crude fat, crude fiber, ash, macro and microelements, and coumarin content. Harvesting plants at the flowering stage increased plant height and green fodder yield. Plants harvested at the prebudding phase were characterized by the highest share of leaves (40.3%) and were the most abundant in protein (21.7%) and minerals (ash content 12.71%). Unfortunately, sweet clover at this growth stage contained the highest level of coumarin, which limits its use in animal feed.

1. Introduction

White sweet clover (Melilotus albus) is an annual or biennial plant belonging to the Fabaceae family [1]. It was widely cultivated in the past but currently is threatened by genetic erosion [2]. Species of the genus Melilotus are well adapted to extreme environmental conditions, such as cold temperatures or droughts; they can also grow in soils with moderate salinity, unlike other forage legumes [3,4].
Sweet clover can be used for soil remediation and as green manure [5]. Furthermore, its cultivation is beneficial in improving soil fertility, thanks to symbiosis with nitrogen-fixing bacteria (Rhizobium meliloti). The rate of nitrogen fixation by Melilotus species is higher than in other legumes, making it beneficial for crop rotation [6,7]. Sweet clover is also known for its ability to utilize both phosphorus and potassium, which are relatively unavailable to other crops. Apart from its soil-building properties, sweet clover inhibits the growth of weeds during cultivation, as well as in following crops or fallow [8]. Furthermore, being a rich source of nectar, the Melilotus species is very important for beekeeping [9]. Its honey yield from field cultivation ranges from 400 to 600 kg ha−1 and the pollen yield is 40–90 kg ha−1. Bees fly around the sweet clover from noon to evening. Due to the deep taproot, it can produce nectar even in dry weather [2]. Another very valuable feature of this plant is the high yield of green mass and high protein content, which makes it a good animal feed. Sweet clover produces yields of up to 9700 kg ha−1 of dry matter [4]. However, the disadvantages of this species are quick wooding of the stems and high coumarin content, the latter giving the forage a specific taste and aroma. Therefore, green forage should be harvested at the proper plant growth stage [5,10].
High coumarin content has become a limiting factor in the use of sweet clover as a livestock feed [11]. Sweet clover can cause a haemorrhagic condition in cattle known as sweet clover disease. Poisoned animals may have a cerebral haemorrhage. The compound responsible for the disease is called dicoumarol. Subsequently, a correlation between high coumarin and dicoumarol content was observed, and some authors suggest that coumarin is a dicoumarol precursor [12,13,14]. As a result, breeding work is carried out to obtain Melilotus varieties with lower coumarin content [7,11,15]. Dicoumarol, also known as bis-hydroxycoumarin, is a strong anticoagulant that acts as a vitamin K antagonist by inhibiting its bioavailability. Improperly dried, moldy hay is particularly dangerous as fungi and molds at present are involved in the formation of dicoumarol [13,16]. However, due to the content of coumarin and its derivatives, Melilotus species are used in medicine [1,7]. Similarly, sweet clover honey, which is abundant in coumarin, has been more and more popular in Poland. This type of light honey with a specific vanilla aroma is recommended as an anticoagulant agent and used in the treatment and prevention of lymphedema and chronic venous disease [9].
In the agrotechnical of white sweet clover, it is important to determine the correct sowing density, consistent with the purpose of the cultivation. It should be remembered that a large percentage of seeds of this species are so-called hard and dead seeds [17]. Various mistakes are still being made in the cultivation of this species, which means that its potential is yet to be fulfilled [2].
This study aims to determine the effects of the sowing density and different harvest times on yield as well as some white sweet clover forage qualities. The idea was provoked by scarce information about the M. albus composition grown in European conditions, especially regarding the annual form of this plant. The research hypothesis assumes that agrotechnical and environmental factors affect the yield and chemical composition of M. albus and thus determine its suitability as fodder.

2. Materials and Methods

2.1. Field Conditions

The field trial was established in Rzeszów (50°02′28″ N 21°59′56″ E), Podkarpackie Voivodeship, Poland, in the years 2018–2020 on a private agricultural plot. The annual white sweet clover, Adela variety, an early Czech-bred cultivar, was used for the research. Seeds were obtained from an ecological farm located in the Lubuskie Voivodeship. The experiment was set up in four replicates in a split-plot design. The main plot represented sowing density and the subplot showed harvest time. The first experimental variable was the different sowing densities: 500, 1000, and 1500 seeds m2, while the second experimental variable was harvesting at different growth stages: before budding (A), budding (B), and full flowering (C). The second regrowth of green fodder was not analyzed. The experimental plot size for each entry was 1 m2 (1 × 1 m). The forecrop of white sweet clover was winter wheat (Triticum aestivum L.).
The seeds were sown on the 23rd, 22nd, and 20th of April 2017, 2018, and 2020, respectively. Plant harvest dates: 20th, 21st, and 17th of June (before budding), 29th of June, 1st of July, 28th of June (budding), 11th, 15th, and 13th of July (full flowering), and again in 2018, 2019 and 2020. Before sowing, the seeds were inoculated with Nitragina (Biofood-Wałcz s.c., Poland) and contained bacteria of the family Rhizobiaceae (Rhizobium meliloti), according to the manufacturer’s recommendations. Row spacing was 20 cm and sowing depth was 1.5 cm. Mineral phosphorus–potassium fertilization (triple superphosphate and potassium salt) was applied in autumn in the following doses: 40 kg ha−1 P2O5 and 60 kg ha−1 K2O. Nitrogen fertilization was not used. Weeds were removed by hand. Plant population after emergence was counted per 1 m2.

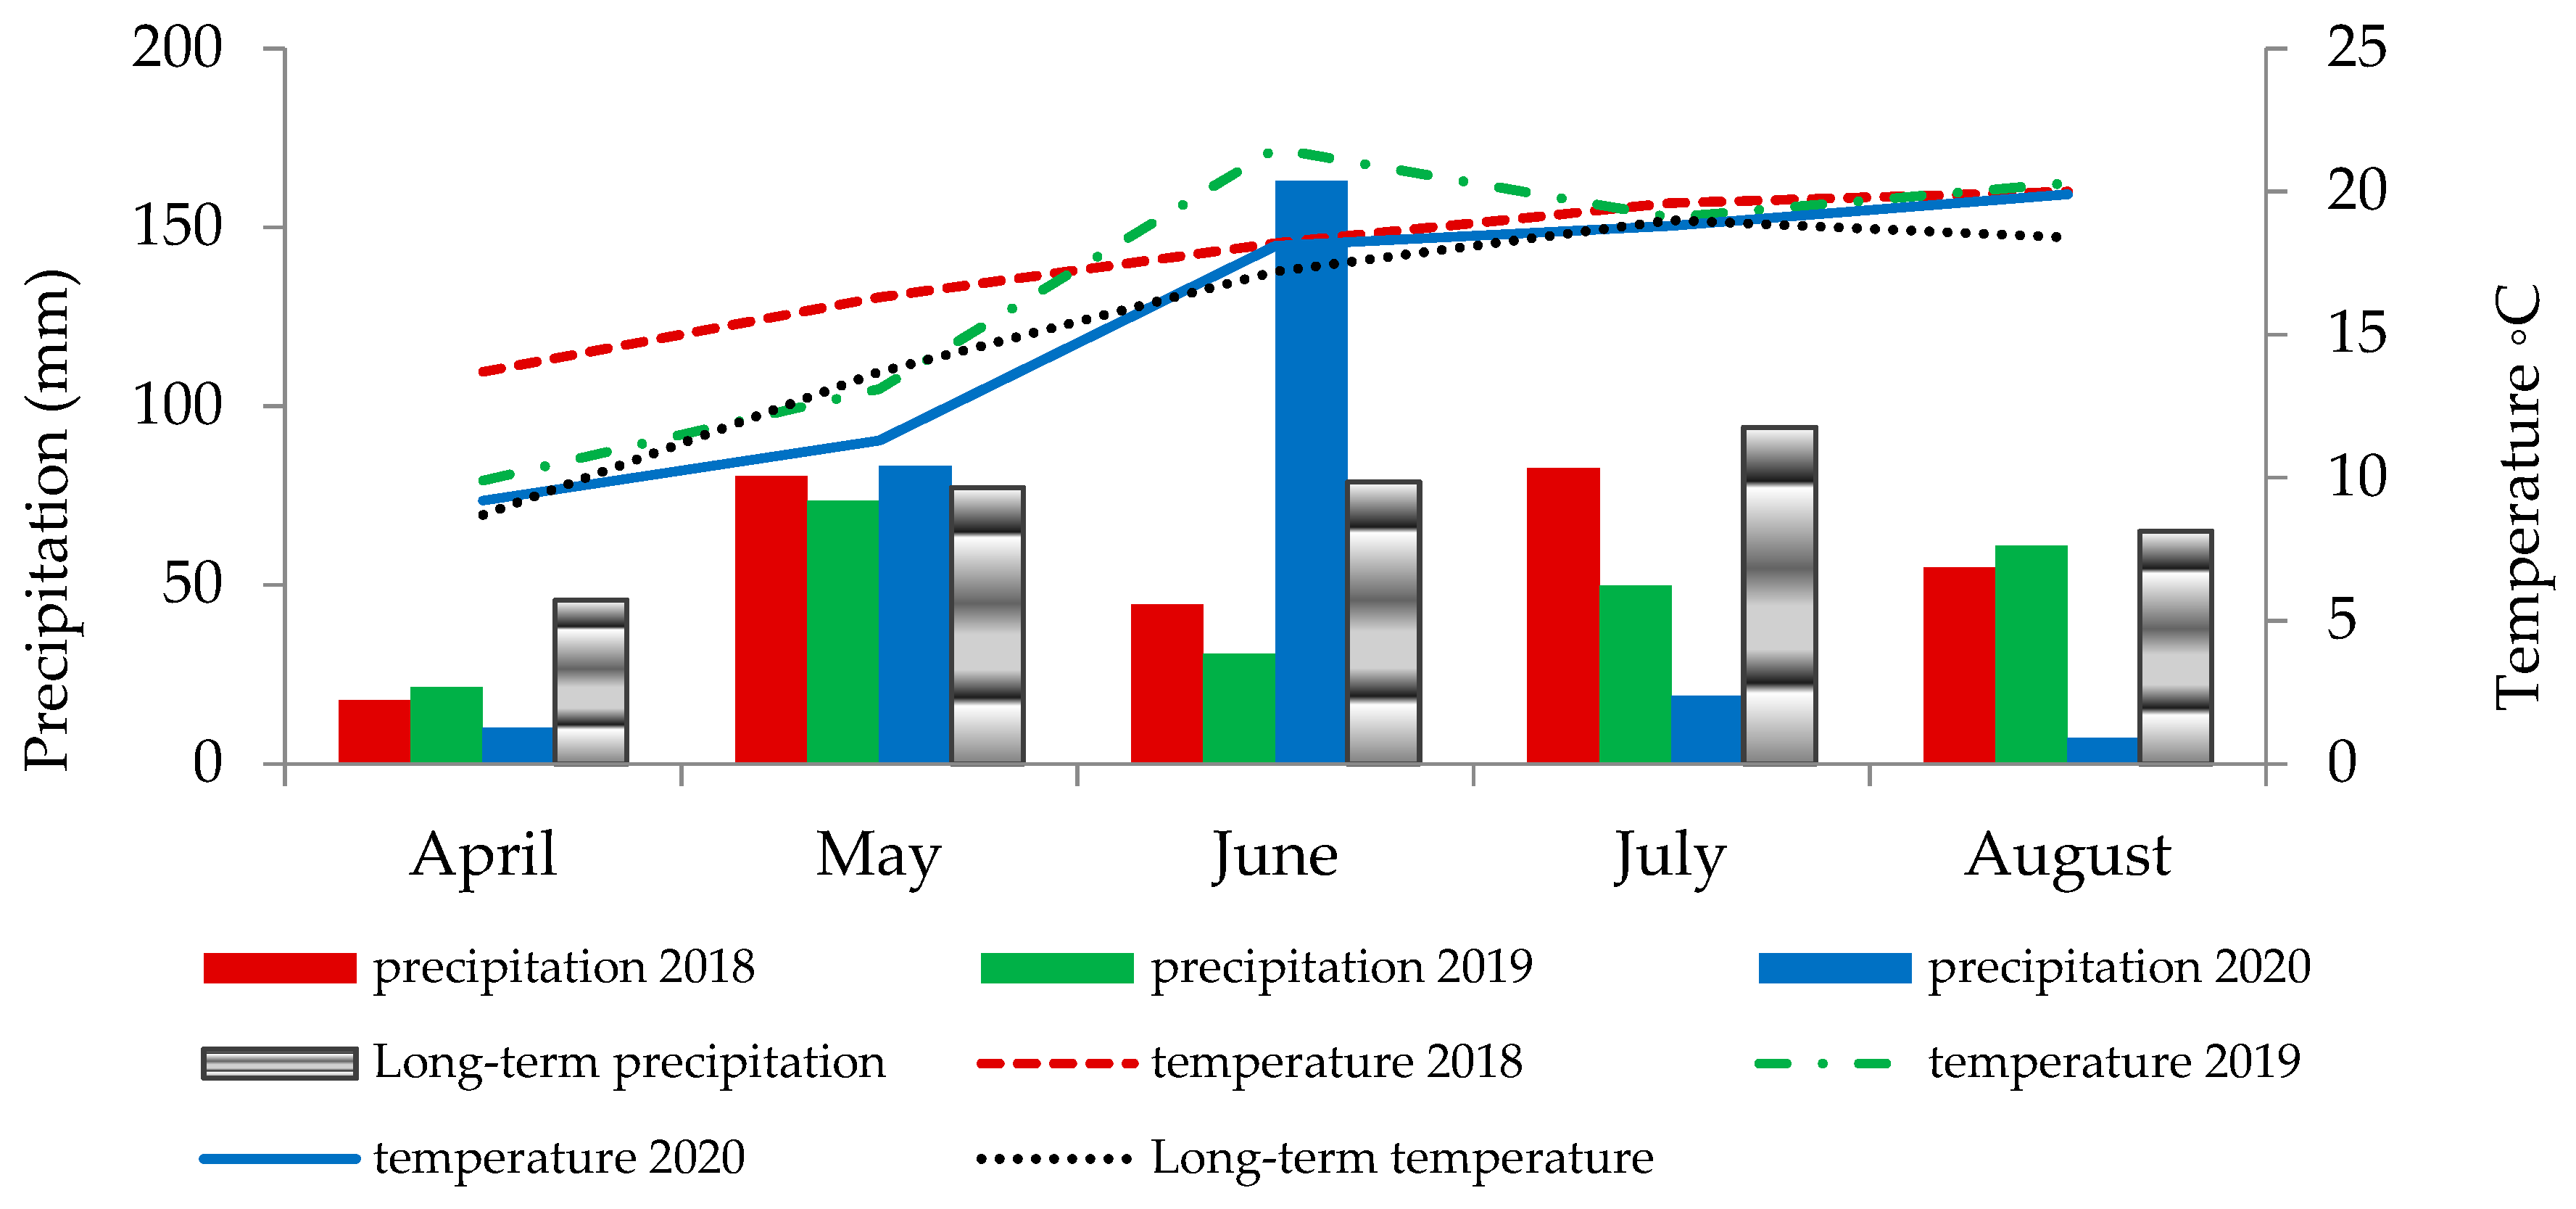
2.2. Weather and Soil Conditions

The weather conditions were noted according to the data of the meteorological station of the University of Rzeszow located in the Rzeszów Zalesie municipal district (50°30′ N and 22°01′ E) at a 5 km distance from the experimental field. The obtained data included monthly average temperature and amount of precipitation.
Soil samples were collected by a sampling probe to a depth of 0–30 cm (arable layer)then dried at room temperature (20 ± 2 °C) in laboratory conditions and sieved through a sieve with a 2 mm mesh diameter before analysis. The pH was determined in a 1:2.5 substrate–water suspension (pH-meter Hanna Instruments, Nusfalau, Romania), whereas electrical conductivity (EC) in a 1:5 substrate–water suspension (EC-meter Hanna Instruments, Nusfalau, Romania). Organic carbon was measured using the Walkley–Black procedure [18]. Available forms of nutrients (P, K, and Mg) were determined by Mehlich 3 method [19]. The contents of elements (Fe, Mn, Zn, and Cu) were analyzed by atomic absorption spectrometry technique (AAS) using a Hitachi Z-2000 spectrometer (Hitachi Tokyo, Japan) after mineralization of 2 g dry soil samples in 70% HClO4. The soil granulometric composition was determined by the laser diffraction method using a Laser Particle Sizer ANALYSETTE 22 (Fritsch, Idar-Oberstein, Germany) at the laboratory of the Department of Soil Science, Environmental Chemistry and Hydrology, University of Rzeszow. Particle size distribution and textural classes of soils and mineral materials were carried out by the United States Department of Agriculture (USDA) soil textural triangle [20]. The results of soil sample analyses are presented in Table 1 and Table 2.

2.3. Field Measurements

The green fodder was collected from each plot and weighed with an accuracy of 0.01 g. Later, the green plants were dried at room temperature (about 20 ± 2 °C) in laboratory conditions with good ventilation and weighed again to calculate the dry mass (average water content 8% w/w). Twenty freshly harvested plants from each plot were randomly selected and plant height (cm) and the percentage of leaves in relation to the weight of the whole plant (%) were measured.

2.4. Laboratory Measurements

For coumarin analyses only, freshly harvested plants were divided into flowers, leaves, and stems and dried separately. The moisture content was determined by a moisture analyzer (MA 50.R Radwag, Puszczykowo, Poland). The dry plant materials (whole plants and separated parts) were ground in a laboratory mill (A11 IKA, Königswinter, Germany).

2.4.1. Chemical Composition

The content of total protein, crude fat, crude fiber, and ash was determined by near-infrared spectroscopy (NIRS) using an MPA FT-NIR spectrometer (Bruker, Billerica, MA, USA) according to Hermida et al. [21]. The results are expressed as % of dry weight (% DW).

2.4.2. Mineral Composition

The content of macro and microelements was determined by inductively coupled plasma optical emission spectrometry (ICP-OES) using a Thermo iCAP 6500 spectrophotometer (Thermo Fisher Scientific Inc., Waltham, MA, USA). Prior to analysis, samples were mineralized under wet conditions and elevated pressure in an Ethos-One UltraWave microwave mineralizer (Milestone SRL, Milan, Italy). Briefly, 0.1 g of ground dried plant matter was weighed into Teflon containers, then 8 mL of 65% HNO3 was added and mineralized for 45 min without exceeding 200 °C. After cooling, the samples were transferred to 50 mL flasks and filled up to the mark with distilled water.
Calibration was performed using certified standard solutions of 10,000 ppm for Ca, Mg, K, Fe, and P and 1000 ppm for Cu, S, Zn, Mn, and Mo. Three-point calibration for each element was carried out, with optical correction using the internal standard method in the form of elements not present in the matrix: yttrium Y and ytterbium Yb at concentrations of 2 and 5 mg L−1, respectively. The detection limit for each element was not fewer than 0.01 mg kg−1 (with an instrument sensitivity at a level of 0.001 mg kg−1).

2.4.3. Coumarin Content

In total, 2 g of plant material (flowers, leaves, and stems separately) was extracted for 30 min with 20 mL of 50% (v/v) ethanol (Stanlab, Lublin, Poland) solution using an ultrasound-assisted method (U-504 Ultron, Moorpark, CA, USA). It was centrifuged for 10 min at 3500 rpm (MPW-260, Warsaw, Poland) and then the supernatant was filtered through a 0.22 µm syringe nylon filter (Merck Millipore, Darmstadt, Germany) before the chromatographic analysis.
Identification of coumarin in sweet clover extracts was carried out using a high-performance liquid chromatograph SYKAM S600 (Ersing, Germany) equipped with a PDA detector (S 3210), binary pomp (S 1132), and column thermostat (S 4120). Conditions of the analysis were as follows: the Bionacom Velocity STR C18 (3.0 × 100 mm, 2.5 μm) column thermostatted at 40 °C, injection volume of 20 μL, and flow rate 0.5 mL/min. The mobile phase consisted of 5 mM ammonium acetate, 0.2% (v/v) acetic acid in water (phase A), and acetonitrile/methanol (1:2 v/v) (phase B). The gradient program was set as 70% A (2 min), 35% A (13 min), and again to 70% A (5 min). The chromatograms were recorded at λ = 280 nm and identification was performed by comparing the UV-VIS spectra as well as retention time with a coumarin standard (>99%, Sigma-Aldrich, St. Louis, MO, USA).
The method was validated for linearity, the limit of detection (LOD), the limit of quantification (LOQ), and interday and intraday assay precision (percentage relative standard deviation, %RSD). A good linear relationship was obtained over the concentration range of 5–100 µg mL−1. The linear regression data showed a regression co-efficient R2  > 0.9989. The LOD was determined as a signal-to-noise ratio (S/N) S/N = 3 and the LOQ was determined as an S/N = 10. Obtained value for LOD was 0.06 µg mL−1 and for LOQ 0.1 µg mL−1. The intraday assay precision was found by analysis of the standard three times on the same day and inter-day assay precision was carried out using the standard on five different days. The calculated intraday and interday precisions were 0.5 and 1.2% RSD, respectively.

2.5. Statistical Analysis

Statistical analysis was performed using TIBCO Statistica 13.3.0 (TIBCO Software Inc, Palo Alto, CA, USA). The results are presented as the mean value of sowing density, harvest date, and years, respectively. Statistical differences (p < 0.05) between the analyzed parameters were obtained using a three-way analysis of variance (ANOVA), followed by Tukey’s HSD test. The interaction between the studied parameters is shown in the supplementary material.

3. Results and Discussion

The weather conditions varied over the years of the study (Figure 1) and affected the assessed features and parameters of the Melilotus albus fodder. In April, rainfall was well below the multiyear average. During the years 2018 and 2019, low rainfall was also recorded in June. On the other hand, in June 2020, heavy rains were observed, while July and August were dry months. The temperature conditions varied in April, May, and June. In contrast, temperatures in July were close to the multiyear average. August was relatively warm.
As expected, with the increase in the seed-sowing density, the plant population after emergence increased significantly as well (Table 3). The field emergence capacity ranged from 66.7% to 49.1% after sowing 500 and 1500 seeds m−2, respectively. The highest seed density (1500 pcs·m−2) caused a significant decrease in plant height, however, feed yield increased as compared with 500 pcs·m−2. The later the green fodder was harvested, the higher the plants were (p < 0.05). This caused significant variation in green and dry matter yields. After harvesting plants at the flowering stage, the green matter yield amounted to 3.06 kg m2, whereas the dry matter yield was 0.80 kg m2. The dry matter yield of plants harvested before budding was the lowest, with the highest share of leaves in the biomass. It was observed that plant density after emergence, the height of the plants, and green matter yield varied over the years of the study (Table 3). It was noted that the sowing density and harvesting stage had a significant effect on a majority of studied parameters (p < 0.05) (Table 3 and Table S1a). However, no interactions between these two factors were observed. The sowing density significantly influenced plant density after emergence (Table S1a). In turn, plant height was significantly affected by the stage of development only, especially at the last stage. A similar trend of the impact of the harvesting growth stage rather than sowing density was found in other parameters. For dry and fresh matter yield, the differences were found mainly between prebudding and full-flowering stages, whereas a share of leaves was found in all stages. No interaction was observed between sowing density and years (Table S1a). Oppositely, a significant interaction (p < 0.05) was observed between the harvesting stages and years in the case of plant height, green matter yield, dry matter yield, as well as a share of leaves (Table S3a). The only exception was the plant population after emergence, which was not observed to be affected by harvesting stages or years.
Tenikecier and Ates [22] proved that seeding density is one of the most important factors affecting plant yield and yield components. They found an increase in the fresh and dry matter along with an increase in the seeding density of blue melilot, which was similar to our results. However, they observed a variation in plant height as well as stem-to-leaf ratio depending on the seeding density, which our study did not confirm. Similar to our research, Abdel-Rahman and Suwar [23] observed that the plant height of alfalfa was not significantly affected by seeding density, and the highest forage yield was produced by the highest seeding rate. The quality and yield of forage legumes are affected by many factors, such as growths stage, cutting time, disease damage, insect damage, weeds ratio, soil traits, irrigation, fertilizer applications, and seeding rate. However, the genotype of the plant is very important [22]. Dashkevich et al. [10] analyzed the yield of white and yellow sweet clover according to cultivar. Green matter yield of Melilotus albus ranged between 13.18–14.46 Mg·ha−1 and Melilotus officinalis between 15.57–17.77 Mg·ha−1, while the dry matter yield amounted to 3.36–3.84 Mg·ha−1 and 4.06–4.92 Mg·ha−1, respectively. In the experiment of Evans et al. [24], the white sweet clover yield also depended on variety, as well as salinity. Kosolapov et al. [25] presented an analysis of the new bred biennial Melilotus albus variety (POD 17/13) in comparison with the Obskoy gigant, the well-known zoned variety used for comparison. In this case, a significant increase in green and dry matter was observed in the second year of vegetation, as compared with the first one (regardless of the variety). However, in the case of leaf coverage, an increase was only observed in the new variety. It should be mentioned that, nowadays, no variety of sweet clover is officially registered in the Polish National List of Agricultural Plant Varieties. The only domestic variety, Selgo GOH-180, is included in the conservation breeding [2].
The results prove that the increase in the sowing density did not have a statistically significant effect (p > 0.05) on the content of total protein, crude fat, crude fiber, and ash in Melilotus albus (Table 4). The highest quality green fodder was obtained from the plants before budding. At this growth stage, the highest content of total protein, crude fat, and ash, with the lowest amount of crude fiber was observed. The green forage harvested in 2018 and 2020 had higher crude fat content in comparison with the fodder harvested in 2019. A similar tendency was observed for the total protein content, but the difference was not statistically significant. The green fodder harvested in 2019 was characterized by a high content of crude fiber, while the one harvested in 2018 featured high ash content. Similar to the previous variables, no interaction was observed between the harvesting stage and sowing density (Table S1a). Regarding protein content, only a statistically significant effect of the main factor was shown, which was the harvesting stage. An interaction between sowing density and years was also not observed (Table S2a). However, the influence of both harvesting stages and years was found to create the chemical composition values (Table S3a). All interactions were statistically significant (p < 0.05).
Orlova [26] reported lower ash and fat content in the dry matter of sweet clover fodder, 5.7% DM and 1.2% DM, respectively, with a similar protein content of 18.7% DM. Dashkevich et al. [10] obtained slightly different results for the varieties of white sweet clover. The average determined the content of protein amounted to 16.97% DM, fiber 21.58% DM, ash 8.90% DM, and fat 2.00% DM, which corresponds with our results. Moreover, the aforementioned authors observed a strong variation in the analyzed parameters depending on the cultivar. Varietal differences were also demonstrated by Kosolapov et al. [25]. The total protein content in the study by Luo et al. [27] ranged from 11.31% DM to 15.27% DM in Melilotus albus and from 12.19 to 15.45% DM in Melilotus officinalis. Guerrero-Rodríguez et al. [28] proved that the quality of the green forage of the sweet clover depends on soil conditions, among others salinity. Accordingly, they recommend nutrient supplementation when animals are fed poorer quality forage. Kara [29] analyzed the chemical composition of hay obtained from Melilotus officinalis in three growth stages: vegetative, early flowering, and full flowering. The research showed that the content of total protein and ash was higher when plants were harvested at the vegetative and early flowering stages, rather than at full flowering. On the other hand, hay obtained from plants in the fully flowering stage was characterized by the highest content of the neutral and acid detergent fiber, without ash contents. Çaçan et al. [30] reported that delaying the harvest of sweet clover reduces the content of protein and ash, with a simultaneous increase in fiber.
The variable sowing density had no significant effect on the content of analyzed macro and microelements in the fodder (Table 5 and Table 6). Differentiation in the content of some elements depending on the plant growth stage was observed. Among the analyzed macronutrients, the white sweet clover was the richest in potassium, especially in the stages before budding and during budding. In the flowering phase, the potassium content decreased significantly. The same correlations were observed for the content of calcium, phosphorus, and sulfur. In addition, significant differences in the calcium, potassium, phosphorus, and sulfur content were demonstrated depending on the year of harvest.
Iron was found to be the most abundant microelement in Melilotus albus, followed by zinc and manganese (Table 6). The different sowing densities did not impact the micronutrient content. It was noted that harvesting green forages before the budding stage resulted in increased iron, manganese, molybdenum, and copper content, as compared with the green forage harvested at the flowering stage. The year of the harvest significantly affected iron, manganese, zinc, and molybdenum content (p < 0.05).
No interaction was found between harvesting stage and sowing density, as well as sowing density and years, both for micro and macroelements (Tables S1b and S2b). Statistically significant differences were found between potassium, iron, and copper content, but these were caused by the main factor, which was the harvesting stages (Table S1b). Similarly, the significant differences in phosphorus, iron, and molybdenum content were due to the influence of one factor, a year (Table S2b). Statistically significant effects of both harvesting stages and years were found for potassium, phosphorus, iron, zinc, and magnesium contents (Table S3b). For the other elements, no interaction was found, even if the main factors had a significant effect. It should be noted that the variation in mineral composition between years may be influenced by the mineral composition of the soil, which varied between years.
The proper mineral composition of the feed is extremely important in animal nutrition as it affects proper growth, health, and fertility [31]. According to our knowledge, the effect of different sowing densities on the mineral composition of the white sweet clover has not yet been studied. There is also scarce data on the variability of the mineral composition of green forage during the developmental stage of annual varieties. This is caused by sweet clover not being as popular fodder crop as other legumes such as Medicago sativa, Onobrychis sativa, Trifolium pratense or Trifolium repens [29]. Tenikecier and Ates [22] obtained similar results that the sowing density did not have a significant effect on the content of micro and macroelements in alfalfa. Frame et al. [32] observed a decrease in N, P, and K content in red clover and alfalfa during their development, whereas Tekieli et al. [33] found statistically significant differences in the Ca, K, and Mg content during the phenological cycle of various Trifolium sp. species. Marković et al. [34] analyzed the variability of mineral compounds in alfalfa (Medicago sativa L.) according to the growth stage, both for individual plant parts and for the whole plant. They found that nitrogen, potassium, magnesium, iron, copper, zinc, and manganese are the most common minerals influenced by the plant growth stage. Moreover, in contrast with the results of other researchers, they observed an increase in calcium and phosphorus concentrations correlating with plant development, both in its parts and in the entire plant. The mineral composition of herb mixtures of Lolium perenne, Poa pratensis, Dactylis glomerata, Phleum pratense, Festuca rubra, Trifolium repens, and Trifolium pratense focusing on harvest date and plant growth stage was studied by Schlegel et al. [31]. It was noted that the content of P, Mg, K, S, Cu, Fe, Mn, Zn, Co, and Se decreased with the development of plants, the content of Ca remained constant, while Na increased in the beginning and then dropped sharply. In the research conducted by the aforementioned authors, a significant influence of the harvest season on the mineral composition of plants was observed. It is in agreement with our findings for Melilotus albus.
A characteristic feature of Melilotus species is the high content of coumarin and coumarin derivatives [9]. Accordingly, the content of this compound in different parts of the plant was determined. The obtained results are presented in Figure 2 (leaves), Figure 3 (stems), and Figure 4 (flowers). Flowers were characterized by the highest content of coumarin, followed by the stems and leaves (in plants before budding). There was no statistically significant influence (p > 0.05) of the different sowing densities on the content of this compound, regardless of the part of the plant tested. Moreover, a decrease in its content was observed during the phenological cycle, both in leaves and stems (p < 0.05). In leaves, the content varied between 1.82 mg g−1 DM and 0.74 mg g−1, whereas in stems between 2.28 mg g−1 DM and 0.59 mg g−1 DM. This shows more than a two-fold decrease in coumarin content in leaves and an almost four-fold decrease in stems. What is more, the weather conditions did not affect the coumarin content except for flowers (Figure 4), where the lowest content was found in 2018 (p < 0.05). The sowing density, along with the harvesting stages, as well as depending on the years, did not affect the coumarin content (Table S4a). The significant two-way interaction was found only between harvesting stages and years in leaves and stems of Melilotus albus (Table S4b).
It has been reported that the coumarin content in Melilotus varies greatly depending on the species, variety, and places of origin [11,15,35]. Nair et al. [11] determined its content in leaves of 15 Melilotus species at 90% flowering time and found that the mean coumarin content ranged from 0.06 to 0.753% DM (which corresponds to 0.6–7.53 mg g−1), for M. albus it was in the range of 0.17–1.3% DM (which corresponds to 1.7–13 mg g−1), while in M. officinalis from 0.16 to 0.61% DM (1.6 to 6.1 mg g−1). In contrast, in a study by Abbasi et al. [15], the content of this compound ranged from 0.09 to 5.27% DM in biennial white and yellow sweet clover. High differentiation ranging from 0.05 to 1.04% DM for the 93 samples of different varieties and species of Melilotus was observed by Kitchen et al. [14].
Jasińska and Kotecki [36] suggested that the coumarin content increases during plant development. However, these findings were not confirmed by our three-year study. What is more, our results are consistent with the observations for other plant species. Maggi et al. [37], who analyzed the coumarin content in dried and fresh leaves of the bastard balm (Melittis melissophyllum L.), noted that its content varied during the phenological cycle and that the young leaves were the most abundant source of the substance (3 to 7 times higher content). A similar observation was reported by Pereira et al. [38] for leaves of Mikania glomerate, where young leaves contained 5.91 mg · g−1 of coumarin, whereas mature leaves as much as 2.15 mg · g−1. Baidalin et al. [5] determined the content of this compound in different parts of the yellow sweet clover. The highest content of coumarin was found in flowers and young leaves, 1.61 and 1.55% DM, respectively, followed by leaves (lower layer) at 0.72% DM, stems at 0.34% DM, seeds at 0.27% DM, and roots at 0.09% DM, which corresponds to our results. Such distribution of coumarin can be explained by its role as phytoalexin. Young plants which are more vulnerable to injury and pathogens attack produce coumarin as a protective compound. Furthermore, it has been suggested that the primary site of synthesis of coumarin can be found in the young, actively growing leaves.
Due to its potential toxicity to the livestock, the content of coumarin should be controlled in feed. It can be converted to dicumarol upon fungal spoilage of the plant, but also, as proved by laboratory tests, coumarin may have other toxic effects. It has been noted that coumarin can induce liver cancer in rats and mice, lung tumors in mice, as well as potentially damage the internal organs (liver and kidneys) in dogs [39,40]. However, the toxicity of this compound, especially hepatotoxicity, is strongly species dependent. Based on the analysis of various studies, Felter et al. [41] emphasized that no adverse liver effects have been reported in humans following coumarin exposure via dietary sources or dermal application. Despite these findings, the European Food Safety Authority (EFSA) established a tolerable daily intake (TDI) of 0.1 mg coumarin per kg body weight. Furthermore, the European Commission specified a maximum limit for coumarin: 2 mg/kg in food samples [42,43]. It is extremely important to note that there is no legal regulation regarding its content in species and herbs [44]. Unfortunately, to our knowledge, studies on coumarin toxicity to farm livestock such as cattle are lacking. For this reason, sweet clover, especially young plants before budding, should be used in mixtures with other crops as an additive, rather than the primary forage.

4. Conclusions

Increasing the sowing density of white sweet clover seeds resulted in a significant increase in plant population after emergence and green and dry matter yield. Green fodder of M. albus harvested in the flowering phase increased the plant height and the green fodder yield. When harvested before budding, the dry matter yield was the lowest, but the proportion of leaves in biomass was the highest. The varied seed-sowing density did not significantly affect the chemical composition of the fodder. However, most of the evaluated parameters were influenced by weather conditions occurring in the years of the study. The best quality forage was obtained after harvesting the plants before budding, as a result of its content of total protein, crude fat, ash, some macronutrients, micronutrients, and reduced crude fiber content. Unfortunately, sweet clover at this growth stage contains the highest level of coumarin, which limits its use in animal feed. Flowers were characterized by the highest content of coumarin as compared with leaves and stems. For this reason, sweet clover may be of greater importance in herbal medicine and beekeeping. What is more, due to the intensive growth of biomass during the growing season, it has the possibility of being used as an energy resource.

Supplementary Materials

The following supporting information can be downloaded at: https://www.mdpi.com/article/10.3390/agriculture12050575/s1, Table S1a: plant measurements, yield, and chemical composition of white sweet clover and mean values for interaction seeding density (S) × harvesting stages (H). Table S1b.—The content of macro and microelements of white sweet clover and mean values for interaction seeding density (S) × harvesting stages (H). Table S2a. Plant measurements, yield, and chemical composition of white sweet clover and mean values for interaction seeding density (S) × years (Y). Table S2b.—The content of macro and microelements of white sweet clover and mean values for interaction seeding density (S) × years (Y). Table S3a: plant measurements, yield, and chemical composition of white sweet clover and mean values for interaction harvesting stages (H) × years (Y). Table S3b:—the content of macro and microelements of white sweet clover and mean values for interaction harvesting stages (H) × years (Y). Table S4a: coumarin content in Melilotus albus leaves and stems and mean values for interactions. Table S4b: coumarin content in Melilotus albus leaves and stems and mean values for interactions.

Author Contributions

Conceptualization, P.S.-B., W.J. and M.D.; methodology, P.S.-B., W.J. and M.D.; formal analysis, P.S.-B.; writing—original draft preparation, P.S.-B. and W.J.; visualization, P.S.-B., supervision, M.D.; funding acquisition, M.D. and W.J. All authors have read and agreed to the published version of the manuscript.

Funding

This research was funded by the program of the Minister of Science and Higher Education entitled “Regional Initiative of Excellence” in the years 2019–2022, project number 026/RID/2018/19, the amount of financing PLN 9 542 500.00.

Institutional Review Board Statement

Not applicable.

Informed Consent Statement

Not applicable.

Data Availability Statement

The data presented in this study are available on request from the corresponding author.

Conflicts of Interest

The authors declare no conflict of interest.

References

  1. Stefanović, O.D.; Tešić, J.D.; Čomić, L.R. Melilotus albus and Dorycnium herbaceum extracts as a source of phenolic compounds and their antimicrobial, antibiofilm, and antioxidant potentials. J. Food Drug Anal. 2015, 23, 417–424. [Google Scholar] [CrossRef] [PubMed] [Green Version]
  2. Sowa, P.; Jarecki, W.; Dżugan, M. Nostrzyk (Melilotus)—Zapomniana roślina o dużym znaczeniu gospodarczym (Sweet clover (Melilotus)—A forgotten plant with a large economic importance). Zesz. Probl. Postęp. Nauk Rol. 2018, 593, 73–85. [Google Scholar] [CrossRef]
  3. Sherif, E.A.A. Melilotus indicus (L.) All., a salt-tolerant wild leguminous herb with high potential for use as a forage crop in salt-affected soils. Flora 2009, 204, 737–746. [Google Scholar] [CrossRef]
  4. Chen, L.; Wu, F.; Zhang, J. NAC and MYB Families and Lignin Biosynthesis-Related Members Identification and Expression Analysis in Melilotus albus. Plants 2021, 10, 303. [Google Scholar] [CrossRef] [PubMed]
  5. Baidalin, M.E.; Zhumagulov, I.I.; Sagalbekov, E.U.; Sagalbekov, U.M. Ways of Increasing Seed Germination of Sweet Clover and Methods of Reducing the Amount of Coumarin in the Leaf-Stem Mass. OnLine J. Biol. Sci. 2017, 17, 128–135. [Google Scholar] [CrossRef] [Green Version]
  6. Wolf, J.J.; Rohrs, J. The influence of physical soil conditions on the formation of root nodules of Melilotus officinalis in the montane zone of Rocky Mountain National Park. Eur. J. Soil Biol. 2001, 37, 51–57. [Google Scholar] [CrossRef]
  7. Luo, K.; Wu, F.; Zhang, D.; Dong, R.; Fan, Z.; Zhang, R.; Yan, Z.; Wang, Y.; Zhang, J. Transcriptomic profiling of Melilotus albus near-isogenic lines contrasting for coumarin content. Sci. Rep. 2017, 7, 4577. [Google Scholar] [CrossRef] [Green Version]
  8. Moyer, J.R.; Blackshaw, R.E.; Huang, H.C. Effect of sweetclover cultivars and management practices on following weed infestations and wheat yield. Can. J. Plant Sci. 2007, 87, 973–983. [Google Scholar] [CrossRef] [Green Version]
  9. Sowa, P.; Grabek-Lejko, D.; Wesołowska, M.; Swacha, S.; Dżugan, M. Hydrogen peroxide-dependent antibacterial action of Melilotus albus honey. Lett. Appl. Microbiol. 2017, 65, 82–89. [Google Scholar] [CrossRef]
  10. Dashkevich, S.; Filippova, N.; Utebayev, M.; Abdullaev, K. Assessing the Influence of the Initial Forms of Melilot on the Quality of Fodder Mass in the Conditions of Northern Kazakhstan. J. Pharm. Sci. Res. 2018, 10, 2564–2567. [Google Scholar]
  11. Nair, R.M.; Whittall, A.; Hughes, S.J.; Craig, A.D.; Miller, S.M.; Powell, T.; Auricht, G.C. Variation in coumarin content of Melilotus species grown in South Australia. N. Zeal. J. Agr. Res. 2010, 53, 201–213. [Google Scholar] [CrossRef]
  12. Goplen, B.P. Sweetclover Production and Agronomy. Can. Vet. J. 1980, 21, 149–151. [Google Scholar] [PubMed]
  13. Muir, A.D.; Goplen, B.P. Quantitative reversed-phase HPLC analysis of dicumarol in sweetclover hay and silage samples. J. Agric. Food Chem. 1992, 40, 820–823. [Google Scholar] [CrossRef]
  14. Kitchen, J.L.; Mclachln, D.; Hughes, S.; Revell, D.K. Wariation in coumarin concentration between lines of Melilotus sp. Anim. Prod. Aust. 2002, 24, 318. [Google Scholar]
  15. Abbasi, M.R.; Hosseini, S.; Pourakbar, L. Coumarin Variation in Iran Biennial Melilotus Genetic Resources and its Relationship with Agro-morphophonological Traits. J. Crop. Sci. Biotechnol. 2017, 20, 89–98. [Google Scholar] [CrossRef]
  16. Sanderson, M.A.; Meyer, D.W.; Casper, H.H. Dicoumarol concentrations in sweetclover hay treated with preservatives and in spoiled hay of high- and low-coumarin cultivars of sweetclover. Anim. Feed Sci. Technol. 1986, 14, 221–230. [Google Scholar] [CrossRef]
  17. Kintl, A.; Huňady, I.; Vymyslický, T.; Ondrisková, V.; Hammerschmiedt, T.; Brtnický, M.; Elbl, J. Effect of Seed Coating and PEG-Induced Drought on the Germination Capacity of Five Clover Crops. Plants 2021, 10, 724. [Google Scholar] [CrossRef]
  18. Nelson, D.W.; Sommers, L.E. Total Carbon, Organic Carbon, and Organic Matter. In Methods of Soil Analysis: Part 3 Chemical Methods; SSSA: Madison, WI, USA, 1996; Volume 5, pp. 961–1010. [Google Scholar]
  19. Mehlich, A. Mehlich 3 Soil Test Extractant: A Modification of Mehlich 2 Extractant. Comm. Soil Sci. Plant Anal. 1984, 15, 1409–1416. [Google Scholar] [CrossRef]
  20. Ditzler, C.; Scheffe, K.; Monger, H.C. Soil Science Division Staff. Soil Survey Manual. USDA Handbook 18; Government Printing Office: Washington, DC, USA, 2017; p. 603.
  21. Hermida, M.; Rodriguez, N.; Rodríguez-Otero, J.L. Determination of Moisture, Starch, Protein, and Fat in Common Beans (Phaseolus vulgaris L.) by Near Infrared Spectroscopy. J. AOAC Int. 2006, 89, 1039–1041. [Google Scholar] [CrossRef] [Green Version]
  22. Tenikecier, H.S.; Ates, E. Determination of seeding rate in the blue melilot (Melilotus caeruleus (L.) Desr.) for forage yield and some quality features under subtropical conditions. Turk. J. Field Crops. 2020, 25, 161–167. [Google Scholar] [CrossRef]
  23. Abdel-Rahman, E.M.; Suwar, A.O.A. Effect of seeding rate on growth and yield of two alfalfa (Medicago sativa L.) cultivars. Int. J. Sudan Res. 2012, 2, 141–154. [Google Scholar] [CrossRef]
  24. Evans, P.M.; Kearney, G.A. Melilotus albus (Medik.) is productive and regenerates well on saline soils neutral to alkaline reaction in the high rainfall zone of south-western Victoria. Aust. J. Exp. Agric. 2003, 43, 349–355. [Google Scholar] [CrossRef]
  25. Kosolapov, V.M.; Cherniavskih, V.I.; Dumacheva, E.V.; Tseiko, L.M. The use of biological fabaceae resources of the cretaceous south of Russia in breeding on the example of the species Melilotus albus medik. BIO Web Conf. 2021, 39, 2–9. [Google Scholar] [CrossRef]
  26. Orlova, L.D. Chemical composition of Melilotus (Fabaceae) of the Poltava region. Vìsn. Dnìpropetr. Unìv. Ser. Bìol. Ekol. 2008, 16, 122–126. [Google Scholar] [CrossRef] [Green Version]
  27. Luo, K.; Di, H.Y.; Zhang, J.Y.; Wang, Y.R.; Li, Z.Q. Preliminary evaluation of agronomy and quality traits of nineteen Melilotus accessions. Pratacult. Sci. 2014, 8, 2125–2134. [Google Scholar] [CrossRef]
  28. Guerrero-Rodríguez, J.D.; Revell, D.K.; Bellotti, W.D. Mineral composition of lucerne (Medicago sativa) and white melilot (Melilotus albus) is affected by NaCl salinity of the irrigation water. Anim. Feed Sci. Technol. 2011, 170, 97–104. [Google Scholar] [CrossRef]
  29. Kara, K. Nutrient matter, fatty acids, in vitro gas production and digestion of herbage and silage quality of yellow sweet clover (Melilotus officinalis L.) at different phenological stages. J. Anim. Feed Sci. 2021, 30, 128–140. [Google Scholar] [CrossRef]
  30. Çaçan, E.; Aydın, A.; Başbağ, M. Determination of quality features of some legume forage crops in Bingöl University Campus. Turk. J. Agric. Nat. Sci. 2015, 2, 105–111. [Google Scholar]
  31. Schlegel, P.; Wyss, U.; Arrigo, Y.; Hess, H.D. Mineral concentrations of fresh herbage from mixedgrassland as influenced by botanical composition, harvesttime and growth stage. Anim. Feed Sci. Technol. 2016, 219, 226–233. [Google Scholar] [CrossRef] [Green Version]
  32. Frame, J.; Charlton, J.F.L.; Laidlaw, A.S. Temperate Forage Legumes; CAB International: Wallingford, England, 1998; pp. 48–56. [Google Scholar]
  33. Tekieli, A.S.; Ateş, E.; Varol, F. Nutritive values of some annual clovers (Trifolium sp.) at different growth stages. J. Cent. Eur. Agric. 2005, 6, 323–330. [Google Scholar]
  34. Marković, J.; Štrbanović, R.; Cvetković, M.; Anđelković, B.; Živković, B. Effects of growth stage on the mineral concentrations in alfalfa (Medicago sativa L.) leaf, stem and the whole plant. Biotechnol. Anim. Husb. 2009, 25, 1225–1231. [Google Scholar]
  35. Zhang, J.; Di, H.; Luo, K.; Jahufer, Z.; Wu, F.; Duan, Z.; Stewart, A.; Yan, Z.; Wang, Y. Coumarin Content, Morphological Variation, and Molecular Phylogenetics of Melilotus. Molecules 2018, 23, 810. [Google Scholar] [CrossRef] [PubMed] [Green Version]
  36. Jasińska, Z.; Kotecki, A. Szczegółowa uprawa roślin; Wydawnictwo Akademii Rolniczej we Wrocławiu: Wrocław, Poland, 2003; pp. 219–221. [Google Scholar]
  37. Maggi, F.; Barboni, L.; Caprioli, G.; Papa, F.; Ricciutelli, M.; Sagratini, G.; Vittori, S. HPLC quantification of coumarin in bastard balm (Melittis Melissophyllum L., Lamiaceae). Fitoterapia 2011, 82, 1215–1221. [Google Scholar] [CrossRef] [PubMed]
  38. Pereira, A.M.S.; Câmara, F.L.A.; Celeghini, R.M.S.; Vilegas, J.H.Y.; Lanças, F.M.; França, S.C. Seasonal Variation in Coumarin Content Mikania glomerate. J. Herbs Spices Med. Plants 2000, 7, 1–10. [Google Scholar] [CrossRef]
  39. Lake, B.G. Coumarin: Metabolism, Toxicity and Carcinogenicity: Relevance for Human Risk Assessment. Food Chem. Toxicol. 1999, 37, 423–453. [Google Scholar] [CrossRef]
  40. Abraham, K.; Wohrlin, F.; Lindtner, O.; Heinemeyer, G.; Lampen, A. Toxicology and risk assessment of coumarin: Focus on human data. Mol. Nutr. Food Res. 2010, 54, 228–239. [Google Scholar] [CrossRef]
  41. Felter, S.P.; Vassallo, J.D.; Carlton, B.D.; Daston, G.P. A safety assessment of coumarin into account species-specificity of toxicokinetics. Food Chem. Toxicol. 2006, 44, 462–475. [Google Scholar] [CrossRef]
  42. European Food Safety Authority (EFSA). Scientific Opinion of the Panel on Food Additives, Flavourings, Processing Aids and Materials in Contact with Food on a request from the European Commission on Coumarin in flavourings and other food ingredients with flavouring properties. EFSA J. 2008, 793, 1–15. [Google Scholar]
  43. (E.C.). Regulation, no 1334/2008 of the European Parliament and of the Council of 16 December 2008 on flavorings and certain food ingredients with flavoring properties for use in and on foods and amending Council Regulation (EEC) No 1601/91. Off. J. Eur. Communities 2008, L354, 34–50. [Google Scholar]
  44. Wang, Y.H.; Avula, B.; Dhammika, N.P.; Nanaykkara, N.P.D.; Zhao, J.; Khan, I.A. Cassia cinnamon as a source of coumarin in cinnamon-flavored food and food supplements in the United States. J. Agric. Food Chem. 2013, 61, 4470–4476. [Google Scholar] [CrossRef]
Figure 1. Weather conditions (mean temperature and precipitation) during the following growing seasons of Melilotus albus.
Agriculture 12 00575 g001
Figure 2. Coumarin content in leaves of Melilotus albus. Sowing density: S1—500 pcs·m−2, S2—1000 pcs·m−2, and S3—1500 pcs·m−2. A—before budding, B—budding, C—full flowering. Statistically significant differences (p < 0.05) according to the three-way analysis of variance (ANOVA) followed by Tukey’s test are marked with different letters.
Agriculture 12 00575 g002
Figure 3. Coumarin content in stems of Melilotus albus. Sowing density: S1—500 pcs·m−2, S2—1000 pcs·m−2, and S3—1500 pcs·m−2. A—before budding, B—budding, C—full flowering. Statistically significant differences (p < 0.05) according to the three-way analysis of variance (ANOVA) followed by Tukey’s test are marked with different letters.
Agriculture 12 00575 g003
Figure 4. Coumarin content in flowers of Melilotus albus. Sowing density: S1—500 pcs·m−2, S2—1000 pcs·m−2, and S3—1500 pcs·m−2. Statistically significant differences (p < 0.05) according to the two-way analysis of variance (ANOVA) followed by Tukey’s test are marked with different letters.
Agriculture 12 00575 g004
Table 1. Chemical properties of soil samples collected from the experimental field each year before sowing.
Measurement201820192020
pH in H2O7.676.976.94
EC [mS cm−1]0.520.140.19
Organic carbon [%]1.423.022.77
Content of available nutrients [mg 100 g−1 of soil]
P2O530.2620.5019.05
K2O27.6022.4020.90
Mg7.827.237.18
Content of elements [mg kg−1 of soil]
Fe2762.601827.502022.00
Mn239.48506.18452.20
Zn19.9018.2017.34
Cu5.586.134.29
Table 2. Soil granulometric composition during the 3-year field experiment.
YearFractionsThe Proportion of Fractions [%]Texture
(USDA)
2018sand (2–0.05 mm)11silt loam
silt (0.05–0.002 mm)77
clay (<0.002 mm)12
2019sand (2–0.05 mm)3silt
silt (0.05–0.002 mm)92
clay (<0.002 mm)6
2020sand (2–0.05 mm)1silt loam
silt (0.05–0.002 mm)88
clay (<0.002 mm)11
Table 3. Plant measurements and yield of annual white sweet clover.
Factor Plant   Population   after   Emergence   [ Plant   m 2 ] Plant Height [cm] Green   Matter   Yield   [ kg · m 2 ] Dry   Matter   Yield   [ kg · m 2 ] Share of Leaves [%]
S-Sowing density [pcs m−2]
500333.34 ± 22.31 a91.43 ± 52.42 a1.66 ± 0.43 a0.37 ± 0.08 a30.83 ± 3.76 a
1000524.77 ± 34.65 b90.33 ± 50.93 a1.91 ± 0.55 a,b0.42 ± 0.03 a,b30.26 ± 3.49 a
1500736.62 ± 44.87 c87.67 ± 48.72 a2.29 ± 0.63 b0.52 ± 0.07 b30.31 ± 3.69 a
H-Harvesting stage
A541.22 ± 235.30 a46.90 ± 8.21 a1.11 ± 0.49 a0.18 ± 0.08 a40.73 ± 1.46 c
B 532.19 ± 240.10 a68.93 ± 8.33 b1.69 ± 0.66 a0.32 ± 0.11 b31.31 ± 2.19 b
C 521.32 ± 248.70 a153.59 ± 21.17 c3.06 ± 0.89 b0.80 ± 0.22 c19.37 ± 3.80 a
Y-Year
2018554.32 ± 254.30 a89.78 ± 60.96 a1.92 ± 0.33 a0.40 ± 0.13 a31.55 ± 3.33 a
2019530.15 ± 247.60 a99.29 ± 49.90 a1.52 ± 0.23 a0.42 ± 0.19 a28.63 ± 2.13 a
2020510.26 ± 236.70 a80.37 ± 36.28 a2.43 ± 0.44 b0.49 ± 0.17 a31.21 ± 3.80 a
Different harvesting stages: A—before budding, B—budding, and C—full flowering. Results are expressed as mean value ± standard deviations. Different letters in the same column indicate significant differences (p < 0.05) according to the three-way analysis of variance (ANOVA) followed by Tukey’s test.
Table 4. Chemical composition of Melilotus albus plants [% DM].
FactorTotal ProteinCrude FatFiberAsh
S-Sowing density (pcs·m−2)
50018.14 ± 3.58 a2.06 ± 0.56 a38.52 ± 6.44 a10.70 ± 2.11 a
100017.67 ± 2.65 a2.04 ± 0.54 a39.71 ± 4.83 a10.45 ± 2.06 a
150017.80 ± 4.10 a2.11 ± 0.62 a39.42 ± 4.78 a10.49 ± 2.27 a
H-Harvesting stage
A21.72 ± 1.50 c2.41 ± 0.61 b34.55 ± 3.29 a12.10 ± 1.68 b
B17.08 ± 1.66 b2.08 ± 0.45 a,b40.27 ± 3.36 b11.05 ± 0.73 b
C14.81 ± 1.99 a1.71 ± 0.32 a42.82 ± 5.01 b8.44 ± 1.58 a
Y-Year
201818.32 ± 3.50 a2.15 ± 0.55 b35.94 ± 3.64 a12.11 ± 1.80 b
201916.55 ± 3.90 a1.62 ± 0.27 a41.41 ± 5.38 a9.27 ± 1.99 a
202018.74 ± 2.53 a2.44 ± 0.39 b40.31 ± 5.24 a10.21 ± 1.41 a
Different growth stages: A—before budding, B—budding, C—full flowering. Results are expressed as mean value ± standard deviations. Different letters in the same column indicate significant differences (p < 0.05) according to the three-way analysis of variance (ANOVA) followed by Tukey’s test.
Table 5. Macronutrient content in Melilotus albus plants [mg · g−1 DM].
FactorCaKMgPS
S-Sowing density (pcs·m−2)
50012.15 ± 2.09 a21.46 ± 6.23 a2.69 ± 0.55 a3.97 ± 1.15 a3.11 ± 0.66 a
100012.13 ± 2.29 a21.30 ± 6.39 a2.91 ± 0.59 a3.99 ± 0.93 a3.19 ± 0.69 a
150011.84 ± 2.41 a21.59 ± 5.12 a3.04 ± 0.47 a4.19 ± 1.02 a3.12 ± 0.66 a
H-Harvesting stage
A13.51 ± 2.02 b24.95 ± 3.99 b2.82 ± 0.26 a4.36 ± 0.98 b3.54 ± 0.45 b
B12.27 ± 1.76 b24.32 ± 3.90 b2.90 ± 0.39 a4.24 ± 0.67 b3.31 ± 0.53 b
C10.34 ± 1.60 a15.08 ± 2.47 a2.91 ± 0.28 a3.55 ± 1.19 a2.56 ± 0.52 a
Y-Year
201811.94 ± 2.06 a,b24.94 ± 6.82 b3.36 ± 0.51 a2.91 ± 0.62 a2.94 ± 0.57 a
201910.48 ± 1.35 a19.94 ± 5.77 a2.94 ± 0.47 a4.34 ± 0.59 b2.74 ± 0.44 a
202013.70 ± 1.89 b19.46 ± 2.37 a2.34 ± 0.53 a4.90 ± 0.38 b3.73 ± 0.46 b
Different harvesting stages: A—before budding, B—budding, C—full flowering. Results are expressed as mean value ± standard deviations. Different letters in the same column indicate significant differences (p < 0.05) according to the three-way analysis of variance (ANOVA) followed by Tukey’s test.
Table 6. Micronutrient content in Melilotus albus plants [mg · kg−1 DM].
FactorFeMnMoCuZn
S-Sowing density (pcs·m−2)
500103.48 ± 55.07 a15.22 ± 3.91 a2.76 ± 1.68 a7.11 ± 2.26 a17.89 ± 1.93 a
100093.27 ± 42.34 a15.00 ± 3.49 a3.08 ± 1.69 a6.46 ± 1.27 a16.61 ± 2.69 a
150095.31 ± 41.92 a15.49 ± 4.10 a3.22 ± 1.74 a5.80 ± 1.25 a17.77 ± 2.82 a
H-Harvesting stage
A134.02 ± 44.43 c17.80 ± 3.39 b3.35 ± 1.90 b7.37 ± 1.37 b17.50 ± 2.26 a
B98.65 ± 36.89 b15.71 ±2.83 a,b3.59 ± 1.72 b7.02 ± 1.28 b17.56 ± 1.59 a
C59.39 ± 13.34 a12.21 ± 2.54 a2.12 ± 0.90 a4.98 ± 1.11 a17.20 ± 3.52 a
Y-Year
201871.20 ± 38.05 a17.42 ± 3.43 b3.76 ± 1.31 b6.32 ± 2.38 a14.75 ± 2.24 a
201995.07 ± 26.46 b12.07 ± 2.53 a4.06 ± 1.26 b6.29 ± 1.34 a18.49 ± 0.63 b
2020125.80 ± 53.05 c16.22 ± 2.83 b1.24 ± 0.04 a6.76 ± 0.90 a19.02 ± 1.57 b
Different harvesting stages: A—before budding, B—budding, C—full flowering. Results are expressed as mean value ± standard deviations. Different letters in the same column indicate significant differences (p < 0.05) according to the three-way analysis of variance (ANOVA) followed by Tukey’s test.
Publisher’s Note: MDPI stays neutral with regard to jurisdictional claims in published maps and institutional affiliations.

