Article

An ANN-PSO-Based Method for Optimizing Agricultural Tractors in Field Operation for Emission Reduction

1
College of Engineering, China Agricultural University, Beijing 100083, China
2
Beijing Key Laboratory of Modern Agricultural Equipment Optimization Design, China Agricultural University, Beijing 100083, China
*
Author to whom correspondence should be addressed.
Agriculture 2022, 12(9), 1332; https://doi.org/10.3390/agriculture12091332
Submission received: 11 July 2022 / Revised: 13 August 2022 / Accepted: 14 August 2022 / Published: 29 August 2022
(This article belongs to the Special Issue Advances in Agricultural Engineering Technologies and Application)

Abstract

:
Aiming at the serious problem of agricultural tractor emission pollution, especially the limitation of nitrogen dioxide (NOx) and soot emissions, we took an agricultural diesel engine as the research object, and a diesel engine combustion chamber model was established for both simulated calculations and experimental verification analysis. The in-cylinder pressure and heat release obtained from the combustion chamber model simulation calculations were within 6% error of the experimental data. The overall trend of change was basically consistent. The established model can simulate the working conditions of the experimental engine relatively well. An artificial neural network (ANN) was also established as an agent model based on the indentation rate, tab depth, and combustion chamber depth as the input, and NOx and soot as the output. The decision coefficients of the ANN model were R2 = 0.95 and 0.93, with corresponding Mean Relative Error (MRE) values of 10.13 and 8.18%, respectively, which are within the generally required interval, indicating that the obtained ANN model has good adaptability and accuracy. On the basis of the general particle swarm optimization (PSO) algorithm, an improved PSO algorithm was proposed, in which the inertia factor is continuously adjusted with the help of the skip line function in the optimization process so that the inertia factor adapts to different rates and adjusts the magnitude of the corresponding values in different periods. The improved PSO algorithm was used to optimize the optimal input parameter matching of the agent model to form a new combustion chamber structure, which was imported into CONVERGE CFD software for emission simulation and comparison with the emissions of the original combustion chamber. It was found that the NOx reduction was about 1.21 g·(kW·h)−1, and the soot reduction was about 0.06 g·(kW·h)−1 with the new combustion chamber structure. The ANN + PSO optimization method proved to be effective in reducing the NOx and soot emissions of diesel engine pollutants, and it may also provide a reference and ideas for the design and development of relevant agricultural engine combustion chamber systems.

1. Introduction

With increasing levels of agricultural mechanization operations in China, the overall quantity of agricultural machinery has also been increasing. By the beginning of 2022, the total power consumption of agricultural machinery in China was 107,768.02 million kilowatts, the total number of medium and large tractors was 477,737, and the number of small tractors was 17,275,995 [1]. The vast majority of these tractors source their power from diesel engines. Compared to gasoline engines, diesel soot (soot), and nitrogen oxide, (NOx) emissions from diesel engines are significantly increased, which is a serious hazard in respect of human health and the environment [2]. In China, in order to solve this problem, the Ministry of Environmental Protection introduced emission regulations for non-road mobile machinery (the “National IV” emission standards) on 1 December 2022, but the current emission levels of agricultural machinery in most regions are still dominated by the National II and National III emission standards. In the face of increasingly stringent emission regulations and serious energy and environmental issues, reducing the emission of pollutants from agricultural machinery is of great significance to the stable development of China’s economy and society and to environmental protection [3,4].
There are three mainstream methods used to reduce pollutants in diesel engines: Pre-treatment technology (oil technology), in-cylinder technology (in-engine purification technology), and post-treatment technology (off-engine exhaust after-treatment technology) [5]. Internal optimization, such as combustion chamber system optimization, can effectively improve the combustion efficiency of the engine and reduce pollutant emissions [6]. As the main container for fuel mist formation and combustion, the combustion chamber plays a key role in mixture formation and combustion. Different combustion chamber structure designs can change the oil–gas mixture state in the cylinder and affect the fluid motion state and combustion process in the cylinder [7]. An appropriate combustion chamber design can enhance the interaction between vortex and turbulence in the cylinder, accelerate the formation of the oil–gas mixture, and distribute it well in the cylinder, thus improving the combustion efficiency of the whole engine and effectively reducing the generation of harmful emission gases. In this regard, a significant amount of research has been conducted in China and abroad. The team of Su Wanhua of Tianjin University designed a BUMP-type combustion chamber based on the phenomenon of convex ring stripping wall jets [8,9,10], where a finite flow edge is set on the inner wall of the combustion chamber so that a secondary jet is formed in the combustion chamber after the oil beam touches the wall, which accelerates the mixture formation rate and improves the overall combustion efficiency while reducing soot and NOx emissions. Rakopulos et al. [11] investigated the effect of combustion chamber structure on diesel engine performance and emissions based on a high-speed direct injection diesel engine and found that combustion chamber structure, fuel injection, and airflow motion are the key factors affecting diesel engine performance and emissions. Li et al. [12] investigated the effect of different combustion chamber crater depths on diesel engine performance and emissions, and the results showed that indented combustion chambers exhibit better oil–gas mixing and open combustion chambers exhibit better combustion performance at low-speed operating conditions. Abdul et al. [13] investigated the effect of the swirl ratio on engine performance and emissions under different combustion chambers and showed that a lower indentation rate leads to an increase in NOx emissions and a decrease in soot emissions. Jafarmadar et al. [14] investigated the effect of the piston combustion chamber structure on the swirl number and uniformity index and found that a larger crater diameter generally has a higher swirl number and causes lower soot emissions, while a smaller crater depth results in a stronger squeeze flow and output power. Shahanwaz et al. [15] studied the effects of different combustion chamber sizes and injection cone angles on engine emissions and found that an annular combustion chamber structure with different injection cone angle couplings can enable oil and gas to mix more fully and reduce carbon soot emission. At present, scholars at both domestic and international levels mainly focus on two methods for combustion chamber design and optimization. One involves designing and optimizing the traditional combustion chamber shape, and the other involves developing new combustion chambers based on new concepts. However, the common purposes of both are to improve the quality of the oil–gas mixture in the combustion chamber, improve the combustion process, and reduce pollutant emissions. The main research approaches include empirical formulations [16], numerical simulations [17], and complete engine experiments [18,19]. However, most of the methods have long working cycles, high costs, and high accuracy requirements in respect of the experimental models. In recent years, the rise in popular computer technologies, such as machine learning, has provided a new research idea for the rapid prediction of combustion chamber emissions and the mining of new methods and new information [20].
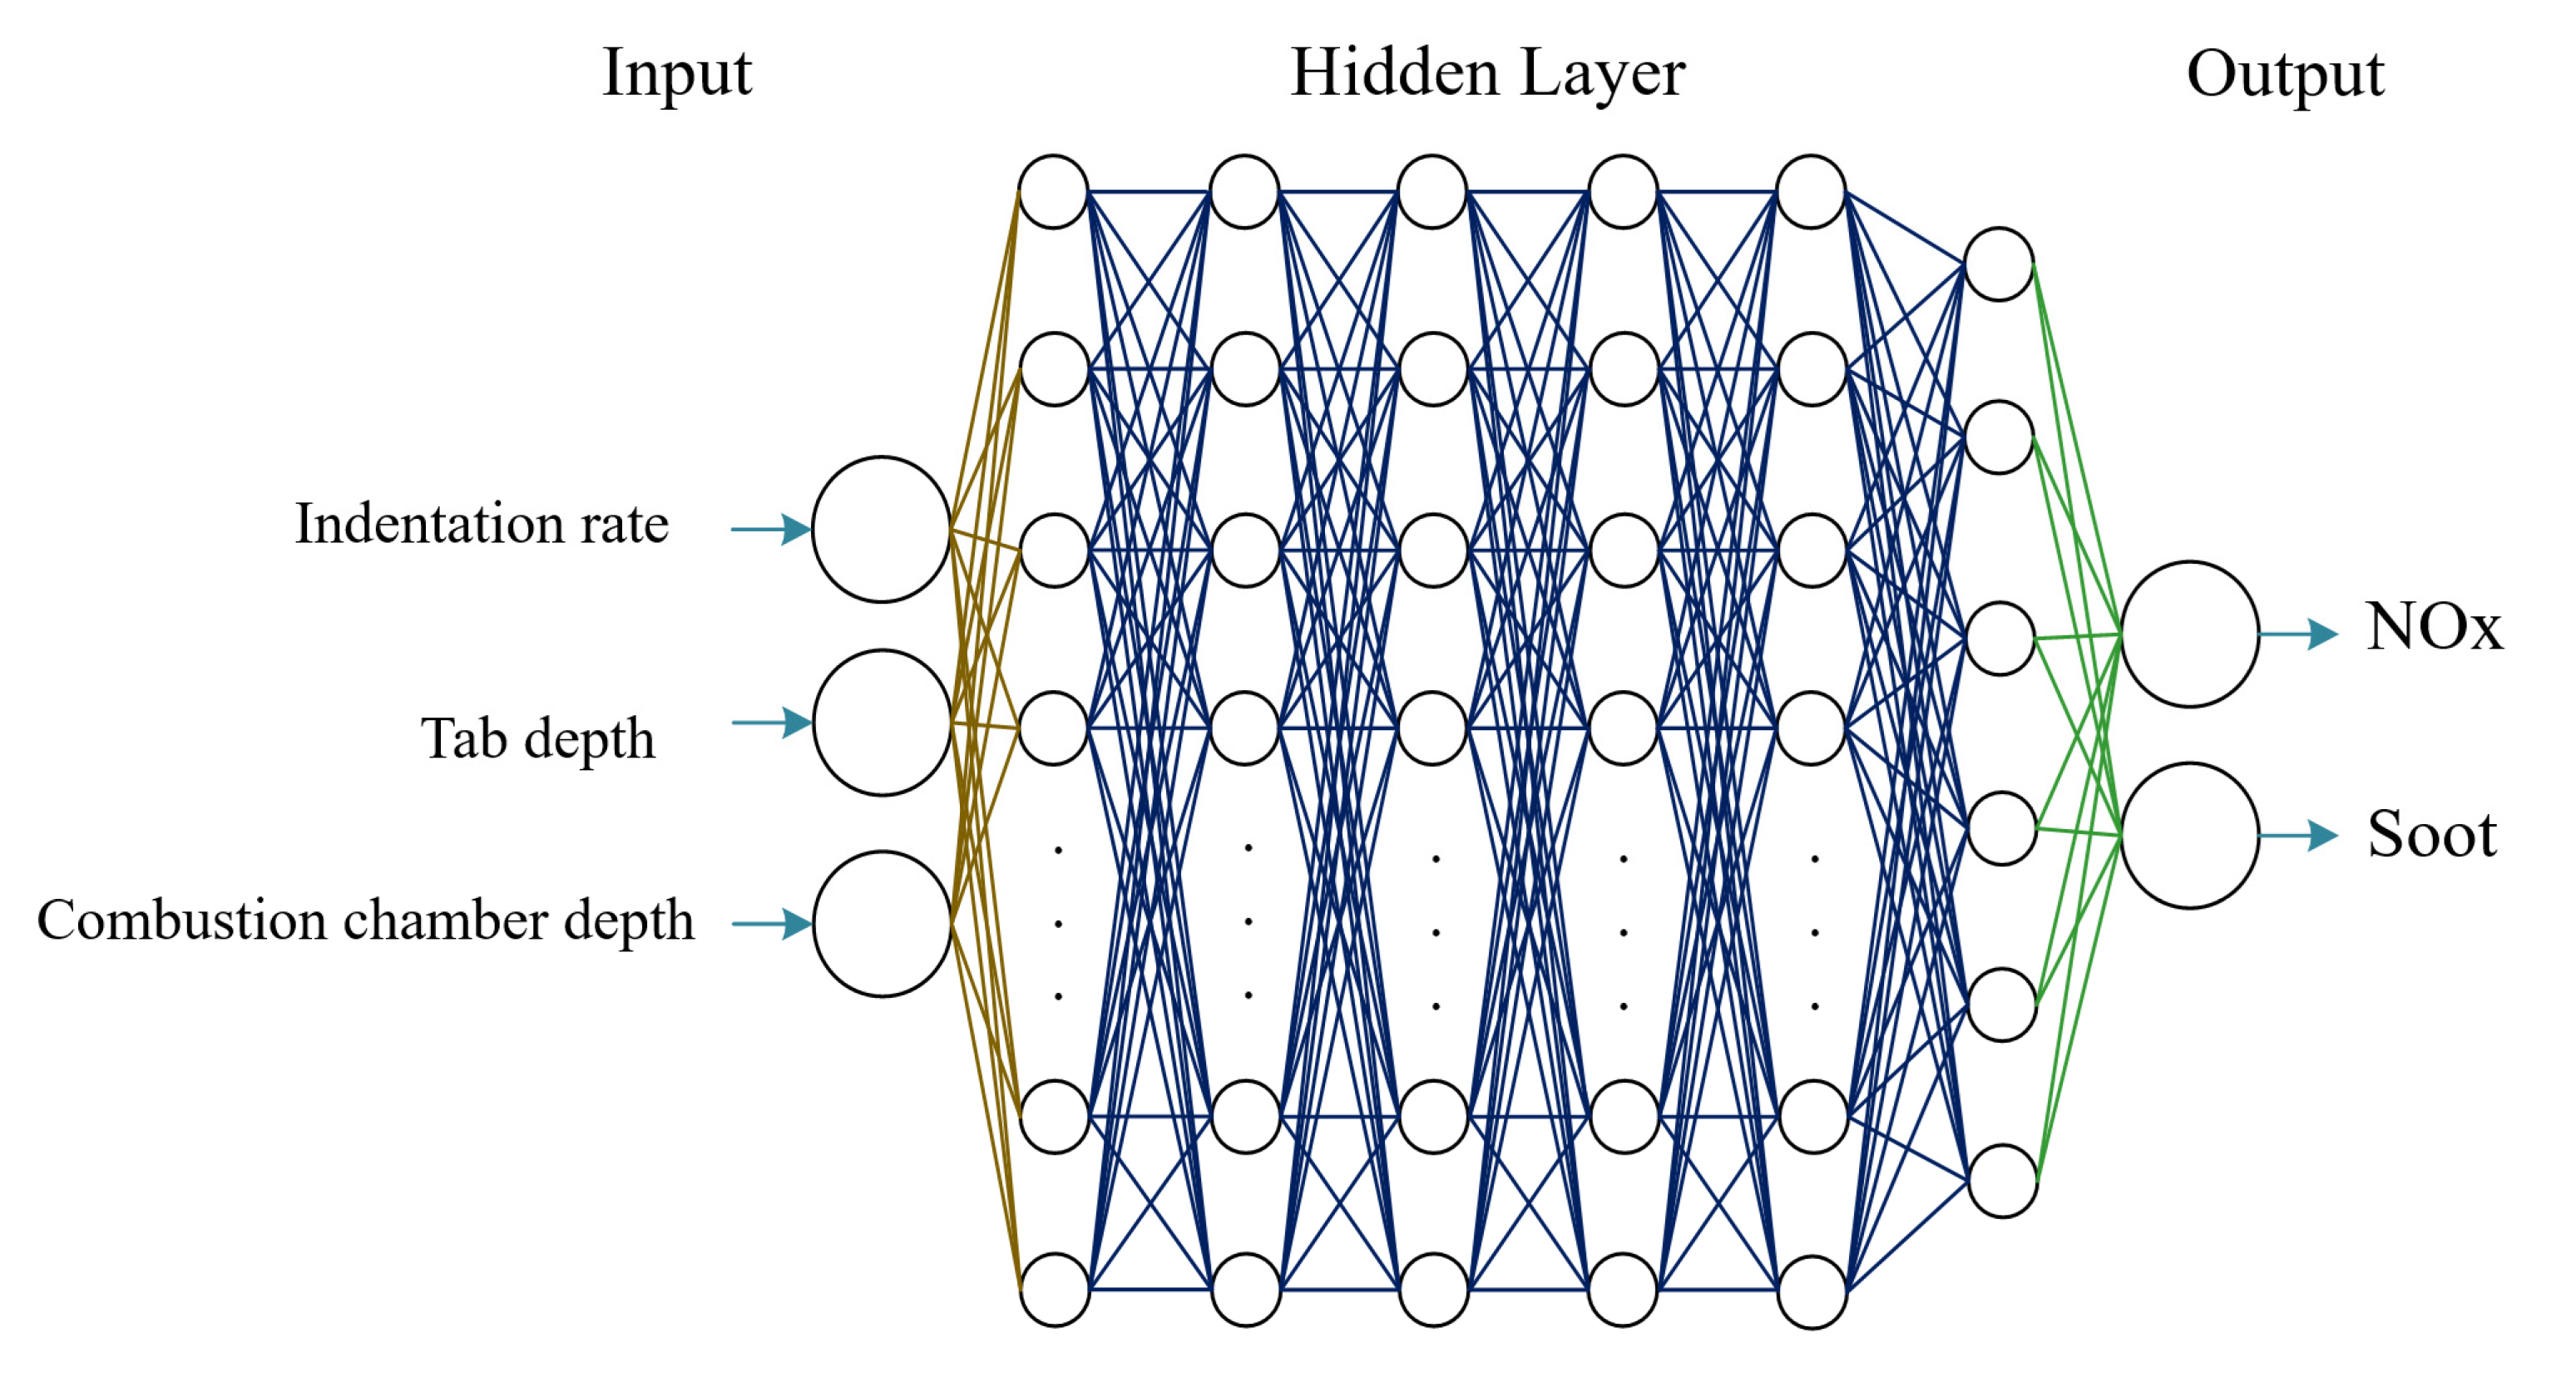
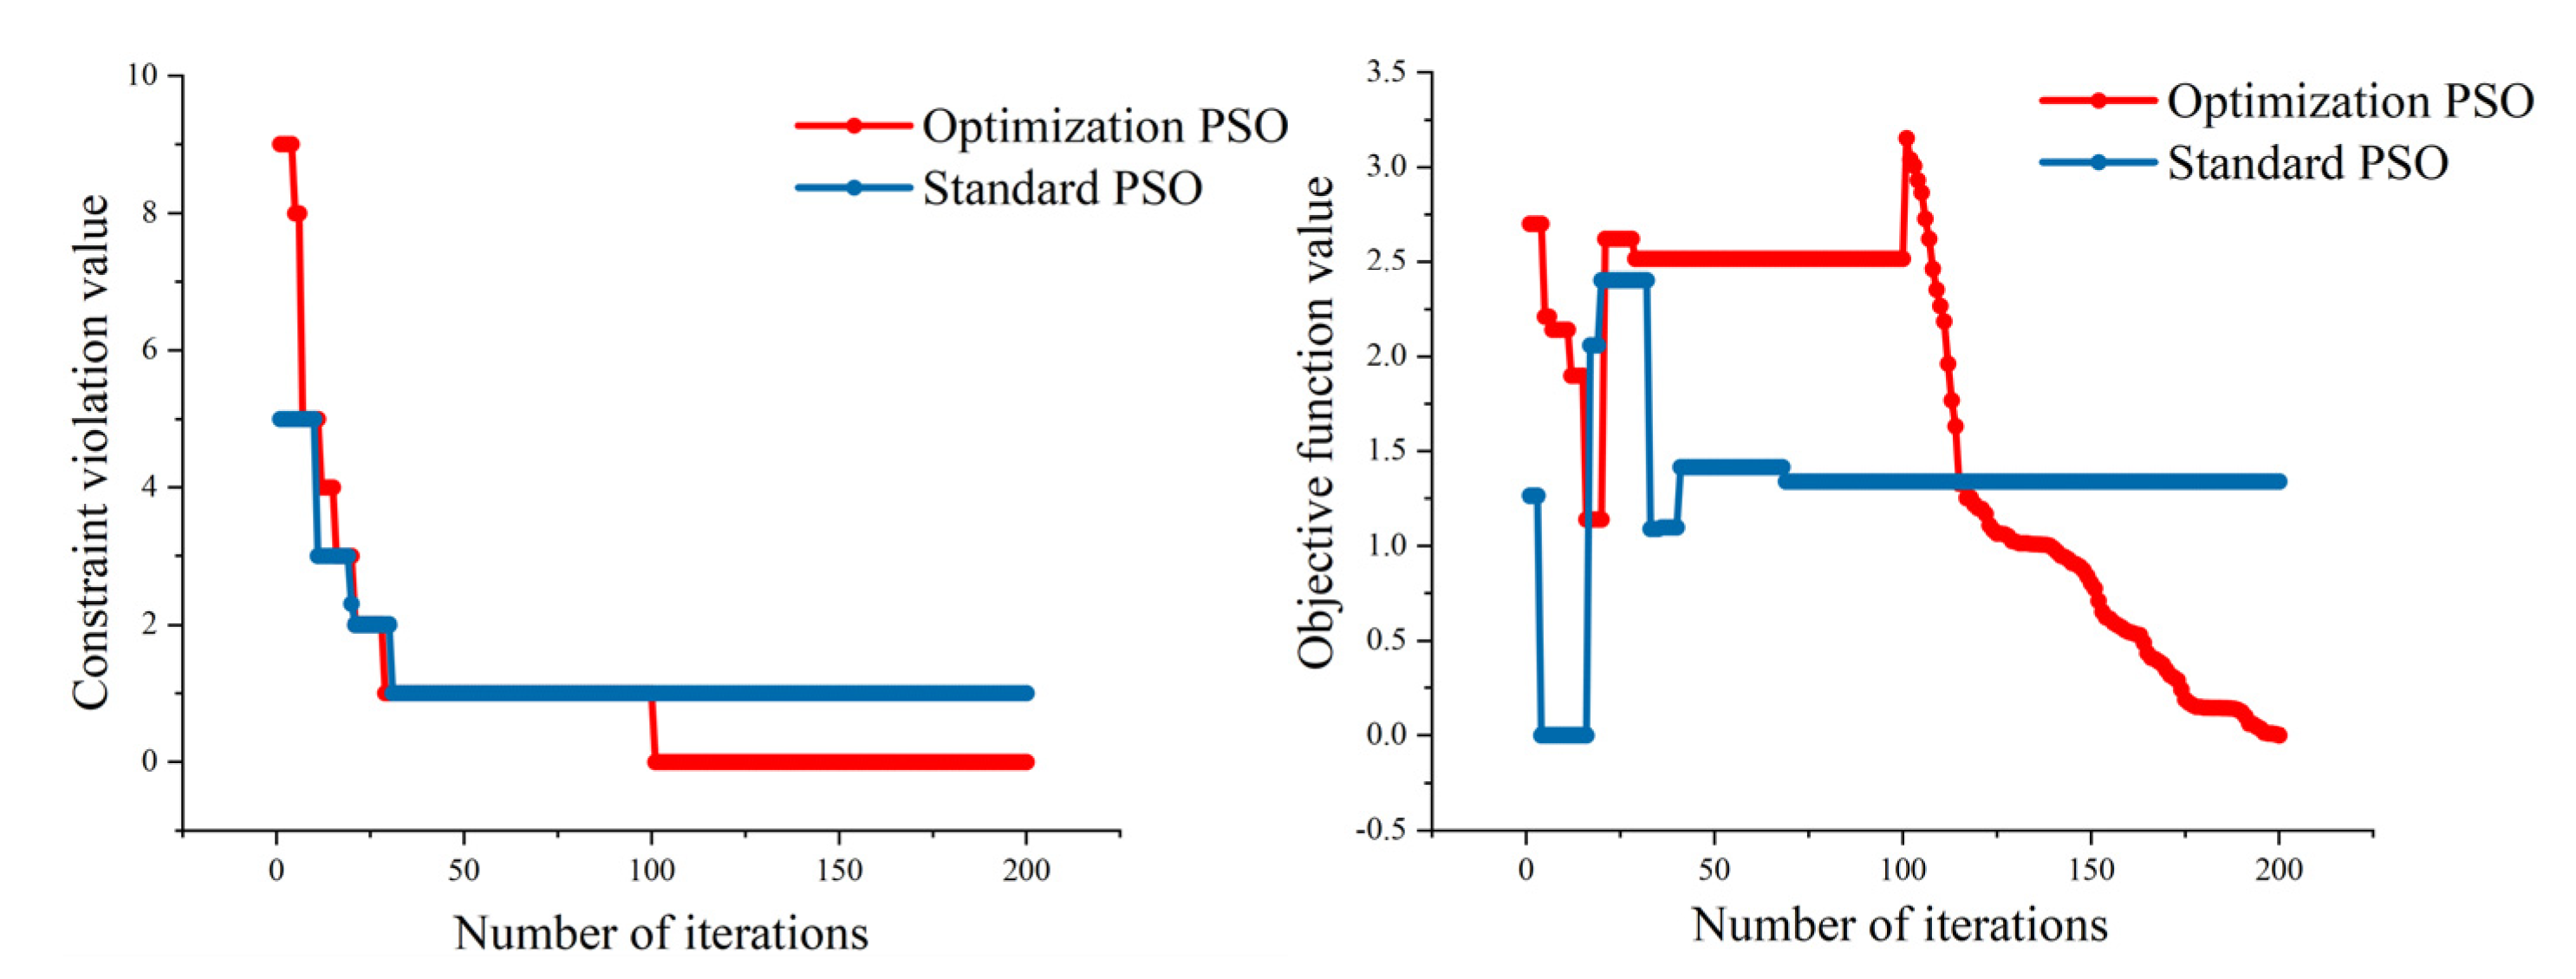
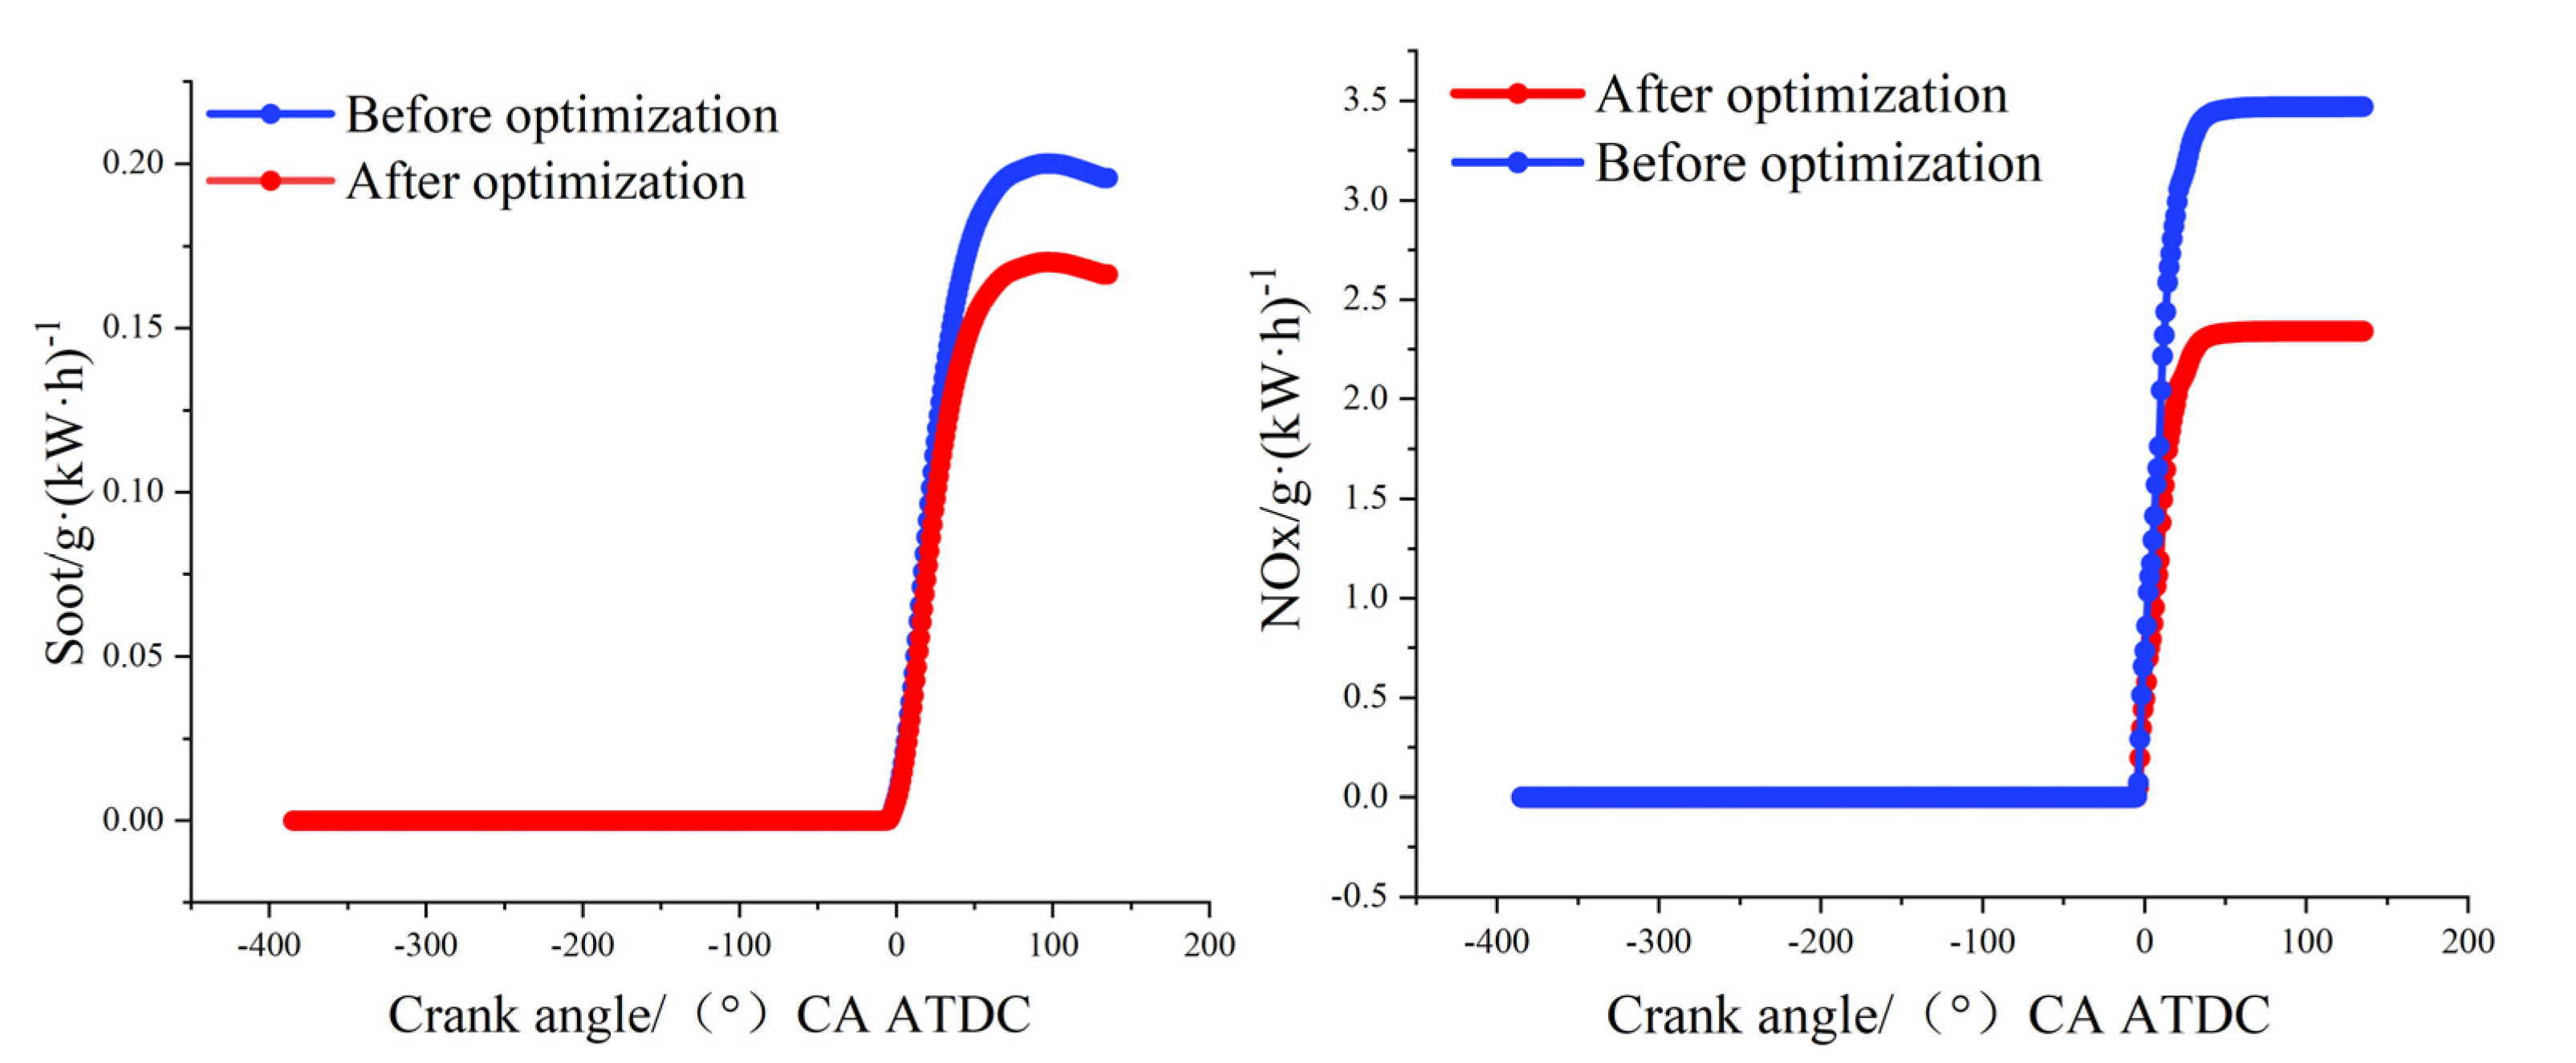
Based on the above, in this study, we first established a diesel engine combustion chamber model based on a YTO Company (China, Luoyang) agricultural tractor diesel engine for simulation, and the simulation model was then tested to enable validation and analysis. The in-cylinder pressure and heat release values obtained from the simulation of the combustion chamber model were within 6% error of the test data. The overall trend of change was basically consistent. The simulation model can simulate the working conditions of the test engine relatively well. Next, an artificial neural network was established as an agent model based on the indentation rate, tab depth, and combustion chamber depth as the input, and NOx and diesel soot emitted from the engine as the output. Subsequently, based on the general particle swarm optimization (PSO) algorithm, an improved PSO algorithm was proposed, which continuously adjusts the inertia factor with the help of a skip line function during the optimization process, so that the inertia factor adapts to different rates and adjusts the magnitude of the corresponding values in different periods, thus facilitating the PSO in switching gradually from local optimization seeking to global optimization seeking. The improved PSO algorithm was used to optimize the optimal input parameter matching of the proxy model, and the new combustion chamber structure was formed and imported into CONVERGE CFD (Convergent Science Company, Madison, WI, USA) software for comparison with the original combustion chamber. It was found that the new combustion chamber structure can effectively reduce diesel engine emission soot and NOx, which provides suggestions and references for the development of relevant engine combustion chamber systems.

2. Materials and Methods

2.1. Theoretical Modeling Basis

In this study, a typical fluid dynamics approach was used as the theoretical basis for the gas flow model in the engine cylinder, and the laws of conservation of mass, conservation of momentum, and conservation of energy were chosen as the theoretical basis for calculation. The mass conservation equation is as follows:
ρ t + ( ρ u x ) x + ( ρ u y ) y + ( ρ u z ) z = 0
In Equation (1), ρ denotes density in kg/m3 and t denotes time in seconds; u x , u y , u z are the components of the velocity vector u in the x, y, and z directions in units of m/s. The mass conservation equation reflects the relationship between fluid motion and mass and follows the law of mass conservation. That is, the increase in mass within the control system is equal to the difference between the mass flowing into the control system and the mass flowing out of the control system.
The conservation of momentum equation is as follows:
{ ( ρ u x ) t + d i v ( ρ u x u ) = p x + τ x x x + τ x y y + τ x z z + F x ( ρ u y ) t + d i v ( ρ u y u ) = p y + τ y x x + τ y y y + τ y z z + F y ( ρ u x ) t + d i v ( ρ u x u ) = p z + τ z x x + τ z y y + τ z z z + F z
In Equation (2), p is the surface force acting on the fluid micro-element in the cylinder in N; τ x x , τ x y , τ x z denote the components of viscous stress in the x, y, and z directions in Pa; F x , F y , F z denote the volume force acting on the micro-element in the x, y, and z directions in N. The momentum conservation equation is the embodiment of Newton’s second law in fluid mechanics, which means that the increased momentum in the control body is equal to the difference between the inflowing momentum and the impulse produced by the surface and volume forces. div denotes the divergence, and the divergence equation is shown in Equation (3):
d i v ( ρ u ) = ( ρ u x ) x + ( ρ u y ) y + ( ρ u z ) z
The momentum conservation equation is the embodiment of Newton’s second law in fluid mechanics, i.e., the increased momentum in the control body is equal to the difference between the inflowing momentum and the impulse produced by the surface and volume forces. div denotes the scatter, and the scatter equation is shown in Equation (3).
The conservation of energy equation is as follows:
( ρ T ) t + ( ρ u x T ) x + ( ρ u y T ) y + ( ρ u z T ) z = z [ h C p y x ] + z [ h C p y y ] + z [ h C p y z ] + S T
In Equation (4), C p denotes the constant pressure-specific heat capacity in J/(kg·K), T denotes the temperature in K, h denotes the fluid heat transfer coefficient, and S T denotes the viscous consumption term in J. That is, when the fluid is subject to viscous friction in the flow process, the mechanical energy of the fluid is converted into thermal energy. The conservation of energy equation is the application of the law of conservation of energy in fluid mechanics, that is, the total energy of the fluid is equal to the sum of kinetic energy and internal energy.
The turbulence model was selected as the RNGκ-ε model in CONVERGE CFD because it has good stability and convergence and can better reflect the effects of rotation, shock, and stratification within the flow field. The turbulent kinetic energy equation is as follows:
1 g ( g ρ k ) t + x j ( ρ u j ¯ k µ e f f σ k   k x j ) = µ t ( P + P B ) ρ ε 2 3 ( µ t u i x i + ρ k )   u i x i .  
The turbulent dissipation rate equation is as follows:
1 g ( g ρ k ) t + x j ( ρ u j ¯ k µ e f f σ k   k x j ) = c ε 1 ε k [ µ t P 2 3 ( µ t u i x i + ρ k ) u i x i ] + c ε 3 ε k µ t P B c ε 2 ε 2 k + c ε 4 ρ ε u i x i ρ ε 2 k c µ η 3 ( 1 η / η 0 1 + β η 3
η S k ε ,   S ( 2 S i j S i j ) 1 2 ,   S i j = 1 2 ( u i x i + u i x j ) , P 2 S i j u i x i , P B g σ h , t 1 ρ ρ x i
where k is the turbulent kinetic energy in J, g is the distance tensor determinant, x j is the coordinate (j = 1,2,3), and u j is the velocity component in m/s in the x, y, and z directions. η is the ratio of average flow to turbulent time scale, u i is the velocity component in the direction of coordinate axis x i in m/s. c ε 1 , c ε 2 , c ε 3 , c ε 4 , σ k , σ h , t , c µ , and η 0 are empirical constants.

2.2. Building Geometric Models and Validation

A three-dimensional model was designed based on a YTO Company agricultural tractor diesel engine combustion chamber. This engine is a four-stroke supercharged intercooled diesel engine and is mainly used in agricultural machinery field operation conditions. According to the engine parameters provided by YTO, the three-dimensional model was drawn and imported into CONVERGE CFD software. The calibrated power condition was selected, and the flow medium was air. The testing location was the Luoyang Xiyuan Vehicle and Power Inspection Institute. The main technical parameters of the diesel engine are shown in Table 1. The engine model used in the study includes intake and exhaust pipes, intake and exhaust valves, cylinders, and a combustion chamber in-cylinder geometry model, as shown in Figure 1. In CONVERGE 3.0 software, a combination of adaptive encryption and fixed encryption was used to dynamically generate a hexahedral mesh, and the base mesh size of the model was determined to be 8 mm × 8 mm × 8 mm, with dynamic adaptive encryption according to the temperature and velocity gradient, and the highest encryption level being 3. The smaller base mesh size and higher encryption level allow the model calculation results to be more convergent. The initial conditions used in the calculation are shown in Table 2.
In order to verify the reliability of the model and calculation method, the in-cylinder combustion process was simulated under the working conditions of the agricultural engine with a speed of 2000 rpm/min and a torque of 305 N-m. Figure 2 shows the comparison of the simulated calculation results for in-cylinder pressure and heat release with the test data. The peak phase of in-cylinder pressure and heat release obtained from the simulation is basically the same as that of the test data, and the error did not exceed 6%. The overall trend of change is basically consistent, and the simulation model can simulate the test engine conditions relatively well.

2.3. Combustion Chamber Structure and Parameters

The geometric shape characteristics of the engine combustion chamber are defined as shown in Figure 3. The parameters indentation rate δ and diameter-depth ratio γ are introduced and calculated as:
δ = d m d k d m × 100 %
γ = d m H
where d m is the maximum diameter of the combustion chamber in mm, d k is the indentation diameter of the combustion chamber in mm, H is the depth of the combustion chamber in mm, and h is the depth of the tab in mm.
The combustion chamber indentation rate has an important influence on the airflow movement at the end of the compression process in the cylinder and also increases the heat load inside the piston. The indentation diameter d k reflects the volume of the combustion chamber, which in turn affects the formation and combustion of the oil and gas mixture. As the diameter of the indentation increases, the oil–gas mixture and combustion rate in the combustion process will increase, and the combustion temperature inside the cylinder will increase, so there will be more areas in the cylinder in which to meet the high temperature and sufficient oxygen conditions required for NOx generation, and NOx will increase. However, as the temperature increases, it will accelerate some of the soot oxidation, thus reducing the production of soot. If the diameter of the indentation is too large, the combustion temperature decreases, and NOx generation decreases while soot generation increases. The change in the indentation depth h affects the partition ratio of oil and gas spray after hitting the wall in the cylinder, which has an impact on the combustion process and combustion temperature and ultimately, on the emission generation. The design of the combustion chamber depth H affects the height of the piston in the cylinder. If the piston height is too large, the exhaust gas cannot easily be discharged from the exhaust port, increasing the heat load in the combustion chamber, and leading to a series of problems such as reduced piston life. Therefore, it can be seen that the combustion chamber indentation rate, tab depth, and combustion chamber depth have an important impact on the design of the combustion chamber system and are also important factors for the optimization of agricultural diesel engine emissions. The airflow motion inside the combustion chamber is mainly turbulent motion, which is a highly nonlinear type of fluid motion. The traditional multi-objective optimization method for a diesel combustion chamber cannot easily ensure a good optimization effect when the multi-objective problem presents complex features such as nonlinearity and high dimensionality. Therefore, in this study, the ANN-PSO approach was used to optimize the diesel engine combustion chamber dimensions with the lowest NOx and soot emissions as the optimization objective and then reduce the engine emissions.

2.4. Construction of Artificial Neural Network (ANN) Model and Validation

In this study, the indentation rate, tab depth, and combustion chamber depth of the combustion chamber were used as inputs, and the nitrogen oxide (NOx) and diesel soot (diesel soot) emitted from the engine were used as outputs to build an artificial neural network as an agent model. The structure of the model is shown in Figure 4, and consists of an input layer, hidden layer, and output layer. Based on the premise of not changing the overall structure of the original 3D model, 200 sets of random data were collected for building the artificial neural network model by using CONVERGE CFD software to randomly generate and collect sample points for three input quantities: Indentation rate, tab depth, and combustion chamber depth. Approximately 75% of the data were used to train the model, and 25% were used to test the model. The logistic sigmoid activation function with distinguishable, continuous, and nonlinear advantages was chosen to formulate the model [21,22]. In addition, gradient descent with momentum weights and a bias learning function (LEARNGDM) was used to minimize the error [23].
In order to ensure the adaptability and accuracy of an established ANN model, the model is generally tested for significance, and the coefficient of determination (R2) and MRE are often used to verify the accuracy of the model. Usually, the R2 value is required to be between 0.9 and 1. The calculation formulas are shown in Equations (9) and (10):
R 2 = S S R   S S T = S S R S S E S S T = 1 i = 1 n ( t i o i ) 2 i = 1 n ( o i ) 2
MRE ( % ) = 1 n i n | 100 t i o i t i |
where S S T is the total sum of squares, S S R is the regression sum of squares, S S E is the residual sum of squares, n is the number of points in the information set, o denotes the test data, and t denotes the actual data. Combined with the typical agricultural engine operating conditions, the accuracy of the established ANN model was verified and the R2 values were calculated under a speed of 2200 rpm/min, as shown in Figure 5, and the R2 values were 0.95 and 0.93, MRE values were 10.13% and 8.18%, respectively, which are within the generally required interval.

2.5. Improved Particle Swarm Algorithm (PSO) Application

Particle swarm optimization was jointly proposed by Kennedy and Eberhart in 1995. The particle swarm algorithm is an evolutionary algorithm inspired by the foraging behavior of bird groups in nature and has been widely used in various complex experimental tests and practical engineering applications in view of its simple implementation, efficient searching, and fast convergence. Ven den Bergh [24] analyzed and proved the stability and convergence of the PSO algorithm from a theoretical perspective. In 2002, Cello and Lechuga [25] formally published the results of the multi-objective particle swarm optimization algorithm. The particle swarm algorithm for solving multi-objective optimization problems is called the multi-objective particle swarm optimization (MOPSO) algorithm. With the PSO algorithm, the individual position or food of the flock is treated as the solution to the optimization problem, and the information interaction between the individuals in the flock and the optimal individual, and between the individuals, is used to guide the individuals in the whole flock to converge toward the optimal individual of the flock while retaining their own diversity information, and gradually find the optimal solution through continuous updating. Individuals in the flock are abstracted as “particles”, ignoring their mass and volume, and the topological structure determines that the particles are influenced by the combined information of their own and group states in each iteration, i.e., the update mechanism of particles is obtained by the organic combination of population history optimal particles and individual history optimal particles. The particle update mechanism is obtained through the organic combination of population history optimal particles and individual history optimal particles, as shown in Figure 6. The current velocity v j ( t ) of particle J, its own optimal position p b j ( t ) , and the global optimal position g b j ( t ) determine the velocity v j ( t + 1 ) at the next moment, after which the particle moves from the original position p j ( t ) to the new position p j ( t + 1 ) with the updated velocity v j ( t + 1 ) . As the number of iterations increases, the particle reaches the entire global optimal position by continuously updating the speed and position, thus completing the search for the optimal solution in space.
The selection of the objective function mainly considers the emission performance of the combustion chamber, where a better emission performance is defined in the PSO algorithm as the emission of less NOx and soot. According to the analysis of previous tests, different indentation ratios, tab depths, and combustion chamber depth dimensions will affect the emissions of NOx and soot. Therefore, the objective function is shown in Equation (11):
min f ( a , b , c ) = δ 1 N O x + δ 2 S o o t
where a, b, and c denote the indentation rate, tab depth, and combustion chamber depth, respectively, NOx and soot are NOx emissions and soot emissions, respectively, and δ 1 and δ 2 are their corresponding constant coefficients. Each particle in the PSO algorithm has two attributes, velocity and position, and the velocity and position are iterated several times in the optimization process, whose iterative formula is shown in Equation (12):
v i j + 1 = w v i + c 1 r 1 ( p b e s t i j p i j ) + c 2 r 2 ( g b e s t i j g i j ) p i j + 1 = p i j + v i j + 1
where w is the inertia factor, whose value is non-negative and represents the degree of influence of the last velocity of the particle on the current particle. According to experience, w is generally taken as 0.9. c 1 and c 2 are learning factors, usually taken as c 1 = c 2 = 2 ; r 1 and r 2 are random values whose values range from 0 to 1. In the general PSO algorithm, the inertia factor is a constant because the inertia factor plays different roles in different stages of optimization, which is to say, at the beginning of optimization, a larger inertia factor can enhance the global search ability, but at the end of optimization, a smaller inertia factor can enhance the local search ability. In general, PSO algorithms are influenced by the “optimal” particles, and sometimes the population will converge too fast and lead to “premature maturity”, and the particles will fall into the local optimum. Therefore, a larger value of the inertia factor at the beginning of optimization and a smaller value at the end of optimization can significantly improve the solving ability of PSO, and it has been found that the rate of change of the inertia factor will also greatly affect the global optimal finding ability of PSO. Based on the improved PSO algorithm proposed by Feng et al. [26], the inertia factor is continuously adjusted during the optimization process with the help of the skip line function so that the inertia factor takes a larger value and changes slowly at the beginning of the iteration, and takes a smaller value and changes quickly at the end of the iteration, which facilitates the gradual switch from local to global optimization in respect of PSO. The skip line function is shown in Equation (13). The second-order derivative of Equation (13) is solved to obtain Equation (14).
y = 8 a 3 x 2 + 4 a 2
y = 16 a 3 ( 4 a 2 3 x 2 ) ( 4 a 2 + x 2 ) 3
From Equation (14), it can be derived that the coordinates of the inflection point of the skip line function are ( ± 2 3 3 a ,     3 2 a ) . The function has the following characteristics: Its function value at the point (0, 2a) is larger, and the rate of change of the curve is a minimum, while at the inflection point, the function value is smaller, and the rate of change of the curve is a maximum. Based on these characteristics, the adjustment strategy of the inertia factor is designed as follows:
w ( i ) = w m i n + ( w m a x w m i n ) { 2 a [ 8 a 3 ( η i η m a x 2 3 3 a ) + 4 a 2 ] 3 } = w m i n + ( w m a x w m i n ) ( 12 h ( i ) 2 + 3 3 )
where w m i n and w m a x are the maximum and minimum values of the inertia factor, η i and η m a x denote the current iteration number and the maximum iteration number. Finally, after calculating 200 sets of data iteratively, the parameters of the combustion chamber optimization model were obtained as in Table 3.

3. Discussion and Results

In this study, the results of the standard PSO algorithm optimization and the improved PSO algorithm optimization were compared, as shown in Figure 7. The improved PSO algorithm has two main improvements compared with the general PSO algorithm. On the one hand, it can enable the particles to jump out of the local optimum to reach the global optimum during the optimization search process, and on the other hand, it further reduces the objective function value under the premise of satisfying the constraints. Thus, the optimal combination of indentation rate, tab depth, and combustion chamber depth is obtained.
The combustion emission process was re-run by redesigning the combustion chamber imported into CONVERGE CFD software. The emissions of the engine are shown in Table 4 and Figure 8, with reductions of approximately 1.21 g·(kW·h)−1 for NOx and 0.06 g·(kW·h)−1 for soot. The indentation rate was reduced from 0.924 to 0.82, indicating that the NOx emission level increased, and the soot emission level decreased as the diameter of the shrinkage became larger. This is due to the increase in the oil–gas mixture and the combustion level in the cylinder after the indentation diameter became larger, and the increase in temperature during the whole combustion process promoting the NOx generation efficiency and suppressing the soot generation. The tab depth increased from 7.9 to 8.1 mm, which affected the in-cylinder temperature and which, in turn, affected the in-cylinder NOx and soot generation rates. The combustion chamber depth increased from 17.8 to 18.56 mm, and the NOx emission level decreased with the increase in the combustion chamber depth, while the soot exhibited an opposite pattern of changes. The trend in the parameters optimized by the improved PSO algorithm is consistent with the results of the conventional experimental verification. The ANN + PSO method shortens the experimental period and saves experimental costs compared with the conventional method.
Furthermore, by comparing with the existing studies in the literature, we found that ANN + PSO is feasible [27]. It can be found that most of the studies take the engine body as the object of study and use different parameters as inputs, such as different ratios of biodiesel mixed with diesel, different injection pressure and engine load, etc. Then the performance and emission of the engine are taken as the output, and an ANN model or other models such as support vector machine (SVM), K-nearest neighbors (k-NN) are established, and predictions are made based on the established models [28]. Some studies use standard PSO algorithms and other algorithms combined together to find the optimal input parameter ratios and obtain the optimized performance and emission data [27]. Some studies compared the prediction results after using different models cross-sectionally, such as comparing ANN, SVM, k-NN, etc. [29]. In this study, the same cross-sectional comparison method was used to build ANN model, SVR model and k-NN model using the same data collected, and the R2 and MRE of ANN model, SVR model and k-NN model were compared as shown in Table 5. It was found that the accuracy of all three models met the requirements, but the accuracy of ANN model was higher compared with other models. In this study, to address the current situation that the emission level of domestic agricultural machinery engines is still at a low level, an engine combustion chamber system is used as the research object to investigate the effect of changing the size of combustion chamber parameters on the engine emission by changing the size of the internal parameters of the combustion chamber system, and an improved particle swarm algorithm based on the standard PSO algorithm is used to optimize the established combustion chamber proxy model An improved particle swarm algorithm based on the standard PSO algorithm is used to optimize the established combustion chamber proxy model and find the optimal size of the engine combustion chamber with the lowest emission as the optimization objective. In addition, by comparing the existing studies, the fitting accuracy of the ANN model used and established in this study meets the basic conditions of the proxy model, and the relevant accuracy parameters R2 and MRE meet the requirements, which ensures the accuracy of the model, and the ANN model, as a proxy model in the intermediate process, only needs the accuracy of the established model to meet the requirements. Compared with other literature, the improved particle swarm algorithm used in this study can solve the problem that the particles are easy to fall into the local optimum in the process of finding the optimum and can find the optimum value in the global search, which can further reduce the cost of the objective function value while satisfying the constraints, so as to obtain the best combination of parameters of indentation rate, tab depth, and combustion chamber depth with the lowest emission as the optimization goal.
Table 6 lists some of the literature reviews using the ANN + PSO approach for the relevant emission optimization.

4. Conclusions

In this study, a diesel engine combustion chamber model was established based on a YTO Group agricultural diesel engine for simulation modeling and calculation, followed by an experimental verification analysis of the simulation model. The results show the following:
(1)
The in-cylinder pressure and heat release obtained from the combustion chamber model simulations were within 6% error of the test data. The overall trend of change was basically consistent. The simulation model can simulate the working conditions of the test engine relatively well.
(2)
An artificial neural network was established as an agent model with the indentation rate, tab depth, and combustion chamber depth as inputs and NOx and soot emitted from the engine as outputs. The R2 values were 0.95 and 0.93. The MRE values were 10.13% and 8.18%, respectively, which indicates that the obtained ANN model has good adaptability and accuracy.
(3)
On the basis of the general particle swarm (PSO) algorithm, an improved PSO algorithm was proposed in which the inertia factor is continuously adjusted with the help of the skip tongue function in the optimization process so that the inertia factor adapts to different rates in different periods and adjusts the size of the corresponding value. On the one hand, it is beneficial for PSO to gradually switch from local to global optimization. On the other hand, this can further reduce the value of the objective function needed to reach the optimum under the condition of satisfying the constraints. The improved PSO algorithm was used to optimize the agent model and obtain the optimal combination of input parameters (i.e., an optimized combustion chamber structure with indentation rate, tab depth, and combustion chamber depth of 0.82, 8.1, and 18.56 mm, respectively). The model was then imported into CONVERGE CFD software for combustion emission calculation to obtain the emission generation compared with the original combustion chamber. It was found that the optimized combustion chamber reduced NOx by about 1.21 g·(kW·h)−1 and soot by about 0.06 g·(kW·h)−1, which values are close to the National IV emission standards.
For future applications of tractor emission reduction in agriculture, we will focus on the optimization of tractors with different horsepower in different field operating environments and working conditions. We will also increase the complexity of the artificial neural networks used in order to perform larger-scale model building and optimization.

Author Contributions

Conceptualization, B.Z.; methodology, B.Z.; software, B.Z.; validation, B.Z., Z.D.; formal analysis, Z.L.; investigation, X.S., Z.L., Y.L.; writing—original draft preparation, B.Z.; writing—review and editing, Z.S., Q.Z., E.M.; funding acquisition, Z.S.. All authors have read and agreed to the published version of the manuscript.

Funding

This research was funded by the National Key Research and Development Plan of China (2017YFD0700301).

Institutional Review Board Statement

Not applicable.

Informed Consent Statement

Not applicable.

Data Availability Statement

Not applicable.

Conflicts of Interest

The authors declare no conflict of interest.

References

  1. National Bureau of Statistics. China Statistical Yearbook; China Statistics Press: Beijing, China, 2021.
  2. Bai, H.; Meng, L.; He, C. Study on technical routes to achieve standards of emission stage III for non-road diesel engine. J. Chin. Agric. Mech. 2015, 36, 193–196. [Google Scholar]
  3. Xie, B.; Wu, Z.; Mao, E. Development and Prospect of Key Technologies on Agricultural Tractor. Trans. Chin. Soc. Agric. Mach. 2018, 49, 1–17. [Google Scholar]
  4. Guo, J. Bowl Geometry Optimization of a Heavy-Duty Diesel Engine in High Density-Low Temperature Combustion; Tianjin University: Tianjin, China, 2020. [Google Scholar] [CrossRef]
  5. Tan, P.; Wang, D.; Lou, D.; Hu, Z. Progress of control technologies on exhaust emissions for agricultural machinery. Trans. Chin. Soc. Agric. Mach. 2018, 34, 1–14. [Google Scholar]
  6. Geng, Y. Tail Gas Pollution from the Vehicles and Its Control Technology. Environ. Sci. Surv. 2010, 29, 62–69. [Google Scholar] [CrossRef]
  7. Wang, G.; Yu, W.; Li, X.; Su, Y.; Yang, R.; Wu, W. Experimental and numerical study on the influence of intake swirl on fuel spray and in-cylinder combustion characteristics on large bore diesel engine. Fuel 2019, 237, 209–221. [Google Scholar] [CrossRef]
  8. Pei, Y.; Su, W.; Lin, T. The BUMP Combustion Chamber Presented Based on the Concept of Lean Diffusion Combustion in a D.I. Diesel Engine with Common Rail Fuel Injector. Trans. CSICE 2002, 20, 381–386. [Google Scholar] [CrossRef]
  9. Su, W.; Lin, T.; Pei, Y. A Compound Technology for HCCI Combustion in a DI Diesel Engine Based on the Multi-Pulse Injection and the BUMP Combustion Chamber. In Proceedings of the SAE 2003 World Congress & Exhibition, Detroit, Michigan, 3–6 March 2003. [Google Scholar]
  10. Zhao, C.; Su, W.; Wang y Yu, J.; Lin, T. A Study on the Mechanism of New Conceptual Mixture Formation of Lean Diffusion Combustion in the Bump Combustion Chamber of a Diesel Engine. J. Combust. Sci. Technol. 2004, 327–335. [Google Scholar]
  11. Rakopoulos, C.D.; Kosmadakis, G.M.; Pariotis, E.G. Investigation of piston bowl geometry and speed effects in a motored HSDI diesel engine using a CFD against a quasi-dimensional model. Energy Convers. Manag. 2010, 51, 470–484. [Google Scholar] [CrossRef]
  12. Li, J.; Yang, W.M.; An, H.; Maghbouli, A.; Chou, S.K. Effects of piston bowl geometry on combustion and emission characteristics of biodiesel fueled diesel engines. Fuel 2014, 120, 66–73. [Google Scholar] [CrossRef]
  13. Gafoor, C.A.; Gupta, R. Numerical investigation of piston bowl geometry and swirl ratio on emission from diesel engines. Energy Convers. Manag. 2015, 101, 541–551. [Google Scholar] [CrossRef]
  14. Jafarmadar, S.; Taghavifar, H.; Taghavifar, H.; Navid, A. Numerical assessment of flow dynamics for various DI diesel engine designs considering swirl number and uniformity index. Energy Convers. Manag. 2016, 110, 347–355. [Google Scholar] [CrossRef]
  15. Khan, S.; Panua, R.; Bose, P.K. Combined effects of piston bowl geometry and spray pattern on mixing, combustion and emissions of a diesel engine: A numerical approach. Fuel 2018, 225, 203–217. [Google Scholar] [CrossRef]
  16. Lei, J.; Yu, Y.; Xin, Q.; Shen, L.; Song, G.; Chen, L. Investigation and application of systematic design method for combustion chamber of diesel engine. Trans. Chin. Soc. Agric. Mach. 2020, 36, 36–46. [Google Scholar]
  17. Zhu, J.; Huang, C.; Yao, M.F. Numerical Simulation on the Effect of Combustion Chamber Geometry on Diesel Engine Combustion Process. Chin. Intern. Combust. Engine Eng. 2007, 28, 14–18. [Google Scholar]
  18. Li, S.; Ge, M.; Shen, L.; Luo, F. Influence of Combustion Chamber Structure on Diesel Engine Emission Based on Simulation and Experiment. Veh. Engine 2013, 22–26. (In Chinese) [Google Scholar]
  19. Zhao, C.; Sun, Y.; Wang, Y.; Zhang, Z.; Zhu, Y. Numerical Simulations of Piston Bowl Geometry on Marine Diesel Engines. China Mech. Eng. 2017, 28, 2176–2182. [Google Scholar]
  20. Wang, Z.; Chen, S.; Fan, W. Effect of neural network width on combustor emission prediction. Acta Aeronaut. Astronaut. Sin. 1–12. Available online: http://kns.cnki.net/kcms/detail/11.1929.V.20220119.1003.016.html (accessed on 12 July 2022).
  21. Javed, S.; Murthy, Y.S.; Baig, R.U.; Rao, D.P. Development of ANN model for prediction of performance and emission characteristics of hydrogen dual fueled diesel engine with Jatropha Methyl Ester biodiesel blends. J. Nat. Gas Sci. Eng. 2015, 26, 549–557. [Google Scholar] [CrossRef]
  22. Bhowmik, S.; Paul, A.; Panua, R.; Ghosh, S.K.; Debroy, D. Performance-Exhaust Emission Prediction of Diesosenol Fueled Diesel Engine: An ANN Coupled MORSM Based Optimization. Energy 2018, 153, 212–222. [Google Scholar] [CrossRef]
  23. Aydogan, H. Prediction of diesel engine performance, emissions and cylinder pressure obtained using Bioethanol-biodiesel-diesel fuel blends through an artificial neural network. J. Energy S. Afr. 2015, 26, 74–83. [Google Scholar] [CrossRef]
  24. Van, D. Analysis of the Particle Swarm Optimization Algorithm. Ph.D. Dissertation, University of Pretoria, Pretoria, South Africa, 2002. [Google Scholar]
  25. Coello, C.; Lechuga, M.S. MOPSO: A proposal for multiple objective particle swarm optimization. In Proceedings of the 2002 Congress on Evolutionary Computation (CEC’02), Honolulu, HI, USA, 12–17 May 2002. [Google Scholar]
  26. Feng, J.; Wang, Y.; Wang, Q.; Biao, X. Fast reflector self-anti-disturbance control based on improved particle swarm algorithm. Syst. Eng. Electron. 2021, 3675–3682. [Google Scholar]
  27. Dhahad, H.A.; Hasan, A.M.; Chaichan, M.T.; Kazem, H.A. Prognostic of diesel engine emissions and performance based on an intelligent technique for nanoparticle additives. Energy 2022, 238, 121855. [Google Scholar] [CrossRef]
  28. Ağbulut, Ü.; Ayyıldız, M.; Sarıdemir, S. Prediction of performance, combustion and emission characteristics for a CI engine at varying injection pressures. Energy 2020, 197, 117257. [Google Scholar] [CrossRef]
  29. Ağbulut, Ü.; Gürel, A.E.; Sarıdemir, S. Experimental investigation and prediction of performance and emission responses of a CI engine fuelled with different metal-oxide based nanoparticles–diesel blends using different machine learning algorithms. Energy 2021, 215, 119076. [Google Scholar] [CrossRef]
  30. Roy, S.; Das, A.K.; Bhadouria, V.S.; Mallik, S.R.; Banerjee, R.; Bose, P.K. Adaptive-neuro fuzzy inference system (ANFIS) based prediction of performance and emission parameters of a CRDI assisted diesel engine under CNG dual-fuel operation. J. Nat. Gas Sci. Eng. 2015, 27, 274–283. [Google Scholar] [CrossRef]
  31. Norhayati, I.; Rashid, M. Adaptive neuro-fuzzy prediction of carbon monoxide emission from a clinical waste incineration plant. Neural Comput. Appl. 2018, 30, 3049–3061. [Google Scholar] [CrossRef]
  32. Sakthivel, G.; Snehitkumar, B.; Ilangkumaran, M. Application of fuzzy logic in internal combustion engines to predict the engine performance. Int. J. Ambient. Energy 2016, 37, 273–283. [Google Scholar] [CrossRef]
  33. Rai, A.; Kumar, N.S.; Rao, B.R.S. Fuzzy logic based prediction of performance and emission parameters of a LPG-diesel dual fuel engine. Procedia Eng. 2012, 38, 280–292. [Google Scholar] [CrossRef]
  34. Kökkülünk, G.; Akdoğan, E.; Ayhan, V. Prediction of emissions and exhaust temperature for direct injection diesel engine with emulsified fuel using ANN. Turk. J. Electr. Eng. Comput. Sci. 2013, 21, 2141–2152. [Google Scholar] [CrossRef]
  35. Özener, O.; Yüksek, L.; Özkan, M. Artificial neural network approach to predicting engine-out emissions and performance parameters of a turbo charged diesel engine. Therm. Sci. 2013, 17, 153–166. [Google Scholar] [CrossRef]
  36. Isin, O.; Uzunsoy, E. Predicting the exhaust emissions of a spark ignition engine using adaptive neuro-fuzzy inference system. Arab. J. Sci. Eng. 2013, 38, 3485–3493. [Google Scholar] [CrossRef]
  37. Singh, N.K.; Singh, Y.; Sharma, A.; Kumar, S. Diesel engine performance and emission analysis running on jojoba biodiesel using intelligent hybrid prediction techniques. Fuel 2020, 279, 118571. [Google Scholar] [CrossRef]
Figure 1. Engine geometry model and grid structure.
Agriculture 12 01332 g001
Figure 2. Comparison of numerical and experimental pressure and heat release in the cylinder.
Agriculture 12 01332 g002
Figure 3. Structural diagram of combustion chamber.
Agriculture 12 01332 g003
Figure 4. ANN structure diagram.
Agriculture 12 01332 g004
Figure 5. ANN results diagrams.
Agriculture 12 01332 g005
Figure 6. Schematic diagram of the general particle swarm algorithm.
Agriculture 12 01332 g006
Figure 7. Comparison charts showing combustion chamber parameter optimization iterations.
Agriculture 12 01332 g007
Figure 8. Comparison of combustion chamber emission generation.
Agriculture 12 01332 g008
Table 1. Main technical parameters of diesel engine.
ParametersValue
Cylinder bore × stroke105 mm × 125 mm
Total capacity4.33 L
Rated power73.5 KW
Rated speed2200 rpm
Maximum torque400 N·m
Maximum torque speed1400–1600 rpm
Compression ratio17.5
Combustion geometryω-type
Table 2. Calculation model initial conditions.
ConditionAreaTemperature/KPressure/MPa
Initial conditionsAir intake tract3091.83
Exhaust tract8001.21
Combustion chamber5331.56
Boundary conditionsAir inlet3091.83
Exhaust port8001.20
Combustion chamber wall surface433
Cylinder head bottom surface525
Piston top surface553
Table 3. Comparison of combustion chamber parameters before and after optimization.
Combustion ParametersOriginal ValueANN + PSO Optimization Value
Indentation rate0.9240.82
Tab depth7.98.1
Combustion chamber depth17.818.56
Table 4. Comparison of combustion chamber emissions before and after optimization.
Emission/g·(kW·h)−1NOxSoot
Non-road National III Emission Limits4.000.20
Non-road National IV Emission Limits2.000.025
Original Engine Emission Value3.450.20
Optimized Engine Emission Value2.240.14
Table 5. Comparison of fitting accuracy of different models.
Model NameEmissionR2MRE
ANNNOx0.93710.13%
Soot0.9558.18%
SVMNOx0.90215.67%
Soot0.91120.45%
k-NNNOx0.91516.21%
Soot0.90225.21%
Table 6. Comparison of prediction capability of different techniques and the developed PSO-ANN.
ReferenceNOxSoot
Roy et al. [30] ANFIS0.08054N/A
Roy et al. [30] ANN0.1224N/A
Norhayati et al. [31]N/AN/A
Sakthivel et al. [32]9.96363.1611
Rai et al. [33]N/A0.3057
Kokkulunk et al. [34]7.51022.1451
Ozener et al. [35]0.0852N/A
Isin et al. [36]N/AN/A
Nishant et al. [37] ANFIS0.7708N/A
Nishant et al. [37] GA-ANFIS0.6354N/A
Nishant et al. [37] PSO-ANFIS0.4893N/A
Publisher’s Note: MDPI stays neutral with regard to jurisdictional claims in published maps and institutional affiliations.

