
Drought Damage Assessment for Crop Insurance Based on Vegetation Index by Unmanned Aerial Vehicle (UAV) Multispectral Images of Paddy Fields in Indonesia
 , ,
, ,  ,
, 
Abstract
:1. Introduction
2. Materials and Methods
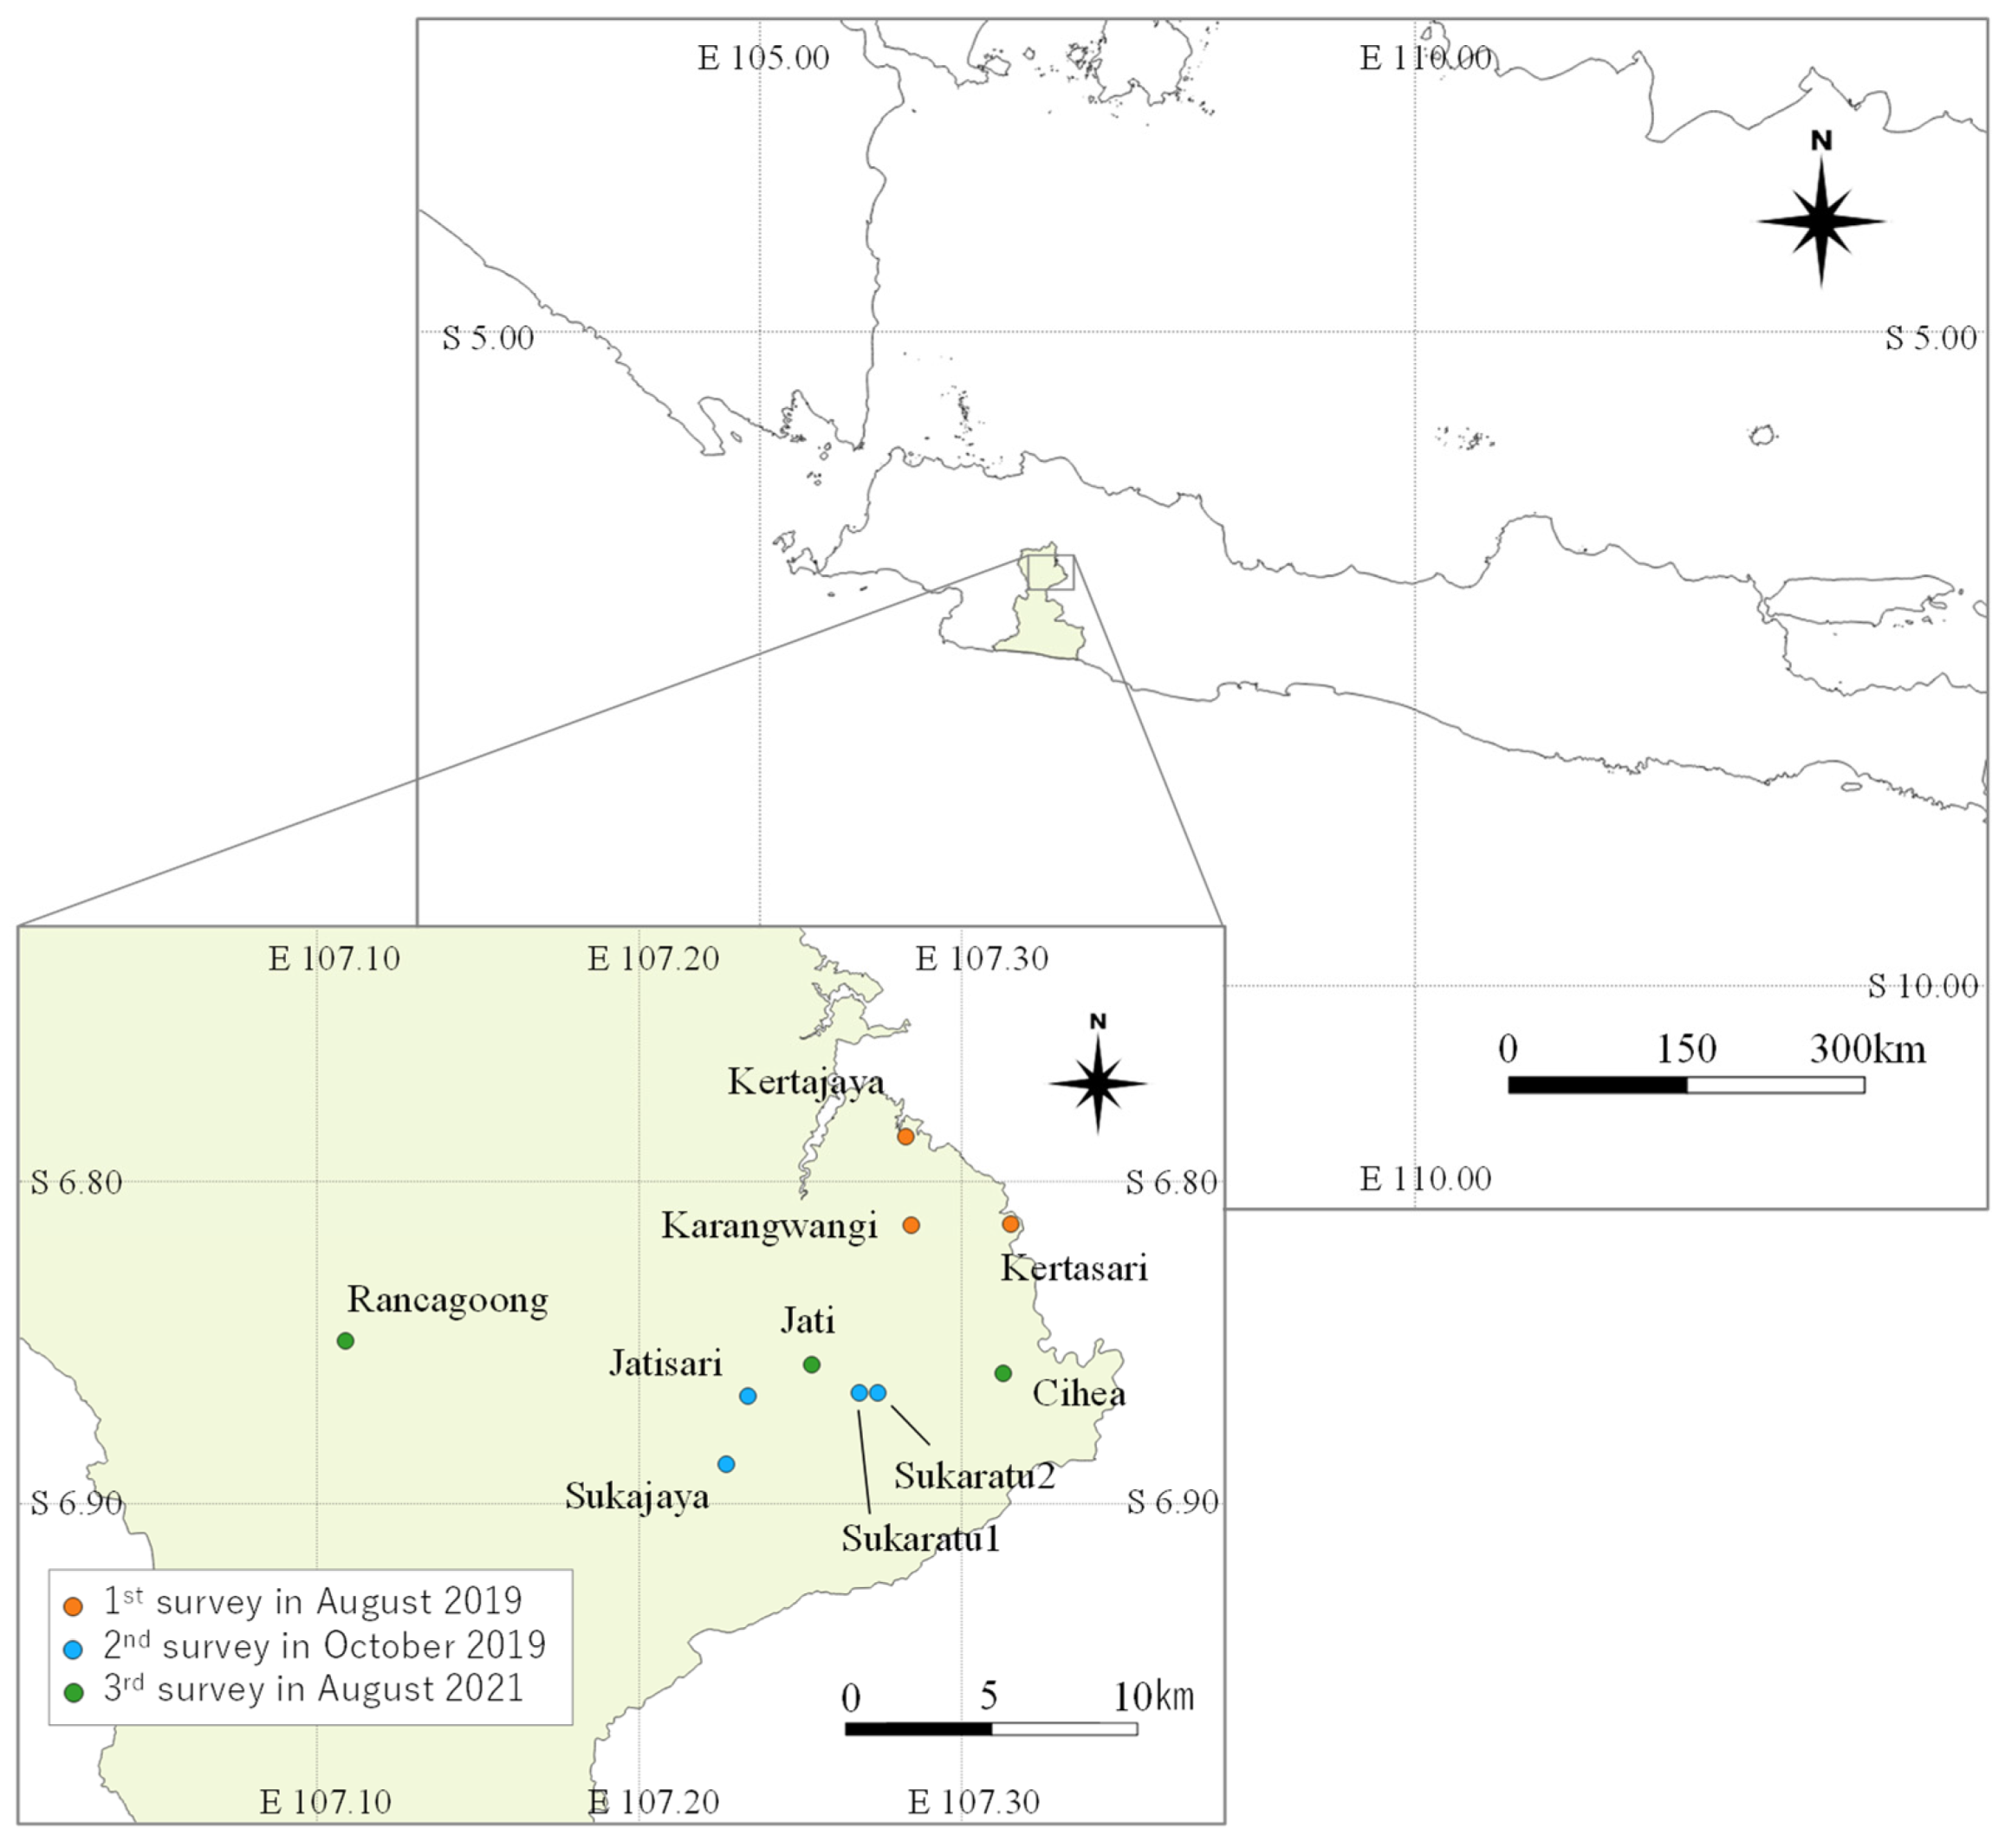
2.1. Study Site
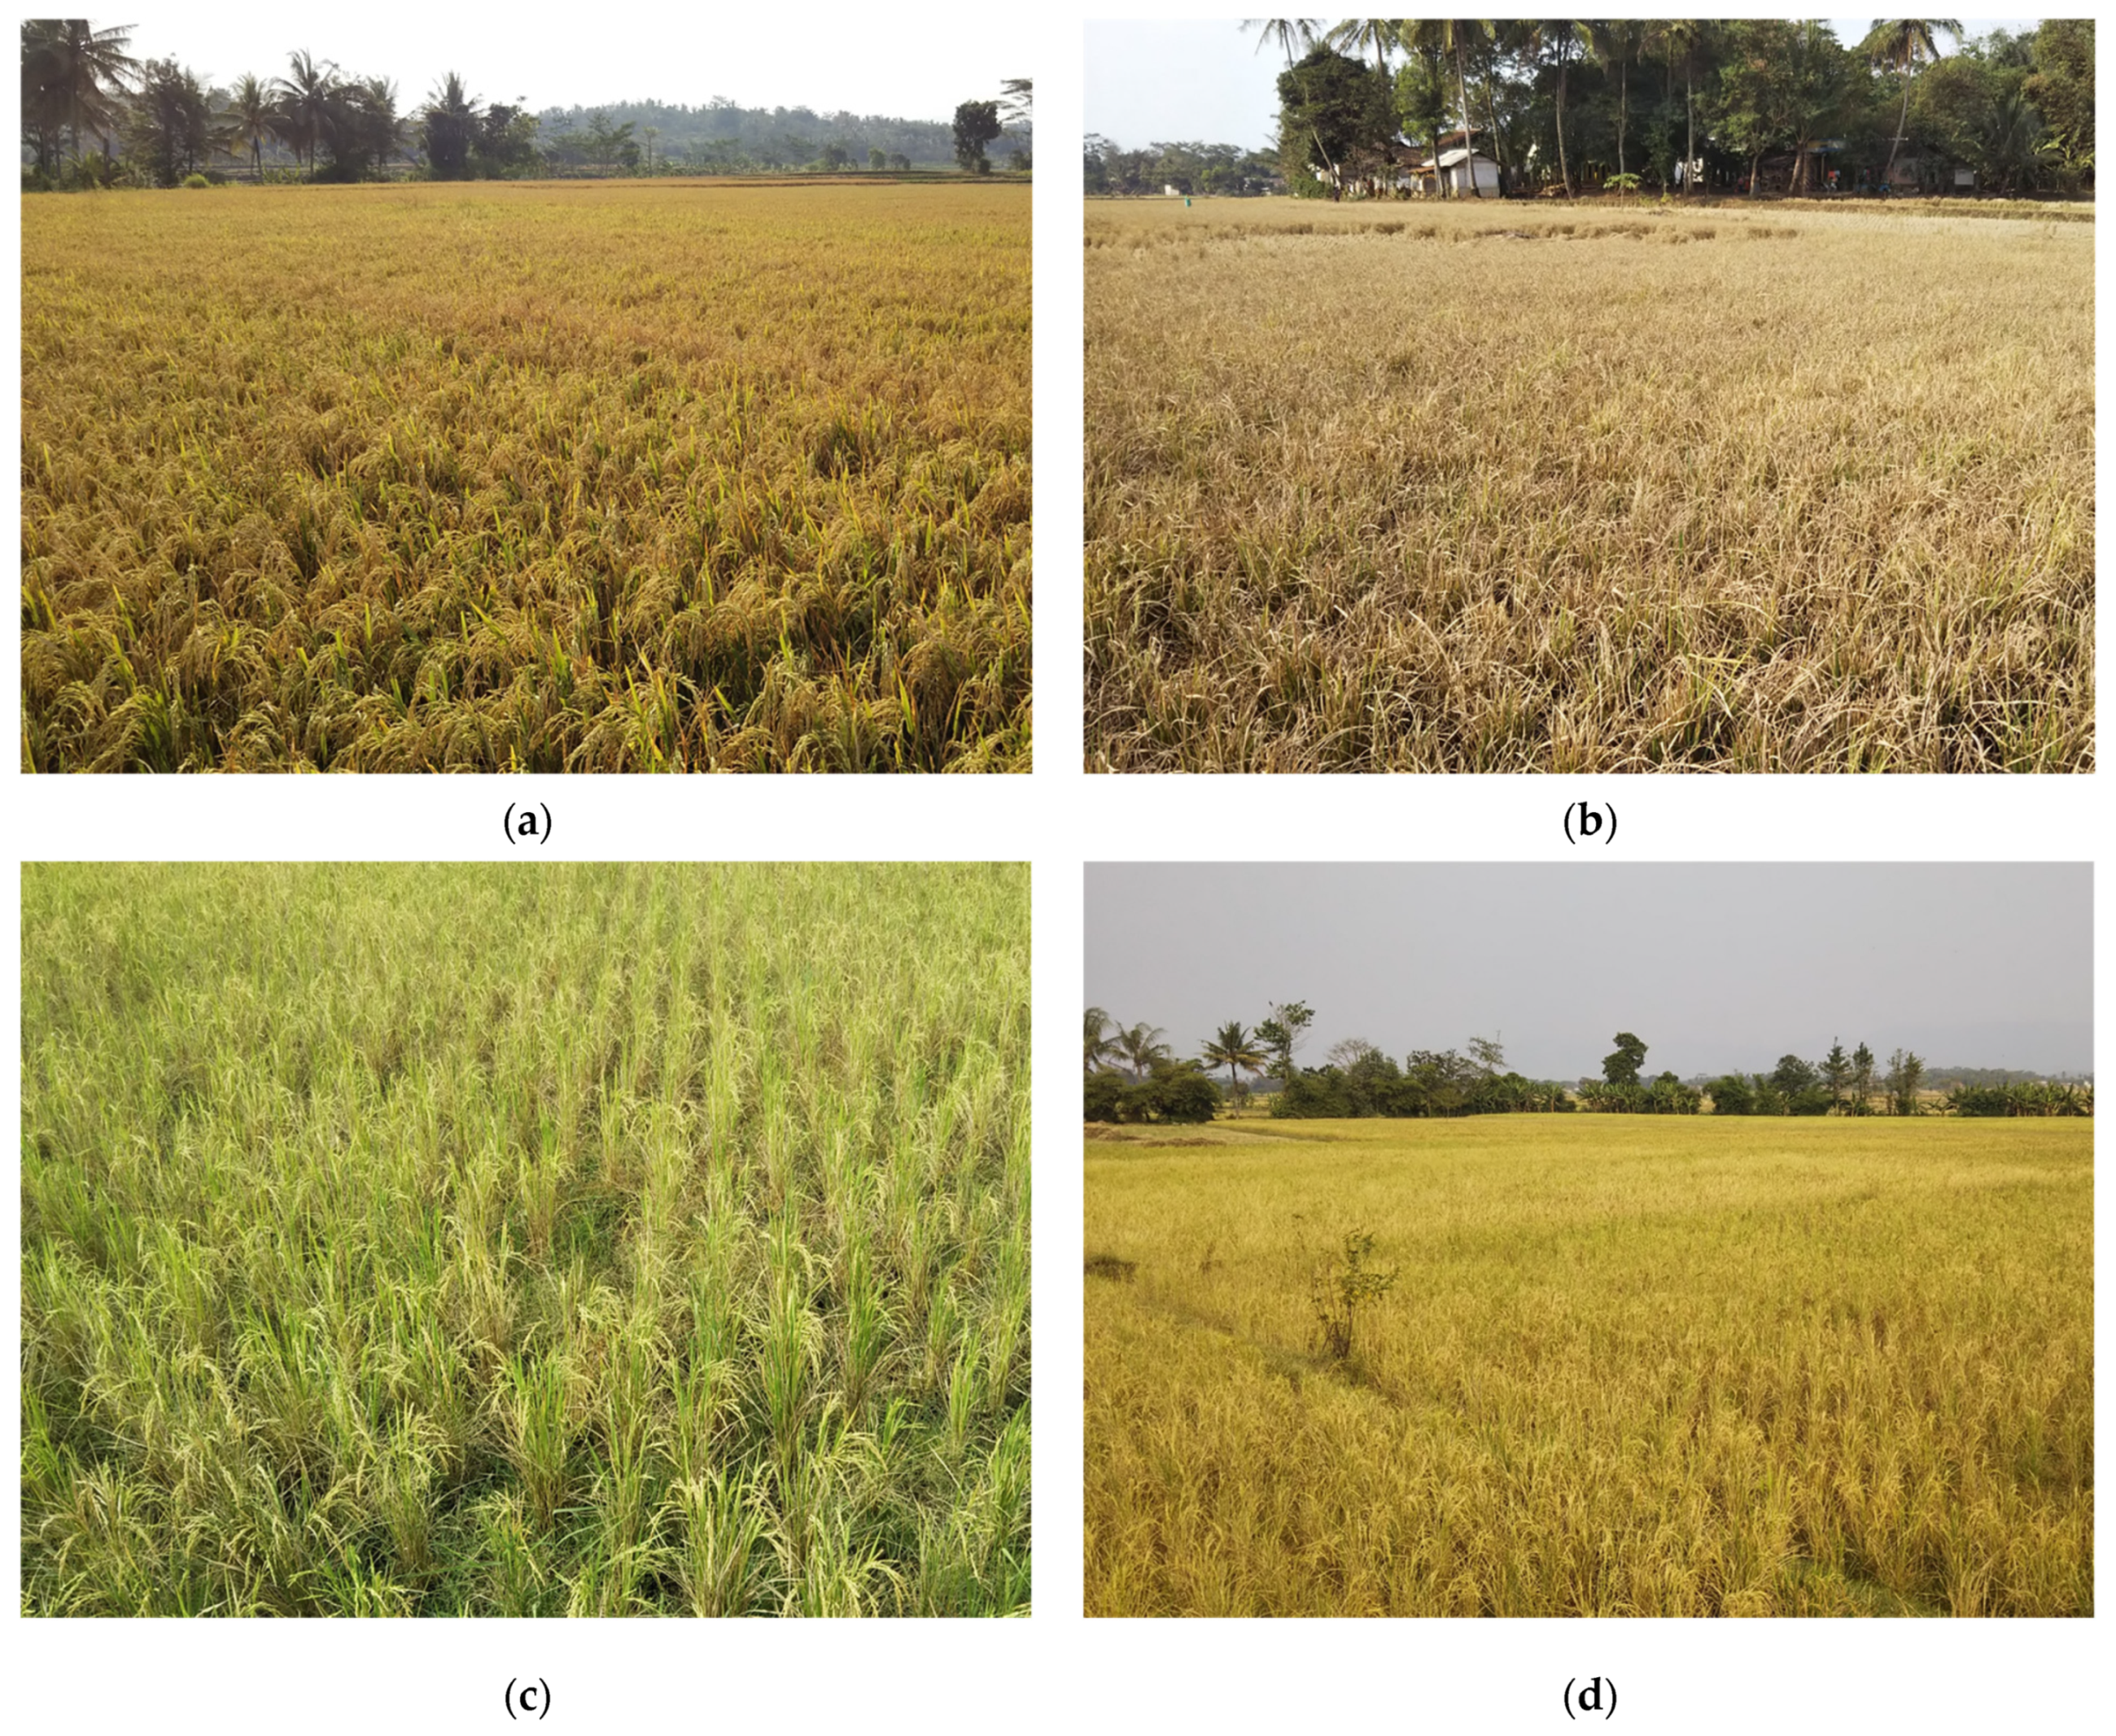
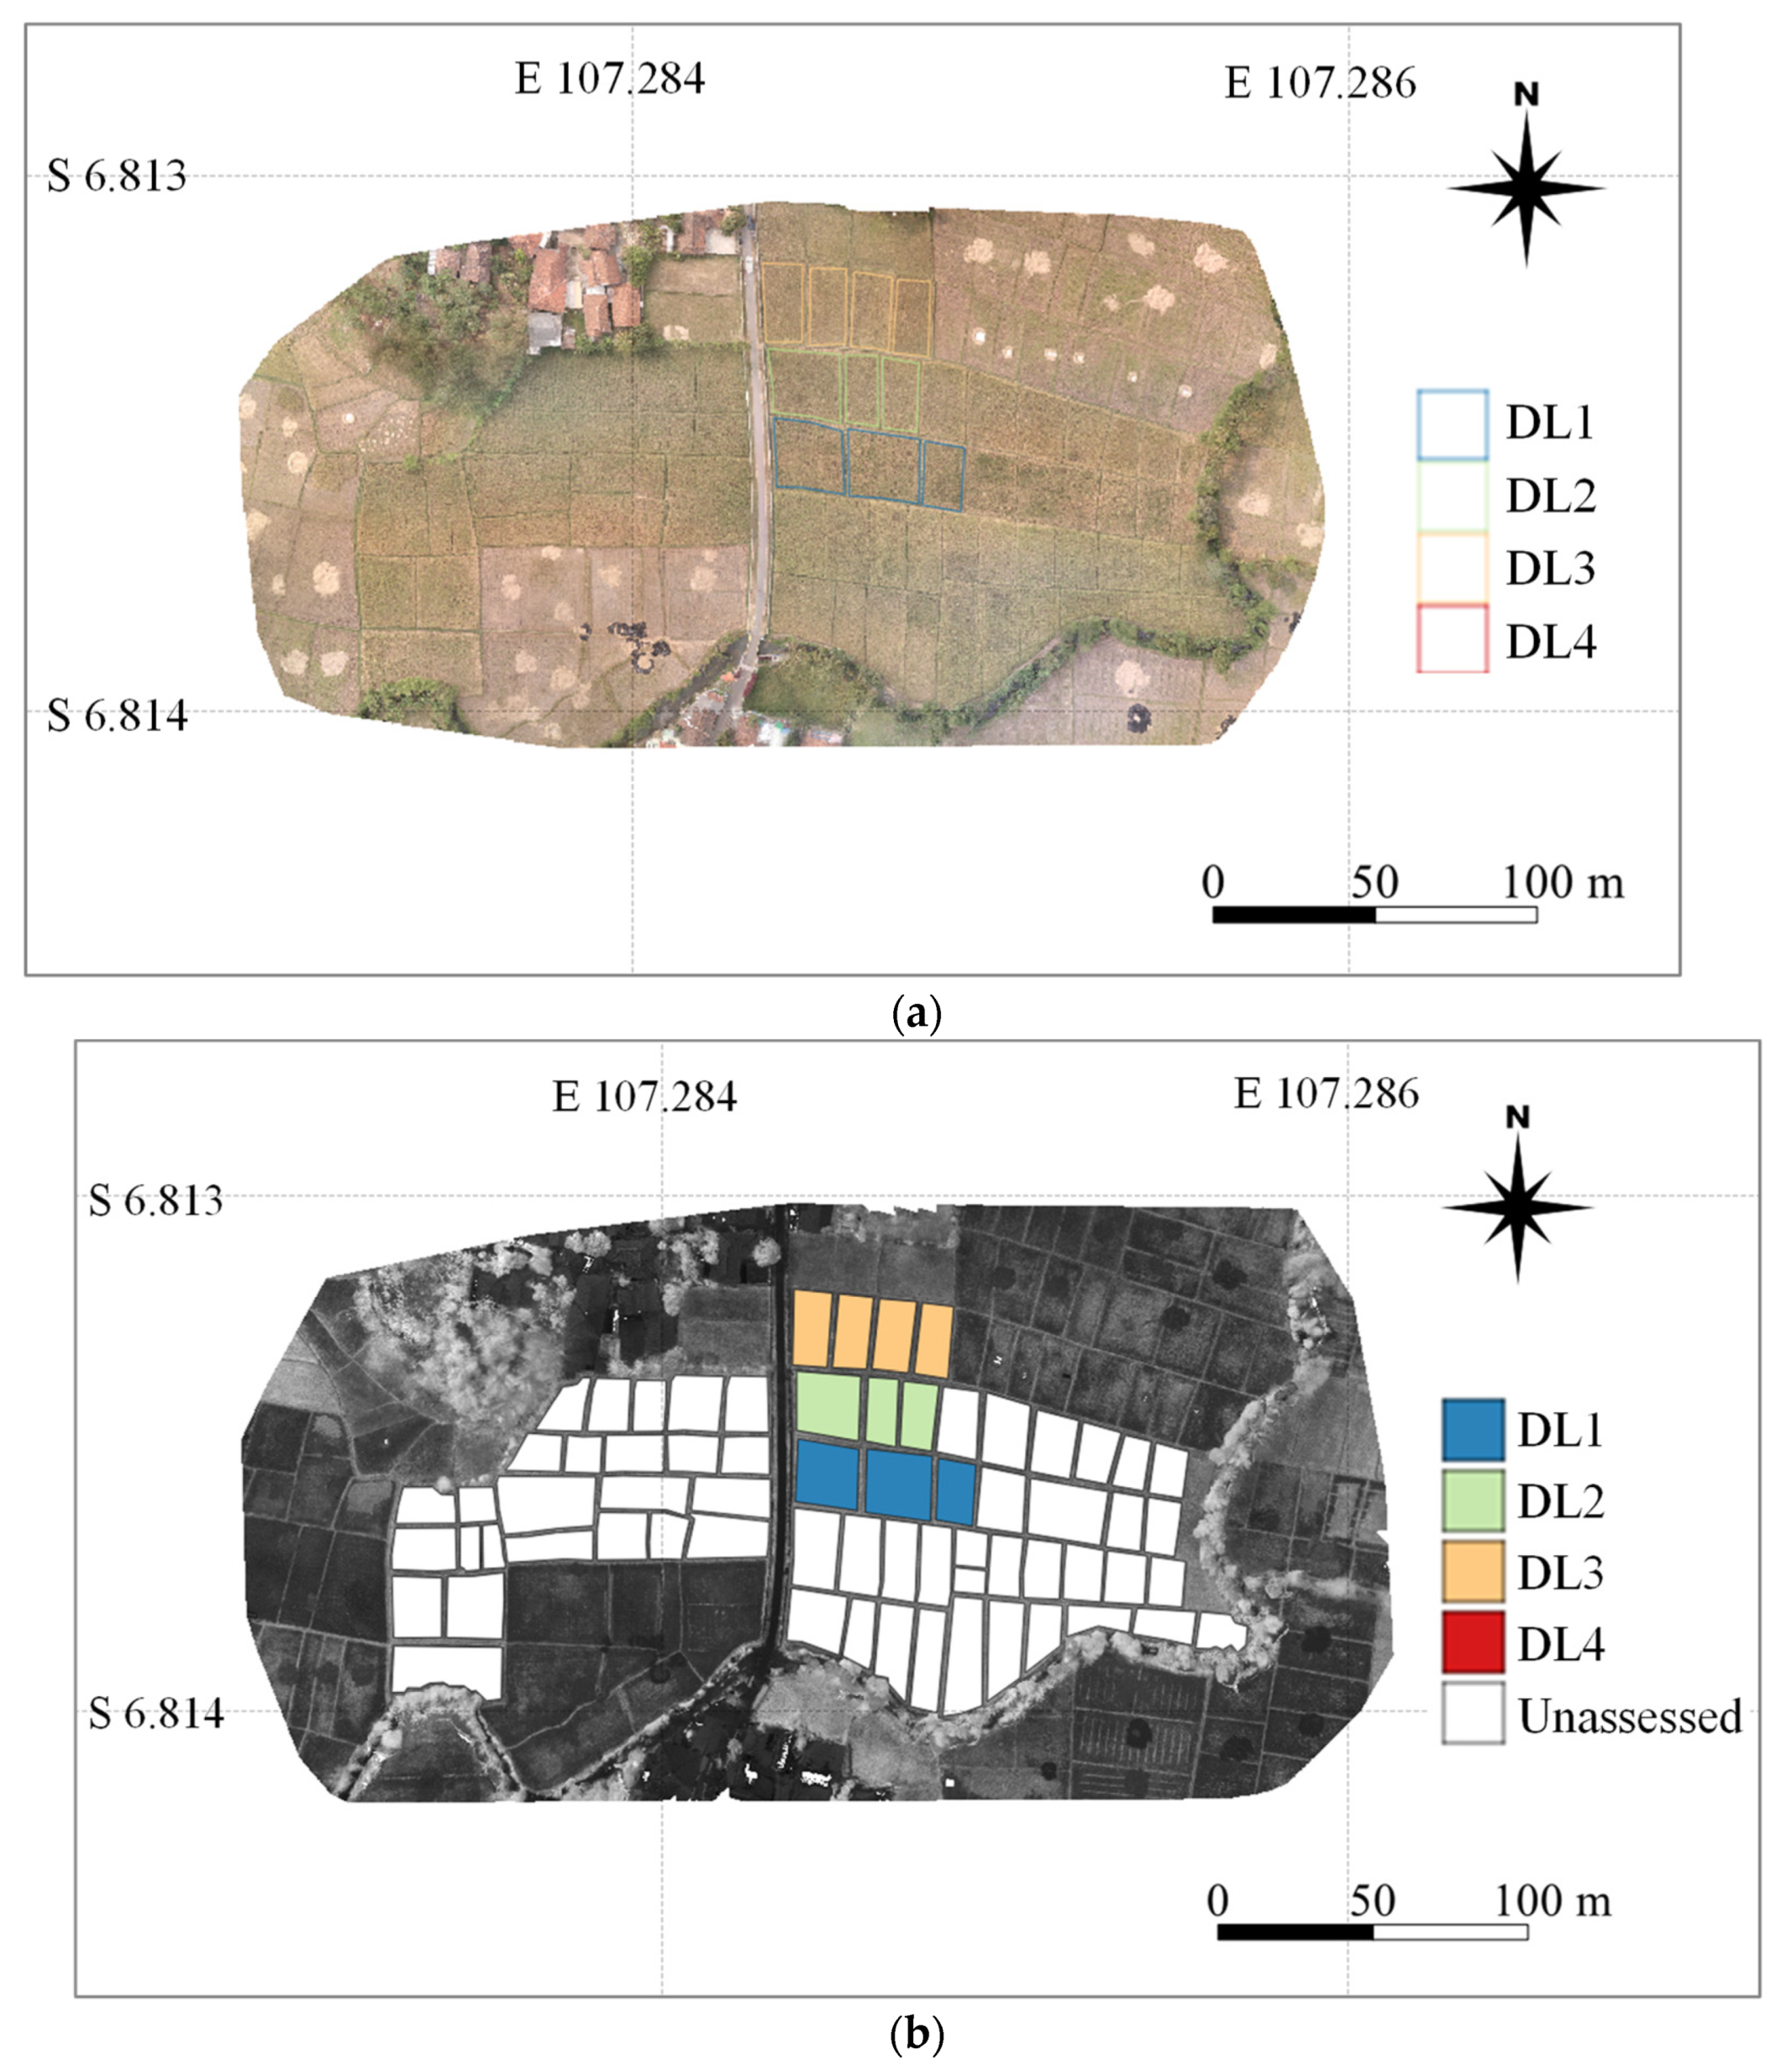
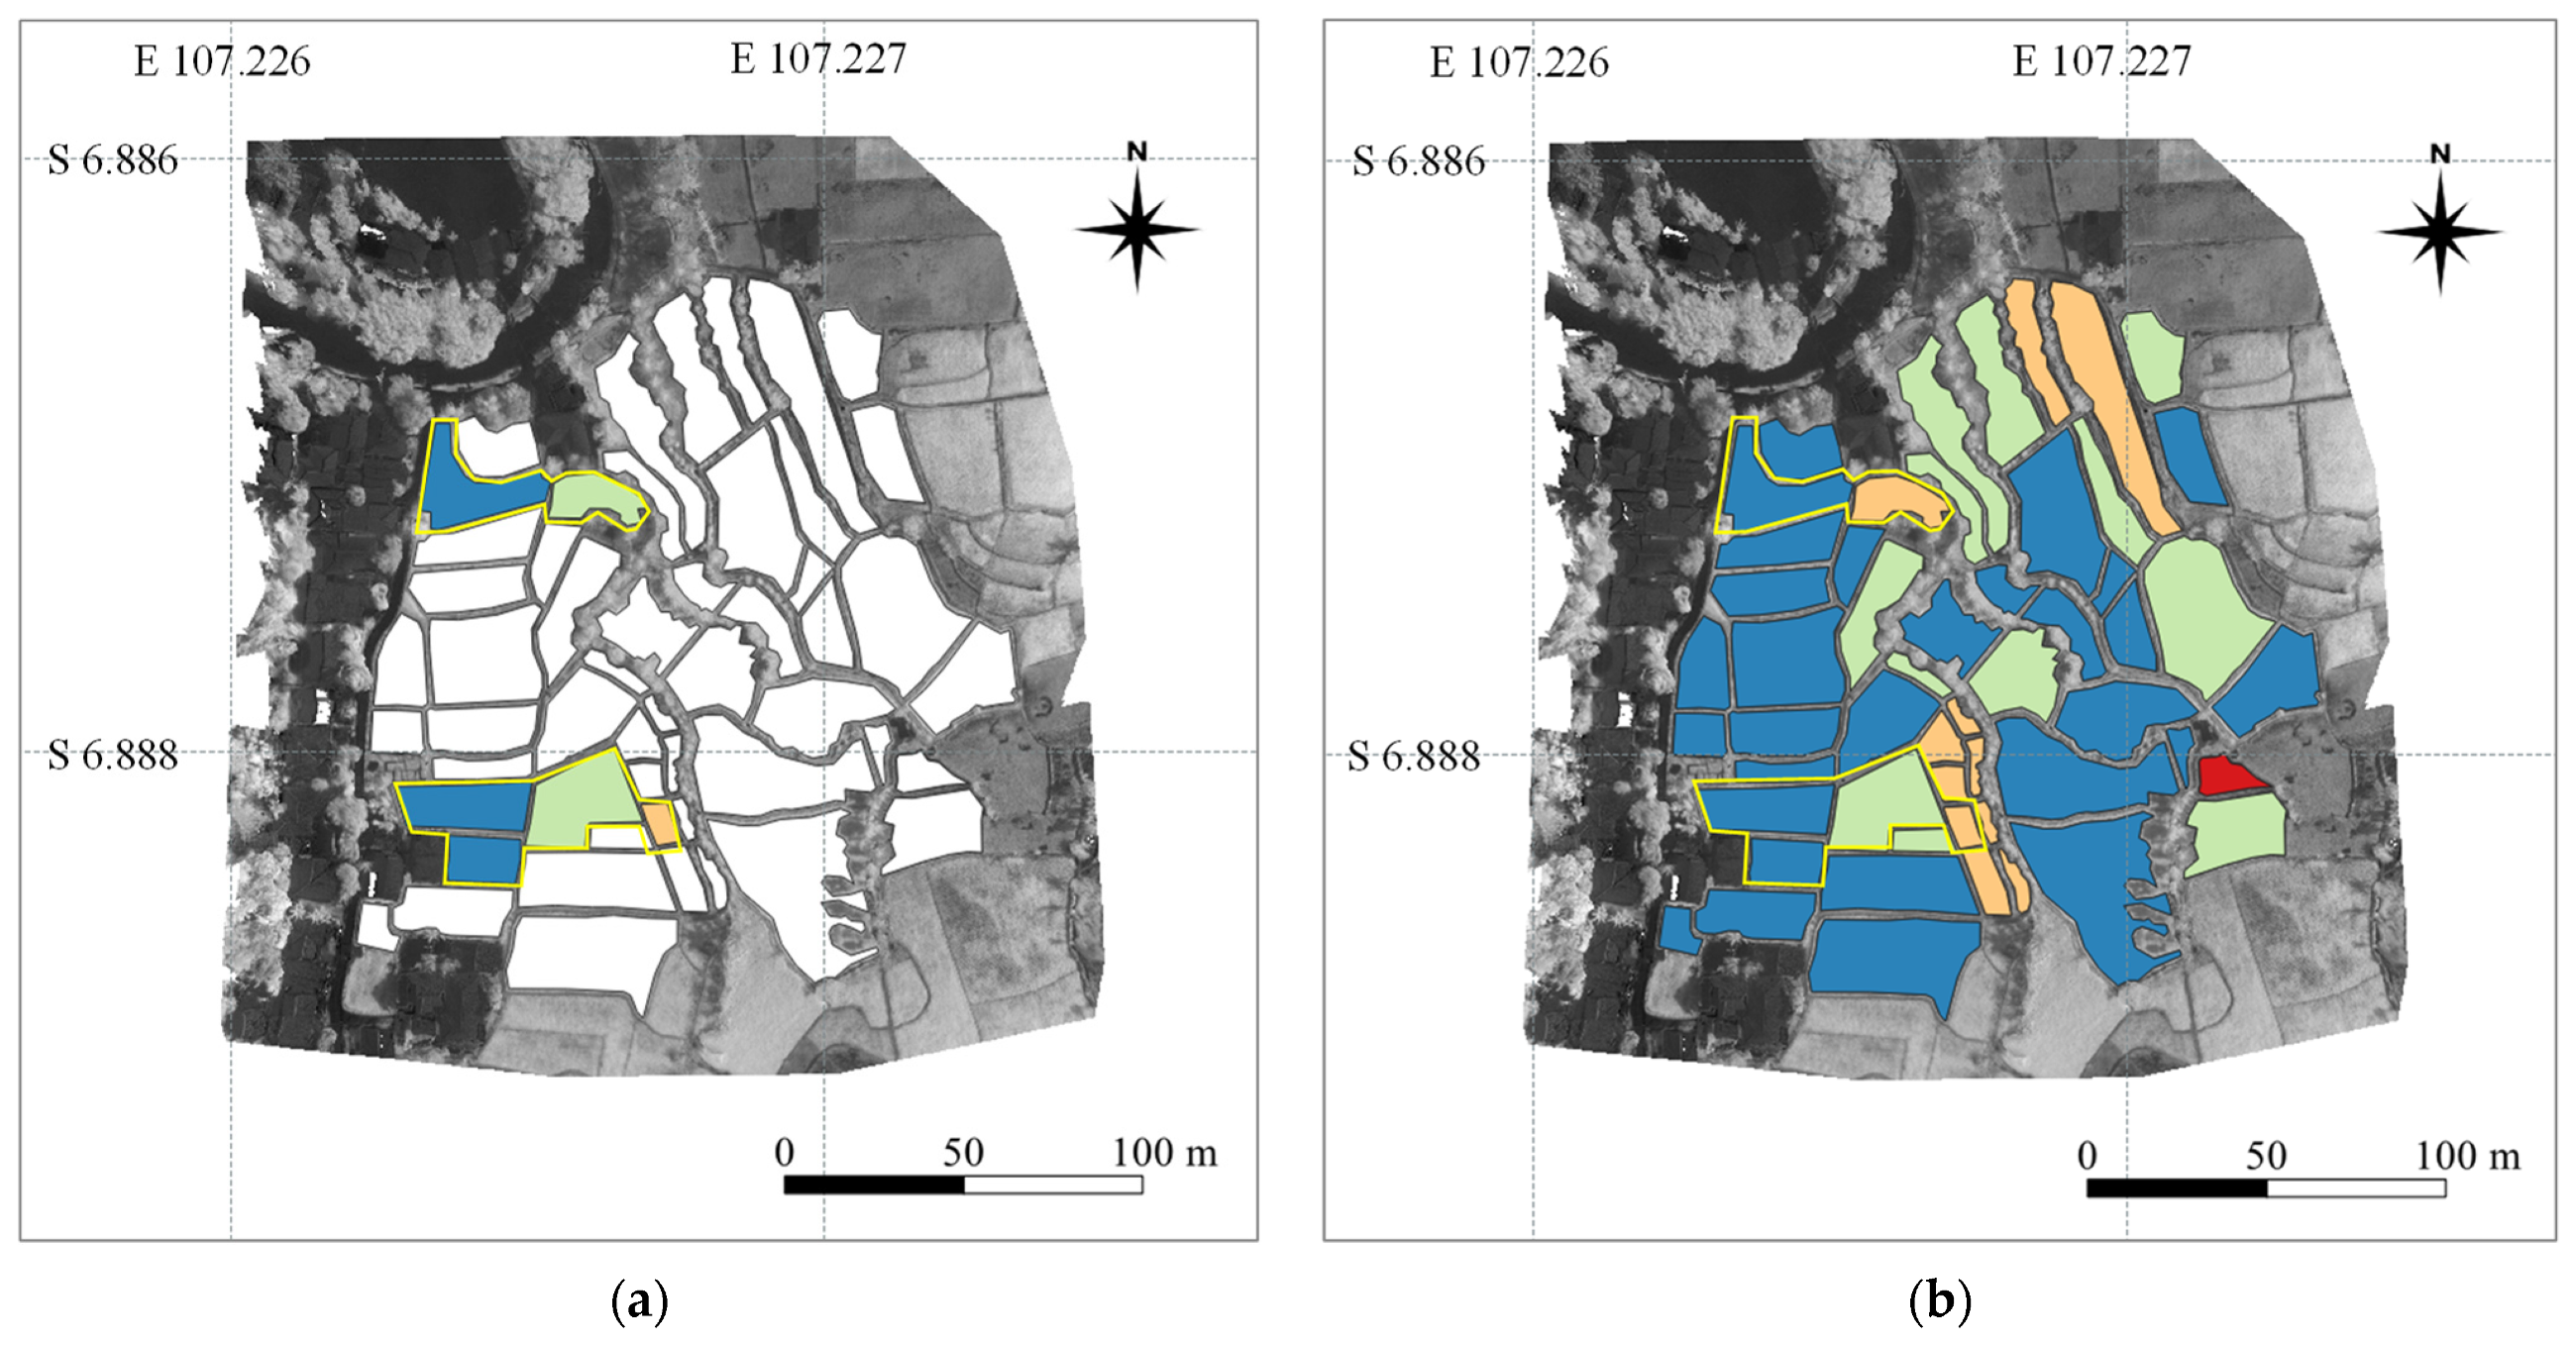
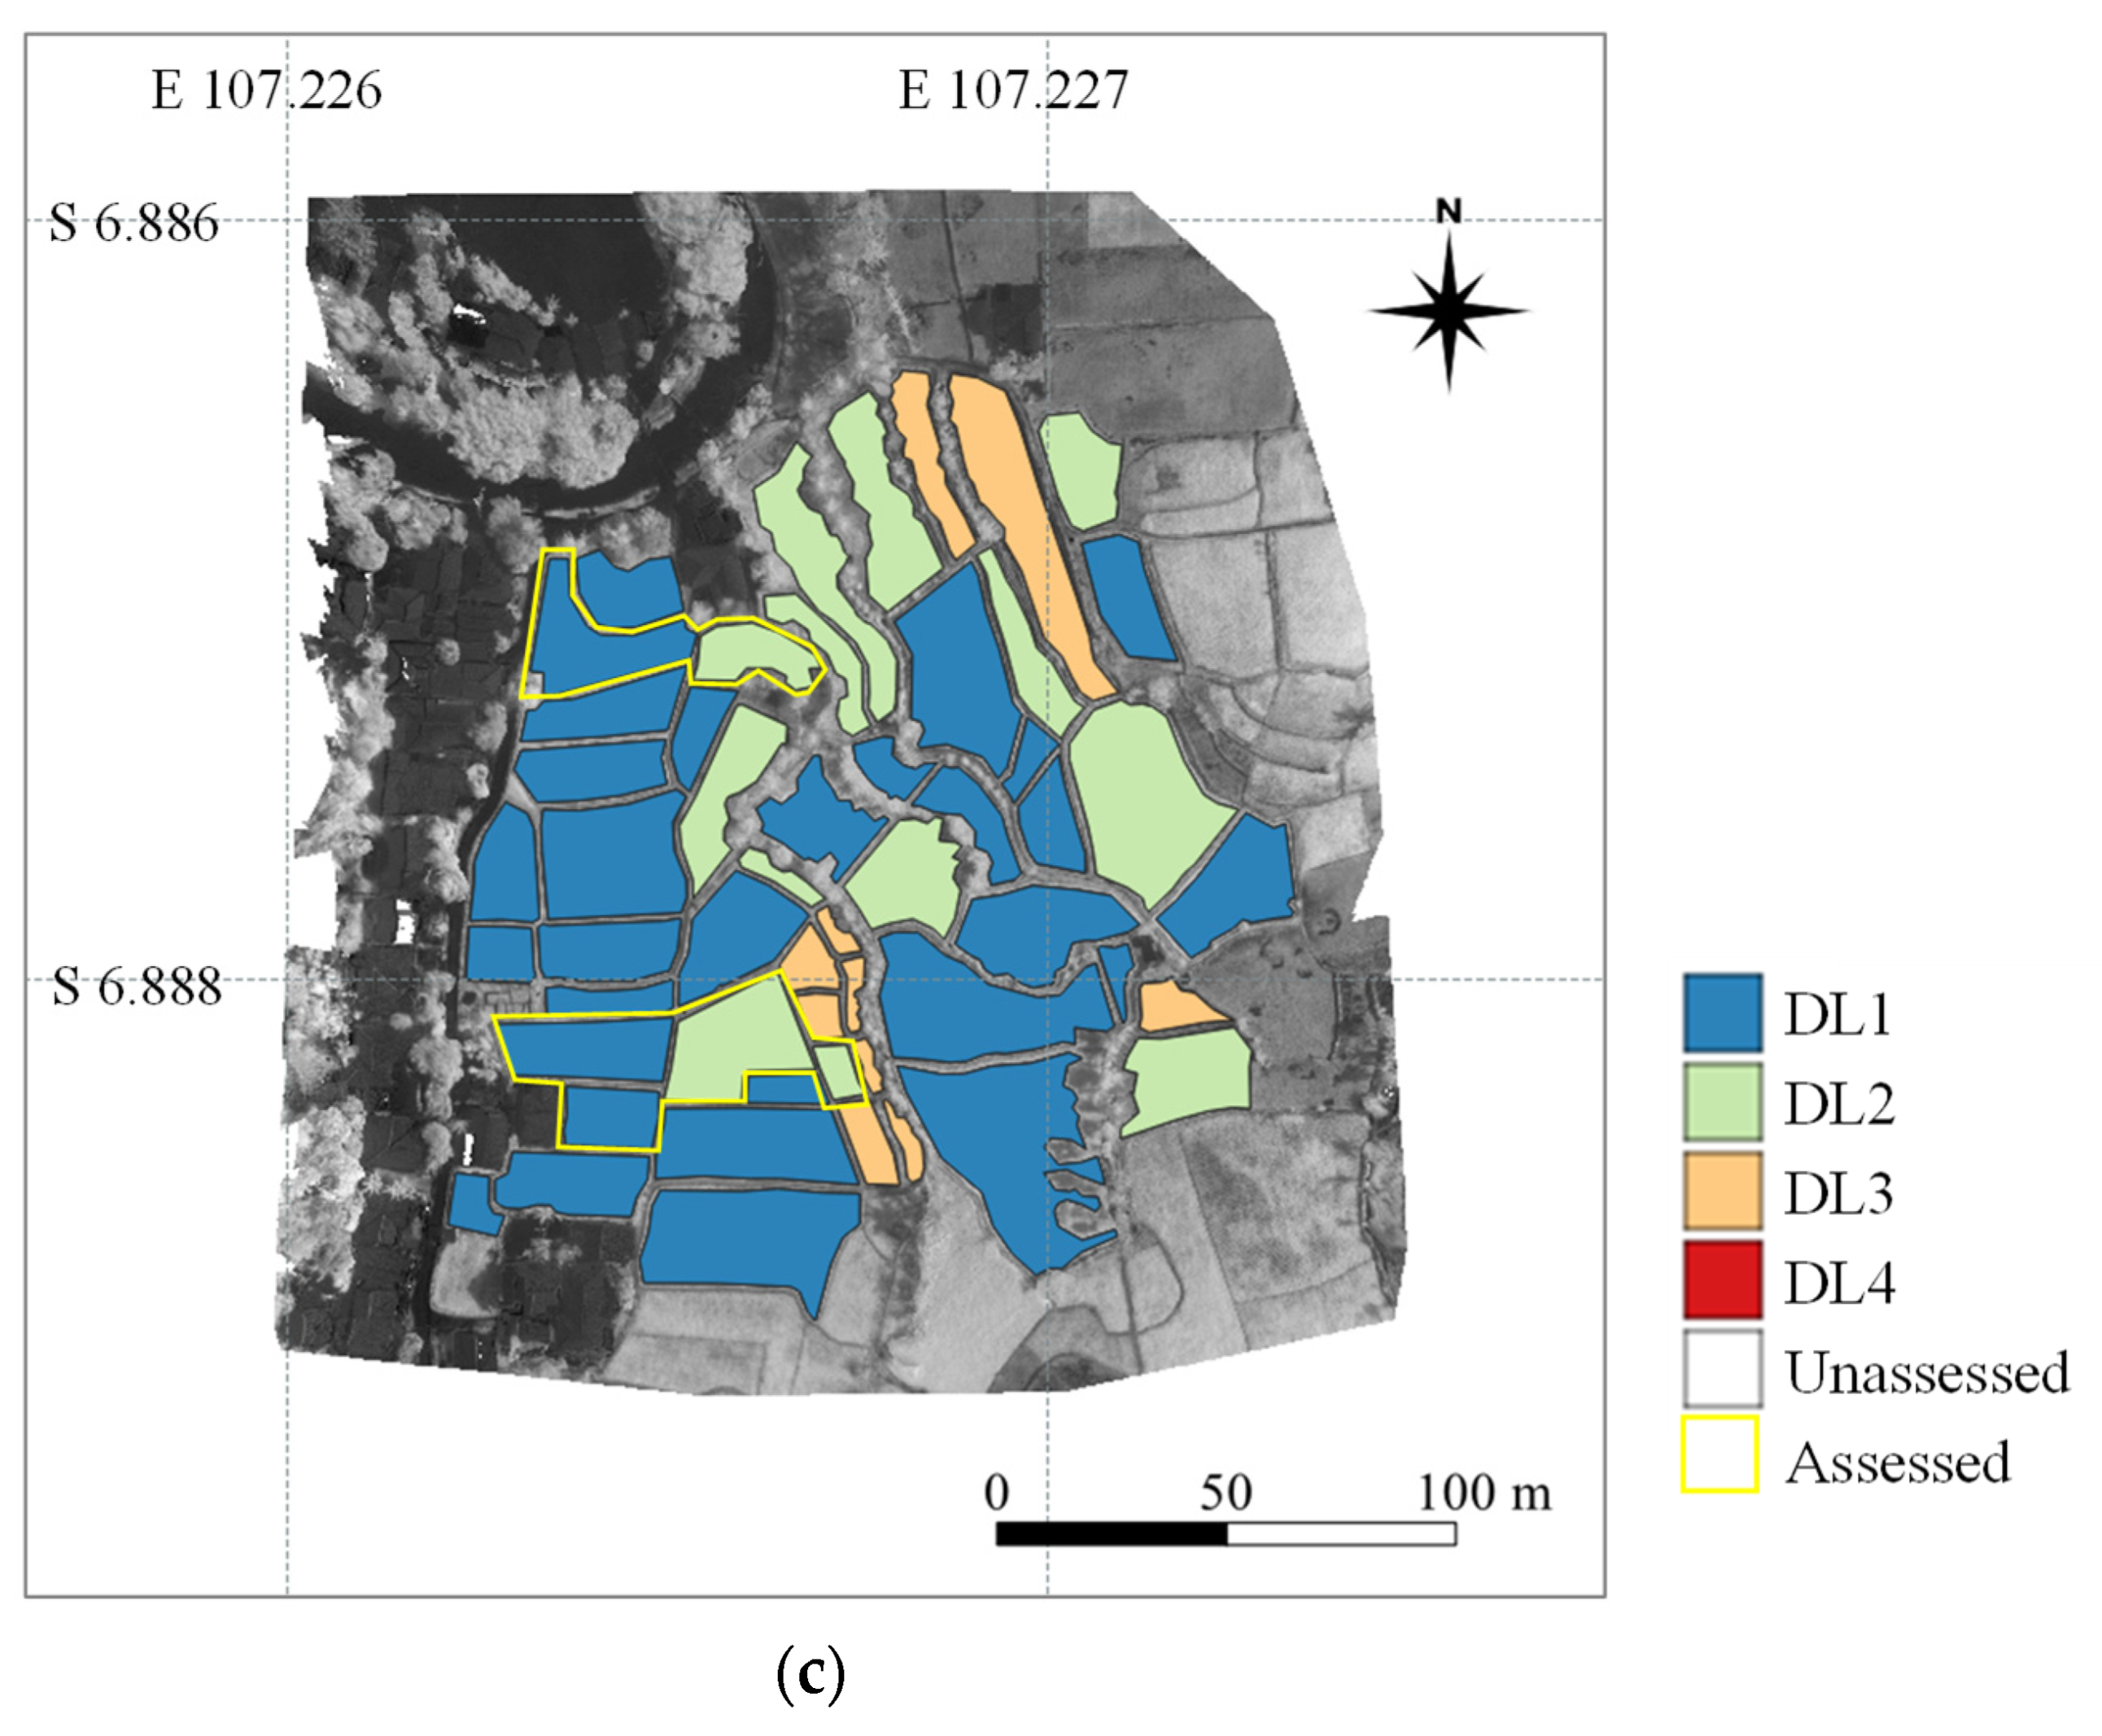
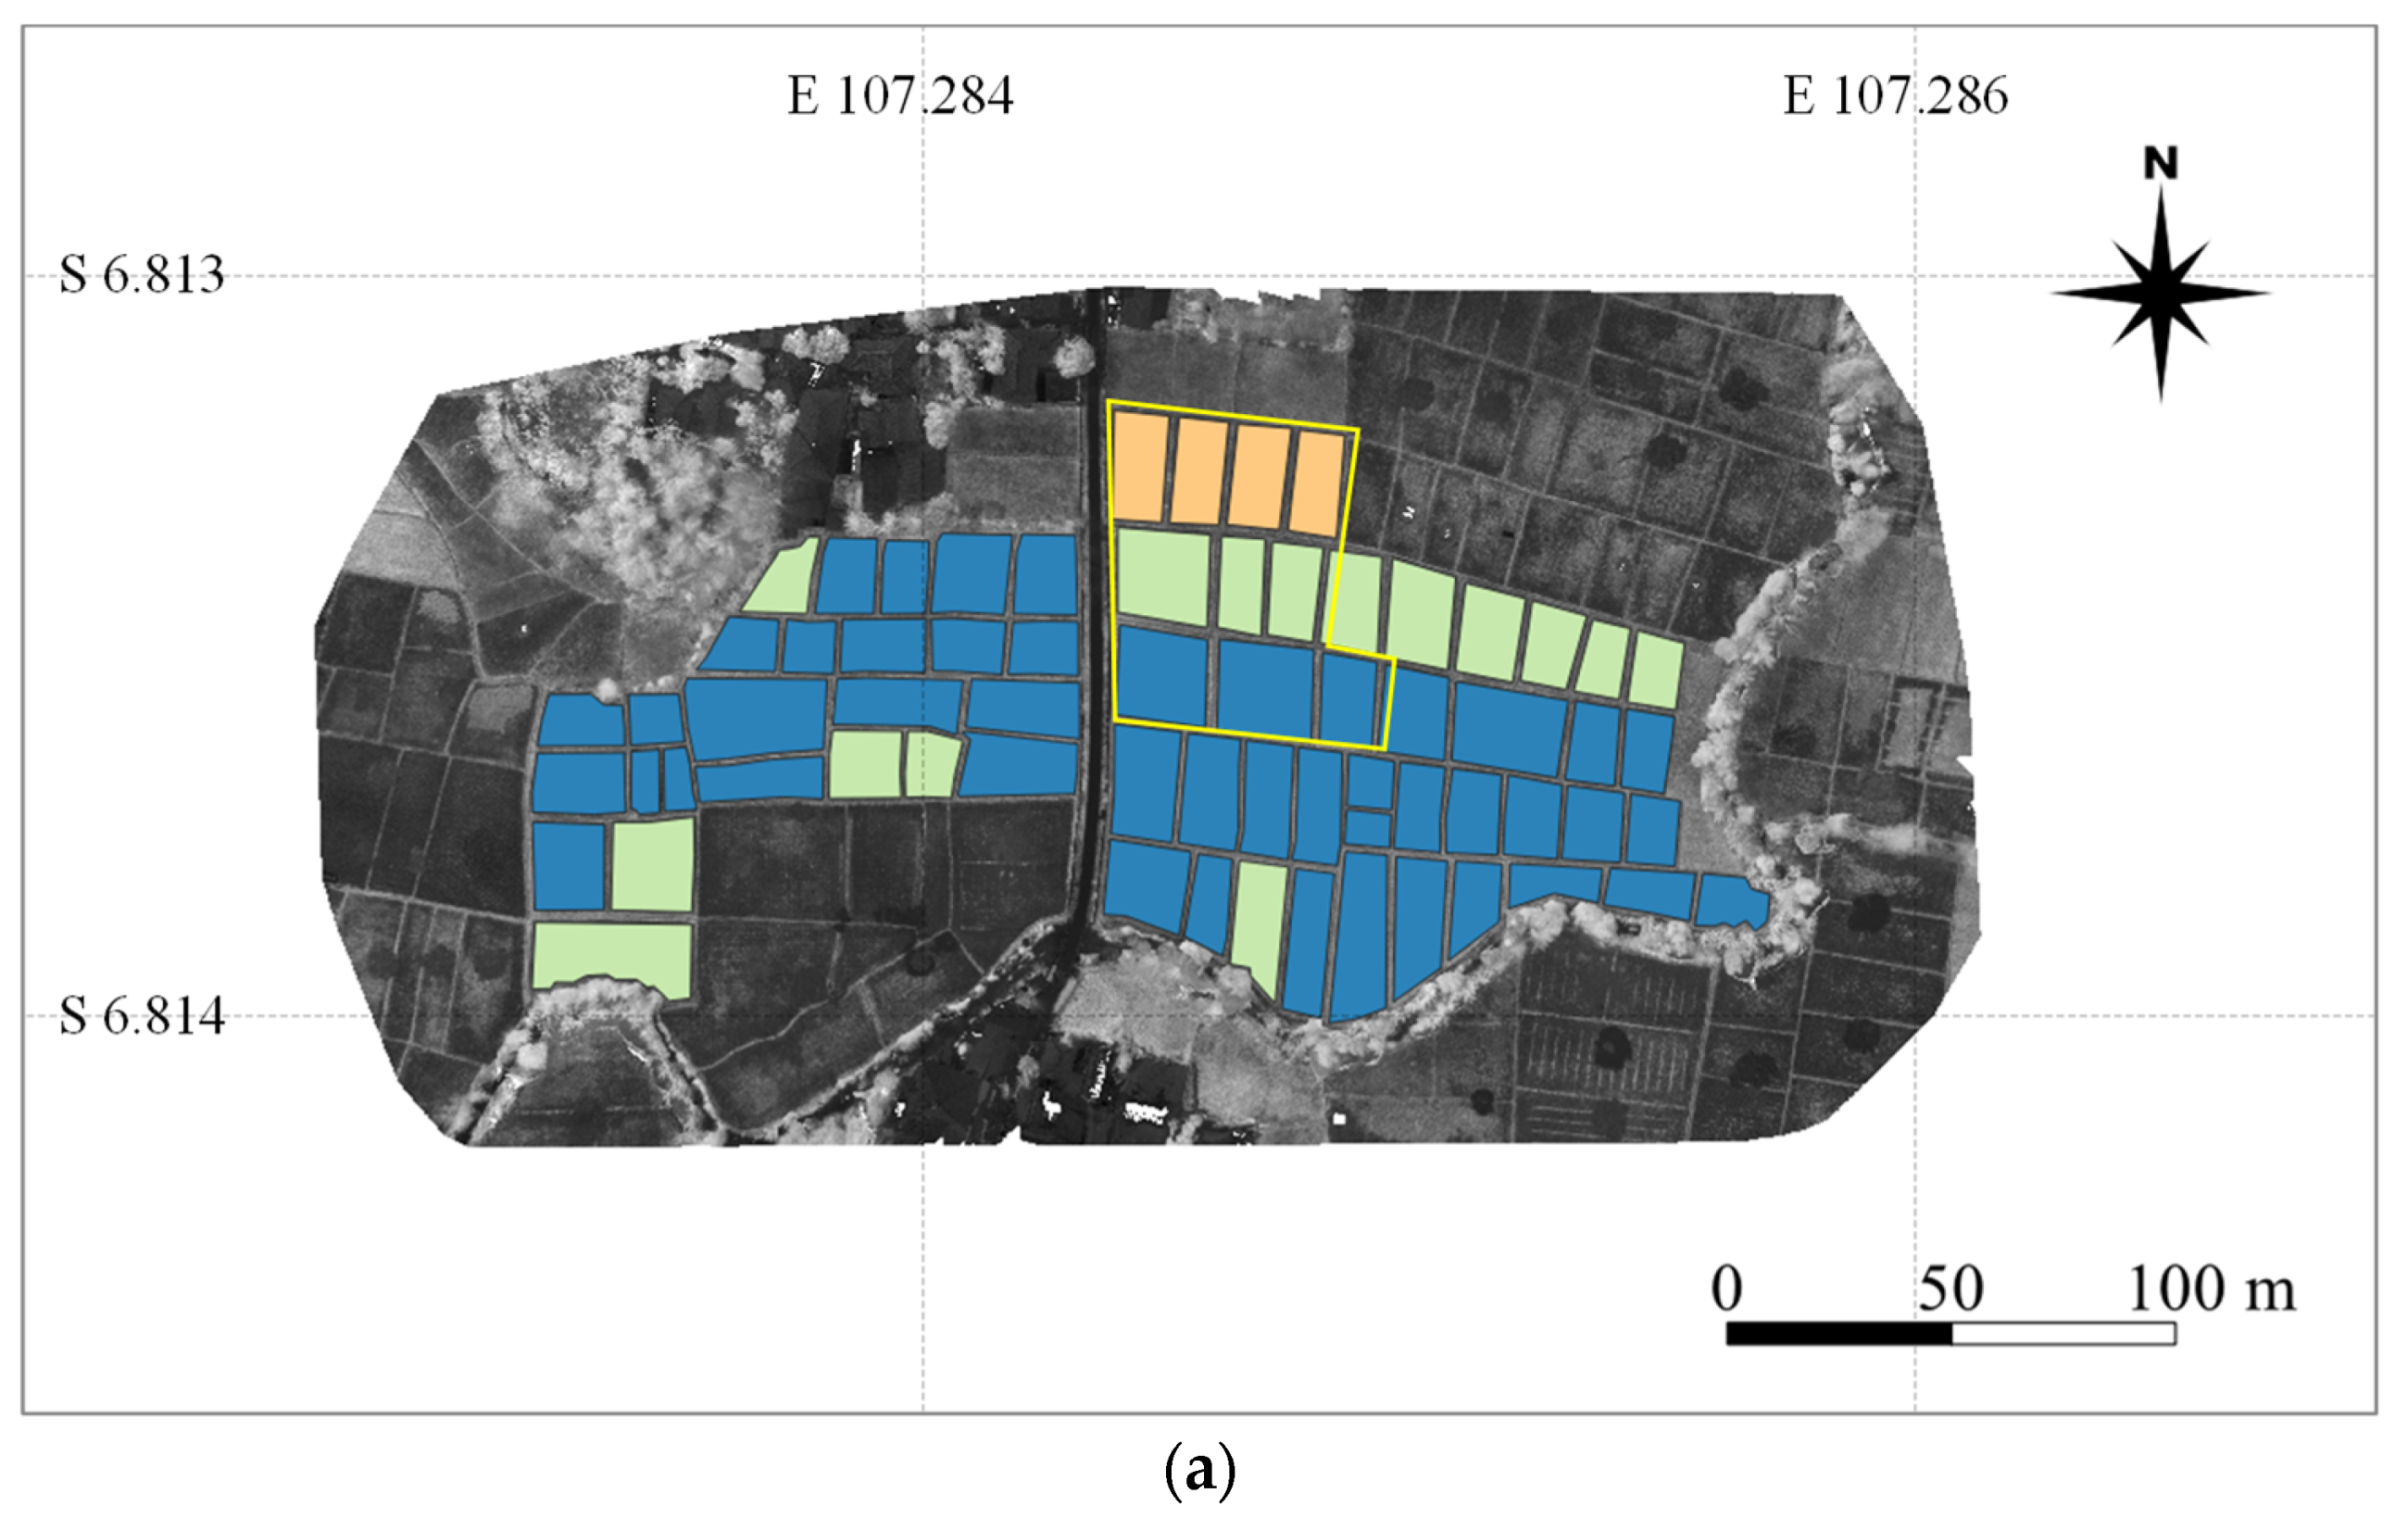
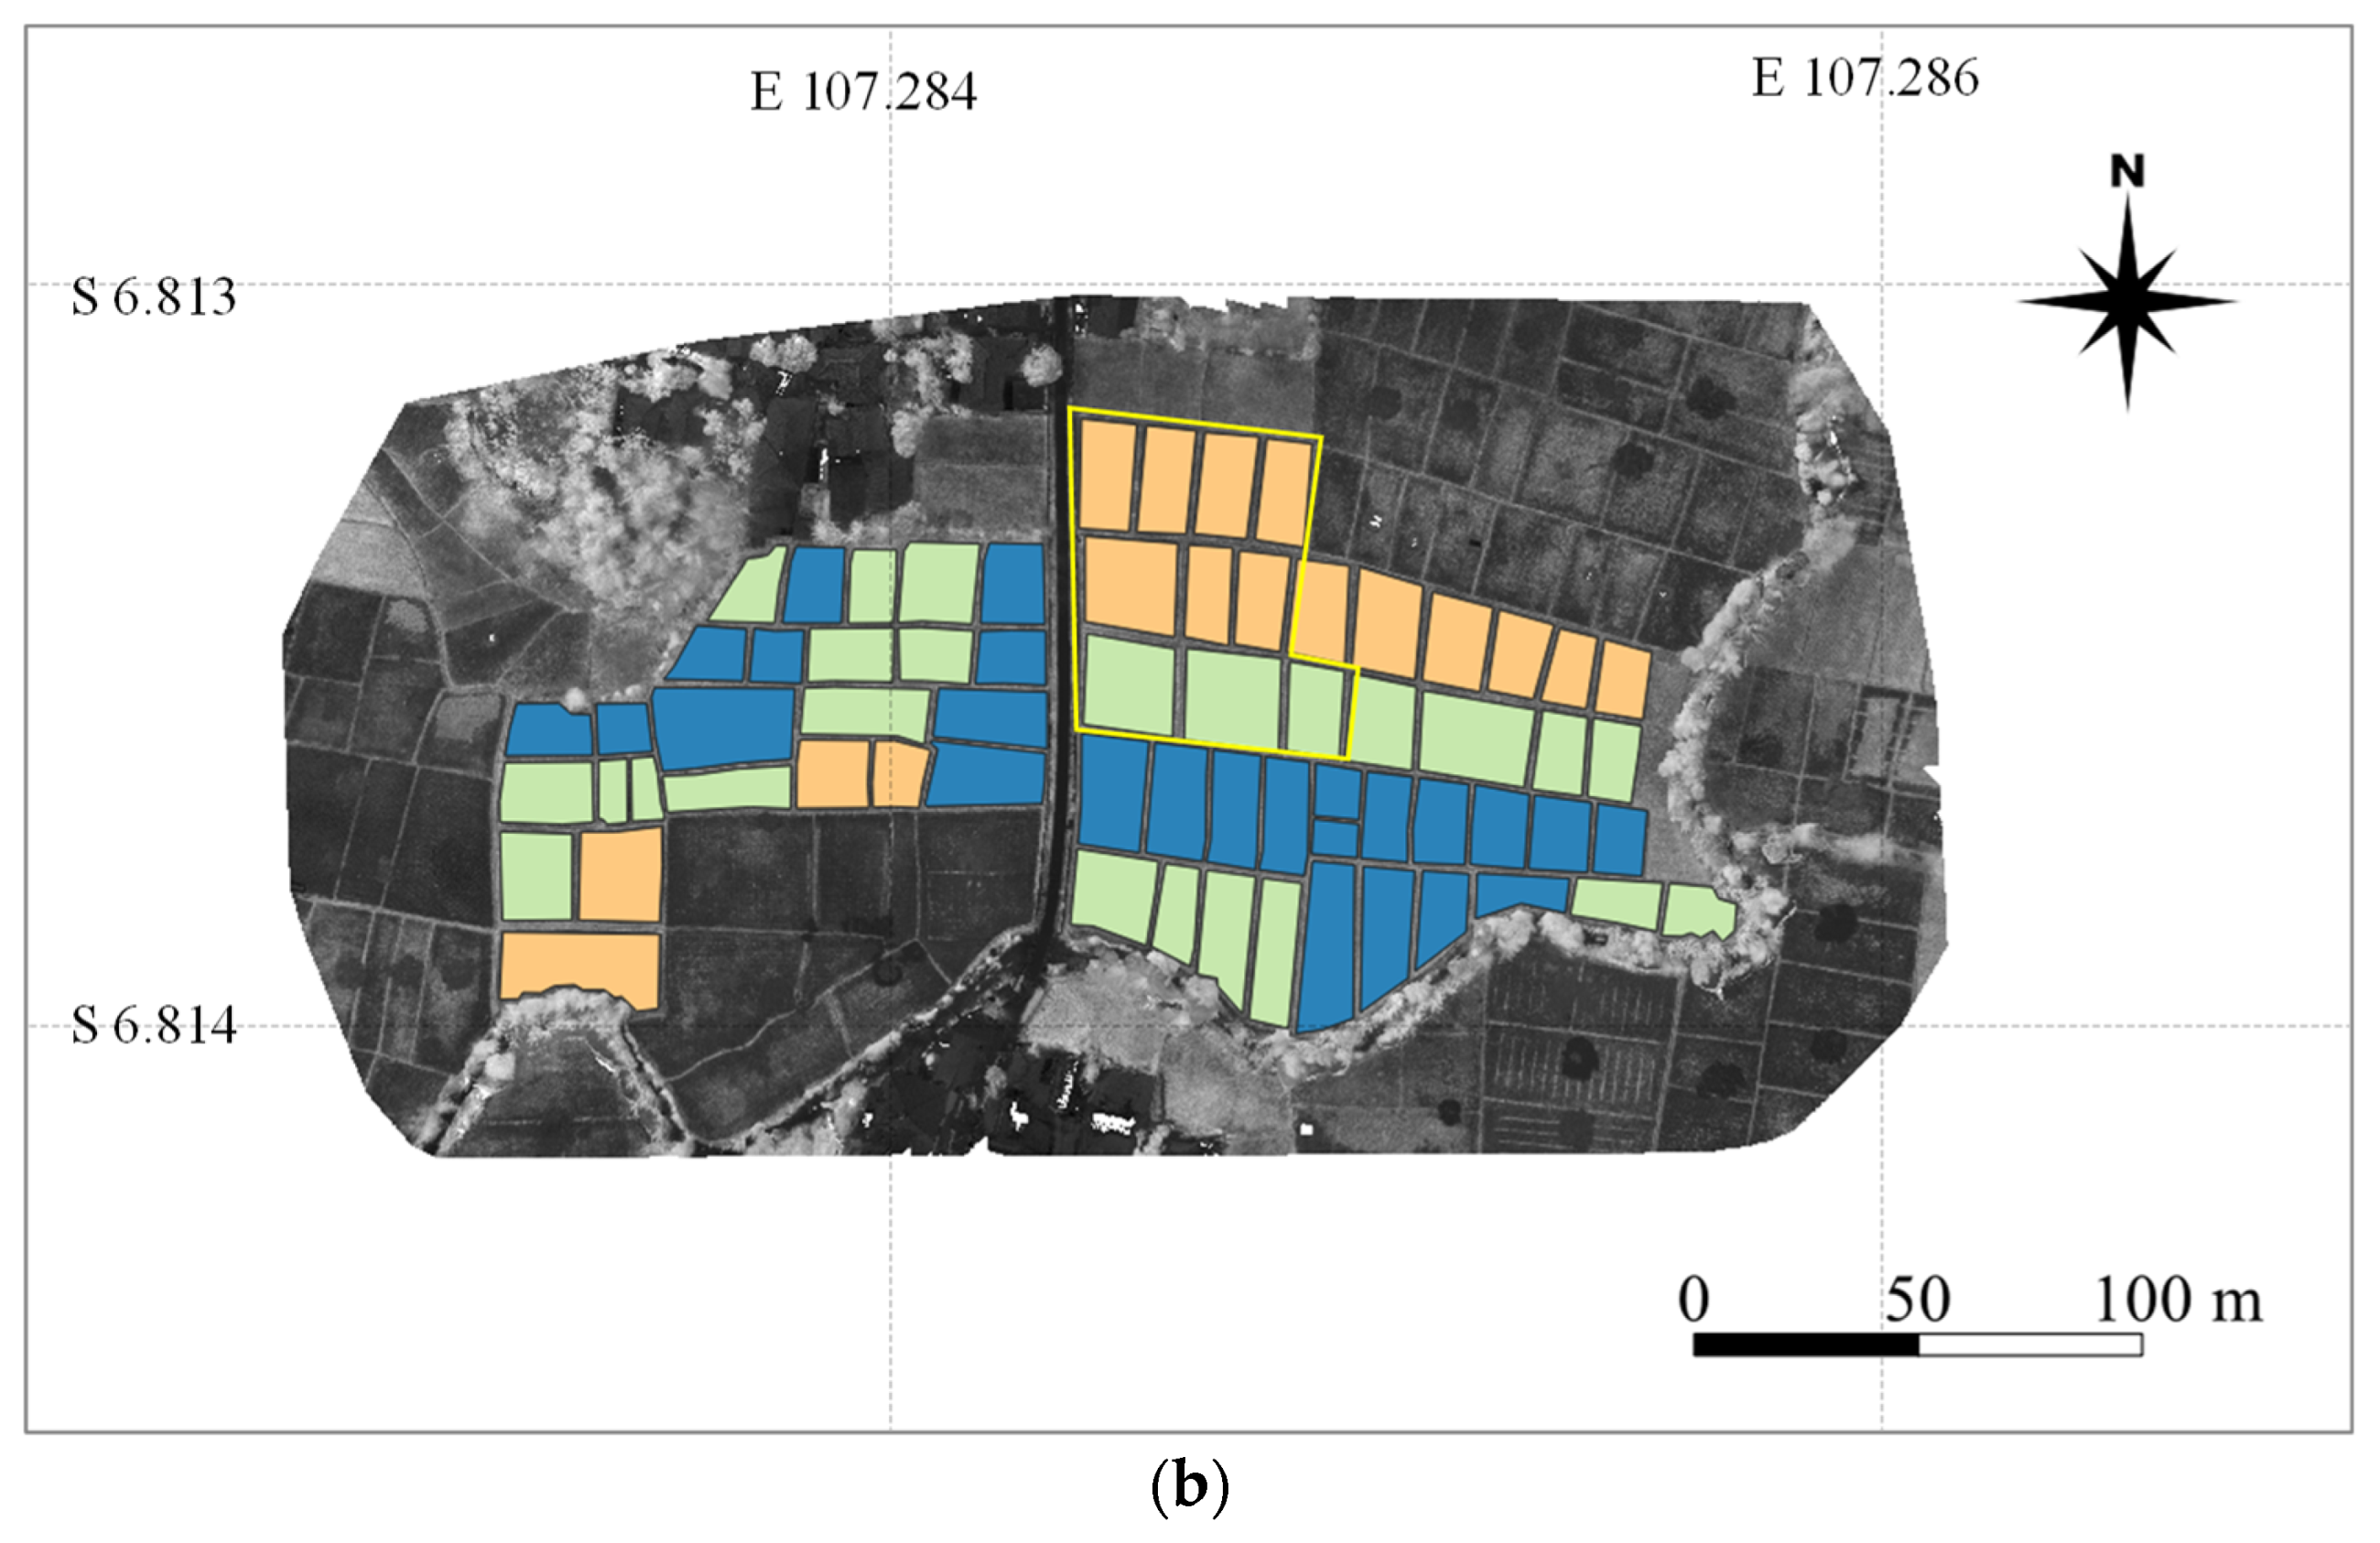
2.2. Drought Assessment and Field Investigation
2.3. Data Processing
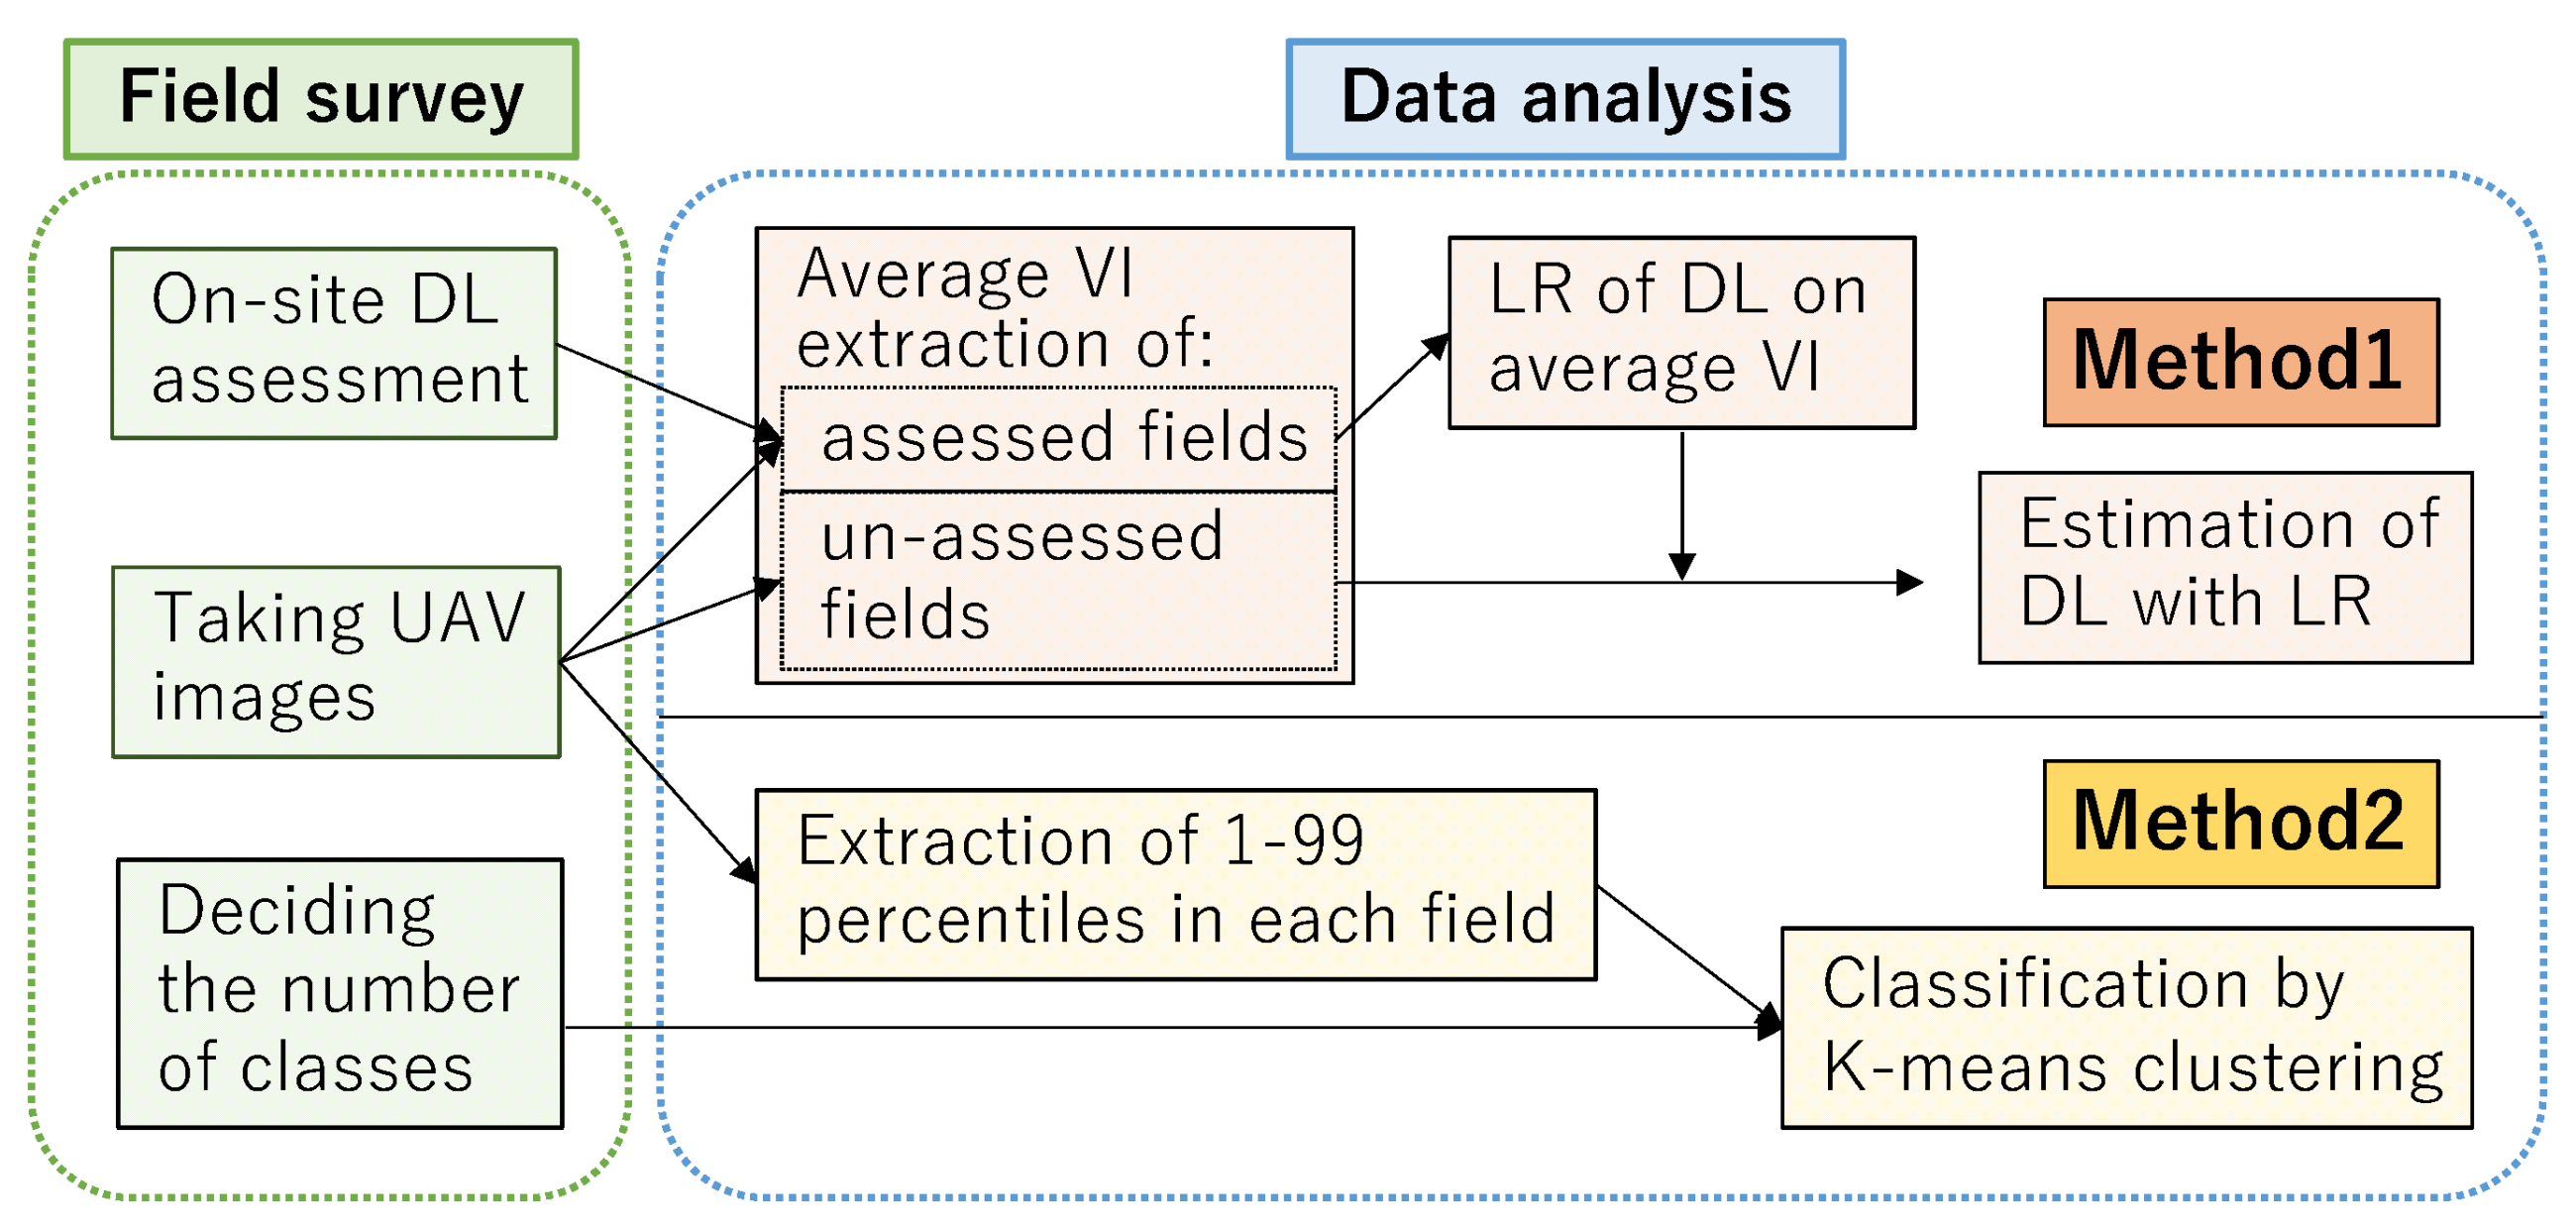
2.4. Evaluating Methods
3. Results
4. Discussion
5. Conclusions
Author Contributions
Funding
Institutional Review Board Statement
Informed Consent Statement
Data Availability Statement
Acknowledgments
Conflicts of Interest
References
- FAOSTAT. Available online: https://www.fao.org/faostat/en/#data (accessed on 11 April 2022).
- Ravesteijn, W. Dutch Engineering Overseas: The Creation of a Modern Irrigation System in Colonial Java. Knowl. Technol. Policy 2002, 14, 126–144. [Google Scholar] [CrossRef]
- Panuju, D.R.; Mizuno, K.; Trisasongko, B.H. The dynamics of rice production in Indonesia 1961–2009. J. Saudi Soc. Agric. Sci. 2013, 12, 27–37. [Google Scholar] [CrossRef] [Green Version]
- Hairmansis, A.; Rumanti, I.A.; Nugraha, Y.; Kato, Y.; Jamil, A. Reaping gains with less rain: Best management practices for drought-prone rice areas in Indonesia. In Climate-Ready Technologies: Combating Poverty by Raising Productivity in Rainfed Rice Environments in Asia; Manzanilla, D., Singh, R.K., Kato, Y., Johnson, D., Eds.; International Rice Research Institute: Los Baños, Philippines, 2016; pp. 17–28. [Google Scholar]
- Surmaini, E.; Susanti, E.; Syahputra, M.R.; Hadi, T.W. Exploring Standardized Precipitation Index for predicting drought on rice paddies in Indonesia. IOP Conf. Ser. Earth Environ. Sci. 2019, 303, 012027. [Google Scholar] [CrossRef]
- Naylor, R.L.; Battisti, D.S.; Vimont, D.J.; Falcon, W.P.; Burke, M.B. Assessing risks of climate variability and climate change for Indonesian rice agriculture. Proc. Natl. Acad. Sci. USA 2007, 104, 7752–7757. [Google Scholar] [CrossRef] [PubMed] [Green Version]
- Pasaribu, S.M. Developing rice farm insurance in Indonesia. Agric. Agric. Sci. Procedia 2010, 1, 33–41. [Google Scholar] [CrossRef] [Green Version]
- Mahul, O.; Stutley, C.J. Government Support to Agricultural Insurance; The World Bank: Washington, DC, USA, 2010; pp. 6–15. [Google Scholar]
- The World Bank. Agricultural insurance: A background. In Weather Index Insurance for Agriculture: Guidance for Development Practitioners; The World Bank: Washington, DC, USA, 2011; pp. 9–13. [Google Scholar]
- Mutaqin, D.J.; Usami, K. Smallholder Farmers’ Willingness to Pay for Agricultural Production Cost Insurance in Rural West Java, Indonesia: A Contingent Valuation Method (CVM) Approach. Risks 2019, 7, 69. [Google Scholar] [CrossRef] [Green Version]
- Manago, N.; Hongo, C.; Sofue, Y.; Sigit, G.; Utoyo, B. Transplanting Date Estimation Using Sentinel-1 Satellite Data for Paddy Rice Damage Assessment in Indonesia. Agriculture 2020, 10, 625. [Google Scholar] [CrossRef]
- Iwahashi, Y.; Ye, R.; Kobayashi, S.; Yagura, K.; Hor, S.; Soben, K.; Homma, K. Quantification of Changes in Rice Production for 2003-2019 with MODIS LAI Data in Pursat Province, Cambodia. Remote Sens. 2021, 13, 1971. [Google Scholar] [CrossRef]
- Kross, A.; McNairn, H.; Lapen, D.; Sunohara, M.; Champagne, C. Assessment of RapidEye vegetation indices for estimation of leaf area index and biomass in corn and soybean crops. Int. J. Appl. Earth Obs. Geoinf. 2015, 34, 235–248. [Google Scholar] [CrossRef] [Green Version]
- Yamaguchi, T.; Tanaka, Y.; Imachi, Y.; Yamashita, M.; Katsura, K. Feasibility of Combining Deep Learning and RGB Images Obtained by Unmanned Aerial Vehicle for Leaf Area Index Estimation in Rice. Remote Sens. 2021, 13, 84. [Google Scholar] [CrossRef]
- Qiao, L.; Tang, W.; Gao, D.; Zhao, R.; An, L.; Li, M.; Sun, H.; Song, D. UAV-based chlorophyll content estimation by evaluating vegetation index responses under different crop coverages. Comput. Electron. Agric. 2022, 196, 106775. [Google Scholar] [CrossRef]
- Johnson, M.D.; Hsieh, W.W.; Cannon, A.J.; Davidson, A.; Bédard, F. Crop yield forecasting on the Canadian Prairies by remotely sensed vegetation indices and machine learning methods. Agric. For. Meteorol. 2016, 218–219, 74–84. [Google Scholar] [CrossRef]
- Yoshino, K.; Setiawan, Y.; Shima, E. Land Use Analysis using Time Series of Vegetation Index Derived from Satellite Remote Sensing in Brantas River Watershed, East Java, Indonesia. J. Geomat. Plan. 2017, 4, 109–120. [Google Scholar] [CrossRef] [Green Version]
- Kim, H.; Kim, W.; Kim, S.D. Damage Assessment of Rice Crop after Toluene Exposure Based on the Vegetation Index (VI) and UAV Multispectral Imagery. Remote Sens. 2021, 13, 25. [Google Scholar] [CrossRef]
- Swaef, T.D.; Maes, W.H.; Aper, J.; Baert, J.; Cougnon, M.; Reheul, D.; Steppe, K.; Roldán-Ruiz, I.; Lootens, P. Applying RGB- and Thermal-Based Vegetation Indices from UAVs for High-Throughput Field Phenotyping of Drought Tolerance in Forage Grasses. Remote Sens. 2021, 13, 147. [Google Scholar] [CrossRef]
- Das, S.; Christopher, J.; Choudhury, M.R.; Apan, A.; Chapman, S.; Menzies, N.W.; Dang, Y.P. Evaluation of drought tolerance of wheat genotypes in rain-fed sodic soil environments using high-resolution UAV remote sensing techniques. Biosyst. Eng. 2022, 217, 68–82. [Google Scholar] [CrossRef]
- Fullana-Pericàs, M.; Conesa, M.À.; Gago, J.; Ribas-Carbó, M.; Galmés, J. High-throughput phenotyping of a large tomato collection under water deficit: Combining UAVs’ remote sensing with conventional leaf-level physiologic and agronomic measurements. Agric. Water Manag. 2022, 260, 107283. [Google Scholar] [CrossRef]
- BMKG; BNPB; WFP. INDONESIA Impact Monitoring of Hydrometeorological Hazards July-September 2020; A Bulletin from BMKG, BNPB and WFP; Badan Meteorologi, Klimatologi, dan Geofisika, Badan Nasional Penanggulangan Bencana and World Food Programme; BMKG; BNPB: Jakarta, Indonesia; WFP: Rome, Italy, 2020.
- Kanemasu, E.T. Seasonal Canopy Reflectance Patterns of Wheat, Sorghum, and Soybean. Remote Sens. Environ. 1974, 3, 43–47. [Google Scholar] [CrossRef]
- Motohka, T.; Nasahara, K.N.; Oguma, H.; Tsuchida, S. Applicability of Green-Red Vegetation Index for Remote Sensing of Vegetation Phenology. Remote Sens. 2010, 2, 2369–2387. [Google Scholar] [CrossRef] [Green Version]
- Huang, S.; Tang, L.; Hupy, J.P.; Wang, Y.; Shao, G. A commentary review on the use of normalized difference vegetation index (NDVI) in the era of popular remote sensing. J. For. Res. 2021, 32, 1–6. [Google Scholar] [CrossRef]
- Zhang, Y.; Su, Z.; Shen, W.; Jia, R.; Luan, J. Remote Monitoring of Heading Rice Growing and Nitrogen Content Based on UAV Images. Int. J. Smart Home 2016, 10, 103–114. [Google Scholar] [CrossRef]
- Jiang, Z.; Huete, A.R.; Didan, K.; Miura, T. Development of a two-band enhanced vegetation index without a blue band. Remote Sens. Environ. 2008, 112, 3833–3845. [Google Scholar] [CrossRef]
- Maki, M.; Katsura, K.; Oki, K. Comparison of Empirical Regression Models for Estimating LAI of Paddy Rice from Several Vegetation Indices Derived from UAV Images. J. Remote Sens. Soc. Jpn. 2016, 36, 100–106. [Google Scholar]
- Walsh, O.S.; Shafian, S.; Marshall, J.M.; Jackson, C.; McClintick-Chess, J.R.; Blanscet, S.M.; Swoboda, K.; Thompson, C.; Belmont, K.M.; Walsh, W.L. Assessment of UAV Based Vegetation Indices for Nitrogen Concentration Estimation in Spring Wheat. Adv. Remote Sens. 2018, 7, 71–90. [Google Scholar] [CrossRef] [Green Version]
- Su, T. Efficient paddy field mapping using Landsat-8 imagery and object-based image analysis based on advanced fractel net evolution approach. GIScience Remote Sens. 2017, 54, 354–380. [Google Scholar] [CrossRef]


| Survey Date (Growth Stage or DAT) | Name of Location | Number of Assessed and Unassessed (UA) Fields | Total Area * (m2) | |||||
|---|---|---|---|---|---|---|---|---|
| DL0 | DL1 | DL2 | DL3 | DL4 | UA | |||
| 1st survey on 7–9 August 2019 (heading to harvesting) | Kertajaya | - | 0 | 6 | 0 | 4 | 14 | 6312 |
| Kertasari | - | 2 | 6 | 0 | 3 | 70 | 17,414 | |
| Karangwangi | - | 3 | 3 | 4 | 0 | 56 | 16,331 | |
| 2nd survey on 9–10 October 2019 (DAT 14–60) | Sukajaya | - | 3 | 2 | 1 | 0 | 47 | 18,470 |
| Jatisari | - | 3 | 3 | 0 | 0 | 57 | 22,825 | |
| Sukaratu1 | - | 0 | 8 | 0 | 0 | 20 | 11,399 | |
| Sukaratu2 | - | 3 | 0 | 10 | 0 | 58 | 21,284 | |
| 3rd survey on 8–9 August 2021 (DAT 45–90) | Cihea | 4 | 0 | 5 | 4 | 4 | 66 | 18,905 |
| Jati | 5 | 5 | 5 | 5 | 0 | 21 | 19,785 | |
| Rancagoong | 5 | 4 | 1 | 0 | 0 | 14 | 10,209 | |
| Drought Level (DL) | Ratio of Damaged Area | Symptoms |
|---|---|---|
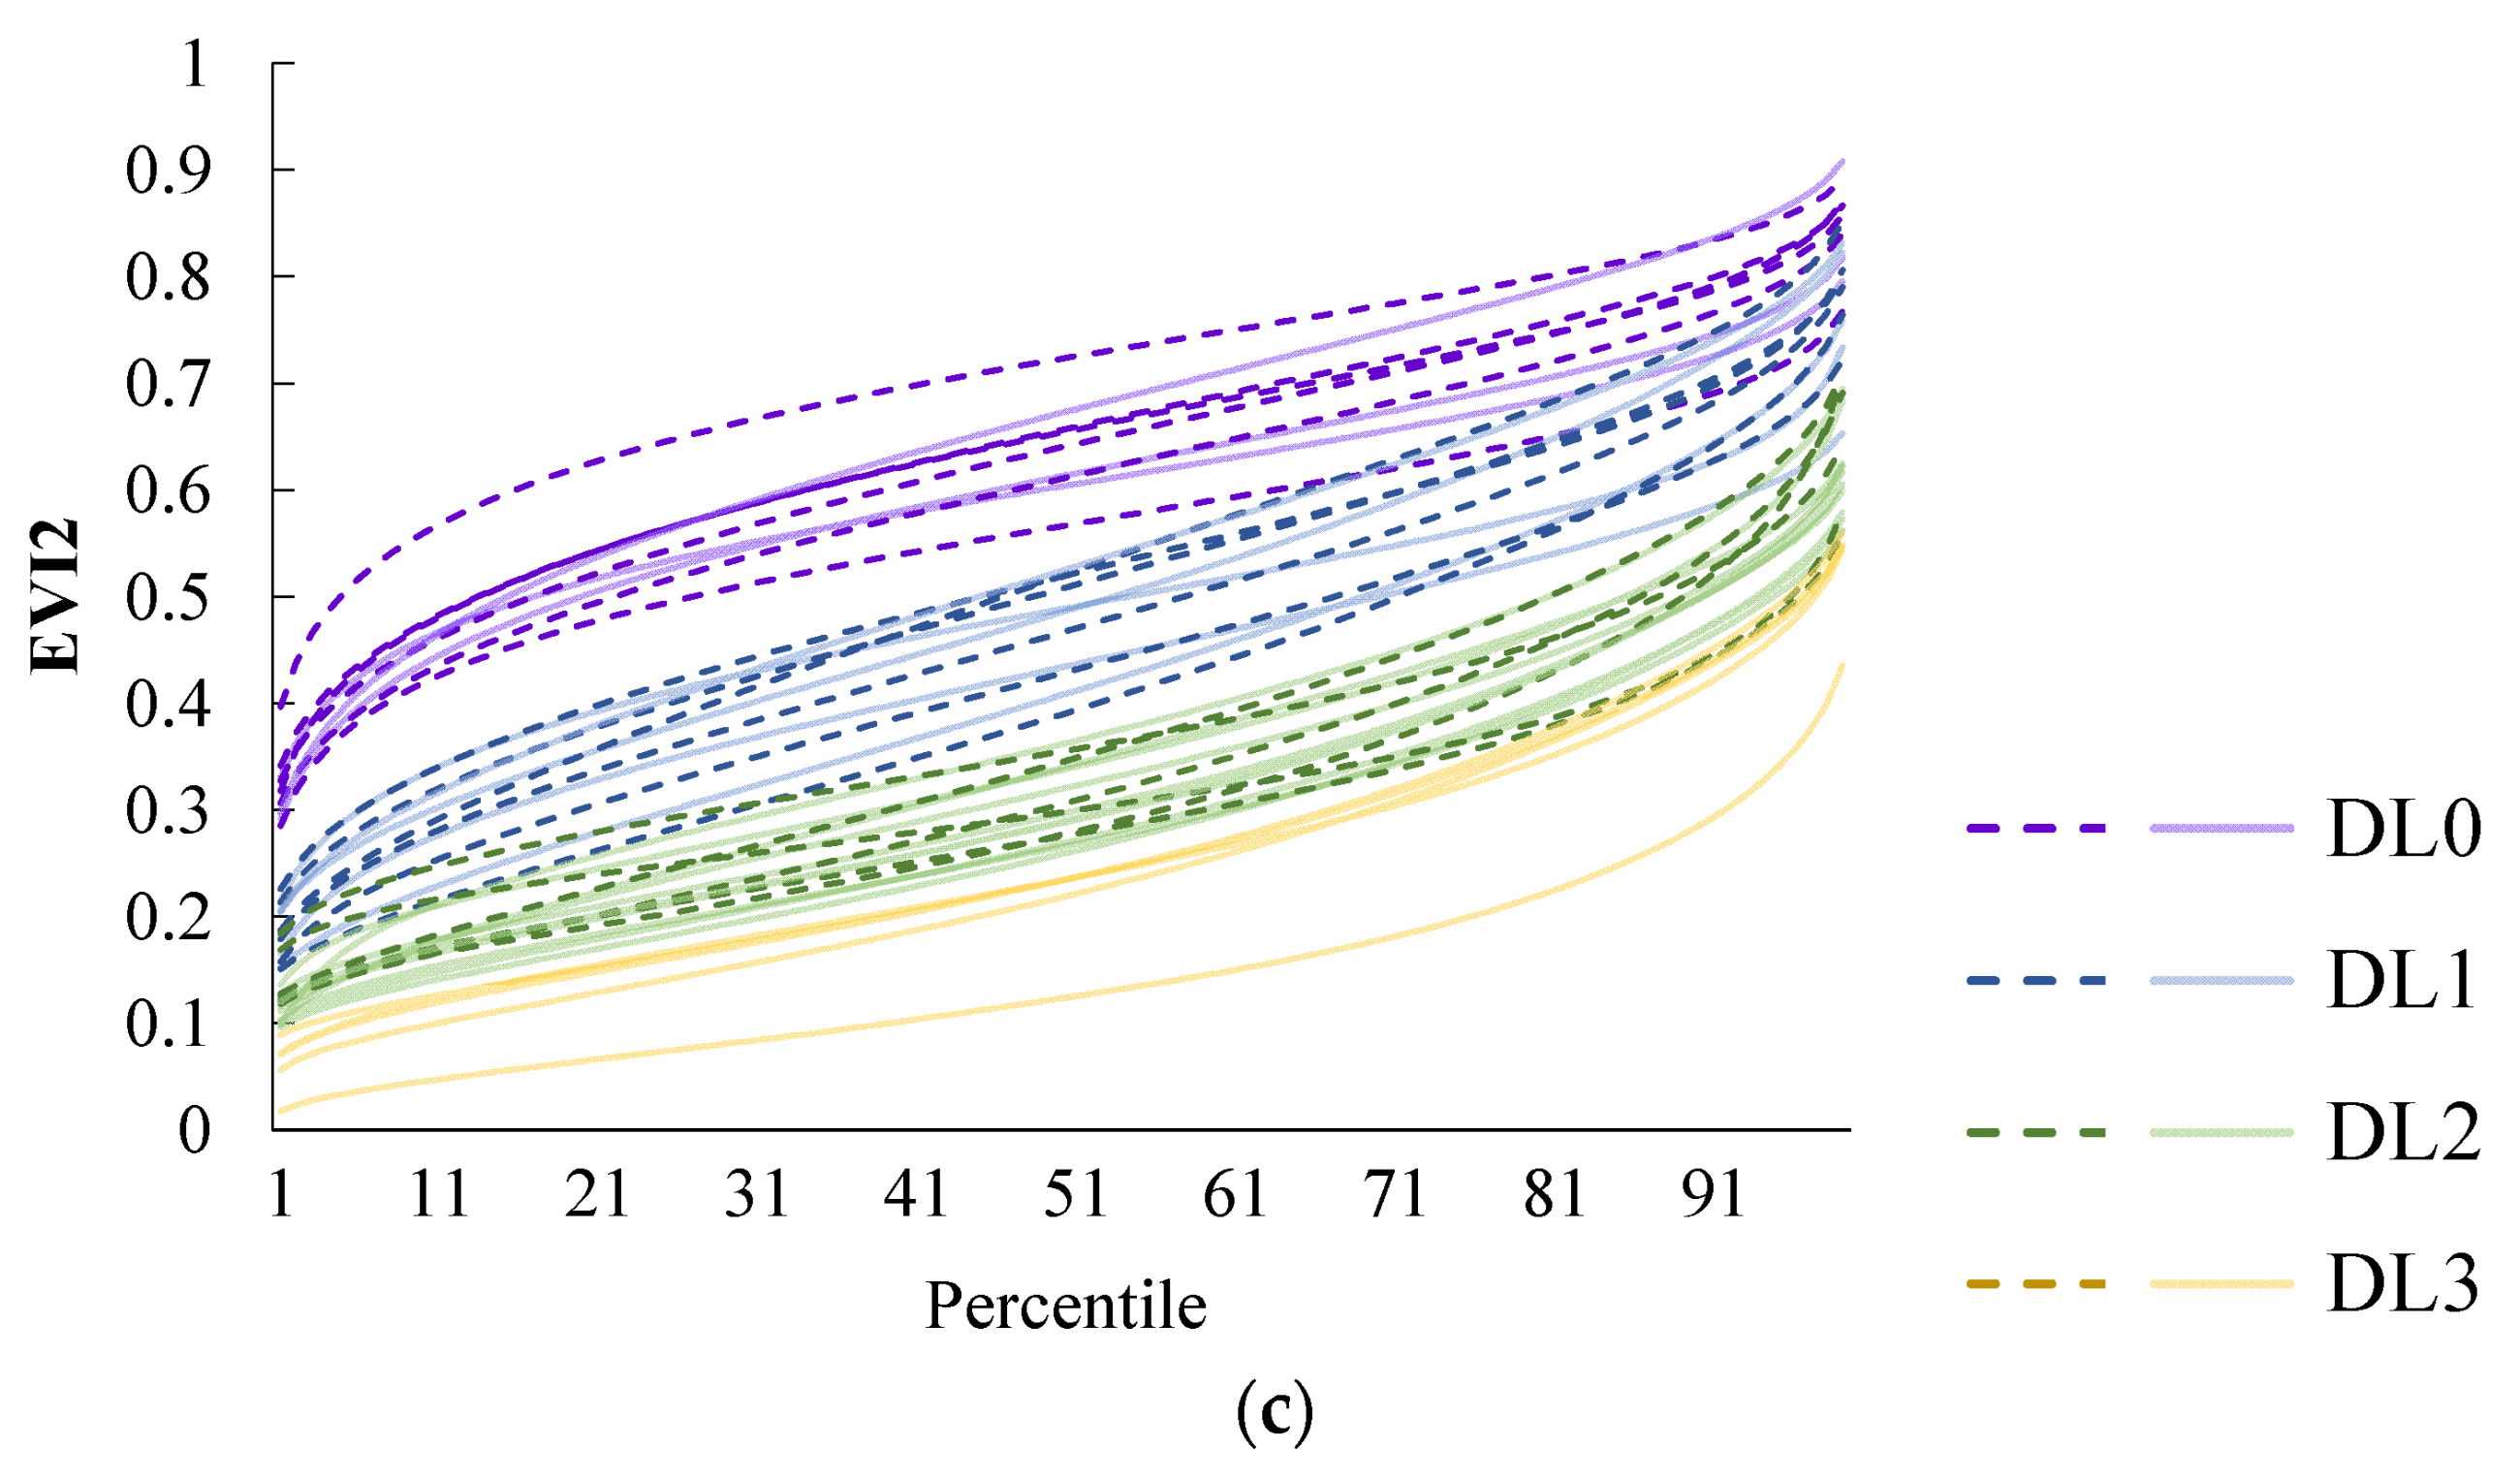
| DL0 | 0% | No obvious symptoms |
| DL1 | 25%< | Slight leaf rolling |
| DL2 | 25–50%< | Leaf top rolling and yellow |
| DL3 | 50–85%< | Almost wilting and yellow leaves |
| DL4 | ≥85% | All died or no harvest |
| Location Name | Cultivar | DAT | Number of Assessed Fields | DL |
|---|---|---|---|---|
| Cihea | Shintanur | 79 | 3 | 2 |
| Ciherang | 69 | 4 | 2/3 | |
| Segon Salak | 64/74 | 7 | 0/4 | |
| Inpari 32 | 64/90 | 3 | 0/3 | |
| Jati | Inpari 32 | 35 | 20 | 0/1/2/3 |
| Rancagoong | Inpari 32 | 45/60/65/75 | 9 | 0/1/2 |
| Shintanur | 65 | 1 | 1 |
| UAV | Camera | Flight Height (m) | Front-Side Overlapping (%) | |
|---|---|---|---|---|
| 1st survey | Mavic Pro | Sequoia | 50 | 85–85 |
| 2nd survey | Bluegrass | Sequoia | 74 | 85–85 |
| 3rd survey | P4 Multispectral | P4 Multispectral | 50 | 85–75 |
| Vegetation Index | Calculation Formula | |
|---|---|---|
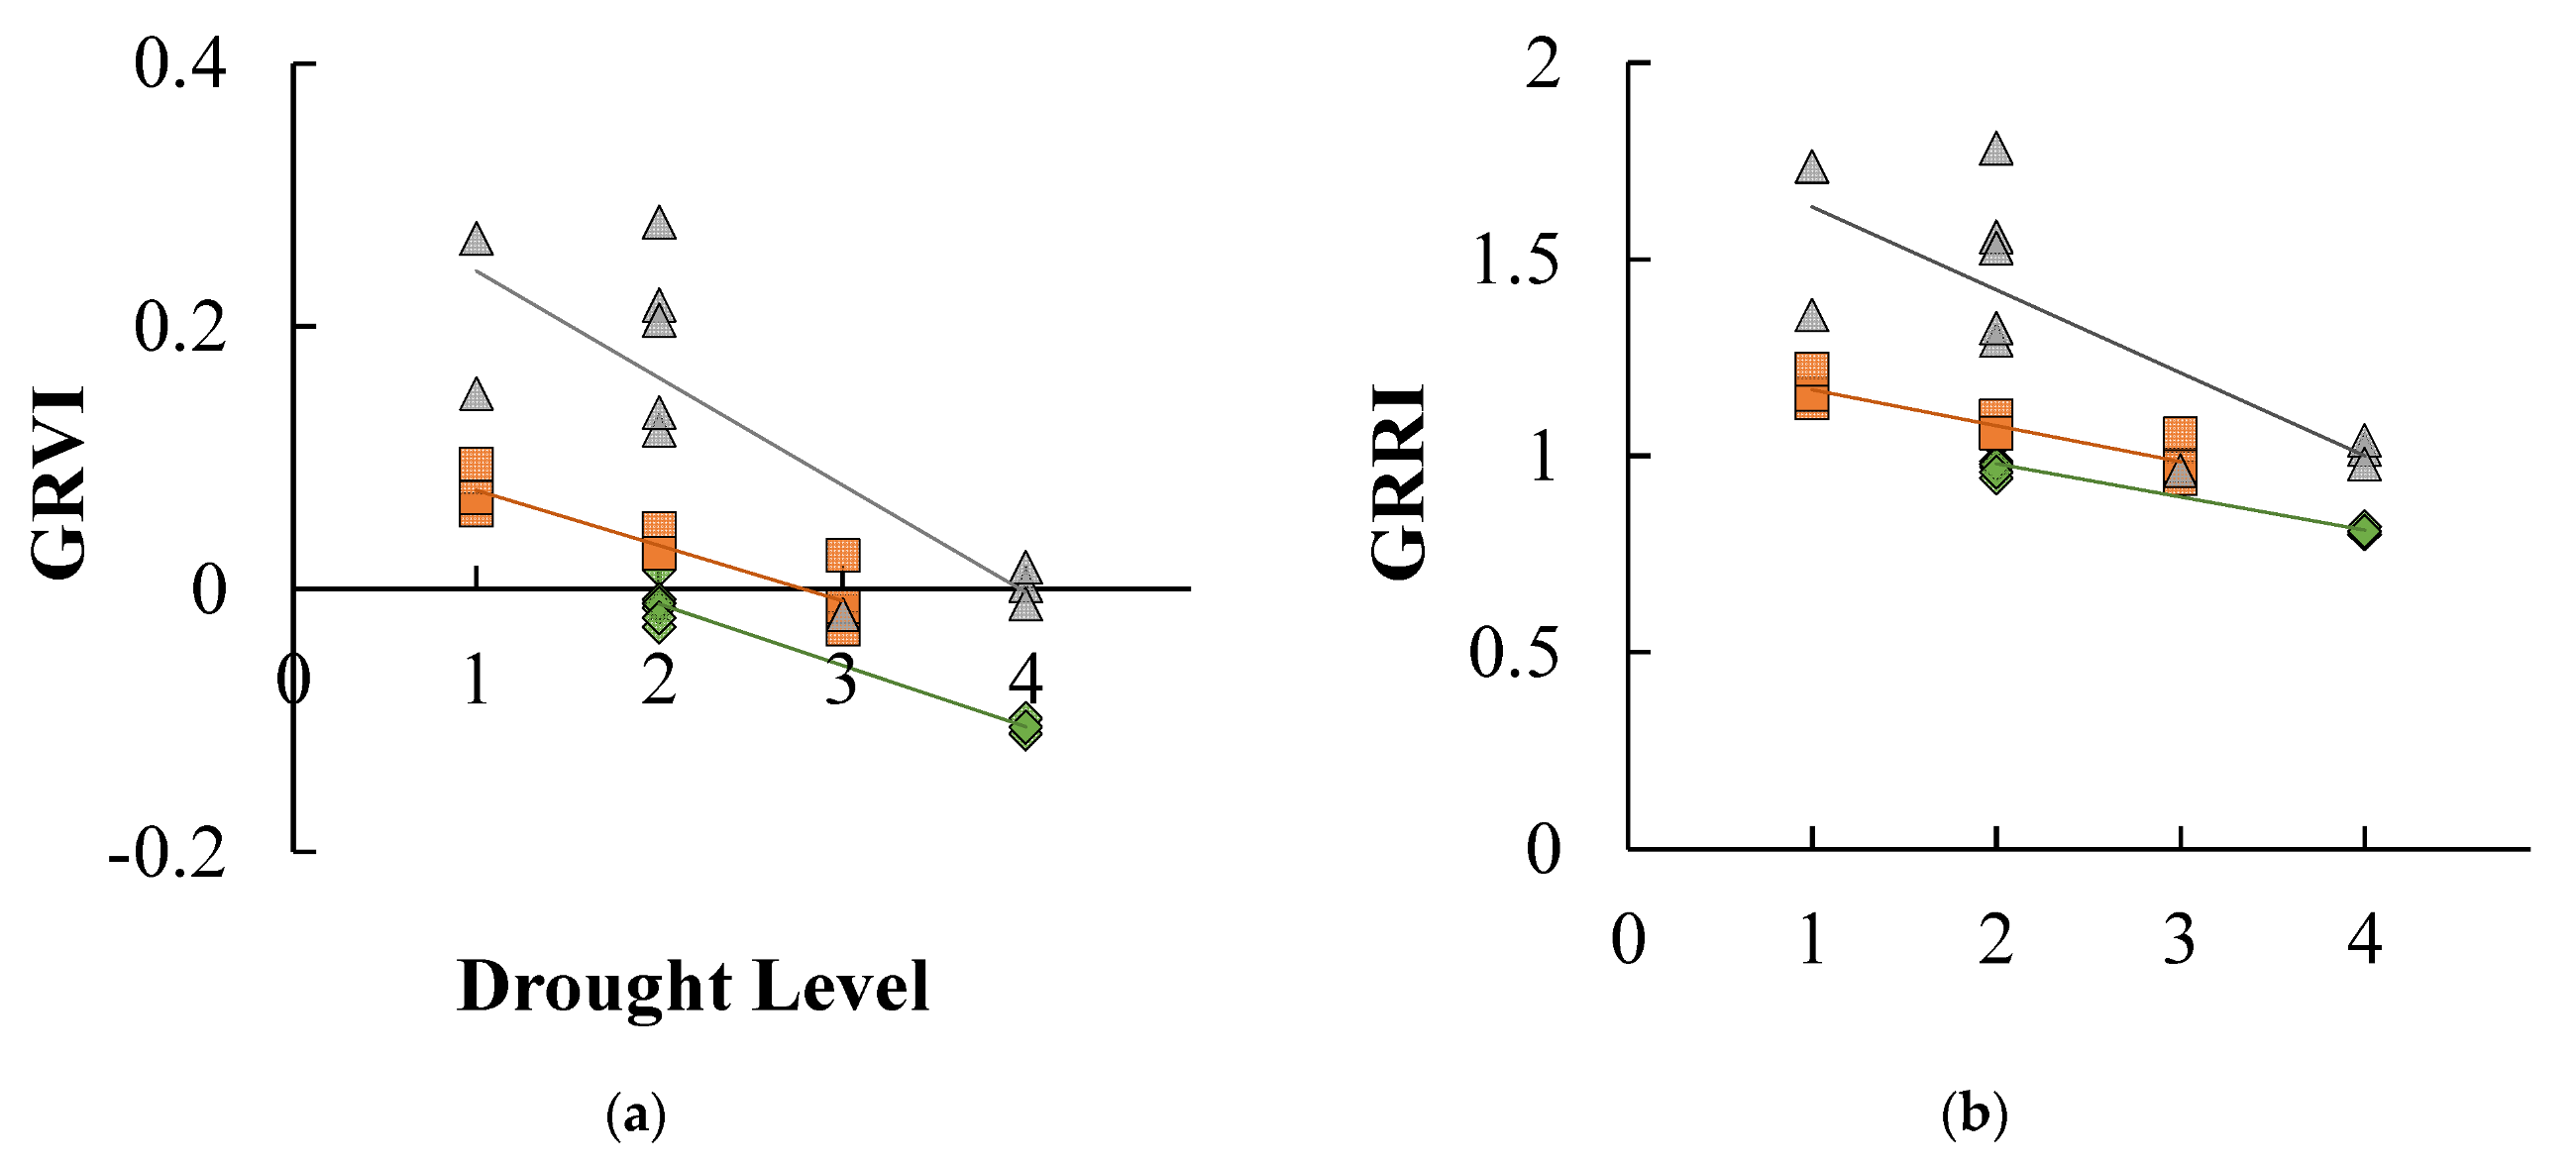
| GRRI | GRRI = [G]/[R] | [23] |
| GRVI | GRVI = ([G] − [R])/([G] + [R]) | [24] |
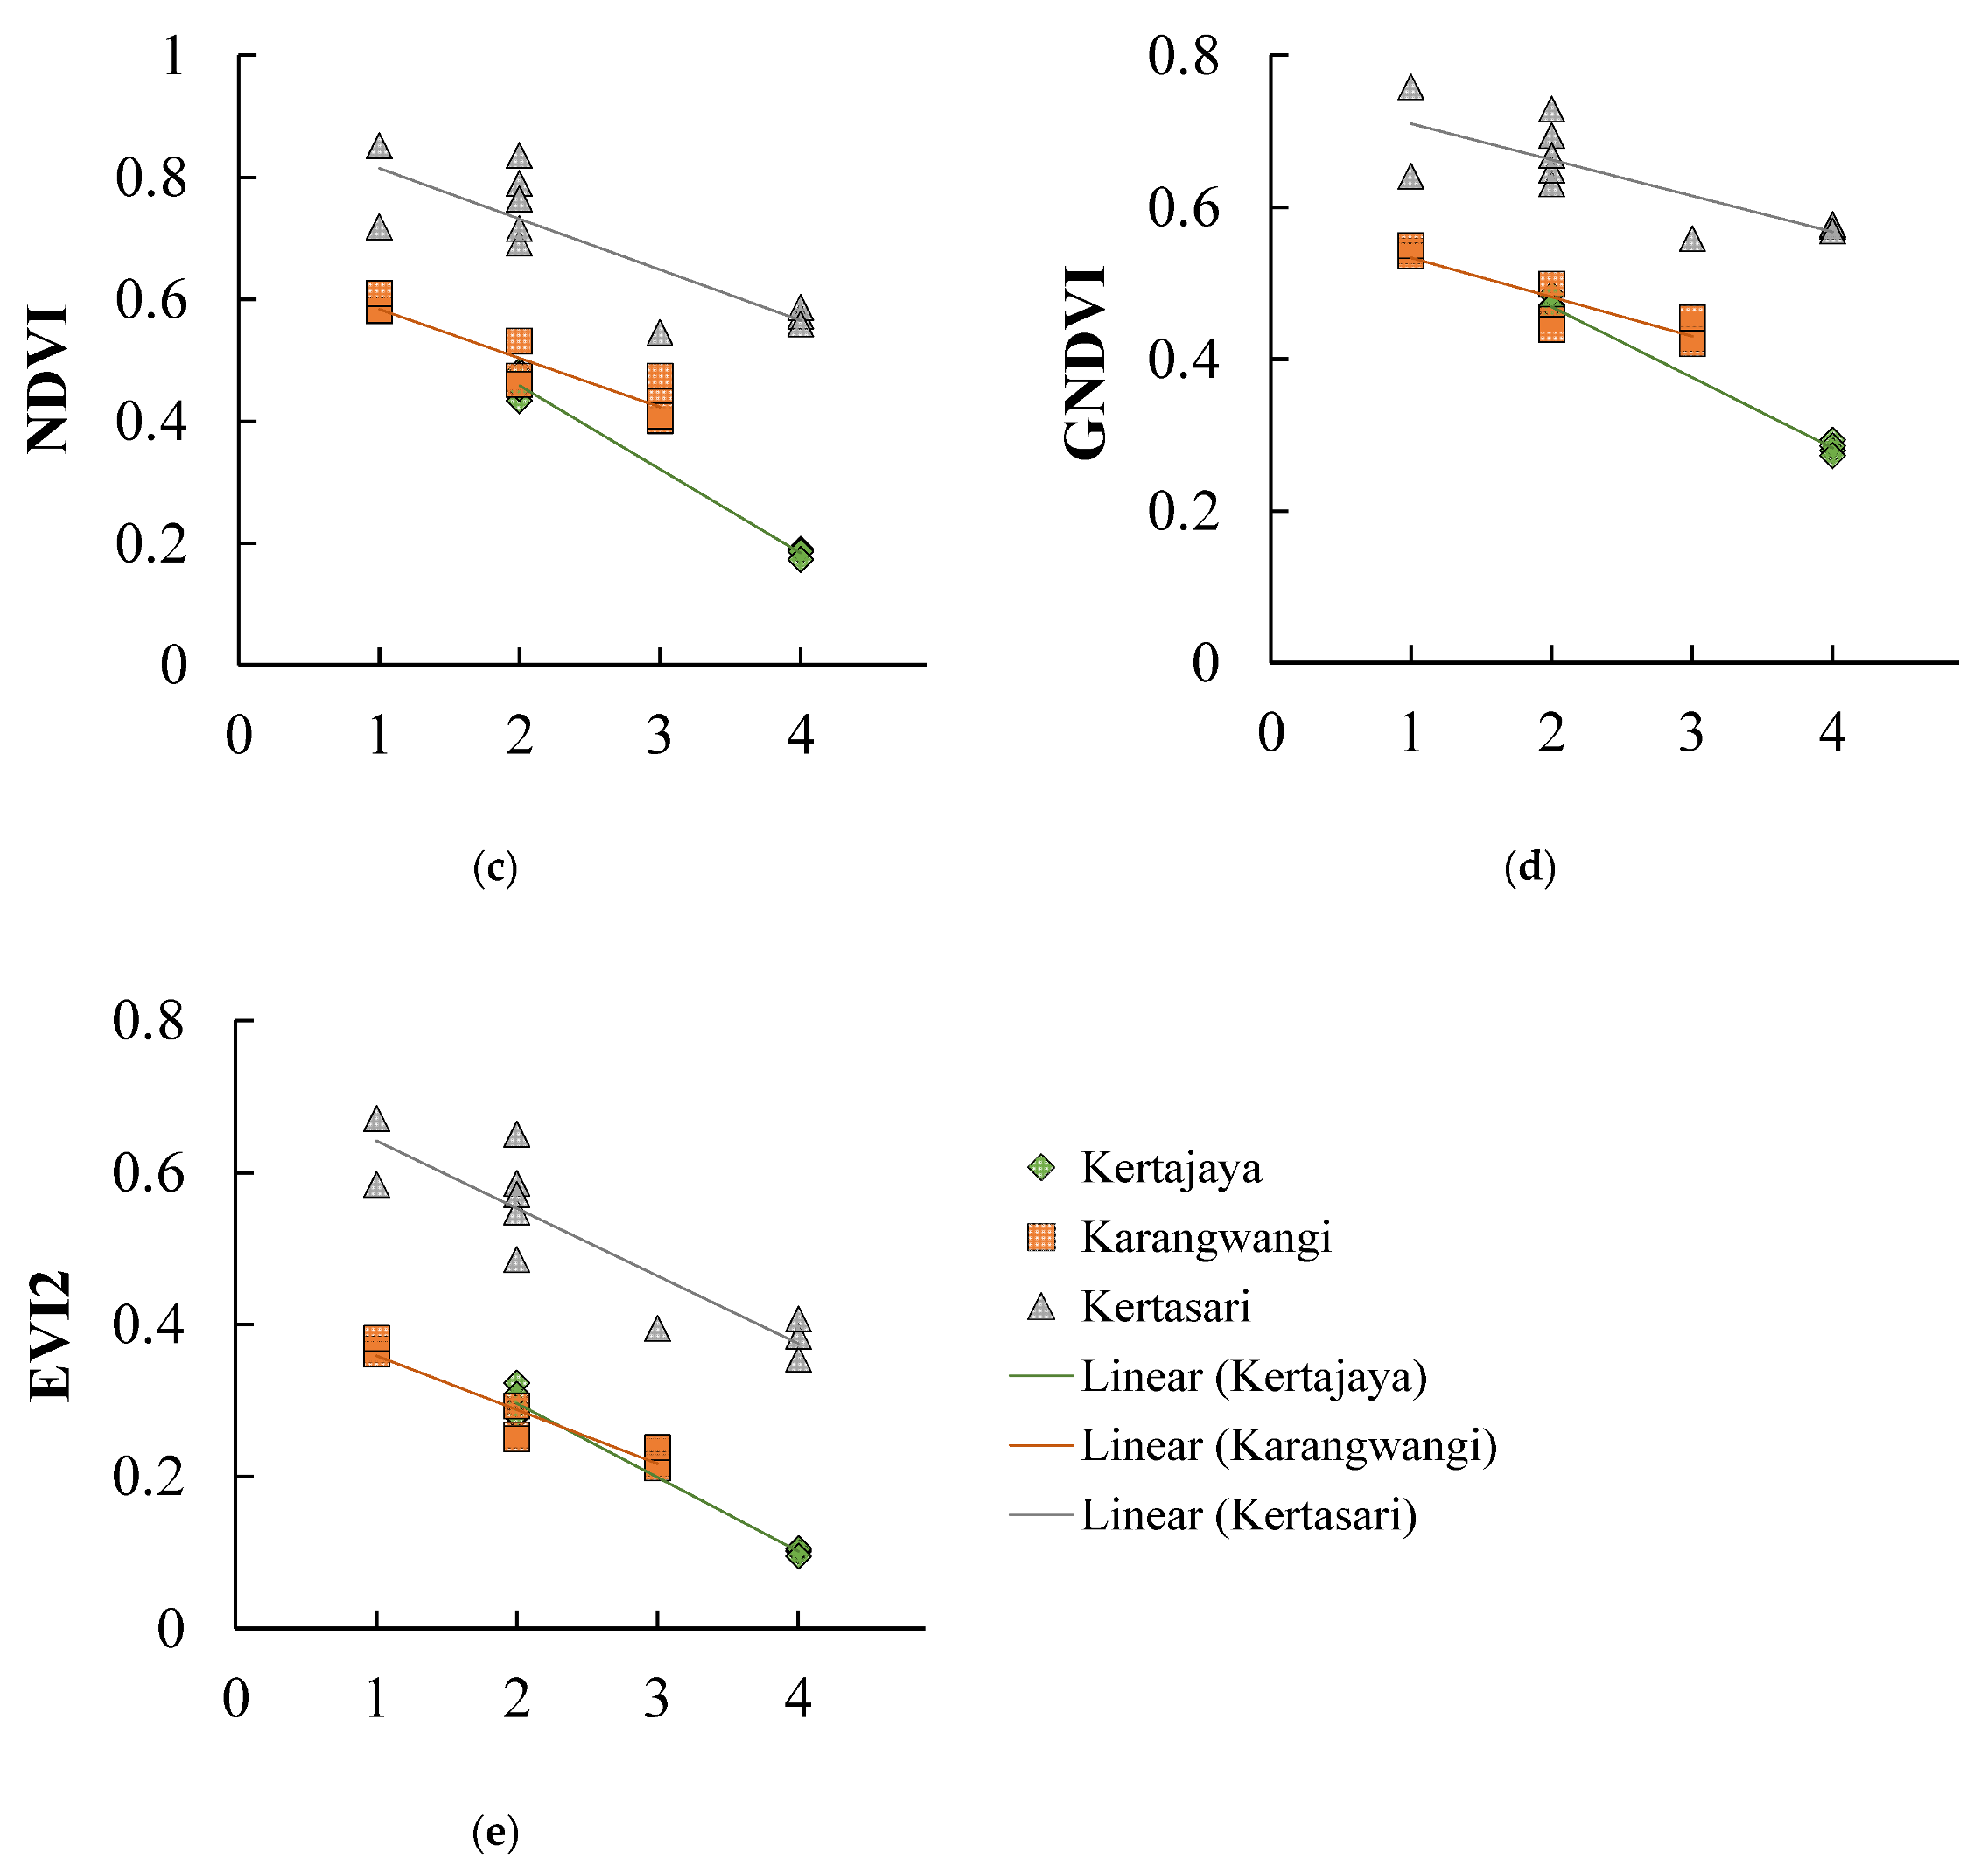
| NDVI | NDVI = ([NIR] − [R])/([NIR] + [R]) | [17] |
| GNDVI | GNDVI = ([NIR] − [G])/([NIR] + [G]) | [19] |
| EVI2 | EVI2 = G * ([NIR] − [R])/([NIR] + C * [R] + L) (G = 2.5, C = 2.4, L = 1) | [20] |
| Average R2 Value | ||
|---|---|---|
| 1st Survey | 2nd Survey | |
| GRVI | 0.81 | 0.93 |
| GRRI | 0.80 | 0.93 |
| NDVI | 0.85 | 0.92 |
| GNDVI | 0.81 | 0.83 |
| EVI2 | 0.89 | 0.89 |
| Location Name | Concordance Rate (%) | Match Rate (%) | ||
|---|---|---|---|---|
| Method1 | Method2 | |||
| 1st survey | Kertajaya | 100 | 90.0 | 75.0 |
| Kertasari | 54.5 | 63.6 | 74.1 | |
| Karangwangi | 100 | 40.0 | 47.0 | |
| 2nd survey | Sukajaya | 83.3 | 83.3 | 92.5 |
| Jatisari | 100 | 83.3 | 71.4 | |
| Sukaratu1 | 87.5 | 62.5 | 71.4 | |
| Sukaratu2 | 76.9 | 100 | 71.8 | |
| 3rd survey | Cihea | - | 17.7 | - |
| Jati | 50.0 | 35.0 | 73.2 | |
| Rancagoong | 80.0 | 90.0 | 91.7 | |
| Total | 76.6 | 62.8 | 67.9 | |
Disclaimer/Publisher’s Note: The statements, opinions and data contained in all publications are solely those of the individual author(s) and contributor(s) and not of MDPI and/or the editor(s). MDPI and/or the editor(s) disclaim responsibility for any injury to people or property resulting from any ideas, methods, instructions or products referred to in the content. |
© 2022 by the authors. Licensee MDPI, Basel, Switzerland. This article is an open access article distributed under the terms and conditions of the Creative Commons Attribution (CC BY) license (https://creativecommons.org/licenses/by/4.0/).
Share and Cite
Iwahashi, Y.; Sigit, G.; Utoyo, B.; Lubis, I.; Junaedi, A.; Trisasongko, B.H.; Wijaya, I.M.A.S.; Maki, M.; Hongo, C.; Homma, K. Drought Damage Assessment for Crop Insurance Based on Vegetation Index by Unmanned Aerial Vehicle (UAV) Multispectral Images of Paddy Fields in Indonesia. Agriculture 2023, 13, 113. https://doi.org/10.3390/agriculture13010113
Iwahashi Y, Sigit G, Utoyo B, Lubis I, Junaedi A, Trisasongko BH, Wijaya IMAS, Maki M, Hongo C, Homma K. Drought Damage Assessment for Crop Insurance Based on Vegetation Index by Unmanned Aerial Vehicle (UAV) Multispectral Images of Paddy Fields in Indonesia. Agriculture. 2023; 13(1):113. https://doi.org/10.3390/agriculture13010113
Chicago/Turabian StyleIwahashi, Yu, Gunardi Sigit, Budi Utoyo, Iskandar Lubis, Ahmad Junaedi, Bambang Hendro Trisasongko, I Made Anom Sutrisna Wijaya, Masayasu Maki, Chiharu Hongo, and Koki Homma. 2023. "Drought Damage Assessment for Crop Insurance Based on Vegetation Index by Unmanned Aerial Vehicle (UAV) Multispectral Images of Paddy Fields in Indonesia" Agriculture 13, no. 1: 113. https://doi.org/10.3390/agriculture13010113